


-
Tomato (Solanum lycopersicum L.)[1] is an annual herb of Solanaceae, which is rich in carotene, vitamin C, and B, and has high nutritional value. As the most important tomato-producing area in China, Xinjiang has a planting area of more than 1 million mu. In recent years, the cultivated area of greenhouse tomatoes in Xinjiang, China has gradually expanded, but the development of the greenhouse tomato industry has been seriously restricted due to the long distance between production and sales. As an important horticultural production base in the northwest region of China, Xinjiang faces significant post-harvest losses and quality deterioration in its greenhouse tomato industry during transportation and storage, which severely restricts the sustainable development of the industry. According to empirical research data[2−5], losses included during transportation due to low cold chain coverage (32%), mechanical damage (breakage rate > 18%), and unreasonable stacking, amount to 15% to 25%. During storage, physiological weight loss (8% to 12%), disease decay (> 20%), nutrient losses such as lycopene degradation (30% to 40%), and ascorbic acid loss (average daily loss of 2.8 mg·100 g−1), further exacerbated economic losses. Therefore, through precise water and fertilizer coupling technology, it is an urgent problem to be solved in the current industrial development to improve the quality of tomatoes while increasing the ability of tomatoes to withstand transportation and storage.
Water and fertilizer coupling technology[6] is based on different water conditions, the irrigation and fertilization in time, quantity, and mode of fine coordination, promoting crop root deep, expanding the root system in the soil water absorption range, more use of deep soil water storage, and improve crop transpiration and photosynthetic intensity, reduce the invalid evaporation of soil. Li[7] showed that the ratio of water and fertilizer had a significant effect on the quality index and yield index of tomato. Yao et al.[8] has shown that sugar, as an energy substance and signal molecule, regulates fruit sweetness and various physiological processes, including fruit ripening, senescence, and response to stress. Ramandeep[9] stored tomatoes at 7, 15, and 25 °C for 10 d. Regardless of the temperature, the contents of soluble phenols and ascorbic acid in tomatoes increased slightly during storage. Distefano et al.[10] studied the storage quality of tomatoes cultivated in an intelligent greenhouse, and showed that cold storage could delay the ripening speed and decay process of tomato fruit, thus prolonging the preservation period of fruit. However, long-term cold storage treatment may lead to poor texture and flavor of tomato fruit. Currently, there is limited literature reporting the integration of water-fertilizer coupling with postharvest storage in tomato cultivation. Investigating the application rates of nitrogen (N), phosphorus (P), and potassium (K) holds significant implications for precisely meeting crop nutrient requirements, enhancing yield and quality, improving fertilizer utilization efficiency, and protecting ecological environments. Therefore, this experiment employed sandy soil from southern Xinjiang as the growth medium to cultivate tomatoes under water-fertilizer coupling treatments. During harvest, uniformly matured tomato fruits were stored at 4 °C in a cold storage facility, followed by a comprehensive analysis of variations, and dynamic changes in nutritional quality parameters.
Tomato fruit is a typical climacteric fruit, which is easy to distinguish at the mature stage, so it is often used as a model material to study the physiological metabolism of postharvest fruit. In this study, postharvest tomato fruits were used as materials to explore the relationship between water and fertilizer coupling and fruit ripening quality. Based on traditional facility tomato production technology, the effects of different water and fertilizer ratios on the nutritional quality of tomato fruit after low-temperature storage were studied, and the effective water and fertilizer ratio to achieve water and fertilizer saving was explored. The relationship between quality change and storage time and temperature was obtained, and the kinetic equation of tomato storage quality was established. The aim was to provide theoretical reference for tomato storage and preservation and to provide reference for the sales channels and sales radius storage period of facility tomatoes in southern Xinjiang, China.
-
The experiment was conducted in a multi-span greenhouse at the Horticultural Experimental Station of Tarim University, Xinjiang, China (81°16' E, 40°33' N) from January to August 2021. The experimental materials are composed of the locally planted variety 'Qinshu Lingyue' (provided by Qinshu Agriculture Co., Ltd., formerly known as the Municipal Fine Seed Breeding Center). This mid-early maturing cultivar completes its growth cycle in approximately 125 d, demonstrating an indeterminate growth habit with vigorous plant vigor. It exhibits dual tolerance to low and high temperature stresses, moderate foliar density, shortened internodal spacing, and persistent fruit-setting capacity. The cultivar produces high-spherical fruits with pink pigmentation, featuring a lustrous epidermis and superior organoleptic characteristics. The experiment was performed under trough cultivation in a north-south direction, with an individual plant spacing of 0.35 m, and row spacing of 1.1 m, in an area of 7.5 m2. Drip irrigation was performed using a reliable water source, water pump, water meter, fertilizer barrel (electric sprayer) and water pipeline, dripper, drip pipe, and other systems. The dripper exhibited a pressure-compensated flow rate of 2 L·h−1, with a dripper spacing of 35 cm. After the fruits entered the red ripening stage, 30 fruits with the same maturity at the full red stage were selected and stored in a 4 °C freezer after vacuum treatment. The quality of tomato fruit was measured on days 0, 7, 14, 21, and 28 after storage.
Experimental design
-
In this experiment, the water-fertilizer coupling mechanism was investigated using four factors: irrigation volume (W), nitrogen (N), phosphorus (P), and potassium (K) application rates. Each factor was assigned five coded levels (−α, −1, 0, +1, +α) to quantify synergistic interactions between irrigation and fertilization, where α = 2.378 ensured rotatability of the quadratic model. The experimental design adopted a half-fraction quadratic rotatable composite design (1/2 of 36 treatment combinations), resulting in 20 core treatment combinations strategically comprising eight factorial points, six axial points, and six center points. Each treatment was replicated three times (60 experimental units in total) to assess experimental error and model validity. Water-fertilizer management protocols were standardized: tomato seedlings (seven leaves, one core) were transplanted into cultivation tanks on February 10, 2021, with irrigation scheduling calibrated to soil moisture thresholds and fertilizer applications synchronized with critical growth stages. Fruits at uniform maturity were harvested at the full ripening phase (June 14, 2021) for storage analysis. The factor level coding scheme and treatment combinations are detailed in Table 1.
Table 1. The level coding and treatment combination of each treatment factor.
Treatment Code value scheme Actual value Irrigation level Amount
of nitrogenPhosphate Amount of
potassium appliedIrrigation level (mm·hm−2) Amount of
nitrogen (kg·hm−2)Phosphate (kg·hm−2) Amount of potassium
applied (kg·hm−2)H1 1 1 1 1 543 855 657 1107 H2 1 1 −1 −1 543 855 219 369 H3 1 1 1 −1 543 285 657 369 H4 1 −1 −1 1 543 285 219 1107 H5 −1 1 1 −1 369 855 657 369 H6 −1 1 −1 1 369 855 219 1107 H7 −1 −1 1 1 369 285 657 1107 H8 −1 −1 −1 −1 369 285 219 369 H9 −1.6818 0 0 0 310 570 438 738 H10 1.6818 0 0 0 602 570 438 738 H11 0 −1.6818 0 0 456 90 438 738 H12 0 1.6818 0 0 456 1049 438 738 H13 0 0 −1.6818 0 456 570 70 738 H14 0 0 1.6818 0 456 570 806 738 H15 0 0 0 −1.6818 456 570 438 117 H16 0 0 0 1.6818 456 570 438 1359 H17 0 0 0 0 456 570 438 738 H18 0 0 0 0 456 570 438 738 H19 0 0 0 0 456 570 438 738 H20 0 0 0 0 456 570 438 738 To enhance interpretability, the original coded values (−1.682, −1, 0, 1, and 1.682) representing fertilizer parameters were replaced with five qualitative levels: low, relatively low, medium, relatively high, and high, respectively, throughout this study. Determination of indicators
-
Fruit hardness was measured with a GY-4 fruit hardness tester. Three tomatoes were taken from each group, and the fruit chamber was separated from its equator for measurement. The hardness meter probe pointed vertically to the fruit and applied pressure until the top of the probe pressed into the pulp. The hardness was recorded in kg·cm−2. The average hardness of each fruit was also calculated[11].
Soluble sugar content
-
the content of soluble sugar was determined via anthrone colorimetry. Each sample was measured three times in parallel. The content of soluble sugar was calculated from the standard curve, and the unit was %.
Lycopene content
-
The lycopene content was calculated based on the value obtained using the colorimeter. The method was adopted by Yildiz & Baysal to rapidly detect the lycopene content with a colorimeter[12]. The CR-400/410 colorimeter was used. Three fruits were taken from each group; each fruit was measured three times, and three consecutive values were recorded. Chroma was measured using L, a, and b values, and substituted into the formula, O (lycopene content) = 3.004X − 35.003, where X is the Chroma value, and the lycopene content is expressed as μg·g−1.
Vitamin C content
-
Vitamin C content was determined via 2,6-dichlorophenol indophenol sodium method. Each sample was measured three times in parallel. The content of vitamin C was calculated from the standard curve, and the unit of measurement was mg·kg−1.
Tomato quality index (TQI)
-
The tomato quality index (TQI) was calculated as described by Huang et al.[13] and other comprehensive methods of evaluation of tomato fruit. First, the indices of hardness, soluble sugar, lycopene, and vitamin C levels were non-dimensionally treated to eliminate the differences between measurements, and the values ranged between 0 and 1. Next, each index was calculated using Eqn (1), where Ti is a dimensionless quantity and y is the actual measured value of each index. The maximum and minimum values of each index are represented by m and s. Finally, the value of TQI was obtained using Eqn (2). Equation (1) was used to calculate the TQI. The larger the value, the better the comprehensive quality of tomato fruit preserved under storage following water and fertilizer treatment.
$ \mathrm{T}\mathrm{i}\mathrm{ }=\mathrm{ }\mathrm{y}\mathrm{ }-\mathrm{ }\mathrm{s}/\left(\mathrm{m}\mathrm{ }-\mathrm{ }\mathrm{s}\right) $ (1) $ \text{TQI=}{\sum }_{\text{i}\text{=1}}^{\text{n}}\text{Ti} $ (2) Kinetic model and data processing
Zero-order and first-order kinetic equations
-
A large number of experiments show that the nutritional components and sensory indices of fruits and vegetables are affected by various factors during low-temperature storage. Most of these changes follow zero-order or first-order reaction kinetics, represented by Eqns (3) and (4) below.
${\rm Zero{\text -}order \;reaction : N} -[N]=k $ (3) ${\rm First{\text -}order\; reaction :}\; [N]= \exp\left(-kt\right) $ (4) By taking the logarithm of Eqn (2), we obtain:
$ \left[{\mathrm{N}}_{0}\right]-\mathrm{ln}[N]=kt $ In the formula, t is the storage time, [N0] is the initial quality index of tomato storage, [N] is the quality index after t days of storage, and k is the rate constant of the reaction. The reaction order and equation were determined according to the measured data of tomato quality index changing with time during storage.
Data processing
-
In this experiment, Microsoft Office Excel 2020 was used to count and sort the data, and GraphPad Prism 9.0 was used for data analysis. SPSS version 18.0 and the DPS data processing system were used to process each index. The relationship between TQI and quality indices after storage was tested via linear regression analysis.
-
Fruit firmness is a complex trait involving many physical properties, including cell wall structure, cell turgor, and cuticle properties[14−17]. As shown in Fig. 1, different water and fertilizer ratios affected the hardness of tomatoes during storage. With the extension of storage time, each treatment showed a 'slow-fast-slow' downward trend. The hardness value of each treatment showed a slow downward trend under storage between days 0 and 14. The hardness of H10 was the highest (5.289 kg·cm−2) after 14 d of storage, suggesting a decrease of 24.8%. The hardness of H7 was 5.222 kg·cm−2, which decreased by 22.1%. After 14−21 d of storage, the hardness of tomato fruit decreased rapidly, with H8 showing the smallest decrease of 26.8% and H11 the largest decrease of 60.8%. The hardness of H8 was the highest after 21 d of storage, which was 3.944 kg·cm−2, followed by H13, which showed a hardness value of 3.889 kg·cm−2. It indicated that fruit softening was closely related to the disintegration and degradation of the cell wall during storage.
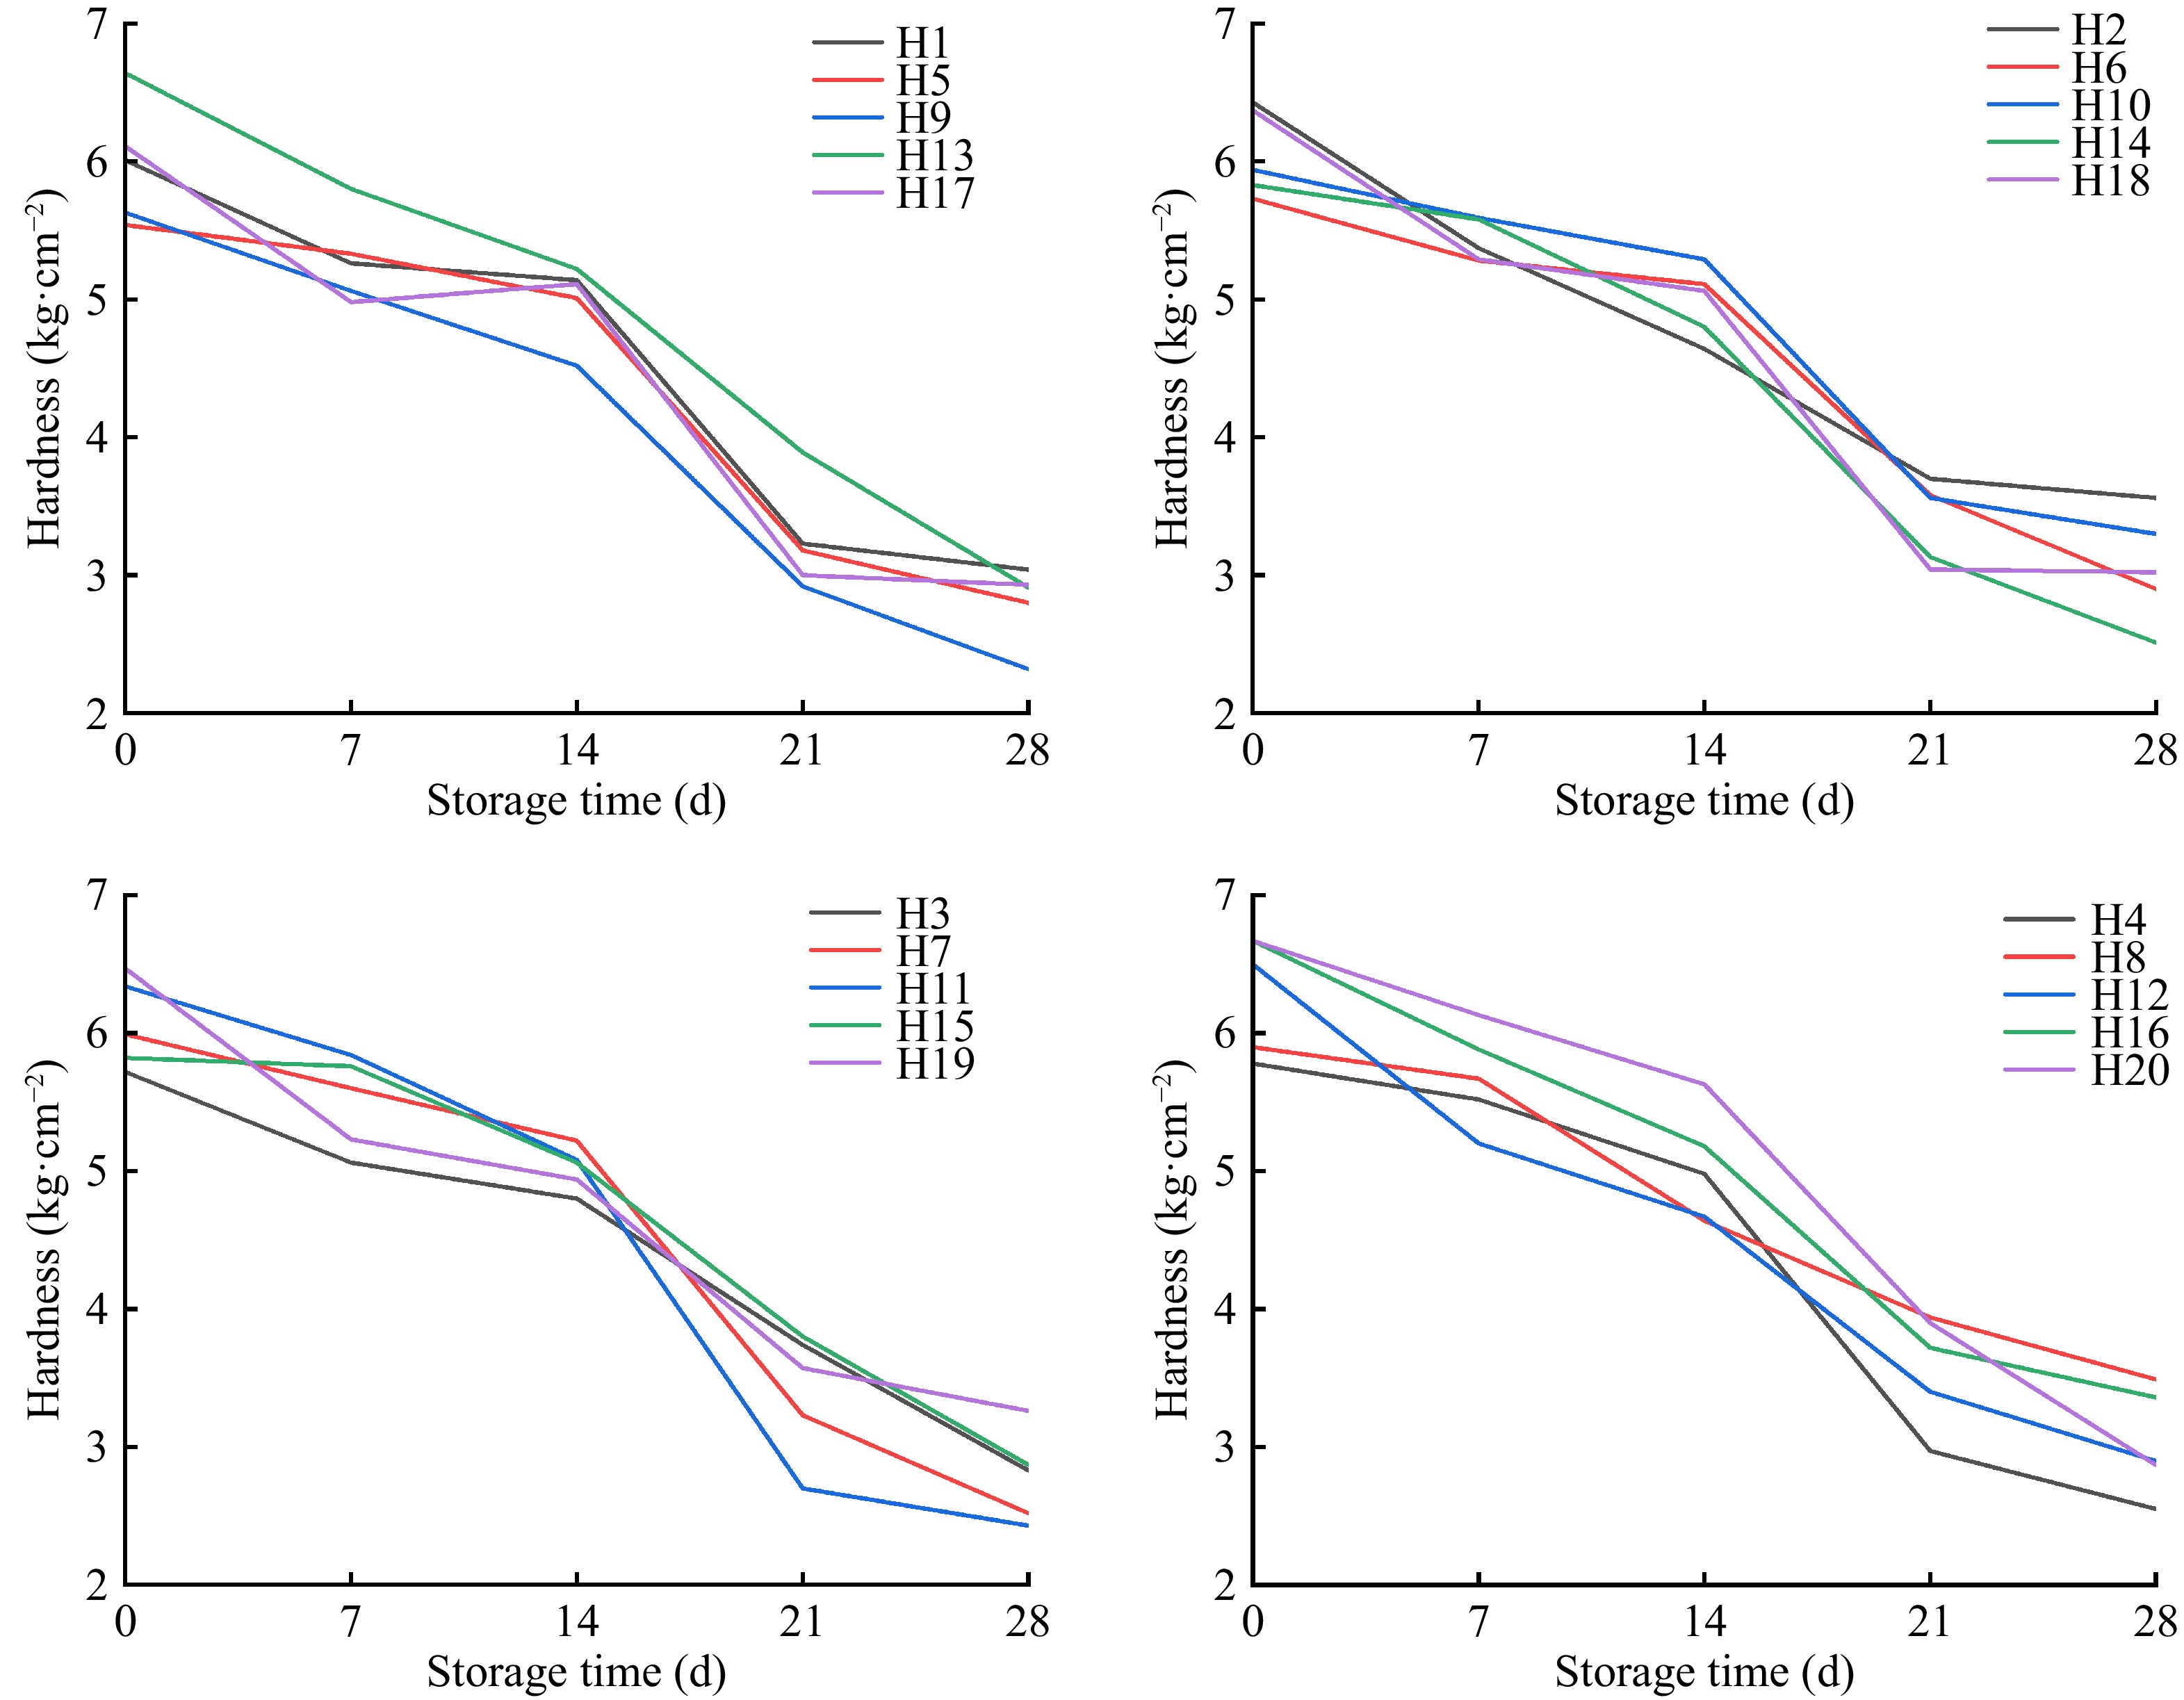
Figure 1.
Changes in hardness and storage time under different water-to-fertilizer ratios.
Based on the experimental data, the reaction rate constant k of the hard sand-cultured tomatoes, under the corresponding reaction coefficient was calculated from Eqns (3) and (4), and the correlation coefficient R2 was obtained. The results are shown in Table 2. The correlation coefficient R2 in the first-order reaction was larger than that in the zero-order reaction, which indicates that the fitting degree of the hardness change and the first-order reaction change was enhanced during the storage of sand-cultured tomatoes. Therefore, the kinetics of hardness change of sand-cultured tomato under storage was consistent with first-order reaction. In terms of hardness, the stored tomatoes in H2, H3, H12, H13, H15, and H20 groups fitted the first-order reaction kinetic model.
Table 2. Zero order and first-order reaction rate constants and determination coefficients of hardness changes in sand cultivated tomatoes under different water and fertilizer ratios.
Water and fertilizer treatment Zero-order reaction First-order reaction Regression equation Reaction rate constant Correlation coefficient Regression equation Reaction rate constant Correlation coefficient H1 X2 = 0.613556 − 0.011341X1 0.011341 0.9056 X2 = 0.715972/(1 + EXP(−1.6637 + 0.074204X1)) 0.074204 0.9157 H2 X2 = 0.622444 − 0.010603X1 0.010603 0.9575 X2 = 831.5989/(1 + EXP(7.1735 + 0.023001X1)) 0.023001 0.9818 H3 X2 = 0.584889 − 0.009968X1 0.009968 0.9595 X2 = 0.605382/(1 + EXP(−2.5640 + 0.095588X1)) 0.095588 0.9866 H4 X2 = 0.609889 − 0.012873X1 0.012873 0.9385 X2 = 0.666221/(1 + EXP(−2.0774 + 0.096845X1)) 0.096845 0.9613 H5 X2 = 0.590222 − 0.010921X1 0.010921 0.8848 X2 = 0.606894/(1 + EXP(−2.6517 + 0.105617X1)) 0.105617 0.9296 H6 X2 = 0.599333 − 0.010524X1 0.010524 0.9185 X2 = 0.610340/(1 + EXP(−2.7643 + 0.105018X1)) 0.105018 0.9622 H7 X2 = 0.636444 − 0.013159X1 0.013159 0.9135 X2 = 0.643247/(1 + EXP(−2.7932 + 0.119279X1)) 0.119279 0.9588 H8 X2 = 0.603889 − 0.009365X1 0.009365 0.9712 X2 = 0.835779/(1 + EXP(−0.939008 + 0.047201X1)) 0.047201 0.9744 H9 X2 = 0.584778 − 0.012540X1 0.012540 0.9594 X2 = 0.634521/(1 + EXP(−2.1096 + 0.098699X1)) 0.098699 0.9778 H10 X2 = 0.620000 − 0.010460X1 0.010460 0.9012 X2 = 0.673096/(1 + EXP(−2.1559 + 0.082881X1)) 0.082881 0.9258 H11 X2 = 0.666889 − 0.015651X1 0.015651 0.9217 X2 = 0.720430/(1 + EXP(−2.1611 + 0.109661X1)) 0.109661 0.9450 H12 X2 = 0.633311 − 0.012857X1 0.012857 0.9780 X2 = 1.9470/(1 + EXP(0.700469 + 0.037786X1)) 0.037786 0.9844 H13 X2 = 0.676444 − 0.013333X1 0.013333 0.9846 X2 = 0.769768/(1 + EXP(−1.7915 + 0.081801X1)) 0.081801 0.9929 H14 X2 = 0.618444 − 0.012921X1 0.012921 0.9416 X2 = 0.652681/(1 + EXP(−2.3483 + 0.104762X1)) 0.104762 0.9718 H15 X2 = 0.623333 − 0.011238X1 0.011238 0.9288 X2 = 0.625679/(1 + EXP(−2.9466 + 0.113388X1)) 0.113388 0.9867 H16 X2 = 0.662889 − 0.012206X1 0.012206 0.9705 X2 = 1.1094/(1 + EXP(−0.404949 + 0.045979X1)) 0.045979 0.9726 H17 X2 = 0.602444 − 0.011905X1 0.011905 0.9261 X2 = 1.1123/(1 + EXP(−0.187209 + 0.046426X1)) 0.046426 0.9302 H18 X2 = 0.634333 − 0.012778X1 0.012778 0.9175 X2 = 0.943992/(1 + EXP(−0.720706 + 0.056926X1)) 0.056926 0.9212 H19 X2 = 0.631111 − 0.011556X1 0.011556 0.9571 X2 = 2.3789/(1 + EXP(0.995675 + 0.031162X1)) 0.031162 0.9630 H20 X2 = 0.700667 − 0.014048X1 0.014048 0.9465 X2 = 0.711344/(1 + EXP(−2.7299 + 0.113821X1)) 0.113821 0.9858 X1 in the table is the number of days of tomato storage; X2 is the predicted value of tomato hardness. Changes in soluble sugar under different water and fertilizer treatments during storage
-
As shown in Fig. 2, different water and fertilizer ratios specifically altered the levels of soluble sugar in tomato during storage. With the extension of storage time, each treatment showed a uniform downward trend. Storage for zero to 14 d decreased the soluble sugar content under each treatment, with the largest decrease observed after storage for 14 d in H17 (2.19%), resulting in a decrease of 55.1%. The H13 group showed a soluble sugar value of 2.18%, representing a decrease of 25.8%. After 0−21 d of storage, H11 had the smallest decrease of 87.1%, and H1 had the largest decrease of 90.1%. At 28 d of storage, the soluble sugar value of H17 was the highest at 1.48%, followed by the H11 group, which was 1.43%. It indicated that the respiration rate consumed the soluble sugar content in tomato fruit during storage.
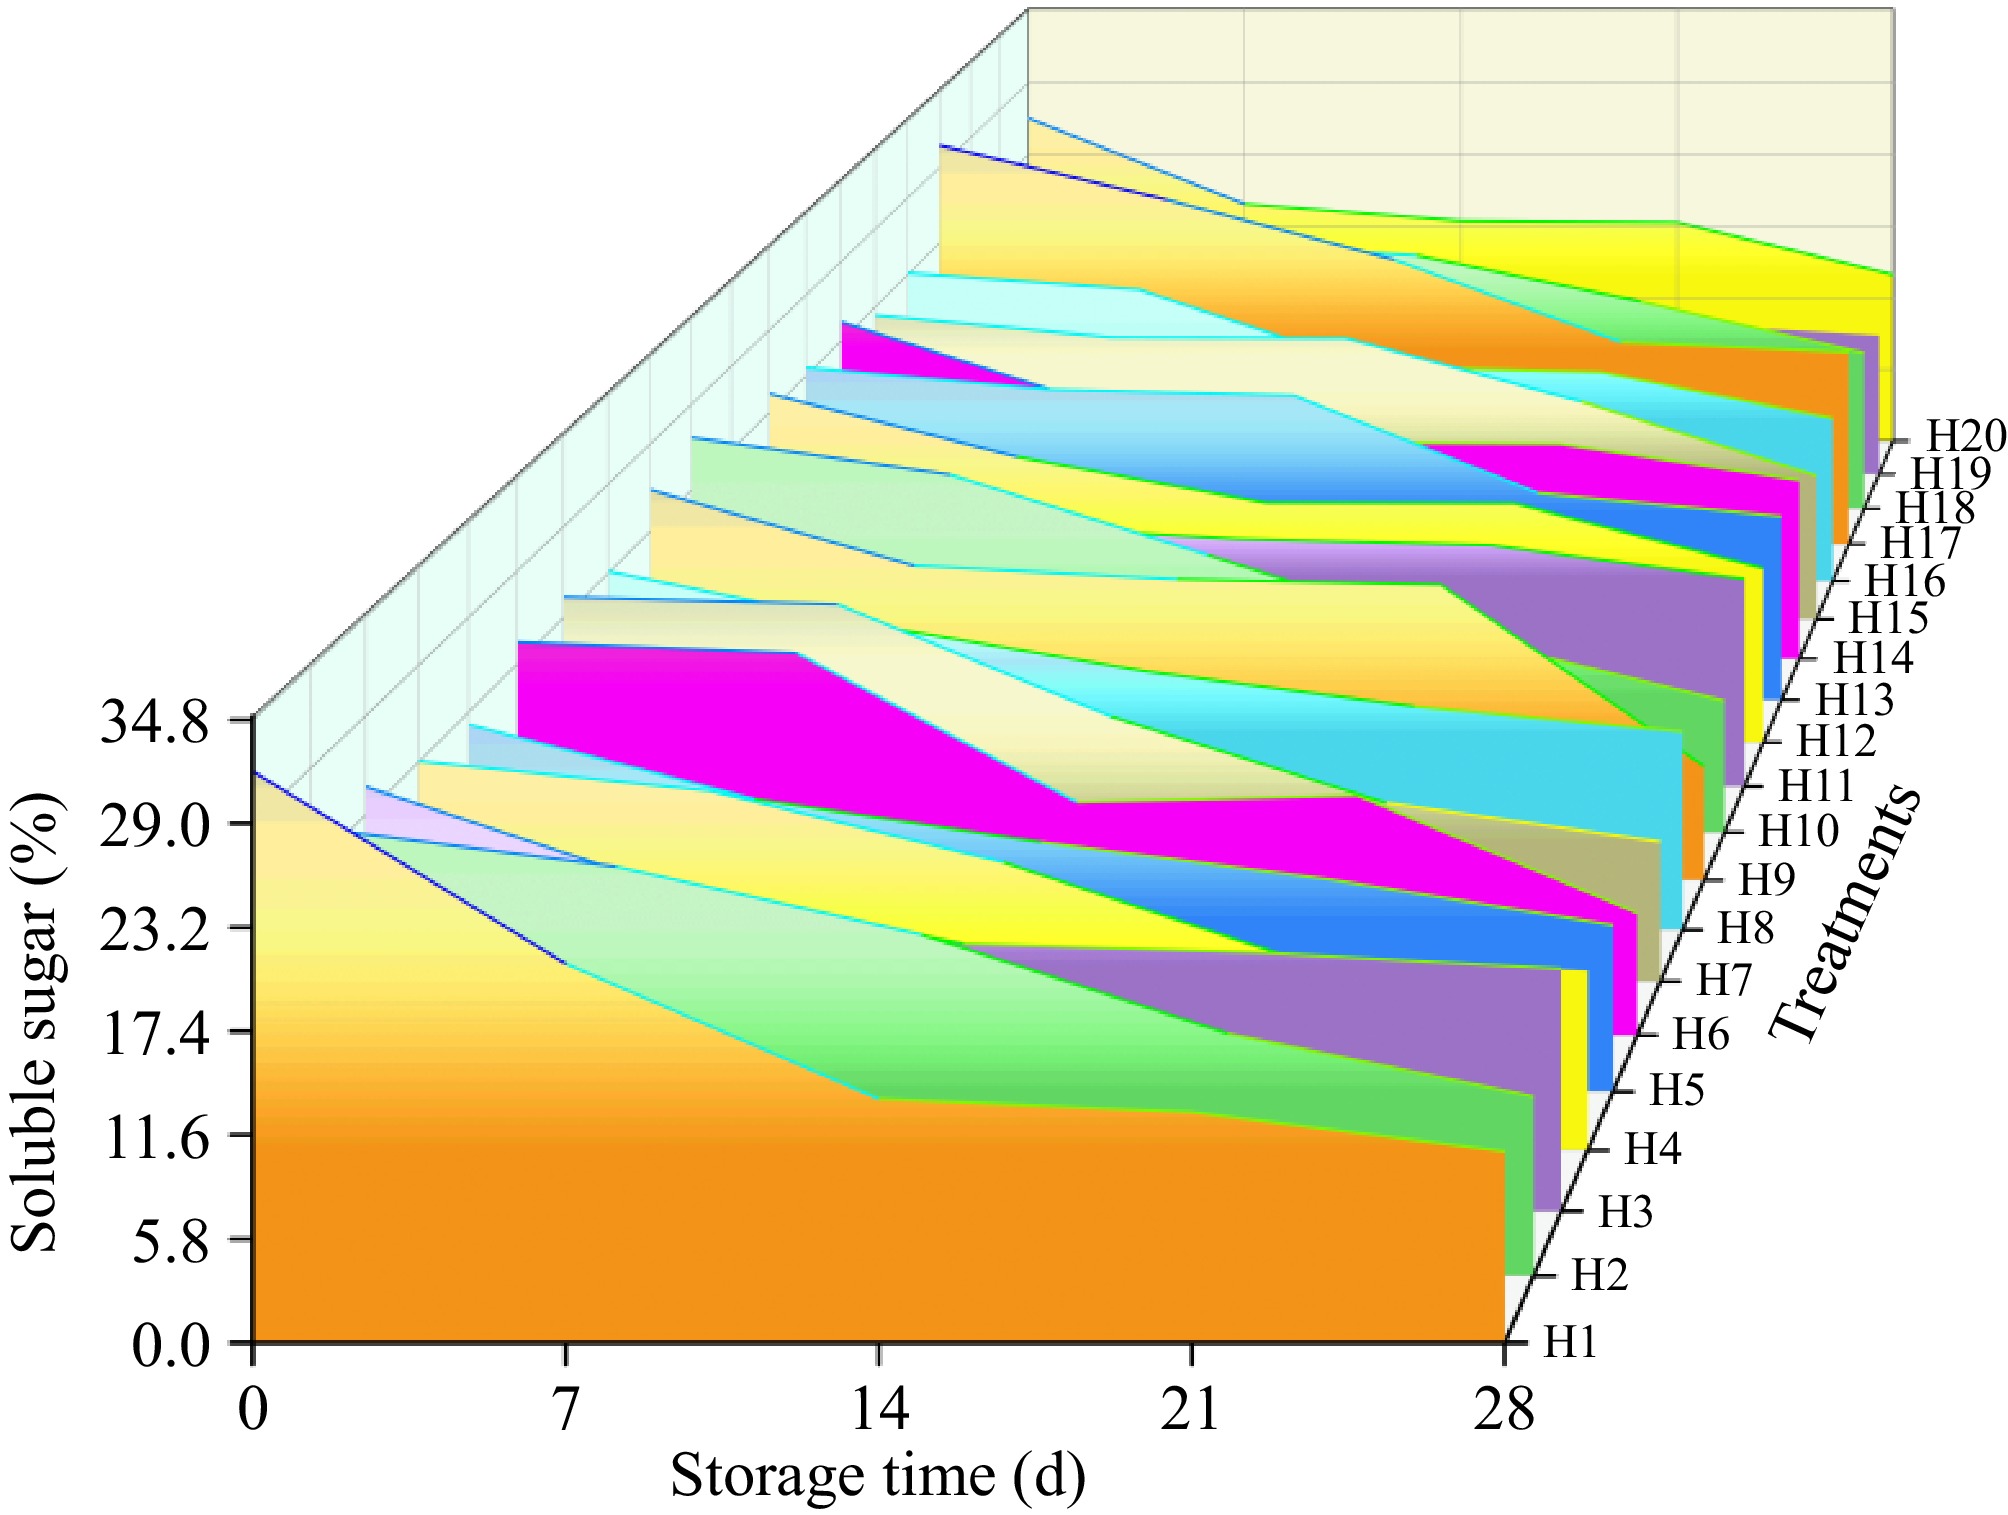
Figure 2.
Changes in soluble sugar and storage time under different water and fertilizer ratios.
As shown in Table 3, The experimental data of soluble sugar were calculated using Eqns (3) and (4). The rate constants k in zero-order and first-order reactions of the kinetic model were obtained, together with their correlation coefficient R2. By comparing the correlation coefficients of the two series, it was shown that the soluble sugar of sand-cultured tomatoes under different water and fertilizer ratios was more consistent with the first-order reaction. The first-order reaction of H17 was better, and the correlation coefficient was 0.9754. The change in soluble sugar under storage was consistent with the first-order reaction.
Table 3. Zero-order and first-order reaction rate constants and correlation coefficients of soluble sugar content of tomato in sand culture under different water and fertilizer ratios.
Water and fertilizer treatment Zero-order reaction First-order reaction Regression equation Reaction rate constant Correlation coefficient Regression equation Reaction rate constant Correlation coefficient H1 X2 = 28.8470 − 0.755354X1 0.755354 0.8395 X2 = 8,481.9293/(1 + EXP(5.5899 + 0.047548X1)) 0.047548 0.9457 H2 X2 = 26.5926 − 0.576422X1 0.576422 0.9819 X2 = 29.6266/(1 + EXP(−1.9231 + 0.093496X1)) 0.093496 0.9953 H3 X2 = 22.8185 − 0.359867X1 0.359867 0.8379 X2 = 72,541.1600/(1 + EXP(8.0340 + 0.021706X1)) 0.021706 0.8952 H4 X2 = 22.8185 − 0.359867X1 0.359867 0.8379 X2 = 72,541.1600/(1 + EXP(8.0340 + 0.021706X1)) 0.021706 0.8952 H5 X2 = 21.6233 − 0.419661X1 0.419661 0.9807 X2 = 128,163.0305/(1 + EXP(8.6605 + 0.027113X1)) 0.027113 0.9940 H6 X2 = 25.6608 − 0.610153X1 0.610153 0.9039 X2 = 30.3448/(1 + EXP(−1.5767 + 0.090557X1)) 0.090557 0.9067 H7 X2 = 25.9195 − 0.626635X1 0.626635 0.9481 X2 = 29.8062/(1 + EXP(−1.7588 + 0.099337X1)) 0.099337 0.9646 H8 X2 = 22.6970 − 0.372647X1 0.372647 0.9793 X2 = 171,521.3241/(1 + EXP(8.9101 + 0.021750X1)) 0.021750 0.9969 H9 X2 = 26.3834 − 0.542267X1 0.542267 0.7864 X2 = 22.5843/(1 + EXP(−8.5787 + 0.329461X1)) 0.329461 0.8951 H10 X2 = 27.7176 − 0.667503X1 0.667503 0.9872 X2 = 31.4207/(1 + EXP(−1.8166 + 0.099736X1)) 0.099736 0.9970 H11 X2 = 21.0315 − 0.241560X1 0.241560 0.8912 X2 = 36,342.2462/(1 + EXP(7.4434 + 0.013990X1)) 0.013990 0.9092 H12 X2 = 23.6797 − 0.397745X1 0.397745 0.9364 X2 = 3,479.2203/(1 + EXP(4.9641 + 0.022361X1)) 0.022361 0.9455 H13 X2 = 24.9081 − 0.409861X1 0.409861 0.8881 X2 = 25.8104/(1 + EXP(−2.6009 + 0.095383X1)) 0.095383 0.9278 H14 X2 = 22.8886 − 0.376458X1 0.376458 0.8863 X2 = 136,036.4153/(1 + EXP(8.6627 + 0.022460X1)) 0.022460 0.9279 H15 X2 = 23.9872 − 0.408938X1 0.408938 0.8627 X2 = 22.5429/(1 + EXP(−4.4227 + 0.162398X1)) 0.162398 0.9858 H16 X2 = 23.6017 − 0.403839X1 0.403839 0.9399 X2 = 41.4151/(1 + EXP(−0.290605 + 0.040683X1)) 0.040683 0.9414 H17 X2 = 30.3753 − 0.608310X1 0.608310 0.9655 X2 = 77.5410/(1 + EXP(0.410452 + 0.039907X1)) 0.039907 0.9754 H18 X2 = 24.2516 − 0.403246X1 0.403246 0.9675 X2 = 26.1364/(1 + EXP(−2.1926 + 0.082239X1)) 0.082239 0.9827 H19 X2 = 21.6041 − 0.426556X1 0.426556 0.8993 X2 = 196,525.7721/(1 + EXP(9.0774 + 0.028822X1)) 0.028822 0.9462 H20 X2 = 24.1891 − 0.382369X1 0.382369 0.8506 X2 = 27,980.1398/(1 + EXP(7.0305 + 0.021042X1)) 0.021042 0.8777 X1 in the table is the number of days of tomato storage; X2 is the predicted value of tomato soluble sugar. Changes in lycopene content under different water and fertilizer treatments during storage
-
As shown in Fig. 3, different water and fertilizer ratios affected the changes in lycopene content during storage. With the prolongation of storage time, each treatment led to a 'slow rise-rapid decline'. The lycopene content of each treated fruit showed a slow upward trend at 0−14 d of storage. After 14 d of storage, the lycopene content of H11 increased the most, which was 125.62 μg·g−1, followed by H13, with a lycopene content of 125.02 μg·g−1. After 14−21 d of storage, the lycopene content of tomato fruits in each treatment decreased rapidly. The decrease in lycopene levels of H18 was the smallest (15.4%), and the decrease in H10 was the largest (87.7%). At 28 d of storage, the lycopene value of H1 was the highest at 97.21 μg·g−1, followed by the H13 group, which was 96.08 μg·g−1. The observed biphasic pattern of lycopene content was attributed to enhanced biosynthesis during tomato postharvest ripening, followed by degradation triggered by climacteric respiration during storage.
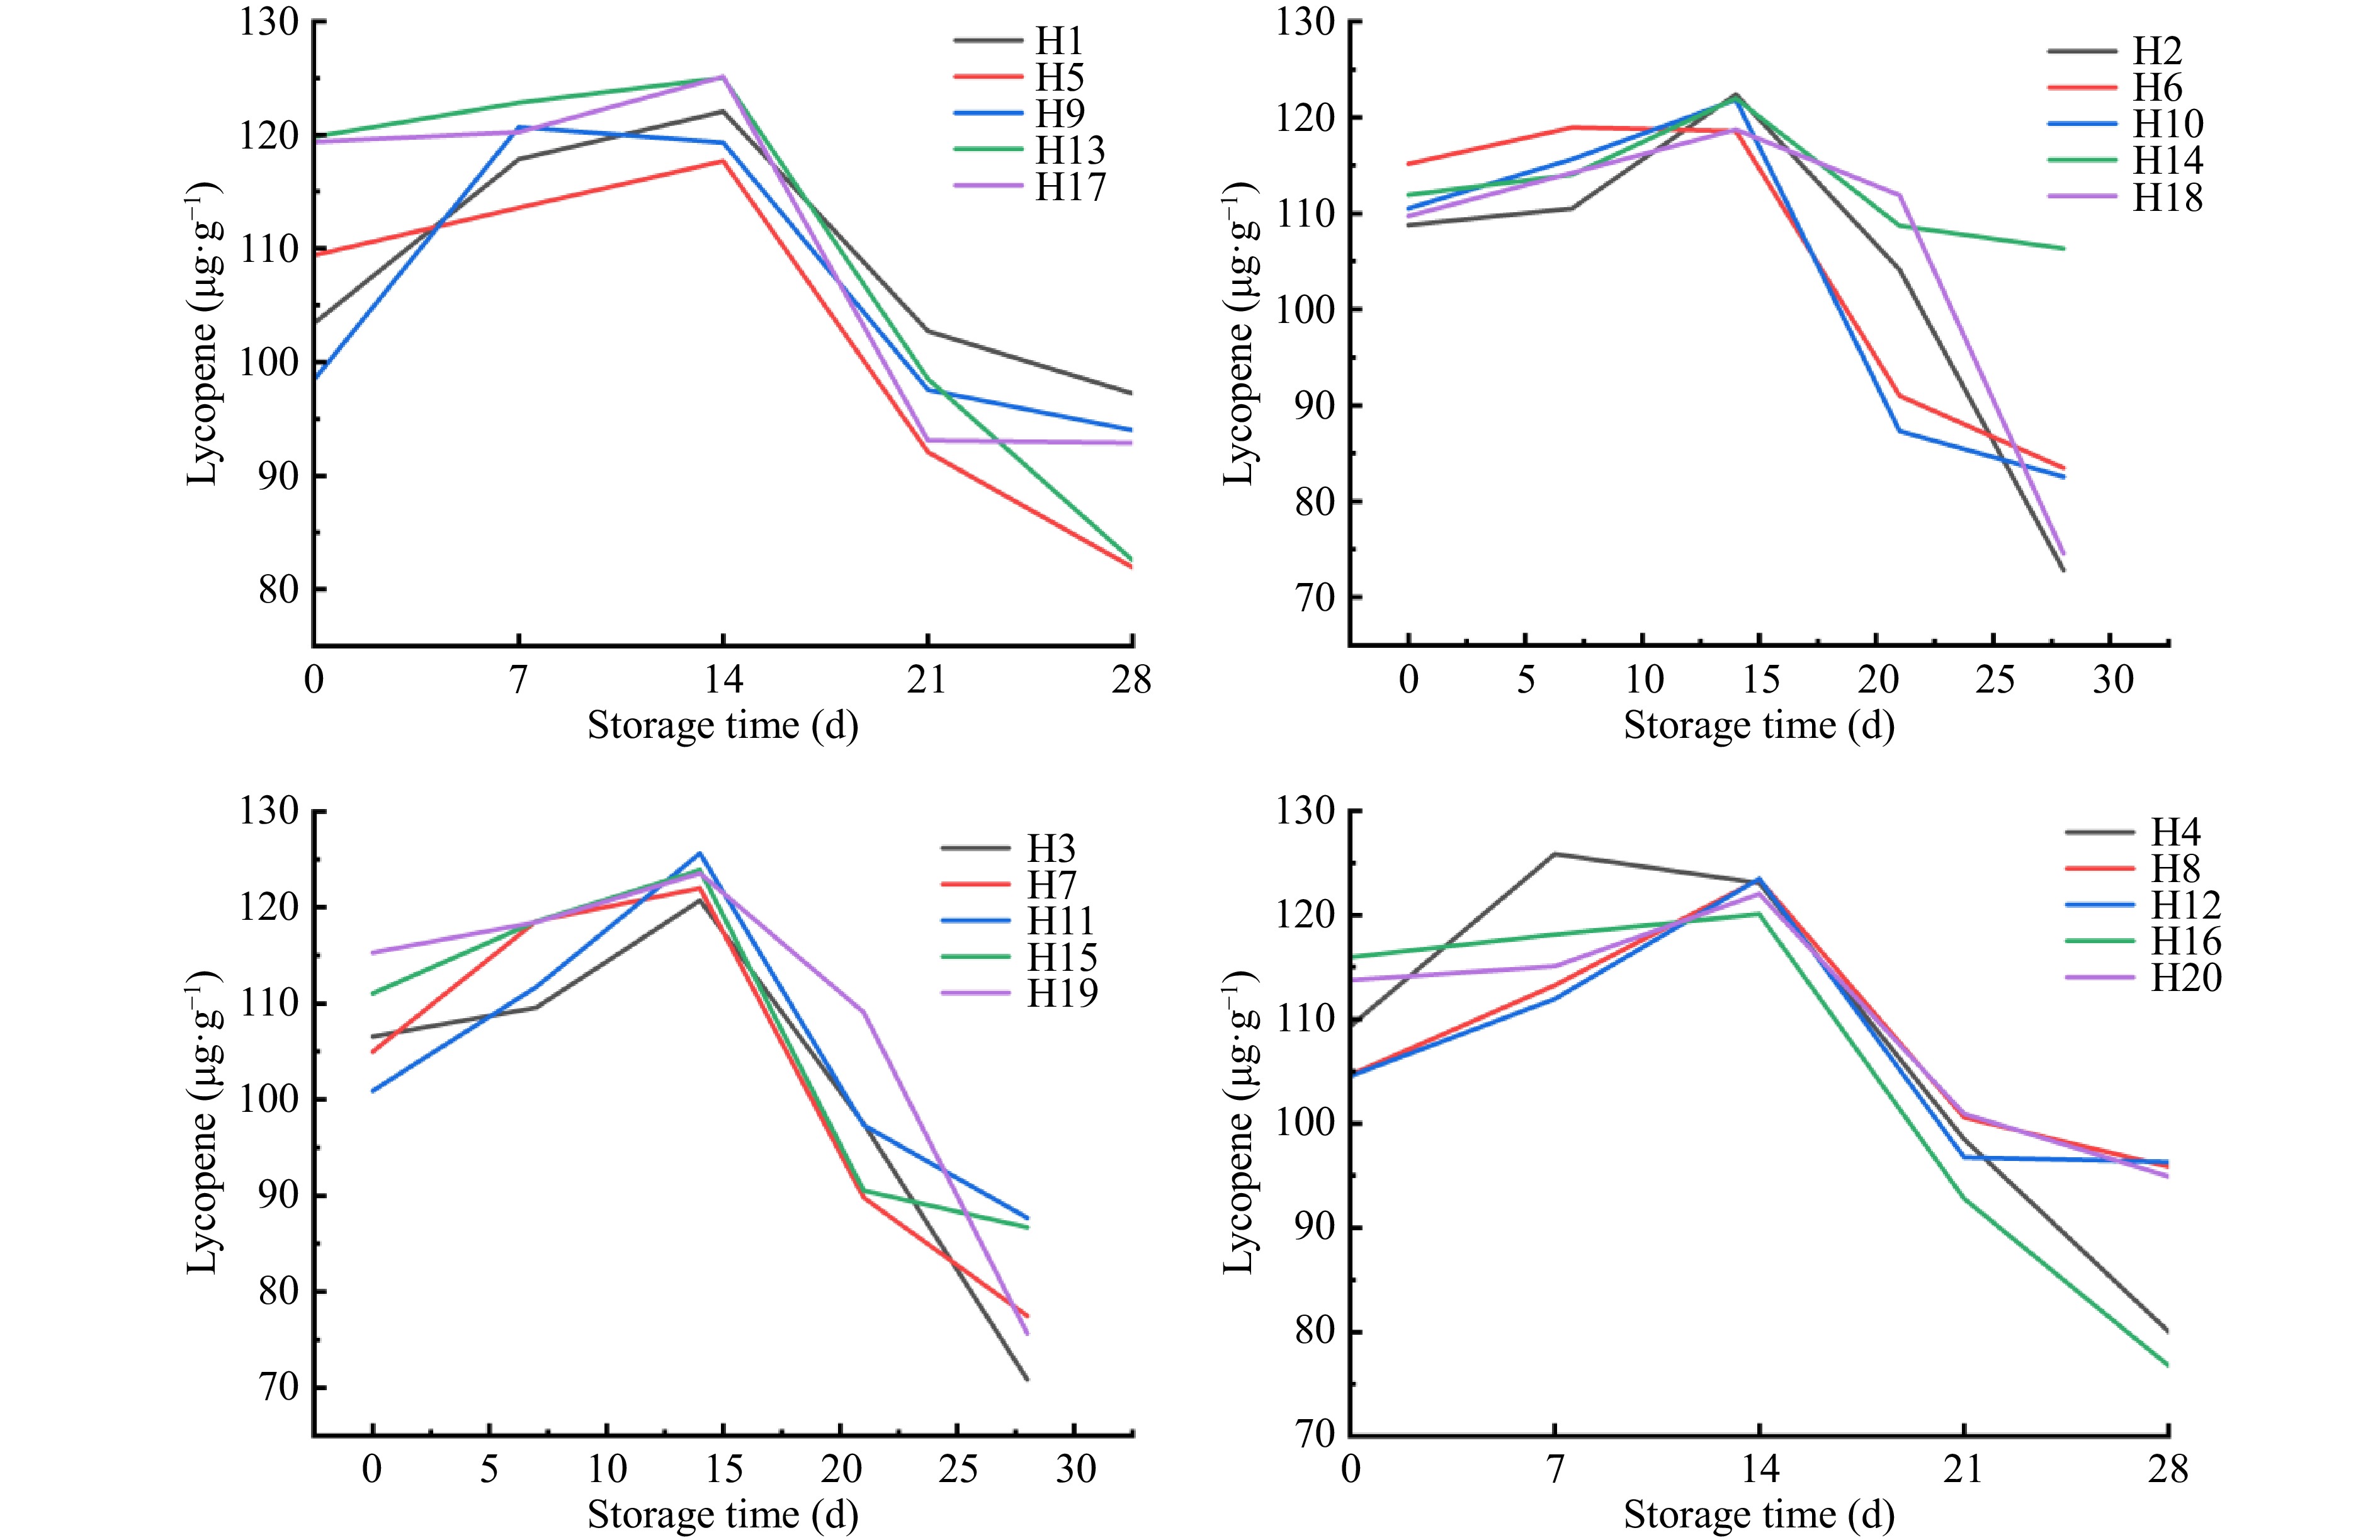
Figure 3.
Effects of storage time on lycopene under different water and fertilizer ratios.
As shown in Table 4, The lycopene test data were calculated using Eqns (3) and (4). The rate constant (k) in the zero-order and first-order reactions of the kinetic model was obtained, and the correlation coefficient R2 was also determined. Based on the correlation analysis, the lycopene of sand-cultured tomatoes under different water and fertilizer ratios was more consistent with the first-order reaction. Comparing the first-order reactions of 20 groups of lycopene, it was found that the H2, H3, H6, H11, H13, H16, and H20 groups had a higher degree of fitting with the first-order reaction.
Table 4. Zero-order and first-order reaction rate constants and correlation coefficients of lycopene content in sand-cultured tomato under different water and fertilizer ratios.
Water and fertilizer treatment Zero-order reaction First-order reaction Regression equation Reaction rate constant Correlation coefficient Regression equation Reaction rate constant Correlation coefficient H1 X2 = 114.1535 − 0.393447X1 0.393447 0.1656 X2 = 113.4065/(1 + EXP(−7.1691 + 0.194381X1)) 0.194381 0.4448 H2 X2 = 119.4587 − 1.1284X1 1.1284 0.4470 X2 = 113.5233/(1 + EXP(−9.1896 + 0.308270X1)) 0.308270 0.9064 H3 X2 = 117.7443 − 1.1929X1 1.1929 0.4926 X2 = 111.9576/(1 + EXP(−7.5344 + 0.250599X1)) 0.250599 0.8835 H4 X2 = 124.5365 − 1.2282X1 1.2282 0.5204 X2 = 119.9351/(1 + EXP(−5.7911 + 0.184073X1)) 0.184073 0.8175 H5 X2 = 118.2350 − 1.0929X1 1.0929 0.6272 X2 = 114.9281/(1 + EXP(−4.8839 + 0.144766X1)) 0.144766 0.8295 H6 X2 = 123.7006 − 1.3048X1 1.3048 0.7312 X2 = 121.9513/(1 + EXP(−3.8997 + 0.115155X1)) 0.115155 0.8570 H7 X2 = 119.3229 − 1.1968X1 1.1968 0.4900 X2 = 115.4133/(1 + EXP(−5.3785 + 0.169974X1)) 0.169974 0.7476 H8 X2 = 112.4134 − 0.432594X1 0.432594 0.2893 X2 = 111.1648/(1 + EXP(−6.5740 + 0.171748X1)) 0.171748 0.5649 H9 X2 = 112.3896 − 0.456737X1 0.456737 0.1536 X2 = 111.7282/(1 + EXP(−6.3736 + 0.171521X1)) 0.171521 0.3733 H10 X2 = 120.4036 − 1.2031X1 1.2031 0.5755 X2 = 117.8957/(1 + EXP(−4.3473 + 0.129540X1)) 0.129540 0.7307 H11 X2 = 110.8261 − 0.583811X1 0.583811 0.3297 X2 = 108.8337/(1 + EXP(−6.8557 + 0.195863X1)) 0.195863 0.6644 H12 X2 = 112.9478 − 0.453232X1 0.453232 0.1929 X2 = 112.0050/(1 + EXP(−6.1305 + 0.158566X1)) 0.158566 0.3849 H13 X2 = 129.5200 − 1.4121X1 1.4121 0.7124 X2 = 124.9003/(1 + EXP(−4.8056 + 0.150013X1)) 0.150013 0.9097 H14 X2 = 115.8803 − 0.235104X1 0.235104 0.1875 X2 = 115.2472/(1 + EXP(−7.5697 + 0.184149X1)) 0.184149 0.4308 H15 X2 = 121.4842 − 1.0956X1 1.0956 0.5273 X2 = 119.2548/(1 + EXP(−4.4706 + 0.129254X1)) 0.129254 0.6924 H16 X2 = 125.5049 − 1.4829X1 1.4829 0.7338 X2 = 120.8531/(1 + EXP(−4.6363 + 0.148194X1)) 0.148194 0.9169 H17 X2 = 126.1745 − 1.1455X1 1.1455 0.6422 X2 = 126.5790/(1 + EXP(−3.5452 + 0.095305X1)) 0.095305 0.7266 H18 X2 = 120.3463 − 1.0373X1 1.0373 0.4169 X2 = 114.1383/(1 + EXP(−14.3382 + 0.489449X1)) 0.489449 0.9675 H19 X2 = 126.1550 − 1.2678X1 0.741408 0.5463 X2 = 119.0906/(1 + EXP(−8.6740 + 0.290296X1)) 0.138877 0.7443 H20 X2 = 119.7115 − 0.741408X1 1.2678 0.5418 X2 = 117.4821/(1 + EXP(−5.2487 + 0.138877X1)) 0.290296 0.9663 X1 in the table is the number of days of tomato storage; X2 is the predicted value of tomato lycopene. Changes in vitamin C content under different water and fertilizer treatments during storage
-
Vitamin C content is one of the important indexes to evaluate the comprehensive quality of tomato. As shown in Fig. 4, different water and fertilizer ratios specifically altered the vitamin C content during storage. With the extension of storage time, each treatment showed a 'fast-slow' downward trend. The vitamin C content of each treated fruit showed a rapid downward trend during zero to 14 d of storage. When stored for 14 d, the vitamin C content of H11 was the highest, which was 46.23 mg·kg−1, with a decrease of 43.9%, followed by H17, with a vitamin C content of 42.50 mg·kg−1, representing a decrease of 41.7%. After 14−28 d of storage, the vitamin C content of tomato fruits in each treatment decreased slowly, with the smallest decrease of 9.3% in H19 and the largest decrease of 46.6% in H17. After 28 d of storage, the vitamin C content of H12 was the highest, which was 30.68 mg·kg−1, followed by H13 group, which showed a vitamin C level of 29.85 mg·kg−1.
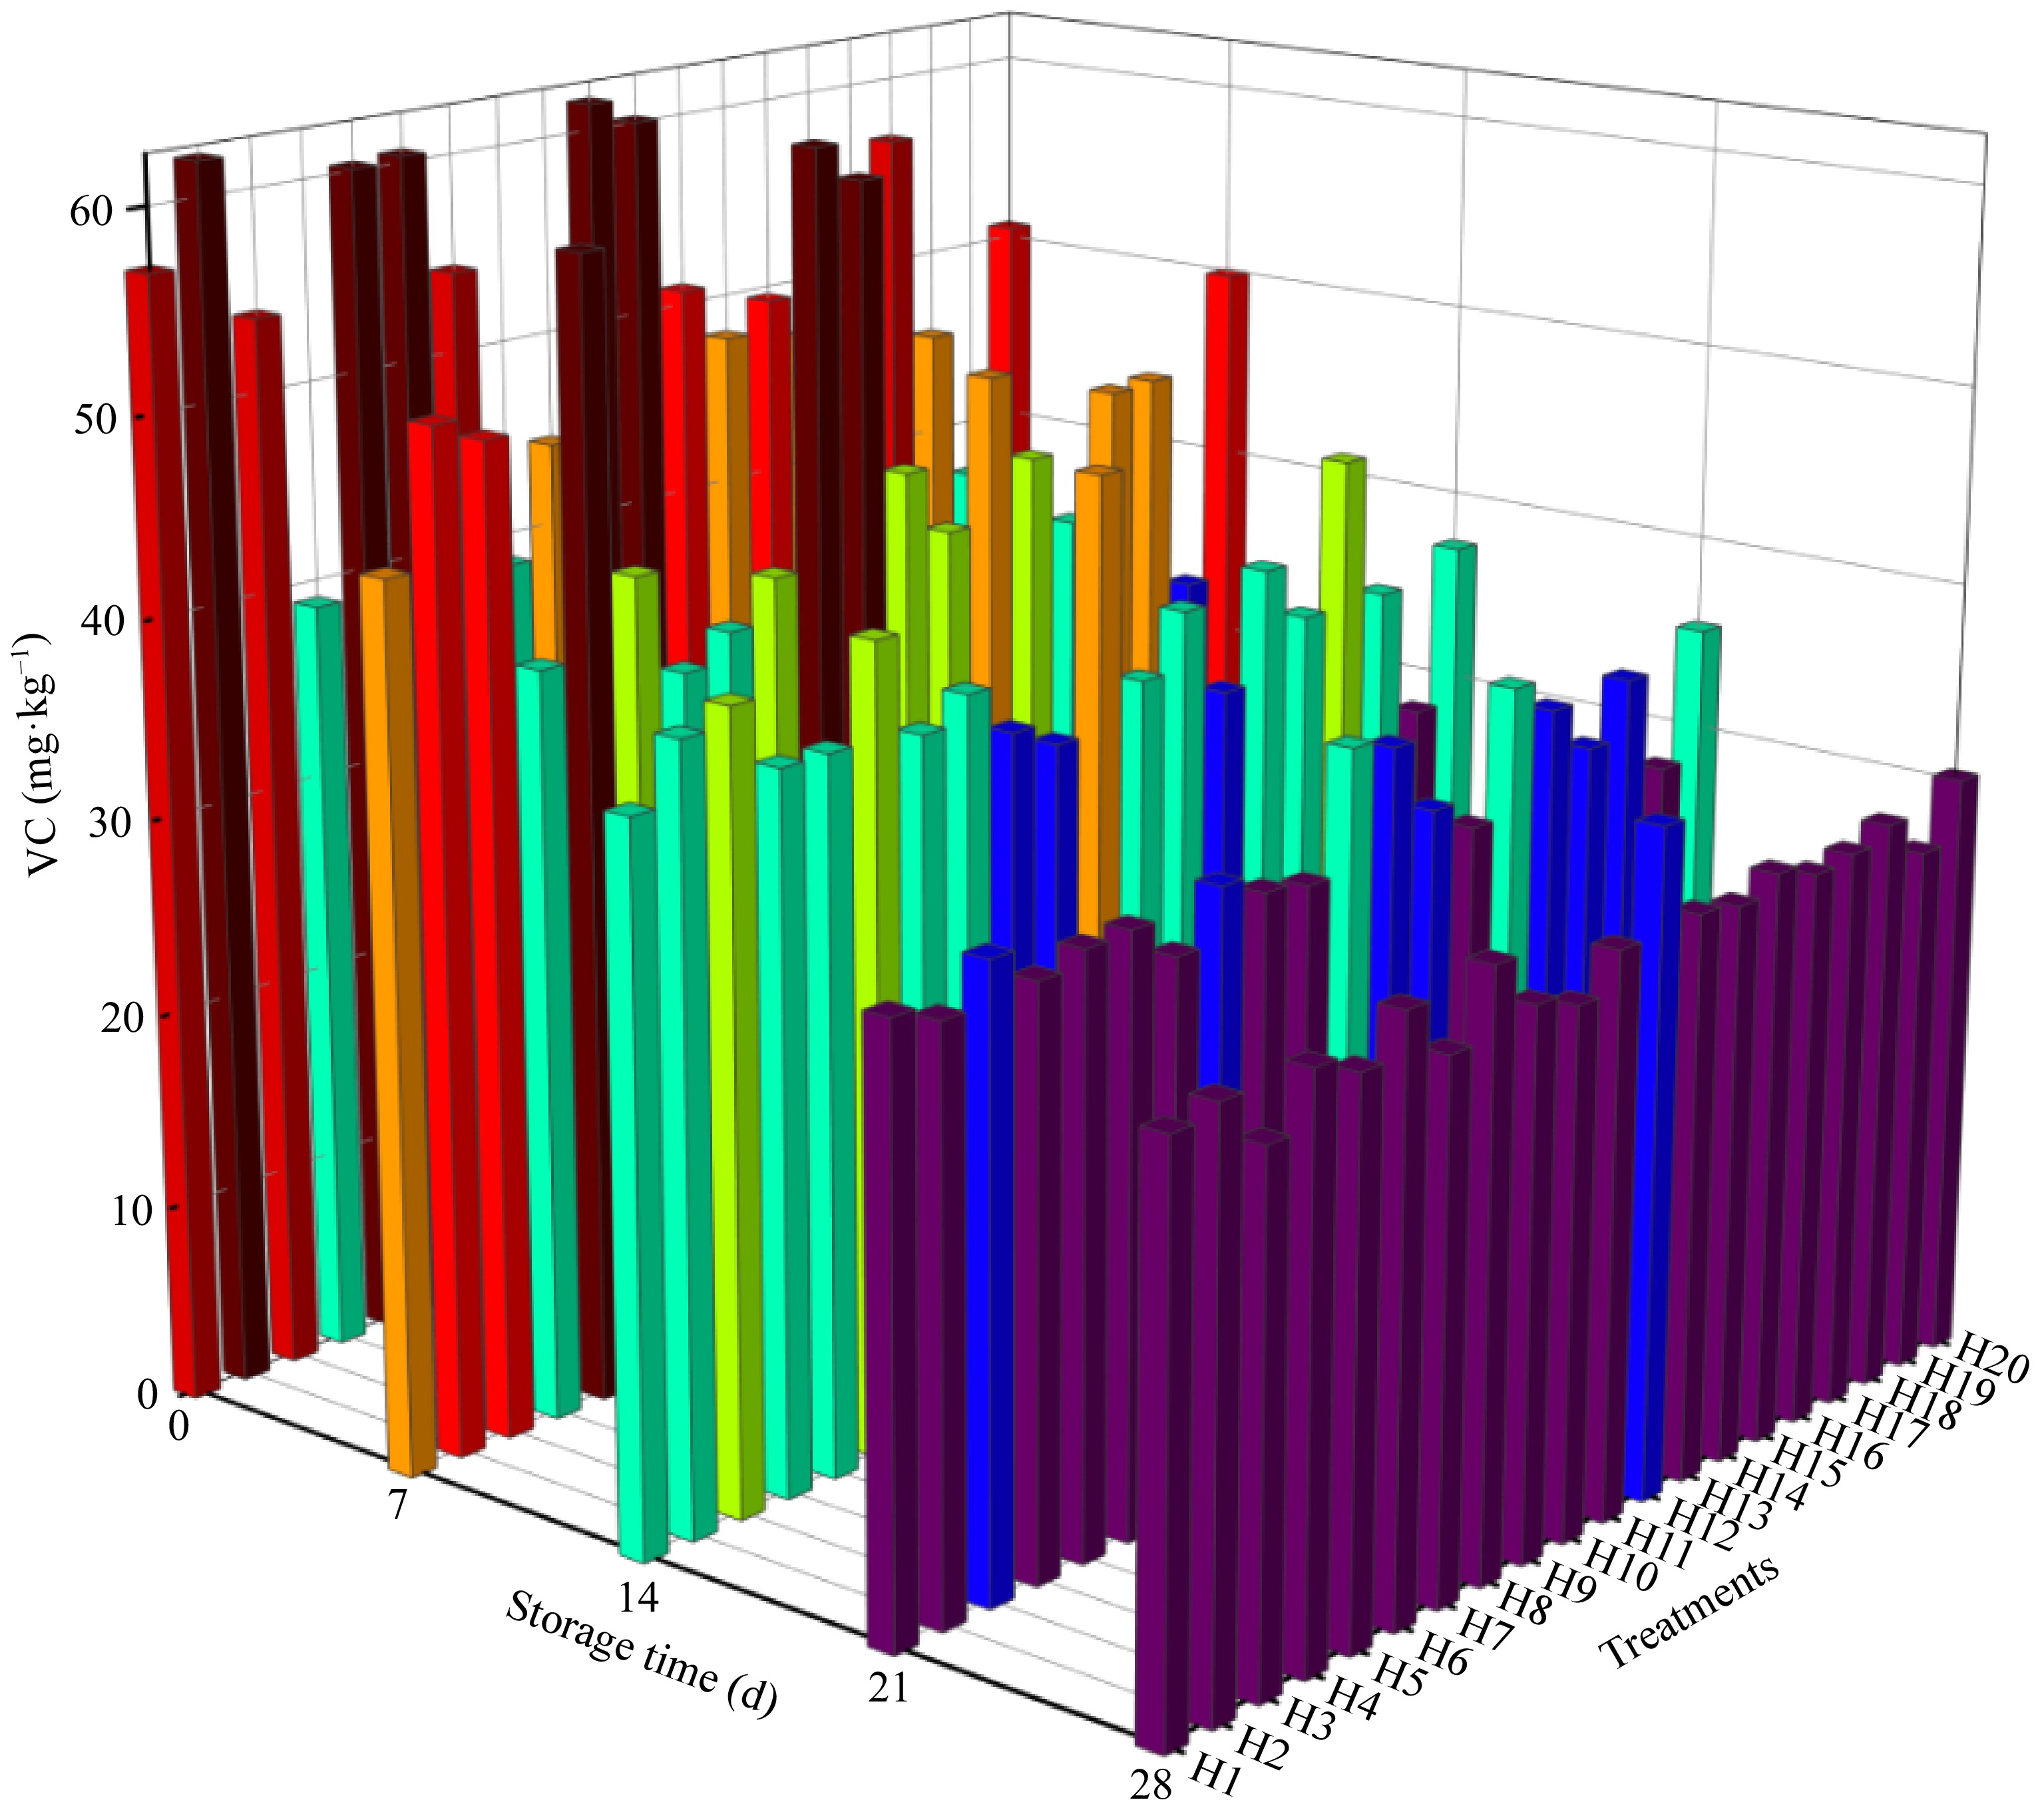
Figure 4.
Changes in vitamin C and storage time under different water and fertilizer ratios.
The experimental data of vitamin C were calculated using Eqns (3) and (4), and the rate constant k of the zero-order and first-order reactions of the kinetic model was obtained, the correlation coefficient R2 was also determined. By comparing the correlation coefficients of the two orders, it was shown that the vitamin C of sand-cultured tomatoes under different water and fertilizer ratios were more consistent with the first-order reaction. Comparing the first-order reaction of 20 groups of vitamin C, the results of the first-order reaction fitting degree H15 > H3 > H1 > H2 > H13 were obtained, and the fitting degree of H19 was the worst. It was verified that the changes in vitamin C levels under storage were consistent with the first-order reaction (Table 5).
Table 5. The zero-order and first-order reaction rate constants and correlation coefficients of vitamin C content in sand-cultured tomato under different water and fertilizer ratios.
Water and fertilizer treatment Zero-order reaction First-order reaction Regression equation Reaction rate constant Correlation coefficient Regression equation Reaction rate constant Correlation coefficient H1 X2 = 53.5885 − 1.0236X1 1.0236 0.9286 X2 = 529,115.8490/(1 + EXP(9.1620 + 0.027482X1)) 0.027482 0.9746 H2 X2 = 59.7146 − 1.2589X1 1.2589 0.9386 X2 = 45,397.7406/(1 + EXP(6.5941 + 0.031166X1)) 0.031166 0.9737 H3 X2 = 55.0959 − 1.0616X1 1.0616 0.9810 X2 = 72.8628/(1 + EXP(−1.1024 + 0.062426X1)) 0.062426 0.9855 H4 X2 = 40.1549 − 0.416704X1 0.416704 0.8833 X2 = 44.4078/(1 + EXP(−2.1000 + 0.056549X1)) 0.056549 0.9037 H5 X2 = 61.1113 − 1.3310X1 1.3310 0.8953 X2 = 135.6821/(1 + EXP(0.158561 + 0.047863X1)) 0.047863 0.9115 H6 X2 = 55.2497 − 1.0439X1 1.0439 0.8557 X2 = 60,188.3627/(1 + EXP(6.9555 + 0.027312X1)) 0.027312 0.9044 H7 X2 = 48.8088 − 0.898248X1 0.898248 0.8282 X2 = 474,666.5720/(1 + EXP(9.1442 + 0.026595X1)) 0.026595 0.8833 H8 X2 = 39.5776 − 0.337551X1 0.337551 0.8496 X2 = 42.2099/(1 + EXP(−2.4937 + 0.059221X1)) 0.059221 0.8781 H9 X2 = 41.9110 − 0.553822X1 0.553822 0.8916 X2 = 38,988.4215/(1 + EXP(6.8196 + 0.016680X1)) 0.016680 0.914 H10 X2 = 62.6289 − 1.4503X1 1.2419 0.9249 X2 = 134.6140/(1 + EXP(0.088131 + 0.053171X1)) 0.107880 0.9685 H11 X2 = 64.3055 − 1.2419X1 1.4503 0.8482 X2 = 66.1189/(1 + EXP(−2.6277 + 0.107880X1)) 0.053171 0.8689 H12 X2 = 48.1829 − 0.616155X1 0.616155 0.8447 X2 = 54,330.2959/(1 + EXP(7.0087 + 0.016392X1)) 0.016392 0.8868 H13 X2 = 46.5055 − 0.677012X1 0.677012 0.9548 X2 = 13,749.5348/(1 + EXP(5.6713 + 0.018571X1)) 0.018571 0.9656 H14 X2 = 49.5684 − 0.863020X1 0.863020 0.8889 X2 = 2,631.4967/(1 + EXP(3.9301 + 0.023881X1)) 0.023881 0.9076 H15 X2 = 47.1535 − 0.609021X1 0.609021 0.9857 X2 = 56.7154/(1 + EXP(−1.5218 + 0.051210X1)) 0.051210 0.9899 H16 X2 = 43.6986 − 0.533570X1 0.533570 0.9664 X2 = 2,786.0899/(1 + EXP(4.1306 + 0.014971X1)) 0.014971 0.9682 H17 X2 = 54.9882 − 1.0007X1 1.0007 0.9436 X2 = 630.6366/(1 + EXP(2.3259 + 0.026455X1)) 0.026455 0.9515 H18 X2 = 46.6184 − 0.619063X1 0.619063 0.9323 X2 = 64.3036/(1 + EXP(−0.950981 + 0.040834X1)) 0.040834 0.9348 H19 X2 = 34.2568 − 0.290852X1 0.290852 0.6709 X2 = 13,499.4987/(1 + EXP(5.9649 + 0.010089X1)) 0.010089 0.7002 H20 X2 = 51.6928 − 0.791803X1 0.791803 0.9180 X2 = 92.1464/(1 + EXP(−0.252515 + 0.035599X1)) 0.035599 0.9206 X1 in the table is the number of days of tomato storage; X2 is the predicted value of tomato vitamin C. The correlation of each index under different water and fertilizer treatment
-
As shown in Fig. 5, hardness was significantly correlated with soluble sugar (R2 = 0.71, p < 0.01). The hardness was significantly correlated with lycopene content (R2 = 0.61, p < 0.01). Hardness was significantly correlated with vitamin C (R2 = 0.70, p < 0.01). Soluble sugar was significantly correlated with lycopene level (R2 = 0.47, p < 0.01). Soluble sugar was significantly correlated with vitamin C (R2 = 0.67, p < 0.01). A specific correlation existed between different indices.
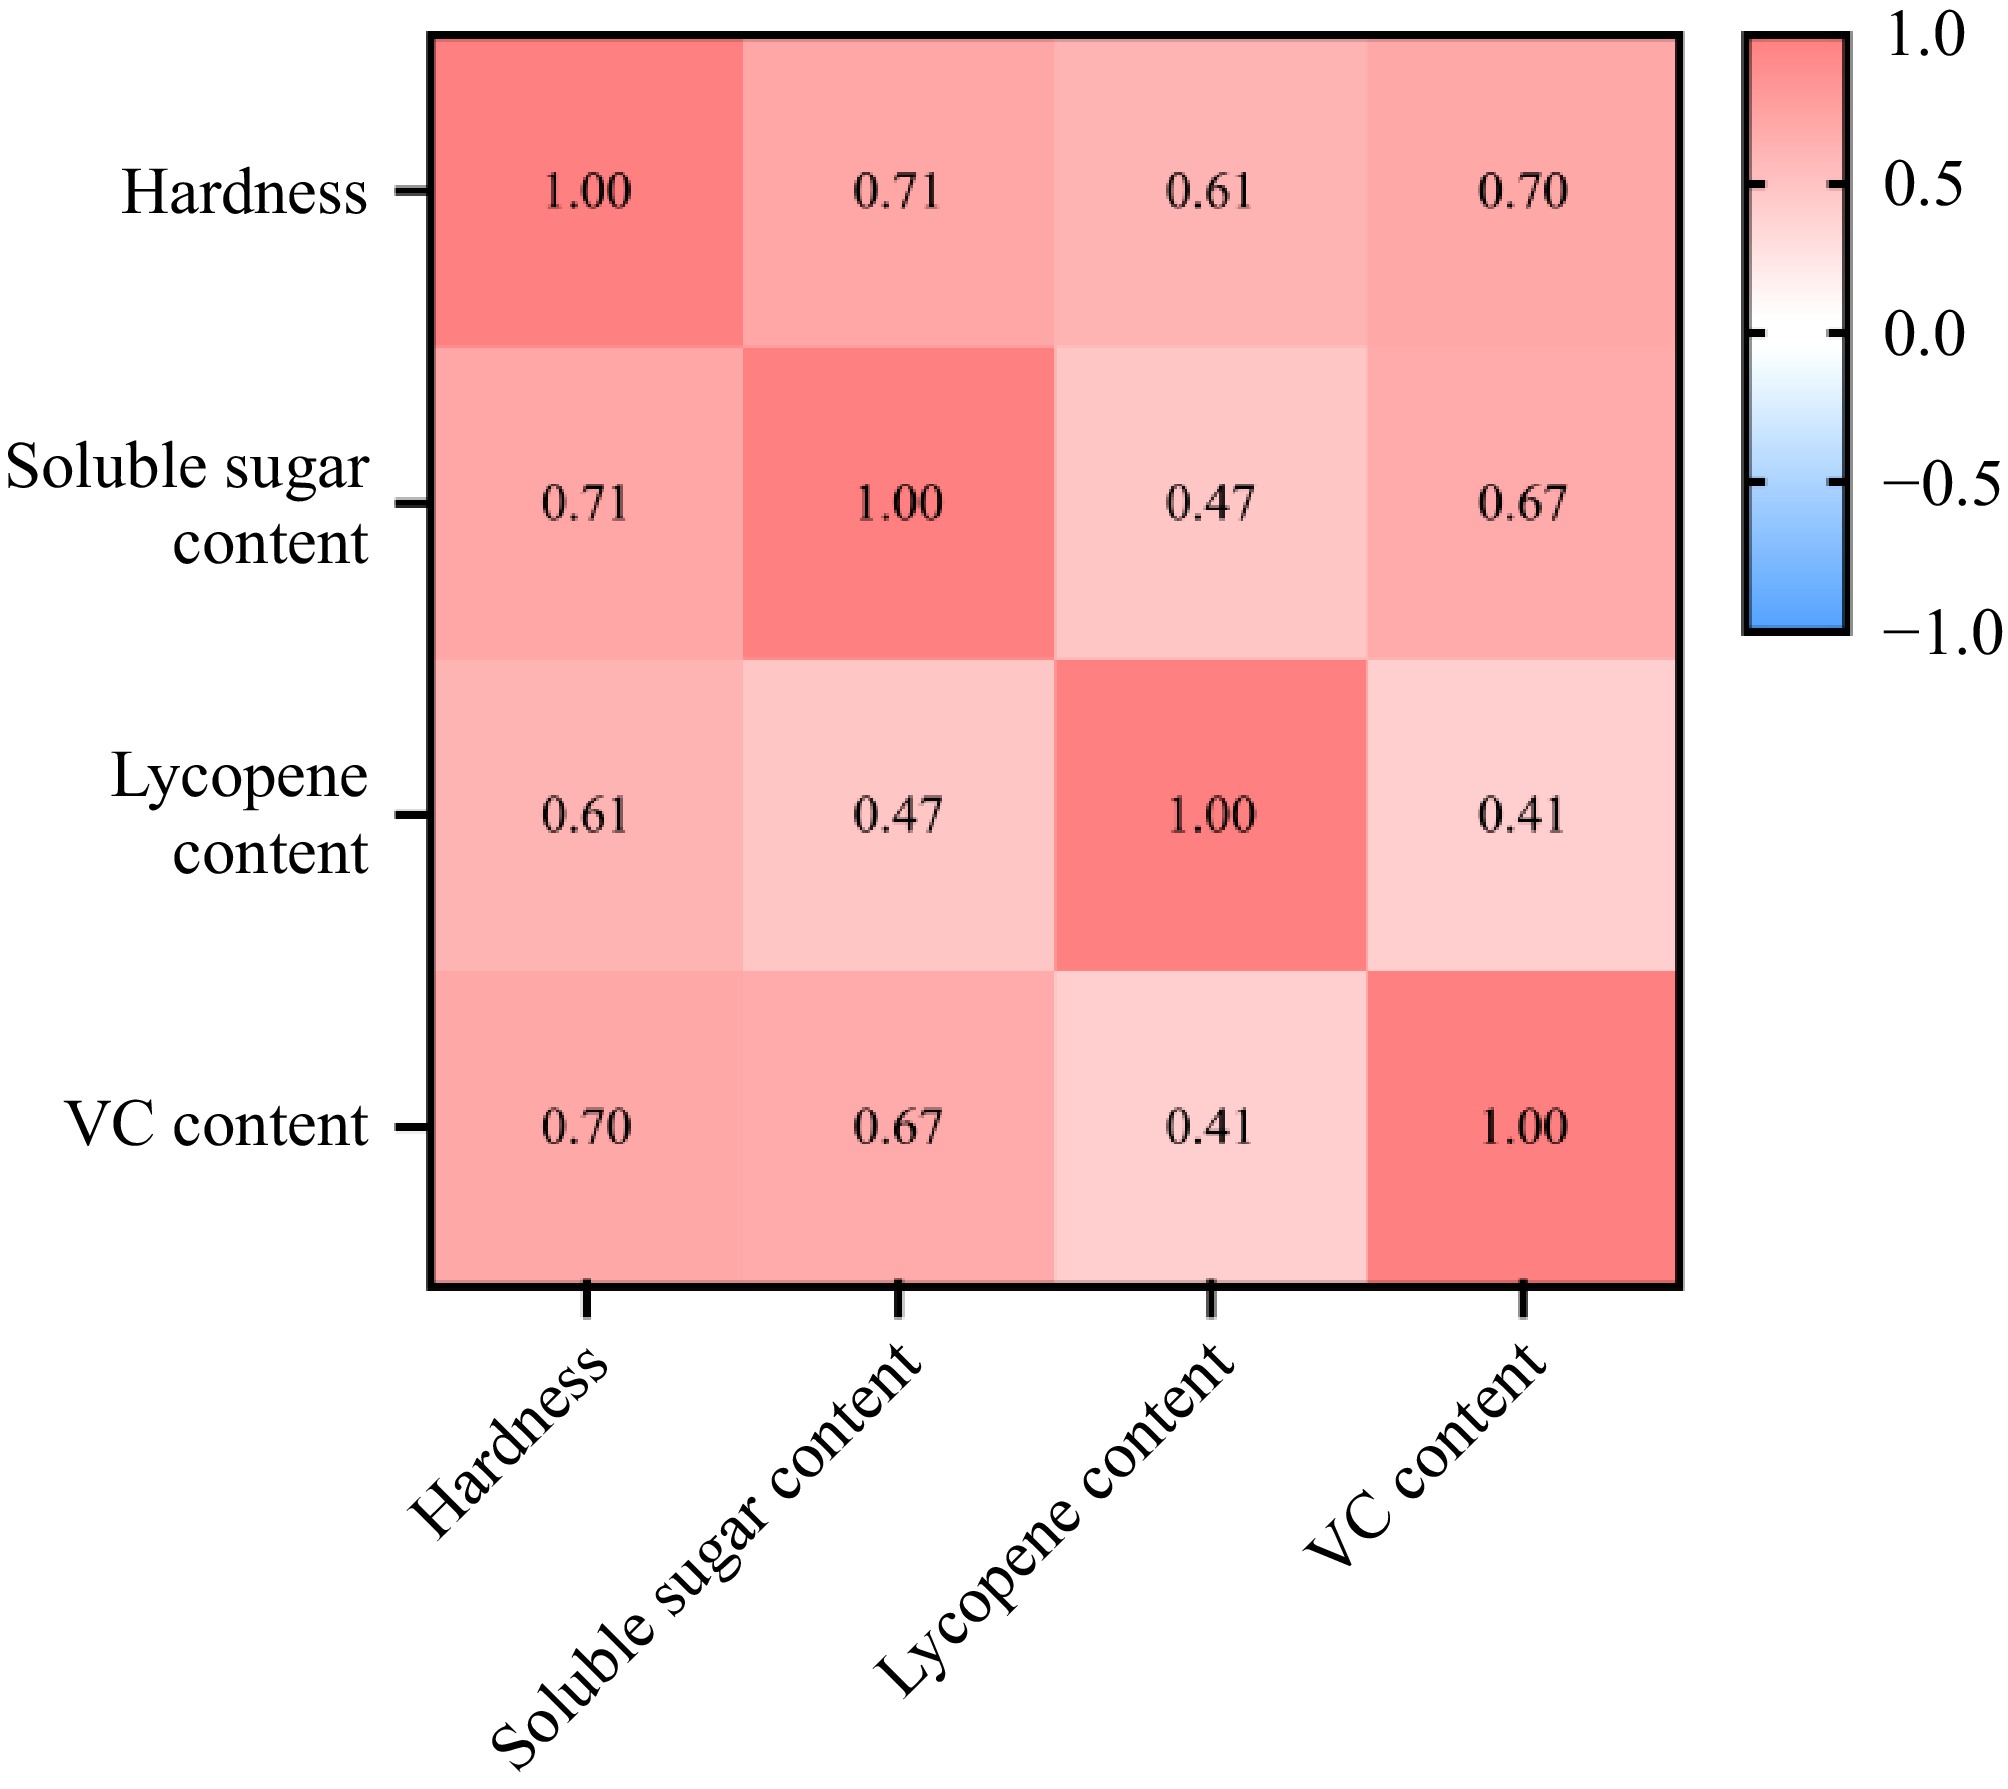
Figure 5.
Correlation of quality indices under different water and fertilizer ratios.
Comprehensive evaluation of tomato storage quality under different water and fertilizer treatments
-
To evaluate the quality of tomato fruit under storage, multiple indicators should be analyzed together for a comprehensive analysis of TQI. The quality indices of tomato fruit under storage were positively correlated with TQI (Fig. 6a), and the quality indices of tomato fruit were effectively determined. The TQI of fruits with the same maturity and different storage time under different water and fertilizer treatments was analyzed (Fig. 6b). The TQI of H17 was the highest on day zero of storage, with a value of 2.89, followed by H13, with a value of 2.87; H10 had the highest TQI value of 2.64 after 7 d of storage, followed by H13 with a value of 2.4. The TQI of H17 stored for 14 d was the highest at 3.24, followed by H13 at 3.13. When H18 was stored for 21 d, the TQI was the highest, which was 2.65, followed by H20, which was 2.64. The TQI of H8 was the highest after 28 d of storage, with a value of 3.16, followed by H12, with a value of 3.08. The TQI values of H13 maturing at the same time under different storage periods were higher than 2.0, and the total TQI value under this water and fertilizer treatment was the highest, which was 12.58.
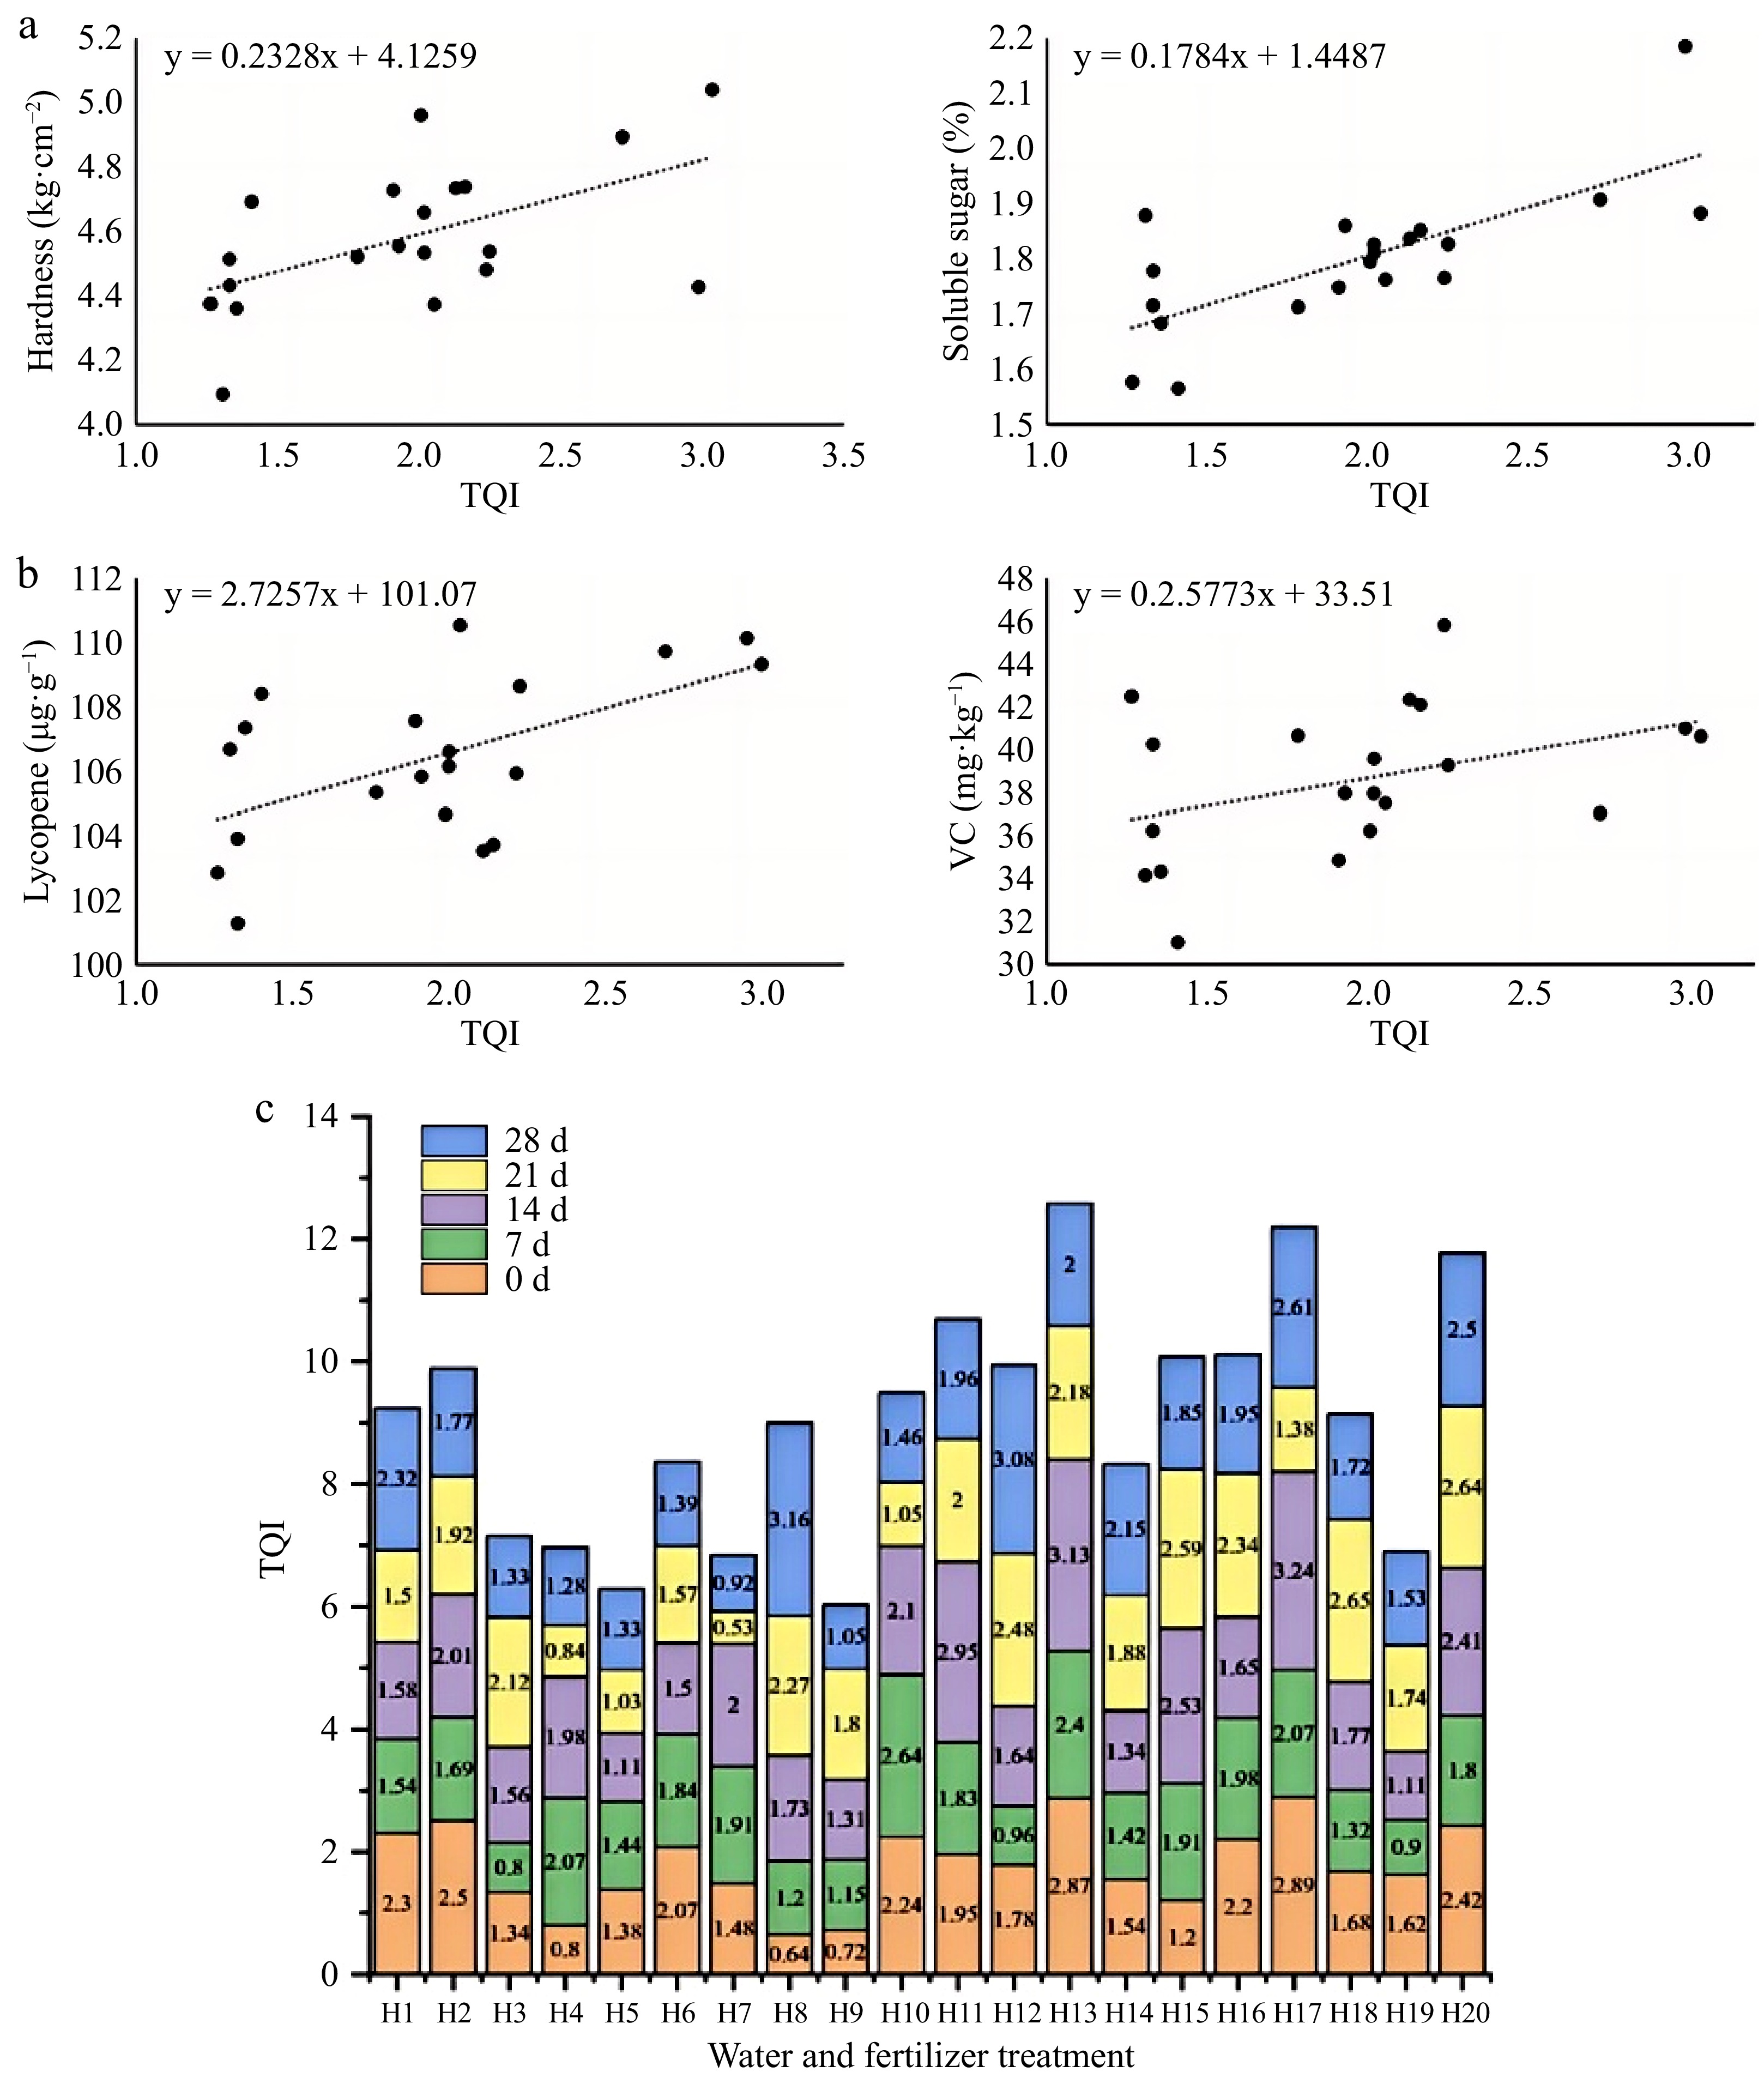
Figure 6.
Correlation between tomato fruit quality index and TQI and comparison of TQI of tomato fruits stored under different water and fertilizer treatments.
-
Water and fertilizer coupling plays an important role in fruit quality and storability, and it is also an important factor contributing to the sustainable development of vegetable facilities in southern Xinjiang. Li et al.[18] reported that the effects of fertilization and irrigation on tomato quality indicators reached a highly significant level, and the role of irrigation was greater than that of fertilizer. The water-to-fertilizer ratios in this study also had similar effects. Wang et al.[19] showed that excessive irrigation water reduced the quality of tomato fruit. This study established a reasonable ratio of water to fertilizer to increase the quality of tomatoes. Excessive or restricted water supply and fertilizer application may reduce the quality content. Hao et al.[20] found that the combination of yellow sand substrate together with water and fertilizer can accurately control the supply of water and fertilizer and improve the efficiency of crop water and fertilizer utilization. In this study, we also used yellow sand in southern Xinjiang as a cultivation matrix to obtain a better utilization rate of water and fertilizer, without affecting the fruit quality. Simultaneously, this study identified the optimal water-fertilizer formulation (H13) for facility tomato production under yellow sand composite substrate cultivation, specifically defined as an irrigation volume of 602 mm·hm−2 combined with nutrient inputs of N570 kg·hm−2, P70 kg·hm−2, and K738 kg·hm−2. The formulation demonstrates compatibility with drip irrigation systems for precision regulation and aligns with the intelligent fertilization model proposed by Zhang et al.[21]. This integrated approach exhibits substantial potential for large-scale implementation, facilitating intelligent, precise, and personalized farm management and fertilization decision-making in facility agriculture.
Effects of water and fertilizer coupling on tomato storage hardness
-
Fruit firmness is an important index of fruit texture, reflecting fruit storability and storage effect[22]. The hardness of tomato decreases with the increase in nitrogen, phosphorus, and potassium fertilizer content. Application of large amounts of fertilizer increases the tomato fruit size and decreases its hardness, as shown by De Ketelaere et al.[23]. Brummell[24] reported that the hardness of tomato will decrease with the extension of storage time. The results of this study were consistent, because some of the lyases in tomato fruit lysed with the prolongation of storage time, resulting in a decrease in hardness.
Effects of water and fertilizer coupling on tomato storage soluble sugar
-
Soluble sugar determines the quality of tomatoes basically and is a key factor in determining fruit storage quality and consumer recognition[25]. In the presence of moderate levels of other factors, the effect of irrigation on the soluble sugar content of tomatoes under storage was not significant, while Shang et al.[26] showed that appropriate water stress facilitated the accumulation of soluble sugars as storage reduces the activity of enzymes. Under the experimental conditions reported here, in the presence of other factors in the medium, an appropriate amount of nitrogen fertilizer increased the content of soluble sugar in stored tomatoes, which is consistent with the study of Huang et al.[27]. Wei et al.[28] reported that the soluble sugar content initially increased and then decreased with the increase in phosphorus application due to complex phosphorus metabolism in the soil, which affected the distribution of nutrients. This study shows that the application of phosphate fertilizer can promote the synthesis of soluble sugar content, which is consistent with the results of Anyega et al.[29].
Effects of water and fertilizer coupling on lycopene content of tomato under storage
-
Lycopene is the main pigment of mature tomato[30]. It is a strong naturally occurring antioxidant. It is an oxygen-free carotenoid which not only has a very high health care value but also is one of the important indicators of quality changes during storage. This study found that the lycopene content initially increased and then decreased during storage. This is consistent with the study of Javanmardi[31]. The content of lycopene increased to a stable level before 14 d of storage. Increased irrigation as well as application of nitrogen, phosphorus, and potassium did not increase the content of lycopene. Combined treatment with water and fertilizer in an appropriate ratio determines the amount of water during storage. The lycopene content was affected the most, and was consistent with the results reported by Luo & Li[32]. Kula-Maximenko et al.[33] reported that light and temperature had a major effect on lycopene content, which increased with increased red and yellow light irradiation time. Therefore, varying temperatures during storage and exposure to light during growth are closely related to lycopene content, suggesting the need for further investigation.
Effects of water and fertilizer coupling on vitamin C content of tomatoes under storage
-
Fruits and vegetables are important sources of vitamin C, which is also an important indicator of tomato product quality[34]. This experiment showed a positive correlation between vitamin C content and irrigation amount during storage, which was consistent with the study by Zushi & Matsuzoe[35]. This study showed that with the increased application of nitrogen, phosphorus, and potassium, vitamin C showed an inverted parabolic change similar to the results of previous studies[36]. The study also found that the vitamin C content decreased rapidly during the storage period, and decreased sharply from day 7 to day 14, which was consistent with the study of Veringa et al.[37].
Effects of water and fertilizer coupling on comprehensive quality of tomato storage index
-
By integrating indicators related to tomato quality such as hardness, soluble sugar, lycopene, and VC, TQI can be used to comprehensively evaluate the quality of tomato fruit after storage under different water and fertilizer treatments. In this experiment, H13-treated tomatoes showed better comprehensive quality during extended storage.
-
By integrating indicators related to tomato quality such as hardness, soluble sugar, lycopene, and VC, TQI can comprehensively evaluate the quality preservation of tomato fruits after storage under different water and fertilizer treatments. In this experiment, to better preserve the fruit quality during storage, and conduct a comprehensive analysis and comparison, it was concluded that the irrigation amount of 602 mm·hm−2 + nitrogen application rate of 570 kg·hm−2 + phosphorus application rate of 70 kg·hm−2 + potassium application rate of 738 kg·hm−2 treatment of tomato in the extension of storage process at the same time to obtain the best comprehensive quality.
This research was financially supported by the XPCC Financial Science and Technology Plan Project (2023AB071), the Tianshan Talent Training Program (2023TSYCCY0002), the key core agricultural technology research and development projects of the XPCC (NYHXGG2023AA311), and the First Division Alra City Financial Science and Technology Plan Project (2024NY04).
-
The authors confirm their contribution to the paper as follows: study conception and design: Tan Z, Yang Y, Ma X; data collection: Yang Y, Liang S, Wang Y, Song Y; analysis and interpretation of results: Yang Y, Cheng Y, Yang L; draft manuscript preparation: Yang Y, He T. All authors reviewed the results and approved the final version of the manuscript.
-
The datasets generated during and/or analyzed during the current study are available from the corresponding author on reasonable request.
-
The authors declare that they have no conflict of interest.
- Copyright: © 2025 by the author(s). Published by Maximum Academic Press, Fayetteville, GA. This article is an open access article distributed under Creative Commons Attribution License (CC BY 4.0), visit https://creativecommons.org/licenses/by/4.0/.
-
About this article
Cite this article
Yang Y, Tan Z, Cheng Y, Yang L, He T, et al. 2025. Study on the kinetics of tomato storage quality under water and fertilizer coupling. Technology in Horticulture 5: e025 doi: 10.48130/tihort-0025-0020 

Study on the kinetics of tomato storage quality under water and fertilizer coupling
- Received: 01 January 2025
- Revised: 21 March 2025
- Accepted: 16 April 2025
- Published online: 02 July 2025
Abstract: To improve the storage quality of tomatoes, an optimized water and fertilizer management scheme was developed by exploring the dynamic effects of water-fertilizer coupling on tomato quality during storage. A dynamic model of tomato fruit quality stored under 4 °C was established, with nitrogen, phosphorus, and potassium application rates as experimental factors. A half-four-element quadratic rotary composite design (20 treatments) was adopted. Tomatoes were stored at 4 °C for 28 d, and quality indicators (hardness, soluble sugar, lycopene, and vitamin C) were analyzed using Pearson correlation and comprehensive evaluation methods. A response model linking the comprehensive quality score to fertilizer levels was constructed. Results demonstrated that appropriate water-fertilizer ratios enhanced tomato quality, while excessive or insufficient parameters reduced it. Changes in quality indicators during storage followed first-order kinetic equations. Optimized parameters through tomato quality index (TQI) analysis included irrigation at 602 mm·hm−2, nitrogen at 570 kg·hm−2, phosphorus at 70 kg·hm−2, and potassium at 738 kg·hm−2, which effectively improved storage quality with satisfactory model fit and storability.
-
Key words:
- Tomatoes /
- Water-fertilizer coupling kinetics /
- Storage quality /
- Dynamic equation