


-
Tomato, a widely cultivated agricultural crop[1], is one of the most common vegetables grown around the world[2]. With the development of agricultural planting techniques, the scale of hydroponic tomato cultivation has progressively expanded[3]. Compared with traditional soil-based cultivation, hydroponic technology overcomes geographical and climatic constraints through a soilless cultivation system[4]. It is particularly suited for urban agriculture and space-restricted environments[5], with year-round production[6]. Meanwhile, hydroponic technology also demonstrates advantages in water conservation[7,8] and effective avoidance of pests and diseases[9]. However, there are still some challenges in the application of hydroponics, such as high costs[10] and insufficient management of the nutrient solution[11]. In hydroponic systems, tomato seedlings' growth exhibits high sensitivity to the environmental conditions, with the nutrient solution being a critical regulatory factor[12−14]. The nutrient solution's concentration affects the growth of hydroponic tomato seedlings, and differential adaptive responses to varying concentrations lead to divergent final growth performance[15−18]. However, the adaptive performance of tomato seedlings across nutrient solution concentration gradients has not yet been sufficiently investigated. Therefore, it is of great significance to study the adaptability changes of tomato seedlings to varying solution concentrations for optimizing hydroponic cultivation techniques.
Chlorophyll fluorescence technology can provide critical insights for investigating the adaptability of plant growth in hydroponic environments by analyzing the photosynthetic characteristics of tomato seedlings under varying nutrient solution concentrations[19]. This technique evaluates the photochemical efficiency of Photosystem II (PSII) through light-dependent fluorescence signal measurements, particularly using chlorophyll fluorescence induction curves, thereby revealing the functional status of photosynthetic systems[20,21]. The changes in the photosynthetic efficiency of plants can be revealed by the alterations in chlorophyll fluorescence parameters[22,23] like Fv/Fm (maximum photochemical efficiency of PSII), Y(II) (effective photosynthetic efficiency of PSII) and Fm (maximum fluorescence), which are able to reflect the functional state of PSII[24,25]. NPQt (nonphotochemical quenching transient index), Y(NPQ) (proportion of nonphotochemical quenching), and Y(NO) (nonregulatory energy dissipation)[26,27] show the light retention mechanism under high light through non-photochemical quenching, thereby regulating photosynthetic efficiency and preventing photodamage. The SPAD (soil plant analysis development) value reflects the chlorophyll content in the leaves, which is essential for evaluating the nutritional status of the plant[28]. The growth adaptability and photosynthetic mechanisms of tomato seedlings under different nutrient solution concentrations were thoroughly explored by analyzing their chlorophyll fluorescence parameters.
Intelligent algorithms have been widely applied in modern agriculture[29−32], demonstrating unique advantages in analyzing patterns of continuous physiological variation within agricultural data systems[33−35]. Traditional methods acquire data through gradient experiments[36], yet discrete data points often fail to comprehensively reflect the parameters' continuity. Intelligent algorithms can construct continuous models in the discrete datasets that bridge data gaps across experimental conditions[37,38]. This discrete-to-continuous modeling paradigm enables scientists to transcend the limitations of conventional gradient-based approaches[39,40]. Therefore, these algorithms were employed to develop dynamic models through the integration of chlorophyll fluorescence parameters for systematically analyzing variations in photosynthetic efficiency in tomato seedlings under varying nutrient conditions.
In summary, the adaptive responses of hydroponic tomato seedlings to varying nutrient concentrations constitute a complex process involving the interactions between photosynthetic efficiency and photoprotective mechanisms. Thus, this study quantified chlorophyll fluorescence parameters and growth conditions to uncover the changes in adaptability in tomato seedlings. The genetic algorithm-support vector regression (GA-SVR) model was developed to dynamically track variations in Fv/Fm, providing mechanistic insights into photosynthetic adaptation processes.
-
The experiment was conducted at Anhui Agricultural University using tomato seedlings (Solanum lycopersicum cv. 'Xinyan') from Xinyan Floriculture. Seedlings were grown in a deep water culture (DWC) system using 4-liter cultivation pots (26.5 cm × 16.5 cm × 11 cm). The standard Japanese garden test nutrient solutions (Table 1) were added to the pots, with five seedlings evenly planted per container. The light intensity was maintained at 150 ± 2 μmol·m−2·s−1, and the light source spectrum is shown in Fig. 1. The environmental conditions for planting were as follows: The photoperiod was set at 14 hours of light and 10 hours of darkness, with an ambient temperature (25 ± 1 °C) and a relative humidity of 65% ± 5%. The entire experiment was repeated twice under identical conditions to ensure the reliability of the results.
Table 1. Composition of stock solutions for the Japanese garden test nutrient solution
Stock solution Chemical reagent Concentration in stock solution (g·L−1) Function A (100 × concentration) Ca(NO3)2·4H2O 94.5 Provides macronutrients
(N, Ca, K)KNO3 80.9 B (100 × concentration) KH2PO4 15.3 Provides macronutrients
(P, K, Mg, S)MgSO4·7H2O 49.3 C (1,000 × concentration) NaFe-EDTA 30 Provides microelements
(Fe, B, Mn, Zn, Cu, Mo)H3BO3 2.86 MnSO4·7H2O 2.13 CuSO4·5H2O 0.08 ZnSO4·7H2O 0.22 (NH4)6Mo7O24·4H2O 0.02 
Figure 1.
Full-spectrum light source under the light intensity level of 150 μmol·m−2·s−1.
Experimental design
-
To analyze the adaptability of tomato seedlings to varying nutrient concentrations, a 14-day time-sequenced nutrient concentration response experiment was designed. Six levels of nutrient solution concentrations were prepared with the same base formulation (Table 2) and administered to hydroponic tanks with the same specifications. Tomato seedlings with consistent growth were randomly assigned after root washing and transplanted into the prepared hydroponic tanks. The other environmental parameters of the experiment remained consistent.
Table 2. Different nutrient solution concentrations and their corresponding electrical conductivity (EC) values.
Treatment Nutrient solution dosage EC (mS·cm−1) T1 0 0.22 T2 1/4 0.90 T3 1/2 1.56 T4 3/4 2.16 T5 1 2.78 T6 3/2 3.82 Measurement of the indicators and methods
Chlorophyll fluorescence parameters
-
The third leaf from the growth point was sampled, and chlorophyll fluorescence was monitored at fixed intervals over 14 consecutive days. For each treatment concentration, two independent trials were conducted under identical conditions. The first trial comprised three experimental groups, and the second trial included two experimental groups. Each group consisted of five seedlings, and chlorophyll fluorescence parameters were measured individually for every seedling. Chlorophyll fluorescence parameters were quantified using the PhotosynQ MultispeQ V2 (PhotosynQ, Inc., East Lansing, MI, USA) portable device, and the following parameters were recorded.
The maximum photochemical efficiency of PSII, Fv/Fm, serves as a critical indicator in photosynthesis research. This parameter has been widely used to reflect plants' health status and responses to environmental stress[41]. Y(II), indicating the effective photosynthetic efficiency of PSII, provides insights into the photosynthetic state of crops[42]. Fm, maximum fluorescence, whose variations correlate with changes in photosynthetic efficiency, serves as an important marker for assessing plant physiological status[43]. Y(NPQ), denoting the quantum yield of nonphotochemical quenching, reflects dynamic changes in plant photoprotective capacity[44]. Y(NO), representing the quantum yield of nonregulated energy dissipation, quantifies the fraction of energy in PSII that is neither utilized for photochemistry nor actively regulated by the plant[27]. NPQt (nonphotochemical quenching), a parameter frequently applied for rapid estimation and imaging, quantitatively reflects nonphotochemical quenching within the antenna pigment-protein complexes associated with PSII[26]. SPAD values were recorded to evaluate the relative chlorophyll content[45].
Plant growth data, health index, and moisture content
-
Following two independent replicate experiments, nine plants were selected from each nutrient solution concentration group. Plant height was measured using a ruler, and stem diameter was measured with calipers. The leaves of each tomato plant were removed, laid flat (from bottom to top), and photographed with a white background and a black ruler for scale. The images were processed and analyzed for leaf area using Image J (National Institutes of Health, Bethesda, USA). An electronic balance was used to weigh the fresh biomass of the aboveground and underground parts. The samples were then placed in an oven at 105 °C for 15 minutes to kill the tissues, followed by drying at 75 °C until a constant weight was achieved, allowing the dry weight of both the aboveground parts and roots to be recorded. The health index of the tomato seedlings was calculated using the following formula:
Health Index = [(Stem diameter / Plant height) + (Root weight / Aboveground weight)] × Plant dry weight[46].
The moisture content of the tomato stems and leaves was calculated using the formula:
Moisture content = (Fresh weight of stems and leaves – Dry weight of stems and leaves) / Fresh weight of stems and leaves[47].
Data visualization and analysis methods
-
Pearson correlation coefficient calculations, data organization, and algorithm modeling were implemented using Python. Data visualization was conducted using Origin Pro 2022 (OriginLab Corporation, Northampton, MA, USA). Duncan's new multiple range test method, implemented through one-way analysis of variance (ANOVA), was used to analyze the significance with the significance level set at p < 0.05 using SPSS (SPSS, Inc., Chicago, IL, USA).
Modeling
Data normalization
-
Min-max normalization was applied. Time and Fv/Fm were normalized using a linear normalization function within the range [0, 1].
$ {x}_{i}=\dfrac{x-{x}_{min}}{{x}_{max}-{x}_{min}} $ (1) where, x is the selected raw data, and xmin and xmax are the minimum and maximum values in the selected raw data, respectively.
Support vector regression
-
Support vector regression (SVR) is a machine learning method based on the Vapnik–Chervonenkis (VC) dimension theory and the principle of structural risk minimization in statistical learning[48]. It has advantages when dealing with small sample sizes[49] and demonstrates strong generalization and robustness in data regression[50].
In the application of SVR, different penalty parameters affect the model's performance. The parameters C (a penalty parameter controlling the model's complexity and error tolerance) and g (gamma, an Radial Basis Function (RBF) kernel parameter defining the sample's influence radius) were optimized using a genetic algorithm (GA), a popular global optimization technique with excellent global search capabilities[51]. The ranges for C and g were set to [0.05, 30] and [0.0001, 10], respectively. The GA population size was 50, with 100 iterations, and the crossover and mutation rates were set to 0.85 and 0.1, respectively. SVR is suitable for smaller samples.
In the experiment, 252 sets of Fv/Fm data were obtained from six nutrient solution treatments in terms of electrical conductivity (EC) across 14 days of experimentation (Time), with the average values taken from three replicates. The nutrient solution treatments (EC) and experiment time (Time) were used as inputs, and Fv/Fm was used as the output for modeling. Additionally, 70% of the data were randomly selected as training samples for the model, while 30% were randomly selected as test samples.
The result of model training is shown in Eq. (2)
$ f\left(x\right)={\sum }_{i=1}^{n}\left({\overline{a}}_{i}^{*}-{\overline{a}}_{i}\right)K\left(x,{x}_{i}\right)+b $ (2) where, f(x) is the output of the model, x is the input, xi is the i training sample of the input,
$ {\overline{a}}_{i}^{*} $ $ {\overline{a}}_{i} $ -
The growth performance and biomass accumulation of tomato seedlings are shown in Figs 2 and 3. One-way ANOVA revealed that different nutrient solution treatments significantly affected root length, leaf area, fresh weight, dry weight, and health index (p < 0.05), whereas no significant effects were observed on plant height, stem diameter, number of leaves, water content, and root-shoot ratio (p > 0.05). For morphological parameters, among the significantly affected indices, root length in T1 was significantly longer than in T3, with no significant differences from T5 or T6 (Fig. 2d). Leaf area in T6 was significantly larger than in T1 but showed no significant differences from T4 or T5 (Fig. 2e). Among the nonsignificantly affected parameters, plant height and leaf number showed a numerical trend of T6 > T2 > other treatments (Fig. 2a, c). For stem diameter, T6 ranked first and T2 ranked third (Fig. 2b).
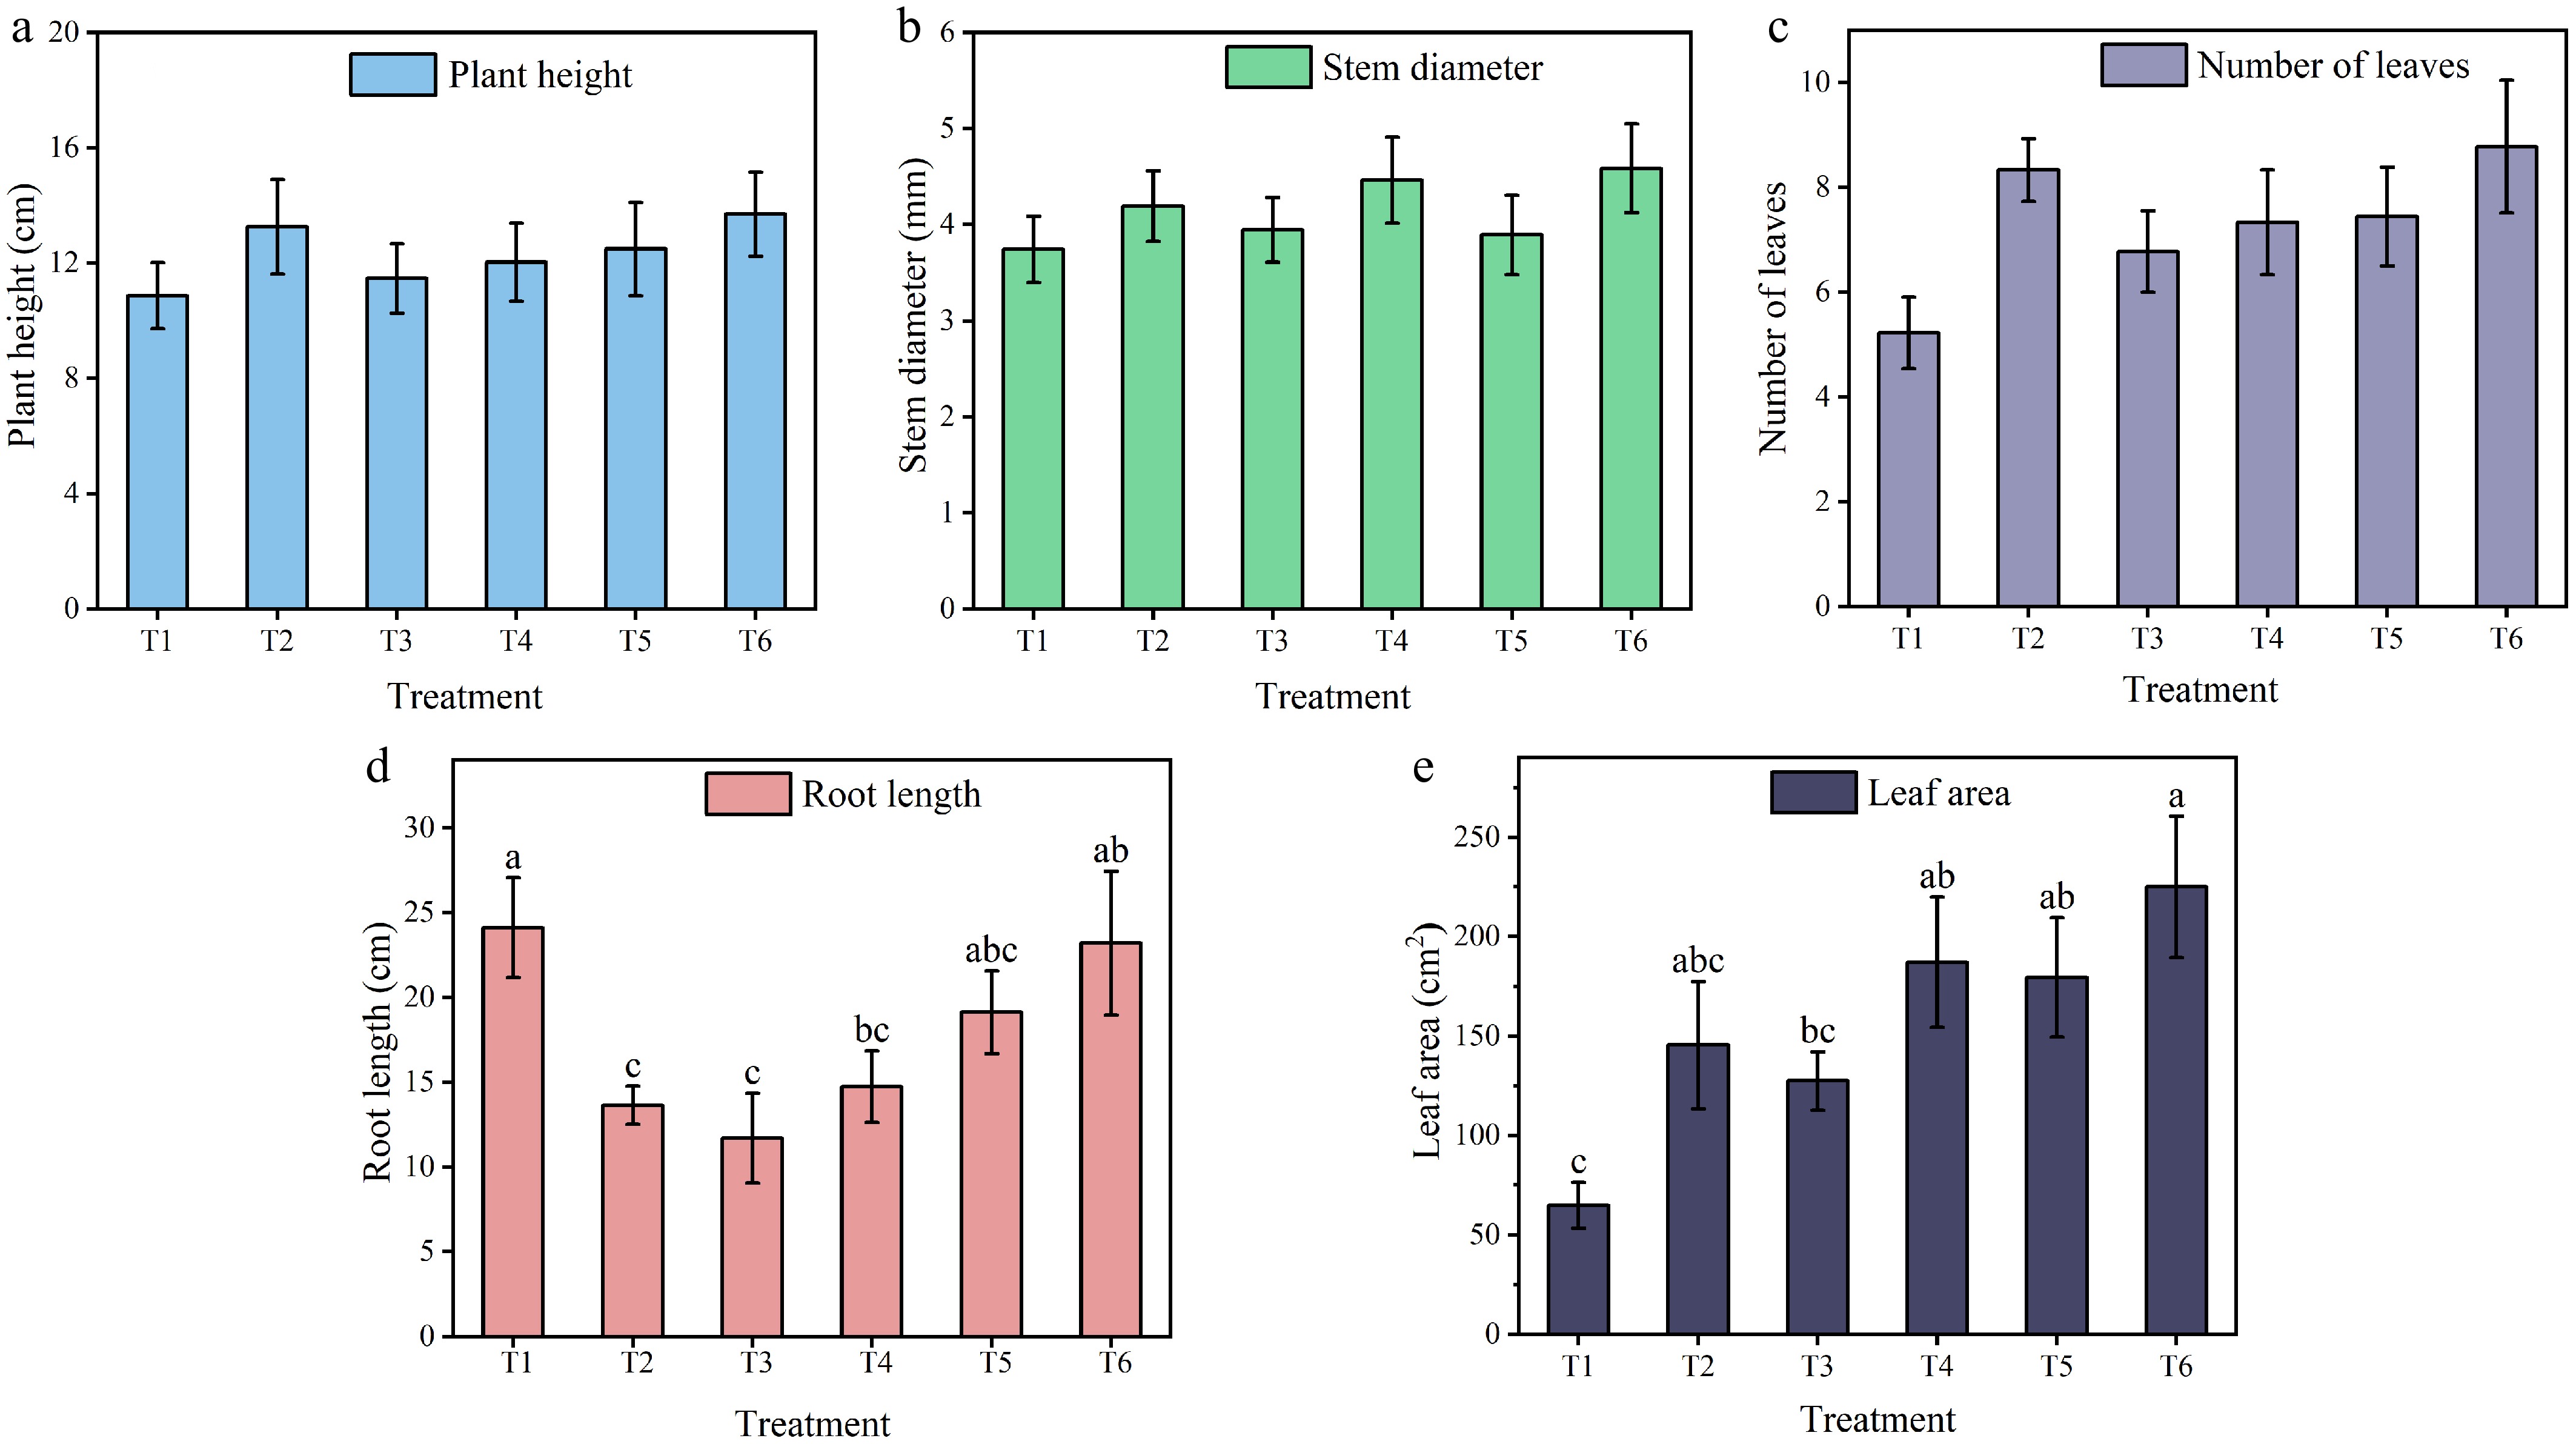
Figure 2.
(a) Plant height, (b) stem diameter, (c) number of leaves, (d) root length, and (e) leaf areaof tomato seedlings under different treatments. Different letters in the columna indicate significant differences at the p < 0.05 level (n = 9). The data are presented as the means ± standard error.
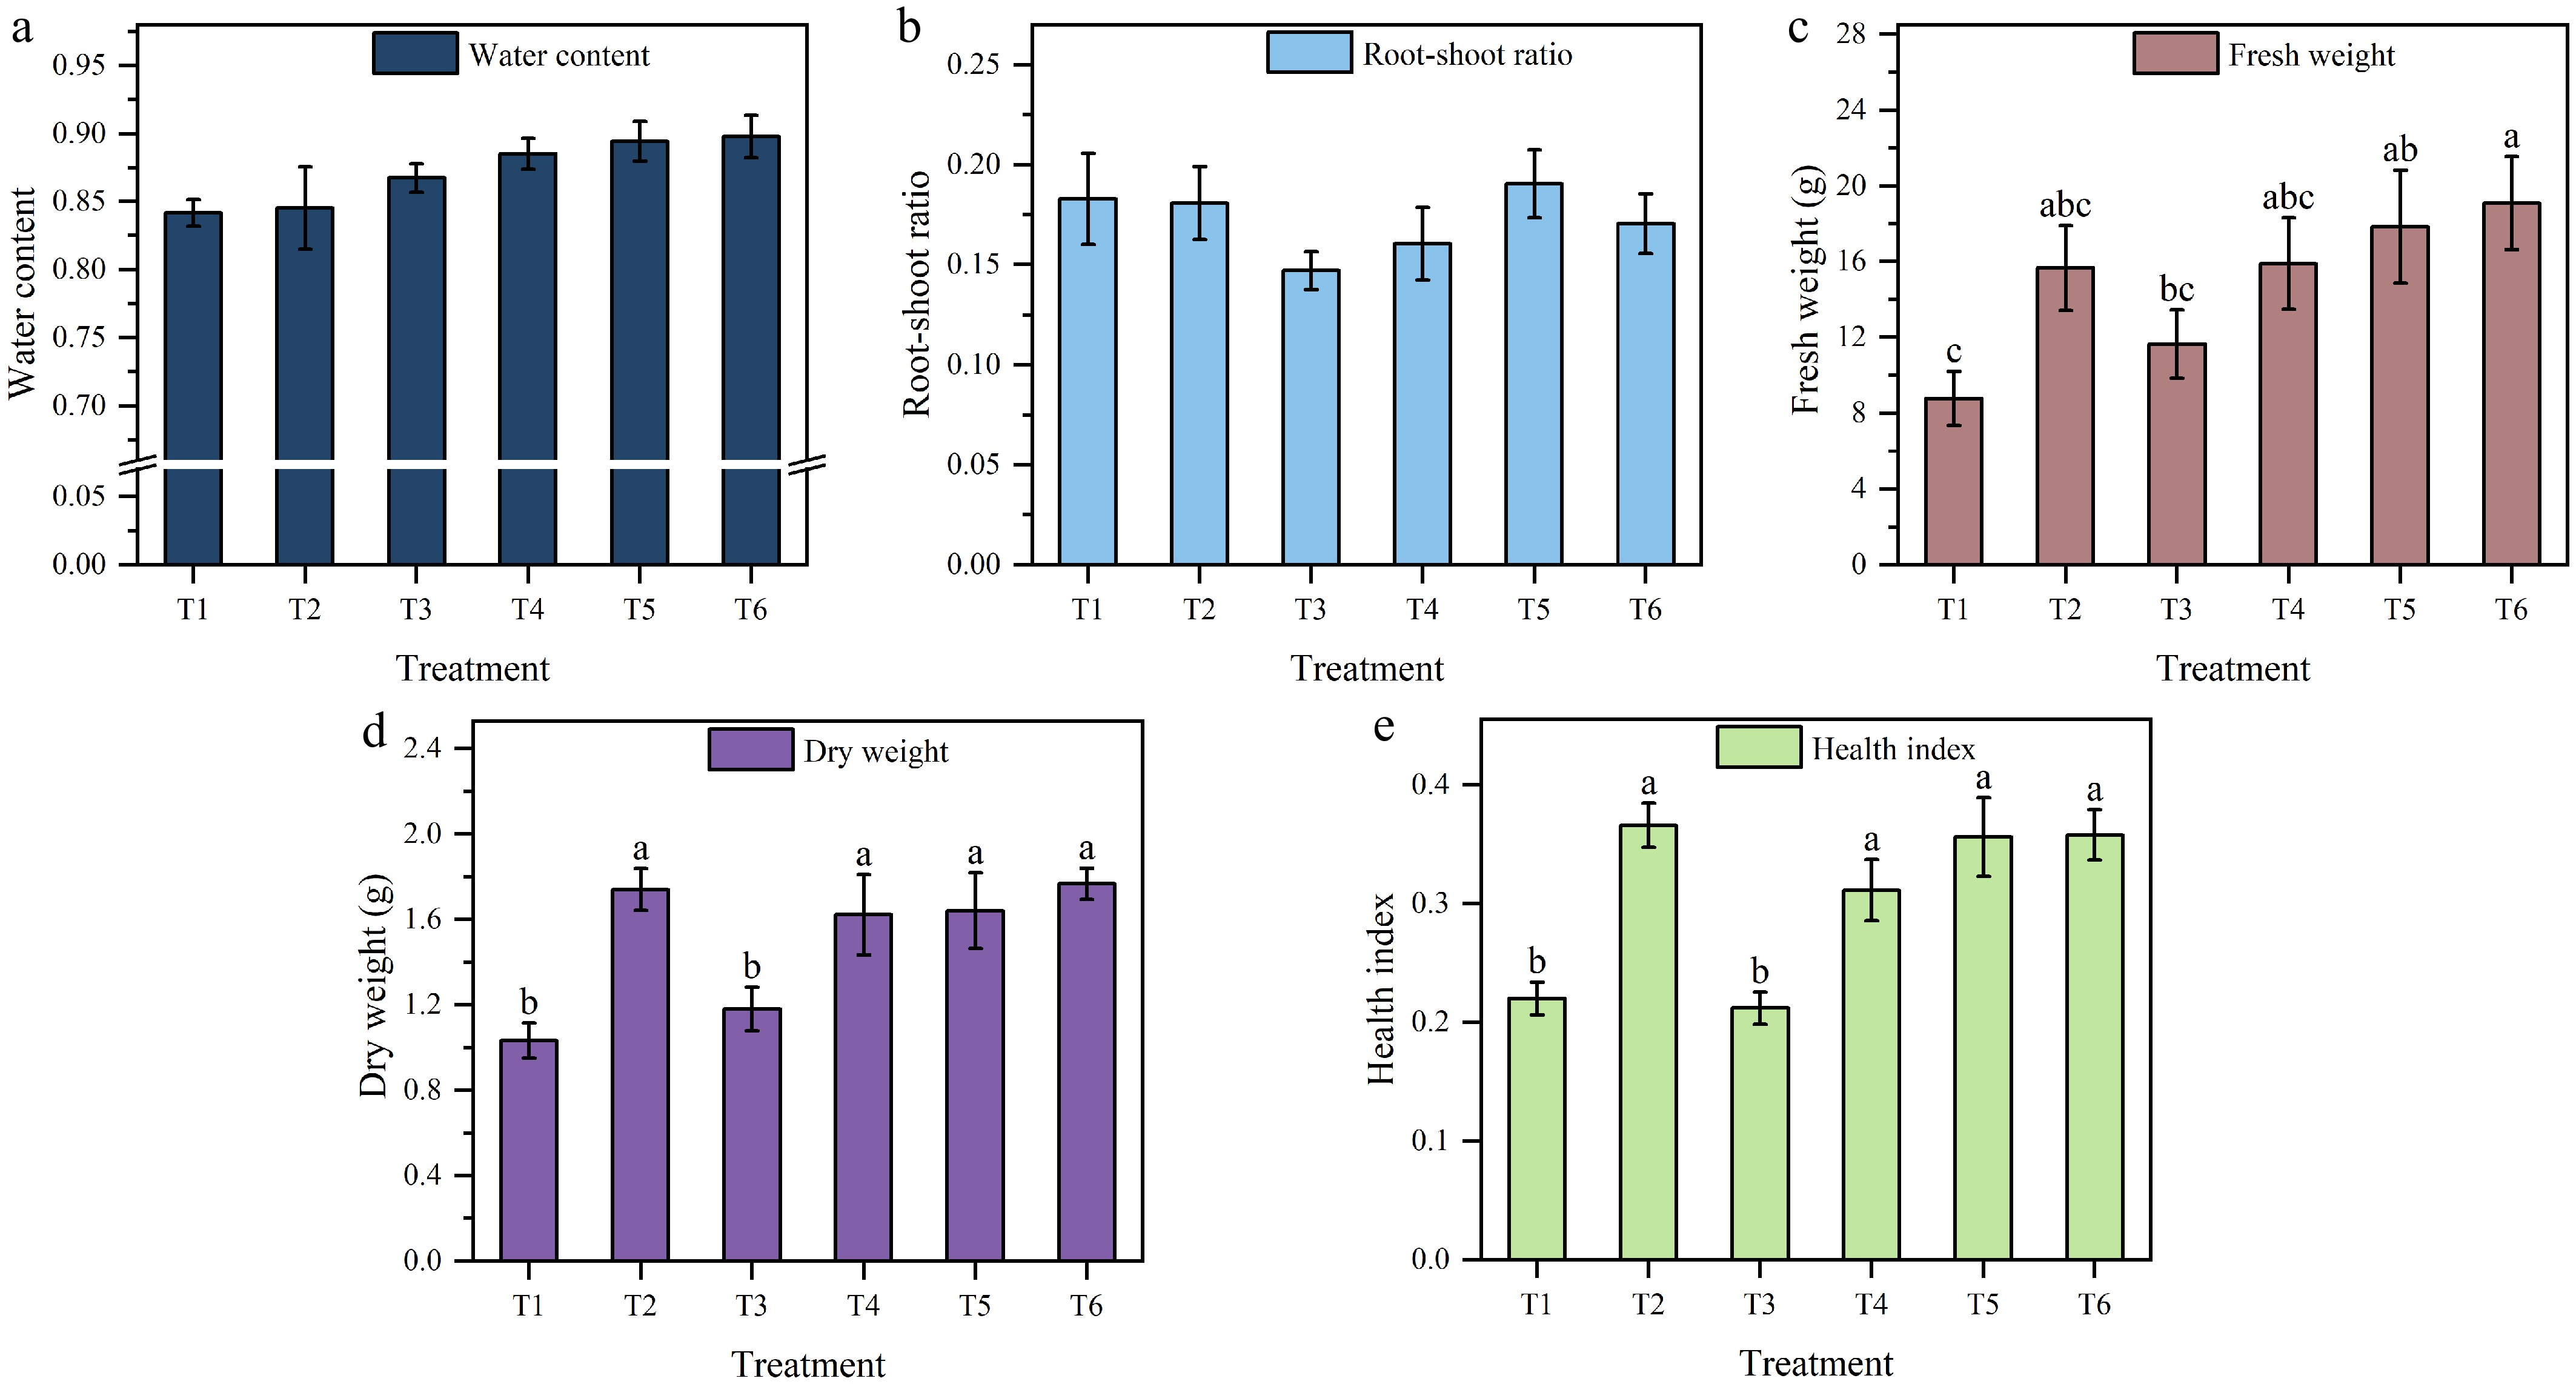
Figure 3.
Water content in the (a) stems and leaves, (b) root-shoot ratio, (c) fresh weight, (d) dry weight, and (e) health index of tomato seedlings under different treatments. Different letters in the vertical lines indicate significant differences at the p < 0.05 level (n = 9). The data are presented as the mean ± standard error.
For the physiological parameters, among the significantly affected parameters, fresh weight in T6 was significantly higher than in T1 and T3, and showed no significant difference from T2, T4, and T5 (Fig. 3c). Dry weight showed no significant difference among T6, T2, T4, and T5, but dry weight in this group was significantly higher than in T1 and T3 (Fig. 3d). The health index in T2 was significantly higher than in T1 and T3, and showed no significant difference from T4, T5, and T6 (Fig. 3e). Simultaneously, dry matter accumulation exhibited a strong positive correlation with the health index (correlation coefficient = 0.823). Among the nonsignificantly affected parameters stem and leaf water content gradually increased from T1 to T6 (Fig. 3a). Root-shoot ratio showed no consistent change pattern (Fig. 3b).
The results demonstrated that T2 achieved the highest health index while also maintaining favorable fresh and dry weights compared with higher nutrient concentrations (T4–T6). This indicated that the T2 nutrient concentration provided a relatively suitable growth environment for transplanted tomato seedlings. This closely aligns with Yang et al.'s study[52], which documented enhanced growth performance in cucumber seedlings under low-concentration nutrient solution treatments during the seedling stage. In contrast, T6 significantly promoted leaf growth. Meanwhile, both biomass accumulation and the growth indices showed excellent performance, though the health index was slightly lower than that of T2. This is consistent with previous studies, confirming that sufficient nutrients can promote the initial growth of crops[53,54]. T1 consistently showed the poorest performance across nearly all metrics, especially leaf development and biomass, but its root length was the longest among all treatments. This is consistent with the study by Jia et al.[55], which reported that crops prioritize root growth under nutrient deficiency to develop a more exploratory root system.
Analysis of changes in Fv/Fm, Y(II), and Fm
-
The recovery of photosynthetic efficiency in tomato seedlings varied under different treatments (Fig. 4). Trend fitting was applied to the data of the chlorophyll fluorescence parameters Fv/Fm, Y(II), and Fm. The results of trend fitting, including their determination coefficients (R2) and root mean square errors (RMSE), showed that the fitted curves effectively represent the trends of the scattered data (Supplementary Table S1). Additionally, treatments and time had significant effects on Fv/Fm, Y(II), and Fm, and the interaction between treatments and time had a significant effect on Fm.
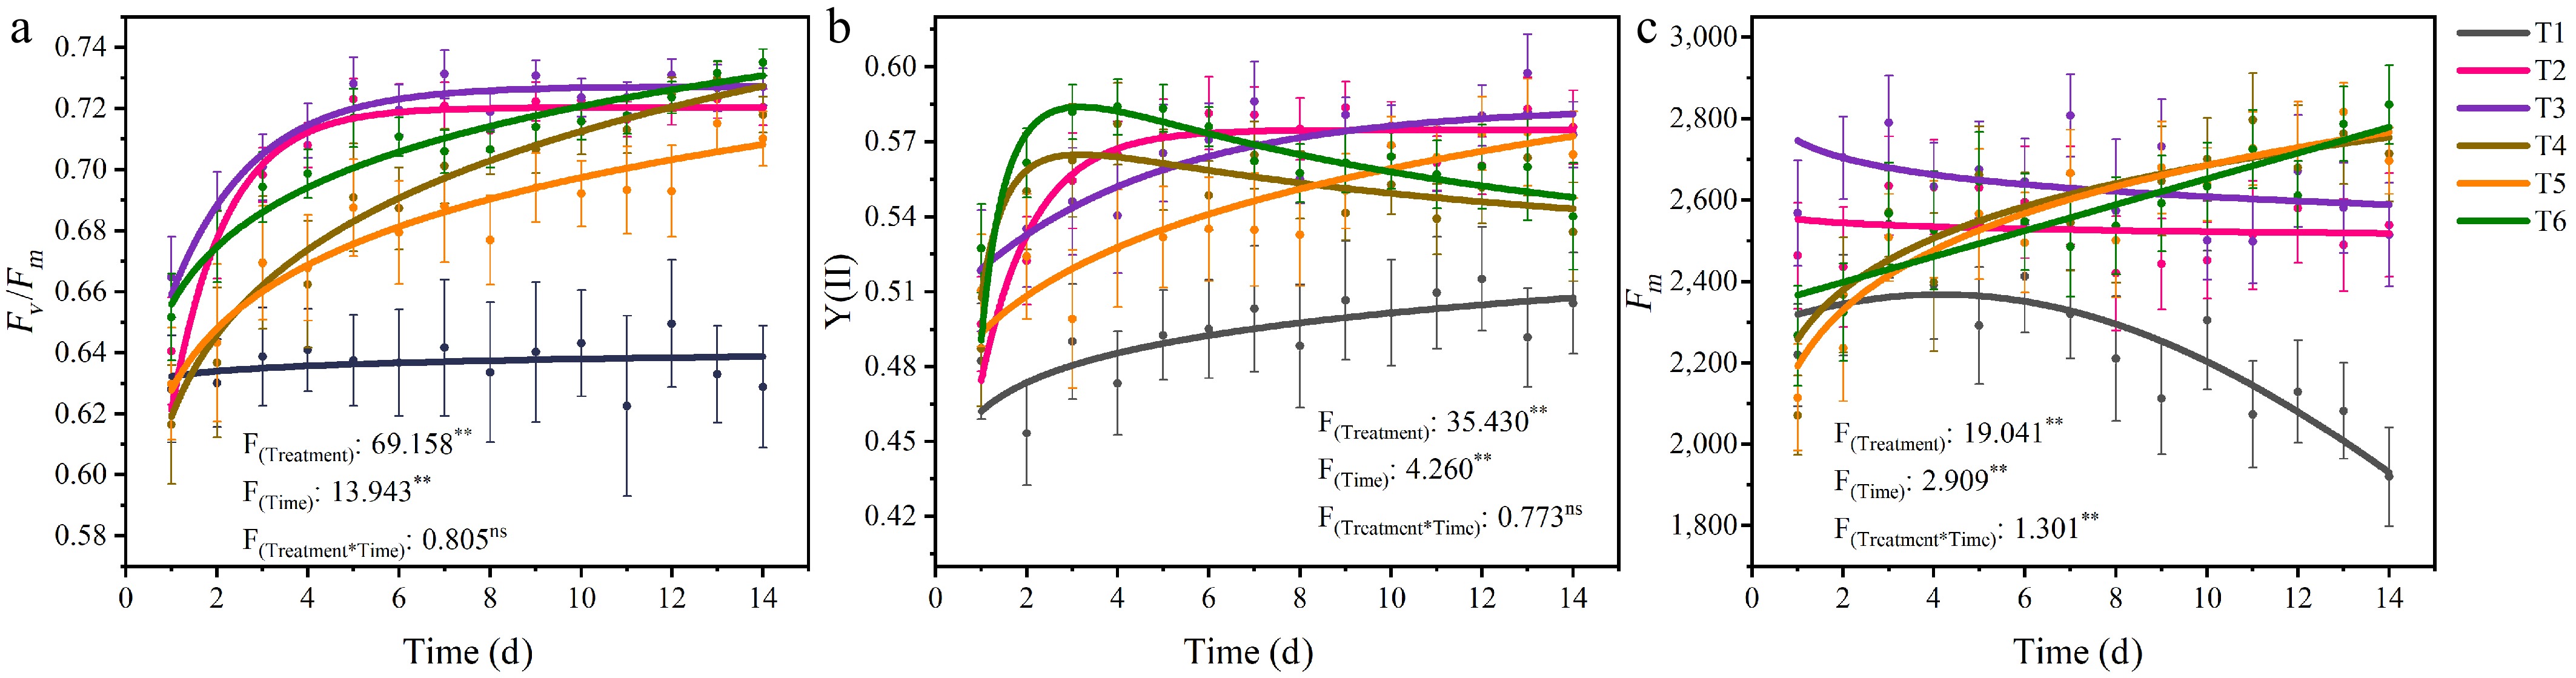
Figure 4.
The trend of (a) Fv/Fm, (b) Y(II), and (c) Fm changes over time under different treatments. Treatment refers to the different nutrient solution concentrations, and Time indicates the duration of the experiment. The points represent discrete original data points, which are the means of five replicate datasets. The lines illustrate the continuous trend after fitting the data. Asterisks (**) denote significant correlations at the p < 0.01 level (n = 25). Each parameter is based on the average of three repetitions. "Ns" indicates no significant correlation.
The results of the Fv/Fm trend fitting indicated that Fv/Fm exhibited an upward trend in the early stage for all treatments except T1, but the magnitude of the increase and its duration varied (Fig. 4a). T1 showed little increase, remaining within a stable range. T2 and T3 displayed the fastest increases, reaching steady states on the fourth and fifth days, respectively. The remaining three treatments (T4, T5, T6) consistently exhibited an upward trend, with T6 surpassing T2 and T3 around Day 11 to take the leading position. The trend fitting results of Y(II) revealed distinct patterns among the treatments (Fig. 4b). T1 exhibited a slow and continuous increase; T2 stabilized by the sixth day; both T3 and T5 showed a slow upward trend, with T3 maintaining relatively higher values; and T4 and T6 peaked on around Day 3 before gradually declining. For Fm, the trend fitting results demonstrated varied responses (Fig. 4c). T1 increased slightly in the early stage before declining rapidly. T2 and T3 exhibited a slight downward trend with a minimal decrease. T4, T5, and T6 showed a continuous upward trajectory, surpassing T3 on around Day 8.
The changes in Fv/Fm, Y(II), and Fm were closely interrelated, directly reflecting the tomato seedlings' photosynthetic performance and growth under varying nutrient concentrations. Previous studies have frequently revealed that plants exhibit sensitivity to nutrient levels[56]. When nutrients are lacking, various adaptive responses occur; for example, T1 exhibited the longest root length as the most evident manifestation. Compared with the nutrient-deficient T1 treatment, T2 had concentrations that were likely better aligned with the early-stage requirements after tomato transplantation, which may have contributed to enhanced photosynthetic recovery and photosystem stability[57]. It has also been demonstrated that elevated nutrient concentrations impose stress on crops, consequently triggering detrimental effects[58]. One reason why T4–T6 initially exhibited slower Fv/Fm recovery rates and lower Fm values than T2 and T3 during the early stage may have been the stress imposed on the tomato seedlings by elevated nutrient concentrations. However, later-stage increases in Fm and higher biomass (Fig. 3c, d) suggested that elevated concentrations promoted growth potential despite the initial stress. This indicates that after crops acclimate to their environment, their nutrient demand exhibits a progressive increase as growth progresses[59].
Analysis of changes in NPQt, Y(NPQ), and Y(NO)
-
The photoprotective mechanisms of tomato seedlings exhibited different variations under different treatments (Fig. 5). Trend fitting was performed on the data for the chlorophyll fluorescence parameters NPQt, Y(NPQ), and Y(NO). The results of the trend fitting, along with their coefficients of determination (R2) and RMSE values, indicate that the fitted curves effectively represent the trends of the scattered data (Supplementary Table S1). Additionally, treatments and time had significant effects on NPQt, Y(NPQ), and Y(NO), and the interaction between treatment and time had a significant effect on Y(NO).

Figure 5.
The trend of (a) NPQt, (b) Y(NPQ), and (c) Y(NO) changes over time under different treatments. Treatment refers to the different nutrient solution concentrations, and Time indicates the duration of the experiment. The points represent discrete original data points, which are the means of five replicate datasets. The lines illustrate the continuous trend after fitting the data. Asterisks (**) denote significant correlations at the p < 0.01 level (n = 25). Each parameter is based on the average of three repetitions. "Ns" indicates no significant correlation.
The trend fitting results of NPQt indicated that NPQt exhibited a downward trend in the early stages for all treatments, but the rate of decrease and the stabilization time varied (Fig. 5a). T1 exhibited the smallest decline magnitude and maintained consistently high NPQt values throughout. In contrast, T2 and T3 started with lower initial values, showed a decreasing trend in the early stage, and stabilized by Day 6. T4 and T5 began with higher initial values but declined rapidly in the initial phase before gradually stabilizing later. T6 displayed similar dynamics to T2 and T3. Y(NPQ) displayed similar patterns to NPQt (Fig. 5b). Except for T1, all treatments exhibited rapid initial declines in magnitude, followed by progressively slower reduction rates. Notably, T2 showed the steepest initial decline. Except for T1 which remained largely stable, Y(NO) exhibited broadly similar trends across treatments (Fig. 5c). T2 to T6 all showed upward trajectories with progressively decelerating increasing rates. Notably, T6 demonstrated the most pronounced increase.
These variations demonstrate distinct photosynthetic adaptability and photoprotective mechanisms across nutrient gradients. T2 and T3 showed rapid declines in NPQt and Y(NPQ), indicating efficient activation of nonphotochemical quenching mechanisms that enhanced PSII's stabilization through optimized light energy allocation. In contrast, the persistently high NPQt in T1 indicated sustained activation of photoprotective mechanisms. Concurrently, the rapid decline in Fm demonstrated that the prevailing light intensity may have imposed significant stress on the plants. These findings align with the research by Kratika Singh et al.[60], demonstrating that deficiency or excess of nutrient elements can compromise plants' stress resistance and environmental adaptability. For T4–T6, NPQt and Y(NPQ) gradually decreased toward stabilization with consistently low final values. Although Y(NO) increased across these treatments, the magnitude of its rise remained substantially smaller compared with the declines in NPQt and Y(NPQ). Collectively, these dynamics reflect significantly alleviated stress on plants under T4–T6. This indicates that plants can develop strategies to avoid or tolerate stress, enabling them to adapt to and protect themselves from stressful situations[61]. T2 and T3 accelerated photoprotective adaptation in seedlings, whereas T5 and T6 had prolonged acclimation but higher growth potential. These results demonstrate that plants dynamically adapt to nutrient conditions through photoprotective regulation. This is consistent with what Zhang et al.[62] stated: That plants can regulate themselves through photorespiration to adapt to the environment.
Analysis of changes in the SPAD values of tomato seedlings
-
The changes in SPAD values varied under different treatments, as shown in Fig. 6. Trend fitting was performed on the SPAD data. The results of the trend fitting, including their R2 and RMSE values, indicate that the fitted curves effectively represent the trends in the scattered data (Supplementary Table S1). Treatments, time, and the interaction between treatments and time all had significant effects on SPAD. The SPAD values of T1 continuously decreased, indicating poor plant adaptability. T1 exhibited a continuous decline in SPAD values. T2 and T3 maintained relatively stable SPAD values. T4 showed an initial decrease in SPAD values, followed by an upward trend. T5 and T6 demonstrated consistently increasing SPAD values.

Figure 6.
The trend of SPAD changes over time under different treatments. Treatment refers to the different nutrient solution concentrations. Time indicates the duration of the experiment. The points represent discrete original data points, which are the means of five replicate datasets. The lines illustrate the continuous trend after fitting the data. Asterisks (**) denote significant correlations at the p < 0.01 level (n = 25). Each parameter is based on the average of five repetitions. "ns" indicates no significant correlation.
The changes in SPAD values were significantly correlated with the changes in Fm values (correlation coefficient = 0.771) and exhibited similar trends. In T1, the synchronous decline in SPAD and Fm led to reduced photosynthetic efficiency. T2 and T3 maintained stable SPAD values without a significant increase. However, T3 exhibited relatively poor overall physiological performance, whereas T2 retained better physiological indices despite developing a smaller leaf area. Nevertheless, compared with T6, T2 demonstrated limited growth potential. Consistent with the previously demonstrated increase in nutritional requirements during crop development[59], these results reflect the dynamic nutrient demand patterns in tomato seedlings. The early inhibition and subsequent recovery observed in T4 demonstrated dynamic adjustments for environmental adaptation, consistent with the previously described role of photorespiration in plants' environmental acclimation[62]. The late-stage increases in SPAD and Fm for T5 and T6 indicated elevated chlorophyll levels, which enhanced light absorption. The underlying causes of the decline in Y(II) in T4 and T6 may differ. For T4, reduced chlorophyll levels at the early stage likely impaired photosynthetic function. For T6, the decrease may represent a self-regulatory response to light stress induced by excessive light absorption. The phenomena align with the research outcomes reported by Shi et al[63]. Overall, the dynamic changes in SPAD values revealed that tomato seedlings adapted to varying nutrient levels by regulating the photosynthetic system as a physiological strategy.
Dynamic model of variation in Fv/Fm based on the GA-SVR algorithm
-
Previous analyses of chlorophyll fluorescence parameters (such as Fv/Fm, Y (II), Fm, etc.) in tomato seedlings under different treatments revealed nonintuitive relationships between these parameters and the nutrient solution concentration (EC) and time. As a critical indicator of photosynthesis, Fv/Fm is widely used to assess the maximum photochemical efficiency of PSII. To visualize the dynamic variations of Fv/Fm with EC and time, this study constructed a genetic algorithm-optimized support vector regression (GA-SVR) model, with EC and time as input variables and Fv/Fm as the output variable (Fig. 7). Data were normalized to the [0, 1] range using the min-max method, and the optimal SVR parameters were determined through parameter optimization (C = 70.00, g = 0.3700). The model exhibited high fitting performance on both the training and testing datasets (training set: R2 = 0.83, RMSE = 0.0143; testing set: R2 = 0.83, RMSE = 0.0141), demonstrating its effectiveness in characterizing the dynamic features of variations in Fv/Fm.
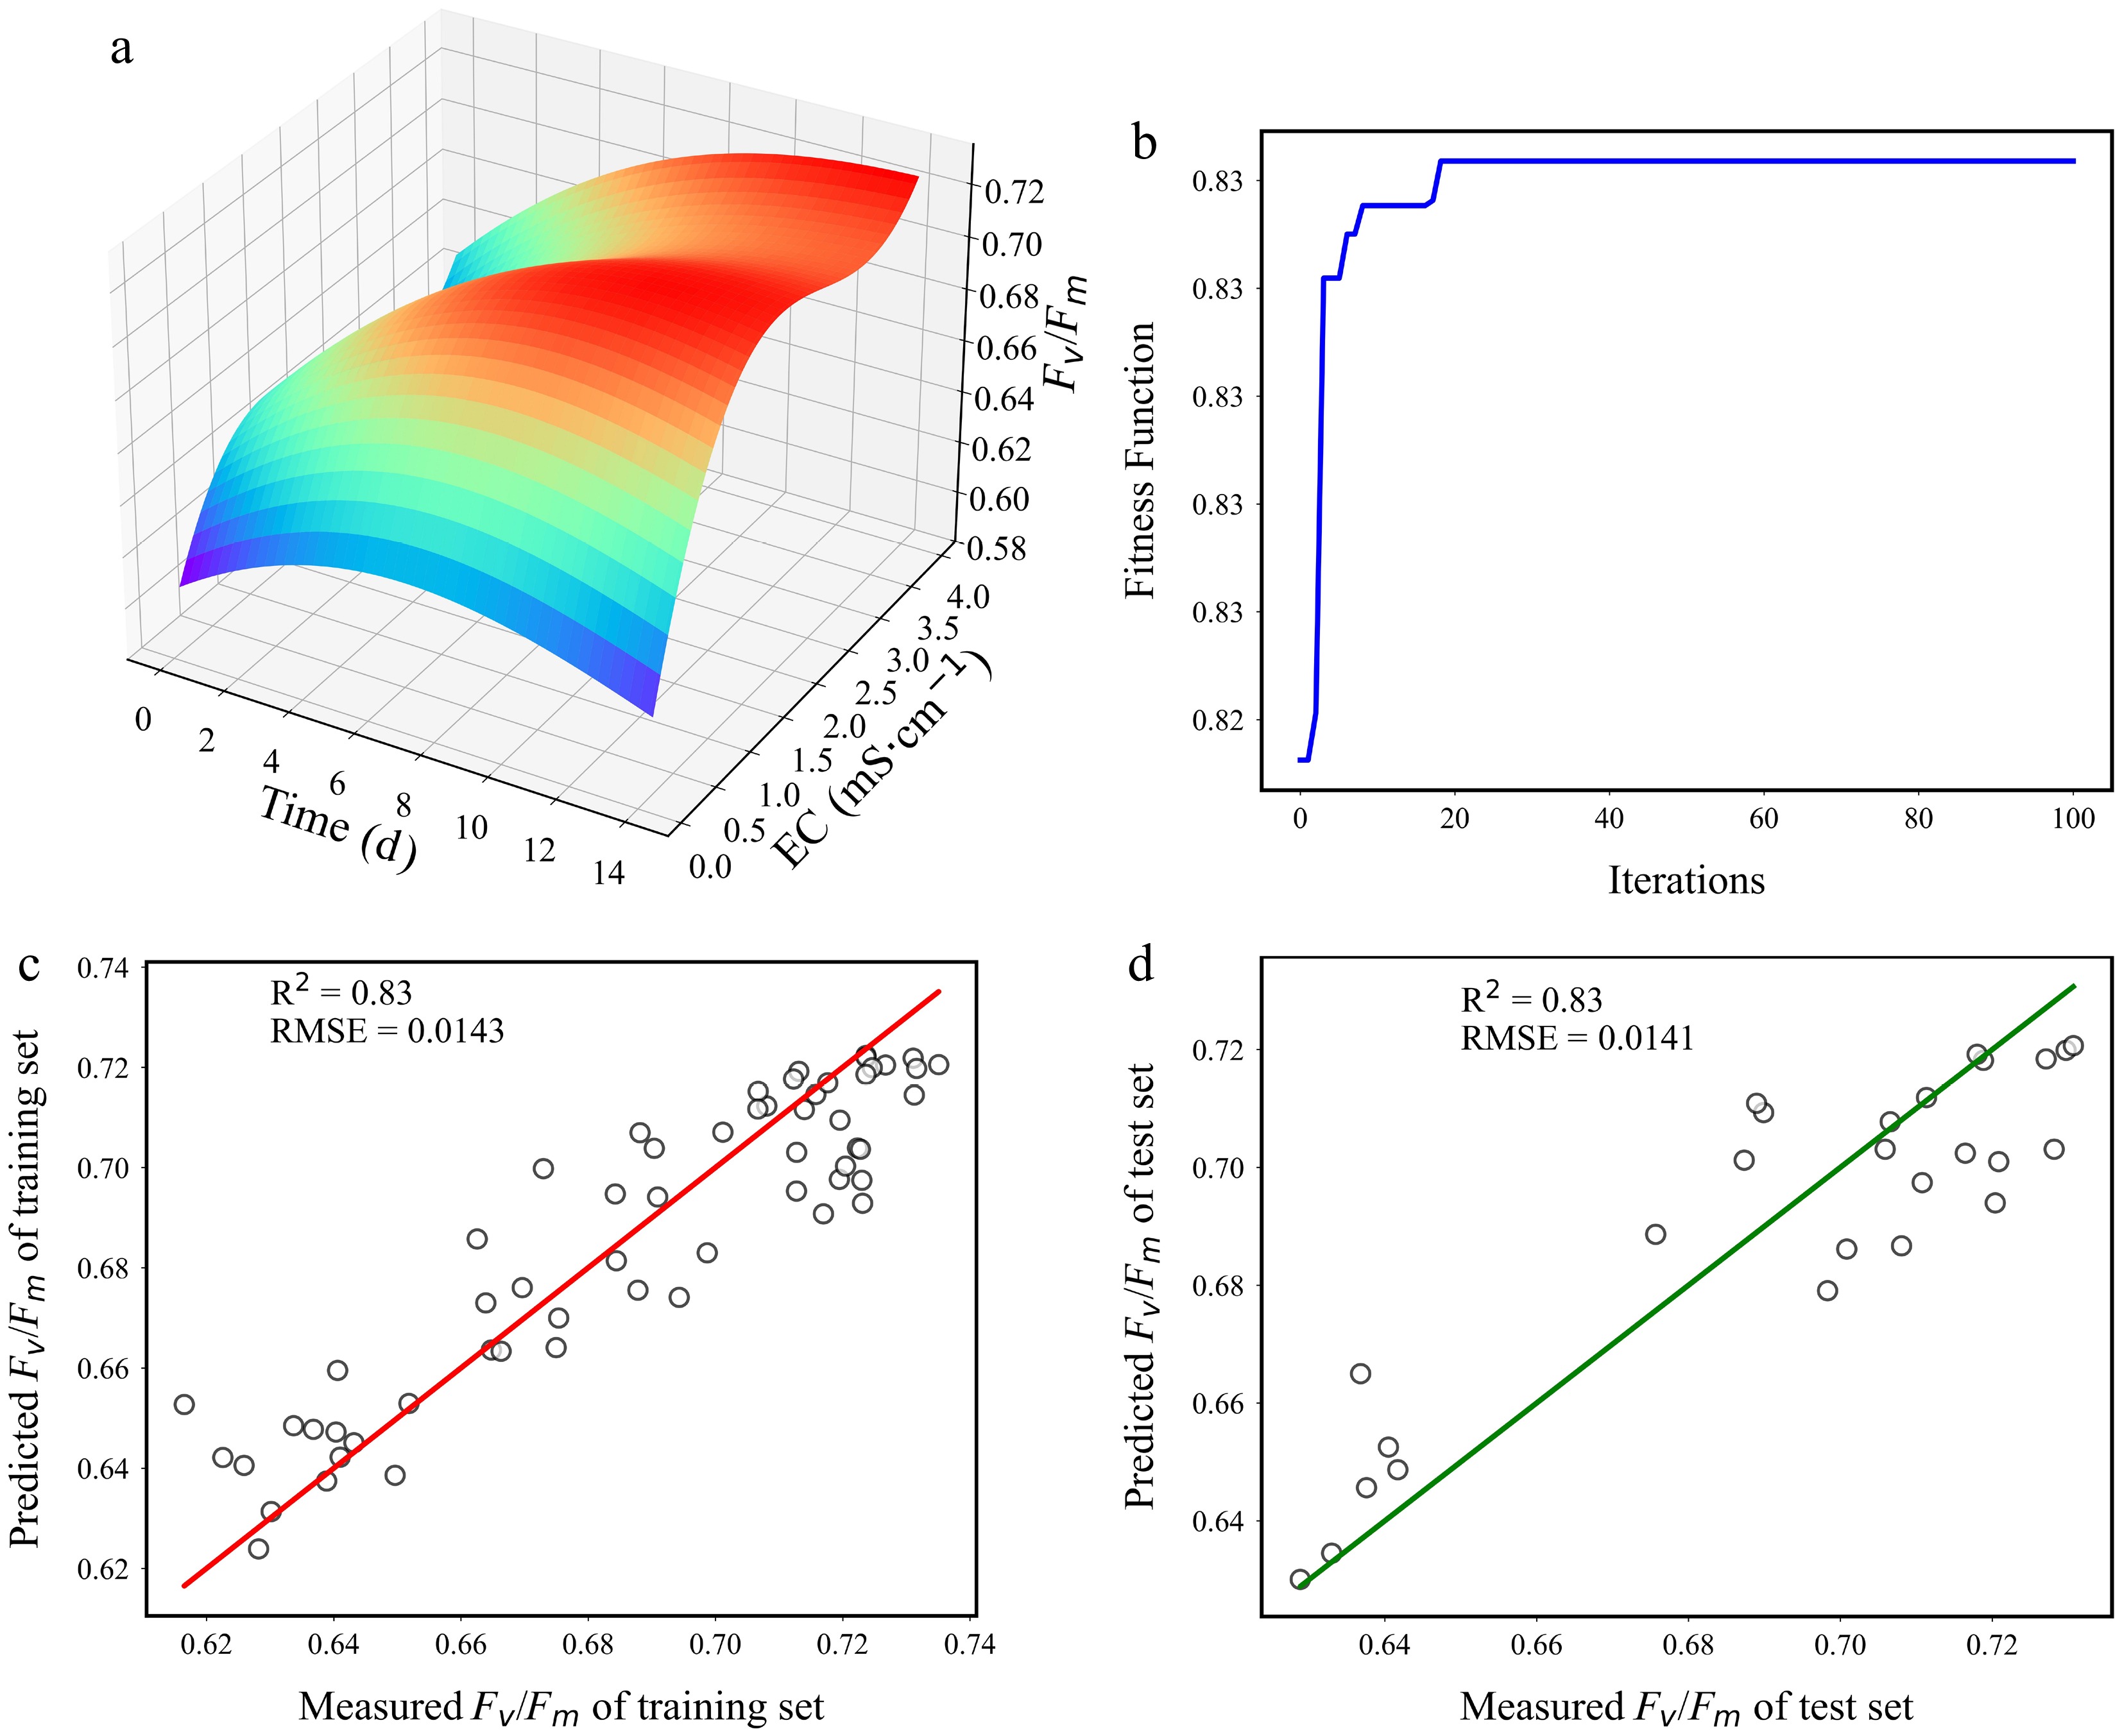
Figure 7.
Visualization of the (a) Fv/Fm model, (b) evolutionary process, and (c), (d) validations of the models.
According to the model's results (Fig. 7a), the adaptive differences in hydroponic tomatoes to varying EC levels became more apparent. Fv/Fm values near the EC ranges of T2 and T3 showed rapid increases during the early stage, whereas those near T5 and T6 exhibited slower initial recovery but significant late-phase improvements. By analyzing the dynamic changes in Fv/Fm values, the model clearly characterized the synergistic effects of EC and time on variations in Fv/Fm, further revealing differences in photosynthetic adaptability under varying nutrient concentrations.
-
This study revealed the dynamic adaptive mechanisms of hydroponic tomato seedlings to variations in the nutrient solution through a combined analysis of chlorophyll fluorescence and intelligent algorithms. The findings demonstrated that nutrient concentration-time synergies govern the recovery dynamics of photosynthetic efficiency and physiological response strategies. Seedlings in T2/T3 solutions showed rapid activation of photoprotective mechanisms, optimized light energy allocation, and accelerated the stabilization of PSII. Although T5/T6 seedlings exhibited delayed initial photosynthetic adaptation, their subsequent increase in chlorophyll content and enhanced photosynthetic efficiency unlocked significant growth potential. This highlights plants' physiological strategy of adaptive growth through a dynamic balance between photosynthetic systems and stress-protective mechanisms under nutrient variations.
The dynamic variations in Fv/Fm in response to the nutrient concentration and time was described with the Fv/Fm model established by GA-SVR. The model's results indicated concentration-dependent differences in photosynthetic recovery rates and growth potential accumulation. Specifically, the application of an appropriate nutrient solution concentration (T2) can accelerate the acclimation of PSII in tomato seedlings after transplantation. After the seedlings adapted to the environment, a gradual increase to a higher nutrient solution concentration (T6) can improve biomass accumulation and growth potential in the seedlings.
This study integrated intelligent algorithms with chlorophyll fluorescence-based physiological analysis and proposed a dynamic regulation strategy for hydroponic tomato seedling cultivation. Linking real-time nutrient adjustments to photosynthetic adaptability enhances interdisciplinary applications of artificial intelligence and plant science, advancing sustainable practices in controlled-environment agriculture.
This work was supported by the National Natural Science Foundation of China (grant numbers 32302643, 32301687), the research start-up funds of Anhui Agricultural University (grant numbers rc482205, rc482206), the open project of the Key Laboratory of Modern Agricultural Equipment and Technology (Jiangsu University) of Ministry of Education and High-Tech Key Laboratory of Agricultural Equipment and Intelligence of Jiangsu Province (MAET202317), the 2024 Southern Xinjiang Facility Agriculture Corps key laboratory open project (NJSS2024106), and Zhenjiang City Science and Technology Program (NY2024020). Thanks to all the members of the Intelligent Agriculture—Intelligent Decision and Control System Laboratory for their help.
-
The authors confirm their contributions to the paper as follows: ideas, formulation, and evolution of overarching research goals and aims, designing and carrying out the experiments, and article writing and editing: Huang L; data collection: Ma H, Chen Y; assisting for experiment and paper ideas modification: Zhang J, Chen D; providing experimental technical guidance: Zhang L; providing experimental funds: Chen D. All authors reviewed the results and approved the final version of the manuscript.
-
The datasets generated during and/or analyzed in the current study are available from the corresponding author on reasonable request.
-
The authors declare that they have no conflict of interest.
- Supplementary Table S1 Fitting accuracy and mean square error of various chlorophyll fluorescence parameters obtained by successfully performing curve fitting with appropriate curve fitting methods selected using Origin under different treatments.
- Copyright: © 2025 by the author(s). Published by Maximum Academic Press, Fayetteville, GA. This article is an open access article distributed under Creative Commons Attribution License (CC BY 4.0), visit https://creativecommons.org/licenses/by/4.0/.
-
About this article
Cite this article
Huang L, Ma H, Chen Y, Zhang L, Zhang J, et al. 2025. The continuous adaptability of hydroponic tomato seedlings to nutrient solutions with chlorophyll fluorescence. Technology in Horticulture 5: e036 doi: 10.48130/tihort-0025-0031 

The continuous adaptability of hydroponic tomato seedlings to nutrient solutions with chlorophyll fluorescence
- Received: 22 May 2025
- Revised: 06 September 2025
- Accepted: 12 September 2025
- Published online: 13 November 2025
Abstract: This study investigated the dynamic effects of nutrient solution concentrations on the growth adaptability of hydroponic tomato seedlings. The chlorophyll fluorescence parameters, growth, and physiological conditions of the seedlings were measured during a 14-day experiment with six EC (electrical conductivity) gradients. These gradients were designated as T1, T2, T3, T4, T5, and T6, representing different nutrient solution concentrations. The continuous chlorophyll fluorescence parameters were integrated with a genetic algorithm-optimized support vector regression (GA-SVR) model to quantify plants' responses to the nutrient solution. The results showed that tomato seedlings under T2 and T3 exhibited optimal photosynthetic recovery and environmental adaptability, but their morphological and physiological indicators showed relatively average performance across all nutrient solution concentrations. In contrast, seedlings under T5 and T6, despite slower photosynthetic recovery compared with T2 and T3, demonstrated superior morphological and physiological indicators, higher chlorophyll content in later stages, and exhibited greater growth potential. A GA-SVR-based dynamic model for the maximum photochemical efficiency of Photosystem II (PSII), i.e., Fv/Fm (input: EC and time; output: Fv/Fm) showed high accuracy in both the training (R2 = 0.83, root mean square error [RMSE] = 0.0143) and test sets (R2 = 0.83, RMSE = 0.0141), revealing concentration-dependent differences in photosynthetic efficiency recovery rates. A dynamic regulation strategy was proposed: Applying T2 nutrient concentrations post-transplantation to accelerate the adaptation of PSII, then progressively increasing to T6 concentrations after the seedlings have acclimatized to enhance biomass accumulation and growth potential. This study provided valuable insights for precision management of hydroponic tomato cultivation and the application of intelligent algorithms in plant physiology research.
-
Key words:
- Hydroponics /
- Tomato seedlings /
- Chlorophyll fluorescence technology /
- Intelligent algorithms /
- GA-SVR