


-
The market for culinary herbs is growing within the US because of the demand for fresh and healthy herbs in various dishes, yet the current production of culinary herbs is insufficient to meet overall demand[1]. The US imports most of its culinary herbs from Mexico, Colombia, and Peru,[2] valued at over US
${\$} $ Whenever plants are stressed, reactive oxygen species (ROS) like hydroxyl radicals (·OH), hydrogen peroxide (H2O2), singlet oxygen (1O2), and superoxide anion radical (O2·−) accumulate in the plants, which leads to oxidative damage in plants[17,18]. Plants produce different enzymatic and non-enzymatic antioxidants to scavenge the free radicals produced from oxidative stress[19]. Of those, phenolic compounds are a major group of antioxidants that plants use to mitigate stress. Therefore, an increase in phenolic compounds is seen in stressed plants. However, polyphenol concentrations within these herbs are greatly influenced by multiple factors like growing conditions[20], plant parts[21], and sustainable production practices[22] as well. Similarly, the phytochemical production of culinary herbs can be influenced by different biotic and abiotic factors. This is true not only for phytochemicals, but proline serves as an osmoprotectant in plants[23]. The level of proline can increase significantly in plants under stress conditions such as salinity[24]. The accumulation of proline during salinity stress can be seen as a key adaptive response that leads to osmotic adjustment, protection of cellular structures, and detoxification of ROS[25].
Water quality in agriculture is of great concern as available water resources dwindle and demand for municipal water increases. Alternative water sources of lower quality, such as saline or brackish groundwater, are abundant and likely to be used during drought or water scarcity[26]. Unconfined or leaky aquifers, being closer to the surface, often have lower quality than confined aquifers[27], and their composition or quality varies widely, yet they remain an option for crop production[28]. However, salinity adversely affects plant growth and yield by causing toxicity and osmotic stress, reducing water and nutrient uptake[29]. Excess salinity disrupts nutrient balances, interfering with essential processes such as photosynthesis and cellular stability[30]. For example, high sodium (Na) uptake limits potassium (K) absorption, increasing Na/K ratios and impairing cellular functions in plants[31]. Furthermore, sodium and chloride ions' dominance also reduces the availability of potassium, calcium, magnesium, iron, and zinc[28,30], leading to nutrient deficiency, reduced growth, and smaller leaf size. Moreover, salinity can cause ion toxicity that can damage cellular structure and hamper metabolic processes[29]. This problem is more severe in salinity-prone areas. Soil salinity arises from the accumulation of soluble salts, weathering of minerals, seawater intrusion into freshwater, and high evaporation rates in natural environments[32]. Furthermore, the presence of cations like sodium, calcium, potassium, and magnesium, and anions like chloride, sulfate, or carbonate, governs soil salinity. Most research has used simple salts like sodium chloride (NaCl), but real-world conditions involve complex salts that require further research to fully understand their effects on plant physiology and productivity, especially for salt-sensitive crops and high-value culinary herbs whose growth can be influenced by the presence of complex salts. The use of stressors like salinity or light to enhance beneficial compounds in fruits, vegetables, and herbs is gaining interest due to the demand for functional foods. Salinity can alter the phytochemical concentrations in culinary herbs, with studies reporting increased phenolics, flavonoids, proline, and essential oils[33] in cilantro under salinity stress. However, other research found reduced essential oil content in parsley with increasing salinity[34]. Exploring lower-quality water sources as an alternative source for irrigation in times of drought or in salinized areas is critical, but understanding how complex salts affect different plants and their phytochemical composition[35] is equally important. These conditions may improve phytochemical profiles, yet varying salt tolerances among herbs can negatively impact the yield and quality. Therefore, managing salinity is crucial for maintaining the quality and productivity of herbs. This experiment was conducted to evaluate the physiology and phytochemical production of two distinct culinary herbs, cilantro and parsley, under complex salt solutions at varying rates, hypothesizing that increasing salinity stress will increase the phytochemical content of culinary herbs.
-
Two sequential experiments were conducted in a growth chamber at the Horticulture Garden and Greenhouse complex of Texas Tech University. The first experiment ran from October 19, 2022, to December 12, 2022, and the second experiment lasted from April 24, 2023, until June 07, 2023. In each experiment, several cilantro and parsley seeds were sown in 4 × 4 plastic pots filled with Berger BM6 all-purpose soilless media (Berger, Saint-Modeste, Canada). Once they reached the two true leaf stage, seedlings were thinned to one seedling per pot. The seedlings were hand irrigated two to three times per week, depending on the moisture content. During the seedling stage, they were fertilized with 100 ppm nitrogen (FloraGro; General Hydroponics, Santa Rosa, CA, USA) to boost their growth. The growth chamber temperature was set to 23 °C, and photosynthetic photon flux density (PPFD) was set to 390 µmol/m2/s with a 16-h photoperiod. Growing environments were kept constant throughout both experiments. Both experiments were set up in a randomized block design with three salinity treatments (1, 3, and 5 dS/m) and a control (DI water) with ten replications for each treatment. The salinity treatments consisted of a complex salt mix Instant Ocean© sea salts (Instant Ocean United Pet Group, Blacksburg, VA, USA), which was mixed with water to get the desired EC values for each treatment (Table 1). The complex salt solution constituent comprised of 30% Na, 54% Cl, 7% SO4, 3% Mg, 1% K, and 1% Ca. In each irrigation, 250 mL of water is applied with the addition of 100 ppm commercial water-soluble Jack's fertilizer (20N : 20P : 20K; JR Peters Inc., Allentown, PA, USA). SMEC 300 soil moisture sensors attached with a data logger (Mini Station WatchDog; Spectrum Technologies Inc., Illinois, USA) were installed to record the electrical conductivity (EC) and volumetric water content (VWC) in each treatment group of cilantro and parsley. At harvest, plant biomass was measured in each plant by using the standard scale. The plant was cut from the base of the stem to measure the fresh biomass using an analytical balance. After harvest, the plants were stored in plastic bags and stored at −80 °C until further analysis. The plants were freeze-dried (Harvest Right, Salt Lake City, UT, USA), and the dry shoot biomass was recorded using an analytical balance (OHAUS Corporation, Parsippany, NJ, USA). The freeze-dried plants were then ground into a fine powder in liquid nitrogen using a mortar and pestle. The powdered samples were stored at −4 °C until they could be further analyzed.
Table 1. Amount of Instant Ocean© sea salts used to prepare the desired salinity levels.
Salinity level Amount of salt used
(mg/L of water)0 dS/m (control) 0 1 dS/m 650 3 dS/m 1,950 5 dS/m 3,350 Analysis of phytochemicals, proline and chlorophyll
-
Phytochemical analyses, including total phenolic compounds (TPC) and total flavonoid compounds (TFC), were conducted following the methodology described by Regmi et al.[36]. Briefly, dried samples of cilantro and parsley were ground into fine powder in liquid nitrogen with a mortar and pestle. For the extraction, 0.25 g of the powdered plant material was mixed with 5 mL of distilled water in heat-resistant tubes, which were then incubated in a water bath at 100 °C for 30 min and subsequently cooled to room temperature. The tubes were centrifuged at 3,000 rpm for 15 min, and the supernatant was collected for the phytochemical analysis.
For TPC determination, 100 µL of supernatant was combined with 0.5 mL of 0.2N Folin-Ciocalteu reagent. After 5 min, 150 µL of the saturated sodium carbonate solution was added. The mixture was incubated at 20 °C for 2 h, and 200 µL was pipetted into the microplate to measure the absorbance at 765 nm using a microplate spectrophotometer (SpectraMax iD3, Molecular Devices, San Jose, CA, USA). The total phenolic content was expressed as mg of gallic acid equivalent/dry weight g sample (mg GAE/g DW).
Similarly, for TFC analysis, 0.5 mL of the supernatant was mixed with 1.5 mL of 95% ethanol, 0.1 mL of 10% aluminum chloride (AlCl3), 0.1 mL of 1M potassium acetate (CH3COOK), and 2.8 mL of distilled water. The mixture was vortexed and incubated at room temperature for 30 min. Subsequently, 200 µL was transferred to a microplate to measure absorbance at 410 nm using a microplate spectrophotometer. The flavonoid content was expressed as mg of quercetin equivalent/ dry weight g sample (mg QE/g DW).
Proline content was measured in ground plant samples according to the modified method of Lee et al.[25]. For extraction, 30 mg of powdered sample was added to 1 mL of 1% sulfosalicylic acid in 2 mL tubes. The samples were vortexed for 10 s and centrifuged at 5,000 rpm for 10 min. The supernatant was used for proline determination. A proline standard curve was prepared, and 66 µL of the supernatant and standard were added to a microplate; then 132 µL of ninhydrin solution was pipetted into the plates, which were then incubated at 100 °C for 60 min. The reaction was stopped by placing the microplate into the ice bath for 10 min. The absorbance was read at 510 nm using the microplate spectrophotometer.
Chlorophyll content was analyzed using the microplate spectrophotometer following the modified method of Lichtenthaler[37] as explained by Kathi et al.[38]. Specifically, 100 mg of the powdered sample was mixed with 1 mL of 100% methanol. The tubes were homogenized and centrifuged at 10,000 rpm for 15 min. Following centrifugation, 200 µL of the supernatant was transferred to a microplate and absorbance was read at 665, 652, and 470 nm for chlorophyll (chl.) a, b, and total chlorophyll, respectively.
Plant nutrient analysis
-
Freeze-dried plant samples were sent to Waters Agricultural Laboratories (Camilla, GA, USA) for the determination of macro- and micronutrient content using Inductively Coupled Plasma Optical Emission Spectroscopy (ICP-OES) analysis on cilantro and parsley plants across both experiments.
Statistical analysis
-
Due to the genetic difference between cilantro and parsley, the analysis was conducted separately for each species. These experiments were arranged in a randomized complete block design (RCBD) with each experiment being conducted twice (Experiment 1 and Experiment 2). Each salinity treatment included ten replicates of cilantro and parsley for a total of 40 cilantro and 40 parsley plants per experiment. Additionally, significant differences were observed between experiments 1 and 2 when data from both experiments were pooled together (Supplementary Table S1). Therefore, each experiment and species was analyzed separately, and an analysis of variance (ANOVA) was tested among salinity treatments within each herb at a p < 0.05 significance level to determine significant differences (JMP Pro 16, SAS Inc., Cary, NC, USA). When differences were significant, Tukey's HSD was used to determine the significant difference among means. A pairwise correlation was conducted to determine the relationship between salinity, growing conditions, and plant growth parameters.
-
Soil EC and VWC were recorded continuously using soil sensors and dataloggers for cilantro and parsley in both experiments (Supplementary Fig. S1) and were averaged. Across both experiments, the average EC and VWC of the soil increased as the salinity increased. In cilantro, the average soil EC and VWC ranged from 0.127−0.534 dS/m and 12.39%−39.87%, respectively, in experiment 1, and they ranged from 0.106−0.644 dS/m and 9.52%−32.82% in experiment 2. Similarly, in parsley, EC and VWC ranged from 0.131−0.406 dS/m and 15.45%−21.07%, respectively, in experiment 1 and 0.098−0.554 dS/m and 12.18%−25.70% in experiment 2 (as shown in Supplementary Table S2).
Fresh weight and dry weight
-
The fresh weight (FW) and dry weight (DW) of cilantro were significantly affected by salinity in both experiments (Fig. 1). In each experiment, the greater FW and DW were found in control plants with steady declines in biomass at higher rates of salinity (Fig. 1a, b).

Figure 1.
Effect of salinity on fresh weight (FW) and dry weight (DW) of cilantro in experiments 1 and 2. Different uppercase letters indicate significant effect of salinity on FW whereas lowercase indicates significant effect of salinity on DW at p ≤ 0.05. The error bars represent ± 1 standard error of the mean (n = 10). The solid bar represents FW, and the striped bar represents DW. Italic text shows the significant impact of salinity on the measured parameters.
In parsley, FW was significantly affected by salinity in both experiments, whereas DW was significantly affected by salinity in experiment 2 only (Fig. 2a, b). Interestingly, 1 dS/m significantly increased the FW of parsley in both experiments. Greater DW was found in 1 dS/m treatments, and the lowest was found in 5 dS/m for experiment 2.
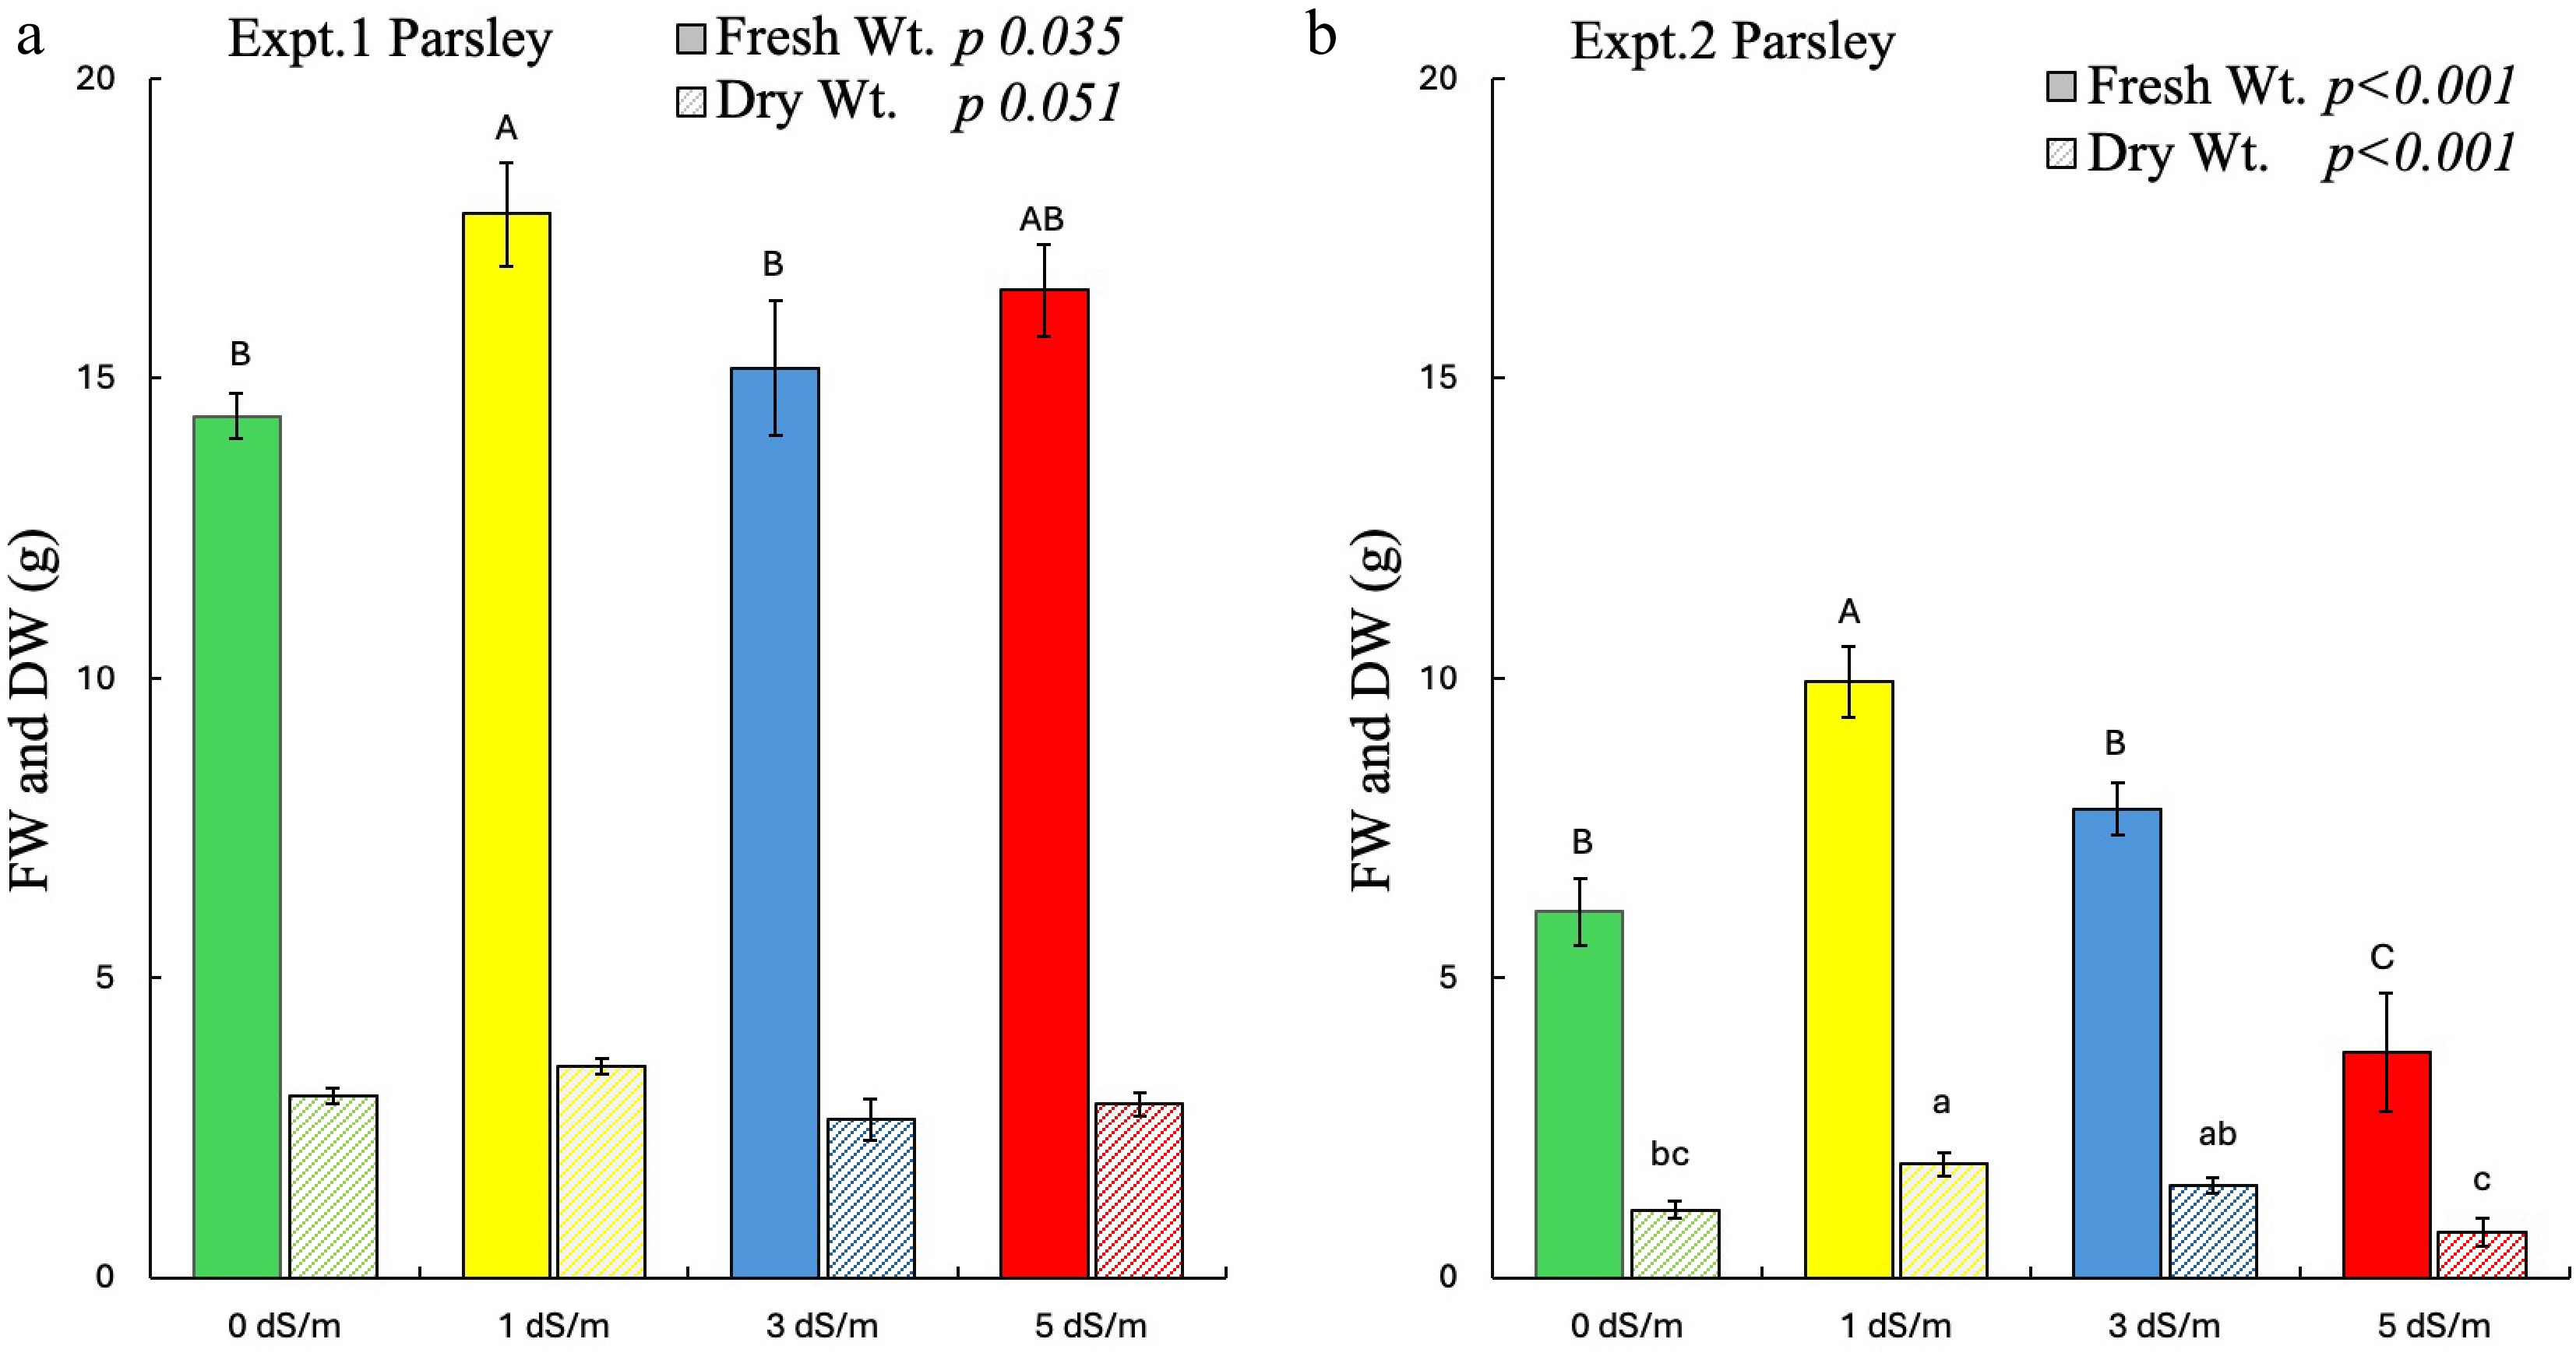
Figure 2.
Effect of salinity on fresh weight (FW) and dry weight (DW) of parsley in experiments 1 and 2. Different uppercase letters indicate significant effects of salinity on FW, whereas lowercase indicates significant effect of salinity on DW at p ≤ 0.05. The error bars represent ± 1 standard error of the mean (n = 10). The solid bar represents FW, and the striped bar represents DW. Italic text shows the significant impact of salinity on the measured parameters.
Phytochemicals, proline, and chlorophyll
-
Salinity significantly affected TPC and TFC of cilantro in experiment 1, but it did not affect the phytochemicals in experiment 2 (Fig. 3a, b). Overall, greater proline content was found in experiment 1 as compared to experiment 2 (3C and 3D). In experiment 1, greater TPC and TFC were found in control plants with reduced phytochemicals in salinity-treated plants. Higher salinity also significantly and proportionally increased the proline content in cilantro in both experiments.
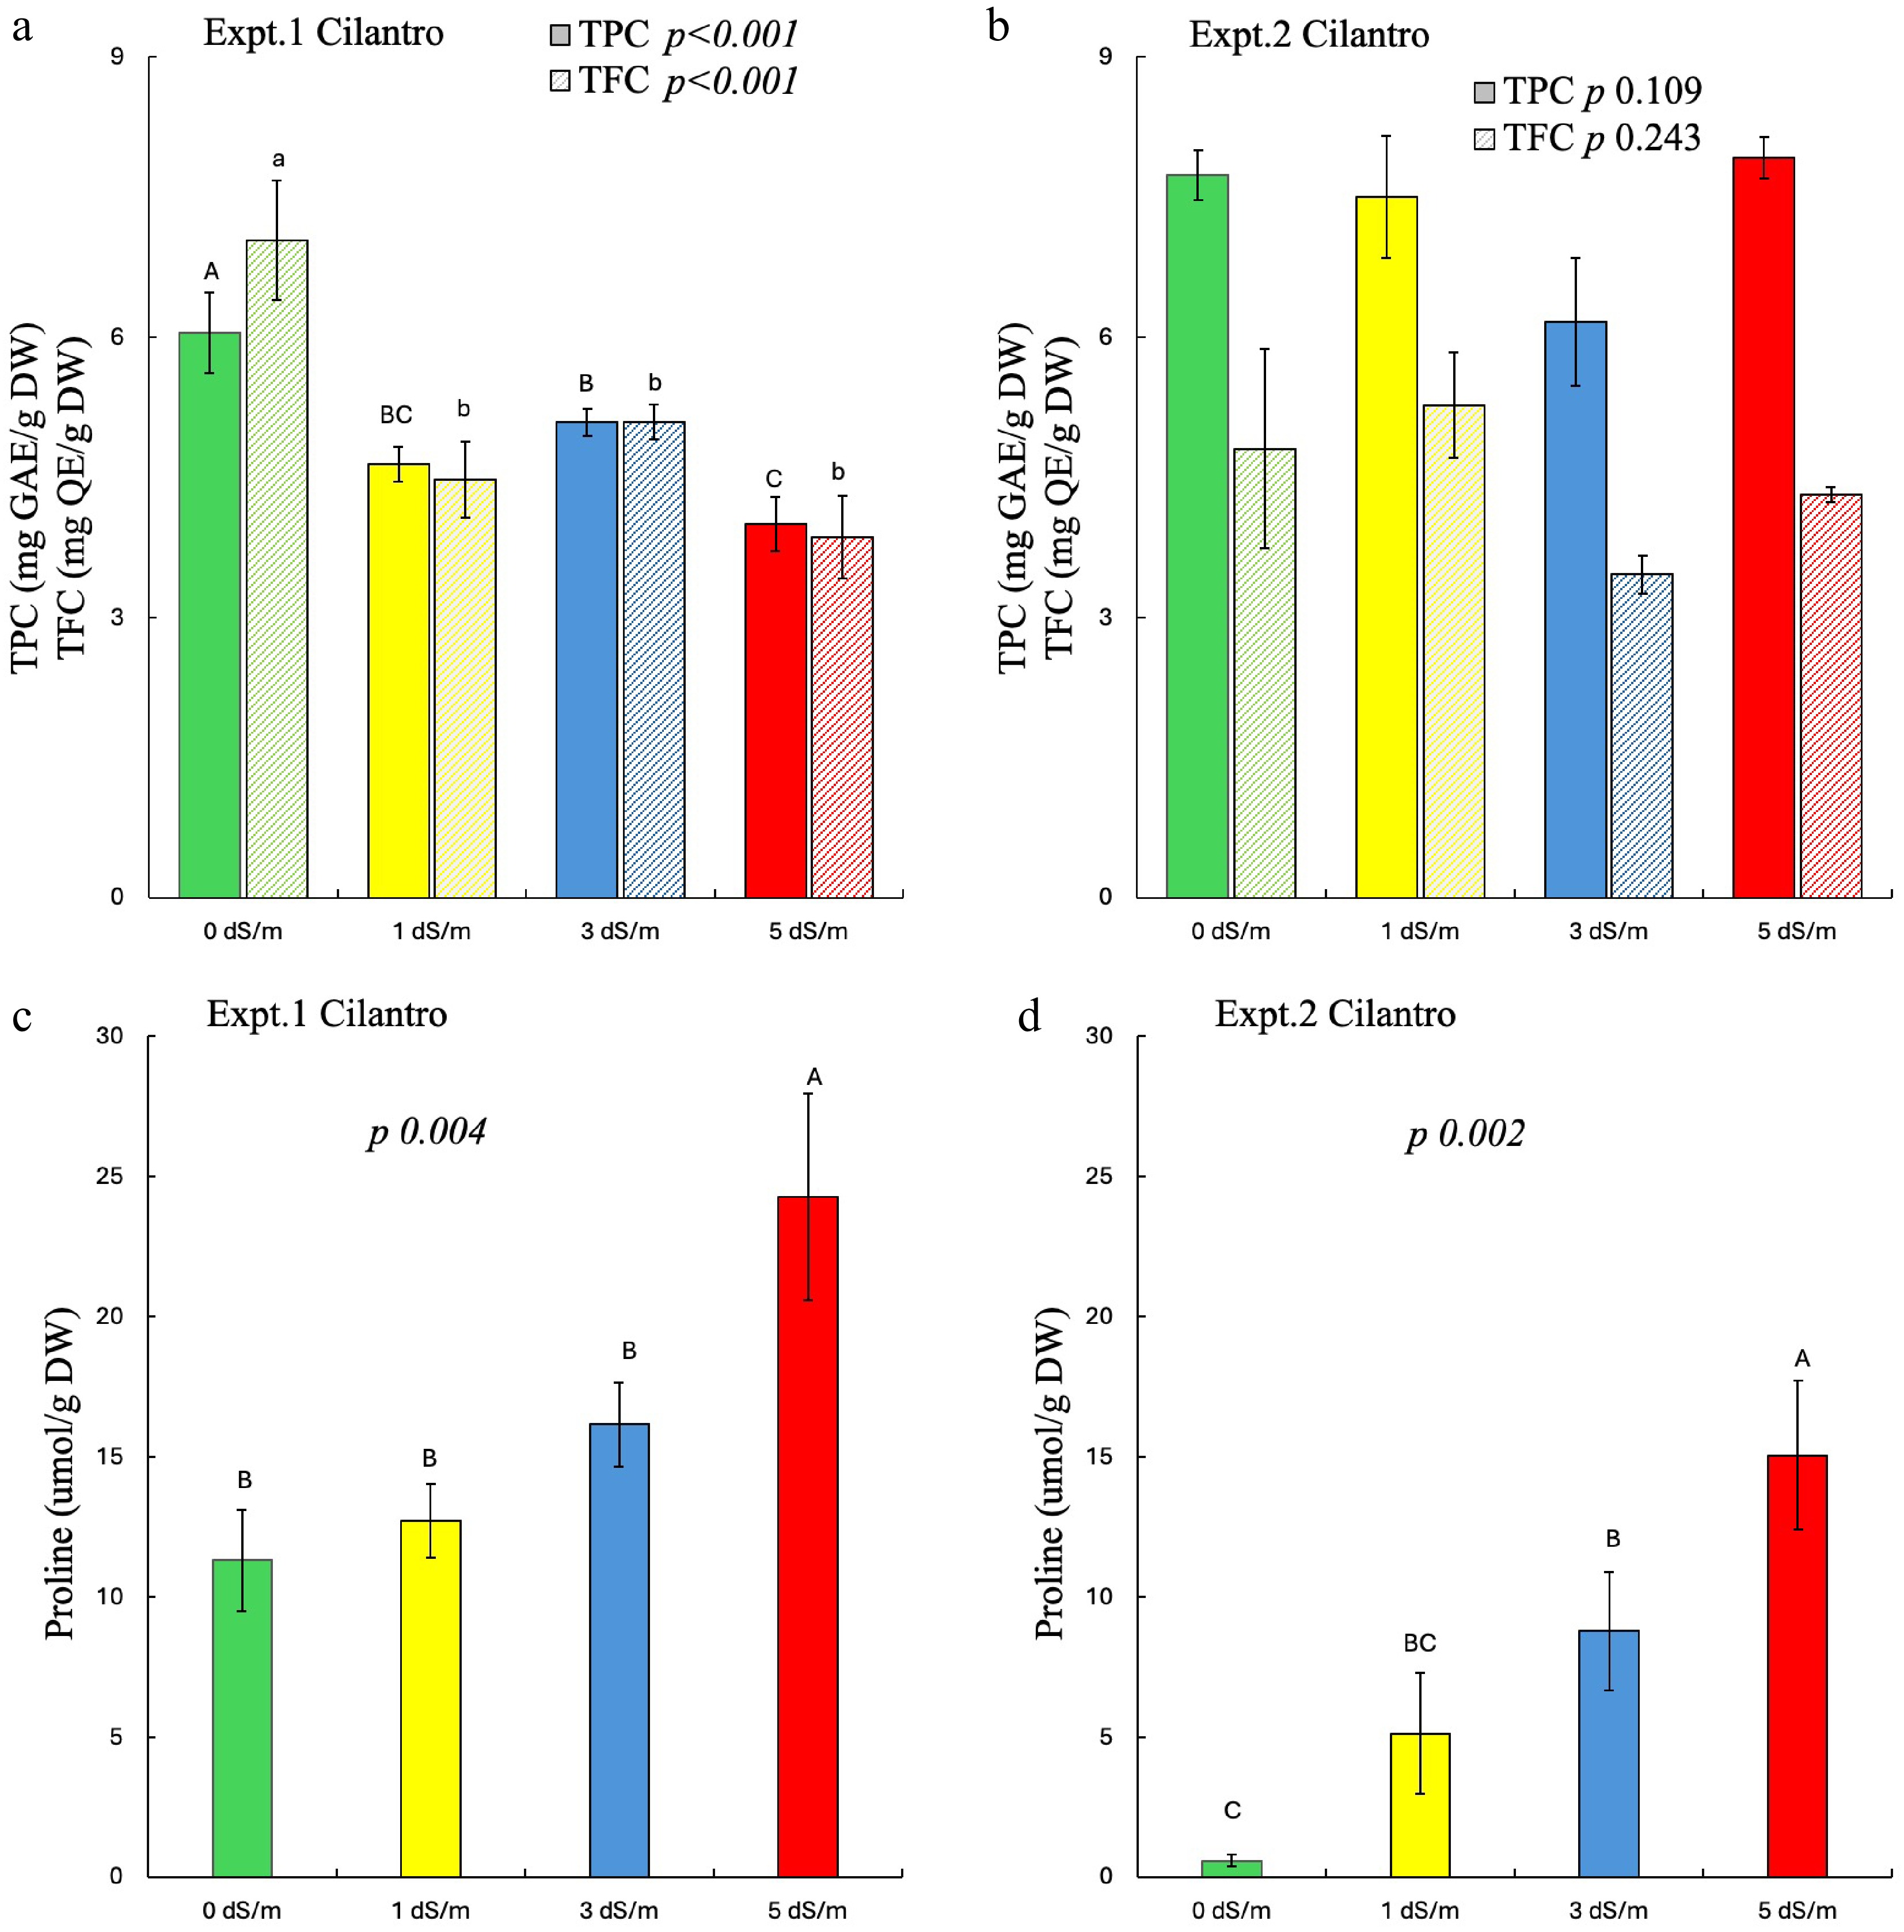
Figure 3.
Effect of salinity on phytochemicals and proline of cilantro in experiments 1 and 2. Different uppercase letters indicate significant effects of salinity on (a), (b) TPC and (c), (d) proline; whereas lowercase indicates significant effects of salinity on (a), (b) TFC at p ≤ 0.05. The error bars represent ± 1 standard error of the mean (n = 5). The solid bar represents TPC, and the striped bar represents TFC. Italic text shows the significant impact of salinity on the measured parameters.
In parsley, salinity significantly affected the TFC in experiment 1 with no significant effects seen in experiment 2 (Fig 4a, b). As seen with cilantro, greater proline content was found in experiment 1 as compared to experiment 2. Parsley treated with 5 dS/m salinity showed significantly reduced TFC in experiment 1, with no difference among other treatments. Conversely, salinity did not affect the TPC of parsley in both experiments. Like cilantro, proline content significantly increased with increased salinity in parsley across both experiments (Fig. 4c, d).
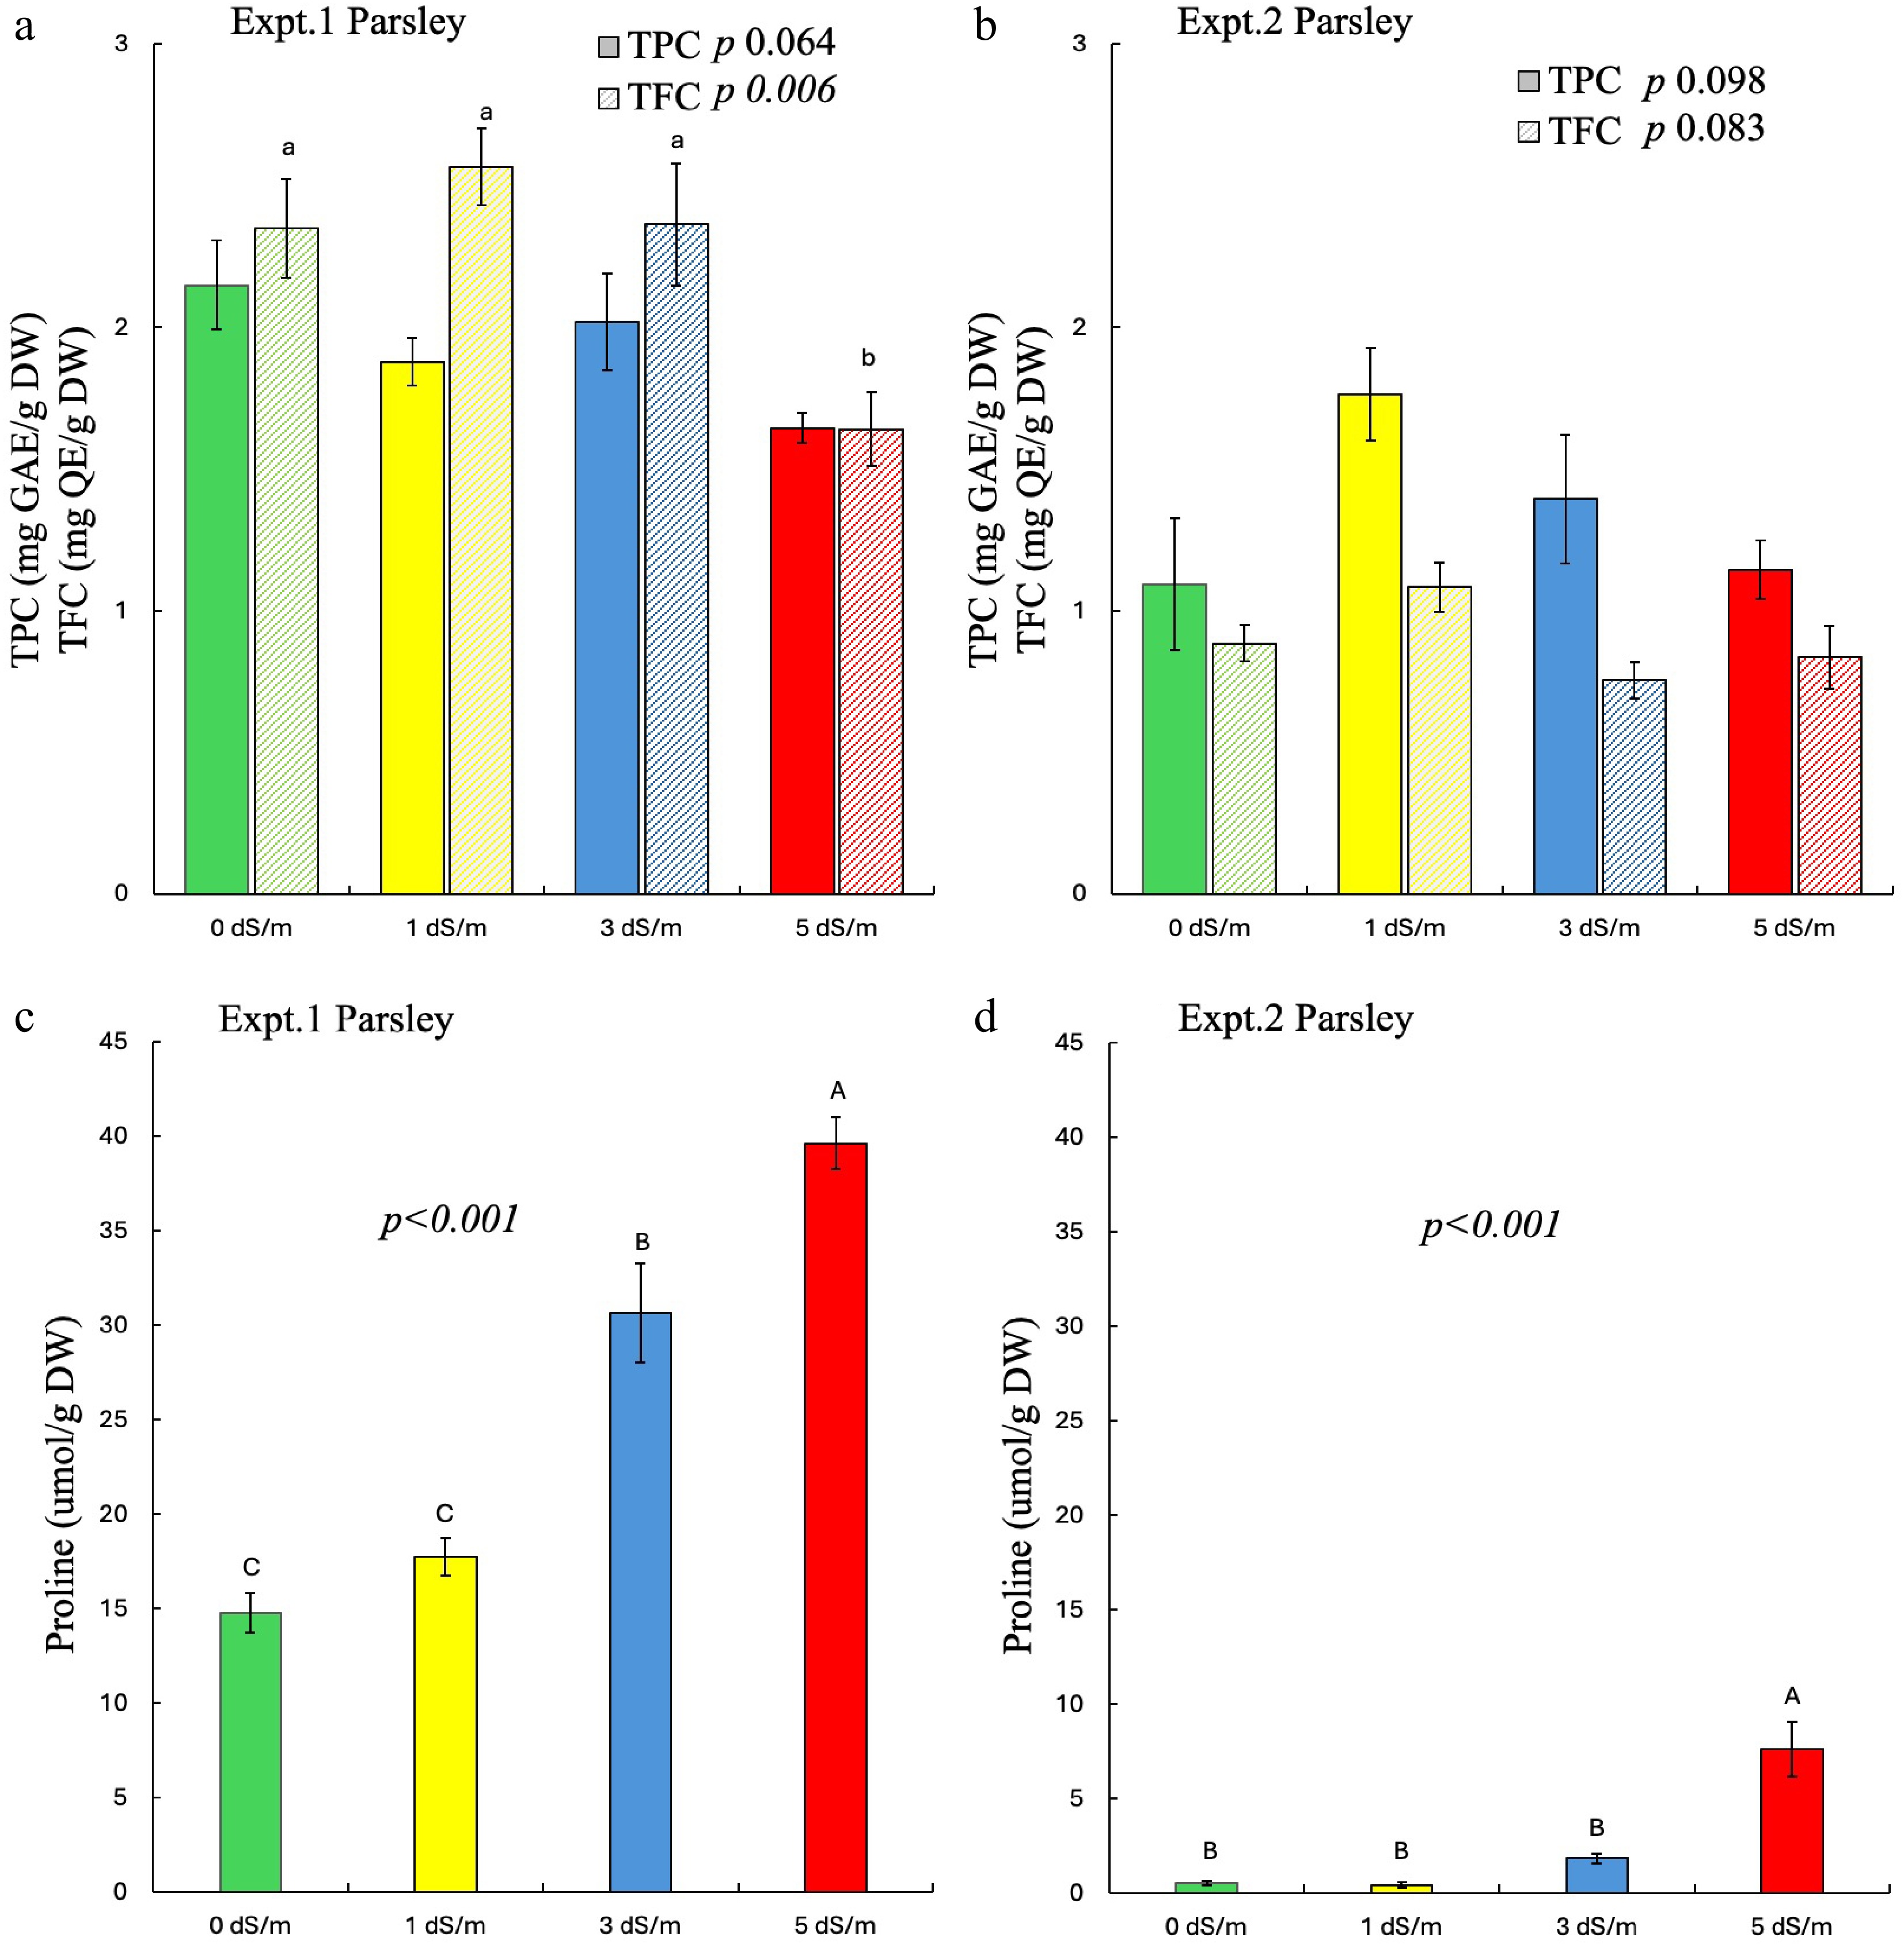
Figure 4.
Effect of salinity on phytochemicals and proline of parsley in experiments 1 and 2. Different uppercase letters indicate significant effects of salinity on (a), (b) TPC and (c), (d) proline whereas lowercase indicates significant effects of salinity on (a), (b) TFC at p ≤ 0.05. The error bars represent ± 1 standard error of the mean (n = 5). The solid bar represents TPC, and the striped bar represents TFC. Italic text shows the significant impact of salinity on the measured parameters.
The chlorophyll content (chl. a, chl. b, and total chlorophyll) of cilantro was not affected by salinity in both experiments (Supplementary Fig. S2a & S2b). Furthermore, similar concentrations of chlorophylls were found in both experiments.
Salinity did not affect the chl. a, chl. b, and total chlorophyll content of parsley in either experiment (Supplementary Fig. S3a, S3b). Results showed similar concentrations of chlorophylls in plant tissues in both experiments.
Nutrient analysis
-
Macro- and micronutrients were measured in cilantro across both experiments, as shown in (Supplementary Table S3). Macronutrients, nitrogen, phosphorus, potassium, magnesium, and calcium were unaffected by salinity rates across both experiments. However, sulfur was significantly reduced in cilantro, approximately 45%−48% in salinity-treated plants, only in the second experiment. Micronutrients were also significantly affected by salinity, where the majority of the micronutrients were increased at higher salinity rates, except for boron in the second experiment. Interestingly, N and P were greater in the first experiment, and micronutrients were greater in the second experiment. In both experiments, salinity treatment significantly elevated plant micronutrient levels. The increase was most dramatic for Mn (27%−793%) and Zn (10%−444%), with a more moderate rise in Fe (6%−110%) and Cu (27%−38%) (refer to Supplementary Table S3 for values).
Macro- and micronutrients were also measured in parsley across both experiments, as shown in Supplementary Table S4. Potassium (K) was reduced by higher salinity rates by 16%−35% in the second experiment, whereas magnesium (Mg) was increased by higher salinity rates by 2%−8% in the first experiment. In terms of micronutrients, zinc (Zn) and copper (Cu) were increased by 8%−125% and 8%−92%, respectively, by higher salinity rates in parsley across both experiments, but manganese (Mn) was increased by salinity by 47%−82% in the first experiment only. Higher nitrogen concentrations were also found in experiment 1.
Correlation analysis
-
Pairwise correlation analysis was performed on the measured parameters of cilantro from experiment 1 (Table 2). In this experiment, salinity levels were negatively correlated with FW, DW, TPC, and TFC, while positively correlated with proline, EC, VWC, Zn, Mn, Fe, and Cu. TPC was positively correlated with TFC, where both TPC and TFC were negatively correlated with EC and VWC. Additionally, proline was positively correlated with VWC. Most of the nutrients were positively correlated with each other.
Table 2. Pairwise correlation between measured parameters in experiment 1 cilantro. Agronomic parameters (biomass), phytochemical (TPC, TFC, proline), chlorophyll content, environmental (EC, VWC) parameters, and nutrient elements were correlated using JMP Pro software.
Salinity FW DW TPC TFC Proline Chl.-a Chl.-b Chl. a&b EC VWC N (%) P (%) K (%) Mg (%) Ca (%) S (%) B (ppm) Zn (ppm) Mn (ppm) Fe (ppm) Cu (ppm) Salinity 1 FW −0.434 1 DW −0.544 0.961 1 TPC −0.636 0.323 0.325 1 TFC −0.608 0.307 0.242 0.903 1 Proline 0.719 −0.301 −0.247 −0.402 −0.537 1 Chl. a 0.034 0.220 0.307 0.166 0.136 −0.115 1 Chl. b −0.267 0.130 0.105 0.214 0.254 −0.532 0.634 1 Chl. a & b 0.192 0.086 0.186 −0.025 −0.069 −0.006 0.920 0.646 1 EC 0.922 −0.426 −0.387 −0.775 −0.704 0.538 0.557 0.171 0.588 1 VWC 0.945 −0.369 −0.368 −0.853 −0.772 0.629 0.413 0.053 0.486 0.974 1 N (%) −0.138 0.314 0.381 0.019 −0.035 −0.082 −0.015 −0.009 0.057 −0.005 −0.006 1 P (%) 0.095 0.154 0.128 −0.133 0.013 −0.320 0.328 0.453 0.383 0.275 0.249 0.693 1 K (%) 0.274 −0.376 −0.360 −0.150 −0.069 −0.080 0.182 0.123 0.239 0.345 0.317 0.583 0.741 1 Mg (%) 0.414 −0.095 −0.112 −0.309 −0.296 0.605 0.117 −0.348 0.099 0.304 0.348 −0.410 −0.433 −0.364 1 Ca (%) −0.248 0.297 0.402 0.317 0.266 −0.201 0.227 0.014 −0.008 −0.153 −0.249 −0.204 −0.130 −0.386 0.346 1 S (%) 0.572 −0.069 −0.175 −0.319 −0.247 0.613 −0.174 −0.394 −0.174 0.439 0.523 −0.074 0.066 0.128 0.195 −0.040 1 B (ppm) −0.032 −0.019 0.144 0.353 0.187 0.094 −0.109 −0.385 −0.160 −0.056 −0.118 0.683 0.234 0.414 −0.309 −0.031 −0.002 1 Zn (ppm) 0.846 −0.266 −0.321 −0.537 −0.454 0.748 0.071 −0.257 0.110 0.712 0.790 0.001 0.157 0.186 0.225 −0.268 0.807 0.067 1 Mn (ppm) 0.855 −0.245 −0.273 −0.599 −0.540 0.743 0.042 −0.322 0.089 0.728 0.815 0.067 0.192 0.250 0.227 −0.258 0.791 0.116 0.983 1 Fe (ppm) 0.634 0.032 0.040 −0.550 −0.547 0.736 0.015 −0.343 −0.003 0.538 0.624 −0.150 −0.131 −0.246 0.382 0.104 0.768 −0.086 0.822 0.825 1 Cu (ppm) 0.880 −0.243 −0.205 −0.799 −0.750 0.545 0.415 0.062 0.456 0.955 0.963 0.150 0.374 0.363 0.209 −0.146 0.542 0.035 0.785 0.826 0.657 1 Bold and Italicized means Significant at p < 0.05; FW (fresh weight), DW (dry weight), TPC (Total phenolic content), TFC (Total flavonoid content), EC (Electrical conductivity), Chl. a (chlorophyll a), Chl. b (chlorophyll b), Chl. a & b (chlorophyll a and b), and VWC (Volumetric water content). Correlation analysis was also performed on cilantro in experiment 2 to investigate the relationship between salinity and measured parameters (Table 3). Salinity levels were negatively correlated with FW and DW, indicating that increases in salinity reduced biomass. Alternatively, salinity was positively correlated with proline, chl. b, EC, and VWC, and K, indicating stress responses. Both TPC and TFC were not significantly correlated in experiment 2, however they were negatively correlated in experiment 1. Interestingly, chl. b and chl. a & b were positively correlated with salinity in experiment 2, which was not seen in experiment 1. Furthermore, FW showed a negative correlation with proline, EC, and VWC, demonstrating the negative impacts of salinity on yields and physiological responses. Both VWC and EC showed negative correlations with TPC and TFC, while they were positively correlated with proline. Interestingly, macronutrients like Mn and Cu also showed negative correlations with TPC.
Table 3. Pairwise correlation between measured parameters in experiment 2 cilantro. Agronomic parameters (biomass), phytochemical (TPC, TFC, proline), chlorophyll content, environmental (EC, VWC) parameters, and nutrient elements were correlated using JMP Pro software.
Salinity FW DW TPC TFC Proline Chl.-a Chl.-b Chl. a&b EC VWC N (%) P (%) K (%) Mg (%) Ca (%) S (%) B (ppm) Zn (ppm) Mn (ppm) Fe (ppm) Cu (ppm) Salinity 1 FW −0.644 1 DW −0.510 0.957 1 TPC −0.043 −0.204 −0.208 1 TFC −0.306 0.266 0.385 0.363 1 Proline 0.827 −0.521 −0.412 −0.004 −0.282 1 Chl. a 0.470 −0.316 −0.295 −0.663 −0.428 0.298 1 Chl. b 0.523 −0.090 −0.004 0.158 −0.055 0.250 0.005 1 Chl. a & b 0.547 −0.283 −0.231 −0.545 −0.355 0.369 0.763 0.439 1 EC 0.958 −0.695 −0.547 0.105 −0.275 0.872 0.196 0.391 0.251 1 VWC 0.969 −0.698 −0.549 0.107 −0.291 0.861 0.181 0.438 0.258 0.996 1 N (%) 0.518 −0.364 −0.181 −0.150 0.150 0.340 0.225 0.130 0.150 0.442 0.476 1 P (%) 0.522 −0.351 −0.173 −0.099 0.107 0.422 0.158 0.023 0.071 0.483 0.503 0.928 1 K (%) 0.659 −0.391 −0.185 −0.145 0.027 0.627 0.125 0.150 0.116 0.614 0.640 0.871 0.864 1 Mg (%) 0.323 −0.545 −0.546 −0.207 −0.222 0.195 0.336 −0.301 0.202 0.268 0.257 0.335 0.517 0.165 1 Ca (%) −0.185 −0.083 −0.267 −0.475 −0.607 −0.239 0.430 −0.252 0.489 −0.273 −0.297 −0.501 −0.384 −0.574 0.422 1 S (%) −0.554 0.511 0.552 0.302 0.693 −0.542 −0.524 −0.066 −0.608 −0.532 −0.498 0.310 0.242 0.085 −0.177 −0.478 1 B (ppm) −0.615 0.570 0.550 −0.108 0.488 −0.555 0.105 −0.533 −0.148 −0.560 −0.605 −0.189 −0.069 −0.356 0.050 0.166 0.306 1 Zn (ppm) 0.748 −0.741 −0.606 −0.130 −0.157 0.602 0.150 0.109 0.146 0.716 0.729 0.685 0.758 0.725 0.657 −0.126 −0.170 −0.471 1 Mn (ppm) 0.830 −0.781 −0.648 −0.082 −0.224 0.694 0.161 0.159 0.171 0.809 0.818 0.573 0.662 0.661 0.636 −0.100 −0.320 −0.529 0.975 1 Fe (ppm) 0.625 −0.514 −0.390 −0.396 −0.264 0.411 0.476 0.068 0.449 0.458 0.495 0.824 0.825 0.714 0.615 −0.073 0.003 −0.287 0.737 0.686 1 Cu (ppm) 0.787 −0.603 −0.469 −0.398 −0.400 0.662 0.380 0.160 0.432 0.672 0.695 0.640 0.705 0.730 0.560 0.003 −0.278 −0.502 0.868 0.872 0.866 1 Bold and Italicized means Significant at p < 0.05; FW (fresh weight), DW (dry weight), TPC (Total phenolic content), TFC (Total flavonoid content), EC (Electrical conductivity), Chl-a (chlorophyll a), Chl-b (chlorophyll b), Chl a&b (chlorophyll a and b), and VWC (Volumetric water content). Pairwise correlation analyses were also performed across salinity level, phytochemicals, and element nutrients of experiment 1 parsley (Table 4). In parsley, salinity levels were positively correlated with proline, EC, VWC, Zn, and Cu, and negatively correlated with TPC, TFC, N, and B. This showed that proline, EC, VWC, Zn, and Cu increased as salinity levels rose, while TPC, TFC, N, and B decreased with increasing salinity levels. Both EC and VWC were negatively correlated with TPC and TFC, similarly to the cilantro experiments; however, they were positively correlated with proline. Furthermore, proline was positively correlated with Zn and Cu, while negatively correlated with N and B.
Table 4. Pairwise correlation between measured parameters in experiment 1 parsley. Agronomic parameters (biomass), phytochemical (TPC, TFC, proline), chlorophyll content, environmental (EC, VWC) parameters, and nutrient elements were correlated using JMP Pro software.
Salinity FW DW TPC TFC Proline Chl.-a Chl.-b Chl. a&b EC VWC N (%) P (%) K (%) Mg (%) Ca (%) S (%) B (ppm) Zn (ppm) Mn (ppm) Fe (ppm) Cu (ppm) Salinity 1 FW 0.100 1 DW −0.293 0.817 1 TPC −0.475 −0.251 −0.255 1 TFC −0.593 0.191 0.005 0.551 1 Proline 0.946 −0.182 −0.265 −0.483 −0.624 1 Chl. a −0.049 0.028 −0.192 0.314 −0.027 −0.136 1 Chl. b −0.014 0.164 0.020 0.000 −0.238 −0.111 0.747 1 Chl. a & b −0.050 0.080 −0.116 0.218 −0.108 −0.134 0.895 0.939 1 EC 0.813 0.178 0.150 −0.664 −0.765 0.764 0.029 0.464 0.296 1 VWC 0.829 0.332 0.226 −0.787 −0.672 0.747 −0.014 0.455 0.259 0.949 1 N (%) −0.653 0.334 0.409 0.364 0.272 −0.690 0.049 −0.071 −0.032 −0.438 −0.396 1 P (%) −0.098 0.168 −0.029 0.245 0.437 −0.273 −0.157 −0.289 −0.263 −0.425 −0.285 0.362 1 K (%) −0.145 −0.222 0.041 0.226 −0.380 −0.090 0.365 0.115 0.222 −0.017 −0.090 0.230 −0.159 1 Mg (%) 0.429 −0.439 −0.464 0.271 −0.231 0.437 −0.136 −0.144 −0.074 0.167 0.023 −0.188 0.365 0.003 1 Ca (%) 0.172 −0.300 −0.334 0.183 −0.120 0.251 −0.107 −0.142 −0.089 −0.056 −0.098 −0.113 0.332 0.306 0.668 1 S (%) −0.256 0.249 0.247 0.159 −0.106 −0.442 0.504 0.400 0.388 −0.026 −0.024 0.476 0.158 0.536 −0.196 −0.055 1 B (ppm) −0.729 0.187 0.145 0.360 0.362 −0.763 0.540 0.281 0.364 −0.465 −0.453 0.686 0.118 0.402 −0.391 −0.088 0.670 1 Zn (ppm) 0.871 0.097 0.063 −0.491 −0.716 0.735 0.023 0.315 0.198 0.861 0.848 −0.364 −0.015 0.122 0.398 0.107 0.113 −0.492 1 Mn (ppm) 0.494 −0.295 −0.270 −0.109 −0.090 0.492 −0.403 −0.427 −0.386 0.050 0.183 −0.264 0.300 −0.026 0.257 0.108 −0.361 −0.619 0.354 1 Fe (ppm) 0.181 −0.222 0.004 0.017 −0.162 0.196 −0.463 −0.407 −0.401 0.213 0.131 0.151 −0.057 −0.102 0.248 −0.339 −0.181 −0.396 0.284 0.433 1 Cu (ppm) 0.768 0.022 −0.208 −0.420 −0.333 0.647 −0.020 0.164 0.096 0.431 0.581 −0.321 0.379 0.004 0.348 0.270 0.030 −0.393 0.704 0.675 0.068 1 Bold and Italicized means Significant at p < 0.05; FW (fresh weight), DW (dry weight), TPC (Total phenolic content), TFC (Total flavonoid content), EC (Electrical conductivity), Chl. a (chlorophyll a), Chl. b (chlorophyll b), Chl. a & b (chlorophyll a and b), and VWC (Volumetric water content). Correlation analysis was also performed in experiment 2 parsley to investigate the relationship between salinity level and measured parameters (Table 5). Salinity levels were negatively correlated with FW, DW, N, and B, while positively correlated with proline, EC, VWC, Zn, Mn, Fe, and Cu. This shows that yield and nutritional status decreased as salinity increased, while higher salinity increased stress responses and increased uptake of transition metals. The significant effect of salinity was not seen in the second experiment, where a significant negative correlation was found between salinity and phytochemicals in experiment 1. Furthermore, EC and VWC showed positive correlation with proline and positive correlation with K. Specifically, proline increased with higher EC and VWC, while K declined.
Table 5. Pairwise correlation between measured parameters in experiment 2 parsley. Agronomic parameters (biomass), phytochemical (TPC, TFC, proline), chlorophyll content, environmental (EC, VWC) parameters, and nutrient elements were correlated using JMP Pro software.
Salinity FW DW TPC TFC Proline Chl.-a Chl.-b Chl. a&b EC VWC N (%) P (%) K (%) Mg (%) Ca (%) S (%) B (ppm) Zn (ppm) Mn (ppm) Fe (ppm) Cu (ppm) Salinity 1 FW −0.428 1 DW −0.353 0.938 1 TPC −0.145 0.164 0.129 1 TFC −0.334 −0.048 −0.118 0.398 1 Proline 0.835 −0.462 −0.400 −0.331 −0.364 1 Chl. a −0.220 0.010 −0.108 0.587 0.388 −0.282 1 Chl. b 0.339 0.033 0.161 −0.519 −0.526 0.316 −0.958 1 Chl. a & b 0.358 0.052 0.183 −0.496 −0.524 0.312 −0.947 0.998 1 EC 0.956 −0.377 −0.311 0.217 −0.166 0.865 −0.050 0.142 0.166 1 VWC 0.873 −0.047 0.018 0.251 −0.335 0.634 −0.021 0.193 0.230 0.881 1 N (%) 0.092 0.040 0.150 −0.430 −0.354 −0.047 −0.429 0.531 0.561 −0.095 0.161 1 P (%) 0.402 −0.174 −0.020 −0.418 −0.647 0.342 −0.501 0.651 0.671 0.237 0.360 0.775 1 K (%) −0.755 0.242 0.269 −0.317 0.023 −0.673 −0.212 0.164 0.157 −0.840 −0.705 0.488 0.154 1 Mg (%) −0.196 0.316 0.279 −0.340 −0.531 −0.371 −0.113 0.223 0.230 −0.296 0.018 0.509 0.418 0.370 1 Ca (%) −0.060 0.086 0.029 0.210 −0.295 −0.240 0.264 −0.153 −0.159 0.004 0.158 −0.027 0.183 −0.059 0.673 1 S (%) −0.397 −0.031 0.055 −0.221 0.090 −0.311 −0.340 0.291 0.293 −0.475 −0.445 0.446 0.211 0.803 0.216 −0.050 1 B (ppm) −0.437 −0.175 −0.124 −0.057 0.488 −0.238 −0.113 −0.055 −0.064 −0.398 −0.618 −0.036 −0.117 0.552 −0.140 −0.101 0.751 1 Zn (ppm) 0.818 −0.345 −0.242 −0.201 −0.416 0.658 −0.271 0.425 0.455 0.688 0.767 0.555 0.717 −0.422 0.160 0.047 −0.281 −0.503 1 Mn (ppm) 0.594 −0.479 −0.423 −0.030 −0.474 0.536 −0.137 0.261 0.257 0.591 0.514 0.085 0.573 −0.437 0.223 0.598 −0.242 −0.229 0.609 1 Fe (ppm) 0.595 −0.487 −0.424 −0.258 −0.562 0.552 −0.284 0.408 0.406 0.516 0.471 0.231 0.653 −0.326 0.395 0.572 −0.108 −0.186 0.666 0.942 1 Cu (ppm) 0.564 −0.026 0.098 −0.050 −0.483 0.391 −0.231 0.429 0.469 0.467 0.683 0.708 0.734 −0.093 0.175 −0.082 −0.065 −0.485 0.803 0.326 0.335 1 Bold and Italicized means Significant at p < 0.05; FW (fresh weight), DW (dry weight), TPC (Total phenolic content), TFC (Total flavonoid content), EC (Electrical conductivity), Chl. a (chlorophyll a), Chl. b (chlorophyll b), Chl. a & b (chlorophyll a and b), and VWC (Volumetric water content). -
Salinity is a major abiotic stress that has negative impacts on both fresh weight and dry weight of plants[24]. As salinity concentrations increase in soil, plants experience reduced growth and biomass accumulation due to various physiological disturbances[39]. In these experiments, average VWC and average soil EC increased with an increase in salinity. Plants at higher salinity stress were unable to take up water due to osmotic stress[30], which increased the volumetric water content at higher salinity treatment (Table 2). Plants' reduced ability to take up water, combined with ionic imbalance, caused reduced biomass at higher salinity treatments[40]. The fresh weight was decreased due to the low water uptake, and the dry weight was also reduced as there was low biomass accumulation due to negative physiological responses to salinity. As cilantro and parsley are distinctly different culinary herbs, higher salinity decreased the overall performance of each crop (Supplementary Figs S4 and S5). While parsley benefited from mild salinity stress, resulting in increased biomass at 1 dS/m, cilantro biomass was inversely proportional to salinity treatments. Similar results were found by Desire & Arslan[41], where 1 dS/m irrigated salinity water did not show any negative effect on fresh weight and plant height of parsley. However, the negative effects of salinity were visible when the salinity level went beyond 1.5 dS/m. Conversely, Brengi et al.[42] found that the fresh weight and dry weight of cilantro decreased when the salinity of irrigated water increased from 0.5 to 1.5 dS/m. These results indicate that parsley is more salt-tolerant compared to cilantro and likely has some distinct plant mechanisms[43] that improve plant growth at low salinity levels. Studies conducted by McFarland et al. & Álvaro et al.[44,45] showed that the threshold of decline due to salinity was 2 dS/m (Fig. 2). However, several other experiments have concluded that salinity levels higher than 1 dS/m decreased overall biomass in cilantro[33]. This was consistent in our study, where the negative effect of salinity was also observed in our experiment starting at 1dS/m salinity level (Fig. 1). However, mild salinity achieved through complex salts like potassium sulfate and magnesium nitrate increased the shoot fresh and dry weight of cilantro as compared to sodium chloride only[46]. This further illustrates that the salinity obtained through different salt types also affects the biomass accumulation in cilantro. This was evident in our study, where plants exposed to higher salinity showed increased VWC (Table 2). Moreover, Na competes with K for uptake into roots because K and Na ions are similar in size. This can lead to an imbalance of K and Na, which negatively impacts plants due to the toxic nature of Na to plants[47]. This was also evident in our study, where lower K content was found in plants irrigated at higher salinity levels (Table 4). However, not all cations in solution have toxic effects on plants, but the imbalance of solute potential may impact the osmotic status of plants, i.e., Mg ions in solution are not necessarily toxic to plants, but MgSO4 salts may affect plant water uptake due to effects on water potential[48].
Phytochemicals, proline, and chlorophyll
-
Salinity significantly influences the phytochemical production of culinary herbs, often altering the accumulation of beneficial compounds[15,42]. However, the hypothesis was rejected because the increase in salinity did not boost the phytochemical content in either herb, cilantro or parsley. In these experiments, high salinity rates (5 dS/m) reduced phenolics and flavonoids of cilantro and parsley. Although salinity can activate plant defense mechanisms and increase phytochemical production, this response is dependent upon species and salt tolerance thresholds[49]. Whenever plants experience biotic or abiotic stress up to a certain threshold, the defense mechanisms of plants are activated through increased antioxidants[50]. While some studies[33] report increased phenolic and flavonoid content in cilantro under NaCl stress, our findings are more aligned with those of Neffati et al.[51], showing a decline in these compounds with increased salinity. Furthermore, Amiripour et al.[52] found that the essential oils of cilantro were increased by 100 mM NaCl salinity and were reduced at 200 mM NaCl. These findings suggest that salinity may benefit phytochemical production only up to a species-specific threshold, beyond which physiological stress reduces plant function. Increasing salinity reduces photosynthesis, stomatal conductance, and evapotranspiration, limiting energy reserves that drive growth[46,35]. This often results in the reduced production of phytochemicals in plants[53]. This may further explain the reduced phytochemicals at higher levels of salinity, which were found in our study. Additionally, the type of salt used can also impact other plant compounds, such as ascorbic acid, in cilantro. Ahmadi & Souri[46] found that cilantro irrigated with a salt composition of potassium sulfate and magnesium nitrate had higher ascorbic acid content than NaCl salt. The use of complex salt solutions in our study may have contributed to reduced phytochemical levels in cilantro at higher salinity rates. Similar to cilantro, salinity can also influence the phytochemical composition of parsley. Salinity alters the physiochemical levels of plants by reducing the overall photosynthesis of plants[54]. However, plants have evolved different techniques to reduce the effect of salt stress, including increasing osmolytes like proline within the vacuole[55].
Proline accumulation is the biomarker for salinity stress before the visible symptoms occur in plants[56]. Higher proline accumulation helps plants maintain osmotic pressure within the cell, which is disrupted by salinity[43]. Our results showed a similar and proportional increase in proline with increased salinity. However, the magnitude of this increase varied greatly between species, with cilantro accumulating significantly more proline than parsley. This indicates that parsley was not under as much stress from salt solutions in comparison to cilantro, making it more tolerant to complex salts[56].
Salinity significantly decreases the chlorophyll content in crops due to reduced photosynthetic performance[56]. In this study, we did not find any significant difference in chlorophyll among the salinity-treated plants. In both experiments, similar content of chl. a & b, and total chlorophyll was found, which also implies that the overall content is the same across both experiments and species. Furthermore, salinity stress may not have begun to affect the chlorophyll composition of the leaves, which can be further evident by nutrient analysis of plants where most of the macronutrients remained unaffected by salinity (Tables 3, 4). While biomass and phytochemicals were affected, stunted growth, proline, and antioxidants are among the first parameters affected by salinity[33,47,48].
Regarding nutrients, several macro- and micro-nutrients were significantly affected by salinity across both herbs, although an equal amount of fertilizer was added in each experiment. Salinity induces a shift in nutrient availability and uptake because of the complex interaction of osmotic stress and ion-specific availability[30]. In these experiments, cilantro did not show any deficiency of macronutrients. This may be due to sufficient fertilizer concentrations throughout the growing period. However, parsley showed a reduced uptake of potassium in the second experiment. The reduced uptake of potassium in high salinity stress may be due to the high availability of sodium, as the presence of excessive sodium in the soil decreases the uptake of potassium due to cation competition[30]. While higher salinity has been found to lower the uptake of different micronutrients like zinc, manganese, and copper, this was not found to be the case in our experiments, where the majority of the micronutrients were increased at higher salinity rates. This may be due to the presence of micronutrients in the complex salt solutions, further indicating that complex salts may not have detrimental impacts on certain parameters of plants other than biomass and certain phytochemicals. Furthermore, the negative effects of the cationic nature of salts are more prevalent at higher electrical conductivity[57]. For example, cations such as Na, Ca, Mg, and K differ based on soil structure and nutrient dynamics[31]. Although some of these cations serve as an essential nutrient in plants, the amount of Na ions present in the salt reduces soil water potential and root water absorption[58]. Furthermore, higher nutrient concentrations were found in the first experiment across both herbs. This may be attributed to the slightly higher irrigation volume in the first experiment (3.25 L per pot in expt. 1 vs 2.75 L per pot in expt. 2), which added one extra watering event. Greater irrigation frequency might have triggered the greater biomass of herbs in the first experiment as compared to the second experiment.
With diminishing freshwater resources, the use of brackish or alternative water resources, which are often comprised of complex salts and nutrients, must be studied for their potential use in agriculture[59]. Due to the limited availability of studies that used complex salt solutions, it is difficult to determine the comparative impact of NaCl on complex salt solutions on plants. Our results show that complex salts most negatively affected cilantro biomass, while other physiological parameters were less impacted. This was different for parsley, which only started to show negative salinity impacts at 5 dS/m. While these experiments were conducted in identical conditions, the application of more irrigation water in the first experiment might be the reason for the variability between experiments. This indicates that slight variations in production practices might have a greater influence on growth factors and phytochemical production of herbs.
-
In this study, two distinct culinary herbs, cilantro and parsley, were treated with complex salt solutions at different concentrations. Phytochemicals like TPC, TFC, and proline, along with chlorophyll, were also quantified. The majority of measured parameters were negatively affected by salinity at higher rates, but the effect of salinity on growth and phytochemical content varies within each species. Both herbs' phytochemical content, specifically TPC and TFC, was reduced at higher salinity (5 dS/m). Therefore, when considering the use of complex salts to enhance phytochemical production, it should be done at a very low threshold level of salinity. However, this study only examined phytochemicals at the time of harvest. To further examine the progressive impacts of complex salts on phytochemicals, periodic analyses should be conducted to determine if there is an effect of salinity over time. Understanding how culinary herbs respond to different water sources can help us better prepare for the use of saline water or alternative water resources in the future. This study further validates the need for further research into crop-specific tolerance and threshold for complex salinity in different crops.
-
The authors confirm contributions to the paper as follows: study conception and design: Regmi A, Simpson C; data collection: Regmi A, Liu H; analysis and interpretation of results: Regmi A, Simpson C; draft manuscript preparation: Regmi A, Simpson C, Liu H, Slaughter L, Laza H, Moustaid-Moussa N. All authors reviewed the results and approved the final version of the manuscript.
-
The datasets generated during and/or analyzed during the current study are available from the corresponding author upon reasonable request.
-
The authors would like to thank the members of Urban Horticulture and Sustainability Lab for their assistance in this work.
-
The authors declare that they have no conflict of interest.
-
accompanies this paper online at: https://doi.org/10.48130/tihort-0026-0003.
- Supplementary Table S1 ANOVA table showing the P-values for measured parameters between experiments.
- Supplementary Table S2 Soil average electrical conductivity (EC) and volumetric water content (VWC) in cilantro and parsley in experiments 1 and 2.
- Supplementary Table S3 Plant nutrient analysis for macro and micronutrients in cilantro (Coriandrum sativum) for different salinity treatments.
- Supplementary Table S4 Plant nutrient analysis for macro- and micronutrients in parsley (Petroselium crispum) for different salinity treatments.
- Supplementary Fig. S1 Soil electrical conductivity (EC) in cilantro and parsley in experiments 1 and 2.
- Supplementary Fig. S2 Effect of salinity on chlorophyll a, chlorophyll b, and total chlorophyll (a+b) of cilantro in experiments 1 and 2.
- Supplementary Fig. S3 Effect of salinity on chlorophyll a, chlorophyll b, and total chlorophyll (chlorophyll a+b) of parsley in experiments 1 and 2.
- Supplementary Fig. S4 Experimental cilantro plants from Experiment 2.
- Supplementary Fig. S5 Experimental parsley plants from Experiment 2.
- Copyright: © 2026 by the author(s). Published by Maximum Academic Press, Fayetteville, GA. This article is an open access article distributed under Creative Commons Attribution License (CC BY 4.0), visit https://creativecommons.org/licenses/by/4.0/.
-
About this article
Cite this article
Regmi A, Liu H, Slaughter L, Laza H, Moustaid-Moussa N, et al. 2026. Effect of complex salt stress on physiology and phytochemical production of culinary herbs. Technology in Horticulture 6: e008 doi: 10.48130/tihort-0026-0003 

Effect of complex salt stress on physiology and phytochemical production of culinary herbs
- Received: 21 May 2025
- Revised: 06 February 2026
- Accepted: 25 February 2026
- Published online: 28 March 2026
Abstract: The interaction of stress and phytochemicals is complex yet offers huge potential to improve the nutritional quality of crops. Functional foods, like culinary herbs, are an important source of minerals, vitamins, fiber, and phytochemicals. Among the phytochemicals with beneficial properties found in culinary herbs are polyphenols. Stressors such as salinity affect the polyphenol production of culinary herbs. Yet, findings have varied and rely on pure sodium chloride solutions that do not reflect natural environments. To determine how culinary herbs are affected by complex salt solutions reflective of naturally occurring salts, we investigated these effects on the growth, yield, and polyphenol production of cilantro (Coriandrum sativum) and parsley (Petroselinum crispum). Two replicated experiments were conducted where a DI water control and three complex salt solutions (1, 3, and 5 dS/m) were applied to plants. Results showed that while both cilantro and parsley were negatively affected by high salinity, parsley was less affected by higher levels of complex salt solutions. Salinity level was the primary factor affecting phytochemical concentrations, where total phenolics and flavonoids decreased with increasing salinity. By contrast, proline increased with increasing salinity, indicating negative physiological impacts of salinity in plants. While findings varied across experiments and did not reach statistical significance, trends were similar across experiments. Overall, the higher salinity level (5 dS/m) caused the most negative impacts on the physiology of both cilantro and parsley. However, parsley showed higher tolerance to complex salt solutions than cilantro, determining the variable effect and complexity of salinity on each plant species.
-
Key words:
- Complex salt stress /
- Physiology /
- Phytochemical production /
- Culinary herbs /
- Cilantro /
- Parsley