


-
Cherry tomato (Solanum lycopersicum var. cerasiforme) is among the fastest-growing specialty tomato products in protected horticulture, driven by consumer preference for strong flavor, nutritional value, and antioxidant potential[1−3]. In parallel, soilless cultivation (hydroponics and substrate-based systems) has been increasingly adopted to alleviate soil-borne constraints and to improve resource-use efficiency and product consistency. Comparative studies have reported advantages in water-use efficiency and carotenoid-related quality attributes under hydroponic production[3,4]. However, because soilless systems depend almost entirely on a nutrient solution as the mineral source, nutrient-solution composition and its management become primary determinants of yield formation and fruit quality[5,6].
In commercial practice, 'general-purpose' tomato nutrient solutions developed decades ago are still widely used. However, rapid cultivar replacement and advances in protected production have altered nutrient requirements and shifted the balance between yield and fruit quality[7−9]. In recirculating or semi-closed soilless systems, nutrient composition may also deviate from the target ionic profile because of differential uptake and accumulation, thereby increasing the risk of nutrient imbalance and unstable yield or quality if nutrient solutions are not adjusted in a cultivar- and system-specific manner[4,5,10] In addition, recent greenhouse studies have shown that high yield and high fruit quality depend on coordinated management rather than on adjustment of a single factor[7,9,11−13].
Among macronutrients, nitrogen (N), phosphorus (P), and potassium (K) are central to tomato growth, fruit development, and source–sink regulation[12,14]. Excessive N is often associated with vigorous vegetative growth and may compromise fruit sensory traits, whereas adequate P supports root development and reproductive processes[15,16]. Potassium plays particularly important roles in osmotic regulation, enzyme activation and phloem transport of photoassimilates, and many studies link improved K nutrition to higher total soluble solids (TSS) and enhanced flavor-related metabolite profiles in tomato fruit[17−22]. Furthermore, manipulating ionic ratios in nutrient solutions (e.g., K : Ca) can modify mineral composition and quality attributes of cherry tomato, and targeted K management has also been explored for producing low-K cherry-type tomato fruit for special dietary needs[2,23]. Transcriptomic and metabolomic studies further indicate that cultivation mode and nutrient solution type can influence fruit quality formation pathways[24−26]. Together, these findings support the need for targeted optimization of macronutrient supply in soilless cherry tomato production.
Despite these advances, many nutrient-management studies in greenhouse tomato production still rely on one-factor-at-a-time gradients, stage-based heuristics, or water–fertilizer coupling strategies[11−13,27−29]. Recent work on hydroponic nutrient management emphasizes the need for systematic strategies to improve nutrient and water use efficiency and to mitigate nutrient imbalance in soilless systems[4−6,10]. Response surface methodology (RSM), coupled with statistically efficient experimental designs such as central composite design (CCD), provides an effective framework to quantify main, quadratic, and interaction effects, and to locate optima within a defined factor space with manageable experimental workloads[30−34]. This approach has been increasingly applied in hydroponic nutrient formulation and protected horticulture[30,35].
Therefore, the objectives of this study were to; (1) quantify the individual and interactive effects of N, P (expressed as P2O5) and K (expressed as K2O) in nutrient solutions on cherry tomato yield and key quality performance (with TSS as a primary indicator) under soilless cultivation; (2) construct quadratic regression models using CCD within RSM to identify dominant factors and interaction patterns; and (3) derive and validate a balanced, high-performance macronutrient formulation (TB) that can simultaneously enhance yield and sweetness relative to a widely used control recipe. Collectively, this work aims to provide both methodological support and practical guidance for high-efficiency, high-quality cherry tomato production in modern protected horticulture[4−6,8].
-
The experiment was conducted in a solar greenhouse at the Shandong Agricultural University (Taian, China). Cherry tomato cultivar ‘Luxiaofan No. 1' was used. Seeds were disinfected in warm water (50 °C) for 15–20 min with gentle stirring, rinsed with clean water, and germinated on moist filter paper. After emergence, seedlings were transplanted into seedling trays containing a commercialized nursery substrate developed by Shandong Agricultural University (organic matter ≥ 40%; pH 5.8–6.5; electrical conductivity 1.0–1.5 mS cm−1). When seedlings reached the three-leaf stage, uniform plants were transplanted into cultivation pots (one plant per pot) filled with the same substrate. Standard greenhouse management practices (training, pruning, pest control, and ventilation) were applied uniformly across treatments.
Experimental design
CCD–RSM optimization experiment
-
To quantify the individual and interactive effects of N, P2O5, and K2O in nutrient solution and to optimize their ratios, a three-factor, five-level central composite design (CCD) was employed. The factor ranges were determined with reference to the Yamazaki tomato nutrient solution used as the baseline in this study, together with published studies on N, P, and K management in greenhouse and soilless tomato production[4−6,14−18,23]. The selected levels were designed to cover suboptimal, near-standard, and relatively high nutrient supply conditions within a biologically meaningful range suitable for response-surface optimization[30,35]. In the RSM analysis, TSS was selected as the primary quality response because it is a widely used and agronomically practical indicator of cherry tomato eating quality, particularly sweetness-related performance, and is highly responsive to nutrient-solution management[17−23]. Given the limited number of CCD runs, using TSS as a representative quality variable also helped maintain a parsimonious and interpretable optimization framework. Other fruit-quality traits, including soluble sugars, organic acids, lycopene, and vitamin C, were measured to provide a broader evaluation of quality and to verify whether the optimized formulations improved additional sensory and nutrition-related attributes. The coded levels and corresponding actual concentrations are shown in Table 1, and the 17 treatment combinations (including factorial points, axial points, and replicated center points) are presented in Table 2.
Table 1. Factor levels and coded values used in the central composite design (CCD).
Coded level N (mg L−1) P2O5 (mg L−1) K2O (mg L−1) +α 350 170 400 1 290 120 315 0 180 70 207.5 −1 70 20 100 −α 50 10 80 Table 2. Nutrient-solution compositions (Yamazaki-based) used in the CCD optimization experiment.
Run type Factorial point Center point Axial point Treatment (mg L−1) 1 2 3 4 5 6 7 8 9 10 11 12 13 14 15 16 17 N 70 70 70 70 290 290 290 290 180 180 180 70 290 180 180 180 180 P2O5 20 20 120 120 20 20 120 120 70 70 70 70 70 20 120 70 70 K2O 100 315 100 315 100 315 100 315 207.5 207.5 207.5 207.5 207.5 207.5 207.5 100 315 Validation experiment
-
To validate the optimized formulations derived from the CCD–RSM models, an independent pot experiment was conducted after completion of the optimization trial. Three treatments were compared: TB (the globally optimized formulation considering yield and fruit quality: N 290, P2O5 120, and K2O 315 mg L−1), TQ (quality-optimized formulation predicted to maximize TSS in the model), and CK (control, Yamazaki formula). Each treatment included 30 pots arranged in a completely randomized design, with three replicates (10 pots per replicate). Except for nutrient solution composition, irrigation amount, environmental conditions, and agronomic management were identical among treatments. Plant growth and physiological traits, single-plant yield, and fruit quality indices were measured at the red-ripe stage to compare the performance of TB and TQ.
Measurements
Plant growth and physiological traits
-
Measurements were taken at the peak vegetative stage and at the red-ripe stage. For each replicate, 10 plants were assessed. Relative chlorophyll content was measured using a SPAD-502 meter (Konica Minolta, Japan) on the 4th to the 5th fully expanded leaves from the apex; 10 readings per leaf were taken, excluding the midrib, and averaged. Plant height was measured from the stem base to the growing point using a measuring tape. Stem diameter was measured 1 cm above the cotyledon node using a digital caliper.
Yield and fruit quality
-
Fruit quality indices, including total soluble solids, vitamin C, soluble sugars, titratable acidity, and lycopene, were determined using standard methods, with measurements performed on 10 plants per replicate unless otherwise specified.
Statistical analysis
-
The CCD–RSM models were fitted using quadratic polynomial regression in Design-Expert 13. Analysis of variance (ANOVA) was used to evaluate model significance, lack-of-fit, and the significance of linear, quadratic, and interaction terms. Model adequacy was assessed using R2, adjusted R2, coefficient of variation (CV), and lack-of-fit statistics. In addition, residual diagnostics provided by the software, including normal probability plots and plots of residuals vs. predicted values, were examined to assess whether the assumptions of normality and constant variance were reasonably satisfied. For the validation experiment, one-way ANOVA followed by multiple comparisons at p < 0.05 was used to compare treatments. Data are presented as mean ± standard deviation unless stated otherwise.
-
Across the 17 CCD treatments, single-plant yield ranged from 1,216 ± 137 to 2,090 ± 152 g plant−1 (Table 3). Notably, several high-yield treatments also maintained relatively strong quality performance, suggesting that yield improvement did not necessarily require a quality penalty within the factor space explored.
Table 3. Yield and fruit-quality responses of cherry tomato under different nutrient-solution treatments in the CCD experiment.
Run Yield (g plant−1) Sugar/acid ratio Lycopene
(mg 100 g−1)Soluble sugars
(mg 100 g−1)Total soluble
solids (°Brix)Vitamin C
(mg 100 g−1)Citric acid
(mg g-−1)Titratable acidity 1 1,216 ± 137 8.5 ± 0.17 3.2 ± 1.47 52 ± 1.38 5.1 ± 0.26 17.5 ± 1.12 2.1 ± 0.14 2.8 ± 0.25 2 1,634 ± 109 12.5 ± 0.25 5.8 ± 2.14 62 ± 2.05 6.3 ± 0.38 18.5 ± 1.63 2.5 ± 0.16 3 ± 0.30 3 1,292 ± 165 9 ± 0.25 4.5 ± 2.91 54 ± 2.61 5.4 ± 0.33 17.8 ± 1.47 2.2 ± 0.15 2.9 ± 0.28 4 1,862 ± 151 15.2 ± 0.33 7.2 ± 1.44 68 ± 1.92 6.9 ± 0.41 19 ± 1.81 2.6 ± 0.17 3.4 ± 0.37 5 1,406 ± 204 10.5 ± 0.22 3.8 ± 3.32 55 ± 3.36 5.6 ± 0.34 18 ± 1.44 2.4 ± 0.17 3 ± 0.30 6 1,938 ± 114 16.5 ± 0.32 8.5 ± 1.55 78 ± 1.59 7.7 ± 0.54 20.2 ± 2.14 2.7 ± 0.22 3.6 ± 0.45 7 1,140 ± 107 7.6 ± 0.29 3.5 ± 3.20 50 ± 3.35 4.9 ± 0.27 17 ± 1.19 2 ± 0.13 2.7 ± 0.24 8 2,090 ± 152 15.8 ± 0.28 7.8 ± 1.92 74 ± 1.60 7.4 ± 0.52 19.5 ± 2.04 2.85 ± 0.24 3.8 ± 0.49 9 1,786 ± 236 15.2 ± 0.36 6.5 ± 2.28 66 ± 2.63 6.6 ± 0.46 19 ± 1.71 2.6 ± 0.19 3.4 ± 0.39 10 1,808 ± 192 15.5 ± 0.32 6.6 ± 2.26 67 ± 2.36 6.7 ± 0.41 19.1 ± 1.86 2.62 ± 0.20 3.4 ± 0.41 11 1,763 ± 109 14.9 ± 0.28 6.3 ± 3.44 65 ± 3.90 6.4 ± 0.38 18.9 ± 1.70 2.58 ± 0.19 3.3 ± 0.38 12 1,520 ± 184 11 ± 0.24 4.8 ± 1.31 58 ± 1.35 5.7 ± 0.31 18.2 ± 1.28 2.3 ± 0.16 3.1 ± 0.31 13 1,900 ± 167 16.2 ± 0.28 7.5 ± 4.18 72 ± 3.70 7.3 ± 0.51 19.6 ± 2.06 2.72 ± 0.23 3.6 ± 0.47 14 1,672 ± 195 13.5 ± 0.30 5.5 ± 1.94 61 ± 1.83 6 ± 0.36 18.5 ± 1.57 2.5 ± 0.18 3.2 ± 0.35 15 1,862 ± 183 16.8 ± 0.36 8.2 ± 2.70 76 ± 2.72 7.6 ± 0.53 19.8 ± 2.08 2.68 ± 0.23 3.7 ± 0.48 16 1,254 ± 177 9.5 ± 0.22 3.6 ± 1.43 53 ± 1.74 5.2 ± 0.26 17.6 ± 1.23 2.15 ± 0.15 2.9 ± 0.26 17 1,884 ± 102 17 ± 0.28 8 ± 3.43 75 ± 3.18 7.5 ± 0.53 20 ± 2.10 2.75 ± 0.24 3.7 ± 0.48 Treatment 8 achieved the highest yield (2,090 ± 152 g plant−1) together with comparatively high quality indices (sugar–acid ratio 15.8 ± 0.28, TSS 7.4 ± 0.52 °Brix, vitamin C 19.5 ± 2.04 mg 100 g−1, and lycopene 7.8 ± 1.92 mg 100 g−1; Table 3). In contrast, treatment 6 delivered the best overall quality among CCD runs, with the highest TSS (7.7 ± 0.54 °Brix), lycopene (8.5 ± 1.55 mg 100 g−1), soluble sugars (78 ± 1.59 mg 100 g−1), and vitamin C (20.2 ± 2.14 mg 100 g−1), while still maintaining high yield (1,938 ± 114 g plant−1) (Table 3). Treatments 6 and 8 both showed relatively high yield and quality values within the tested range (Table 3).
Quadratic models fitted by CCD–RSM captured these responses with high adequacy (Table 4). For yield, the model was highly significant (F = 23.19, p = 0.0002) with R2 = 0.9676 and a non-significant lack-of-fit (p = 0.0568), indicating good model fit within the tested factor range. For soluble solids, model significance (F = 5.56, p = 0.0171) and non-significant lack-of-fit (p = 0.0656) similarly support response-surface interpretation, although the lower Adj R2 (0.7193) suggests that TSS is influenced by additional sources of variability beyond the three macronutrient factors alone (Table 4), reinforcing the value of subsequent independent validation.
Table 4. ANOVA for the quadratic regression models of single-plant yield and total soluble solids.
Source df Yield Soluble solids F-value p-value F-value p-value Model 9 23.19 0.0002** 5.56 0.0171* A-(N) 1 14.42 0.0067** 4.92 0.0621 ns B-(P) 1 2.31 0.1726 ns 0.9 0.3735 ns C-(K) 1 153.5 < 0.0001** 37.01 0.0005** AB 1 3.49 0.1040 ns 1.81 0.2202 ns AC 1 4.87 0.0630 ns 1.81 0.2202 ns BC 1 6.49 0.0383* 0.25 0.6351 ns A² 1 0.59 0.4669 ns 0.46 0.5202 ns B² 1 0.17 0.6941 ns 0.09 0.7676 ns C² 1 13.59 0.0078** 1.37 0.2807 ns Residual 7 Lack of fit 5 16.91 0.0568 ns 14.54 0.0656 ns Pure error 2 R² 0.9676 0.8772 R² adj R² 0.9258 0.7193 CV% 4.8 7.83 ** indicates p < 0.01; * indicates p < 0.05; ns indicates not significant. Factor effects consistently highlighted K2O as the dominant driver (Tables 4, 5). For yield, K2O showed the largest positive linear coefficient (+ 310) and the strongest statistical effect (F = 153.50, p < 0.0001), followed by N (F = 14.42, p = 0.0067; coefficient + 95), whereas P2O5 alone was not significant (p = 0.1726; coefficient + 38). K2O showed the largest positive linear coefficient (+ 310) and the strongest statistical effect, whereas P2O5 alone was not significant (Tables 4, 5). Importantly, a significant P2O5 × K2O interaction was detected (BC: F = 6.49, p = 0.0383; coefficient + 71.25), meaning that the contribution of P2O5 to yield depended on the K2O level. A significant P2O5 × K2O interaction was detected (BC: F = 6.49, p = 0.0383; coefficient + 71.25), indicating that the effect of P2O5 on yield varied with the K2O level.
Table 5. Estimated regression coefficients and significance tests for the yield and total soluble solids models.
Term Yield model Soluble solids model Coefficient Std error p-value Coefficient Std error p-value Intercept 1,763.68 33.86 < 0.0001** 6.65 0.21 < 0.0001** A-(N) 95 25.02 0.0067** 0.35 0.16 0.0621 ns B-(P) 38 25.02 0.1726 ns 0.15 0.16 0.3735 ns C-(K) 310 25.02 < 0.0001** 0.96 0.16 0.0005** AB −52.25 27.97 0.1040 ns −0.24 0.18 0.2202 ns AC 61.75 27.97 0.0630 ns 0.24 0.18 0.2202 ns BC 71.25 27.97 0.0383* 0.09 0.18 0.6351 ns A² −37.18 48.34 0.4669 ns −0.21 0.3 0.5202 ns B² 19.82 48.34 0.6941 ns 0.09 0.3 0.7676 ns C² −178.18 48.34 0.0078** −0.36 0.3 0.2807 ns ** indicates p < 0.01; * indicates p < 0.05; ns indicates not significant. The yield response also exhibited pronounced curvature to K2O (C2: F = 13.59, p = 0.0078; coefficient −178.18), indicating an optimum window rather than monotonic gain. Practically, this curvature is crucial for formulation robustness: it suggests that pushing K2O beyond the optimum region may reduce yield, and thus should be avoided in production-scale recipes. For soluble solids, K2O was the only factor with a highly significant positive main effect (F = 37.01, p = 0.0005; coefficient + 0.96), confirming that quality improvement in this dataset was primarily K-driven within the explored nutrient ranges (Tables 4, 5). This provides a direct quantitative rationale for using K-centric strategies to elevate sweetness-related traits without relying on large shifts in N or P2O5.
Response-surface features and practical implications of interactions
-
Response surfaces (Figs. 1, 2) further clarified how interactions shaped the location and breadth of the optimum region. For yield (Fig. 1), increasing K2O and N promoted yield up to an intermediate–high region, followed by a decline at higher K2O, consistent with the significant negative quadratic term of K2O (Tables 4, 5). The surface topology therefore indicates that both 'insufficient' and 'excessive' K2O can be yield-limiting, which is especially relevant for growers who tend to increase K in pursuit of sweetness.
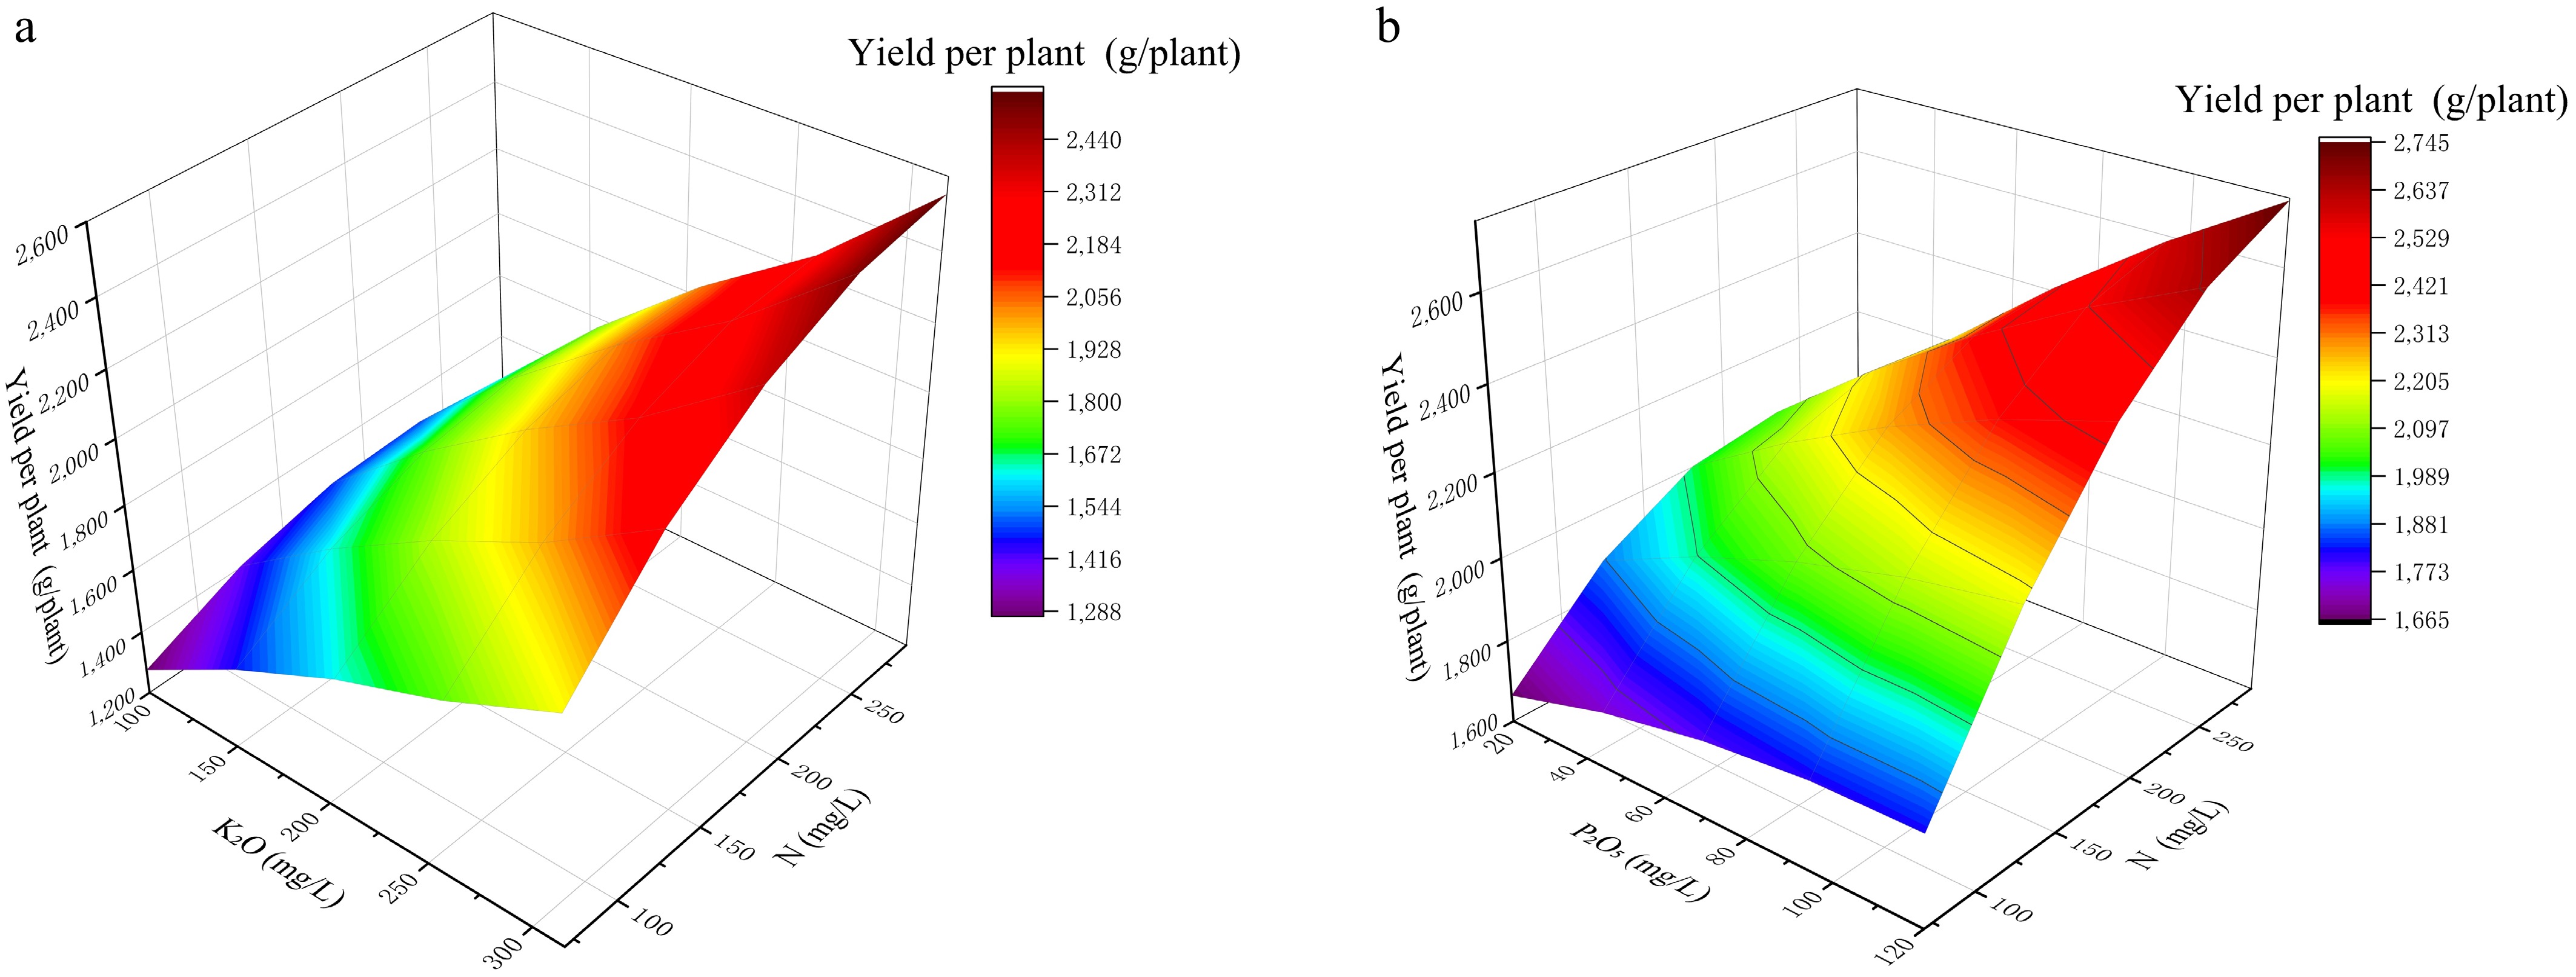
Figure 1.
Response surfaces showing the effects of N × K2O and N × P2O5 interactions on single-plant yield. (a) Response surface of N and P interaction on yield per plant at a fixed K level of 315 mg L−1. (b) Response surface of N and K interaction on yield per plant at a fixed P level of 120 mg L−1.
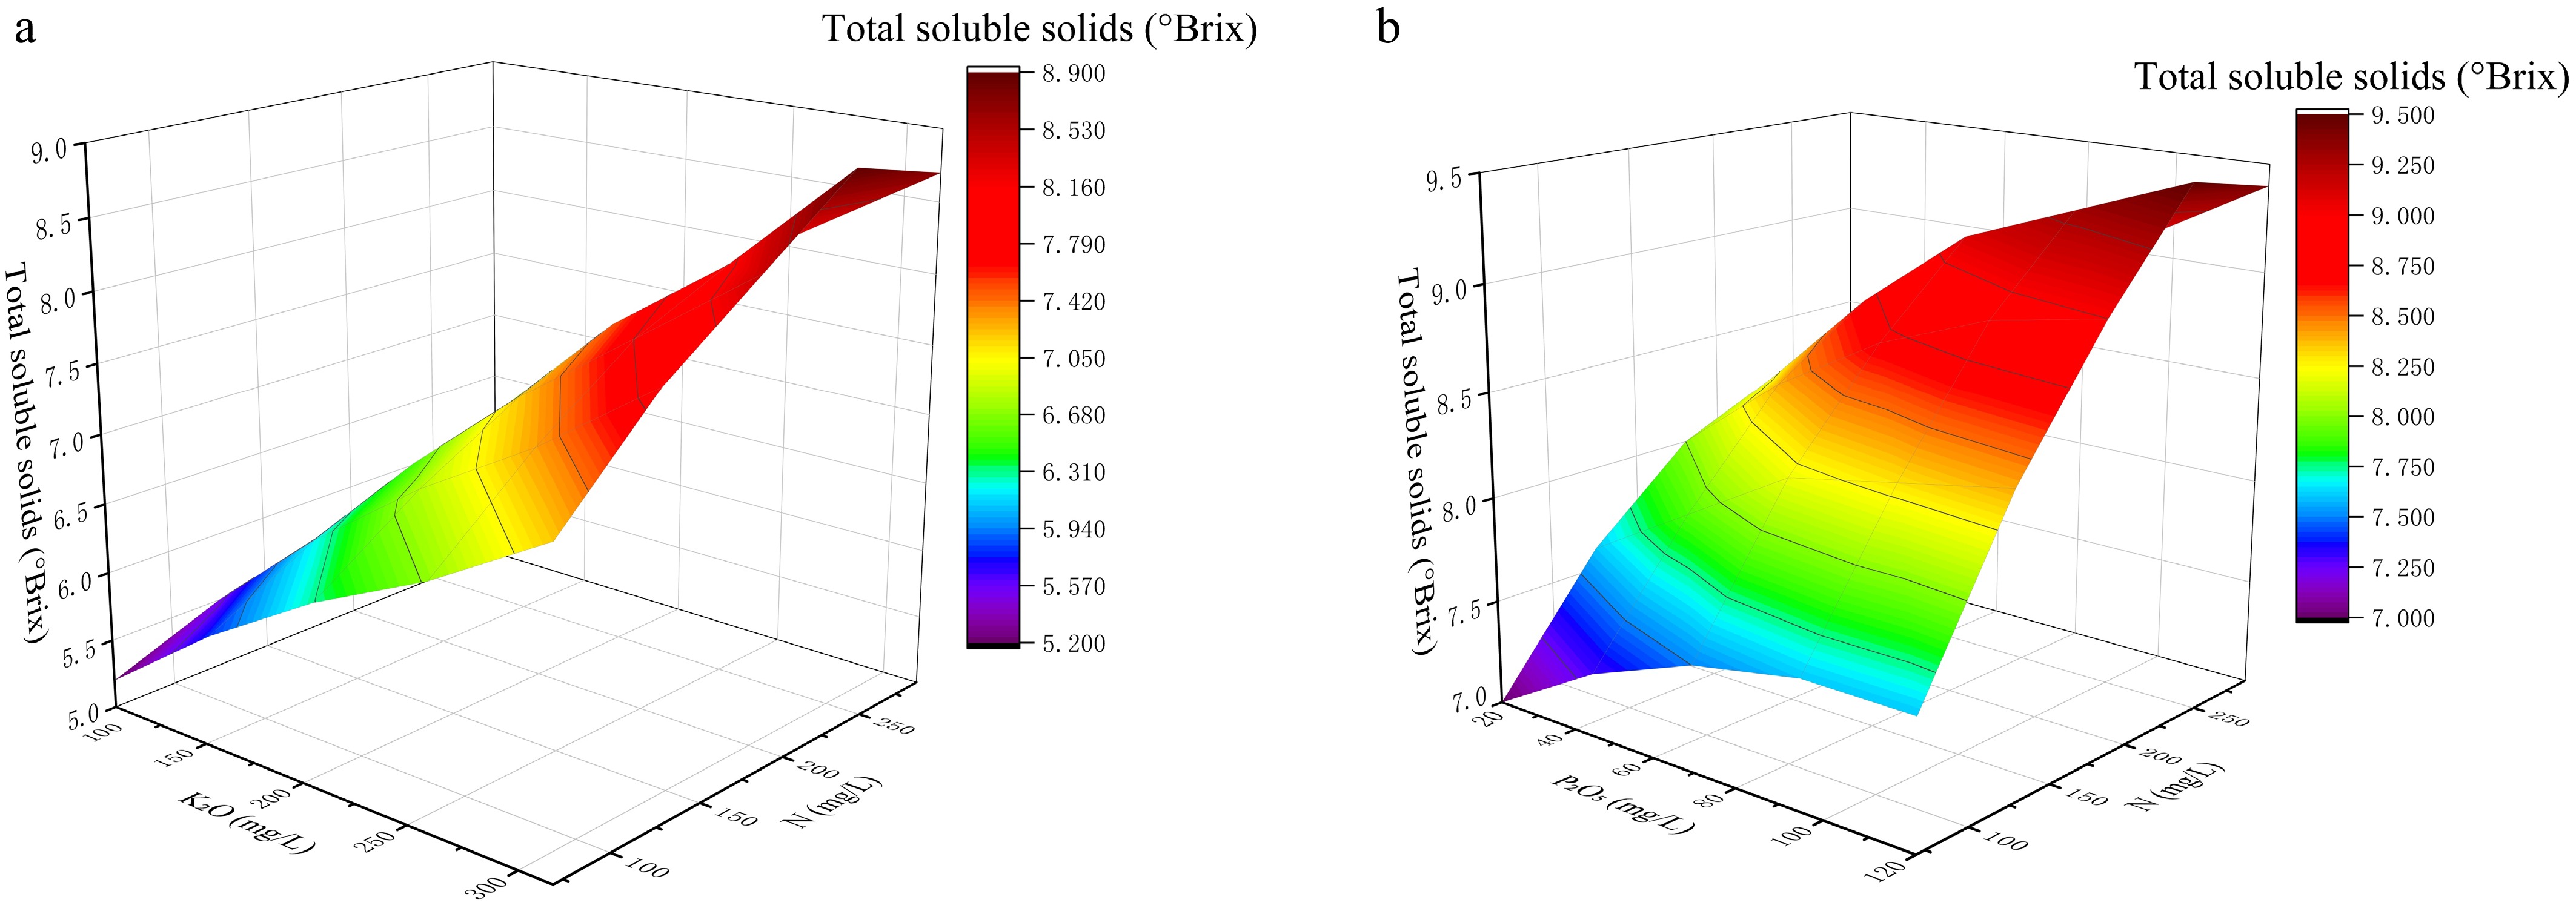
Figure 2.
Response surfaces showing the effects of N × K2O and N × P2O5 interactions on total soluble solids.(a) Response surface of N and P2O5 for TSS at a fixed K2O level of 315 mg L−1. (b) Response surface of N and K interaction to soluble solids content when P level is fixed at 120 mg L−1.
When K2O was fixed at 315 mg L−1, the N–P2O5 surface exhibited a pronounced peak (Fig. 1a), aligning with the significant P2O5 × K2O interaction (Table 4). In practical terms, this pattern suggests that P2O5 adjustment is most effective when K2O is already at a supportive level, and it also helps explain why some traditional formulas that raise P without sufficient K may fail to achieve expected yield responses. When P2O5 was fixed at 120 mg L−1, the N–K2O surface showed an optimum ridge (Fig. 1b), indicating that the yield-maximizing region is not a single point but a narrow band, which is advantageous for recipe design because it implies tolerance to small deviations around the optimum.
For soluble solids (Fig. 2), both response surfaces showed a clear increase in TSS with increasing K2O, whereas the gradients associated with N and P2O5 were relatively weaker. When K2O was fixed at 315 mg L−1, variation in N and P2O5 produced only moderate changes in TSS, indicating limited sensitivity of this trait to these two factors within the tested range (Fig. 2a). When P2O5 was fixed at 120 mg L−1, the surface rose more clearly along the K2O axis, confirming that K2O was the dominant driver of sweetness-related quality in the present dataset. (Fig. 2b) This feature is agronomically meaningful because it indicates a relatively direct lever for sweetness-related improvement. At the same time, the flatter response to N and P2O5 suggests that large changes in these two nutrients may provide only limited gains in TSS and could introduce unnecessary risks to vegetative–reproductive balance, supporting the rationale for prioritizing K2O optimization.
Independent validation of model-optimized nutrient solutions
-
An independent validation trial compared TB (comprehensive optimum for yield and quality), TQ (quality optimum), and CK (Yamazaki control). The validation results evaluate not only whether the optima are repeatable, but also whether the chosen recipe improves performance in a way that is agronomically meaningful and quality-relevant (Tables 6−8).
Table 6. Effects of model-derived nutrient solutions on cherry tomato growth and yield in the validation experiment.
Growth stage Treatment Plant height (cm) Stem diameter (mm) Leaf number Total dry mass (g) SPAD Yield (g plant−1) Seedling vigor index Seedling stage TQ 34.77 ± 2.68b 4.82 ± 0.23b 8.50 ± 0.22b 1.85 ± 0.12b 33.14 ± 0.51b − 0.23 ± 0.10b CK 35.05 ± 2.88b 4.95 ± 0.15b 9.25 ± 0.42ab 1.98 ± 0.24b 34.19 ± 0.22b − 0.29 ± 0.04ab TB 38.90 ± 1.26a 5.11 ± 0.18a 9.55 ± 0.25a 2.25 ± 0.17a 35.62 ± 0.35a − 0.33 ± 0.02a Harvest stage TQ 124.88 ± 2.14b 10.51 ± 0.29 b 18.68 ± 0.58b 153.43 ± 6.52b 43.26 ± 2.15b 1,850 ± 45b − CK 126.13 ± 2.55b 10.60 ± 0.17b 18.70 ± 0.46b 158.08 ± 3.55b 44.54 ± 1.67b 1,811 ± 52b − TB 131.25 ± 1.47a 10.94 ± 0.30a 19.50 ± 0.32a 160.91 ± 3.89a 48.88 ± 2.14a 2,022 ± 42a − Different lowercase letters within a column indicate significant differences among treatments (Duncan's multiple range test, p < 0.05); '−' indicates not measured. Table 7. N, P, and K contents and uptakes in different organs of cherry tomato under different nutrient-solution treatments.
Leaf Stem Fruit Root N P K N P K N P K N P K Content (g kg−1) TQ 31.63 ±
0.14c4.89 ±
0.12b49.65 ±
0.93b20.47 ±
0.22b6.62 ±
0.18b31.17 ±
0.54b19.76 ±
0.35b5.05 ±
0.06b37.15 ±
0.46b19.50 ±
0.50b6.80 ±
0.30b29.5 ±
1.00aCK 32.66 ±
0.22b5.11 ±
0.16a50.12 ±
0.52b21.18 ±
0.67a6.72 ±
0.22ab32.17 ±
0.56a20.25 ±
0.25b5.06 ±
0.08b37.52 ±
0.24b20.20 ±
0.40a7.00 ±
0.20ab30.5 ±
0.80aTB 33.51 ±
0.32a5.25 ±
0.14a52.15 ±
1.30a21.97 ±
0.36a6.88 ±
0.42a33.55 ±
0.23a21.55 ±
0.16a5.16 ±
0.06a38.14 ±
0.27a21.00 ±
0.60a7.30 ±
0.40a31.5 ±
1.20aUptake (mg plant−1) TQ 1.77 ±
0.11b0.29 ±
0.11b3.18 ±
0.18b0.68 ±
0.10b0.21 ±
0.02b0.97 ±
0.06b1.09 ±
0.09b0.28 ±
0.11b2.00 ±
0.10b0.52 ±
0.05b0.18 ±
0.02b0.78 ±
0.06bCK 1.89 ±
0.12b0.32 ±
0.13ab3.32 ±
0.22ab0.71 ±
0.06b0.23 ±
0.02ab1.01 ±
0.02ab1.12 ±
0.10b0.29 ±
0.06b2.03 ±
0.20b0.58 ±
0.04b0.20 ±
0.02b0.87 ±
0.05bTB 2.22 ±
0.15a0.36 ±
0.13a3.45 ±
0.17a0.81 ±
0.08a0.28 ±
0.02a1.10 ±
0.05a1.18 ±
0.04a0.32 ±
0.03a2.11 ±
0.15a0.65 ±
0.06a0.23 ±
0.03a0.97 ±
0.08aDifferent lowercase letters within a column indicate significant differences among treatments (Duncan's multiple range test, p < 0.05). TQ, quality-optimized formulation; CK, Yamazaki formula (control); TB, comprehensive optimum (yield + quality). Table 8. Fruit quality of cherry tomato under different nutrient-solution treatments in the validation experiment.
Treatment Firmness
(kg cm−2)Total soluble
solids (°Brix)Soluble total sugars
(mg 100 g−1)Citric acid
(mg g−1)Malic acid
(mg g−1)Lycopene
(mg 100 g−1)Sugar/acid ratio Vitamin C
(mg 100 g−1)TQ 5.25 ± 0.35b 7.65 ± 0.28a 78.50 ± 2.20a 2.65 ± 0.45a 0.61 ± 0.15b 8.08 ± 1.68a 16.5 ± 0.24a 22.5 ± 0.85a CK 5.18 ± 0.45b 6.67 ± 0.39b 70.14 ± 1.78b 2.05 ± 0.03b 0.64 ± 0.11b 7.15 ± 1.56b 15.2 ± 0.22b 18.7 ± 0.89b TB 5.71 ± 0.31a 7.48 ± 0.32a 76.80 ± 2.05a 2.60 ± 0.25a 0.75 ± 0.17a 8.25 ± 2.88a 16.0 ± 0.18a 23.0 ± 0.82a Different lowercase letters within a column indicate significant differences among treatments (Duncan's multiple range test, p < 0.05). Plant growth and yield: persistence of the TB advantage
-
TB consistently enhanced plant vigor across stages (Table 6). At the seedling stage, TB produced significantly higher plant height (38.90 ± 1.26 cm), stem diameter (5.11 ± 0.18 mm), leaf number (9.55 ± 0.25), total dry mass (2.25 ± 0.17 g), SPAD (35.62 ± 0.35), and seedling vigor index (0.33 ± 0.02) than CK and TQ (different letters; Table 6). These early advantages are important because they indicate that the formulation improved establishment and leaf functional status, which can propagate into greater assimilate supply later in the cycle.
At harvest, TB maintained the highest plant height (131.25 ± 1.47 cm), stem diameter (10.94 ± 0.30 mm), leaf number (19.50 ± 0.32), total dry mass (160.91 ± 3.89 g), and SPAD (48.88 ± 2.14) (Table 6), confirming that the growth benefit was not transient. Ultimately, TB achieved the highest yield (2,022 ± 42 g plant−1), significantly exceeding TQ (1,850 ± 45 g plant−1) and CK (1,811 ± 52 g plant−1), corresponding to + 11.7% vs. CK and + 9.3% vs. TQ (Table 6). The yield gain coupled with sustained vegetative status suggests that TB improved overall plant production capacity rather than merely shifting allocation within a fixed biomass budget.
Nutrient status and uptake: quantitative evidence for improved nutrient acquisition
-
TB significantly increased nutrient contents and uptake across organs (Table 7), providing quantitative evidence that the growth and yield benefits were accompanied by improved nutrient acquisition and accumulation. For tissue contents, TB increased leaf N (33.51 ± 0.32 g kg−1) and leaf K (52.15 ± 1.30 g kg−1) relative to CK and TQ, and also increased stem K (33.55 ± 0.23 g kg−1) and fruit N (21.55 ± 0.16 g kg−1) (Table 7). The elevated leaf K content is agronomically notable because leaf K status is closely associated with photosynthate transport capacity and osmotic regulation, which aligns with the strong K-driven patterns observed in the CCD yield and TSS models.
Nutrient uptake (mg plant−1) showed the same treatment ranking. Under TB, leaf uptake reached 2.22 ± 0.15 (N), 0.36 ± 0.13 (P), and 3.45 ± 0.17 (K), and fruit uptake reached 1.18 ± 0.04 (N), 0.32 ± 0.03 (P), and 2.11 ± 0.15 (K) (Table 7). These increases indicate that TB did not simply redistribute nutrients among organs but raised whole-plant nutrient capture and partitioning to the economic sink (fruit), which is consistent with its simultaneous yield and quality improvement.
Fruit quality: multi-trait enhancement and positioning of TB vs. TQ
-
Fruit quality traits showed clear and consistent differentiation among treatments (Table 8). The optimized formulations improved not only sweetness-related indices but also texture and nutritional attributes, indicating that the model-derived recipes produced broad-based quality gains rather than a single-index improvement.
Texture and sweetness-related traits. TB produced the firmest fruit (5.71 ± 0.31 kg cm−2, 'a'), significantly higher than CK (5.18 ± 0.45, 'b') and TQ (5.25 ± 0.35, 'b') (Table 8). Increased firmness is practically meaningful because it implies improved texture and potential postharvest tolerance. For sweetness-related traits, TSS increased from 6.67 ± 0.39 °Brix (CK, 'b') to 7.48 ± 0.32 (TB, 'a') and 7.65 ± 0.28 (TQ, 'a'). Soluble total sugars likewise increased to 76.80 ± 2.05 mg 100 g−1 (TB, 'a') and 78.50 ± 2.20 (TQ, 'a') compared with 70.14 ± 1.78 (CK, 'b'). The near-equal improvement in TSS and sugars for TB and TQ indicates that both optima effectively enhanced sweetness-related quality, while TB additionally improved firmness.
Organic acids and sugar–acid balance: Both optimized formulations increased organic acid contents. Citric acid increased from 2.05 ± 0.03 mg g−1 (CK, 'b') to 2.60 ± 0.25 (TB, 'a') and 2.65 ± 0.45 (TQ, 'a'), while malic acid was highest under TB (0.75 ± 0.17 mg g−1, 'a') compared with CK (0.64 ± 0.11, 'b') and TQ (0.61 ± 0.15, 'b') (Table 8). Despite the higher acids, the sugar–acid ratio improved from 15.2 ± 0.22 (CK, 'b') to 16.0 ± 0.18 (TB, 'a') and 16.5 ± 0.24 (TQ, 'a'), indicating that the sweetness enhancement outweighed the acid increase. This pattern is important from a sensory perspective because it suggests a net shift toward a more favorable balance rather than simply increasing acids.
Nutritional quality: Lycopene increased from 7.15 ± 1.56 mg 100 g−1 (CK, 'b') to 8.25 ± 2.88 (TB, 'a') and 8.08 ± 1.68 (TQ, 'a') (Table 8), indicating improved carotenoid accumulation under optimized nutrition. Vitamin C increased markedly and was highest under TB (23.0 ± 0.82 mg 100 g−1, 'a') and TQ (22.5 ± 0.85, 'a') compared with CK (18.7 ± 0.89, 'b'). Given that vitamin C and lycopene are core nutritional attributes often emphasized for tomato quality, these gains support the practical value of model-derived formulations beyond yield improvement.
Overall, TB showed the highest yield, whereas both TB and TQ improved multiple fruit-quality traits relative to CK (Tables 6−8). This positioning confirms that the comprehensive optimum TB provides a balanced solution for production systems targeting both marketable yield and eating quality.
-
Within the tested range, K2O exerted the strongest influence on both yield and TSS, indicating that K supply was more closely associated with productivity and sweetness-related quality than the other two macronutrients. This pattern is consistent with previous studies showing that K plays central roles in osmotic regulation, enzyme activation, and phloem transport of photoassimilates, and is therefore closely linked to fruit growth and soluble solids accumulation[17−22].The conditional effect of P2O5 observed in this study may reflect its dependence on an adequate K background. Previous hydroponic studies have also shown that P responses can vary with the K regime because nutrient uptake and utilization are shaped by ionic balance rather than by the absolute level of a single element[16]. The significant quadratic effect of K2O further suggests that the response of cherry tomato to K was nonlinear within the tested range, which agrees with earlier reports that both insufficient and excessive K supply can constrain fruit production or alter quality formation[17,20].
Linking nutrient status to performance: why TB achieved balanced yield and multi-trait quality gains
-
The coordinated improvement in growth, nutrient uptake, and fruit quality under TB suggests that this formulation is better balanced vegetative performance and reproductive allocation than the control treatment. In particular, the higher leaf K status under TB may have supported assimilate transport and canopy function, while the increase in nutrient uptake in fruit indicates improved partitioning of resources to the economic sink. These responses are consistent with previous studies showing that nutrient balance, rather than the supply of a single element alone, is critical for simultaneous improvement of yield and fruit quality in greenhouse tomato systems[7,9,18]. The contrast between TB and TQ also highlights an important point for nutrient-solution optimization: the optimal formulation depends on the response target used in the model. A formulation optimized for TSS alone may not maximize overall agronomic performance, whereas a multi-response optimum is more likely to achieve a better balance between productivity and quality. In terms of fruit quality, both optimized formulations (TB and TQ) improved sweetness-related indices and nutritional traits relative to the control, confirming that the response surfaces captured meaningful quality variation. However, TB achieved a more balanced quality portfolio, simultaneously improving firmness, sweetness-related traits, sugar–acid balance, and nutritional indices while maintaining the highest yield. This 'balanced enhancement' matters for commercial cherry tomato production because market acceptance depends on multiple attributes (eating quality, texture, appearance-linked nutritional compounds) rather than a single index. A formulation that improves soluble solids but compromises firmness or yield may not be preferred in practice. Therefore, TB represents a formulation that performed well under the tested conditions, whereas TQ serves as a quality-targeted option when market strategy prioritizes maximum sweetness/nutrition over yield.
The distinction between TB (multi-response optimum) and TQ (quality optimum) also highlights a broader point: there is not a single universal optimum for nutrient solutions. Instead, optima depend on the chosen objective function and production goal (e.g, maximum yield, maximum quality, or a balanced trade-off). By explicitly generating and validating both a comprehensive optimum and a quality optimum, the present study provides a practical decision framework for growers and agronomists. This approach is more consistent with greenhouse production decision-making than reporting a single optimum, because it recognizes that production targets and price structures vary across regions and markets. In this study, TSS was used as the quality response variable in the RSM framework because it provides a practical and representative indicator for sweetness-related fruit quality during optimization. However, the responses of other quality traits measured here indicate that tomato fruit quality is multidimensional. Furthermore, the optimized formulations identified using TSS were also shown to improve other important quality traits, including soluble sugars, sugar-acid balance, lycopene, and vitamin C, suggesting that TSS served as an effective representative quality indicator in the present framework. Future studies may further extend this approach by incorporating a multi-trait quality index or multiple response variables for broader quality-oriented nutrient optimization.
Practical implications for nutrient-solution formulation and management in soilless cherry tomato
-
Several actionable implications emerge from the present findings. First, given the dominant role of K2O for both yield and soluble solids, formulation adjustment should prioritize defining an appropriate K2O range and maintaining it consistently over time. In recirculating or partially recirculating systems, K can drift due to differential uptake and accumulation; therefore, maintaining target K levels may require periodic solution refreshment or dynamic adjustment of stock concentrations. Second, the significant P2O5 × K2O interaction indicates that P adjustment should be treated as a conditional lever, most effective when K is already sufficient. This suggests that 'raising P alone' is unlikely to deliver stable yield benefits unless paired with an appropriate K background.
Third, the curvature in yield response to K2O emphasizes that 'more K is not always better'. Instead of maximizing K indiscriminately for sweetness, growers should operate within the identified optimum region to avoid yield penalties and preserve formulation stability. This is particularly important for cherry tomato systems, where high fruit load and continuous harvest can amplify nutrient demand shifts; maintaining nutrient balance becomes as important as providing absolute amounts.
Finally, the methodological framework itself is transferable. CCD–RSM provided an efficient way to quantify nonlinear nutrient responses and interactions and to translate them into candidate formulations. When combined with an independent validation trial, this framework reduces the risk of overfitting and improves confidence in practical adoption. Thus, beyond proposing a specific formulation, the study offers a reproducible pathway for cultivar-oriented or site-specific nutrient-solution optimization in modern soilless horticulture.
Nevertheless, the broader applicability of the optimized formulation should be interpreted with caution. The present study was conducted using a single cherry tomato cultivar (‘Luxiaofan No. 1') under one greenhouse soilless production environment. Previous studies have shown that tomato responses may vary across cultivars, with cultivar-dependent differences in yield and fruit quality reported under different production environments[36,37]. Seasonal and environmental variability, including differences in growing conditions and harvest period, may also alter fruit quality traits and phytochemical accumulation[37,38]. In addition, production-system factors such as substrate type, irrigation/fertigation management, and open vs. closed soilless systems can influence nutrient dynamics and crop performance[4,5,10,39]. Therefore, the TB formulation identified here should be regarded as a validated reference for conditions similar to those tested in this study rather than a universal recommendation for all cherry tomato production scenarios. Future studies should further evaluate the robustness of this formulation across multiple cultivars, seasons, and soilless production systems.
-
This study optimized the macronutrient composition of nutrient solution for soilless cherry tomato using CCD–RSM and verified model-derived formulations in an independent pot experiment. The main conclusions are:
(1) N–P2O5–K2O composition significantly affected yield and fruit quality in soilless cherry tomato, and the CCD–RSM models adequately described these responses.
(2) K2O was the main factor associated with both yield and TSS, and yield responses also showed a significant P2O5 × K2O interaction and a quadratic K2O effect.
(3) The TB formulation (N 290, P2O5 120, and K2O 315 mg L−1) gave the highest yield and improved multiple fruit-quality traits relative to the Yamazaki control.
Overall, combining CCD–RSM optimization with independent validation provides a robust framework for cultivar-oriented nutrient-solution development. The TB formulation may serve as a useful reference for nutrient management in production conditions similar to those tested in this study.
The authors thank the relevant funding bodies for their financial support. This work is supported by the National Natural Science Foundation of China (32573008, 32272697, 32502807).
-
The authors confirm their contributions to the paper as follows: performed experiments and data analysis: Li P, Zhang L, Zhao S, Zhao L; designed the research and wrote the manuscript: Gong B, Zhao D. All authors reviewed the results and approved the final version of the manuscript.
-
All data generated or analyzed during this study are included in this published article.
-
Author Lili Zhang is affiliated with Shandong Province Seeds Group Co., Ltd.; author Shanxing Zhao is affiliated with Zhaoxian Wucai Modern Agriculture Development Co., Ltd.; and author Lifu Zhao is affiliated with Shanghai Qiande Seed Industry Co., Ltd. These companies did not provide specific funding, patented materials, or exert any influence on the study design, data analysis, interpretation of results, or manuscript preparation. All authors declare that the research was conducted in the absence of any commercial or financial relationships that could be interpreted as a potential conflict of interest.
-
# Authors contributed equally: Peidong Li, Lili Zhang
- Copyright: © 2026 by the author(s). Published by Maximum Academic Press, Fayetteville, GA. This article is an open access article distributed under Creative Commons Attribution License (CC BY 4.0), visit https://creativecommons.org/licenses/by/4.0/.
-
About this article
Cite this article
Li P, Zhang L, Zhao S, Zhao L, Gong B, et al. 2026. Effects and optimization of different NPK ratios on yield and quality of soilless cultivated cherry tomatoes. Technology in Horticulture 6: e015 doi: 10.48130/tihort-0026-0009 

Effects and optimization of different NPK ratios on yield and quality of soilless cultivated cherry tomatoes
- Received: 24 March 2026
- Revised: 28 April 2026
- Accepted: 07 May 2026
- Published online: 20 May 2026
Abstract: Protected soilless production and rapid cultivar upgrading have altered the macronutrient requirements of cherry tomato, increasing the need for nutrient solution optimization. In this study, nitrogen (N), phosphorus (P), and potassium (K) (expressed as P2O5 and K2O equivalents, mg L−1) were optimized using a three-factor, five-level central composite design (CCD) combined with response surface methodology (RSM), with yield per plant and total soluble solids (TSS) as response variables. The quadratic models adequately described both responses, with R2 values of 0.9676 for yield and 0.8772 for TSS. K2O showed the strongest effect on yield (F = 153.50, p < 0.0001) and TSS (F = 37.01, p = 0.0005), while a significant P2O5 × K2O interaction affected yield (p = 0.0383). Multi-response optimization identified TB (N 290, P2O5 120, and K2O 315 mg L−1) as the optimal formulation. In the validation experiment, TB increased yield per plant to 2,022 g, 11.7% higher than the Yamazaki control, and increased TSS to 7.48 °Brix. Compared with the control, TB also improved several additional fruit-quality traits. These results indicate that CCD–RSM is effective for optimizing macronutrient composition in soilless cherry tomato under the tested conditions.
-
Key words:
- Cherry tomato /
- Soilless cultivation /
- Nutrient solution /
- N–P–K ratio /
- Response surface methodology /
- Fruit quality