


-
The sweetpotato (Ipomoea batatas (L.) Lam) is an hexaploid species (2n = 6x = 90) with an estimated genome size of 2.6 G[1]. Due to its remarkable capacity for high yield and its ability to thrive in diverse environmental conditions, the sweet potato has emerged as a cost-effective provider of essential dietary elements such as calories, protein, fiber, minerals, vitamins, and flavonoids[2,3], particularly within developing countries. In this context, it is noteworthy that orange-fleshed sweet potatoes have emerged as pivotal players in the ongoing battle against vitamin A deficiency in Africa[4].
The initial hexaploid sweetpotato variety to be sequenced is cultivar Taizhong 6, which was solely based on the Illumina sequencing platforms[5]. This effort resulted in the production of 15 pseudochromosomes through the identification of gene synteny between the enhanced haplotype of the I. batatas assembly and the Ipomoea nil genome[6]. Subsequently, with the advent of third-generation sequencing technology, the Taizhong 6 genome was resequenced using 10X Genomics techniques and Nanopore sequencing (Oxford Nanopore Technologies). The resulting long-read assembly was subsequently anchored onto chromosomes using the linkage map. This assembly effectively integrated homologous sequences into a haploid genome, measuring 473.8 Mb in size, and consisting of 15 sequences/chromosomes with an N50 length of 31 Mb. This high-quality chromosome-scaled genome provides a superior reference for genomic and functional analyses of I. batatas. Using these high-quality sweetpotato genomes, candidate genes for important traits were analyzed[7,8].
Beyond genome assembly, the availability of accurate and complete genome annotations is crucial to complement genome assembly and enhance genome applicability. Achieving this objective often involves subjecting a single genome to multiple rounds of reannotation. A notable example is the 11th annotation of the Arabidopsis genome, released in 2017[9]. The advantage brought forth by Illumina technology has catalyzed the establishment of transcriptome resources for many Ipomoea species, particularly the cultivated relative Ipomoea batata[10−12]. However, the use of short RNA-sequence reads from Illumina technology presents a significant hurdle in the process of transcript assembly and annotation[5]. In contrast, long-read sequencing produced via Pacific BioSciences (PacBio) and Oxford Nanopore Technologies (ONT) can provide full-length transcripts, greatly enhancing the precision of gene structure annotation[13−15]. Moreover, the adoption of full-length sequencing technology also benefits the analysis of alternative splicing, thereby enabling a more comprehensive understanding of gene expression. In the case of polyploids containing large sets of homoeologous genes, exploration of transcript splicing offers the potential to yield supplementary insights into the prevalence of subgenome dominance and the evolutionary origins of novel traits. Recently, 12 high-quality full-length transcriptomes of I. batata were sequenced by ONT sequencing technology[16]. This resource, derived from ONT RNA sequencing, presents valuable prospects for further improving I. batata genome annotation.
In previous studies, we successfully optimized the genome annotation pipeline to obtain high-quality gene annotations for the genomes of diploid and octoploid strawberries[13,15,17]. To improve the annotation of the sweetpotato genome, we applied this pipeline with available RNA-seq datasets, which included 12 Nanopore full-length sequencing and 154 RNA-seq libraries. These datasets were generated from various tissues, including storage roots, leaves, and seedling tissues at distinct developmental stages or subjected to different treatments[16,18−20]. As a result, the newly refined and enhanced annotation, designated v1.0.a2, now encompasses a total of 42,751 protein-coding genes, demonstrating an impressive completeness of 97.4%, as indicated by BUSCOs. Moreover, we identified a total of 132 known and 15 novel miRNAs and predicted their targets, in addition to providing the expression levels of these miRNAs at different storage root stages. Collectively, this updated annotation and the comprehensive gene expression profiles will serve as a valuable data resource for genomics and functional studies in sweetpotato.
-
In this study, we gathered 12 ONT libraries generated from storage roots of both white-fleshed and purple-fleshed sweetpotato at different developmental stages[16]. Additionally, we utilized 190 Illumina-based RNA-seq datasets obtained from storage roots, leaves, and seedling tissues at distinct developmental stages or subjected to different treatments[18−20]. In addition, a total of 15 small RNA-seq libraries generated from different stages of storage root were used for small RNA identification (Supplemental Table S1)[21].
Reads processing
-
The full-length reads were generated using Pychopper v2 (
https://github.com/epi2me-labs/pychopper ), which was employed to identifiy, orient and trim full-length Nanopore cDNA reads. Subsequently, these full-length reads were mapped to the I. batata genome of each sample using Minimap2 v2.24[22]. Initially, mapped reads were then processed using cDNA Cupcake (https://github.com/Magdoll/cDNA_Cupcake ) to remove redundancy, considering an alignment identity > 90% and alignment coverage > 85%. Furthermore, 5' degraded reads were excluded to obtain a final set of nonredundant reads. For Illumina reads, the first 12 bp of the Illumina RNA-seq reads were removed using the fastp tool[23]. Subsequently, the clean reads from each library were individually aligned to the I. batata genome[5] using STAR[24]. Only the reads mapped uniquely remained for further analysis.Comprehensive transcriptome generation
-
The short reads from each library were assembled into transcripts using Stringtie[25]. To filter out weakly expressed isoforms, a minimum isoform fraction (-f) of 0.2 was applied. The resulting refined Nanopore transcripts were mapped to the I. batata genome using GMAP[26] with a minimum alignment identity of > 90% and an alignment coverage of > 85%. PASA[27] was employed to construct the best gene models based on the aligned Nanopore full-length reads. Finally, a comprehensive transcriptome was reconstructed and generated by integrating the genome-guided short-read assembly and Nanopore full-length transcripts.
Gene structure annotation of the I. batata genome
-
The annotation of the I. batata genome involved the utilization of various evidence sources. Initial gene models were generated using BRAKER2[28], which integrated trained models from BRAKER with mapped full-length reads, intron hints converted from mapped Nanopore full-length reads, intron hints derived from mapped short Illumina reads, and protein hints converted from mapped UniPro plant proteins and Arabidopsis proteins. Additionally, the I. batata genome underwent soft-repeat masking.
To obtain consensus gene models, EvidenceModeler (EVM)[29] was used. EVM combined initial BRAKER gene models, mapped Nanopore full-length transcripts, genome-guided transcripts from Illumina RNA-seq, comprehensive transcriptome alignments from PASA, mapped UniProt proteins, and mapped Arabidopsis proteins. The consensus gene models were determined using a nonstochastic weighted value, with the following weight values assigned to each evidence source: 3, 6, 5, 10, 2, and 2, respectively. For further refinement of the gene models, PASA[27] was used, incorporating the addition of alternatively spliced isoforms, UTR annotations, and modifications to the gene structure. Finally, the new annotations underwent a meticulous one-by-one manual curation, employing IGV-GSAman (v.0.6.83,
https://tbtools.cowtransfer.com/s/a11146181df14f ). This step was taken to ensure both quality assurance and accuracy.Functional annotation of gene models
-
GO terms, KEGG terms, and gene functions were comprehensively annotated through the EggNOG-mapper (v.2.1.9) (
http://eggnog-mapper.embl.de ). Protein sequences were submited to both the eggNOG-mapper and KOBAS websites, and analysis was conducted using their default settings. Additionally, we employed iTAK (v.1.6,http://itak.feilab.net/cgi-bin/itak/index.cgi ) to identify transcription factors and protein kinases.Identification of miRNAs and their target genes
-
The identification of sweetpotato miRNAs followed a previously described workflow[30,31]. Briefly, the reads obtained from the five stages of storage root[21] were combined and processed. This involved discarding low-quality reads, trimming adapters, and collapsing identical small RNA reads using the FASTX-Toolkit (
http://hannonlab.cshl.edu/fastx_toolkit ). The collapsed reads were then aligned to the 'Taizhong 6' genome using Bowtie1[32], allowing one mismatch. Subsequently, small RNAs with a length of 20–22 nucleotides and ≤ 20 genomic matches were screened for stem-loop structures, considering a maximum of four mispairings and ≤ 1 central bulge. The identified miRNAs were searched against miRbase (www.mirbase.org , v22) using BLAST to identify conserved miRNAs in plants, allowing up to two mismatches. TargetFinder 1.7[33] was utilized to predict the target genes of the miRNAs within the v1.0.a2 gene set. Target prediction employed alignment scores up to 5, where a lower score indicated a better alignment between the miRNA and its target[34]. -
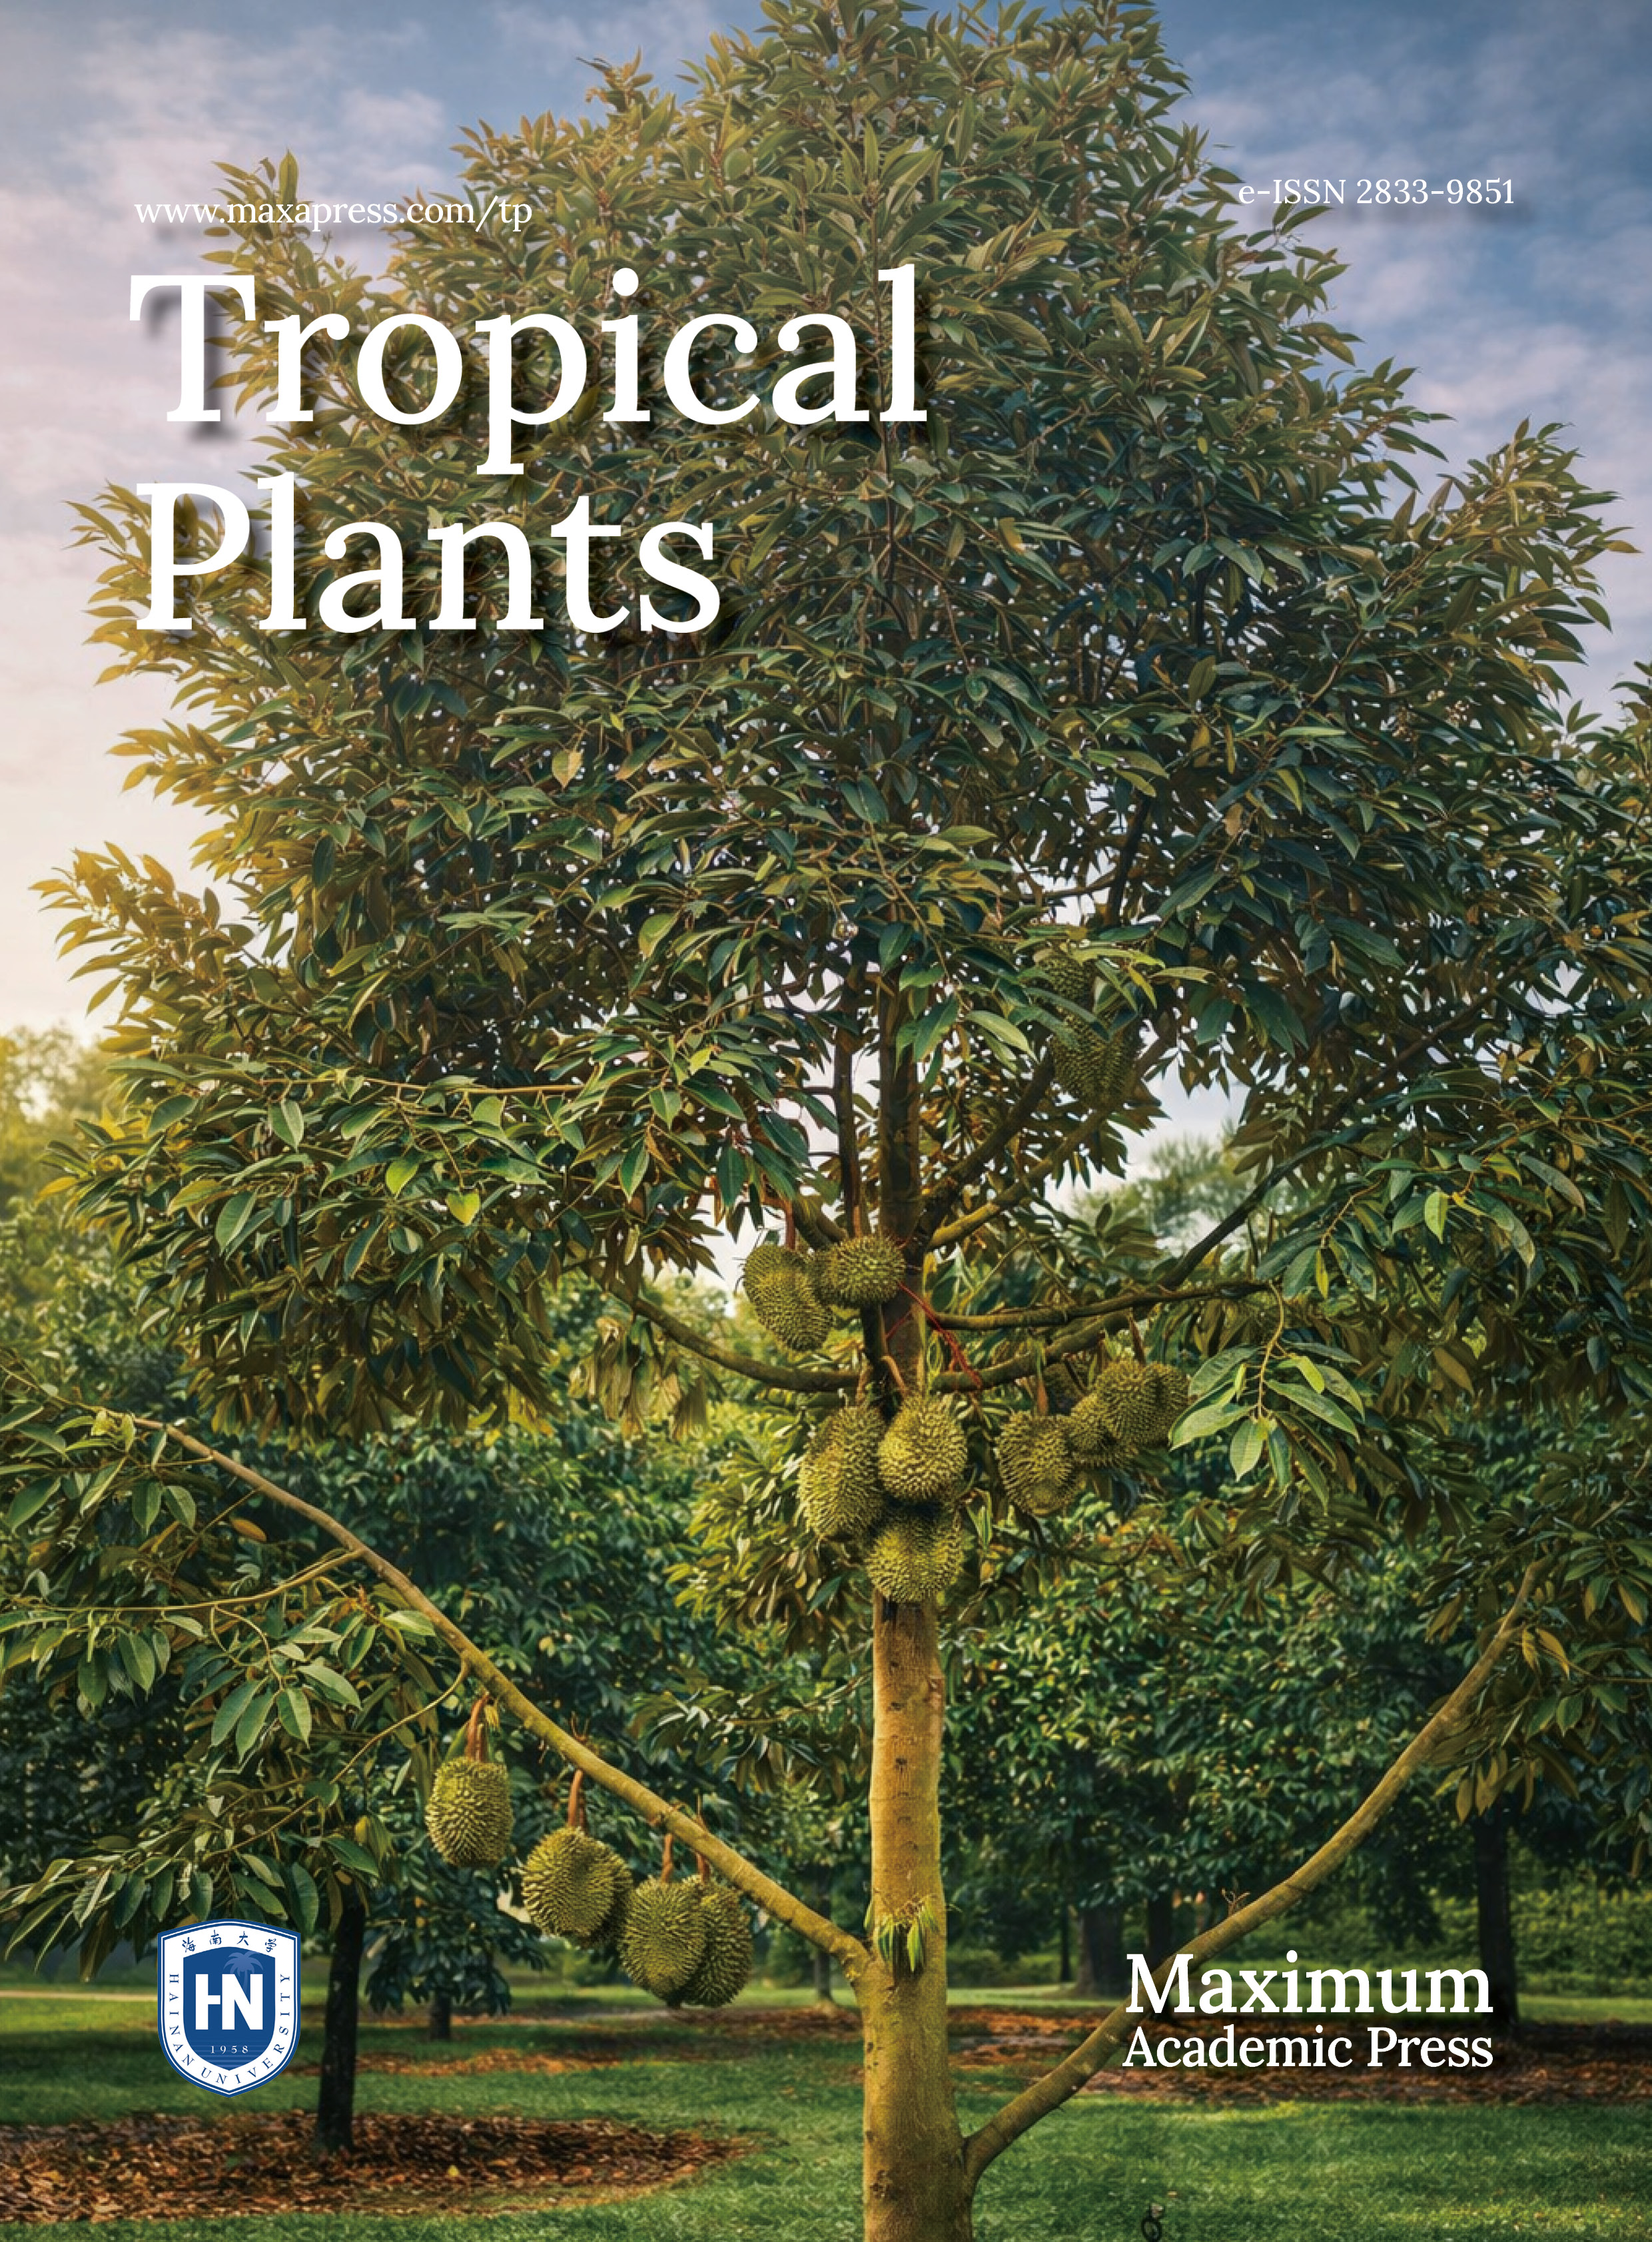
In this study, we carried out an updated annotation of the I. batata genome, denoted as version 1.0.a2 (v1.0.a2). The reannotation process of v1.0.a2 involved the integration of the Nanopore full-length transcriptome and extensive Illumina RNA-seq datasets to incorporate splice isoforms and enhance gene structure accuracy (Fig. 1). Initially, we utilized the BRAKER[28] tool to generate an initial protein-coding gene annotation. The input data for BRAKER include BRAKER trained models, intron hints converted from aligned nanopore transcript sequences, intron hints converted from aligned RNA-seq reads, protein hints generated from mapping Araport11 and UniProt plant protein sequences, and the soft-repeat masked I. batata genome. The Nanopore full-length sequences were obtained from storage roots of both white-fleshed and purple-fleshed sweetpotato at different developmental stages[16]. Illumina RNA-seq libraries were acquired from a series of different tissues in I. batatas, including storage roots, leaves, and seedling tissues at distinct developmental stages or subjected to different treatments[18−20] (Supplemental Table S1). To incorporate diverse evidence sources into consensus gene models, we utilized EVidenceModeler (EVM) software[29]. This allowed us to merge gene models predicted by BRAKER, mapped Nanopore full-length transcripts, genome-guided assembly transcripts, and mapped protein sequences (Fig. 1).

Figure 1.
Annotation workflow for I. batata protein-coding genes. The high-quality gene models obtained from Nanopore full-length transcripts were employed to train BRAKER. Comprehensive transcriptomes were constructed using RNA-Seq datasets through full-length and genome-guided transcripts. Additionally, Arabidopsis and UniProt plant protein sequences were incorporated as inputs for BRAKER. The input evidence for EVidenceModeler is highlighted within the red dotted box. Furthermore, manual curation was performed to ensure the accuracy of the annotation.
Finally, we utilized IGV-GSAman to meticulously examine the new annotations across the entire genome. Through rigorous comparisons with the mapped RNA-seq reads, we identified and selected the most accurate gene models. This meticulous process resulted in the manual curation of approximately 3000 genes, accounting for 7.01% of the total. As a result, we obtained the new annotation, v1.0.a2, which comprised a final set of 42,751 genes.
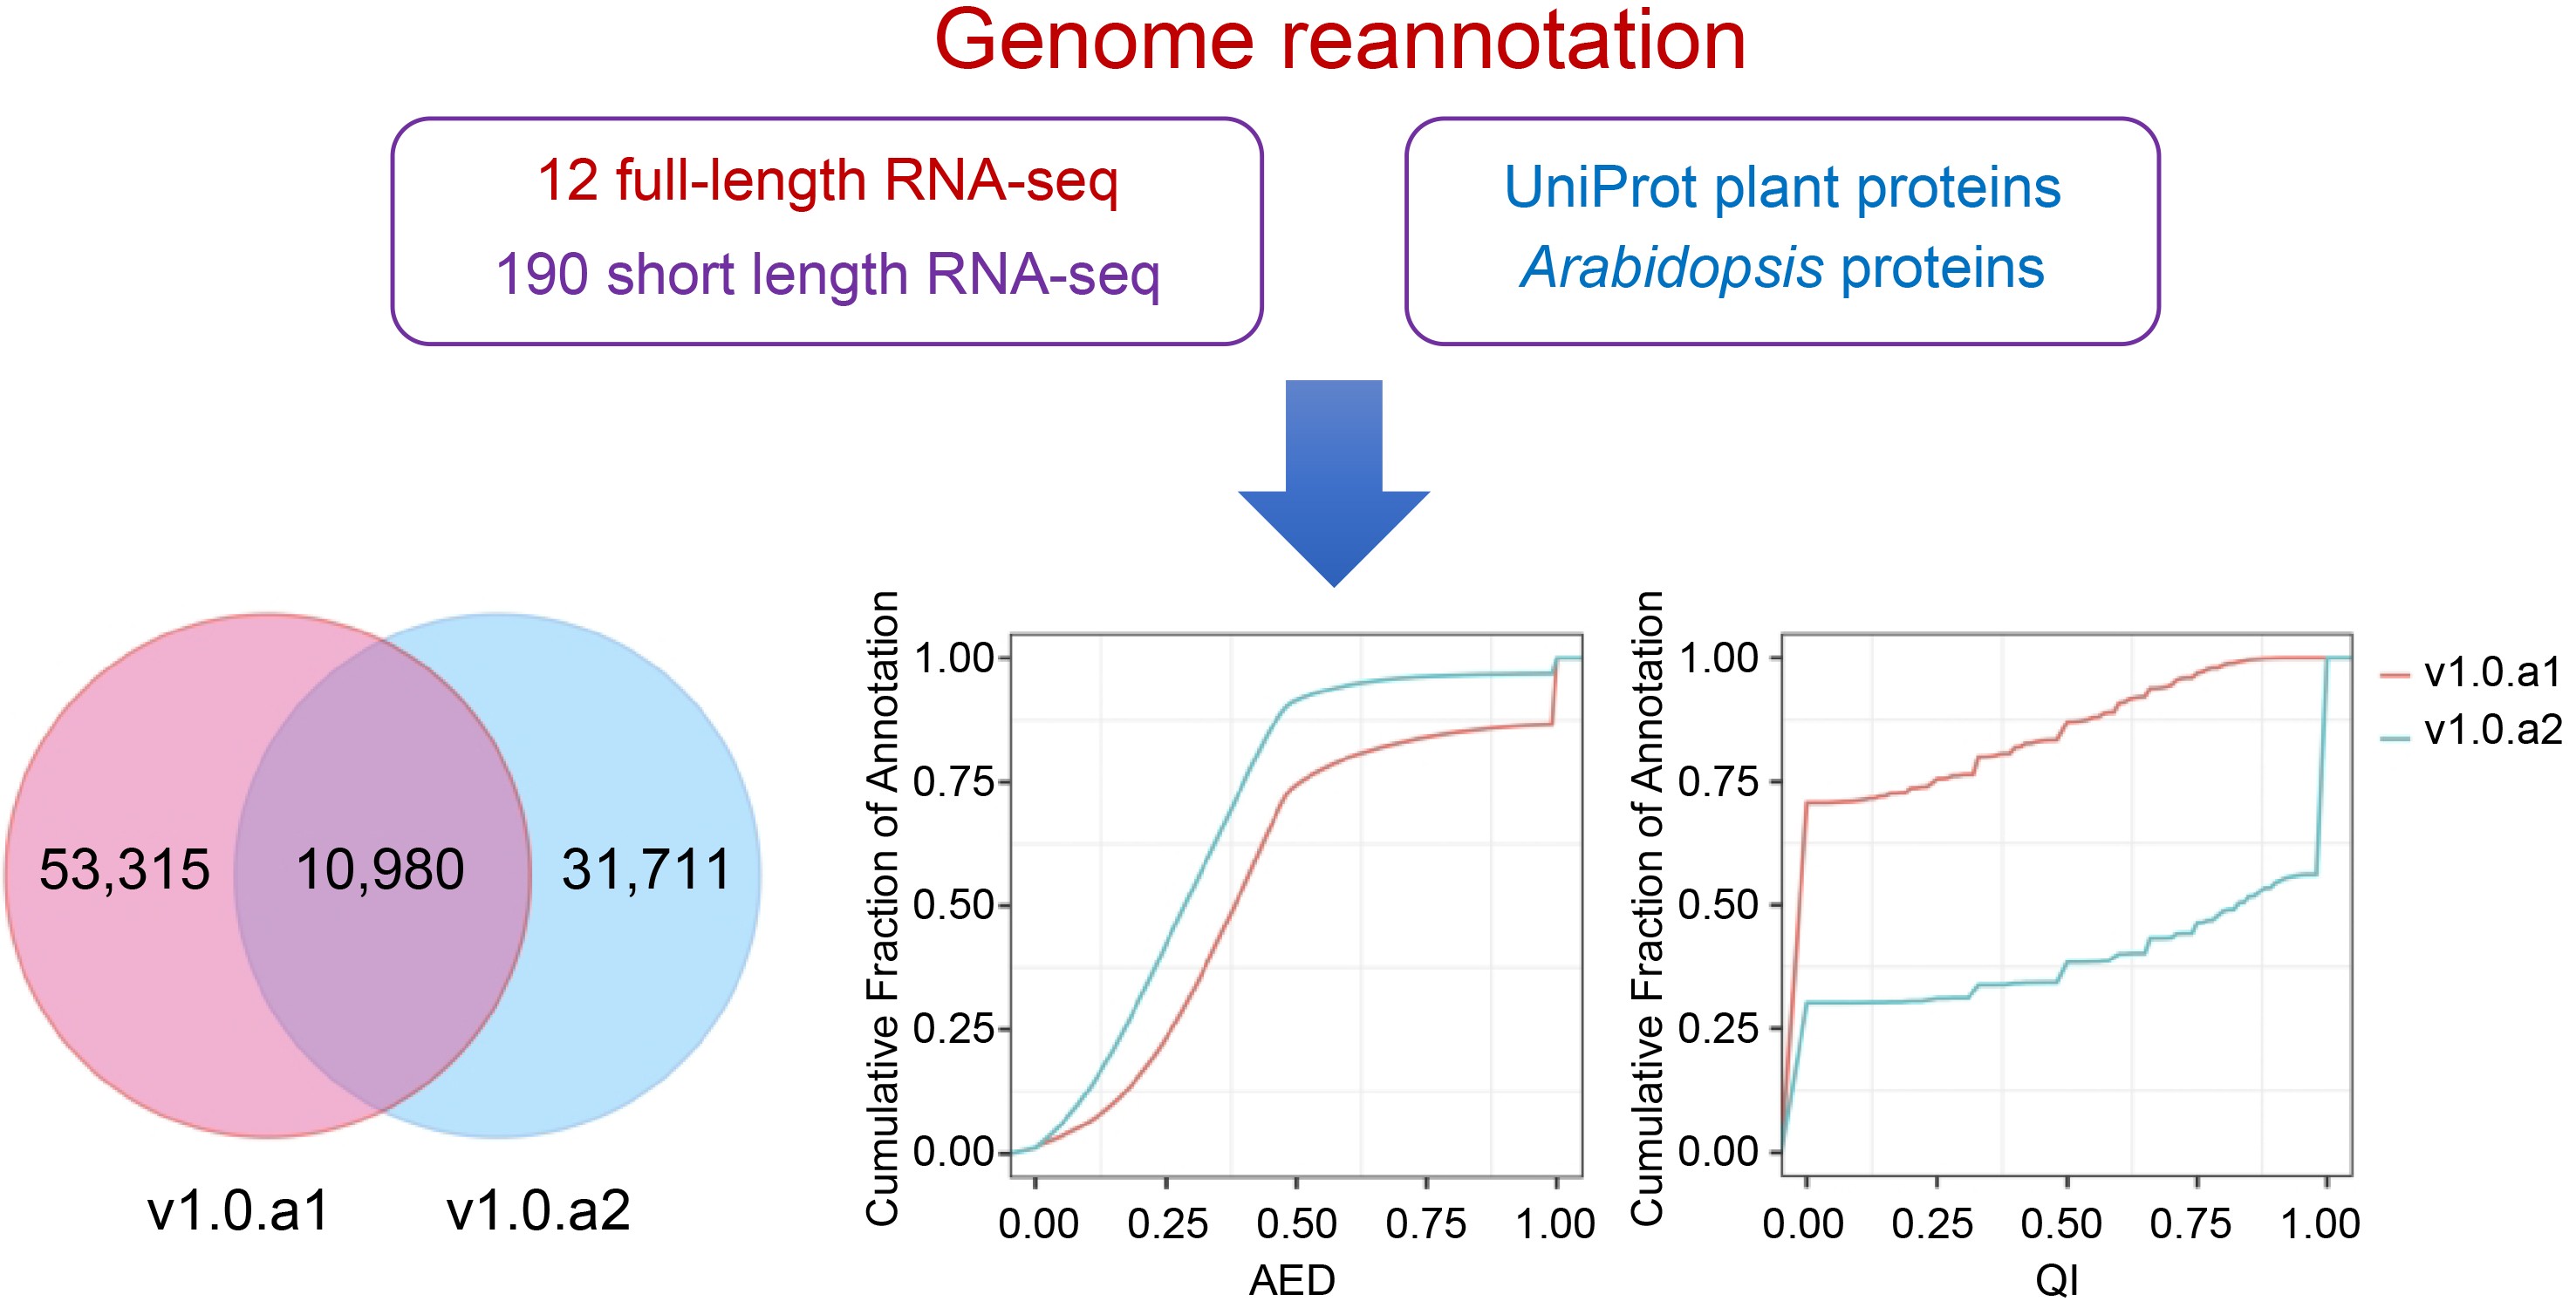
The I. batata annotation, designated v1.0.a2, encompasses 42,715 protein-coding genes with 63,837 transcripts, as detailed in Table 1. In a comparative analysis between v1.0.a1 and v1.0.a2, it is evident that v1.0.a2 is missing 21,544 genes present in v1.0.a21. When examining the gene models between v1.0.a1 and v1.0.a2, we consistently identified a shared pool of 10,980 genes (Supplemental Table S2). However, this shared pool accounts for only 17.07% of v1.0.a1 and 25.68% of v1.0.a2. In this context, we introduce a novel gene identification format, denoted as IbXXGXXXXX. The 'Ib' prefix designates Ipomoea batatas, while the third and fourth digits are represented by 'X', signifying the chromosome number. 'G' is indicative of a gene, and the concluding five-digit code is assigned in accordance with the ascending order from the top/north to the bottom/south of the chromosome. Table 1 presents the statistics comparing v1.0.a1 and v1.0.a2. Remarkably, a total of 32,582 genes features 3' and/or 5' untranslated regions (UTRs), collectively representing approximately 76.2% of all annotated genes. The mean count of exons per gene increased from 5.2 to 8.1. A significant feature of the new annotation is the inclusion of alternative transcripts. A total of 8,736 transcripts arising from 42,751 genes were discerned, resulting in an average of 1.5 transcript isoforms per gene locus, spanning the entire genome. Furthermore, in the v1.0.a2 annotation, a substantial number of 17,720 genes were associated with Gene Ontology (GO) terms, compared to the 17,873 genes documented in v1.0.a1, as delineated in Table 1.
Table 1. Summary of the v1.0.a2 annotation.
Type v1.0.a1 v1.0.a2 Protein-coding genes Number of genes 64,295 42,751 Mean length of genomic loci 2,498 2,953 Mean exon number 5.2 8.1 Mean CDS length 227 214 Mean length of introns 307 423 Genes with 5' UTR − 32,220 Genes with 3' UTR − 32,241 Genes with both 5' and 3' UTR − 31,859 Mean 5' UTR length (bp) − 428 Mean 3' UTR length (bp) − 525 Number of genes with isoforms − 8,736 Mean isoform number per gene 1.0 1.5 Genes with GO terms 17,873 17,720 Genes with functional annotations 38,602 32,629 Complete BUSCOs 89.5% 97.4% Fragmented BUSCOs 6.0% 0.7% Missing BUSCOs 4.5% 1.9% Evaluation of the annotation v1.0.a2
-
We employed MAKER2 software[35] to assess the consistency of gene loci with available nucleotide and protein sequence alignments, utilizing the Annotation Edit Distance (AED) and mRNA quality index (QI). Each gene was assigned an AED score between 0 and 1, where 0 represents complete consistency with the evidence, and 1 indicates complete inconsistency with the evidence. Similarly, the QI score ranged from 0 to 1, with a higher QI score indicating a higher proportion of exons that matched the transcript alignment. As a result, the AED distribution analysis revealed a notable shift toward lower (inproved) scores in v1.0.a2 compared with v1.0.a1 (Fig. 2b). Conversely, the cumulative QI distribution illustrated that QI scores trended toward higher (enhanced) values in v1.0.a2 when compared with v1.0.a1 (Fig. 2c). Consequently, v1.0.a2 boasts a higher percentage of gene models that enjoy robust support from transcript evidence.
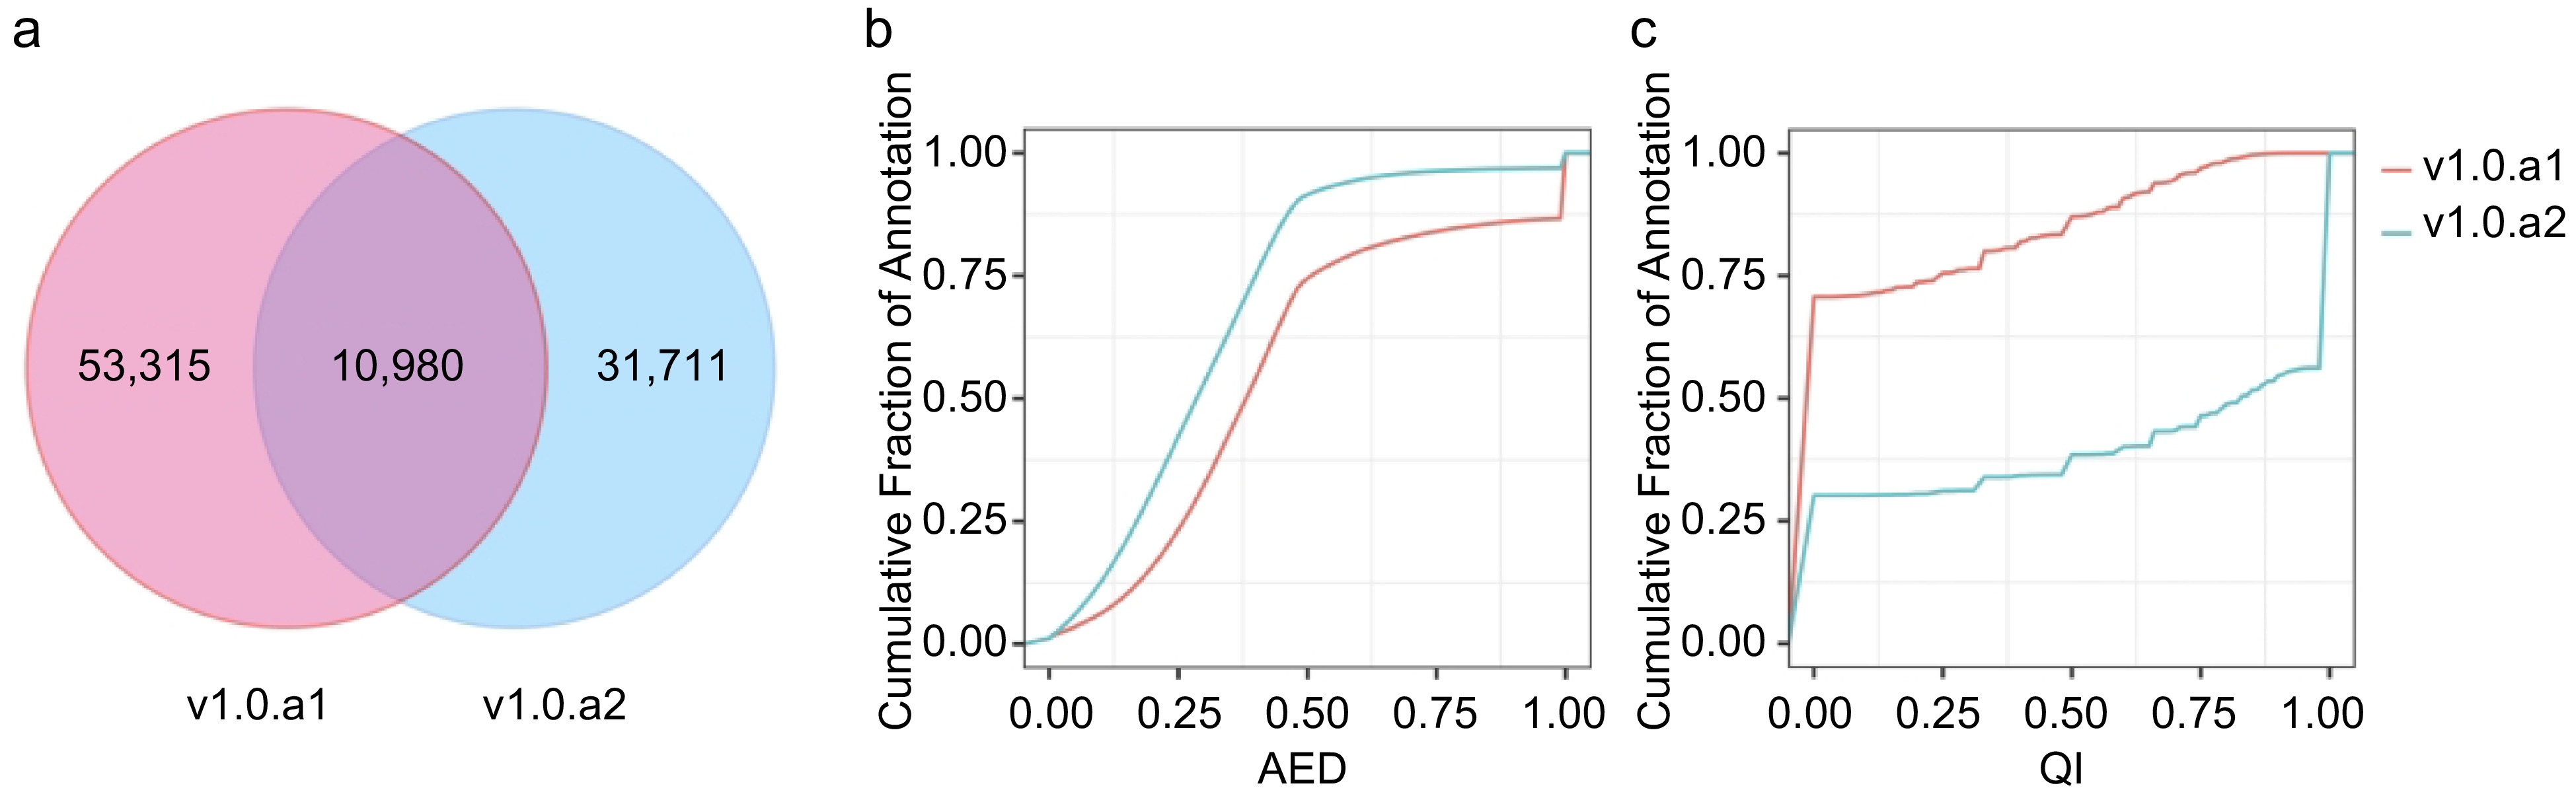
Figure 2.
Comparison of v1.0.a1 and v1.0.a2 annotation. (a) Venn diagram showing the common and unique gene structure of the CDS region between v1.0.a1 and v1.0.a2. (b) Cumulative AED distribution curves for the annotations in v1.0.a1 and v1.0.a2. (c) Cumulative QI distribution curves for the annotations in v1.0.a1 and v1.0.a2.
To assess the completeness of the v1.0.a1 and v1.0.a2 annotations, we employed BUSCO v5.4.7[36]. BUSCO evaluates the completeness of genome assembly and annotations by comparing them to a curated set of lineage-specific single-copy orthologs in the plantae lineage. Out of the 1,614 conserved genes examined, v1.0.a2 harbored 97.4% complete BUSCOs, while v1.0.a1 had 89.5% complete BUSCOs (Table 1). This indicates a significant enhancement in the annotation completeness of v1.0.a2 when compared to v1.0.a1.
Prediction of gene functions
-
To enhance the functional annotations of protein-coding genes in v1.0.a2, we subjected each predicted protein sequence to a comprehensive analysis using the InterPro protein databases using InterProScan[37]. Next, we employed the eggNOG mapper[38] to assign GO categories, KEGG pathways, and functional annotation for all annotated loci. This process resulted in the precise assignment of specific GO terms to 17,265 genes, representing an increase from the 16,569 genes cataloged in v1.0.a1 (Supplemental Table S3). Additionally, we utilized the iTAK tool[39] to identify and categorize transcription factors (TFs) and protein kinases. Within the scope of the v1.0.a2 annotation, we successfully identified a total of 2,136 TFs and 482 transcriptional regulators (TRs), as summarized in Supplemental Table S4. Notably, v1.0.a2 exhibited a higher proportion of genes encoding TFs (5.00%) than v1.0.a1 (3.84%). It is worth mentioning that despite v1.0.a2 having 21,504 fewer genes than v1.0.a1, certain transcription factor families show increases in membership, including the bZIP family from 74 to 75, the Tify family from 25 to 26, and MADS-MIKC from 24 to 46. Furthermore, v1.0.a2 contains 482 protein kinase encoding loci, which is 13 fewer than in v1.0.a1 (Supplemental Table S4).
Below, we present several examples demonstrating the enhanced accuracy of the v1.0.a2 annotation when compared to the v1.0.a1 annotation. Specifically, IB01G33760, is a homolog of GSH-induced LITAF domain protein (ATGILP, AT5G13190). encodes a plasma membrane-localized LITAF domain protein known to interact with LSD1 and function as a negative regulator of hypersensitive cell death[40]. In v1.0.a2, it exhibits a newly identified translation start site and a revised gene structure (Fig. 3a). In v1.0.a2, a single gene, g4152, has been split into two separate genes, IB01G33550 and IB01G33560. Of these two genes, IB01G33550 encodes a homolog of AtIMD2 (AT1G80560), which is one of three genes responsible for encoding the enzyme 3-isopropylmalate dehydrogenase involved in leucine biosynthesis in Arabidopsis[41] (Fig. 3c). Furthermore, IB01G33270, which encodes a homolog of AtAGL27 (AT1G77080), a MADS domain protein that functions as a negative regulator of flowering[42,43]. Initially, it was annotated as three separate genes (Fig. 3b). All of these gene models were validated by PCR amplification and subsequent Sanger sequencing (Supplemental Fig. S1). The primers used for this validation process are listed in Supplemental Table S5.
Figure 3.
Examples of known genes with improved annotations. (a) IGV view of the gene model for IB01G33760 has been updated in the new annotation. (b) IGV view of the RNA-seq mapped reads for the two adjacent genes (IB01G33550 and IB01G33560) with modified gene models in v1.0.a2 are compared to those in v1.0.a1. (c) In v1.0.a2, three genes from v1.0.a1 have been merged into a single gene, now identified as IB01G33270.
Annotation of miRNAs and their target genes
-
To annotate the miRNAs within the Taizhong 6 genome, we processed and analyzed 15 sRNA libraries representing various stages of storage roots, adhering to a well-established protocol[44]. The positions of miRNA genes on sweetpotato chromosomes can be observed in GFF3 file and visually represented using TBtools[45] (Fig. 4a). Our investigation unveiled a total of 132 conserved miRNA genes, encompassing 57 unique miRNA sequences that belong to 29 known miRNA families (Fig. 4a). Furthermore, applying rigorous criteria established in previous research[44], we identified 17 miRNAs as novel miRNAs. These miRNAs have not been characterized or annotated before, and we have designated them as fve-miRN1 to miRN17 (Fig. 4a, Supplemental Table S6). These conserved and novel miRNA genes exhibited a nonuniform distribution across the seven chromosomes (Fig. 4a).
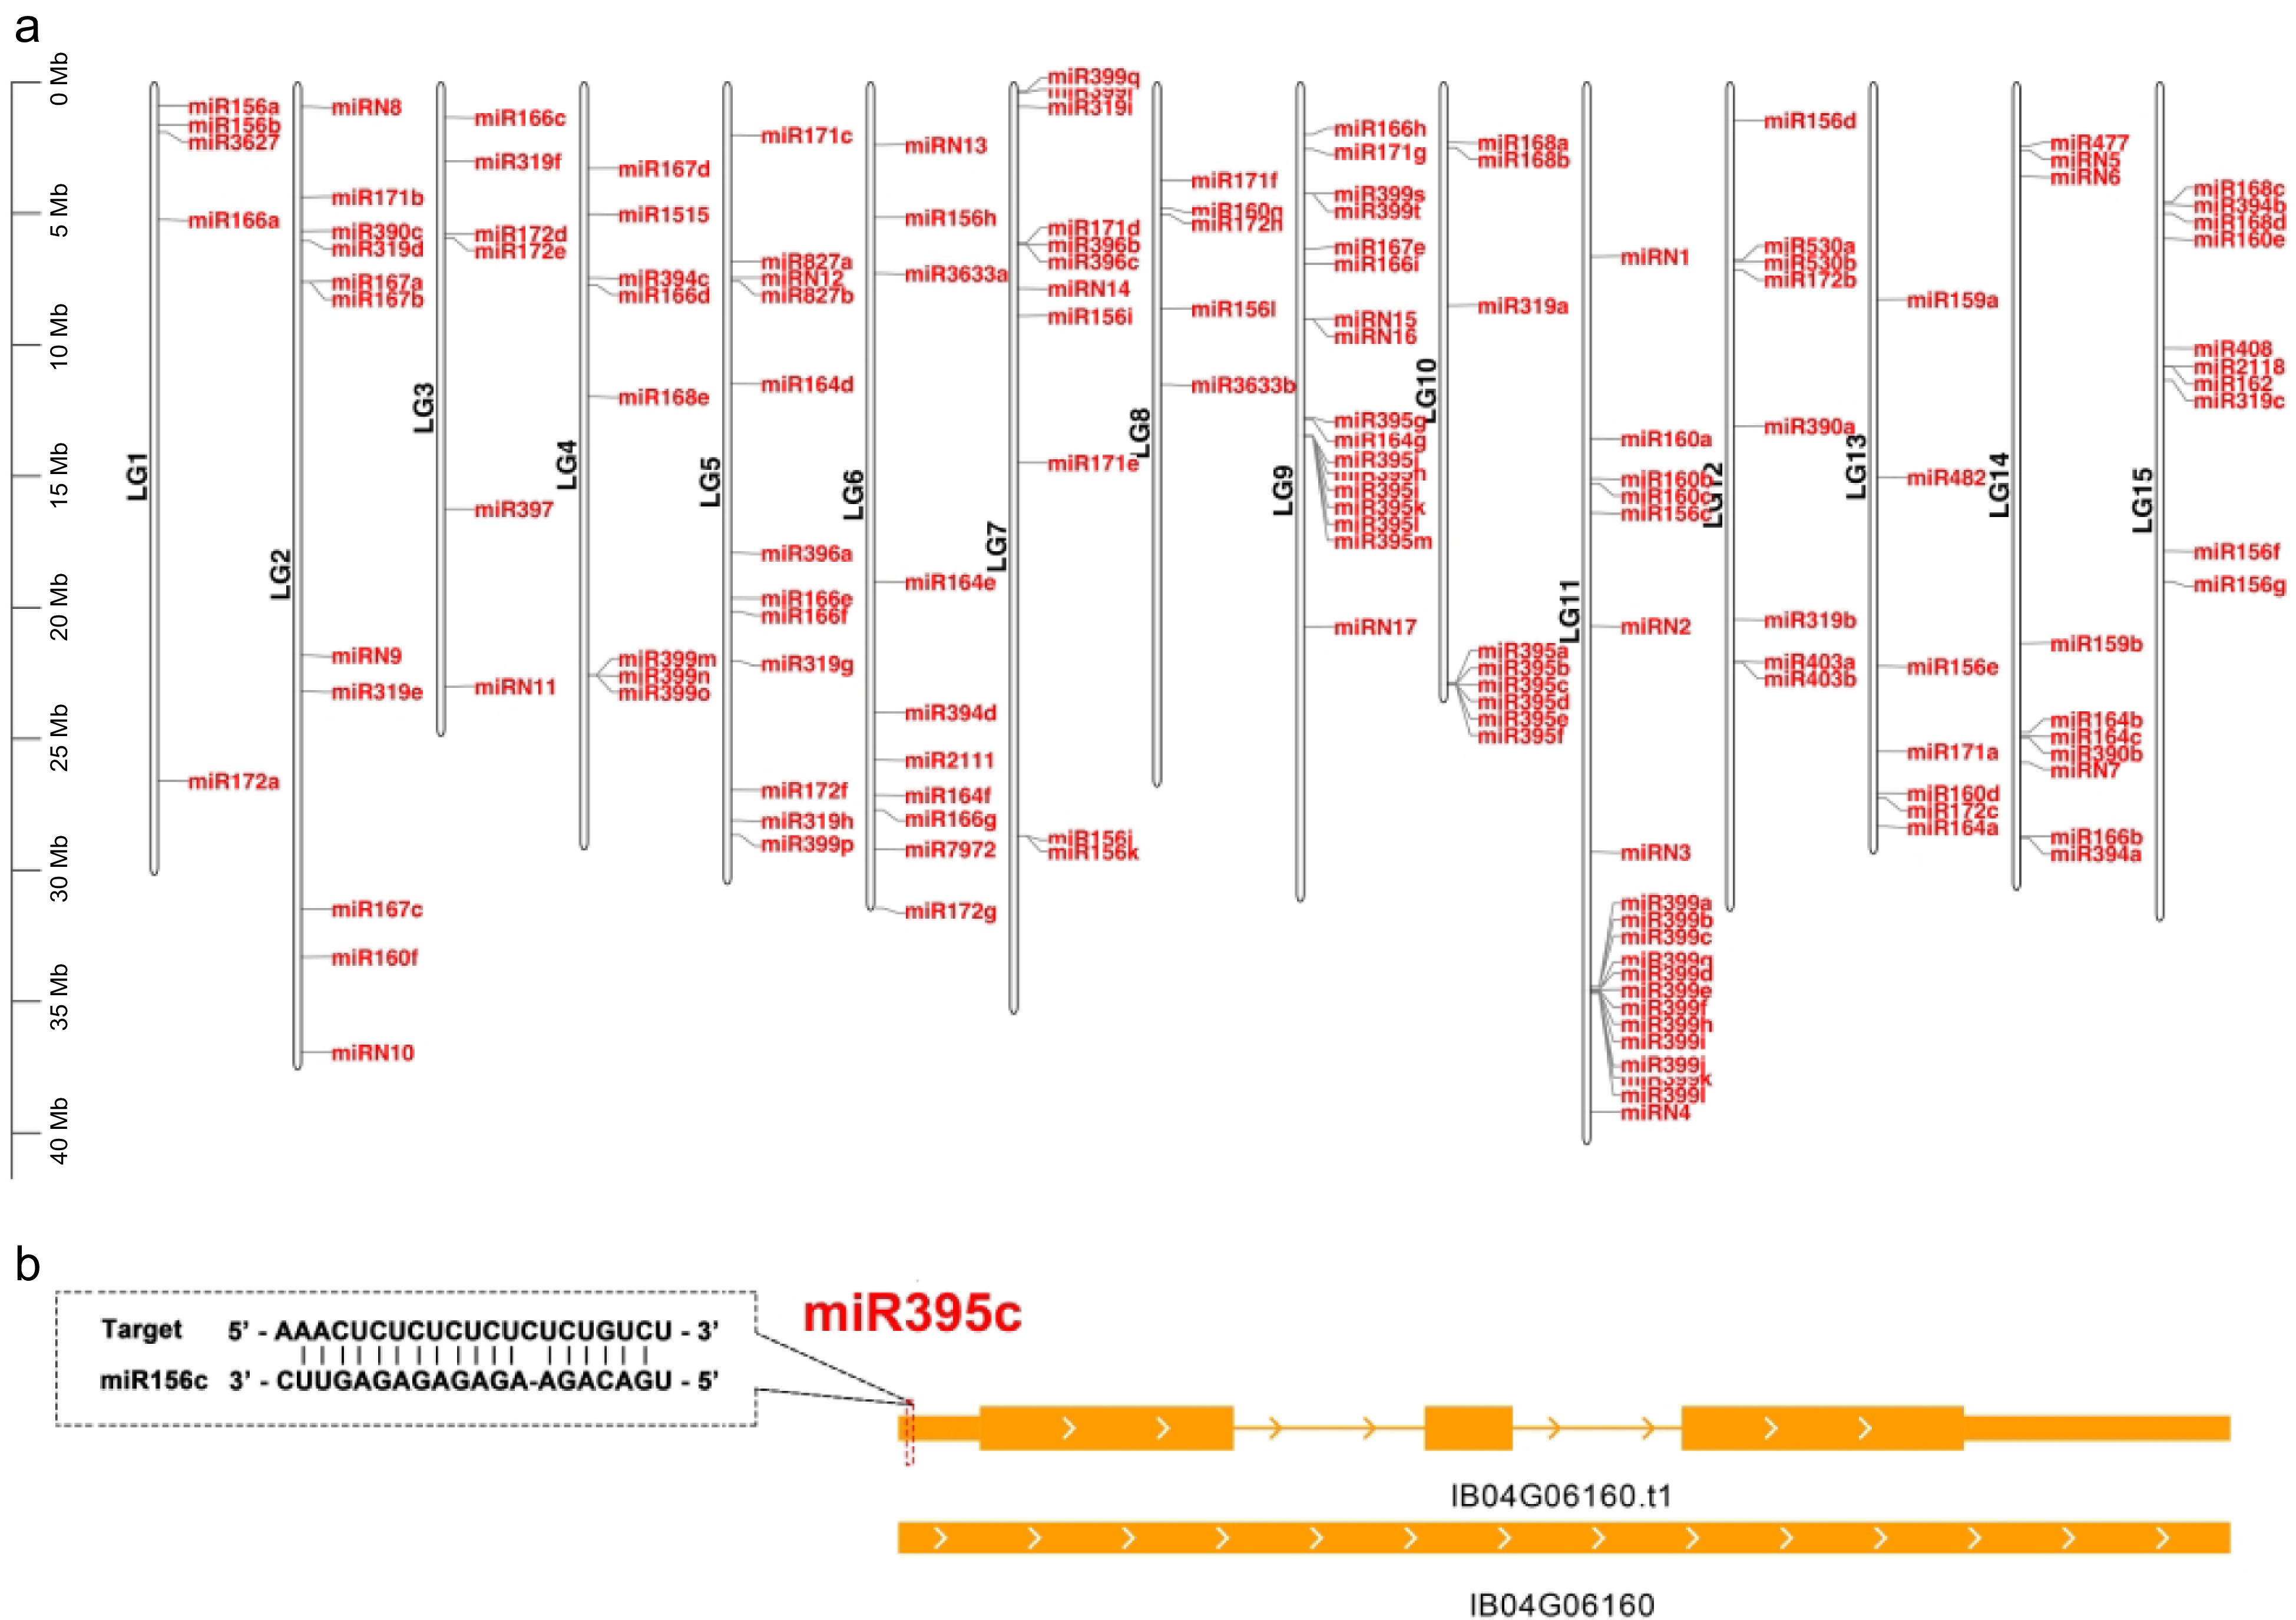
Figure 4.
Distribution of the miRNA genes in different chromosomes. (a) Distribution of the annotated miRNA genes (both known and new) in different chromosomes in the Taizhong 6 genome. (b) The target site of miR395c in IB04G06160. This gene is targeted by miR395c at the 5' UTR. The target sites are indicated by a red dashed box.
After identifying miRNAs from 15 sweetpotato sRNA libraries, we generated an expression matrix (calculated as reads per 10 million, RP10M) of all miRNAs across different stages of sweetpotato storage roots (Supplemental Table S6). To elucidate the expression patterns of these miRNAs in various tissues (spanning five different stages from 15 libraries), we created heatmaps for both known and novel miRNAs using hierarchical clustering and Z-score normalization (Fig. 5). Consequently, we compiled a list of miRNA targets supported by TargetFinder[46], and these can be found in Supplemental Table S7. In total, 402 target genes have the potential to be recognized by 29 conserved miRNA families, while 172 genes are targeted by 15 novel miRNAs. It is worth noting that the presence of UTRs in the v1.0.a2 annotation may account for this significant difference, as miRNAs frequently target UTR regions. In fact, some genes have acquired miRNA target sites within their UTR regions. For example, IB04G06160, which encodes WRKY transcription factor 23 (IbWRKY23), possesses target sites for fve-miR395c in its 5′ UTR (Fig. 4b).

Figure 5.
Expression profiles of miRNAs in storage roots. In this figure, we present the expression profiles of miRNAs in various storage root stages: F for fibrous roots, D1 for initial storage roots (with a diameter of approximately 1 cm), D3 for storage roots (with a diameter of approximately 3 cm), D5 for storage roots (with a diameter of approximately 5 cm), and D10 for storage roots (with a diameter of approximately 10 cm). The color bar on the right side of the panel indicates the relative expression levels of miRNAs across different stages.
Finally, by analyzing the expression levels of all the miRNA genes across the different storage root stages (Supplemental Table S6), we have identified several miRNAs exhibited stage-specific or stage-preferential expression. For instance, miR530a was found to be specifically expressed in fibrous roots, while most miRNAs, including miR171b, miR294a, miR390, and miR403b, among others, displayed high expression levels in D1. The highly expression miRNAs in D1 may contribute to the initiation of storage root. Notably, miR168a predominantly accumulated in D3, while miR156f, miR167a, and miR397 exhibited high expression in D10. Additionally, a novel miRNA miRN17 displayed a significantly high expression level in D5, indicating that this miRNA may be related to the maturation of sweetpotato storage roots.
-
In this study, we have significantly enhanced the annotation of the high-quality genome sequence assembly for hexaploid sweetpotato I. batata, resulting in the creation of a new annotation referred to as v1.0.a2. This comprehensive annotation process involved the utilization of 15 Nanopore long-read sequencing datasets obtained from storage roots of both white-fleshed and purple-fleshed sweetpotatoes at various developmental stages. Additionally, we incorporated data from 190 distinct Illumina short-read sequencing datasets. In this v1.0.a2 annotation, a total of 360 newly discovered genes were successfully identified. Furthermore, we have modified or added 31,771 gene models, simultaneously incorporating transcript isoforms and expanding information on 5' and 3' untranslated regions (UTRs) in this updated annotation. Additionally, we conducted an analysis and presented miRNAs, their expression profiles across different storage root stages, and their targets. Overall, this improved annotation, v1.0.a2, represents a valuable resource for genomic analyses within the Convolvulaceae family and serves as an essential reference for gene function studies in cultivated sweetpotatoes. The incorporation of newly discovered genes, refined gene models, and miRNA data enhances our understanding of sweetpotato genomics and facilitates further research in this field.
-
The authors confirm contribution to the paper as follows: study conception and design: Li Y, Liu T Zhu G; data analysis: Liang B, Zhou Y, Liu T, Wang M, Li Y, Liu Y, Liu YH; draft manuscript preparation and revision: Li Y, Liu T, Zhu G. All authors reviewed the results and approved the final version of the manuscript.
-
The gff3 file for the v1.0.a2 annotation, and the gff3 file for the miRNA annotation can be accessed at the following URL:
https://github.com/yplee614/Sweetpotato-genome-annotation . Additionally, the raw RNA-seq reads can be found in the NCBI Sequence Read Archive; for more details, please refer to Supplemental Table S1. This work was supported by the Scientific Research Start-up Fund Project of Hainan University (RZ2300002728), The earmarked fund for CARS-10-Sweetpotato, the specific research fund of The Innovation Platform for Academicians of Hainan Province (YSPTZX202206), and Hainan Province Science and Technology Special Fund (ZDYF2020226).
-
The authors declare that they have no conflict of interest.
-
accompanies this paper at (https://www.maxapress.com/article/doi/10.48130/tp-0024-0009)
-
Received 21 October 2023; Accepted 23 January 2024; Published online 21 March 2024
-
The updated annotation, named v1.0.a2, includes 42,751 gene models, with 97.4% complete BUSCOs.
The updated annotation have modified or added 31,771 gene models and identified 8,736 genes with alternatively spliced isoforms.
We have introduced a new gene ID nomenclature (IbXXGXXXXX) as an improvement over the previous nomenclature (gene.gXXXXX).
-
# Authors contributed equally: Bei Liang, Yang Zhou
- Supplemental Table S1 RNA-seq datasets used in this study.
- Supplemental Table S2 The Locus IDs for modified genes in both v1.0.a1 and v1.0.2a.
- Supplemental Table S3 GO, KEGG and functional annotation of annotated genes.
- Supplemental Table S4 Comparison of transcription factors and protein kinases betweem v1.0.a1 and v1.0.a2.
- Supplemental Table S5 Primers used for verification of new Gene models
- Supplemental Table S6 Expression profiles of annotated miRNA across different stages of storage roots.
- Supplemental Table S7 Predicted target genes of miRNAs in Taizhong 6 genome.
- Supplemental Fig. S1 The alignment of Sanger sequencing and the latest annotations (v1.0.a2) was performed to compare the two sequences.
- Copyright: © 2024 by the author(s). Published by Maximum Academic Press on behalf of Hainan University. This article is an open access article distributed under Creative Commons Attribution License (CC BY 4.0), visit https://creativecommons.org/licenses/by/4.0/.
-
About this article
Cite this article
Liang B, Zhou Y, Liu T, Wang M, Liu Y, et al. 2024. Genome reannotation of the sweetpotato (Ipomoea batatas (L.) Lam.) using extensive Nanopore and Illumina-based RNA-seq datasets. Tropical Plants 3: e008 doi: 10.48130/tp-0024-0009 

Genome reannotation of the sweetpotato (Ipomoea batatas (L.) Lam.) using extensive Nanopore and Illumina-based RNA-seq datasets
- Received: 21 October 2023
- Revised: 20 January 2024
- Accepted: 23 January 2024
- Published online: 21 March 2024
Abstract: Sweetpotato (Ipomoea batatas (L.) Lam.) is a globally cultivated root crop of paramount significance. The hexaploid genome, known as 'Taizhong 6', has been sequenced and serves as a crucial reference genome for sweetpotato and related species within the Convolvulaceae family. However, the current annotation of the sweetpotato genome relies primarily on ab initio predictions and, to a lesser extent, transcriptome datasets, which only predict coding sequences. Therefore, an improved annotation is highly desirable. Here, we present a comprehensive reannotation of the sweetpotato genome, leveraging 12 Nanopore full-length RNA libraries and 190 Illumina RNA-seq libraries. The improved annotation, named v1.0.a2, includes 42,751 gene models, with 97.4% complete BUSCOs. Within this comprehensive set of gene models, we have modified or added 31,771 gene models and identified 8,736 genes with alternatively spliced isoforms. We have also introduced a new gene ID nomenclature (IbXXGXXXXX) as an improvement over the previous nomenclature (gene.gXXXXX). Additionally, we have annotated and provided expression levels of miRNAs and their targets at different storage roots stages. Overall, our study contributes to an updated genome annotation for the sweetpotato genome, which will significantly facilitate gene functional studies in sweetpotato and promote genomic analyses across the Convolvulaceae family.
-
Key words:
- Sweetpotato /
- Genome annotation /
- Illumina-RNAseq /
- Nanopore-RNAseq /
- Manual curation