


-
Lettuce (Lactuca sativa L.), a self-fertilizing diploid species (2n = 2x = 18) from the Asteraceae (formerly Compositae) family, is a globally significant leafy vegetable. It is primarily cultivated in temperate regions and is a cornerstone of fresh and ready-to-eat culinary applications, particularly salads. Its versatility and nutritional value, encompassing essential vitamins, dietary fiber, flavonoids, and various bioactive compounds, contribute to its widespread appeal[1,2]. The United States stands as the world's second-largest lettuce producer, after China. Over 90% of the domestic supply originates from California and Arizona, with California's Salinas Valley, often dubbed the 'Salad Bowl of America,' being a pivotal production hub. In 2024, the total farm gate value for lettuce in the US surpassed
$\text{\$} $ The underlying cause of TB is commonly attributed to a localized calcium (Ca) deficiency in rapidly growing young tissues[6]. Calcium, an essential nutrient, is predominantly translocated via the transpiration stream in the xylem and exhibits poor remobilization from older to younger tissues through the phloem[7]. Consequently, rapidly expanding leaves in the interior of the head, or under conditions of high growth rates, may not receive adequate Ca supply, even in soils with ample Ca content[8]. While factors exacerbating TB, such as high temperatures, light intensity, and reduced transpiration, are well documented[9−18], effective management remains elusive. Breeding for resistance is the most viable long-term solution[4], yet it is complicated by a polygenic architecture where early-generation selection is often ineffective[19].
Quantitative trait locus (QTL) mapping in biparental populations has identified several genomic regions associated with TB resistance. Significant loci have been reported on chromosomes 1 and 5[20,21], with some regions narrowed to candidate genes involved in calcium transport[22]. However, these findings are often specific to the iceberg (crisphead) market type and may collocate with traits such as leaf development, core height, or head firmness[5,23,24]. This suggests that many identified loci may represent pleiotropic effects of plant architecture rather than direct mechanisms of localized Ca homeostasis. The genetic architecture of TB in a broader, more diverse context remains largely unexplored, and an integrated analysis of how TB responses interface with plant physiology across the species is currently missing.
To address this knowledge gap, we utilized a large diversity panel of 498 lettuce accessions. While this panel has been used to map other traits[25,26], its potential for dissecting the genetic architecture of TB remains untapped. By evaluating this population over six years in the Salinas Valley, our study is uniquely positioned to move beyond simple trait-marker associations by integrating structural equation modeling (SEM) and GWAS on residual traits. We hypothesized that TB resistance is controlled by two distinct classes of loci: mediated loci linked to bulk leaf Ca content and developmental rate, and independent loci that operate via localized signaling or cellular integrity pathways independent of bulk Ca status. The objectives of this study were to: (1) determine the relationships between Ca content, plant developmental rate (DS), and biomass (PB) across a diverse panel; (2) perform GWAS to identify stable QTLs for TB, and (3) identify candidate genes that differentiate between growth-mediated and signaling-dependent resistance mechanisms.
-
A diverse panel of 498 lettuce accessions, representing substantial genetic variation in horticultural types and geographic origins, was utilized for this study. The panel draws from a broad array of sources, including commercial varieties, advanced breeding lines, plant introductions, and selected individuals from recombinant inbred line populations, encompassing eight distinct horticultural types: Batavia, butterhead, iceberg, Latin, leaf, oilseed, romaine, and stem lettuce[25,26]. While the plurality of the accessions that can be strictly classified phenotypically resemble romaine-type lettuce, several accessions cannot be categorized into the typical horticultural types due to their complex origin (intercrossing between types). Genetic analyses of the population structure identified the most likely number of subpopulations as either three or eight, which best explained genetic relatedness among accessions in this diversity panel[26]. The average linkage disequilibrium (LD) decay distance has been estimated to be 9.6 Mb[25].
Experimental design
-
Plants were grown under field conditions at the experimental farm of the USDA-ARS research center in Salinas, California, USA, over six years (2016 to 2021) in multi-environment trials (MET approach). During this period, between one and four experiments were performed annually. Standard horticultural practices for the area were maintained throughout the growth period[27]. The seeds were sown into raised beds, approximately 1 m in width, which facilitated two parallel seedlines spaced about 35 cm apart. Following emergence, plants were manually thinned to establish a final in-seedline spacing of 30 cm, resulting in a target number of 20 to 30 plants per evaluated plot.
Experiments were planted using either a Randomized Complete Block Design (RCBD) with three replications or an Augmented Randomized Complete Block Design (ARCBD)[28] with 39 control accessions replicated in three blocks. The ARCBD was employed in certain experiments due to limitations in field space and resources that did not allow three replications of all 498 accessions. The 39 replicated, control accessions were randomly selected from the panel. This ARCBD allowed us to efficiently evaluate the entire accession panel while providing internal spatial replication and adjustment for field heterogeneity. For experiments where full replication was possible (RCBD), all lines were replicated three times. In RCBD experiments, data from the three blocks were averaged for each accession prior to statistical analyses. When the ARCBD was applied, the replicated control accessions were used to calculate Least-Squares means (LS means) to account for possible differences among field blocks.
Phenotypic evaluation and mineral analysis
-
Tipburn (TB, Fig. 1) incidence was assessed visually at five experiments conducted across four of the study years, at whole head market maturity. For TB evaluation, five or 10 plant heads (number varied across experiments) were harvested from each plot, cut open, and the number of heads showing TB was expressed as a percentage of analyzed heads. Data were recorded as an incidence percentage.
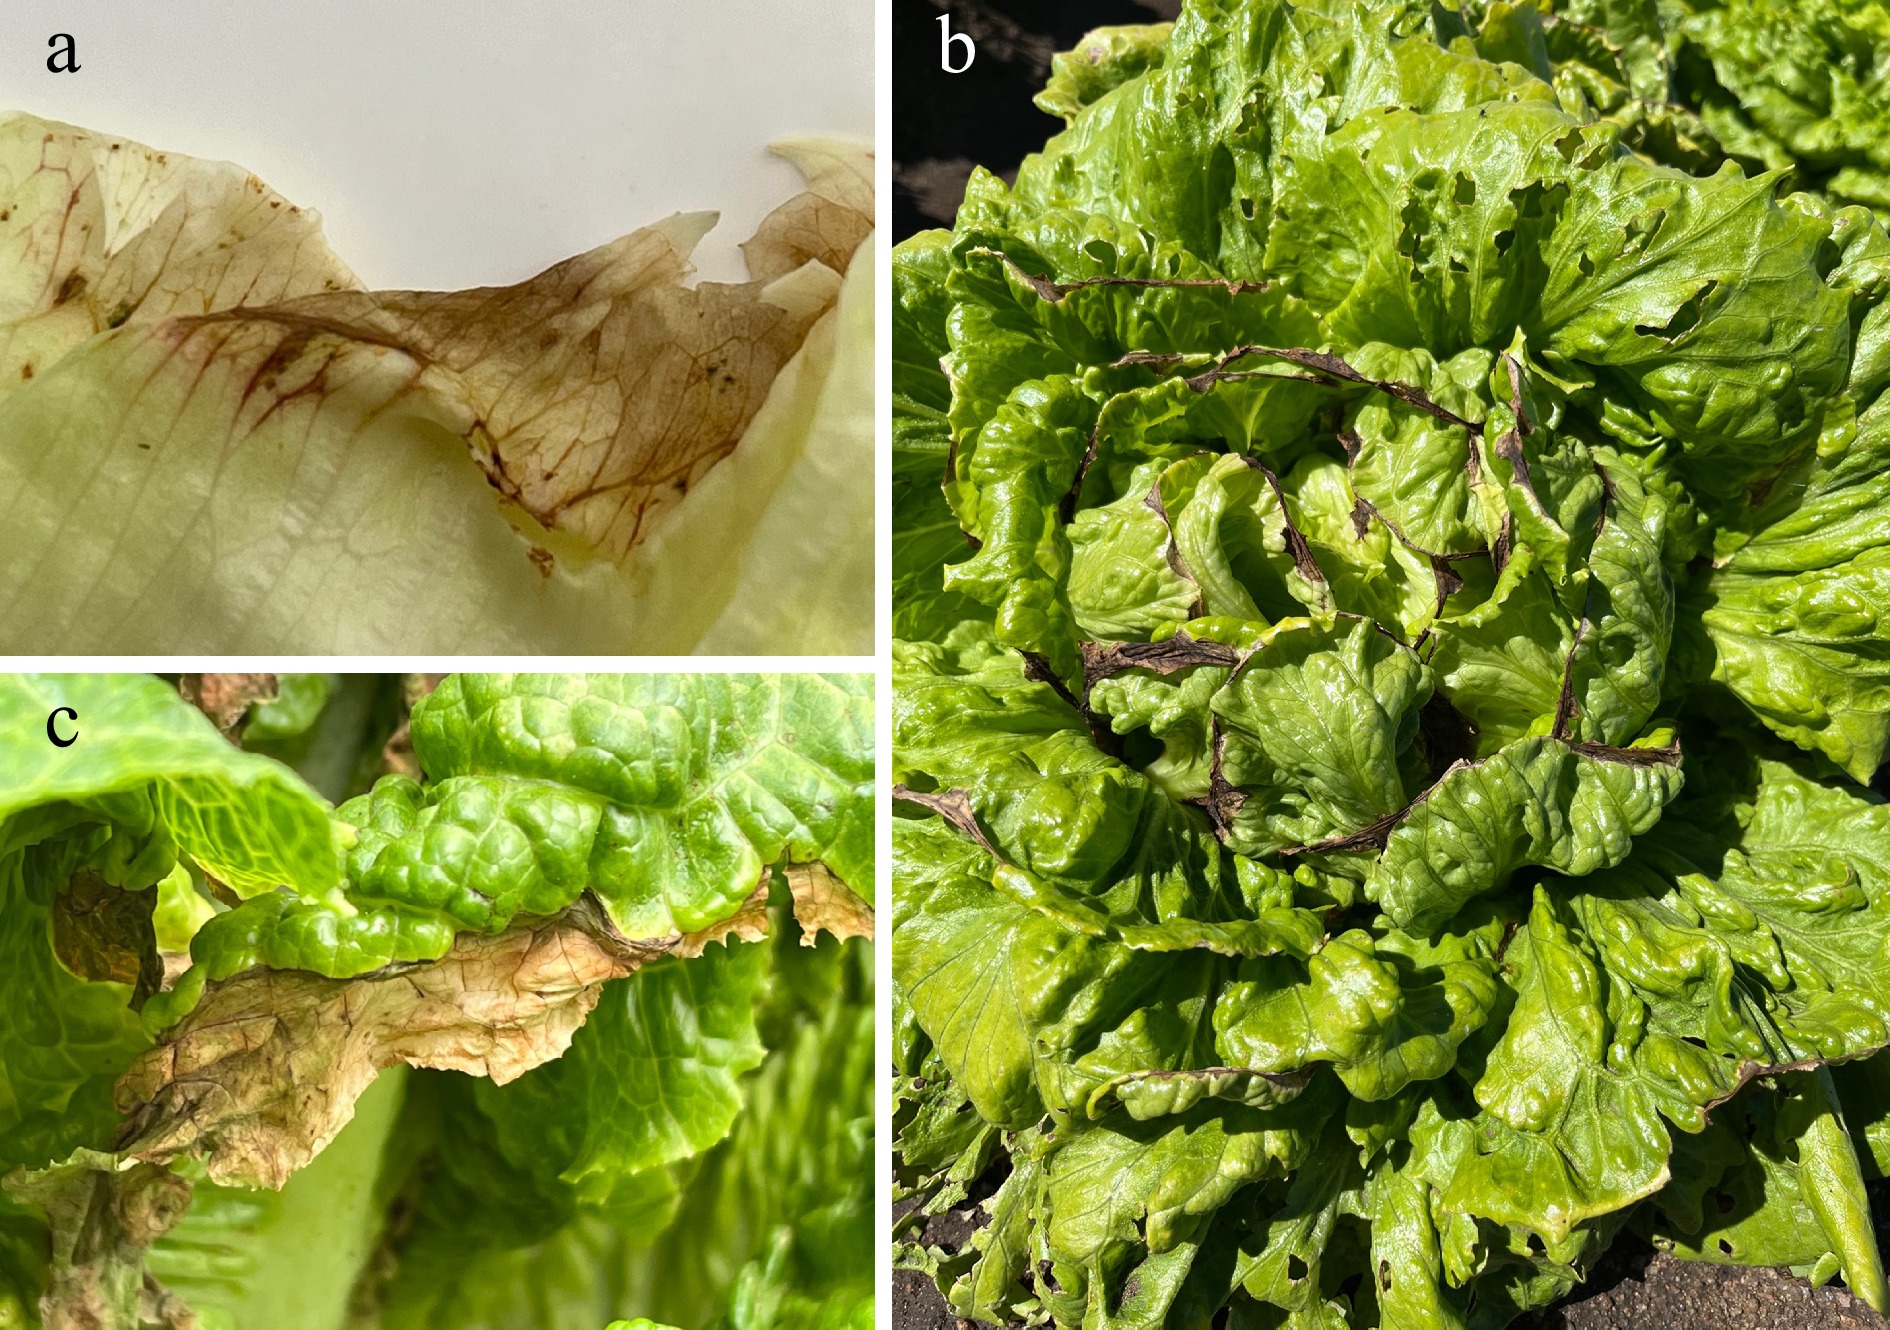
Figure 1.
Tipburn symptoms on lettuce leaves. (a) The initial stage is characterized by the darkening of veins near the leaf margins, which is rapidly followed by the development of (b), (c) necrotic, dark areas. These symptoms can manifest in a very short time under conditions conducive to tipburn development.
Developmental Score (DS) was assessed in 13 experiments over 5 years on all plants per plot at the time when cv. Salinas reached harvest maturity. A scale from 1 to 7 was used to evaluate DS (1 = rosette; 2 = bolting-visible internode elongation; 3 = visual buds; 4 = expanded inflorescence; 5 = flowering–opening of first flower; 6 = more than half of buds flowered; 7 = open involucres)[29].
Plant Biomass (PB) was assessed as the fresh weight of five sampled plants per plot at harvest time. This measurement represents the total accumulated above-ground plant tissue prior to trimming typically performed for commercial sale.
Bulk calcium (Ca) content was measured in tissue collected from a leaf positioned in the middle of the plant at harvest time. Approximately 20 g of fresh tissue was harvested and oven-dried at 70 °C for about 24 h. Samples were then shipped to Wallace Laboratories (El Segundo, California, USA) for analyses performed using the standard analytical method. Ca concentration is expressed in mg·kg−1 dry weight.
Genotyping and population structure analysis
-
Genotyping of the diversity panel was performed using tunable Genotyping-By-Sequencing (tGBS) markers[30] by Data2Bio (Ames, Iowa, USA) as previously described in detail[26]. The original set of 2,314,942 polymorphic sites[31] was filtered to maintain a subset of 4,615 high-quality single-nucleotide polymorphism (SNP) markers. Filtering criteria included a missing data rate of ≤ 10%, heterozygosity of ≤ 10%, and a minor allele frequency (MAF) of ≥ 5%.
Principal component analysis (PCA) was conducted on the SNP marker data to infer population structure, retaining the first three principal components (PCs) for subsequent analyses. A kinship matrix (K matrix) was calculated using the centered Identity-By-State (IBS) method implemented in TASSEL 5[32] to estimate pairwise genetic relatedness among accessions.
Heritability estimates
-
For each trait, variance components were estimated using a mixed linear model with experiments treated as fixed effect and accessions and accession by environment interaction as random effect. Trait broad sense heritability (H2) across experiments was then calculated as H2 = VG/(VG + (VGxE + VE)/N), where VG is genotypic variance among the accessions, VE is environmental variance within a specific experiment, VGxE is accession-by-environment interaction variance, and N is the number of experiments where the trait was tested.
Statistical analyses of traits
-
To obtain overall trait values for statistical analyses, data from multiple experiments for the same trait were pooled. This approach was chosen to evaluate the overall effect of each factor on TB rather than annual changes, and also because not all traits were always evaluated in the same experiments.
Pearson linear correlation coefficients were calculated between all pairs of traits (TB, PB, DS, Ca) to determine their interrelationships and influence on TB. Because both PB and DS showed a significant (p < 0.05) correlation with TB and Ca, several statistical models were tested to visualize their combined effect. The models evaluated included full factorial, polynomial, response surface, Scheffe cubic, and partial cubic models. The best model, selected based on Akaike Information Criterion (AIC), was the response surface model (RSM). This model was subsequently used to calculate predicted TB (pTB) and predicted Ca (pCa) values, which were then used to visualize relationships between PB, DS, and TB or Ca, respectively.
To test the combined effect of PB, DS, and Ca on TB, a response surface model was applied. This model included TB as the dependent variable, and PB, DS, Ca, and the three principal components (PC1, PC2, and PC3) as independent variables. The principal components were included in the model to account for the population structure present in this diversity panel[26]. The model was used to calculate expected values of TB that incorporate the Ca effect (expected TB with Ca effect, ecTB). Residuals from observed values (rcTB = TB − ecTB) were also calculated. Additionally, two separate response surface models were developed: one for TB as the dependent variable with PB, DS, and PCs as independent variables to calculate expected (eTB) and residual values of TB (rTB = TB − eTB) not related to the Ca effect; and another for Ca as the dependent variable with PB, DS, and PCs as independent variables, to calculate expected (eCa) and residual values of Ca (rCa = Ca − eCa). These residual values (rTB, rcTB, and rCa) were subsequently used in GWAS to detect Quantitative Trait Loci (QTL) for the particular trait while accounting for covariance with other included traits. All statistical analyses were performed in JMP Pro 18 (SAS Institute, Cary, North Carolina, USA).
Structural equation modeling (SEM)
-
To investigate the direct and indirect causal relationships between TB, DS, PB, Ca, and the population structure, structural equation modeling (SEM) was performed. A conceptual model was developed hypothesizing that the genetic background of accessions, as represented by the three PCs (PC1, PC2, and PC3), directly influences DS and PB as well as their respective quadratic terms (DS2 and PB2). The inclusion of these quadratic terms was based on the results from preliminary response surface analyses. Furthermore, the model proposed that DS, DS2, PB, and PB2, either individually or in combination, directly affects both TB and Ca. The model also considered potential direct effects from each PC to TB and Ca.
Two sets of nested models were tested: one where the direct effect of Ca on TB was included, and another where this effect was not considered. The models were fitted using JMP Pro 18. Model fit was evaluated using standard fit indices, including AIC, Bayesian Information Criterion (BIC), Comparative Fit Index (CFI), the Chi-square test, Root Mean Square Error of Approximation (RMSEA), and Standardized Root Mean Square Residual (SRMR). Path coefficients were estimated to quantify the strength and direction of the hypothesized relationships within the selected model.
To refine the model, a stepwise elimination process was employed. Paths that were not statistically significant at p < 0.05 were gradually removed, retaining only the significant relationships within the final model.
Genome-wide association study (GWAS)
-
Genome-Wide Association Study (GWAS) was performed using TB, rTB, rcTB, DS, PB, Ca, and rCa values with the TASSEL software. Because TB, DS, and PB values originated from multiple experiments (MET approach), these were entered into TASSEL to perform a joint GWAS that calculates a combined association effect across all environments. This involves fitting the model where environment, genotype, and their interaction are included as effects, alongside the standard K matrix. A Mixed Linear Model (MLM) that incorporated both population structure and kinship as covariates was applied to minimize spurious associations. Statistical significance for marker-trait associations was determined using a False Discovery Rate (FDR) of 5% for multiple testing correction. p-values of results are presented as −log10 (p-value), referred to as a LogWorth (LW) score.
Given that multiple, closely linked significant SNP markers can indicate a single underlying trait association, these markers were consolidated into a single associated genomic region if the physical distance between any two loci was less than 20 Mb. This distance was chosen because it approximates twice the average LD decay observed within this diversity panel[25]. For a more systematic classification of these genomic associations, the lettuce reference genome was partitioned into 10 Mb BINs (e.g., BIN 1.01–9.20)[33]. Each BIN designation specifies its chromosome number and its specific 10 Mb location on that chromosome (for example, BIN 1.01 corresponds to the first 10 Mb segment of chromosome 1). The relevant BIN information is provided for each identified Quantitative Trait Locus (QTL).
Candidate gene identification and annotation
-
The genomic regions identified as putative QTLs for TB incidence were scanned against the L. sativa (cv. Salinas) reference genome[34] assembly version 11 (Lsat_Salinas_v11,
www.ncbi.nlm.nih.gov/datasets/genome/GCF_002870075.4 ). Following the confirmation of the QTL sequence via a BLAST search, a 1 Mb sequence region flanking both upstream and downstream of each QTL peak was manually curated to identify potential protein-coding and long non-coding RNA (lncRNA) sequences.Once identified, the putative gene models were analyzed to determine their specific location, predicted size, and the nature of their final product (protein or lncRNA). For protein-coding sequences, functional annotation was performed using data from multiple publicly available databases, including NCBI's Genome Data Viewer, UniProt, InterPro, the Kyoto Encyclopedia of Genes and Genomes (KEGG), and Gene Ontology (GO). This comprehensive approach allowed us to obtain key information for each gene, including its name, predicted protein function, Gene Ontology (GO) terms (Molecular Function, Biological Process, and Cellular Component), and relevant pathway information. We prioritized candidate genes with known or predicted roles in Ca homeostasis, cell wall metabolism, oxidative stress response, plant development (specifically flowering/bolting time), and hormone signaling due to their potential relevance to TB development.
To investigate allelic variation, the mRNA sequence of the top candidate gene, phosphoinositide phospholipase C (LOC111901278, PLC), from the cv. Salinas reference genome (XM_023897135.3) was used to query the NCBI database. Sequences from 20 diverse accessions available in the NCBI archive that are also present in the diversity panel were retrieved and aligned against cv. Salinas to identify SNPs. Open reading frame analysis was performed to determine corresponding amino acid (AA) differences and identify resultant haplotypes.
The complete analytical pipeline for this study, integrating SEM and residual GWAS approaches, is summarized in Supplementary Diagram 1.
-
The weather patterns in Salinas during the 2016−2021 growing seasons were relatively uniform, characterized by minimal precipitation (requiring full irrigation of all fields) and consistently cool days (average high and low daily air temperatures from April to October ranged approximately from 19 to 22 °C, and from 10 to 13 °C, respectively). As a result, plant performance was relatively uniform across experiments. Given that the mean values of DS, PB, and TB were similar across experiments, the overall value for each trait and accession was calculated as the mean of the adjusted values across all trials. These mean values were used in all subsequent statistical analyses.
The lettuce diversity panel exhibited substantial phenotypic variation for all four analyzed traits (Fig. 2). Tipburn (TB) scores ranged from 0.3% to 90.2% (mean ± SE = 39.0% ± 0.9%). Developmental Score (DS) ranged from 1.23 to 4.69 (mean ± SE = 2.38 ± 0.04). Plant Biomass (PB) ranged from 0.11 kg to 1.21 kg (mean ± SE = 0.74 kg ± 0.01). Bulk leaf calcium (Ca) content ranged from 1,874 mg·kg−1 to 14,531 mg·kg−1 (mean ± SE = 7,679 mg·kg−1 ± 106). Broad-sense heritability (H2) was highest for DS (0.970), followed by PB (0.826) and TB (0.706). The lowest H2 was determined for Ca content (0.631).
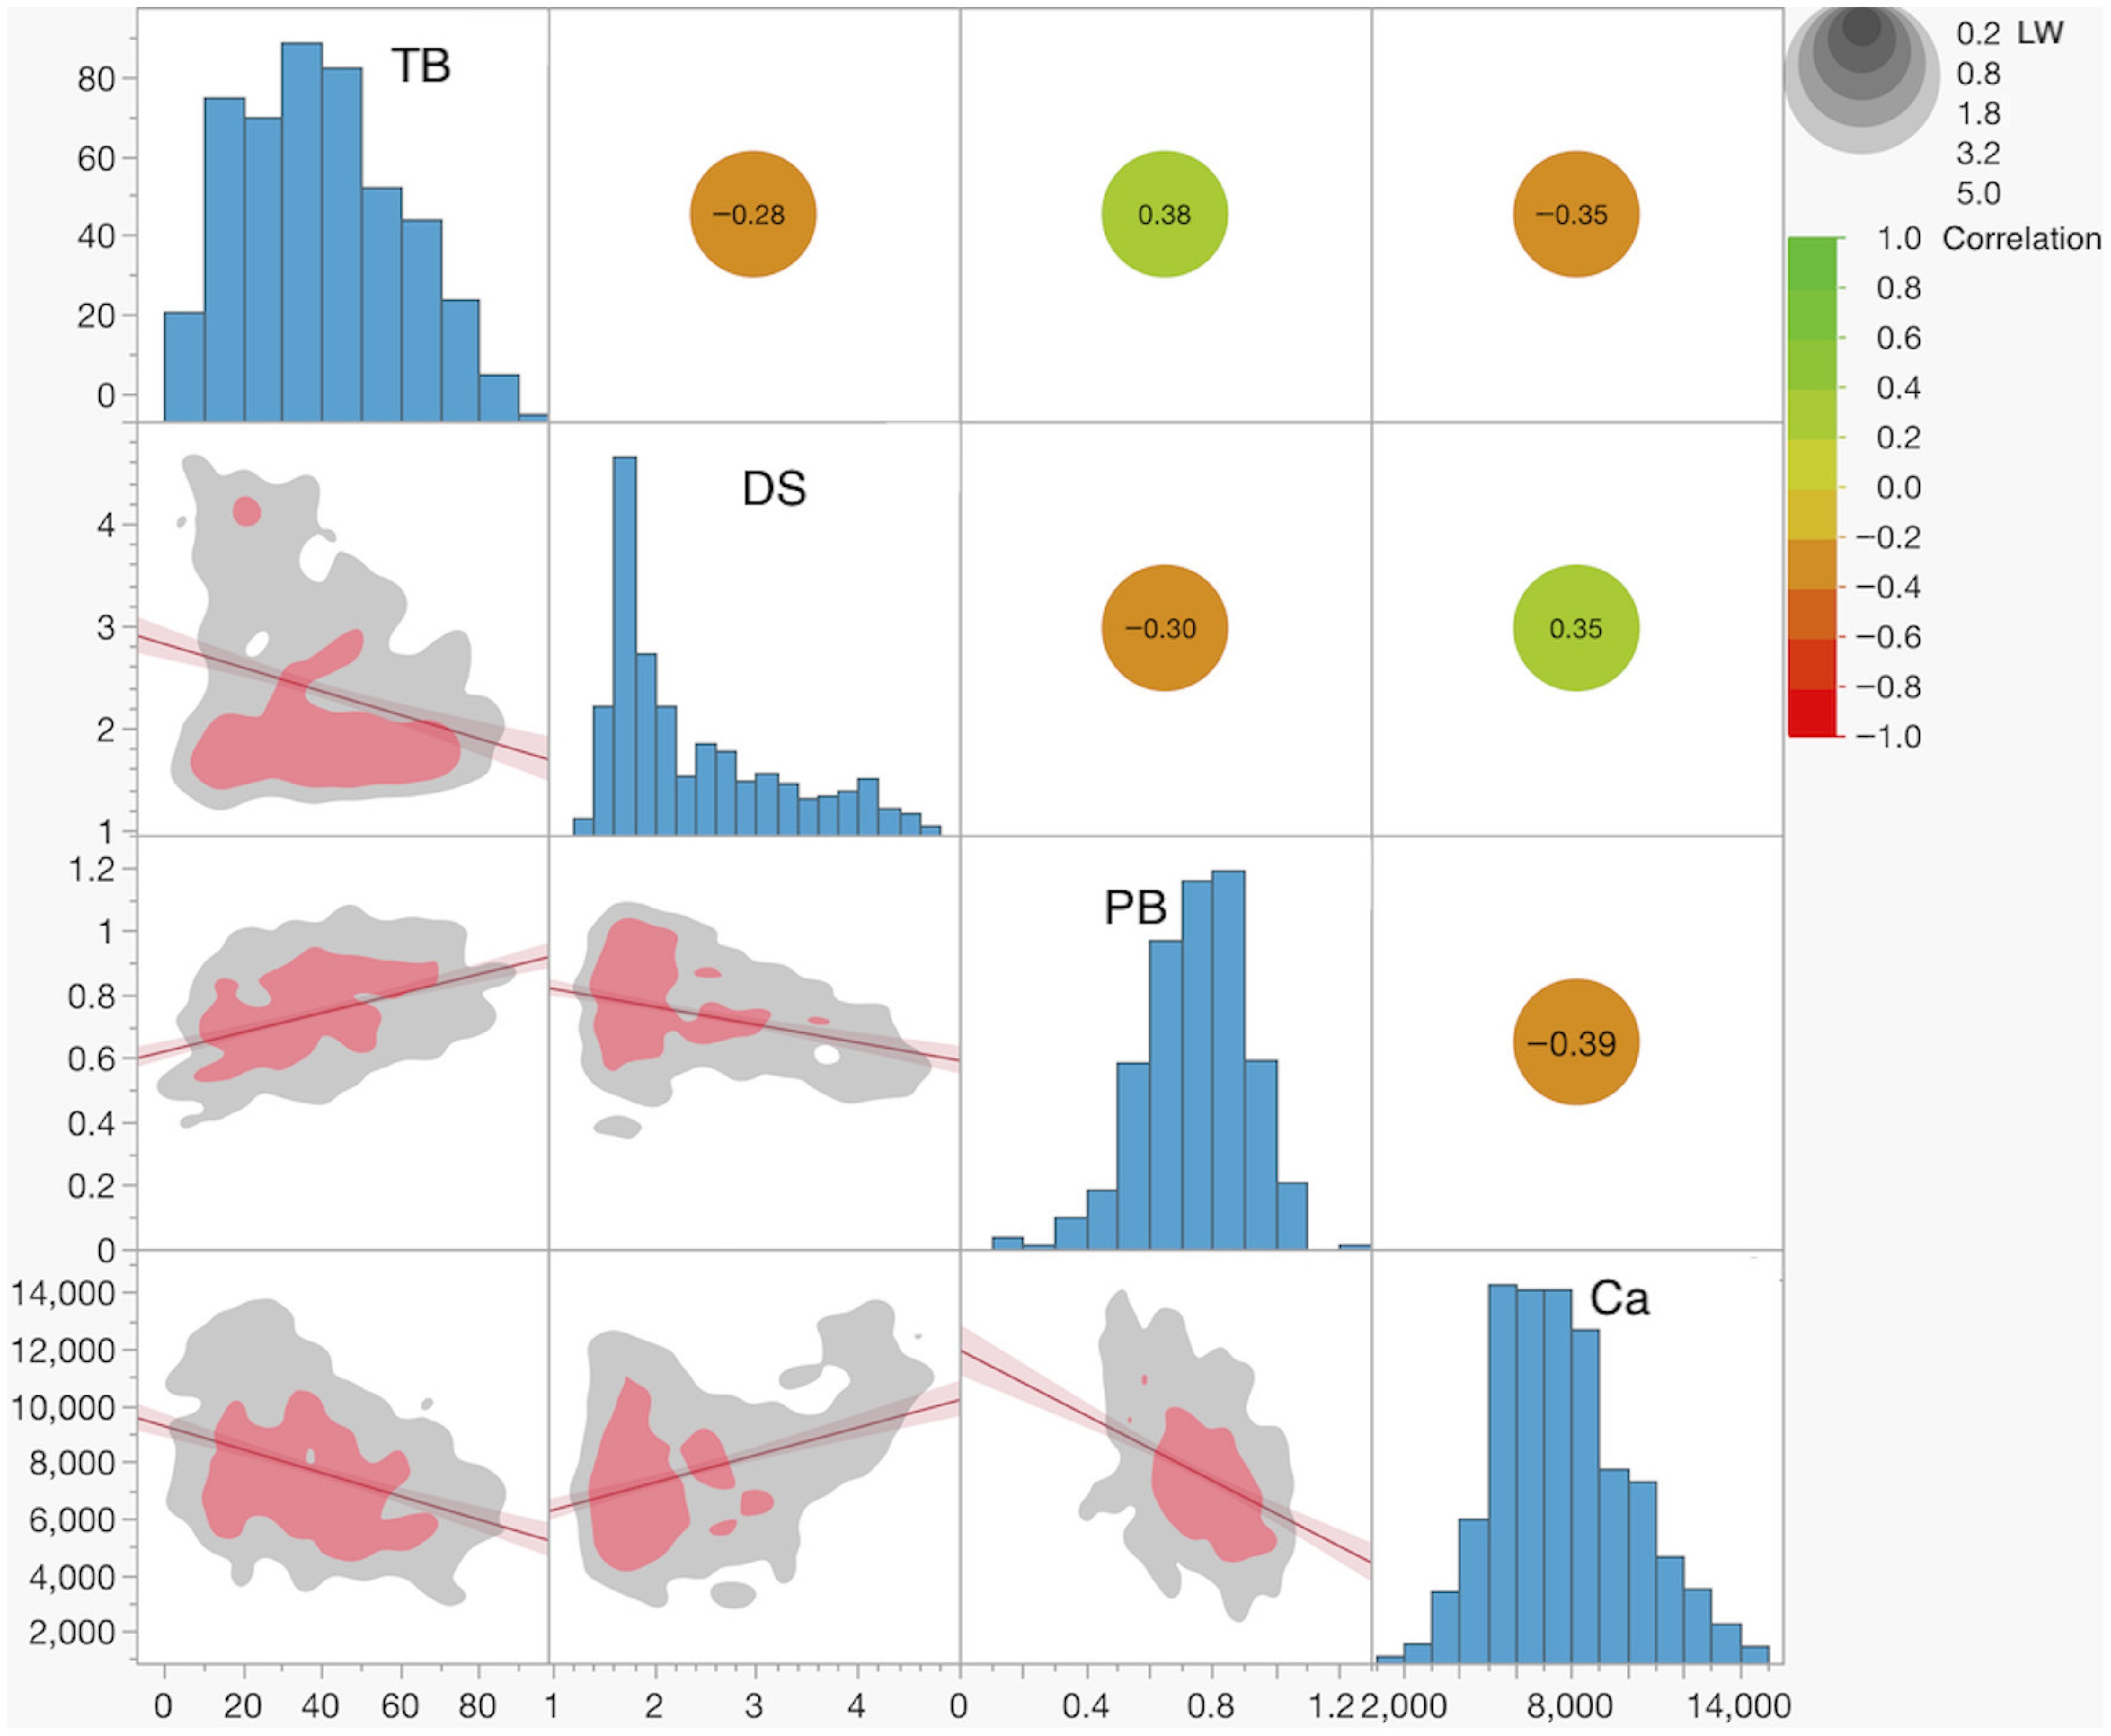
Figure 2.
Distributions of and correlations between traits. Histograms of trait values are shown in the diagonal panels. The plots below the diagonal display the linear fit between trait pairs, with the red line indicating the linear regression and the shaded red area representing the 95% confidence interval. Nonparametric data density is shown by the gray (lower density), and red (higher density) colored areas. Linear correlation coefficients between trait pairs are presented above the diagonal. The color scale indicates the magnitude of the correlation coefficient, while the gray circles represent the significance level in LogWorth (LW), a measure of statistical significance defined as −log10 (p-value).
Significant linear correlations were observed between all pairs of traits (all at p < 0.0001). Correlations with TB ranged from r = −0.35 for Ca, through r = −0.28 for DS, to r = 0.38 for PB. These correlations indicate that higher Ca content, earlier plant development (higher DS score), and lower plant weight are associated with lower TB incidence.
When TB and Ca values were fitted using response surface models with DS and PB as independent variables, both models were highly significant (p < 0.0001). The TB model was significantly affected by PB (LW = 7.3), DS2 (LW = 3.3), and PB2 (LW = 1.8), while the Ca model was significantly affected by the inclusion of PB (LW = 8.3) and DS2 (LW = 4.4). Predicted TB (pTB) and Ca (pCa) values calculated from these response surface models visually illustrate that the highest TB incidence and lowest Ca content are expected for accessions producing heavier plants that develop at a relatively slow rate (Fig. 3).
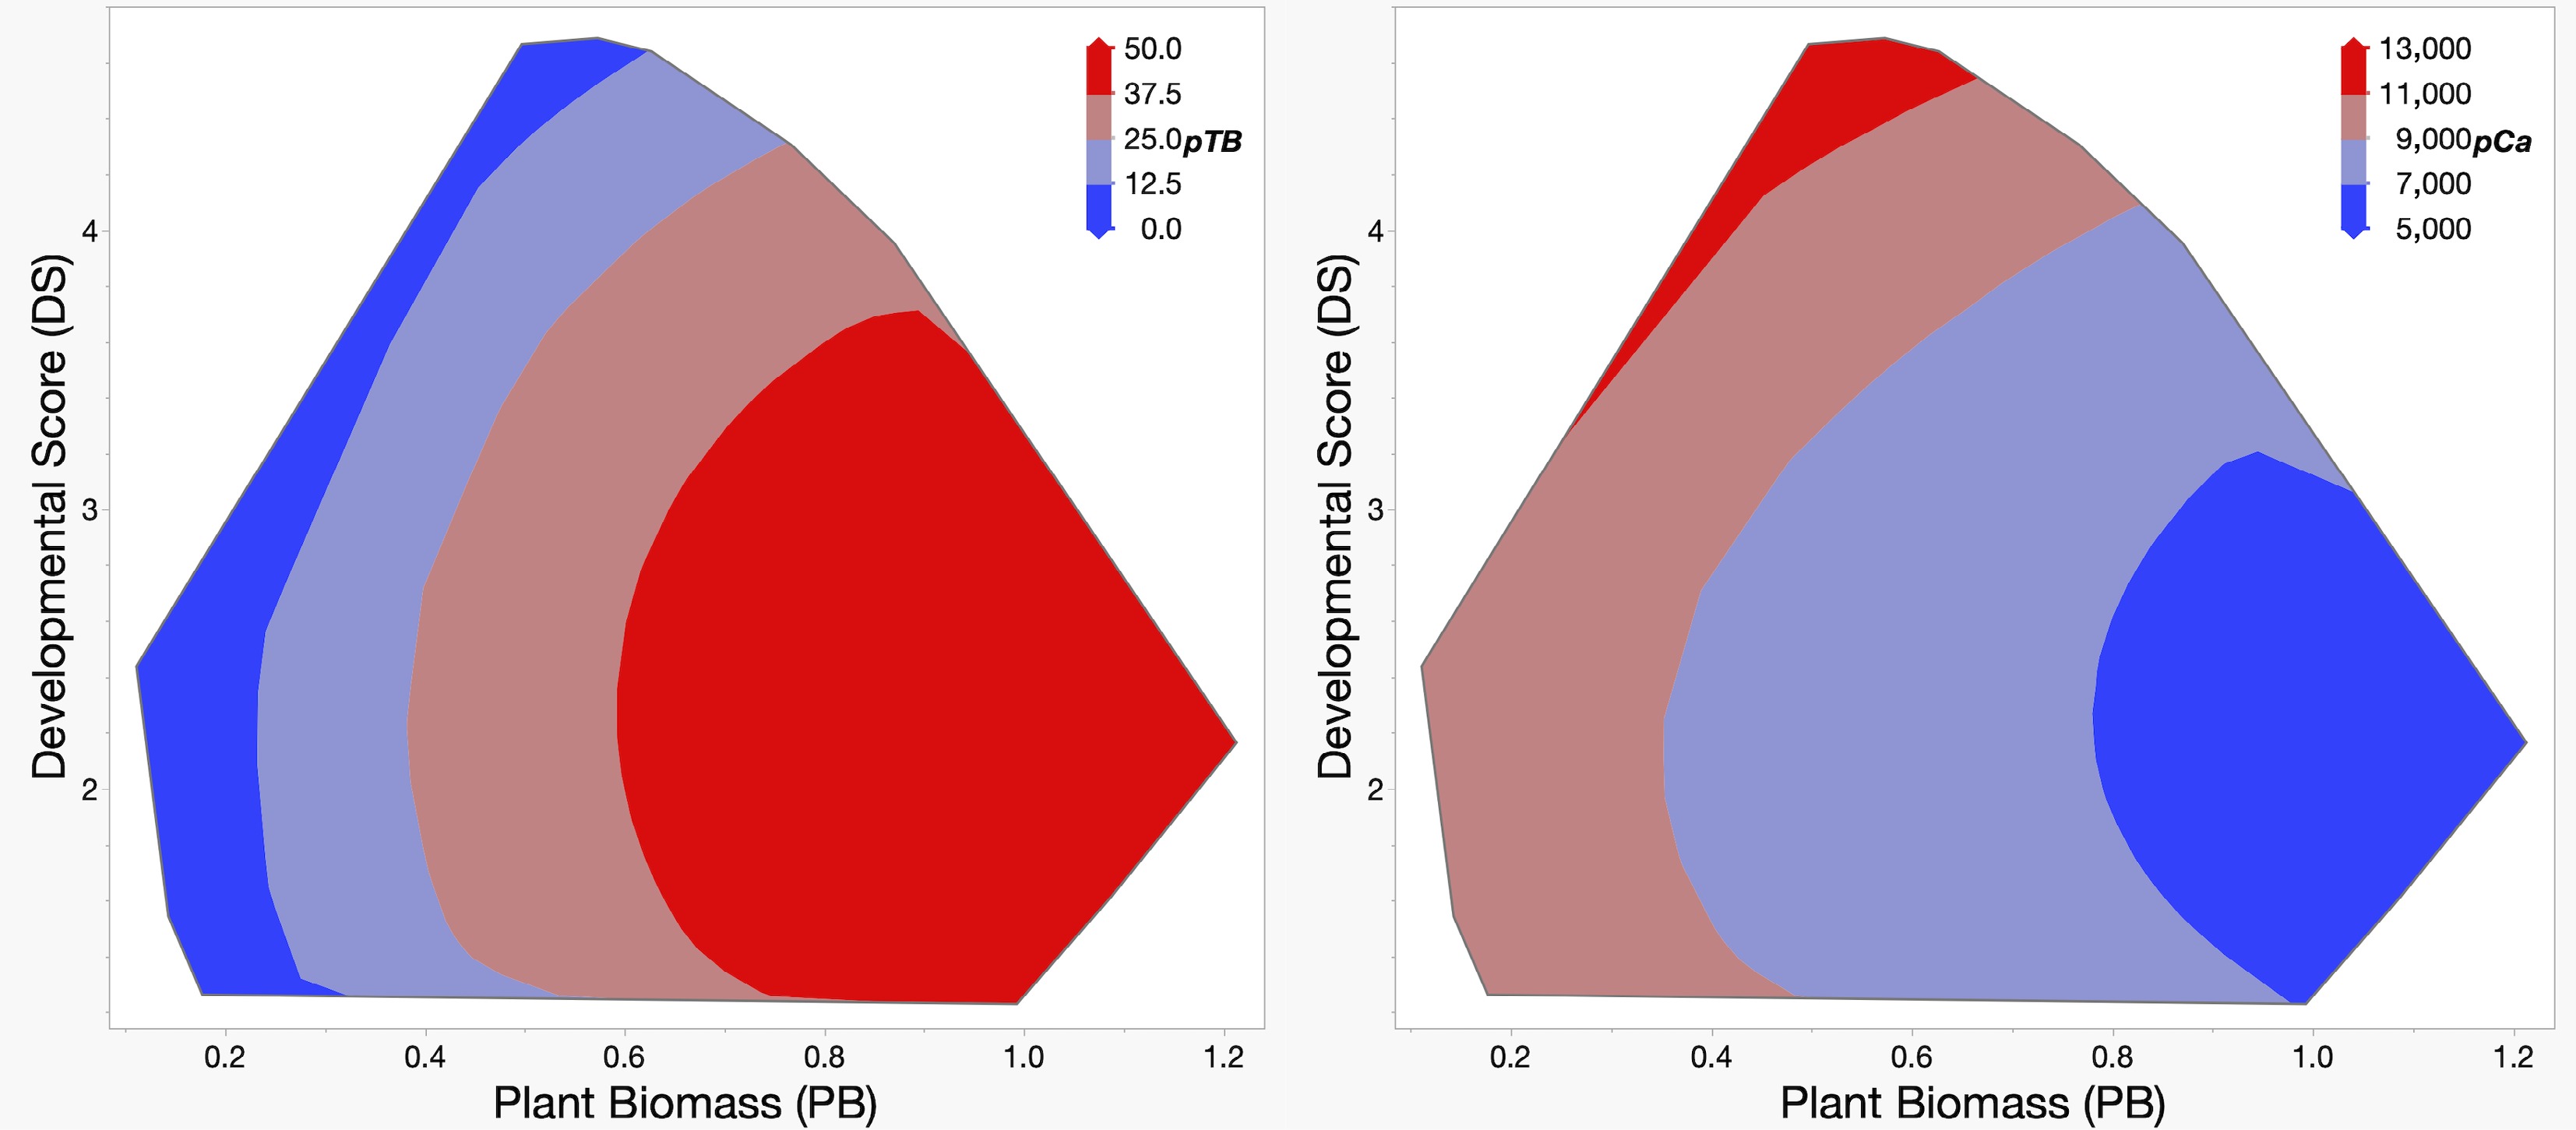
Figure 3.
Predicted values for TB incidence (pTB, left), and leaf bulk calcium content (pCa, right). Predicted values for pTB and pCa were calculated using a response surface model from plant biomass (PB, horizontal axis), and developmental score (DS, vertical axis), the traits that significantly affect both TB and Ca content. The color key in the upper right corner of each panel provides a visual guide to the predicted values.
Structural equation modeling (SEM) results
-
We performed 24 SEM analyses, exploring various combinations of relationships among the three PCs, PB, DS, Ca content, and TB. A stepwise approach was used to eliminate non-significant relationships.
The final, best-fitting model achieved a strong fit, with the lowest AIC, BIC, RMSEA (0.134), and SRMR (0.085) values from all tested models. Its CFI (0.98) also approached the ideal maximum of 1 (Fig. 4, Table 1). This model, which incorporated the effect of Ca on TB, demonstrated a significantly lower Chi-square compared to the model that excluded this relationship (Δχ2 = 14.78, ΔDF = 1, p < 0.0001). This statistical difference conclusively shows that Ca content in plants significantly influences TB incidence. This influence exists even though both TB and Ca are also affected by PB, DS (and/or their respective quadratic terms), and by the genetic background of the accessions, as represented by the three PCs.
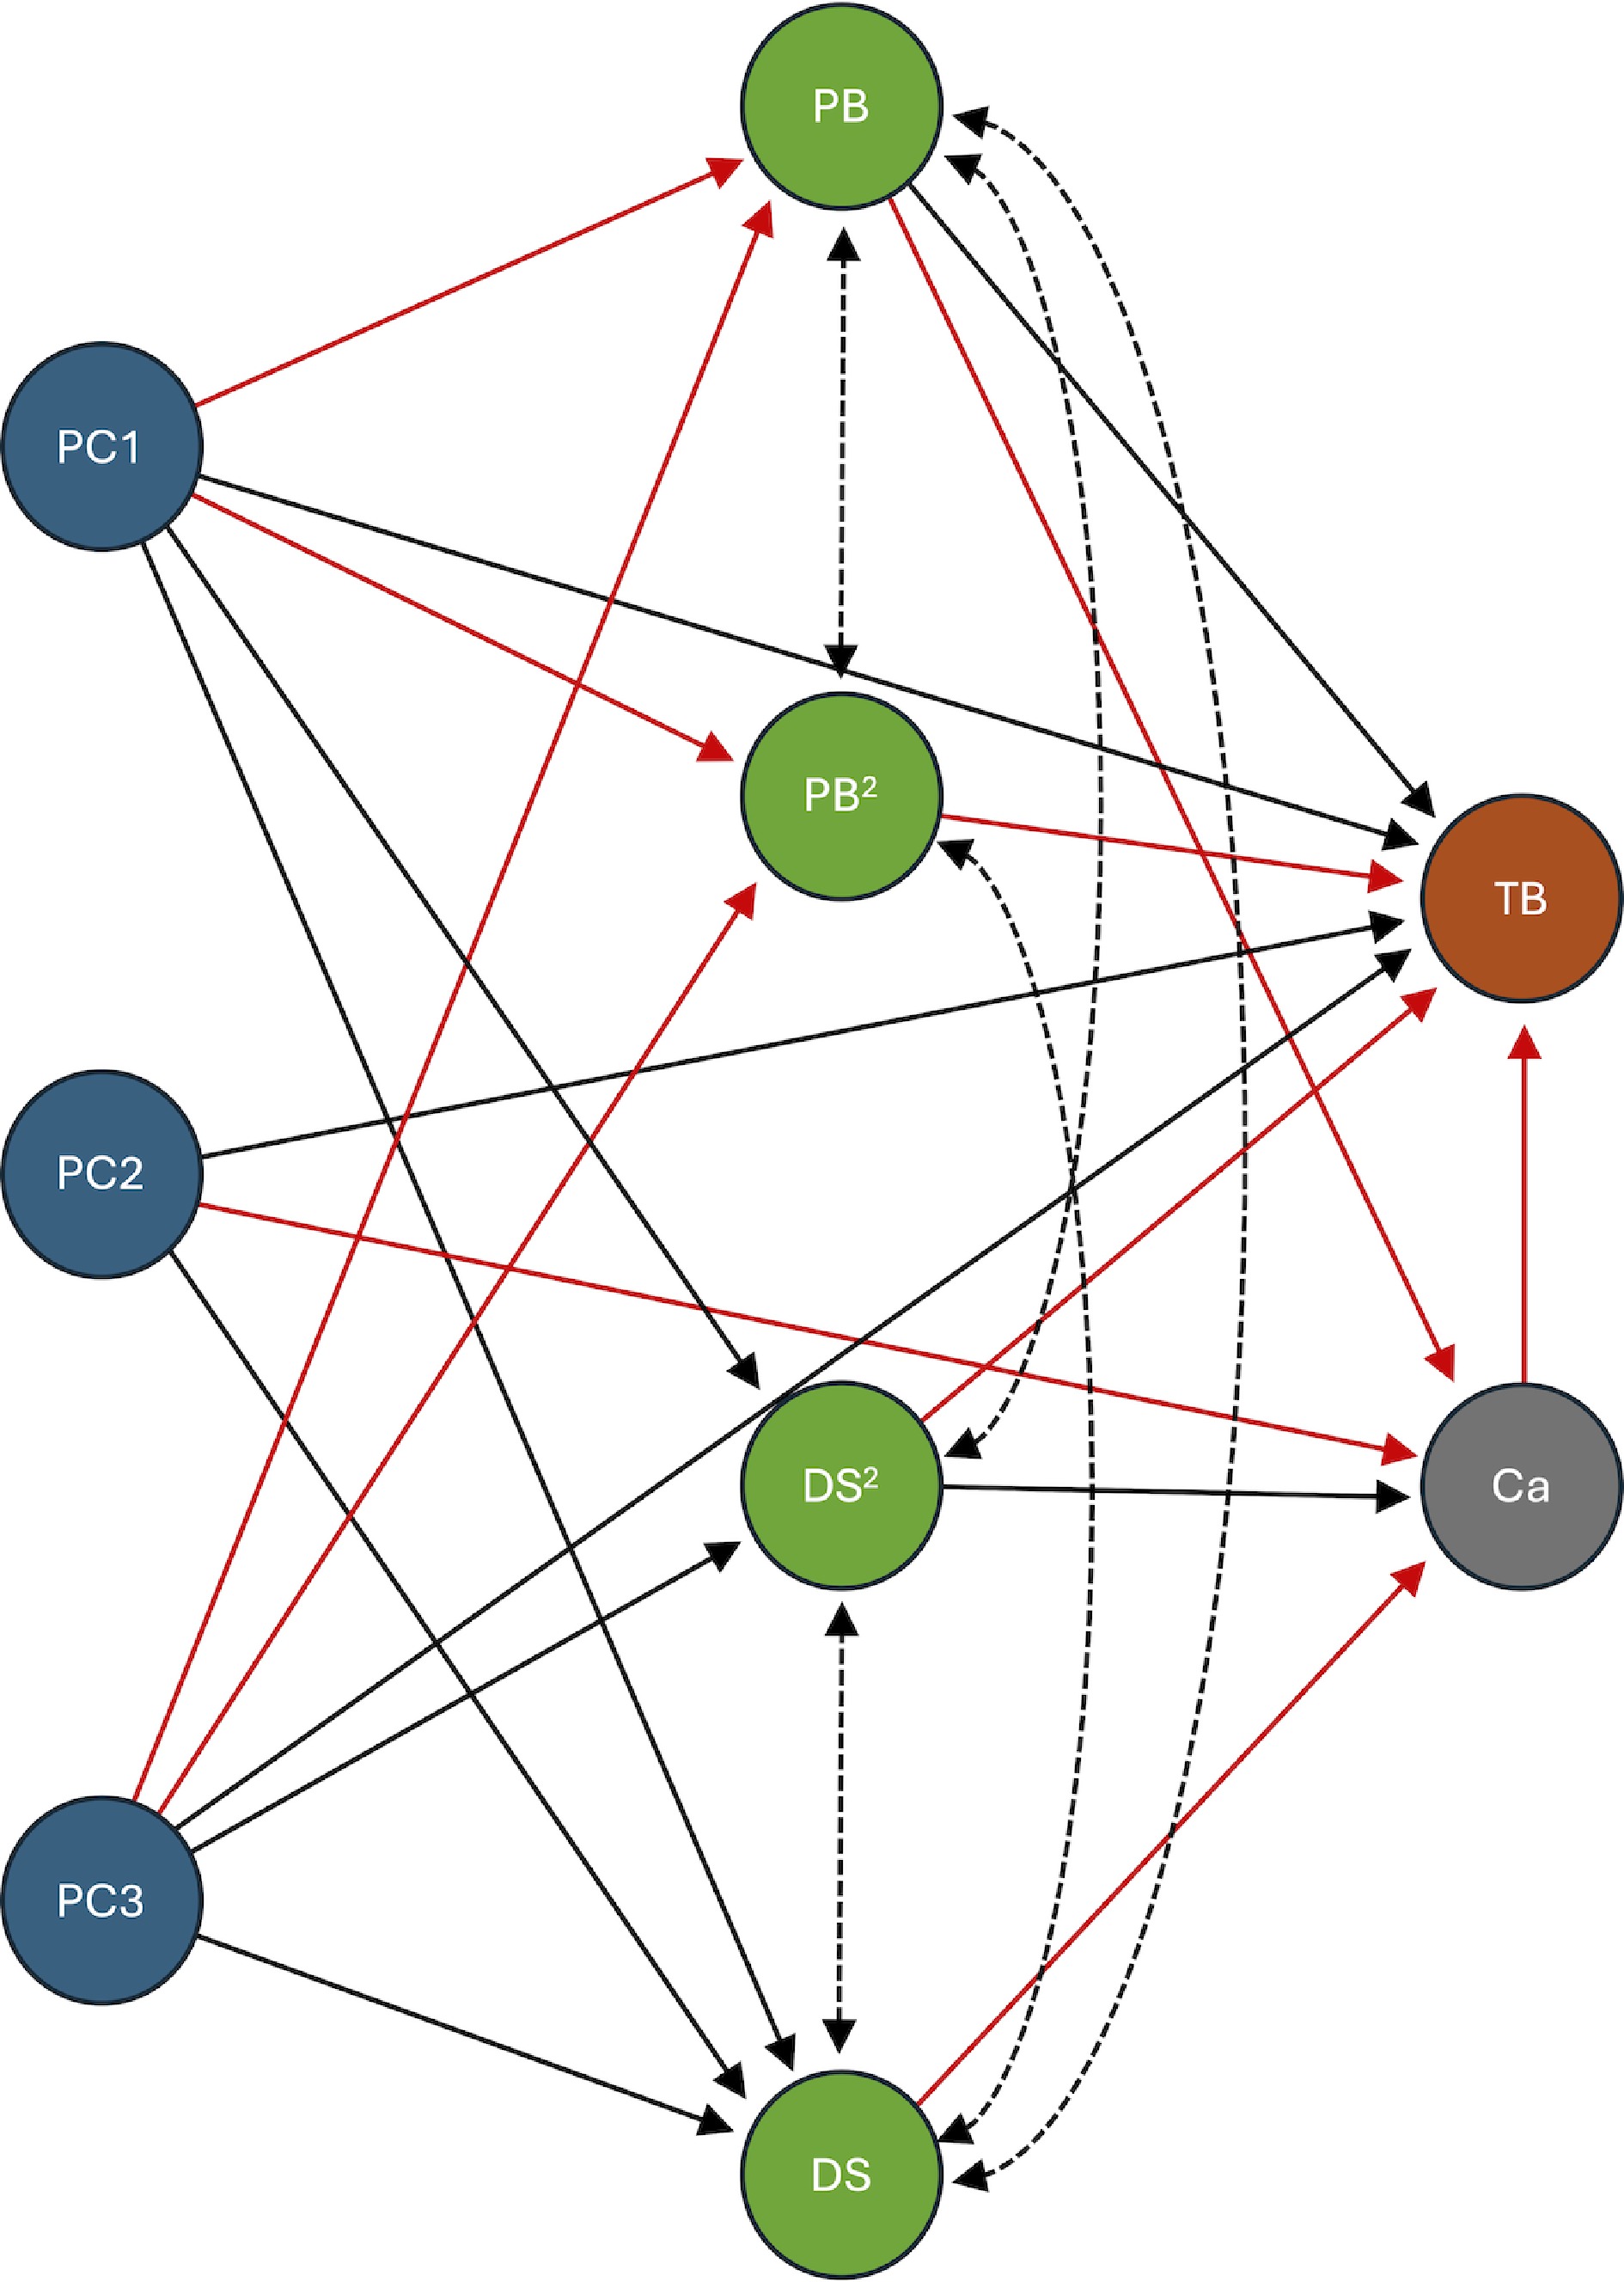
Figure 4.
Structural equation model (SEM) of genetic and physiological determinants of lettuce tipburn. This diagram illustrates the final structural equation model used to analyze the genetic and physiological determinants of lettuce tipburn. The model includes genetic variation estimated from SNP data via principal components (PC1, PC2, and PC3), shown in blue. Physiological traits, including plant biomass (PB), developmental score (DS), and their quadratic terms (PB2 and DS2), are shown in green. Calcium content (Ca) is shown in gray, and tipburn incidence (TB) is shown in brown. A stepwise elimination process was used to refine the model, retaining only the statistically significant paths (p < 0.05). Solid arrows indicate a directional, or predictive, relationship, while dotted lines indicate a non-directional, or covariance, relationship. Black lines represent a positive relationship, and red lines indicate a negative relationship. For detailed statistical results, including standardized estimates and significance values, please refer to Table 1.
Table 1. Structural equation modeling (SEM) analysis of genetic and physiological determinants of lettuce tipburn.
Group patha Pathb Standardized estimatesc LWd Physiology → Composition DS → Ca −0.823 2.38 Physiology → Composition PB → Ca −0.278 > 4.00 Physiology → Disorder PB → TB 1.016 > 4.00 Genetics → Disorder PC1 → TB 0.105 1.71 Genetics → Physiology PC1 → DS 0.352 > 4.00 Genetics → Physiology PC1 → PB −0.501 > 4.00 Genetics → Physiology PC1 → PB2 −0.503 > 4.00 Genetics → Physiology PC1 → DS2 0.337 > 4.00 Genetics → Disorder PC2 → TB 0.199 > 4.00 Genetics → Composition PC2 → Ca −0.118 2.17 Genetics → Physiology PC2 → DS 0.053 > 4.00 Genetics → Disorder PC3 → TB 0.168 > 4.00 Genetics → Physiology PC3 → DS2 0.114 2.19 Genetics → Physiology PC3 → PB2 −0.179 > 4.00 Genetics → Physiology PC3 → DS 0.093 1.59 Genetics → Physiology PC3 → PB −0.184 > 4.00 Physiology → Disorder PB2 → TB −0.712 2.85 Physiology → Disorder DS2 → TB −0.285 > 4.00 Physiology → Composition DS2 → Ca 1.161 > 4.00 Composition → Disorder Ca → TB −0.169 > 4.00 Physiology ↔ Physiology DS ↔ PB 0.039 > 4.00 Physiology ↔ Physiology DS ↔ PB2 0.013 2.05 Physiology ↔ Physiology DS ↔ DS2 0.860 > 4.00 Physiology ↔ Physiology PB ↔ PB2 0.701 > 4.00 Physiology ↔ Physiology PB ↔ DS2 0.023 2.74 a The groupings of paths based on the variable types (genetics, physiology, composition, disorder). b The relationship between two variables, where '→' indicates a directional, or predictive, relationship and '↔' indicates a non-directional, or covariance, relationship. c The standardized path coefficients representing the strength and direction of the relationship between variables. d LogWorth, a measure of statistical significance '−log10 (p-value)'. LW values of 1.301, 2, 3, 4, indicate p-values of 0.05, 0.01, 0.001, and 0.001. PC1, PC2, PC3: Principal components 1, 2, and 3, representing the major axes of genetic variation within the diversity panel. PB, PB2, DS, DS2, TB, Ca: Plant biomass and its quadratic term (PB, PB2), developmental stage and its quadratic term (DS, DS2), tipburn, and calcium content. Genome-wide association study (GWAS) results
-
GWAS identified SNP markers associated with each of the tested traits: three for TB, two for rTB and rcTB each, 12 for DS, six for PB, six for Ca, and two for rCa (Fig. 5).
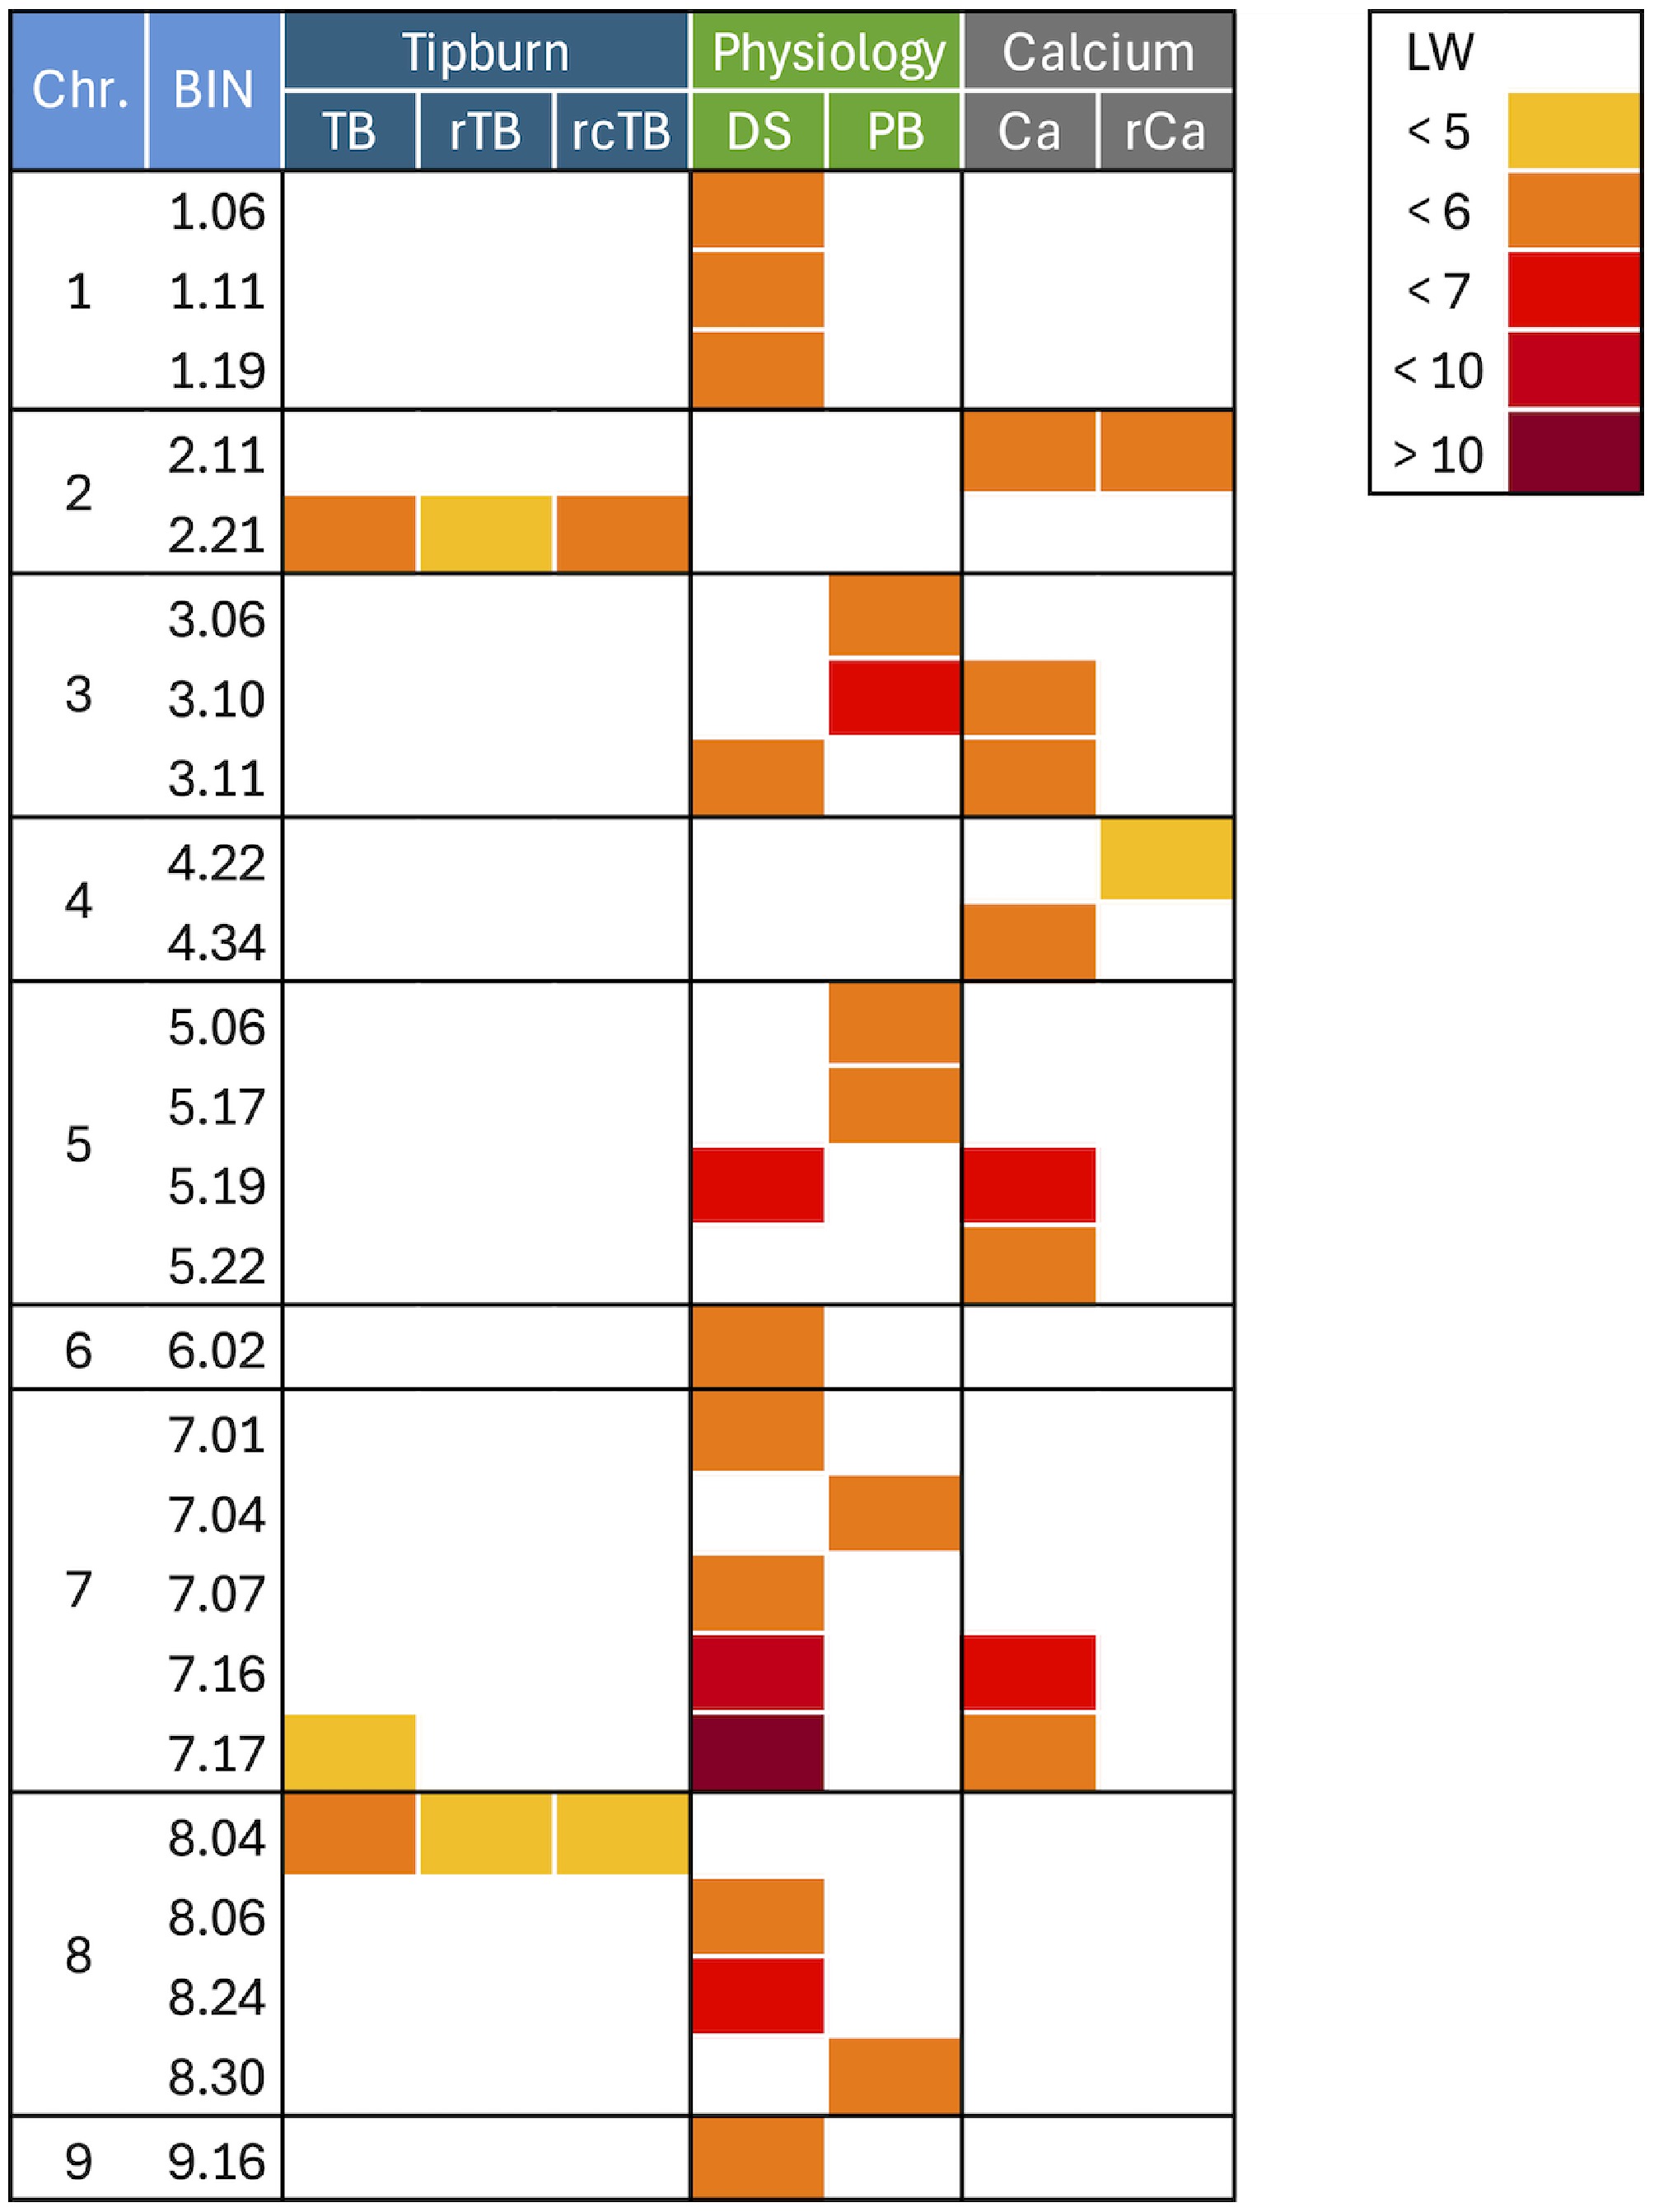
Figure 5.
Heatmap of quantitative trait loci. Visualized are the positions of significant quantitative trait loci (QTLs) across the lettuce genome. The QTLs are placed into BINs, which are identified by their chromosome number and a unique BIN identification number. The lettuce reference genome was partitioned into 10 Mb BINs, and QTLs detected on adjacent BINs are considered a single associated genomic region. The traits analyzed were: plant biomass (PB), developmental score (DS), calcium content (Ca), residual of calcium content after accounting for genetic background, PB, and DS (rCa), tipburn (TB), residual of tipburn after accounting for genetic background, PB, and DS (rTB), residual of tipburn after accounting for genetic background, PB, DS, and Ca (rcTB). The legend in the upper right corner indicates the significance of the QTLs using LogWorth (LW), a measure of statistical significance defined as −log10 (p-value).
Significant associations for raw TB were detected on chromosome 2 at BIN 2.21 (qTB2.1), chromosome 7 at BIN 7.17 (qTB7.1), and chromosome 8 at BIN 8.04 (qTB8.1) (Table 2). Two QTLs on chromosomes 2 (BIN 2.21) and 8 (BIN 8.04) were consistently detected from analyses of residual TB values accounting for DS and PB (rTB) and accounting for DS, PB, and Ca (rcTB). These two QTLs were also present in the analysis of raw TB data, indicating their robust and potentially Ca-content-independent effect on TB.
Table 2. Genome-wide association study (GWAS) QTLs for tipburn, calcium Content, and physiological traits in a lettuce diversity panel.
QTL Traita Chr.b Positionc BINd LWe Other traitsf qDS1.1 DS 1 56,082,040 1.06 5.22 − qDS1.2 DS 1 109,861,146 1.11 5.49 − qDS1.3 DS 1 187,627,615 1.19 5.55 − qCa2.1 Ca 2 107,766,218 2.11 5.77 rCa qrCa2.1 rCa 2 107,766,218 2.11 5.41 Ca qTB2.1 TB 2 202,474,259 2.21 5.66 rTB, rcTB qrTB2.1 rTB 2 202,474,259 2.21 4.99 TB, rcTB qrcTB2.1 rcTB 2 202,474,259 2.21 5.25 TB, rTB qPB3.1 PB 3 52,159,558 3.06 5.40 − qPB3.2 PB 3 99,083,545 3.10 6.07 Ca, DS qCa3.1 Ca 3 99,083,545 3.10 5.49 PB, DS qDS3.1 DS 3 107,109,727 3.11 5.60 PB, Ca qCa3.1 Ca 3 107,109,727 3.11 5.98 PB, DS qrCa4.1 rCa 4 219,238,112 4.22 4.97 − qCa4.1 Ca 4 334,262,257 4.34 5.04 − qPB5.1 PB 5 53,264,256 5.06 5.23 − qPB5.2 PB 5 162,067,126 5.17 5.26 − qDS5.1 DS 5 188,494,426 5.19 6.57 Ca qCa5.1 Ca 5 180,142,680 5.19 6.24 DS qCa5.2 Ca 5 210,996,408 5.22 5.33 − qDS6.1 DS 6 14,650,416 6.02 5.54 − qDS7.1 DS 7 7,686,305 7.01 5.06 − qPB7.1 PB 7 32,958,813 7.04 5.45 − qDS7.2 DS 7 63,420,944 7.07 5.83 − qDS7.3 DS 7 159,938,623 7.16 7.02 Ca, TB qCa7.1 Ca 7 159,938,623 7.16 6.68 DS, TB qTB7.1 TB 7 161,895,764 7.17 4.97 DS, Ca qDS7.3 DS 7 161,895,696 7.17 15.58 Ca, TB qCa7.1 Ca 7 161,895,709 7.17 5.95 DS, TB qTB8.1 TB 8 32,085,668 8.04 5.78 rTB, rcTB qrTB8.1 rTB 8 32,085,668 8.04 4.96 TB, rcTB qrcTB rcTB 8 32,085,668 8.04 4.98 TB, rTB qDS8.1 DS 8 56,390,912 8.06 5.16 − qDS8.2 DS 8 237,867,381 8.24 6.61 − qPB8.1 PB 8 292,702,418 8.30 5.45 − qDS9.1 DS 9 151,974,797 9.16 5.41 − a Traits: PB (plant biomass), DS (developmental score), Ca (calcium content), rCa (residual of calcium content accounting for genetic background and two physiological traits – PB and DS), TB (tibpurn), rTB (residual of tipburn accounting for genetic background and two physiological traits – PB and DS), rcTB (residual of tipburn accounting for genetic background, two physiological traits, and calcium content – PB, DS, and Ca). b Chromosome number. c The position of the significant SNP on the chromosome, in base pairs, based on the lettuce reference genome. d BIN identification (the lettuce reference genome was partitioned into 10 Mb BINs). QTLs detected on adjacent BINs are considered a single associated genomic region. e LogWorth, a measure of statistical significance '−log10 (p-value)'. LW values of 1.301, 2, 3, 4, indicate p-values of 0.05, 0.01, 0.001, and 0.0001. f Other traits for which a significant QTL was detected at the same genomic location, indicating a possible pleiotropic effect or closely linked genes. Among the 12 QTLs detected for DS, the most prominent one was located on chromosome 7 at BIN 7.17 (qDS7.3), exhibiting a high LW of 15.58. The peak of this QTL shared the same SNP location (161,895,764) as the qTB7.1 QTL for raw TB. Phenotypically, earlier development (higher DS score) was associated with a lower TB incidence.
Six QTLs were detected from the combined PB data across three experiments. The most significant QTL (qPB3.2, BIN 3.10, LW = 6.07) was likely located in the same genomic region as a QTL for DS (qDS3.1 at BIN 3.11), suggesting shared genetic control for these traits. However, none of the PB QTLs overlapped with those detected for TB.
QTLs for Ca content were found on chromosomes 2, 3, 4, 5, and 7. The most significant Ca QTL (qCa7.1, LW = 6.68) was located at BIN 7.16, a region likely collocating with QTLs for DS (qDS7.3) and TB (qTB7.1). Furthermore, Ca QTLs at BINs 3.10–3.11 overlapped with those for DS and PB, at BIN 5.19 with DS. After accounting for the effects of DS and PB, the residual Ca (rCa) showed significant QTLs on chromosome 2 (BIN 2.11, qrCa2.1) and chromosome 4 (BIN 4.22, qrCa4.1). The qrCa2.1 overlapped with the bulk Ca content QTL (qCa2.1). A candidate locus for Ca content (LOC128132365), which is annotated as a Ca-transporting ATPase 8, plasma membrane-type-like, also co-localized at BIN 2.12 (linked to qCa2.1 and qrCa2.1), providing a direct functional link to the genetic control of Ca transport. The qrCa4.1 did not overlap with any other analyzed traits, suggesting unique genetic contributions to residual Ca content.
Candidate genes for tipburn QTLs
-
Following the identification of significant QTLs across the analyzed traits, the genomic regions were searched for functional candidate genes. We identified 71 candidates for BIN 2.21, 33 for BIN 7.17, and 56 for BIN 8.04. A full list of all identified genes and their putative role in the TB phenotype is provided in Supplementary Data 1. The most promising candidates per BIN are summarized below, categorized by their relationship to bulk Ca content.
The bulk Ca-independent effect on TB loci include BIN 2.21 candidates such as LOC111901282 and LOC111901278 (phosphoinositide phospholipase C 6, PLC), a key enzyme in Ca signal transduction (GO:0051209), and LOC111901266 (xylan O-acetyltransferase 1), involved in cell wall modification. For BIN 8.04, bulk Ca-independent candidates include LOC111917693 (myosin-11), a motor protein known to interact with calmodulin (Ca sensor), and LOC111878431 and LOC111878432 (catalase), an enzyme critical for detoxifying hydrogen peroxide (H2O2) and managing oxidative stress.
The bulk Ca-mediated effect on TB is represented by BIN 7.17, where candidates include LOC111902840 (rho GDP-dissociation inhibitor 1), a regulator of cytoskeleton and developmental growth, and LOC111902823 (uncharacterized protein), which has a confirmed Ca ion binding property (GO:0005509).
Analysis of the coding sequence for the top candidate PLC gene (LOC111901278) revealed six distinct haplotypes among 20 accessions from the diversity panel, resulting in four unique protein variants (Supplementary Data 2). Interestingly, the accession carrying the most divergent protein variant showed the lowest observed TB incidence (~13%) within this subsample, providing preliminary evidence that allelic variation in PLC may contribute to TB resistance.
Long non-coding RNAs
-
In addition to the candidate genes described above, our analysis also uncovered the presence of multiple long non-coding RNA(s) within the genomic regions identified as putative QTLs for TB incidence. The lncRNA sequences ranged from 240 to 6,765 bp, with an average length of 1,457 bp and a median of 865 bp. All lncRNAs appear to have the capability to anneal to potential targets in the lettuce genome, with E values ranging from 0 to 4.00E-84 (Supplementary Data 1). In most cases, targets are unidentified sequences, and frequently, an lncRNA has multiple putative target regions within the same unidentified sequence. An exception is lncRNA gene LOC128132120 (XR_008230047.1), which has a 99.69% identity over a span of approximately 330 bp with a predicted L. sativa peroxisomal membrane protein (PMP22-like; LOC128127636).
-
Tipburn (TB) is a significant physiological disorder that causes substantial economic losses in both field and greenhouse lettuce production. While localized Ca deficiency is a widely recognized cause, the relationship between bulk Ca content and TB is complex. Our study confirms that plants can develop TB symptoms despite the presence of adequate Ca in the soil or even in the bulk leaf tissue[8,12]. This paradox occurs because Ca is translocated almost exclusively through the xylem via the transpiration stream and exhibits negligible phloem mobility[35]. Consequently, rapidly expanding inner leaves, which are often enclosed and have low transpiration rates, become physiological sinks that are easily deprived of Ca during peak growth phases[36].
Our findings, supported by structural equation modeling, demonstrated that including Ca as a predictor significantly improves the model fit for TB, yet it does not explain the entirety of the variance. This confirms that TB risk is a product of a supply–demand imbalance where plant biomass (PB) and developmental rate (DS) act as the primary regulatory drivers. Specifically, our response surface modeling visualized a critical threshold: accessions with high biomass and slow developmental progress are at the highest risk. This suggests a demand-side bottleneck; as biomass increases, the plant's ability to partition sufficient Ca to every leaf margin is overwhelmed.
The regulatory role of plant development and population structure
-
Intriguingly, our population-wide analysis revealed that accessions that transition to a reproductive stage earlier (higher DS values) tend to exhibit lower TB incidence at a comparable biomass. This observation provides a new perspective on TB resistance. Conventionally, it may be expected that elongated stems would increase the transport distance to Ca, thereby increasing TB risk. However, our data suggests that anatomical and physiological shifts associated with bolting, such as changes in leaf enclosure or xylem hydraulic conductivity, may optimize Ca delivery to developing tissues.
This is consistent with our previous work on tetraploid lettuce, which showed significantly lower TB incidence than their diploid counterparts (1.8% vs 22.2%), despite having lower overall leaf Ca levels[37]. We proposed that the slower developmental cadence in the tetraploids leads to a reduction in the peak Ca demand, which matches the current supply-demand model. By integrating population structure (PCs) into our SEM, we also observed that principal components representing the genetic background had indirect effects on TB via their influence on DS and PB. This implies that certain horticultural types carry correlated physiological traits that inherently influence TB risk. This suggests that some of the resistance observed in specific market types is not due to TB-specific genes alone, but rather a byproduct of their growth architecture and developmental timing.
Comparison with traditional biparental QTL studies
-
The polygenic nature of TB resistance has been documented through several biparental mapping studies, which frequently identified major-effect QTLs on chromosomes 1 and 5[20−22], with additional QTL on chromosome 8[23,38]. Most notably, qTPB5.2 on chromosome 5, was previously found to account for up to 70% of the phenotypic variation in specific crosses[20]. This locus was often linked to pleiotropic effects on leaf morphology, head firmness, and core height[21]. Interestingly, our GWAS on a diverse panel of 498 accessions did not detect a significant signal at the qTPB5.2[20−22] locus. In fact, our detected locus qCa5.2 (BIN 5.22) is located approximately 40 Mb away, suggesting it is a genetically distinct region.
This divergence highlights a critical gap in lettuce genetics; many previously identified QTLs may be specific to the iceberg (crisphead) genetic background used in those crosses[20−23]. For example, recent research identified LsTCP4 as a candidate gene on chromosome 5 influencing bolting and leaf shape, which indirectly impact TB[24]. While these biparental studies provided foundational insights, our GWAS identifies loci that are stable across a much broader range of horticultural types. By identifying QTLs that persist across a diverse panel, we are uncovering core resistance mechanisms that are less dependent on a specific market-type architecture.
Decoupling growth from resistance via residual GWAS
-
A primary challenge in breeding for TB resistance is the confounding effect of plant size and maturity. Because larger, more vigorous plants are naturally more susceptible, breeders may inadvertently select lines with smaller plant biomass. One of the novel contributions of this study is the use of residual trait dissection (rTB and rcTB) to isolate TB-specific variation. By regressing out the effect of PB, DS, and bulk Ca, we were able to identify direct-effect loci that provide resistance without a biomass penalty.
This approach identified major QTLs on chromosomes 2 (BIN 2.21-qTB2.1) and 8 (BIN 8.04-qTB8.1) that remained significant even after adjusting for physiological covariates. These loci represent a cellular integrity hub that likely operates at the level of localized Ca transport[6,39] or signaling efficiency loci[40,41]. In contrast, the QTL at BIN 7.16–7.17 (chromosome 7) was strongly associated with raw TB (qTB7.1) but vanished in the residual analysis. This identifies BIN 7.16–7.17 as a developmental hub, where the genetic effect on TB is entirely mediated through bolting time (qDS7.3) and bulk Ca accumulation (qCa7.1).
Mechanistic hypotheses for candidate genes at BIN 2.21 and 8.04
-
The identification of candidate genes within these isolated QTLs allows us to move from statistical associations to functional hypotheses. At BIN 2.21, the most compelling candidates are two genes encoding phosphoinositide phospholipase C (PLC, LOC111901282, LOC111901278). PLC enzymes are essential for plant signal transduction, facilitating the release of sequestered Ca2+ ions into the cytosol (GO:0051209)[42,43].
Our targeted sequence analysis of PLC (LOC111901278) provides strong preliminary evidence for this mechanism. We identified six distinct haplotypes resulting in four unique protein variants (Supplementary Data 2). Crucially, the PLC protein variant most divergent from the cv. Salinas reference genome was associated with lowest TB incidence, suggesting that specific structural polymorphisms in signaling efficiency may serve as a primary mechanism for tipburn escape. Other candidates in this region include xylan O-acetyltransferase 1 (LOC111901266), which influences cell wall structure[44,45], and NF-X1-type zinc finger protein NFXL2 (LOC111901277), a potential master transcription factor[46] that could regulate downstream stress or Ca transport pathways.
In BIN 8.04, the candidate genes center on oxidative stress mitigation and intracellular transport. Catalase (LOC111878431 and LOC111878432) is vital for decomposing hydrogen peroxide, a reactive oxygen species (ROS) that accumulates during tissue stress. Previous research has shown that TB symptoms are exacerbated by ROS-induced oxidative damage[41]. Furthermore, the presence of myosin-11 (LOC111917693), a motor protein that interacts with Ca-binding calmodulin[47], suggests a mechanism for the precise intracellular distribution of Ca-regulated proteins. A protein kinase in the chloroplast (LOC111892931) and a protein phosphatase regulatory subunit with Ca binding (LOC111917699) may act as modulators of stress and Ca-mediated signaling cascades[48]. The involvement of UDP-rhamnose/UDP-galactose transporter 2 (LOC111892926) in BIN 8.04 region suggests an additional, albeit more indirect, role in TB development. This transporter facilitates the synthesis of cell wall polysaccharides via the Golgi apparatus, a central hub for Ca storage and signaling. A disruption in Golgi-mediated transport could lead to organelle stress and subsequent dysregulation of Ca homeostasis, weakening the cell wall's ability to withstand internal turgor pressure[49−51].
Developmental regulators and signaling cascades in BIN 7.17
-
In the developmental hub of BIN 7.17, candidate genes are primarily involved in cell wall remodeling and developmental processes. These include rho GDP-dissociation inhibitor 1 (LOC111902840), which regulates cytoskeleton dynamics during rapid cell expansion[52], and multiple exopolygalacturonase genes (LOC111902841 and others) essential for cell wall remodeling during bolting[53]. The locus also contains the phosphate transporter PHO1 (LOC111902824), which has been shown to bind InsP6, a critical signal for the Ca2+ release[54,55]. This suggests that the variation in bulk Ca content observed at this BIN may be regulated through a phosphate-linked signaling cascade that coordinates mineral transport with the transition to reproductive growth.
Regulatory layers: lncRNAs and comparative species insights
-
The presence of lncRNA sequences in our identified BIN regions provides a further layer of regulatory complexity. In particular, lncRNA gene LOC128132120 (XR_008230047.1) is predicted with high confidence to have a highly significant sequence similarity with a putative peroxisomal membrane protein (PMP22-like; LOC128127636). Peroxisomes are key sites for ROS metabolism; thus, lncRNA-mediated control of PMP22 could be a post-transcriptional response to the abiotic stress that triggers TB[56−58]. This suggests that TB susceptibility is governed not just by protein-coding variation, but by an intricate network of non-coding regulatory elements.
Our findings also offer a valuable comparison to other crops. In cabbage (Brassica oleracea), TB resistance has been attributed to the differential accumulation of Ca into cell vacuoles via vacuolar Ca transporters[59]. While previous studies in lettuce and other crops have suggested that Ca2+/H+ exchanger and Ca2+-ATPase might contribute to resistance[38,60], our GWAS did not detect significant associations at those specific loci. This highlights the distinct genetic architectures of TB across species and within different genetic backgrounds of lettuce, indicating that in our diverse lettuce panel, signaling efficiency (PLC) and oxidative defense (catalase) may be more critical than simple vacuolar transport capacity. In Chinese cabbage (B. rapa L. ssp. pekinensis), TB resistance is governed by hub genes involved in cell wall modification, hormones, and general stress response pathways[40].
-
By integrating SEM with residual GWAS, this study provides a high-resolution map of the genetic architecture of lettuce TB. The transition from a descriptive association to a mechanistic framework is supported by our identification of direct signaling loci versus mediated developmental loci. The robust QTLs at BIN 2.21 and BIN 8.04 are of particular value for lettuce improvement as they provide resistance that is decoupled from plant vigor. The genes identified in this study, particularly the PLC, myosin, and phosphatase candidates, are excellent targets for further functional validation. Their strong link to Ca signaling and transport, even when accounting for overall Ca content, offers exciting new avenues for developing more resilient lettuce cultivars.
Moreover, by integrating physiological modeling with GWAS and residual trait analysis, we were able to disentangle the confounding effects of growth and maturity on TB and reveal loci with potentially direct contributions to resistance. This integrative approach not only identifies novel targets for breeding but also improves our understanding of the developmental and metabolic processes contributing to TB, enabling more predictive phenotyping and genetic selection strategies in future lettuce improvement programs. Future research should prioritize transcriptional profiling (qRT-PCR) of the PLC, catalase, and lncRNA candidates (and their potential targets) during the onset of necrosis to confirm their regulatory roles. Additionally, the development of molecular markers for the low-TB PLC haplotypes identified here will enable more precise marker-assisted selection. Ultimately, the use of these Ca-independent loci within a genomic selection framework offers a promising path toward developing lettuce cultivars that maintain high productivity and quality across fluctuating environmental conditions.
-
The authors confirm their contributions to the paper as follows: study conception and design: Simko I; analysis and interpretation of results, draft manuscript preparation, manuscript editing: Simko I, Ospina-Giraldo M. Both authors reviewed the results and approved the final version of the manuscript.
-
The datasets generated during and/or analyzed during the current study are available from the corresponding author on reasonable request.
-
The authors extend their gratitude to J. Orozco, R. Zhao, and S. Benzen for their invaluable technical support with the field experiments, and to A. Haldaman for her assistance in assigning GO terms. We also thank R. Stahlhut for providing the tipburn photograph used in Fig. 1b. This research was supported in part by the California Leafy Greens Research Board (Grant Nos LGR-2016-19, 2017-16, 2018-15, 2019-15, 2020-18, and 2021-01). The mentioning of trade names or commercial products in this publication is solely for the purpose of providing specific information and does not imply recommendation or endorsement by the U.S. Department of Agriculture (USDA).
-
The authors declare that they have no conflict of interest.
-
accompanies this paper online at: https://doi.org/10.48130/vegres-0026-0003.
- Supplementary Diagram 1 Flow diagram of analytical pipeline for this study integrating SEM and residual GWAS approaches.
- Supplementary Data 1 List of candidate genes identified at three significant QTL locations on chromosomes 2, 7, and 8 with annotations and GO terms.
- Supplementary Data 2 Allelic and protein variation in the PLC candidate gene (LOC111901278) among 21 accessions.
- Copyright: © 2026 by the author(s). Published by Maximum Academic Press, Fayetteville, GA. This article is an open access article distributed under Creative Commons Attribution License (CC BY 4.0), visit https://creativecommons.org/licenses/by/4.0/.
-
About this article
Cite this article
Simko I, Ospina-Giraldo M. 2026. Integrating growth physiology and calcium status to reveal the genetic basis of lettuce tipburn via GWAS. Vegetable Research 6: e009 doi: 10.48130/vegres-0026-0003 

Integrating growth physiology and calcium status to reveal the genetic basis of lettuce tipburn via GWAS
- Received: 02 September 2025
- Revised: 20 December 2025
- Accepted: 07 January 2026
- Published online: 16 March 2026
Abstract: Tipburn (TB) is a devastating physiological disorder in lettuce (Lactuca sativa) linked to localized calcium (Ca2+) deficiency. While biparental population studies have identified tipburn-linked QTLs, the core genetic mechanisms across diverse germplasm remain poorly understood. We utilized an integrative physiological-genetic framework to dissect TB genetic architecture in a diversity panel of 498 lettuce accessions evaluated over six years. Structural equation and response surface modeling established that TB risk is driven by a supply-demand imbalance regulated by plant biomass (PB) and developmental rate (DS). Although Ca2+ content significantly influenced TB incidence, it did not account for all phenotypic variance, suggesting the existence of Ca2+-independent resistance pathways. To isolate these, we performed GWAS on residual TB that accounted for PB, DS, and bulk Ca content, effectively decoupling plant physiology from resistance. We identified a stable cellular integrity hub on chromosomes 2 (BIN 2.21) and 8 (BIN 8.04), providing resistance regardless of biomass, developmental rate, or bulk Ca2+ status. Conversely, a major locus on chromosome 7 (BIN 7.17) acted as a developmental hub, where resistance is entirely mediated by bolting time and mineral partitioning. Candidate gene analysis at BIN 2.21 identified phosphoinositide phospholipase C (PLC) as a putative primary regulator; sequence analysis revealed a highly divergent PLC protein variant strongly associated with the lowest TB incidence. Other candidates include catalases (BIN 8.04) involved in oxidative stress mitigation and myosin-11 motor proteins. Our findings move beyond simple trait associations to identify stable, vigor-independent genetic targets, providing a roadmap for breeding high-yielding, tipburn-resilient lettuce cultivars.