












-
Carotenoids refer to a class of isoprenoid pigments. Due to their crucial roles in plant growth and benefits to human health, the biosynthesis of carotenoids has been intensively investigated, and numerous genes involved in this process have been isolated and functionally characterized. Briefly, carotenoid biosynthesis occurs in the plastid and begins with the condensation of two geranylgeranyl diphosphate (GGPP, C20) molecules, which is catalyzed by a rate-limiting enzyme, phytoene synthase (PSY), and produces a colorless C40 molecule, 15-cis-phytoene. Then, catalyzed by phytoene desaturase (PDS), ζ-carotene isomerase (Z-ISO), ζ-carotene desaturase (ZDS), and carotene isomerase (CRTISO), 15-cis-phytoene undergoes a series of dehydrogenation and isomerization reactions and finally turns into all-trans-lycopene, a red pigment that is enriched in fruit, such as tomato and watermelon. Later, all-trans-lycopene converts into all-trans-β-carotene and all-trans-α-carotene, which are catalyzed by lycopene-β-cyclase (LCYB) and lycopene-ε-cyclase (LCYE), respectively. Finally, catalyzed by hydroxylases (CHYB, CYP97A, and CYP97C), all-trans-β-carotene and all-trans-α-carotene turn into all-trans-zeaxanthin and all-trans-lutein, respectively[1−3]. Besides producing carotenoids, the above-mentioned pathway also overlaps with the biosynthesis pathways of phytohormones and other pigments. For example, all-trans-β-carotene participates in abscisic acid (ABA) biosynthesis, and GGPP is the precursor of gibberellin (GA) and phytol[1,4−6].
The discovery of carotenoid biosynthesis-related genes provides a wonderful tool for manipulating carotenoid production and accumulation in certain plant organs. PDS is the first gene in the spotlight. However, transformation of a bacterial PDS gene (crtI) into a photosynthetic bacterium Rhodobacter capsulatus, and tomato under the control of a constitutive promoter does not significantly increase the content of carotenoids[7,8]. With the discovery of PSY as the rate-limiting enzyme in carotenoid biosynthesis, many efforts have been made to improve the nutrients or increase certain components of carotenoids by overexpression of this gene in crops. Overexpression of a plant or bacterial Psy in tomato results in a 1.25- to 400-fold increase of total carotenoids in fruit[9−11]. Using the same strategy, a 50-fold increase and a 43-fold increase of total carotenoids are obtained in seeds of Brassica napus and Arabidopsis, respectively, which normally do not accumulate carotenoids. In order to further elevate carotenoid levels, especially the β-carotene level, Psy has been co-expressed with a bacterial Pds and a plant LCYB in the endosperm of cereal crops, achieving up to 23-fold and 10.8-fold increases in total carotenoids in rice and wheat, respectively, and the carotenoid-rich rice is named 'Golden Rice'[12−14]. Further boosting of the above-mentioned carotenoid synthesis pathway in 'Golden Rice' has been achieved through overexpression of two additional genes, DXS (1-deoxy-D-xylulose 5-phosphate synthase gene) and OR (ORANGE), which supply metabolic precursors and promotes the formation of a metabolic sink, respectively[15]. Furthermore, the mutation of the cauliflower Orange (OR) gene, which encodes a DnaJ cysteine-rich domain-containing plastid protein, results in the differentiation of non-colored plastids into chromoplasts and finally leads to β-carotene accumulation in normally carotenoid-free tissues[16], while seed-specific expression of a modified wheat OR gene can boost β-carotene in rice and wheat grains[17], indicating that plastid differentiation is also involved in regulating the accumulation of carotenoids.
However, overexpression of Psy does not always lead to favorable phenotypes, especially when this is performed in a constitutive overexpression manner. In tomato, besides the unscheduled over-accumulation of carotenoids in various organs, constitutive overexpression of Psy1 cDNA leads to dwarf plants and reduced chlorophyll in young leaves, which could be attributed to the diversion of GGPP to phytoene but away from the gibberellin and phytol biosynthetic pathways[10,11]. The mechanism underlying the multi-phenotype caused by the overexpression of Psy1 has been investigated at multiple levels. In Psy1-overexpressing fruit, expression levels of Psy1, Psy2, and LCYB are increased, with the upregulation of activities of the three enzymes as well as the related metabolites[18]. Meanwhile, chromoplast-like structures are discovered in the transgenic mature green fruit, which are normally found in fruit at much later developmental stages. On the other hand, compared with those of the wild-type fruit, 58% of the tested metabolites are altered in the transgenic mature green fruit, many of which are correlated with the transition from green to red ripe fruit[18].
Although the mechanism underlying the alteration of multi-phenotypes caused by the constitutive overexpression of Psy1 has been illustrated by various studies, there is still a lack of comprehensive description and interpretation of this phenomenon. In this study, we demonstrated that overexpression of the genomic DNA of SlPsy1 driven by the CaMV 35S promoter resulted in reprogramming of gene expression involved in several metabolic pathways, including carotenoids, phytohormones, and chlorophyll, as well as changes in chromoplast differentiation, which eventually caused great morphological alterations in tomato. The data obtained here provide key additional knowledge to understand the regulatory mechanisms among different secondary metabolic pathways and a potential strategy to modify Psy1 expression for nutritional quality improvement in plants.
-
Transgenic tomato lines with overexpression of SlPsy1 were obtained by transforming the genomic DNA (gDNA) of SlPsy1 amplified from a Solanum lycopersicum var. cerasiforme accession PI 114,490 into a cultivated tomato (S. lycopersicum var. lycopersicum) line Ohio 88,119 using the previously described method[19]. Three independent T0 transgenic tomato plants verified at RNA and protein levels were retained to obtain T2 progenies for the whole experiment. Wild-type (WT) Ohio 88,119 was used as the control. All plants of Ohio 88,119 and T2 progenies of overexpression of SlPsy1 (OE) tagged for synchronized developmental observation and comparisons were grown under the same conditions in the greenhouse, with water and fertilizer supplied.
Phenotypic data collection
-
Phenotypes including plant height, node number, leaf length and width, dynamic changes in fruit maximal length and maximal width, and fruit weight of WT and OE lines were recorded. Plant height, defined as the length from the ground to the tip of the main stem, was measured, and all nodes were counted from 10 plants randomly selected from each line at 12 weeks after seeding. Leaf length and width were determined by measuring terminal leaflets of three mature leaves collected from each of 10 plants. Single fruit weight was determined by dividing the total weight of 20 fruit at the red-ripe (R) stage (52 d post-anthesis, DPA) by the number of fruit (20) collected from each line. Besides, the colors of the flower, root, and stem were recorded for each line as well.
Seed germination experiments were carried out in a growth chamber under standard conditions (16 h of light at 26 °C followed by 8 h of darkness at 22 °C) with GA3 treatment (10 μM) and non-GA3 treatment. The number of germinated seeds was recorded every day until no further seed germination was observed. Experiments were performed in three replicates with 50 seeds per Petri dish for each line in each replicate.
Fruit development monitoring
-
Flowers were tagged on the day of anthesis to monitor fruit growth. Maximum length and width of fruit were recorded from at least 10 fruit of each line using a vernier caliper (Hangzhou Tool and Measuring Tool Company, Hangzhou, China). Because the fruit was too small before 6 DPA, measurements were conducted from 6 DPA to 48 DPA with a 3-day interval in the first month and a 6-day interval thereafter. Fruit shape index was calculated as the ratio of maximum length to maximum width.
Microscopic observation
-
The color of cell contents in fruit at the immature (IM) stage (15 DPA) was determined by observing freehand sections of fruit mesocarp tissues under a high-resolution digital microscope (TE2000, Nikon Corporation, Japan). The number of cell layers and the number of cells per mm2 were counted in fruit at the mature green (MG) stage (39 DPA)[20].
Fully expanded young leaves and fruit at the IM stage from WT and OE lines were collected from four replicates of each line for transmission electron microscopy (TEM) analysis under a JEM-1230 transmission electron microscope (JEOL-USA, Inc., Peabody, MA, USA). Samples were prepared using methods described in Yang et al.[21]. The number of chloroplasts was calculated based on observation of two fields of view under the microscope for each sample.
qRT-PCR and western blot analysis
-
Total RNA was isolated from leaves and fruit using the Quick RNA Isolation Kit (Huayueyang Biotechnology [Beijing] Co., Beijing, China). The integrity and purity of RNA were checked on a 2% agarose gel, and RNA quantity was determined using a NanoDrop2000 Spectrophotometer (Thermo Fisher Scientific, DE, USA). qRT-PCR was conducted following the previously described method[19]. The expression of the EF1α (Solyc06g0050600) gene was used as an internal control. Primers used for qRT-PCR were listed in Supplementary Table S1.
Proteins were isolated from fruit at 12 DPA using the Tissue Protein Extraction Kit (Beijing ComWin Biotech Company, Beijing, China) following the manufacturer's protocol. Western blot was performed using the previously described method[19].
Measurement of chloroplast content and net photosynthetic rate
-
Fresh mature leaves of 12-week-old plants and fruit at MG were used to extract total chlorophyll (Chl) with 95% ethyl alcohol, and the content was determined using a spectrophotometer and calculated using a formula described in Li[22]. The net photosynthetic rate of fully expanded leaves on WT and OE plants in the greenhouse was measured from 9:00 am to 11:00 am using a portable photosynthesis system (LI-6400, LI-COR Inc, NE, USA) following the manufacturer's instructions.
Quantification of carotenoids
-
Fruit from plants of WT and heterozygous plants in T2 lines were used for carotenoid measurement due to the low fruit set of OE-ho plants. Total carotenoid content in fruit at IM, MG, and R stages, with removal of seeds, was measured by a spectrophotometer using the method described for chloroplast content measurement. The content of individual carotenoids was determined using the high-performance liquid chromatography (HPLC) method performed by the Institute of Vegetable and Flowers, Chinese Academy of Agricultural Sciences (Beijing, China).
Hormone determination
-
Since reduction of organ size occurred in the whole plant of OE lines, endogenous phytohormones were determined from either leaf samples or whole seedlings. Fully expanded young leaves of the second leaf layer from the top of WT and OE-13-ho plants were collected for measurements of ABA, auxin, and cytokinin, which were performed at Wuhan Metwell Biotechnology Company (Wuhan, Hubei, China). Three biological replicates with four plants in each replicate for each line were performed for ABA, auxin, and cytokinin measurements.
Three replications (more than 2 g fresh weight per replication) of 20-day-old seedlings of WT and OE were harvested for measurement of endogenous gibberellins (GAs), which was performed at the Wuhan Greensword Creation Technology Company (Wuhan, Hubei, China) using a previously described method[23] with minor modifications.
RNA-seq analysis
-
Fruit at the IM, MG, and R stages, as well as fully expanded young leaves of WT and OE-13-ho lines, were used for RNA-seq. The experiment was conducted with three biological replicates. In each replicate, mesocarps without seeds, collected from the fruit of four plants from each line, were mixed as one sample for RNA isolation, and the same approach was used to prepare leaf samples. RNA-seq was performed at Biomarker Technologies Company (Beijing, China).
The filtered clean reads were mapped to the tomato reference genome sequence (SL2.5,
http://solgenomics.net ). Related annotation was obtained from the International Tomato Annotation Group (ITAG) release 2.5 (http://solgenomics.net ). Fragments per kilobase of exon model per million mapped fragments (FPKM) values per sample for all genes were calculated based on both the total number of reads that mapped to the tomato reference genome of Heinz 1,706 (http://solgenomics.net ) and corresponding gene length. Differentially expressed genes (DEGs) were identified by DESeq2[24,25] with the threshold of 'p-value less than 0.05 and the absolute value of Log2fold-change > = 1'. The q-value was adjusted using the method described in Benjamini & Hochberg[26]. A heatmap of DEGs was created using TBtools[27].Determination of gene copy number in transgenic lines
-
Gene copy numbers in transgenic lines were determined by qPCR. Genomic DNA was isolated using the CTAB method. Serial dilution of the genomic DNA was performed to generate the standard curves. The LAT52 gene was used as an internal control. qPCR was conducted using TOROGreen® qPCR MasterMix (Toroivd, Shanghai, China) following the manufacturer's protocol. Primers used for qPCR are listed in Supplementary Table S1. The copy number of SlPsy1 and LAT52 in the DNA template was calculated based on Ct values and parameters obtained from the standard curves. The ratio of copy numbers between SlPsy1 and LAT52 was considered as the gene copy in tested tomato lines. Considering that the non-transgenic line Ohio 88,119 also contains a copy of SlPsy1, the final copy number of the genes in the OE line was determined by deducting 1 from the copy number calculated above.
Data analysis
-
All quantitative data were based on at least three biological replicates with a minimum of three plants in each replicate, as well as three technical replicates, unless noted otherwise. The data were analyzed using SPSS software (IBM SPSS Statistics, v20, New York, USA) with a one-way analysis of variance followed by Duncan's test for multiple comparisons. Statistical significance was determined at p < 0.05 or using Student's t-test at the 0.05 (*) and 0.01 (**) levels.
-
Transgenic lines harboring the overexpressed SlPsy1 gDNA were verified at the transcriptional and protein levels. Three independent overexpression T0 plants (OE#13, OE#16, and OE#19) that simultaneously accumulated high levels of SlPsy1 transcript (Fig. 1a) and SlPSY1 protein (Fig. 1b) were retained to develop T1 and T2 progenies for the following experiments.
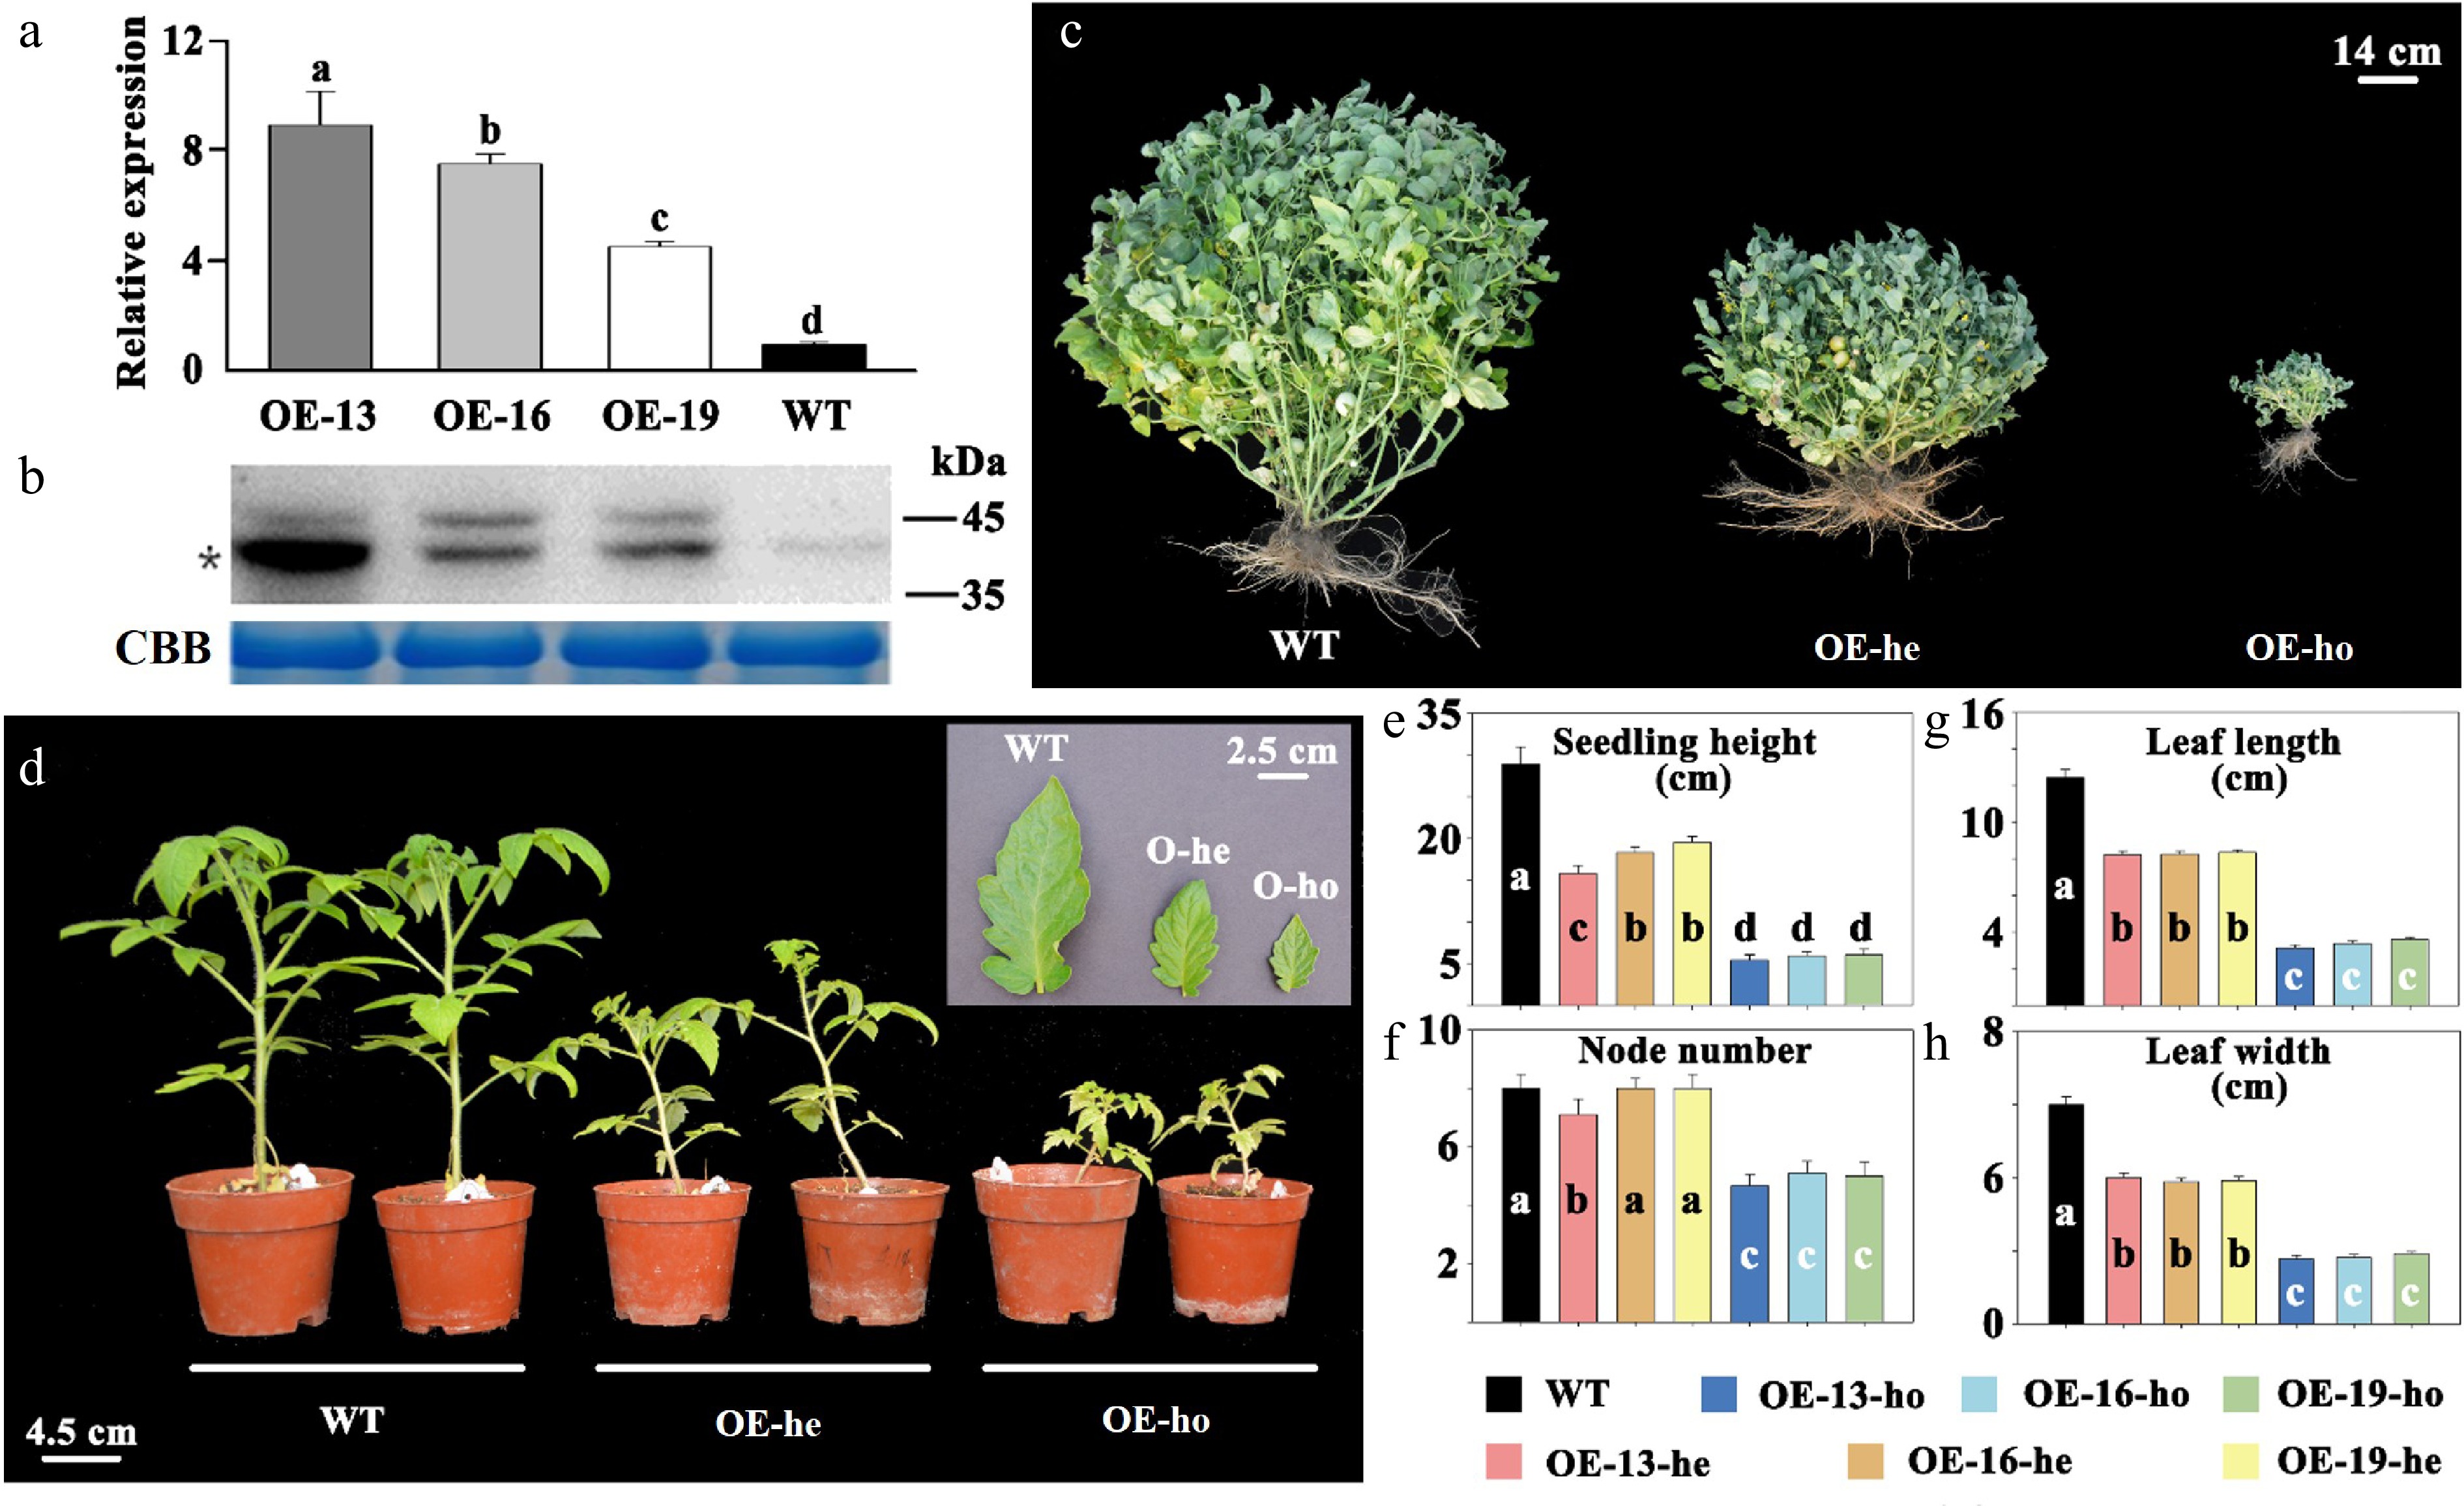
Figure 1.
Changes in plant traits in lines with overexpression (OE) of the SlPsy1 gene in the tomato inbred line Ohio 88,119 (wild type, WT). (a) Quantitative RT-PCR analysis of SlPsy1 expression in immature (IM) fruit (10 d post-anthesis) of T0 plants. The data are shown as mean ± SD (n = 3). (b) Western blot analysis using antibodies to verify the expression of SlPsy1 in IM fruit of T0 plants. The concentration of total protein is monitored by Coomassie brilliant blue (CBB) staining. The asterisk indicates the position of mature phytoene synthase. (c) Representative plants at the fruit set stage of WT and OE T2 lines. (d) Representative 12-week-old seedlings from the WT and OE T2 lines grown in the greenhouse. (e), (f) Height and node numbers of 12-week-old seedlings of WT and OE T2 lines. The data are shown as mean ± SD (n = 10). (g), (h) Leaf length and width of WT and OE T2 lines. The data are shown as mean ± SD (n = 30). he: heterozygote. ho: homozygote. Means with the same letter indicate no significant difference at 0.05 (Duncan's test).
Morphological parameters, especially plant height and leaf size, were obviously changed in the T1 generation of all the OE lines. Based on plant height, plants in the T1 population of each OE line could be divided into three groups: normal (similar to WT), intermediate, and dwarf (Fig. 1c, d). The segregation ratio of those three groups fit 1:2:1 (Supplementary Table S2), indicating that possibly one copy of the SlPsy1 gene was transformed into each transgenic line, which could be supported by the data from qPCR analysis (Supplementary Table S3). Thus, the small and intermediate transgenic plants were considered as homozygotes (OE-ho) and heterozygotes (OE-he), respectively.
More detailed morphological investigations were conducted in the OE-he and OE-ho T2 plants. Compared to WT, seedling height was reduced by 32.4%−45.3% and 79.2%−81.3% in the OE-he and OE-ho plants at the 12-week-old stage, respectively (Fig. 1d, e). Consistently, plant height at harvest was significantly decreased in the OE-he and OE-ho plants (Fig. 1c). Meanwhile, leaf length was decreased by 32.9%−33.8% and 71.0%−74.8% in the OE-he and OE-ho plants, respectively (Fig. 1f), and the leaf width was reduced by 33.1%−35.1% and 67.9%−70.3% in the OE-he and OE-ho plants, respectively (Fig. 1g). Although the node numbers in WT and OE-he plants were not significantly different, it was significantly reduced in the OE-ho plants (Fig. 1h). These data indicated that OE-ho plants had more severe phenotypic alterations than OE-he plants, which resulted in severely delayed flowering (Supplementary Fig. S1a).
Reduction in fruit size in OE lines was mainly caused by the decrease in cell size
-
Due to the severely delayed flowering time and low fruit set in OE-ho plants, fruit-related data were collected from OE-he T2 and WT plants. The fruit were smaller in OE-he plants than in WT (Fig. 2a). Generally, growth trends of fruit in WT and OE-he plants were similar, with the highest growth rate period appearing around 15 DPA. However, fruit maximal length and maximal width were significantly reduced in OE-he plants (Fig. 2b, c). Fruit shape index was larger at all times in OE-he plants than in WT plants because the maximal width was reduced more severely than maximal length in fruit of OE-he plants (Fig. 2d). Consistent with fruit size changes, fruit weight of OE-he plants were decreased approximately 55.4% compared to that of WT at the red ripe (R) stage (Fig. 2e). Cell layers in the pericarp at the mature green stage didn't show a significant difference between WT and OE-he fruit (Fig. 2f), but cell number per mm2 was significantly increased in OE-he fruit (Fig. 2g-i), indicating that cell size in the pericarp of OE-he fruit was significantly decreased, which resulted in the reduction of fruit size and weight.
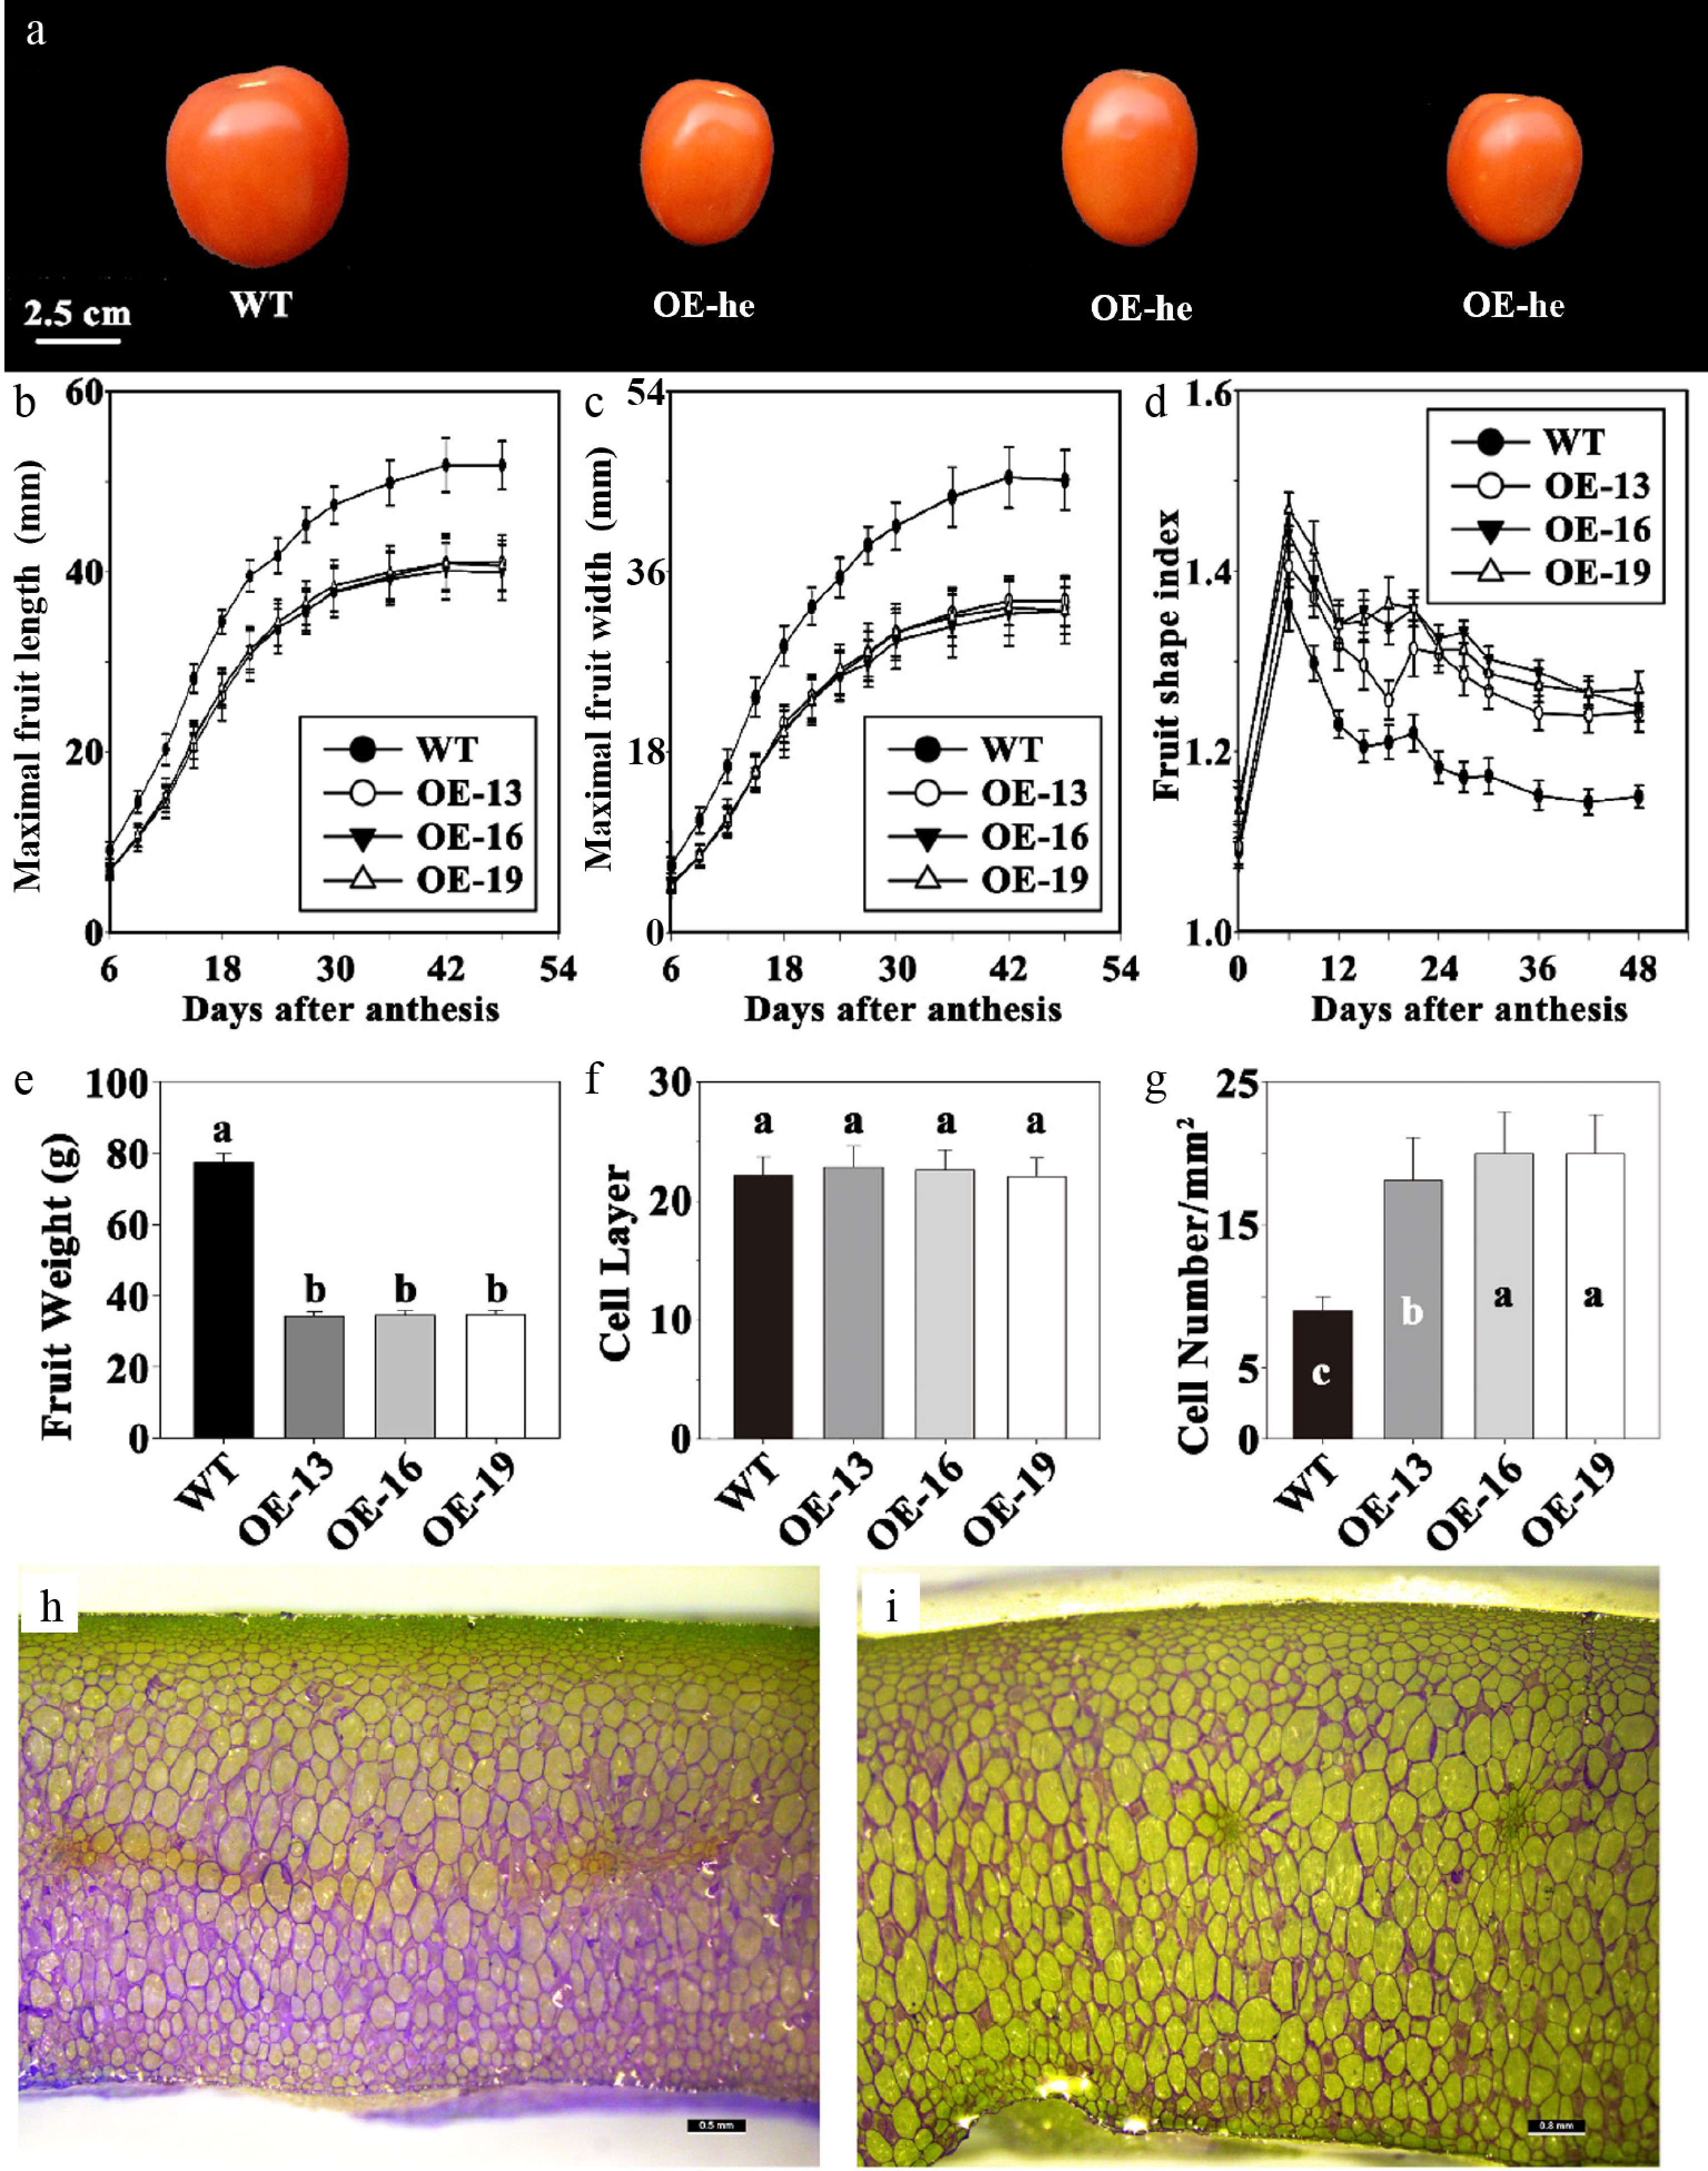
Figure 2.
Changes in fruit traits in heterozygous (he) plants of T2 lines with overexpression (OE) of the SlPsy1 gene in the tomato inbred line Ohio 88,119 (wild type, WT). (a) Representative fruit at the red-ripe stage. (b), (c) Dynamic changes in fruit maximal length and maximal width at various fruit developmental periods. (d) Dynamic changes in fruit shape index at various fruit developmental periods. (e) Fruit weight at the red-ripe stage. (f) Number of cell layers in fruit mesocarp at the mature green (MG) stage. (g) Cell numbers per mm2 at the MG stage. (h) Representative freehand sections of WT fruit at the MG stage (scale bar: 0.5 mm). (i) Representative freehand sections of OE fruit at the MG stage (scale bar: 0.8 mm). Means with the same letter indicate no significant difference at 0.05 (Duncan's test).
The reduction of organ size in OE lines was related to the alteration of gibberellin and ABA content
-
To investigate whether the reduction of organ size in OE lines was caused by changes in phytohormones, the contents of auxin, cytokinin, ABA, and gibberellin were measured in WT and OE-13-he plants. As for auxin, indole-3-acetic acid (IAA), methyl indole-3-acetate (ME-IAA), and indole-3-carboxaldehyde (ICA) did not show a significant difference between WT and OE-13-he lines, while 3-indolebutyric acid (IBA) was not detectable (Fig. 3a). In regard to cytokinin, N6-Isopentenyladenine (IP), trans-zeatin (tZ), cis-zeatin (cZ), and dihydrozeatin (DZ) were at very low levels in both WT and OE-13-he lines (Fig. 3a). These data suggested that both auxin and CK might not be related to organ size reduction in the OE lines.
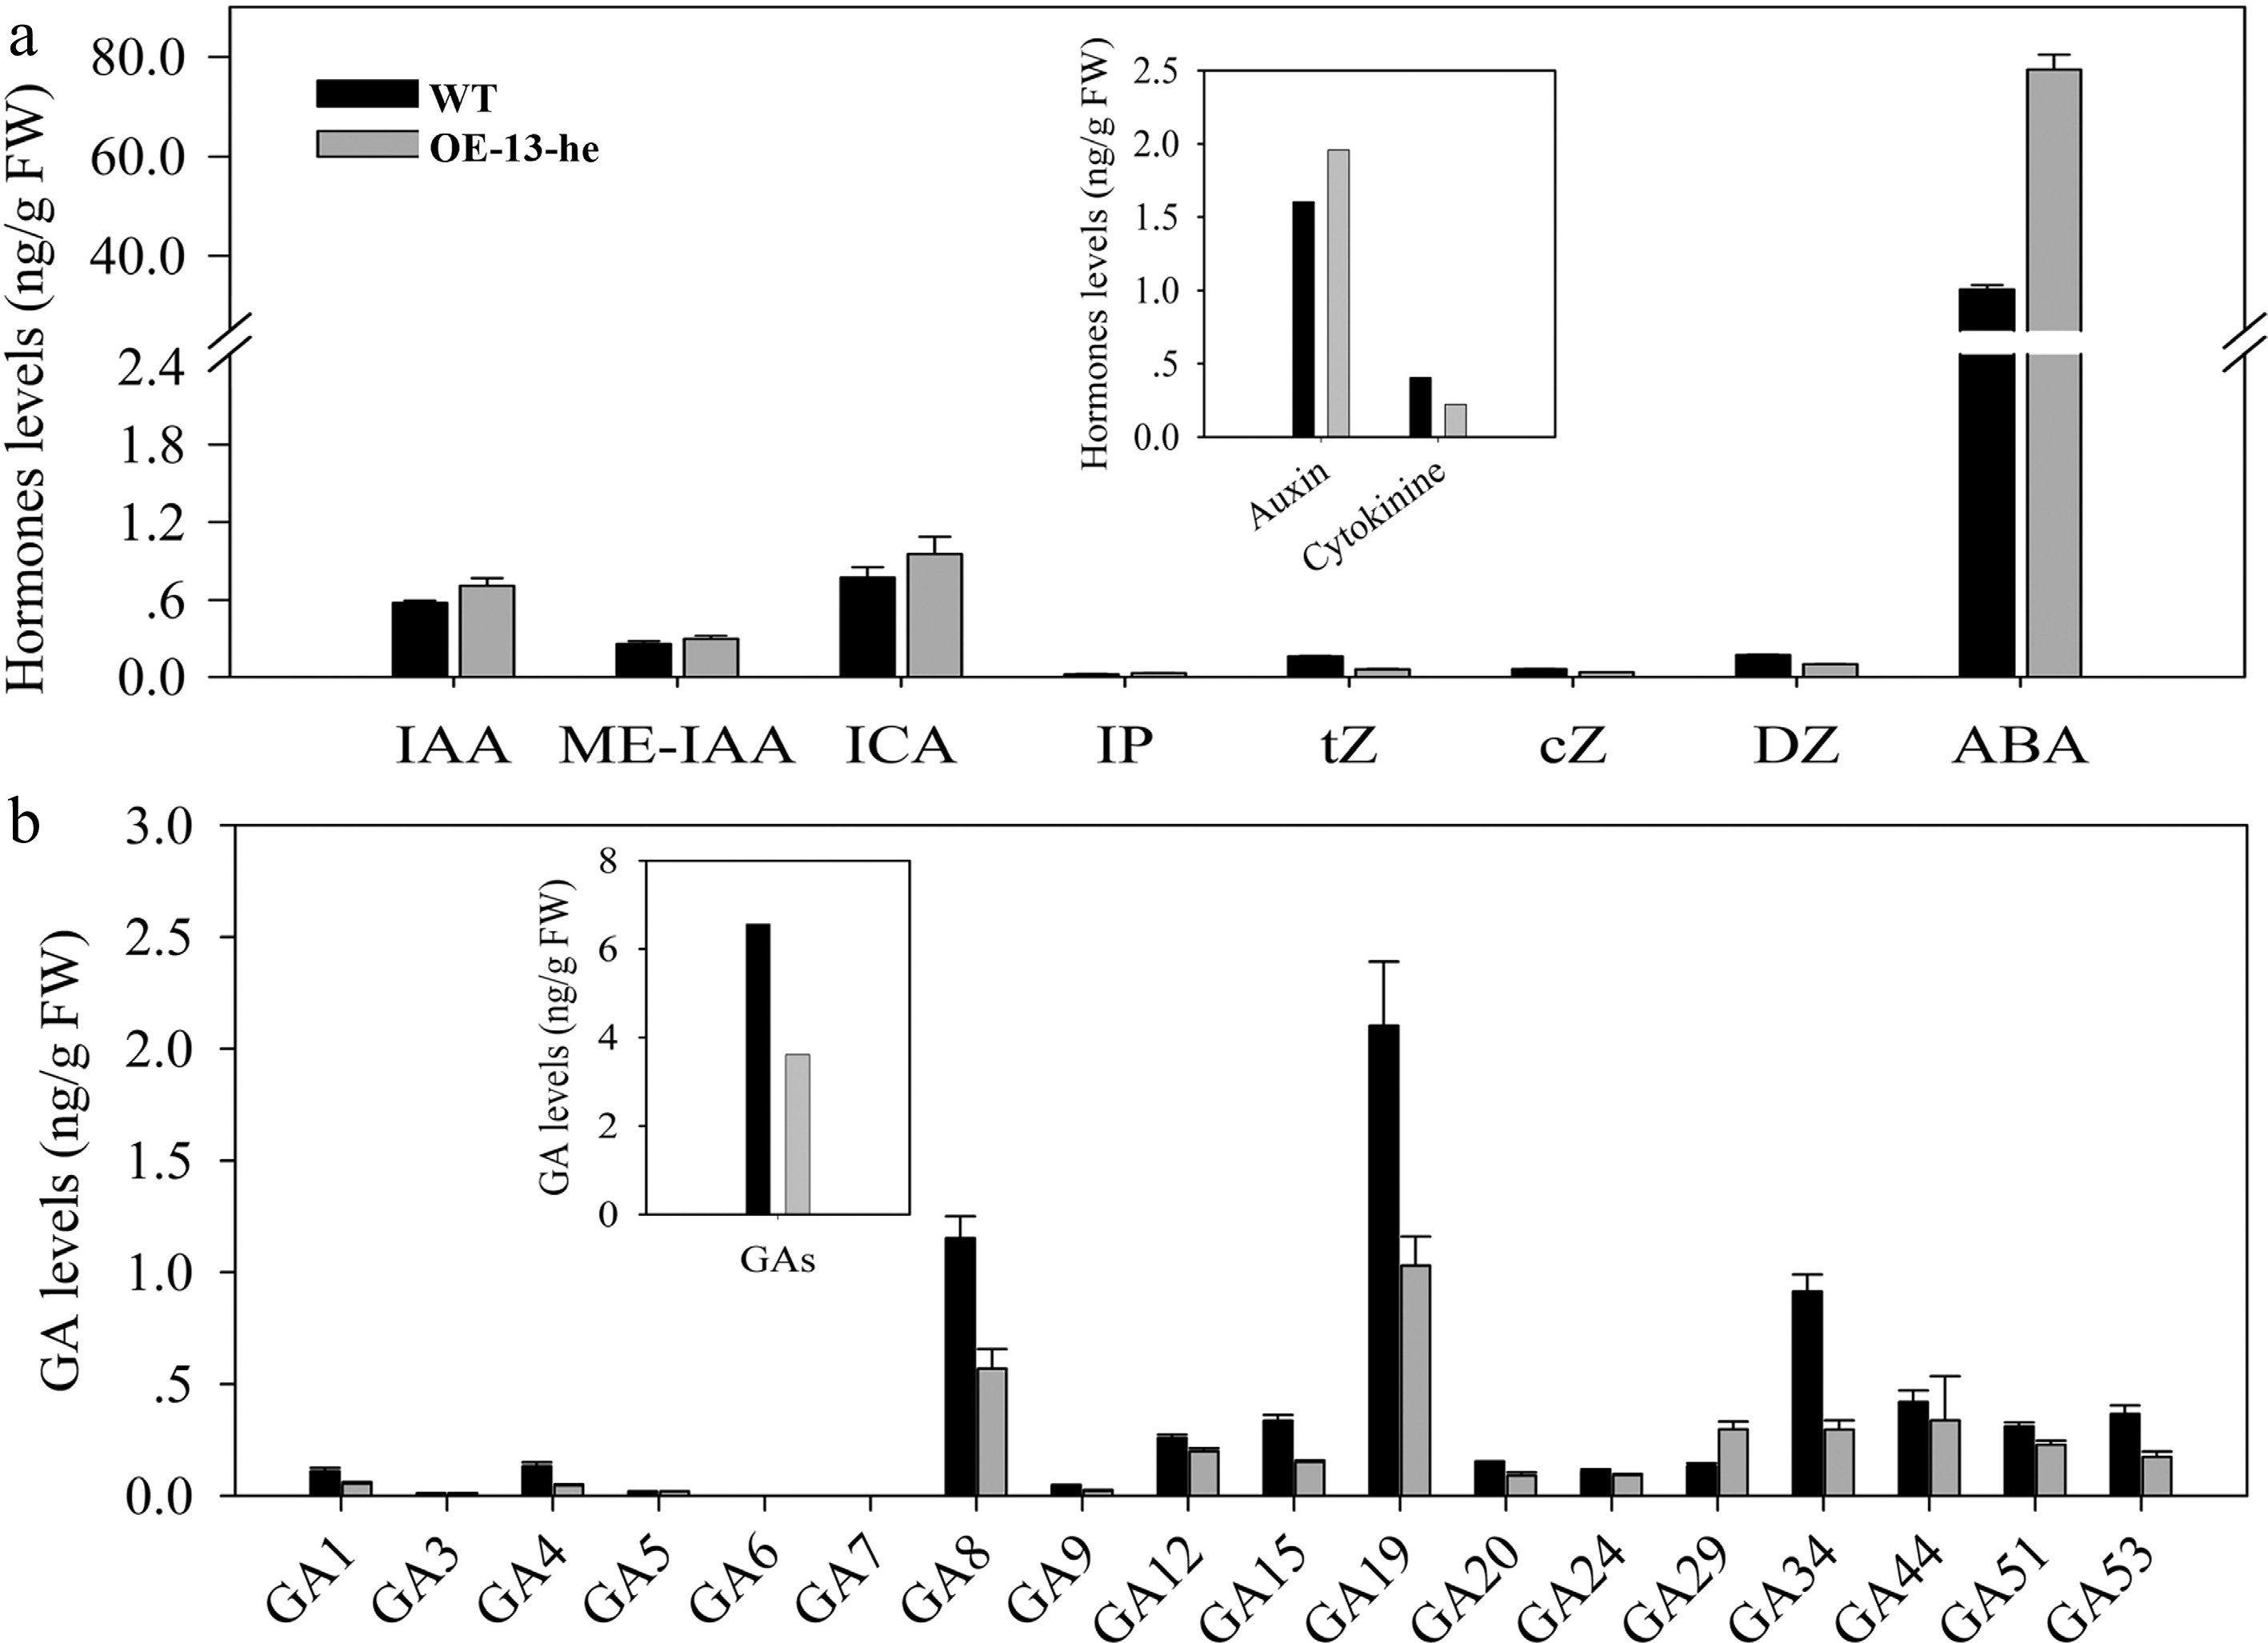
Figure 3.
Hormone content in heterozygous (he) plants of OE-13-he T2 lines with overexpression (OE) of the SlPsy1 gene in the tomato inbred line Ohio 88,119 (wild type, WT). (a) Content of GAs in 20-day-old seedlings. (b) Auxin, cytokinin, and abscisic acid content in young leaves. IAA, indole-3-acetic acid. ME-IAA, methyl indole-3-acetate. ICA, indole-3-carboxaldehyde. IP, N6-isopentenyladenine. tZ, trans-zeatin. cZ, cis-zeatin. DZ, dihydrozeatin. ABA, abscisic acid. The data are shown as mean ± SD (n = 3).
On the contrary, the content of ABA and some forms of GAs were significantly changed in the OE-13-he plants. Compared with that of WT, a 2.32-fold increase in ABA levels was detected in the OE-13-he lines (Fig. 3a), while the total amount of GAs in the OE-13-he lines was almost half of that in WT (Fig. 3b). Among 18 forms of GAs examined, GA6 and GA7 were undetectable, while GA3, GA5, and GA44 did not show a significant difference between WT and OE-13-he plants (Fig. 3b). In contrast, except for GA29, significant decreases were observed for the remaining 13 forms of GAs in the OE-13-he plants. Among those GAs, the bioactive forms GA1 and GA4 were decreased by more than 50% compared with those in WT (Fig. 3b). These results suggested that changes in GA and ABA content might be the cause of organ size reduction in OE lines. Besides what was mentioned above, seed germination time, a process mainly controlled by the balance between ABA and GAs, was prolonged in the OE-he plants, which could be restored by treatment with 10 μM GA3 (Supplementary Fig. S1b, S1c).
Color alteration in the leaves and fruit of OE lines was related to changes in carotenoid and chlorophyll levels, as well as the plastid type and density
-
Color change was another obvious alteration in the OE lines. In the OE-he plants, leaf color was brilliant yellow at the immature stage and then gradually turned green at the mature stage (Fig. 4a). Compared with that of WT, the photosynthetic rate in mature leaves of the OE-he plants was significantly decreased and this trend was more severe in the OE-ho plants (Fig. 4b). Consistently, Chl content in mature leaves from OE lines was reduced to 60%−65% that of WT (Fig. 4c). Since leaf color, Chl content, and photosynthetic rate were all related to plastid, ultrathin sections of young and mature leaves from WT and OE-he plants were made, and plastid type and density were investigated. In all the investigated leaf cells in the OE-he plants, chromoplasts accounted for most of the plastids (Fig. 4d-g), and the chloroplast density in young and mature leaf cells was reduced to 11.1% and 69.2% of WT, respectively (Fig. 4h).
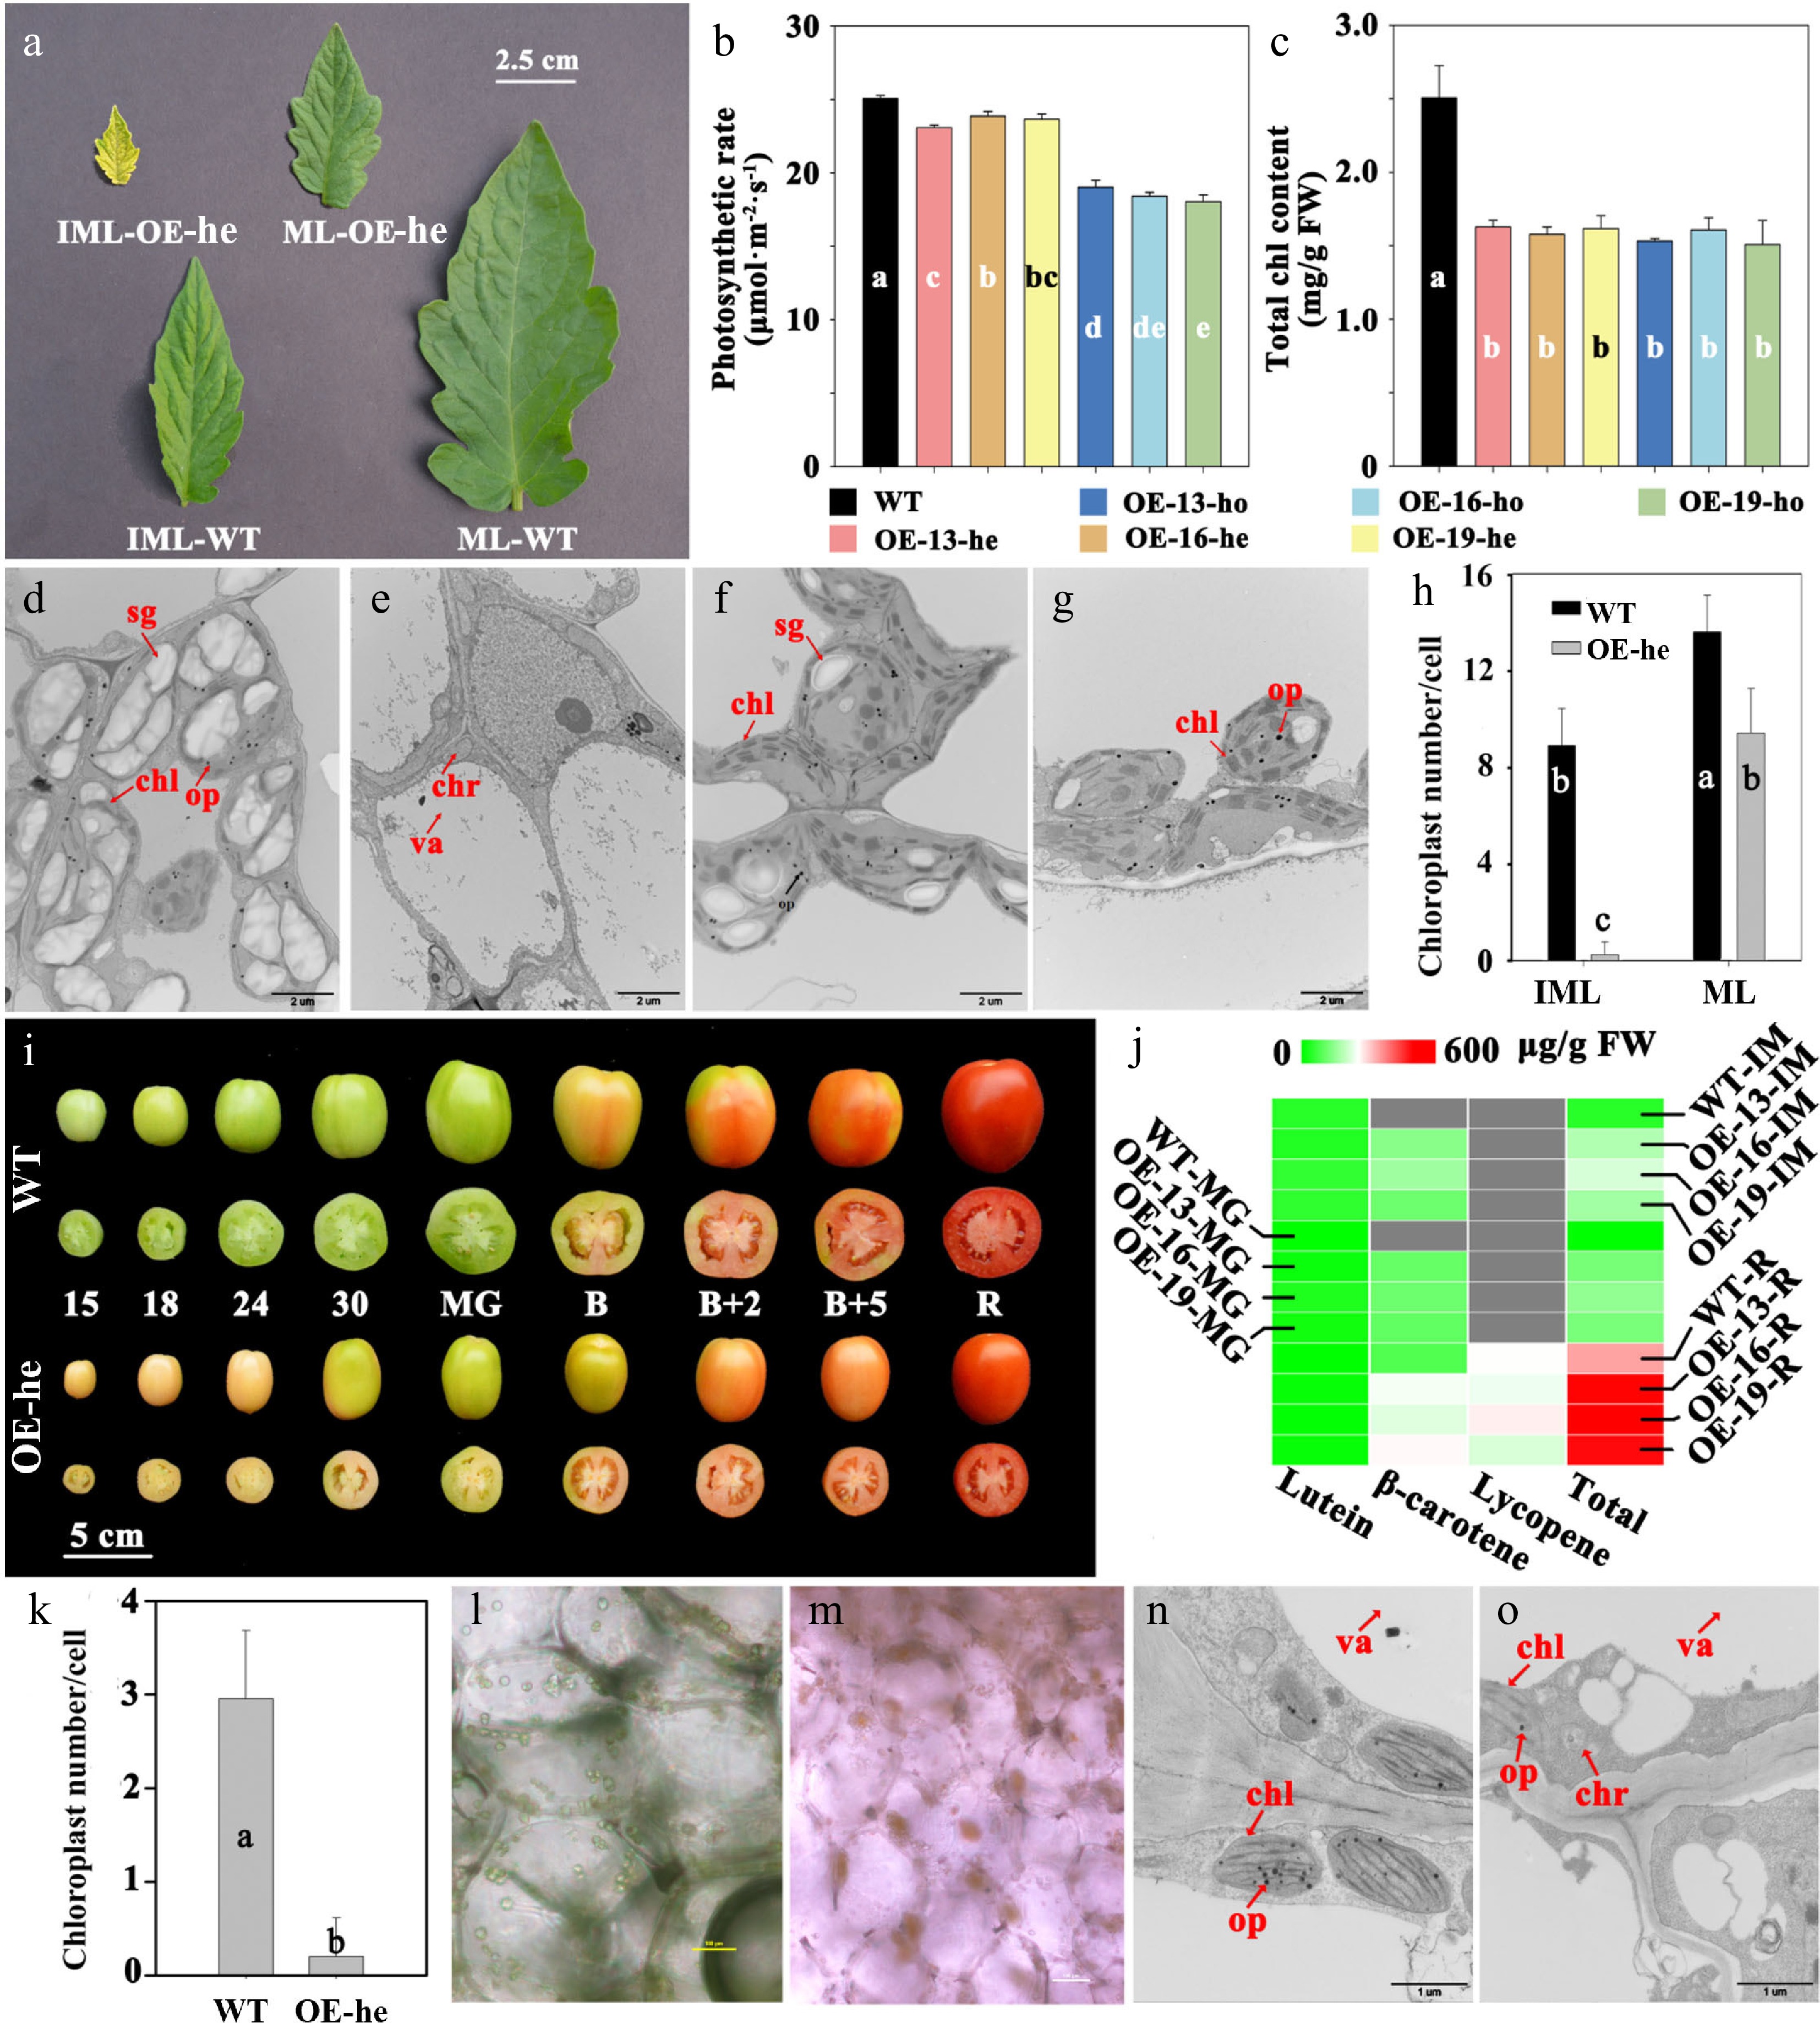
Figure 4.
Pigment-related analysis and observation in fruit and leaves of heterozygous (he) plants of T2 lines with overexpression (OE) of the SlPsy1 gene in the tomato inbred line Ohio 88,119 (wild type, WT). (a) Color of immature leaves (IML) and mature leaves (ML). (b) Photosynthetic rate in mature leaves (n = 4). (c) Total chlorophyll content in mature leaves (n = 3). (d), (e) Plastids in young leaves (scale bar: 2 μm). (f), (g) Plastids in mature leaves (scale bar: 2 μm). (h) Chloroplast number per cell in IML and ML. (i) Dynamic development of fruit in various periods. (j) Carotenoid content in immature (IM) fruit (15 DPA), mature green (MG, 39 DPA), and red stage (R, 52 DPA). (k) Chloroplast number per cell in IM fruit. (l), (m) Bright-field visible light microscopy of mesocarp cells in IM fruit (scale bar: 100 μm). (n), (o) Plastids in IM fruit by TEM (scale bar: 1 μm). Sg, starch grain; Chl, chloroplast; Chr, chromoplast; Op, osmiophilic plastoglobules; Va, vacuole; he, heterozygote; ho, homozygote. Means with the same letter indicate no significant difference at 0.05 (Duncan's test).
Fruit color of OE-he lines changed from yellow to green-yellow and finally to red during fruit development and ripening (Fig. 4i). Total carotenoid levels were higher in the OE-he fruit than in WT fruit at all the investigated stages (Supplementary Fig. S2e). β-carotene was not detected in WT fruit but in the OE-he fruit at the immature (IM) and mature (MG) stages (Fig. 4j). There were more carotenoids in OE-he fruit than in WT fruit at the R stage (Fig. 4j). In contrast, the Chl content was significantly lower in OE-he fruit compared to WT fruit at the IM and MG stages (Supplementary Fig. S2f). Consistently, chloroplast density in each cell was much lower in OE-he than in WT (Fig. 4k). Meanwhile, chloroplasts and chromoplasts accounted for most of the plastids in WT and OE-he fruit, respectively, at the IM stage (Fig. 4l-o). In addition to fruit and leaves, color alteration was also found in the root, stem, flower, and seed of the OE-he plants (Supplementary Fig. S2a-d), which was also attributed to the over-accumulation of SlPsy1 transcript (Supplementary Fig. S2g).
Overexpression of SlPsy1 resulted in the alterations of gene expression patterns in various metabolic pathways
-
A total of 5,905 DEGs were identified in at least one comparison between OE-13-ho and WT, of which 3,649 DEGs (2,049 downregulated and 1,600 upregulated) were from leaves, 443 DEGs (180 downregulated and 263 upregulated) were from IM fruit, 1,917 DEGs (1,232 downregulated and 685 upregulated) were from MG fruit, and 1,350 DEGs (391 downregulated and 959 upregulated) were from R stage fruit (Fig. 5a; Supplementary Fig. S3; Supplementary Table S4). However, only nine DEGs were shared by all comparisons (Fig. 5a).
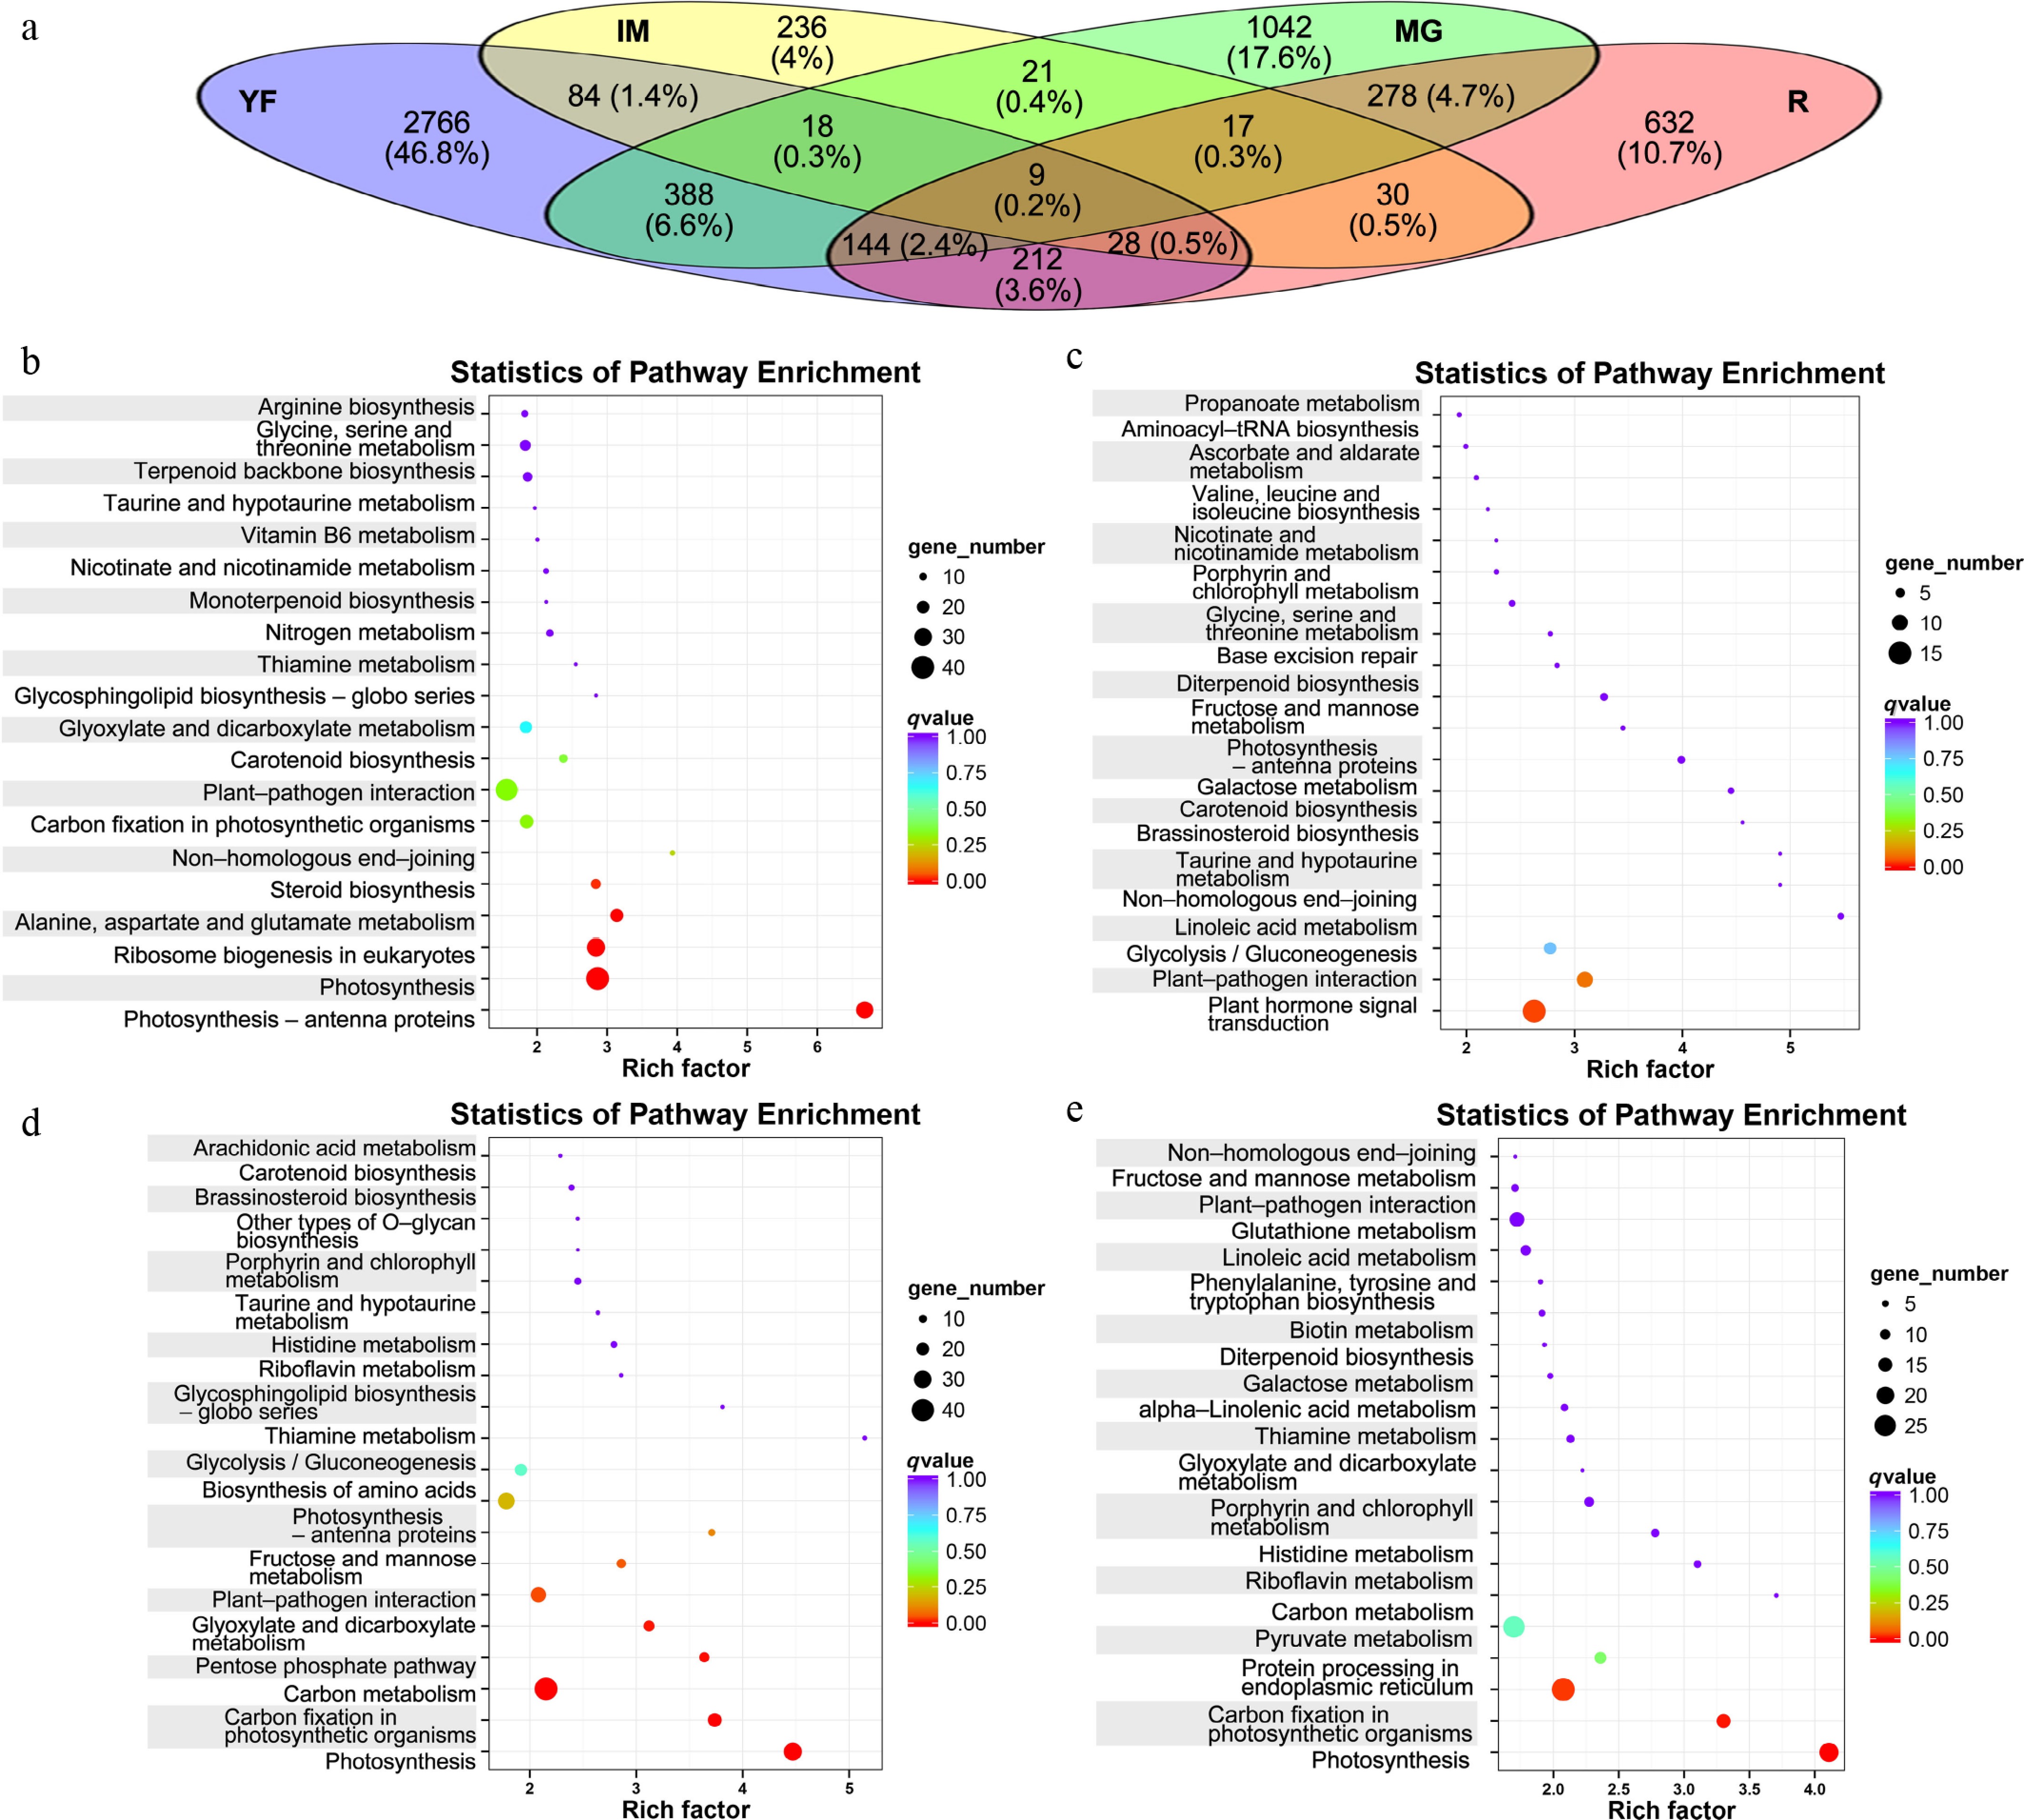
Figure 5.
(a) Venn diagram and (b) enriched KEGG pathways of the relationships between differentially expressed genes in young leaves (YF), as well as (c) immature (IM), (d) mature green (MG), and (e) ripe (R) stage fruit. Bubble plots showing enriched KEGG pathways of DEGs derived from (b) young leaves (YF), (c) immature fruit (IM), (d) mature green fruit (MG), and (e) red ripe fruit (R). The horizontal axis represents the enrichment factor; the size of each bubble corresponds to the number of enriched genes, and bubble color represents the q-value.
In leaves, DEGs were significantly enriched in several plastid-related pathways, including photosynthesis, photosynthesis-antenna proteins, carotenoid biosynthesis, and carbon fixation in photosynthetic organisms (Fig. 5b). Meanwhile, DEGs in IM and MG fruit between OE-13-ho and WT lines were enriched in several plastid-related pathways such as porphyrin and chlorophyll metabolism, photosynthesis-antenna proteins, and carotenoid biosynthesis (Fig. 5c, d). The top two pathways with DEGs enriched in MG and R fruit were photosynthesis and carbon fixation in photosynthetic organisms (Fig. 5d, e). Besides, the plant hormone signal transduction pathway ranked first in IM fruit. All these data indicated that overexpression of SlPsy1 perturbed various pathways in transgenic lines.
Expression of genes related to carotenoids and the GA synthesis pathway was influenced by the overexpression of SlPsy1
-
To explore the cause of the change in carotenoid content in fruit, the transcriptome was used to analyze the transcript levels of genes involved in the carotenoid biosynthesis pathway (Fig. 6a; Supplementary Table S5). In OE-13-ho plants, the expression of SlPsy1 was upregulated in fruit and young leaves (1.2~6.1 fold; Fig. 6a); the gene SlPsy2 was also upregulated in MG fruit and young leaves. The transcript level of CRTISO showed an upregulation trend during three fruit developmental stages (1.1~2.1 fold; Fig. 6a) and the genes LCYE, CYP97A, and CYP97C were upregulated in IM fruit of OE-13-ho plants (1.2~2.2 fold; Fig. 6a). Compared with WT, the transcript levels of LCYB, CHYB, ZEP, and NXS in OE-13-ho plants showed a downregulated trend during all stages (0.5~0.7 fold; Fig. 6a). Additionally, VDE was significantly upregulated during three fruit developmental stages (1.7~3.6 fold; Fig. 6a), but downregulated in young leaves of OE-13-ho plants (0.9 fold; Fig. 6a).
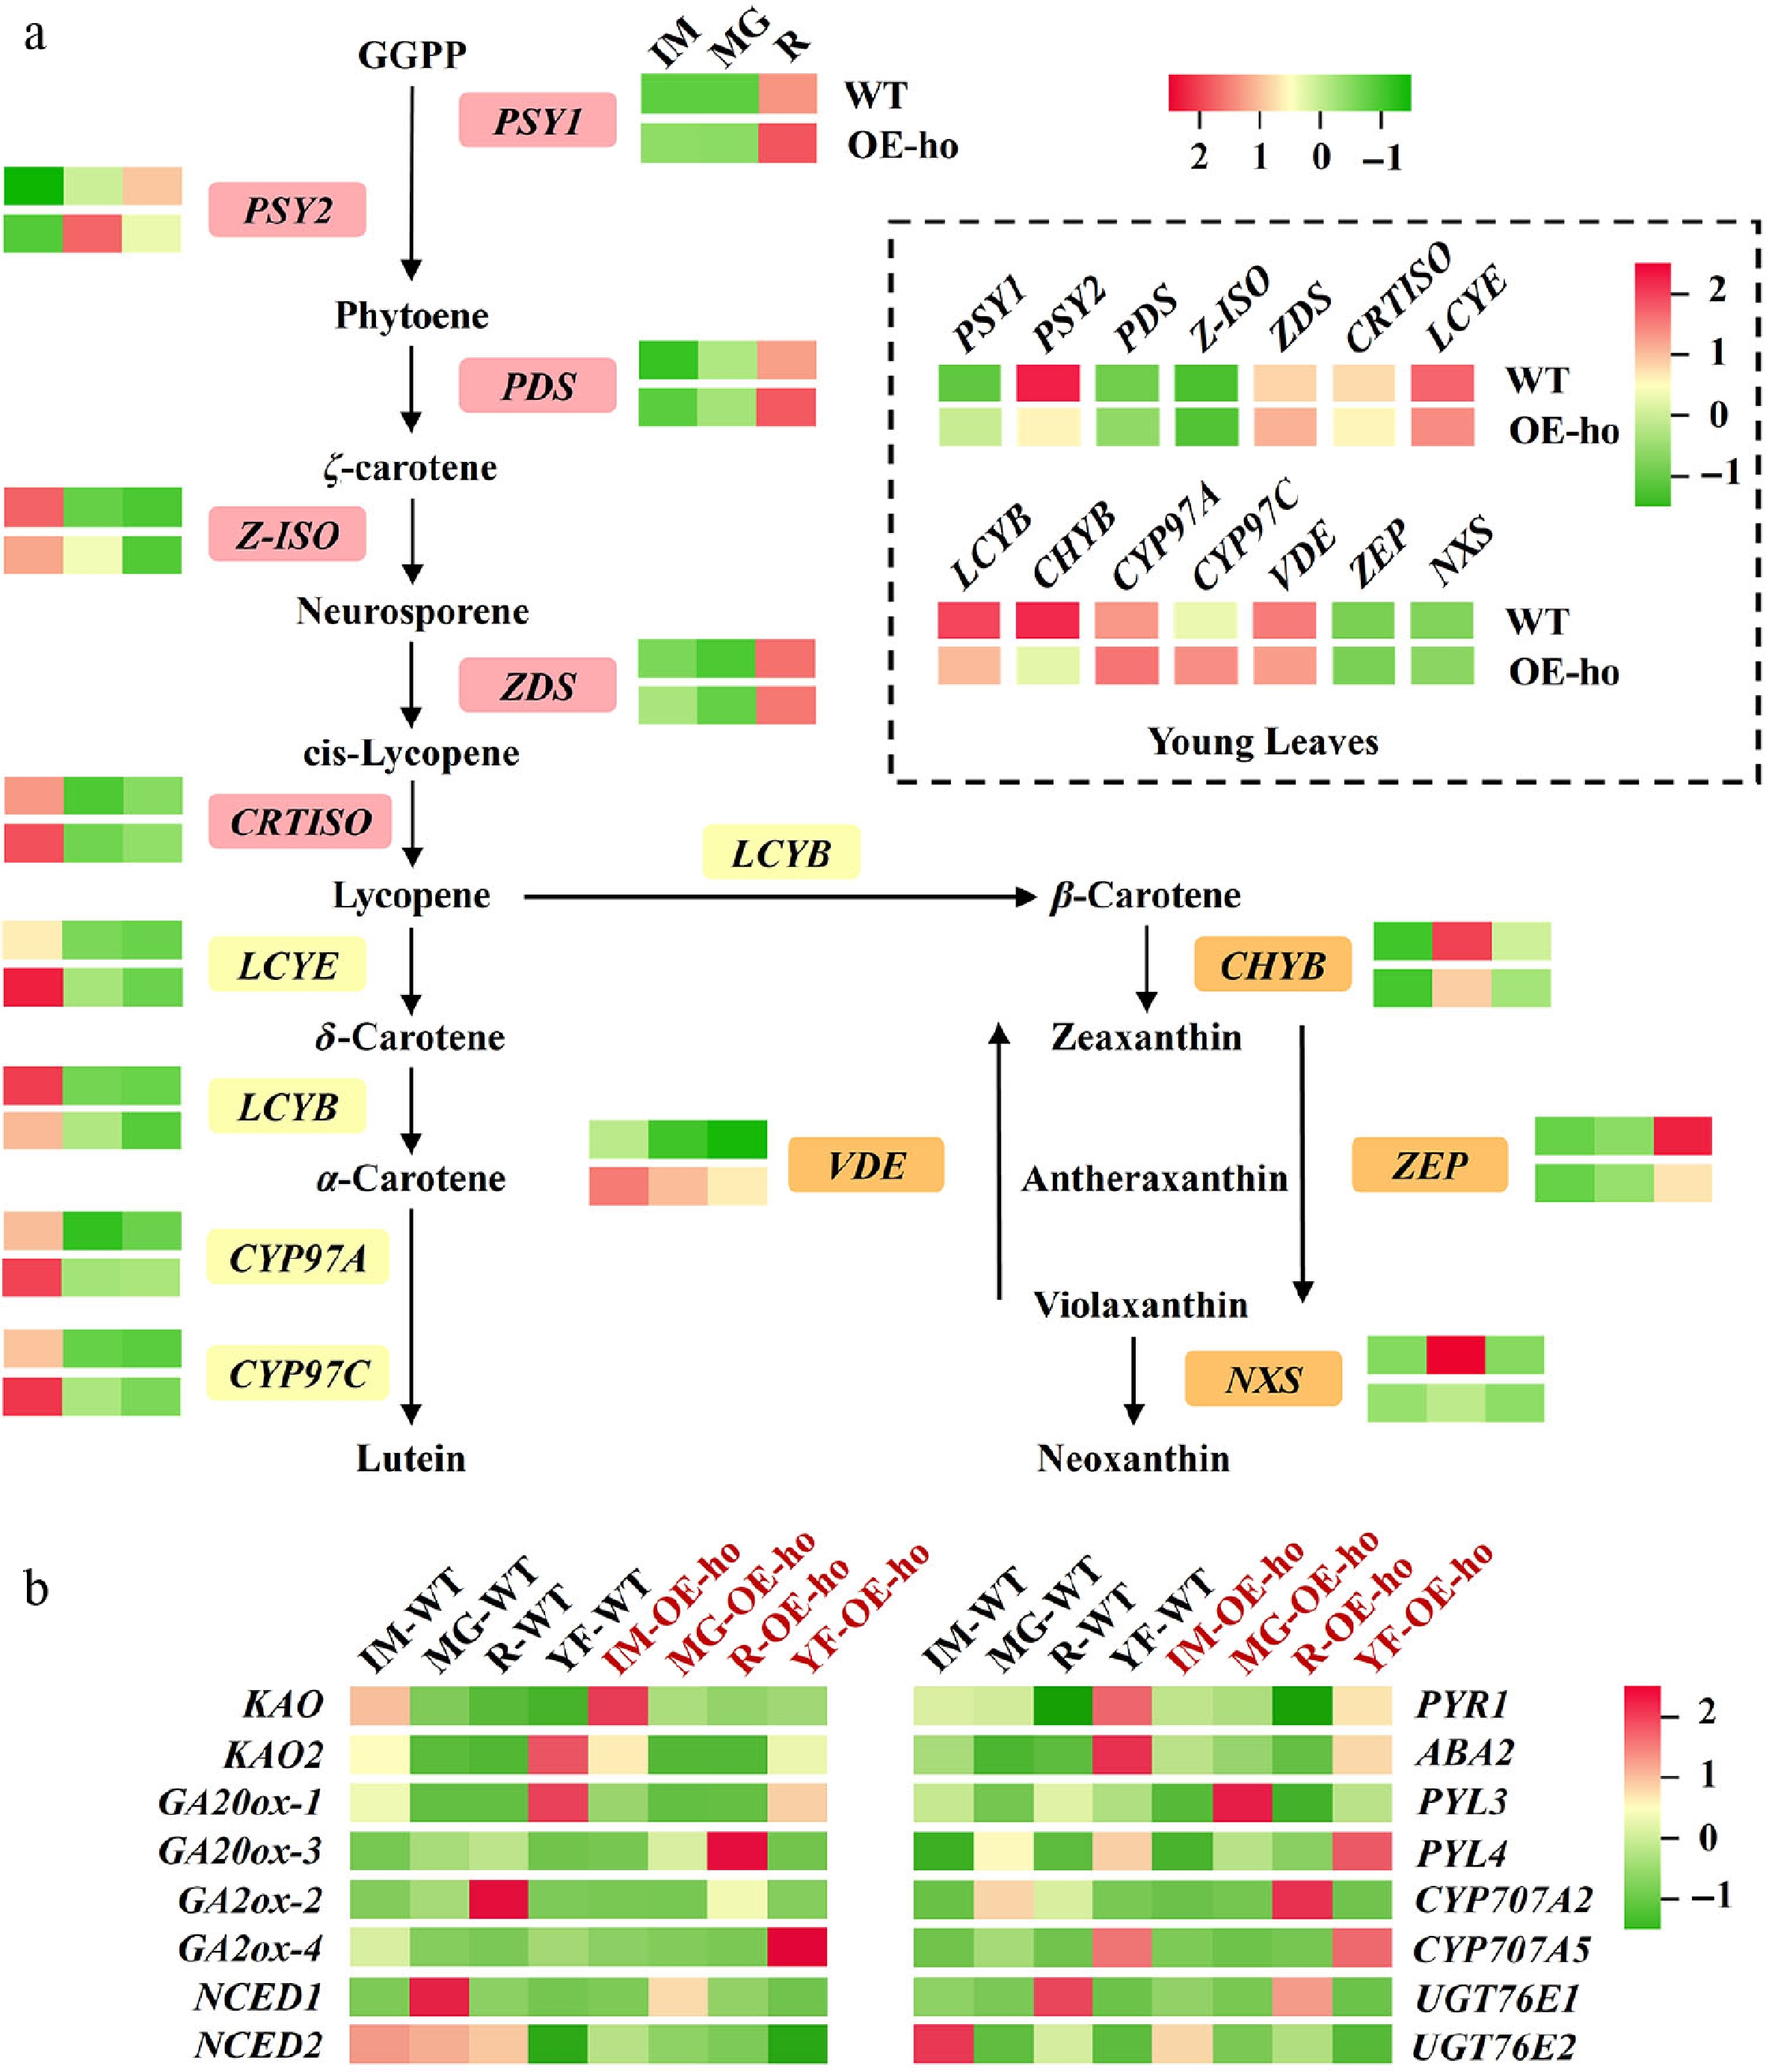
Figure 6.
Heatmap of genes related to (a) the carotenoid pathway and (b) the GA synthesis pathway, created by RNA-seq analysis using fruit at the immature (IM), mature green (MG), and red-ripe (R) stages in OE-ho lines and WT. Solid lines with arrows indicate the direction of metabolic pathways. The dashed box in (a) shows the expression pattern of genes in young leaves. Genes in panel (a): PSY1, phytoene synthase 1, PSY2, phytoene synthase 2; PDS, phytoene desaturase; Z-ISO, ζ-carotene isomerase; ZDS, ζ-carotene desaturase; CRTISO, carotenoid isomerase; LCYE, lycopene ε-cyclase; LCYB, lycopene β-cyclase; CHYB, β-carotene hydroxylase; CYP97A, cytochrome P450 97A; CYP97C, cytochrome P450 97C; VDE, violaxanthin de-epoxidase; ZEP, zeaxanthin epoxidase; NXS, neoxanthin synthase. Genes in panel (b): KAO, ent-kaurenoic acid oxidase; KAO2, ent-kaurenoic acid oxidase 2; GA20ox-1, gibberellin 20-oxidase 1; GA20ox-3, gibberellin 20-oxidase 3; GA2ox-2, gibberellin 2-oxidase 2; GA2ox-4, gibberellin 2-oxidase 4; NCED1, 9-cis-epoxycarotenoid dioxygenase 1; NCED2, 9-cis-epoxycarotenoid dioxygenase 2; PYR1, pyrabactin resistance 1; ABA2, abscisic acid deficient 2; PYL3, PYR-like 3; PYL4, PYR-like 4.
Overexpression of SlPsy1 gDNA in transgenic lines significantly altered the expression of GA synthesis and signal transduction-related genes (Fig. 6b; Supplementary Table S5). The KAO gene encoding a crucial enzyme, ent-kaurenoic acid oxidase, was upregulated, but the rate-limiting gene SlGA20ox-1 in the GA biosynthesis pathway was downregulated in young leaves and immature fruit of all transformants. KAO was also upregulated in MG and R fruit. So did SlGA20ox-3, another gene responsible for GA biosynthesis. On the contrary, the SlGA2ox-2 gene encoding gibberellin 2-beta-dioxygenase 2 for degrading GA and its precursor was downregulated in MG and R fruit. KAO2 and SlGA2ox-4 were downregulated in young leaves (Fig. 6b).
Although ABA content in leaves of OE-he lines was doubled compared to WT (Fig. 3a), the NCED2 gene encoding 9-cis-epoxy carotenoids dioxygenase, an important enzyme for ABA synthesis, was downregulated in leaves and fruit, while NCED1 was downregulated in young leaves and MG fruit (Fig. 6b). The genes encoding ABA 8'-hydroxylase (SlCYP707A2 and SlCYP707A5), key members of the ABA catabolic gene family, exhibited differential expression between WT and OE-he lines; the transcript levels were downregulated at the MG stage and upregulated at the R stage. The ABA glycosylation genes SlUGT76E1 and SlUGT76E2 showed an overall declining expression trend throughout fruit ripening and leaves (Fig. 6b). The gene PYR1, encoding an ABA receptor, was also downregulated in IM and MG fruit, as well as young leaves. Expression of other genes involved in ABA biosynthesis, metabolism, and degradation did not show consistent patterns (Fig. 6b). These results suggested that the overexpression of SlPsy1 altered the transcript levels of genes involved in the carotenoid pathway and the GA and ABA synthesis pathways, which changed the contents of carotenoids, GA, and ABA in plants.
Overexpression of SlPsy1 alters plastid type by influencing gene expression related to chromoplast differentiation
-
Chromoplast differentiation is regulated by the expression of genes associated with chloroplast development, chlorophyll degradation, and fruit ripening. To determine the causes of the alteration of plastid type in OE lines, we investigated the expression of genes related to chromoplast differentiation. As shown in Fig. 7a and Supplementary Table S6, the gene Pftf that has been shown to be involved in chromoplast differentiation in red pepper[28], was upregulated (1.5-fold; Supplementary Table S6) in OE-13-ho plant lines at the MG stage. PAO was also upregulated (1.9-fold; Supplementary Table S6) in OE-13-ho plants at the same stage. Both GLK1 and GLK2, the plant-specific transcription factors regulating chloroplast biogenesis and differentiation, were also upregulated at the MG stage, and GLK1 was significantly downregulated at the R stage in OE lines. HY5 was significantly downregulated (0.4-fold; Supplementary Table S6) at the MG stage. Moreover, the gene expression trends at three stages in fruit development and in leaves were overall consistent between OE-13-ho plants and WT (Fig. 7b; Supplementary Table S5). ACS2, encoding a rate-limiting enzyme in ethylene biosynthesis, showed significant upregulation in fruit at the MG stage and in leaves (Fig. 7b; Supplementary Table S6).
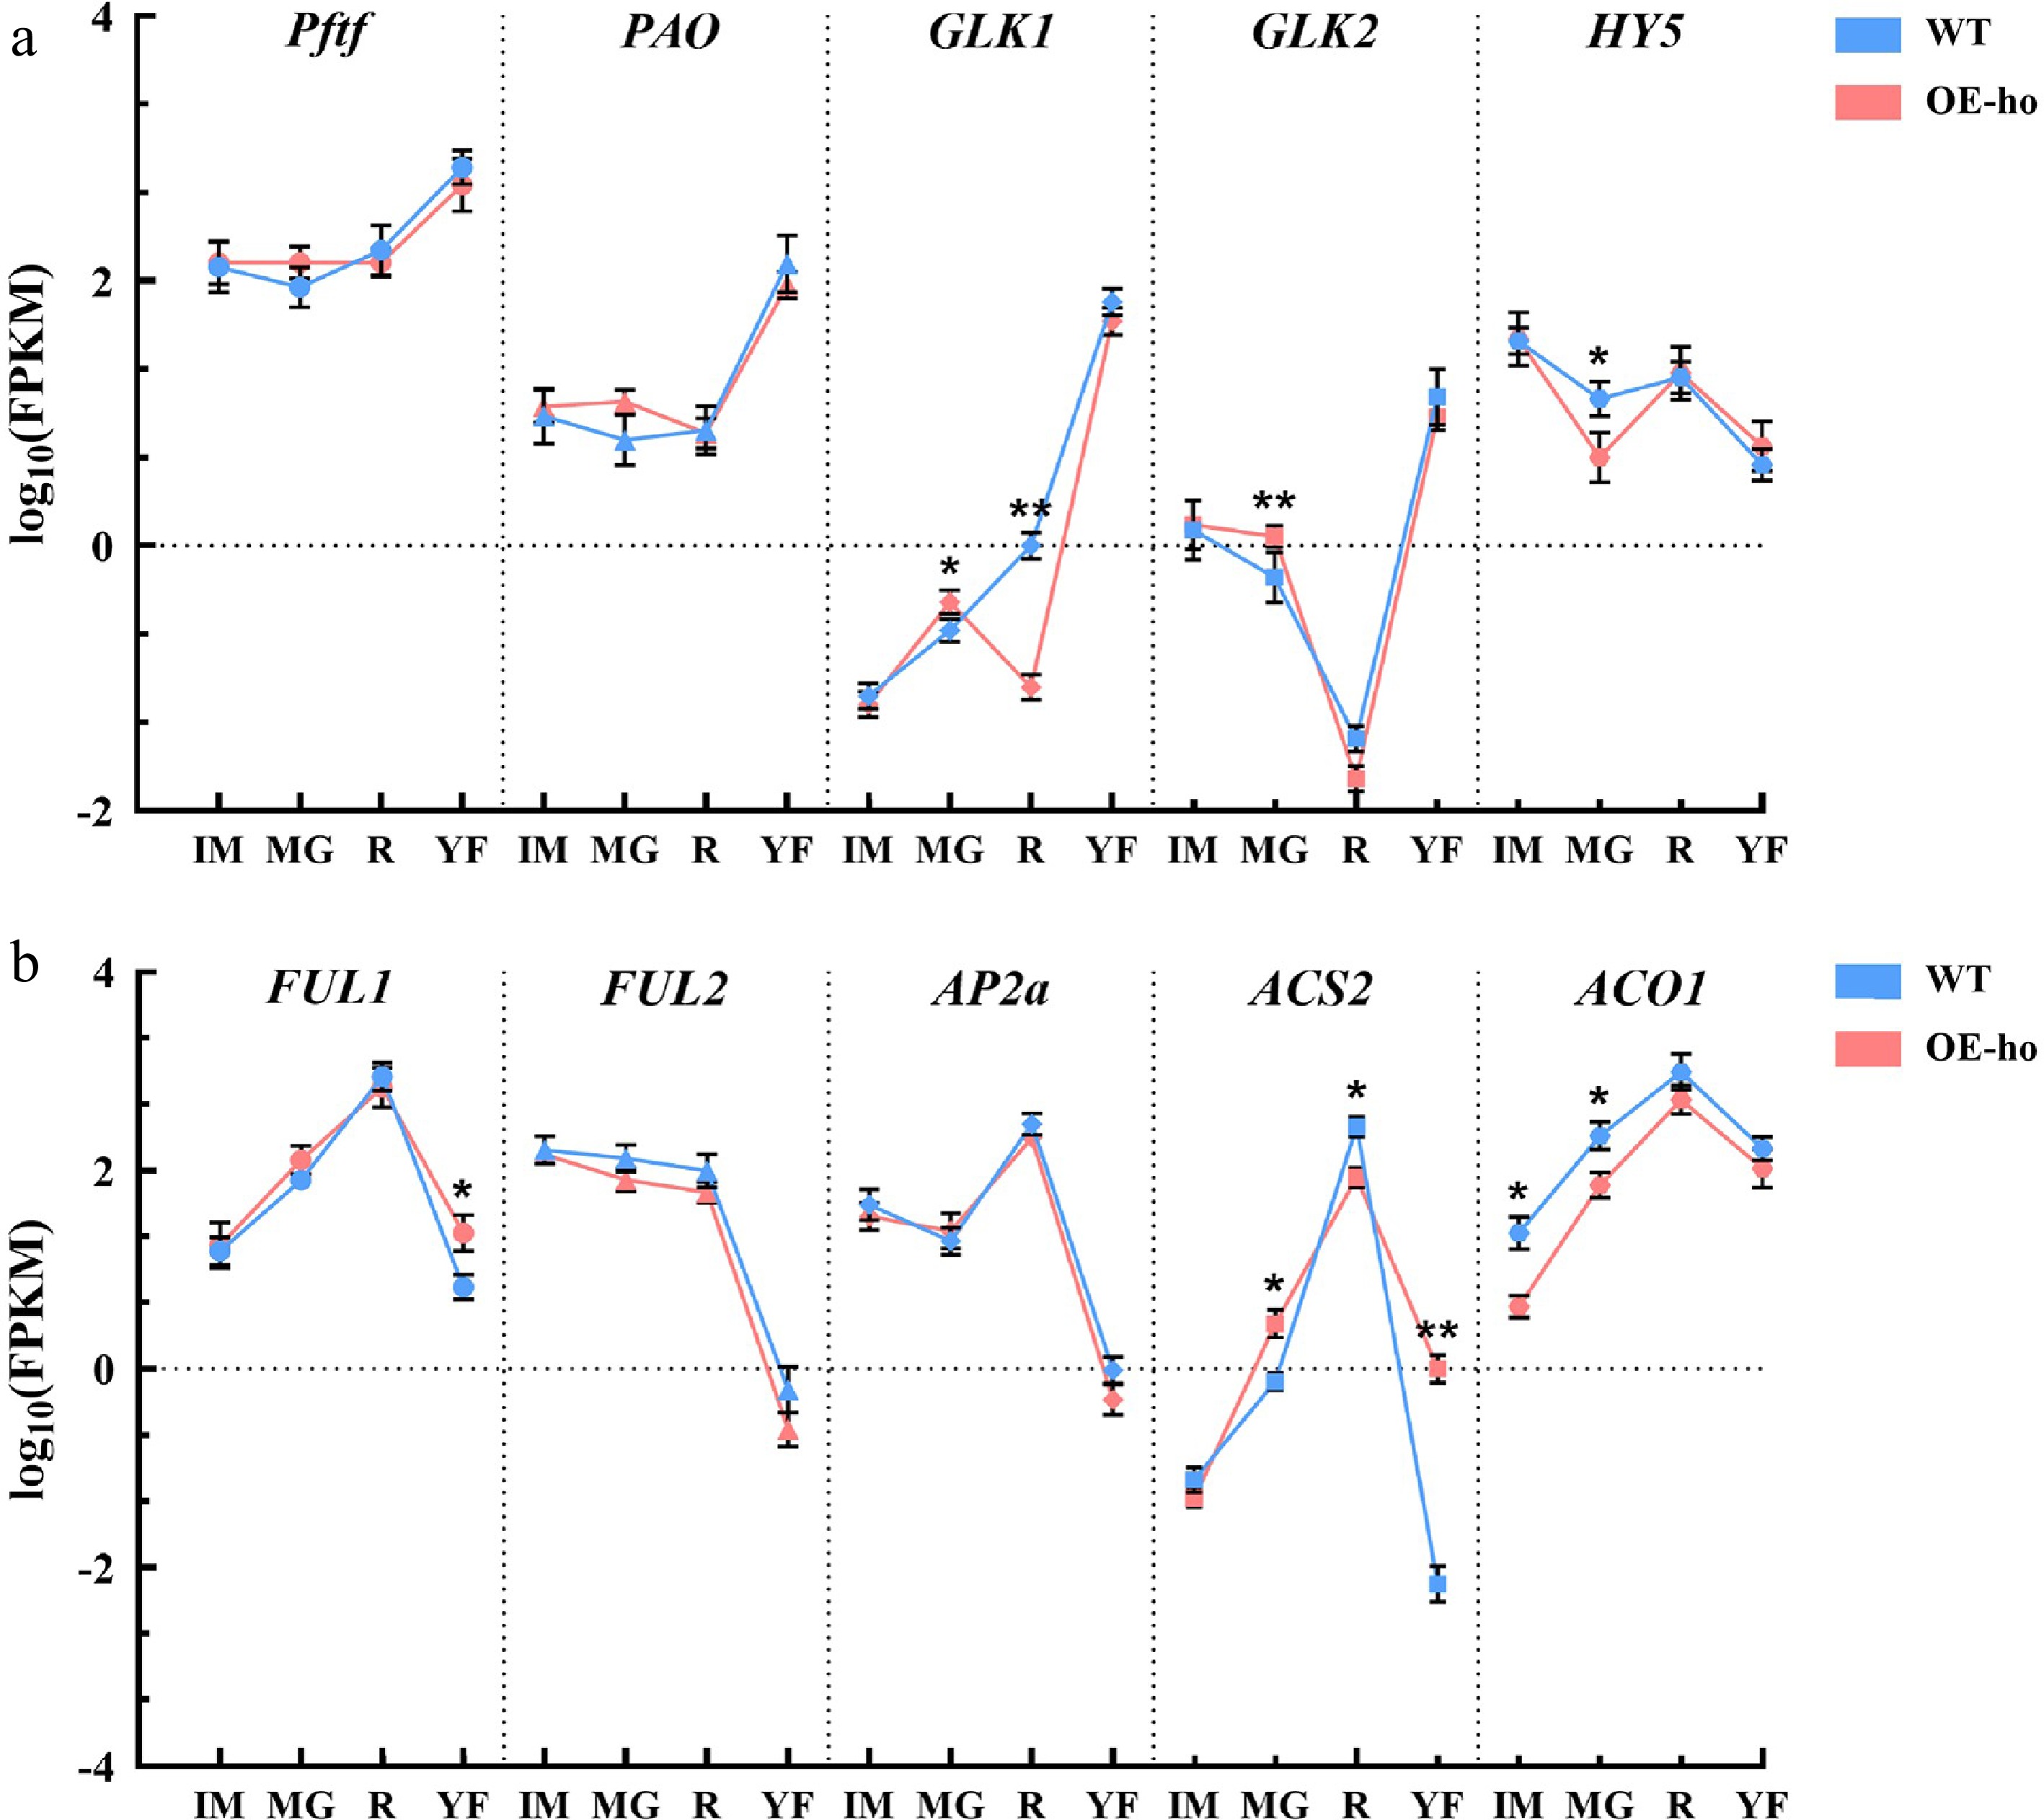
Figure 7.
The expression of genes involved in (a) plastid development and differentiation and (b) fruit ripening from RNA-seq data in immature (IM), mature green (MG), and red-ripe (R) fruit, as well as young leaves (YF), in OE-13-ho plants and WT. Pftf, plastid fusion and/or translocation factor; PAO, pheide a oxygenase; GLK1, golden 2-like 1; GLK2, golden 2-like 2; HY5, ELONGATED HYPOCOTYL 5; FUL1, FRUITFULL 1; FUL2, FRUITFULL 2; AP2a, APETALA2a; ACS2, 1-Aminocyclopropane-1-carboxylic acid synthase 2; and ACO1, 1-Aminocyclopropane-1-carboxylic acid oxidase 1. The data are shown as means ± SD (n = 3). Significant differences between WT and OE-ho at the same developmental stage were analyzed using a t-test. * p < 0.05, ** p < 0.01.
Expression of genes related to the chlorophyll metabolism pathway was perturbed by overexpression of the SlPsy1 gene
-
The colors of young organs were altered after constitutive overexpression of SlPsy1; determination of carotenoid and chlorophyll content in IM fruit and in leaves proved metabolite perturbation (Fig. 3; Supplementary Fig. S2). Therefore, the transcript profiles of chlorophyll synthesis in fruit (IM, MG, R) and young leaves were our primary focus to explain these alterations (Fig. 8; Supplementary Table S7). Among the genes in the porphyrin and chlorophyll metabolism pathways, most abundant transcripts mainly present in young leaves, except for HEMC and HEMD, in which the expressions of other genes were higher than fruit in both WT and OE-13-ho plants (Fig. 8). Twelve genes, including HEMA, GSA, HEMB, HEMC, HEME, HEMF, HEMG, CHLM, POR1, POR2, POR3, and CHLG, were upregulated in young leaves of OE-13-ho plants (1.1~2.2 fold; Fig. 8), but the transcript levels of HEMD, CHLD, CHLH, CHLI, ACSF, DVR, CAO, and GGR were downregulated in young leaves (0.7~0.9 fold; Fig. 8). However, the expression pattern in fruit was different. In OE lines, the HEMD gene was upregulated in MG fruit (1.6-fold; Fig. 8) but downregulated in IM and R fruit (0.9-fold; Fig. 8). The transcript levels of CHLD, CHLH, CHLI, ACSF, DVR, CAO, and GGR were upregulated at three fruit developmental stages (1.1~3.5-fold; Fig. 8).
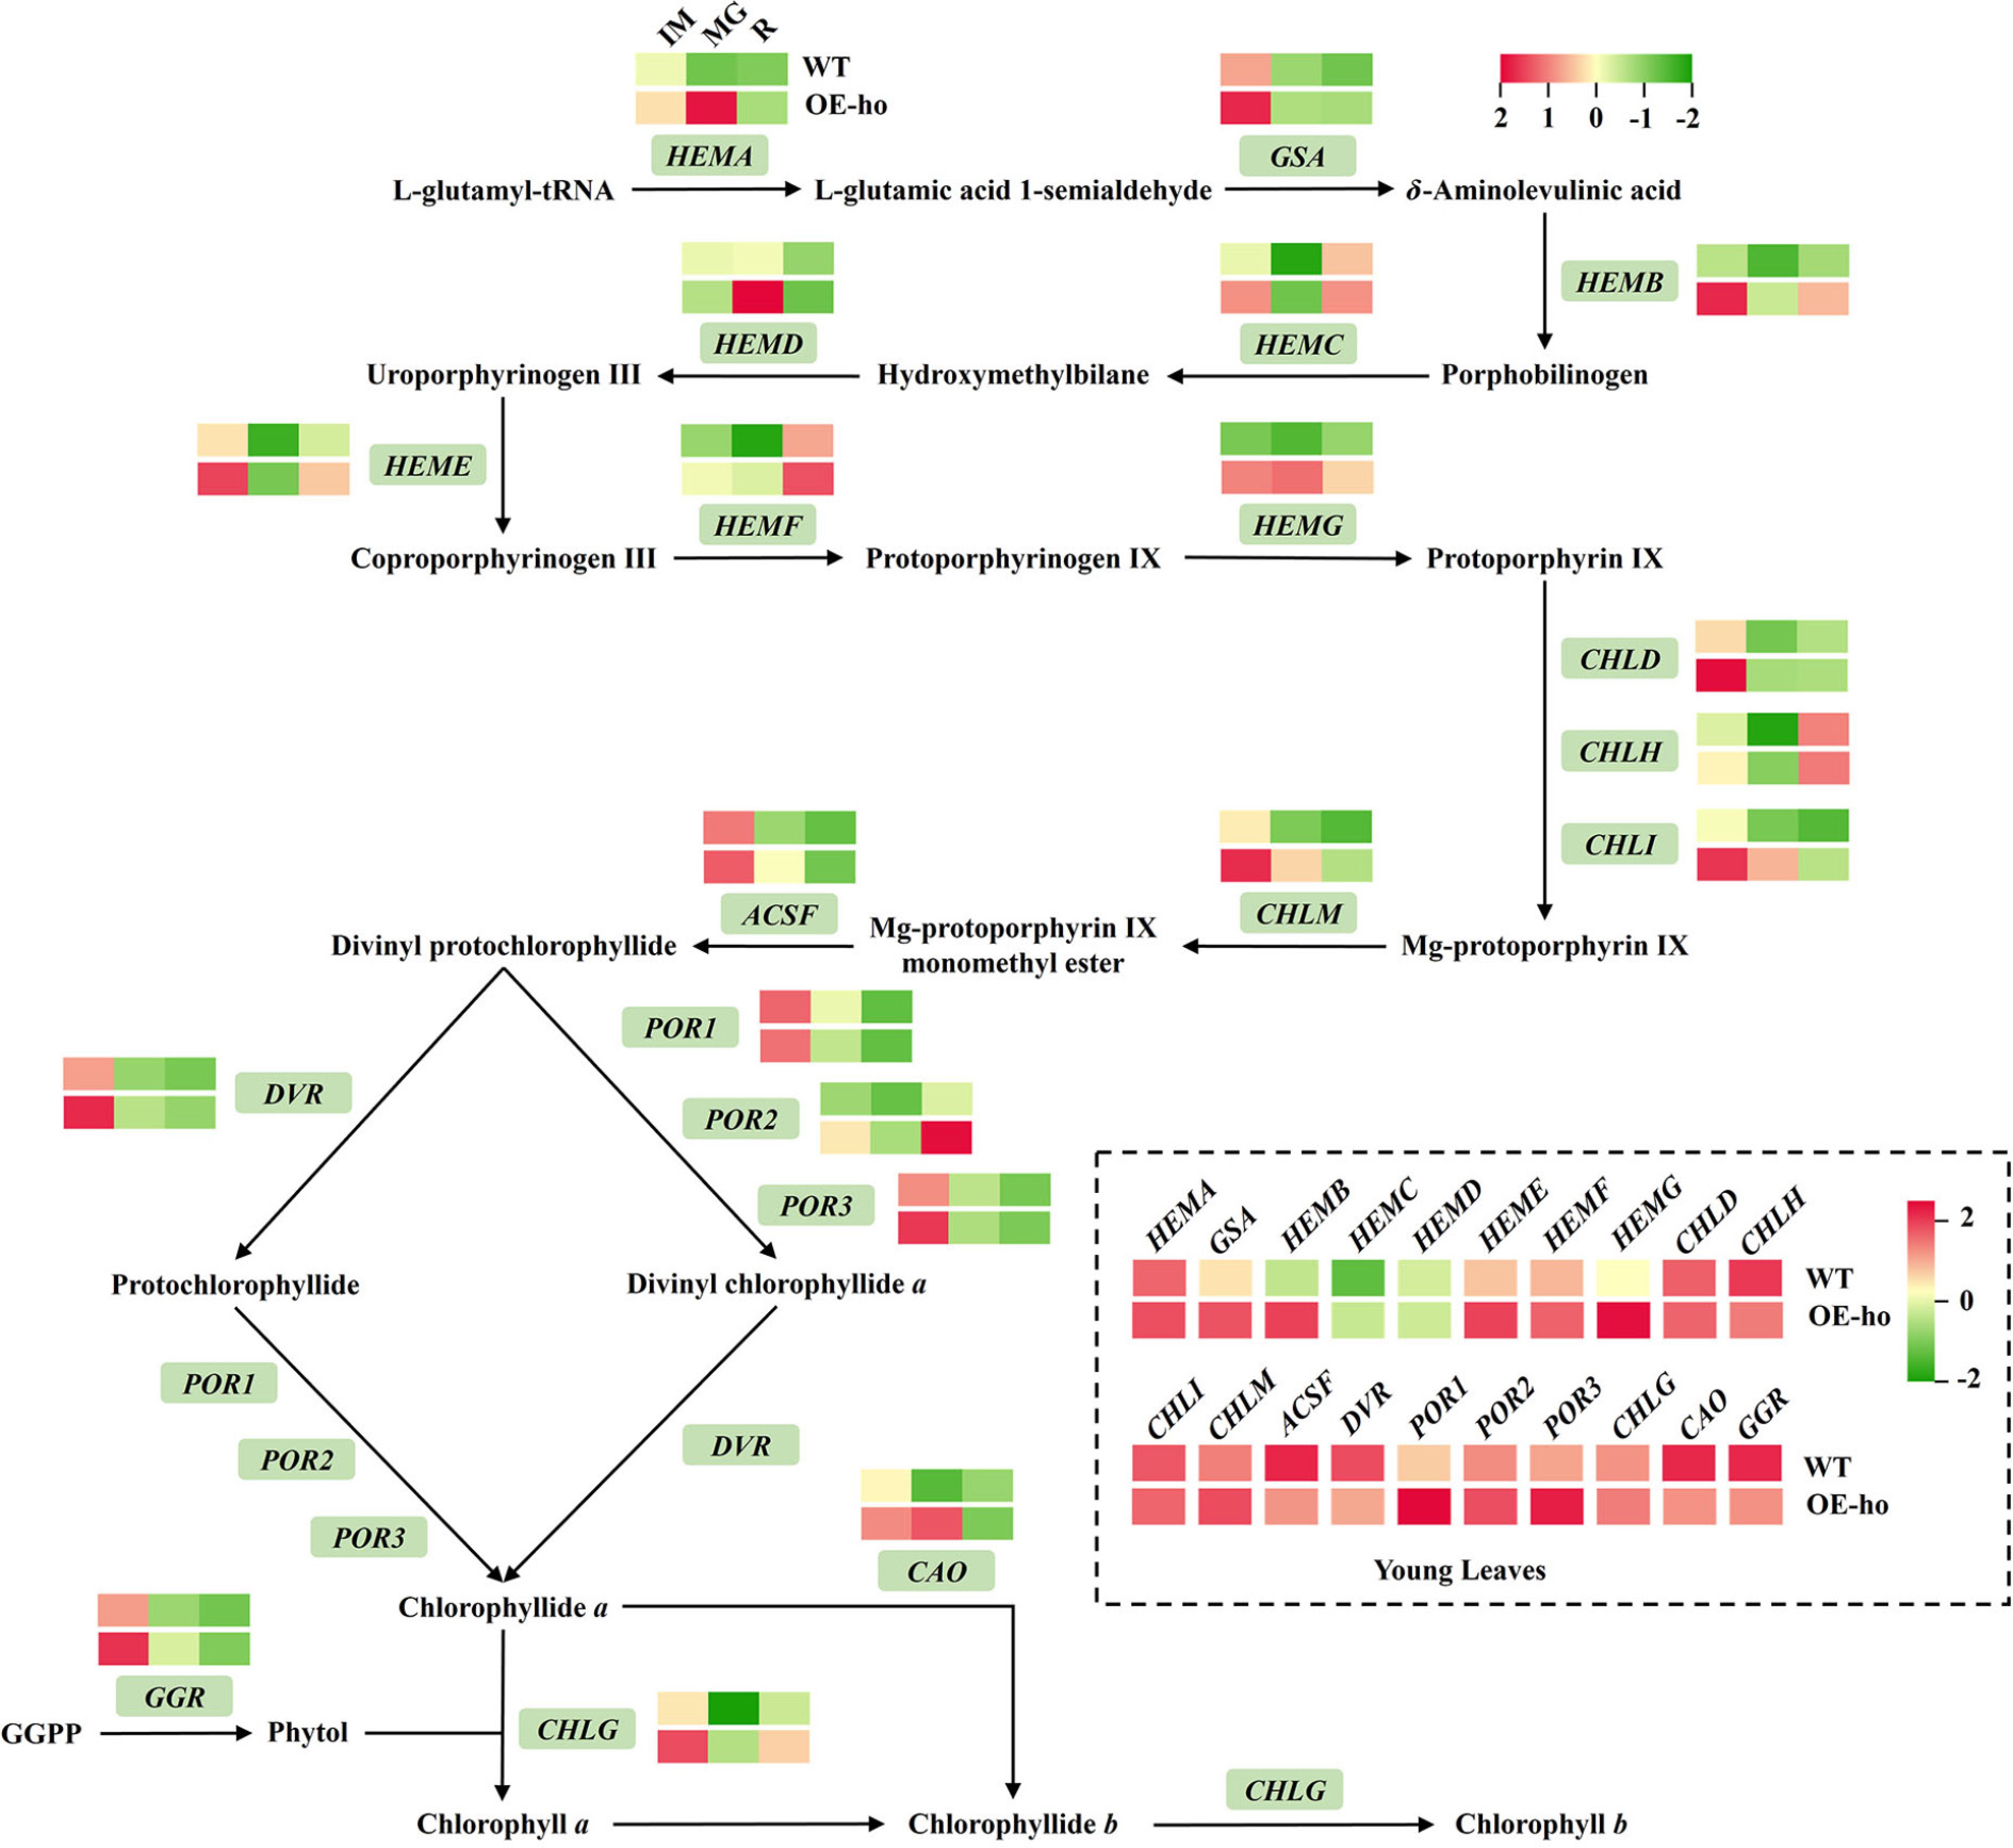
Figure 8.
Heatmap showing the expression pattern of genes related to the chlorophyll metabolism pathway from RNA-seq data at the immature (IM), mature green (MG), and red-ripe (R) fruit developmental stages, as well as young leaves. Solid lines with arrows present the direction of metabolic pathways. The dashed box exhibits expression patterns of chlorophyll metabolic genes in young leaves. HEMA, glutamyl-tRNA reductase; GSA, glutamate-1-semialdehyde aminotransferase; HEMB, 5-aminolevulinic acid dehydratase; HEMC, porphobilinogen deaminase; HEMD, uroporphyrinogen III synthase; HEME, uroporphyrinogen III decarboxylase; HEMF, coproporphyrinogen III oxidase; HEMG, protoporphyrinogen IX oxidase; CHLD, Mg-protoporphyrin IX chelatase D subunit; CHLH, Mg-protoporphyrin IX chelatase H subunit; CHLI, Mg-protoporphyrin IX chelatase I subunit; CHLM, Mg-protoporphyrin IX methyltransferase; ACSF, Mg-protoporphyrin IX monomethylester cyclase; POR1, protochlorophyllide oxidoreductase 1; POR2, protochlorophyllide oxidoreductase 2; POR3, protochlorophyllide oxidoreductase 3; DVR, divinyl chlorophyllide a 8-vinyl-reductase; CAO, chlorophyllide a oxygenase; CHLG, chlorophyll synthase; and GGR, geranylgeranyl reductase.
-
Constitutive overexpression of cDNA of the SlPsy1 gene under the CaMV 35S promoter leads to a stunted growth phenotype and ectopic pigment production in tomato cultivar Ailsa Craig[9,10]. However, only some transformants show abnormal pigment production in abscission zones, immature fruit, immature seed coats, hypocotyls, and cotyledons, and reduced plant height accompanied by a low level of chlorophyll in young leaves and a low fruit set in previous studies[9,10]. Furthermore, overexpression of SlPsy1 cDNA from PI 114,490 in cultivar M82 only shows yellowing in young leaves without other obvious and severe phenotypic alterations[19]. Both studies suggest that overexpression of the SlPsy1 gene into different genetic backgrounds of transformation receptors has different phenotypes. In the current study, novel phenotypic alterations were discovered by observing or measuring traits related to plant height, root, stem, leaf, flower, fruit, and seeds in all transformants with constitutive overexpression of the genomic DNA of the SlPsy1 gene in tomato line Ohio 88,119, and all phenotypic alterations could be inherited, based on observations from T0 to T2 generations. Compared with WT, fruit, leaves, and flower sizes were reduced, fruit was elongated, pigments were accumulated in roots and stems, and seed germination rates were slow in all transformants. Although the fruit and leaves were yellowish at the immature stage, they gradually turned green during growth and ripening, eventually matching WT (Fig. 4i). These additional phenotypic alterations might be due to the different types of DNA used for genetic transformation; cDNA of SlPsy1 was used in previous studies[9,10,19], and genomic DNA containing five introns was used here. The expression of SlPsy1 was significantly higher in transgenic lines with overexpression of the gDNA than in transgenic lines with overexpression of cDNA (Supplementary Fig. S4). Introns can function as internal promoters, elevate expression as intron-mediated enhancement, increase the steady-state levels of mature mRNA in the cytosol, and increase the efficiency of mRNA translation[29]. All introns in the SlPsy1 gene contain a number of cis-acting elements (CAAT-box) and core promoter elements (TATA-box) (Supplementary Table S8), suggesting that they might function as internal promoters. Some introns also contain other types of cis-elements (e.g., Myb), indicating that other transcription factors might also be involved in gene expression. However, further experiments need to be conducted to prove our hypothesis of intron-enhanced gene expression and to determine the molecular mechanism.
Biosynthesis of carotenoids, gibberellin, and phytol share a common precursor, GGPP[5,6,30−34]. Therefore, a rational distribution of GGPP to all involved pathways is crucial for plant growth and development. The biosynthesis and distribution of GGPP is dominantly determined by geranylgeranyl diphosphate synthase (GGPPS), and the partitioning of GGPP among distinct metabolic pathways is collectively modulated by functional differentiation arising from diverse subcellular localization, spatiotemporal expression divergence of GGPPS, specific protein–protein interactions between GGPPS and downstream enzymes that utilize GGPP as a substrate to form multi-enzyme metabolons, along with upstream precursor supply, downstream metabolic flux, and phytohormone feedback regulation[4,34−36]. For example, during tomato fruit ripening, SlGGPPS2 interacts with SlPsy1 and SlPsy2 to form metabolons, redirecting an increased flux of GGPP into the carotenoid metabolic pathway[4]. Manipulation of gene expression in one pathway through a transgenic approach or application of chemicals may have significant influence on others and result in abnormal phenotypes. Tobacco plants treated with paclobutrazol, a GA biosynthesis inhibitor, increase pigment content with a dark green phenotype[37]. Functional disruption of PDS3 inhibits expression of many genes in carotenoid, chlorophyll, and GA biosynthesis pathways, which results in albino and dwarf phenotypes in Arabidopsis[38]. Overexpression of Dclcyb1, a carotenoid biosynthesis gene from Daucus carota, in Nicotiana tabacum induces a positive feedback of significant increases of the expression of isoprenoid gene precursors (Ntdxs2 and Ntggpps) and genes involved in carotenoid (Ntpsy1, Ntpsy2, and Ntlcyb), gibberellin (Ntga20ox, Ntcps, and Ntks) and chlorophyll (Ntchl) pathways, which leads to increased content of total carotenoids, β-carotene, and chlorophyll, as well as more active GA4. Consequently, plant height, leaf size, and whole plant biomass are increased[33]. Overexpression of Psy1 driven by the CaMV 35S promoter significantly increases the levels of phytoene and β-carotene but significantly decreases the chlorophyll content, which is caused by changes in plastid differentiation in peach[39]. In the current study, overexpression of SlPsy1 led to a marked increase in SlPsy1 transcriptional abundance, which may enhance its competitive binding to GGPPS, thereby redirecting a greater flux of GGPP toward carotenoid biosynthesis at the expense of reduced fluxes into the gibberellin and phytol pathways. Accordingly, the content of most GAs (Fig. 3) and chlorophyll significantly declined (Fig 4c; Supplementary Fig. S2f), while carotenoids (Supplementary Fig. S2e) and ABA (Fig. 3) were significantly raised in all transformants. These data were consistent with the previous proposal of lack of precursor availability for the biosynthesis of gibberellins and phytol[10,11]. Expression of genes for GA biosynthesis was altered (Fig. 6b), with KAO2 and GA20ox-1 significantly downregulated in OE lines, suggesting negative feedback to lack of GA, which eventually resulted in reduced plant organ size and less chlorophyll. The dwarf phenotype can be partially reserved by the application of GA3[10]. Similarly, the prolonged seed germination in the OE-he lines can also be restored by application of GA3 (Supplementary Fig. S1b, S1c). These data support that the lack of GA is the cause of reduced plant organ size in the lines with overexpression of the SlPsy1 gene. Meanwhile, ABA content in OE lines was significantly increased (Fig. 3a), but transcription of ABA biosynthetic genes NCED1 and NCED2 was downregulated, and the transcription of ABA degradation genes CYP707A2 and CYP707A5 showed stage-specific changes (Fig. 6b). On the other hand, downregulation of UGT76E1 and UGT76E2 genes (Fig. 6b) might reduce conversion of ABA to the ABA-GE form, which further contributes to ABA accumulation. Thus, the increased ABA in OE lines might result from enhanced precursor supply and reduced glycosylation. According to the auxin-GA-ABA cross-talk mechanisms regulating plant growth, IAA positively promotes GA biosynthesis and antagonizes ABA signaling under stress conditions[40]. In this study, overexpression of SlPsy1 significantly altered endogenous GA and ABA content, but did not change IAA levels (Fig. 3). This is consistent with the fact that IAA biosynthesis is independent of the plastidial GGPP, indicating that the GA/ABA imbalance arises from direct precursor competition rather than from altered auxin signaling. Mutation of genes involved in carotenoid biosynthesis can also cause significant phenotypic alterations. A single nucleotide substitution in the SlMCT gene alters gene expression and metabolic components in the MEP and other pathways, which result in changes in the total contents of carotenoids, chlorophyll, IAA, GAs, SA, CK, JA, and ABA[41]. Therefore, the balance among the biosynthesis of carotenoids, gibberellin, phytol, and others is crucial to normal plant growth and development.
Psy1 was a plastid-dependent gene; mutation of PSY1 would perturb its subcellular localization and alter its function[19,42]. Similar plastid alterations and high-pigment phenotypes have been reported in tomato hp mutants. Plastid number increased in a tomato UV-DAMAGED DNA-BINDING PROTEIN 1 (DDB1) homolog mutation hp1[43]. Plastid volume enlarged in the DEETIOLATED1 mutation hp2[44,45]; hp3 is an ABA-deficient mutant with larger plastid compartment size in fruit cells[46]. All these mutations induced high pigmentation, including carotenoids and chlorophyll content, which increased with plastid alteration. However, differentiation of plastids is always coupled to acquisition of specific roles, but some plastids are interconvertible during development[47,48] or changed by some factors, such as shade processing or gene modification[16,18,49]. In this study, overexpression of SlPsy1 changed plastid type and pigment accumulation (Fig. 4; Supplementary Fig. S2e). Genes associated with plastid development and chromoplast differentiation, including Pftf, PAO, GLK1, GLK2, and HY5, were significantly altered (Fig. 7), further confirming that SlPSY1 acts as a key regulator of plastid identity and developmental transition, in addition to its classic role in carotenoid biosynthesis. Consistent with pigment alterations and premature plastid differentiation, SlPsy1 overexpression led to distinct changes in chlorophyll metabolic genes between leaves and fruit. In young leaves, most chlorophyll biosynthetic genes were upregulated while several key genes were downregulated (Fig. 8). In fruit, however, core chlorophyll synthetic genes were generally induced (Fig. 8). The overall reduction in chlorophyll was therefore mainly attributed to premature chloroplast-to-chromoplast transition, rather than simple transcriptional inhibition of chlorophyll synthesis. Therefore, the genomic DNA overexpression of SlPsy1 strongly enhances carotenoid biosynthesis, promotes premature chloroplast-to-chromoplast transition (with chromoplasts significantly increased and chloroplasts reduced), and redirects GGPP flux, leading to GA deficiency, increased ABA, and severe growth inhibition. Nevertheless, the bulk RNA-seq approach used here may average signals across cell types and plastid populations[50]. Future integration of single-cell and spatial transcriptomics would help unravel the cell-type-specific and spatially organized regulatory networks underlying plastid development and metabolic reprogramming.
It is well known that PSY is a key rate-controlling step in carotenoid biosynthesis that controls the metabolic flux of carotenoids and flavonoids[3,51]. PSY1 can be regulated by various genes such as RIN, SGR1, PIF1, RAP2.2, OR, and Clp[32,52−59], resulting in alterations in the contents and components of carotenoids. On the other hand, PSY1 itself can also modulate tomato fruit quality by influencing the metabolic flux between the carotenoid and flavonoid pathways[51]. This study showed that overexpression of SlPsy1 could upregulate SlPsy2, CRTISO, LCYE, CYP97A, and CYP97C at various fruit developmental stages, resulting in high accumulation of β-carotene in fruit (Fig. 6), which was consistent with other findings[39,51]. However, deleterious effects of constitutive overexpression of SlPsy1 under the CaMV 35S promoter in tomato prevent its application to fruit nutrient and quality improvement. This can be solved by using certain fruit-specific promoters. Although overexpression of the SlPsy1 gene driven by the fruit-specific E-8 promoter also shows some deleterious effects on tomato plants and fruit[11]; overexpression of crtB, HpBHY, CrBKT, and SlLCYB driven by the E-8 promoter enhances production of native carotenoids in fruit without influence on plant growth[60], and overexpression of SlWRKY14 driven by the E-8 promoter changes the contents of carotenoids and flavonoids without affecting yield or developmental integrity in tomato[61]. Furthermore, carotenoid and flavonoid content in tomato fruit can be increased significantly, whereas other parameters of fruit quality are largely unchanged when RNAi of the DET1 gene is performed using fruit-specific promoters T56, P119, 2A11, and TFM7[62]. All these data suggest that it is feasible to explore an appropriate fruit-specific promoter to drive expression of the SlPsy1 gene to increase carotenoid content without affecting plant growth, development, and other quality traits.
-
The authors confirm their contributions to this study as follows: investigation: Xiao Y; conceptualization: Xiao Y, Yu M, Sun L, Yang W; formal analysis, writing – original draft: Xiao Y, Yu M; validation: Sun Y; resources: Shen H; supervision: Shen H, Yang W; data curation: Sun L; funding acquisition: Yang W; project administration: Sun L, Yang W; writing – review and editing: Yu M, Sun L, Yang W. All authors reviewed the results and approved the final version of the manuscript.
-
The datasets generated during and/or analyzed during the current study are available from the corresponding author upon reasonable request.
-
The authors declare that they have no known competing financial interests or personal relationships that could have appeared to influence the work reported in this paper.
-
accompanies this paper online at: https://doi.org/10.48130/vegres-0026-0026.
-
# Authors contributed equally: Yao Xiao, Mengyi Yu
- Supplementary Table S1 Primers used in this study.
- Supplementary Table S2 Segregation of plant height in three OE T1 generation.
- Supplementary Table S3 Copy number of SlPsy1 in wild type Ohio 8811 and transgenic lines with overexpression of SlPsy1 gDNA.
- Supplementary Table S4 FPKM of all DEGs between WT and OE lines in immature (IM), mature green (MG), and red ripe (R) fruits as well as young leaves (YF).
- Supplementary Table S5 FPKM of DEGs involved in carotenoid pathway and GA synthesis pathways between WT and OE lines in immature (IM), mature green (MG), and red ripe (R) fruits as well as young leaves (YF).
- Supplementary Table S6 FPKM of DEGs involved in plastid development, differentiation and fruit ripening between WT and OE lines in immature (IM), mature green (MG), and red ripe (R) fruits as well as young leaves (YF).
- Supplementary Table S7 The FPKM of DEGs involved in porphyrin and chlorophyll metabolism between WT and OE lines in immature (IM), mature green (MG), and red ripe (R) fruits as well as young leaves (YF).
- Supplementary Table S8 Motifs in introns predicted by PlantCARE (http://bioinformatics.psb.ugent.be/webtools/plantcare/html/).
- Supplementary Fig. S1 Flowering time and seed germination in T2 lines with overexpression (OE) of the SlPsy1 gene in tomato inbred line Ohio 88119 (wild type, WT).
- Supplementary Fig. S2 Other color-related phenotypes observation and pigment determination induced by SlPsy1 overexpression.
- Supplementary Fig. S3 Distribution of differentially expressed genes in immature green (IM), mature green (MG), red ripe (R) stages fruit and young leaves (YF).
- Supplementary Fig. S4 Abundance of SlPsy1 transcripts in wild types (M82 and Ohio 88119) and transgenic lines.
- Copyright: © 2026 by the author(s). Published by Maximum Academic Press, Fayetteville, GA. This article is an open access article distributed under Creative Commons Attribution License (CC BY 4.0), visit https://creativecommons.org/licenses/by/4.0/.
-
About this article
Cite this article
Xiao Y, Yu M, Sun Y, Shen H, Sun L, et al. 2026. Transcriptomic reprogramming of several metabolic pathways caused by overexpression of SlPsy1 contributes to great morphological alterations in tomato. Vegetable Research 6: e032 doi: 10.48130/vegres-0026-0026 

Transcriptomic reprogramming of several metabolic pathways caused by overexpression of SlPsy1 contributes to great morphological alterations in tomato
- Received: 26 May 2026
- Revised: 27 August 2026
- Accepted: 31 August 2026
- Published online: 29 September 2026
Abstract: Phytoene synthase 1 (PSY1) plays a vital role in carotenoid biosynthesis. Overexpression of the Psy1 gene to increase the carotenoid content in tomato is not feasible due to the negative effect on plant growth and development. Here, we demonstrated that constitutive overexpression of the genomic DNA of SlPsy1 resulted in severe alterations in color and size in whole plant parts, including fruit, leaves, stems, and roots. Compared to wild type, plant height and leaf length were shorter, leaf width was narrower, and fresh fruit weight was also significantly reduced in OE lines. The gibberellin (GA) content was reduced by about 50% in both total amount and active type, while the abscisic acid content was nearly doubled in OE lines. Transcriptomic analysis revealed that transcription of genes involved in several metabolic pathways, including carotenoids, phytohormones, and chlorophyll, as well as chromoplast differentiation, was reprogrammed. The expression of SlGA20ox-1, a vital gene in the GA synthesis pathway, was significantly downregulated. Overexpression of SlPsy1 promoted premature chloroplast-to-chromoplast transition and reduced chloroplast number, resulting in the accumulation of β-carotene in immature fruit, a nearly 40% increase in carotenoid content at the red ripe stage, and a significant decrease in chlorophyll content. These results provide key knowledge to understand the regulatory networks among several metabolic pathways and a potential strategy to improve nutritional quality by modifying Psy1 expression.
-
Key words:
- SlPsy1 /
- Carotenoids /
- Chlorophyll /
- Phytohormone /
- Transcriptional regulatory network