


-
The prevailing trends of declining birth rates and increasing life expectancy have given rise to rapidly ageing populations in developed countries[1]. These shifts have precipitated a rising prevalence of age-related diseases, which has culminated in a severe burden on many healthcare systems globally[2]. This climate has placed increasing scrutiny on the biological process of ageing and its consequences on health. Analysis of ageing at a molecular level has given rise to the concept of a biological age, which deviates from the traditional notion of a calendar or chronological age. Biological age can be seen as a more precise reflection of an individual's rate of ageing based on measurable parameters rather than temporal metrics. Currently established methods of determining biological age include the use of DNA methylation clocks, telomere length and biomarker panels[3−5]. While innovative, these methods possess limitations such as time consumption, high cost and invasiveness. This has presented an opportunity for the development of a quick, cheap and accessible ageing biomarker. One such proposal involves the use of ocular parameters to predict biological age. The eye is an organ that offers both external vision to the individual as well as an internal perspective on the individual's overall health status when observed from the outside. Additionally, the retina shares similar embryological roots and physiological features with vital organs[6], which potentiates its use as a window into systemic health. Rapidly developing capabilities of high-resolution retinal imaging techniques and artificial intelligence (AI) present the possibility of drawing new health insights from the eye. This has given rise to the discovery of many ocular ageing biomarkers[7]. Compared to other ageing biomarkers, these biomarkers offer three distinct advantages: speed, non-invasiveness and cost-effectiveness.
This review is aimed at determining the extent of current literature relating to ocular ageing biomarkers. The specific aims are assessing the accuracy and key findings of each model/biomarker, determining the efficacy of combining ocular and extra-ocular ageing biomarkers and reviewing the clinical utility and associations of each biomarker, if any.
-
A systematic search of the databases MEDLINE and Embase was conducted on April 15, 2024, for studies that discuss a specific ocular parameter as a biomarker of ageing. Initial keywords which built a foundation for the search included (ocular OR eye) AND (biological age OR ageing biomarker). In order to expand the scope to cover all ocular parameters, all words under the MeSH category 'eye' were included in the search. Additionally, further alternative terminology for biological age was added to capture more relevant articles. The search was also limited to human-based studies and English articles. The full search strategy is included in Appendix A.
Inclusion criteria
-
• Studies which specifically discussed any ocular parameter in the context of it being an ageing biomarker.
• Studies which attempted to draw a correlation between a certain ocular parameter and biological or chronological age.
• Applied studies which analysed the association between an ocular ageing biomarker and certain outcomes, such as risk of disease.
• Extra-ocular biomarkers could be discussed if it was in relation to ocular biomarkers.
• Studies needed to be human-based.
• Ocular parameters needed to be determined by imaging modalities.
Exclusion criteria
-
• Articles that discussed ocular biomarkers outside the context of ageing.
• Articles that strictly analysed intra-ocular molecular or genetic biomarkers.
• Animal-based studies.
• Non-English studies.
• Review articles.
The screening process consisted of an initial title and abstract screen, followed by an in-depth full-text assessment for eligibility on the remaining articles. A PRISMA diagram is included in Fig. 1.
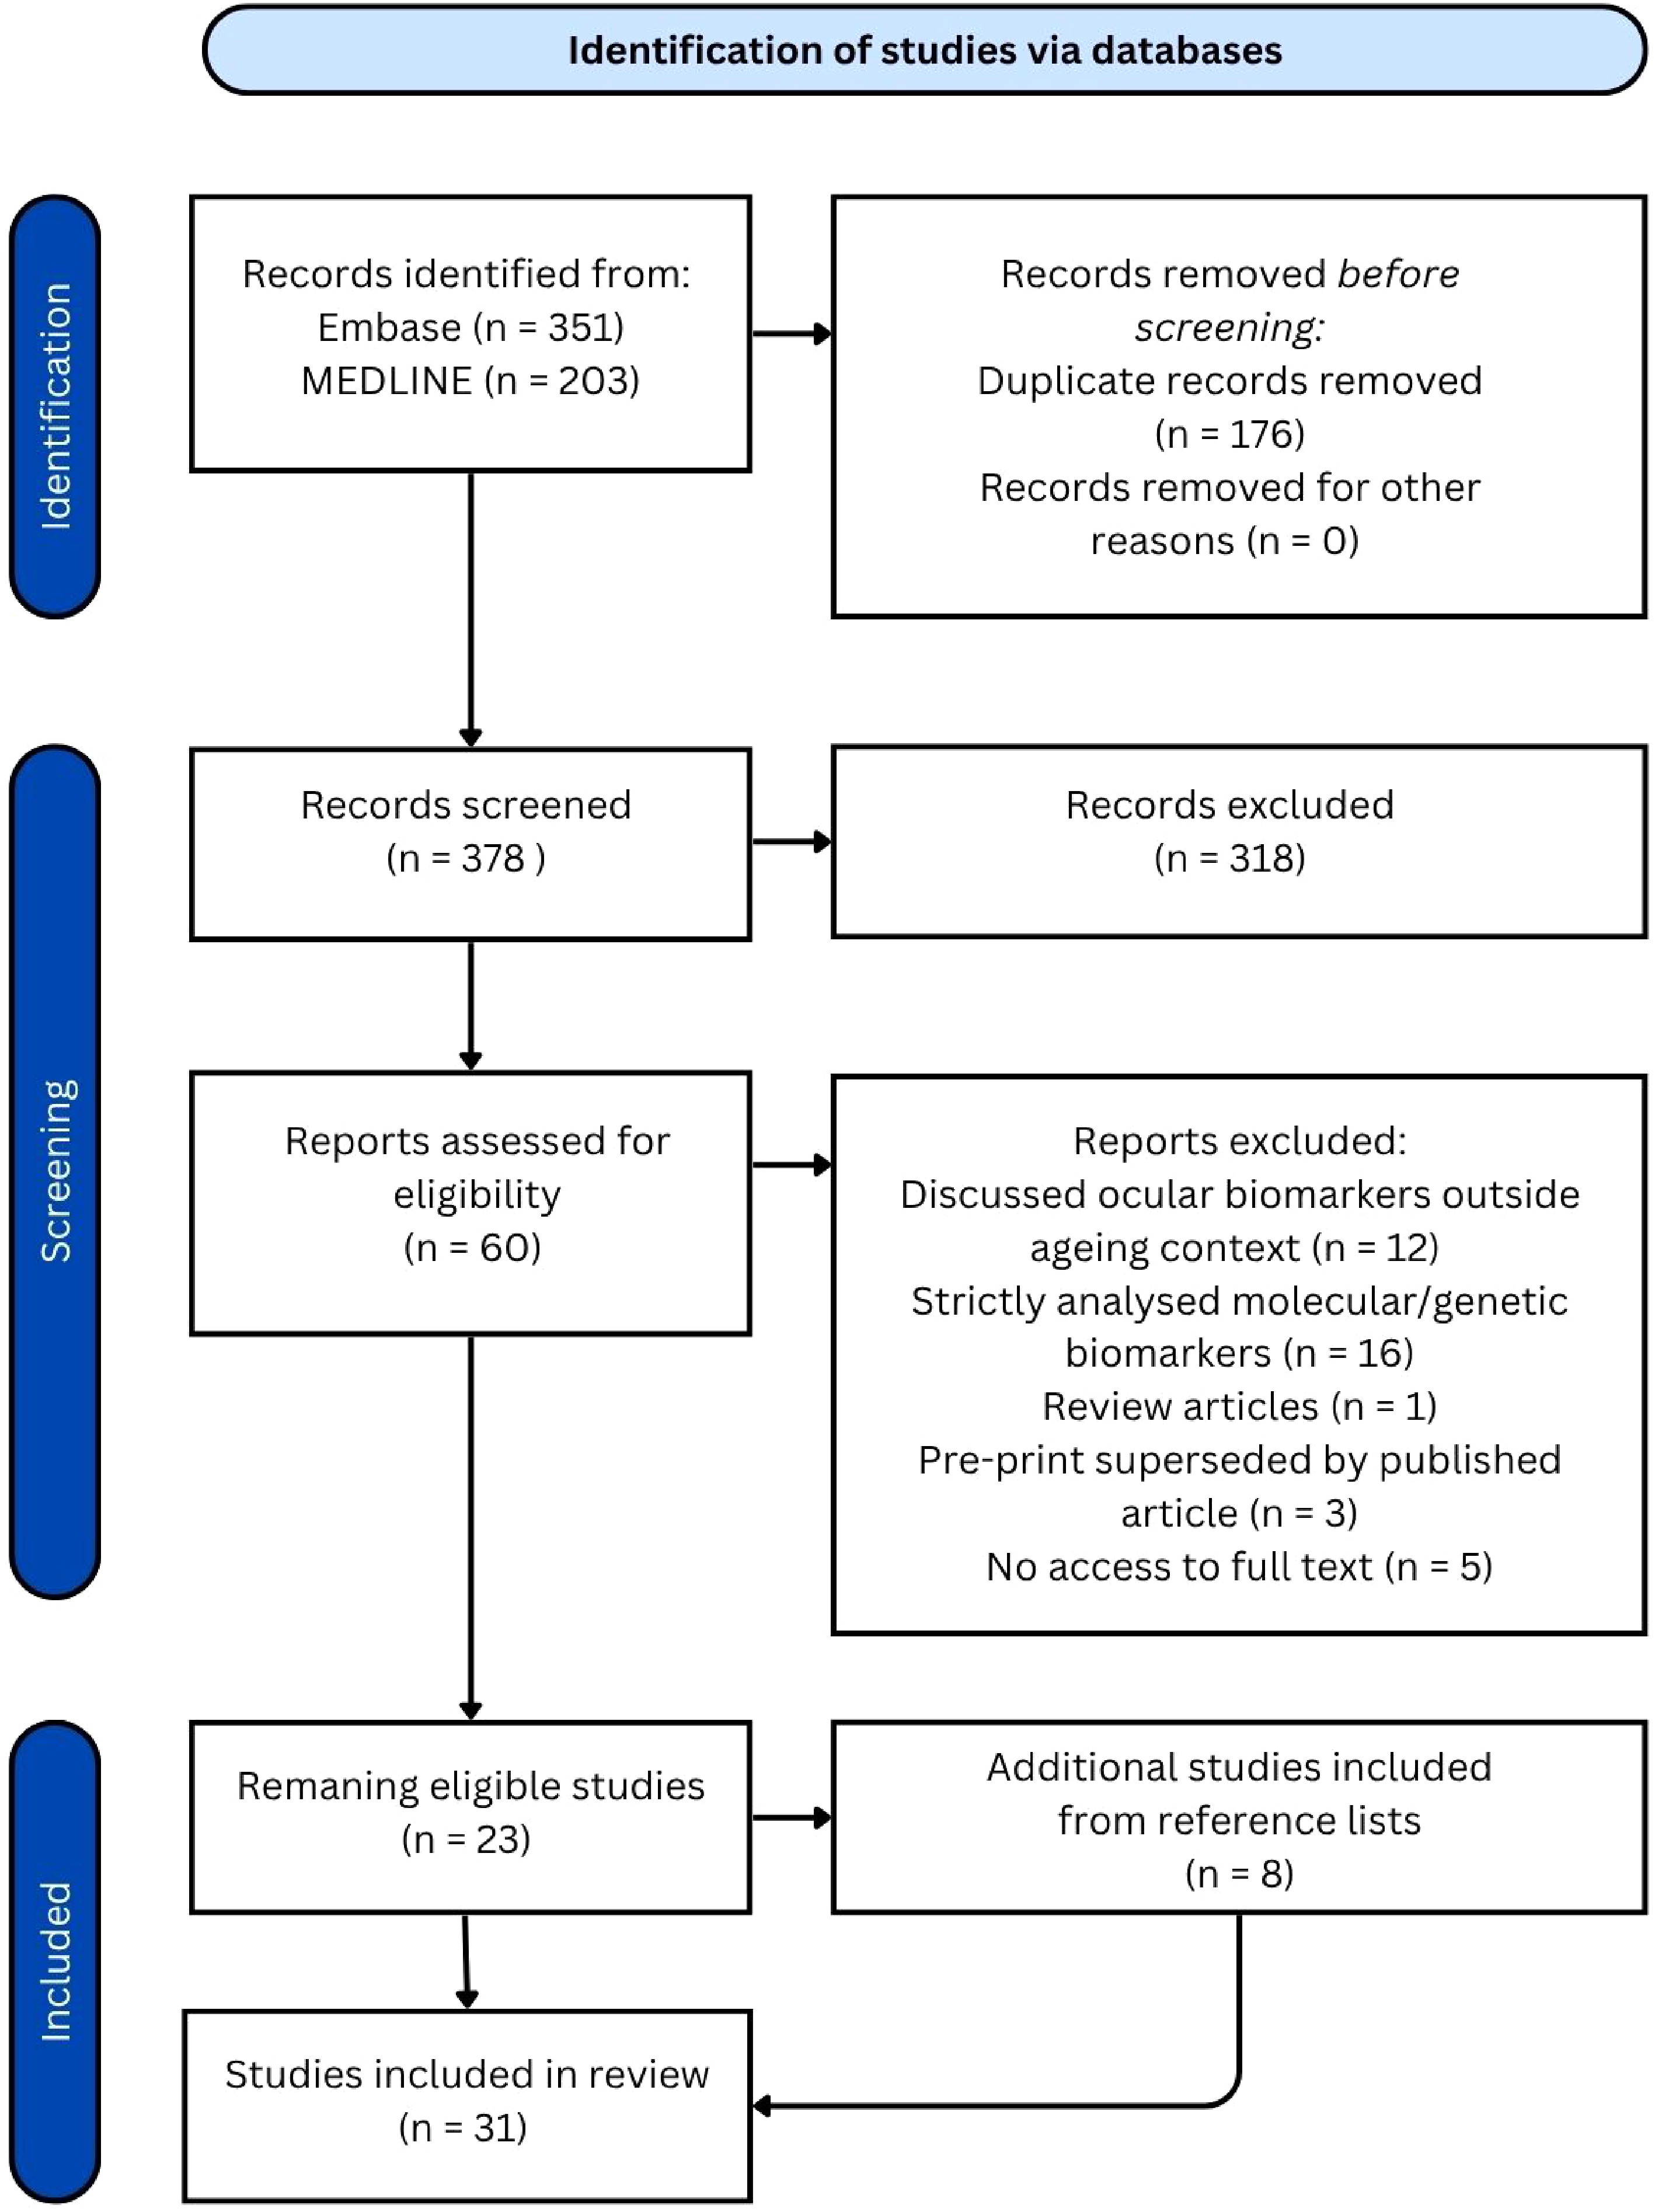
Figure 1.
PRISMA diagram.
-
The systematic search was conducted on April 15, 2024, and yielded 554 articles: 351 from Embase and 203 from MEDLINE. After removing 176 duplicate articles, 378 articles remained for title and abstract screening. Out of these, 60 articles proceeded to full-text review, resulting in the removal of an additional 37 articles and leaving 23 eligible articles. The reference lists of these remaining studies were screened, and eight additional articles were identified and included, bringing the total to 31 articles reviewed. Amongst these were 22 articles which introduced one or more ocular ageing biomarkers. While each AI-focused article presented a single biomarker, some non-AI articles examined multiple biomarkers, resulting in a broader range of biomarkers overall. The characteristics of the included studies are summarised in Table 1.
Table 1. Overview of ocular ageing biomarkers.
Biomarker AI/
non-AIPopulation Predictive accuracy for age/
correlation with ageRisk stratification Retinal age[8] AI 19,200 fundus images from 11,052 participants in the UK Biobank study (UK) r = 0.81 between predicted retinal age and chronological age, MAE = 3.55 years One year increase in RAG associated with increased risk of Parkinson's disease (10%), incident CVD (3%), stroke (4%), kidney failure (10%), metabolic syndrome or inflammation (1%), DR in diabetic patients (7%), mortality (2%) Convolutional network-based model[9] AI 98,400 retinal images of diabetic patients enrolled in the Retislaud program of the Canary Islands health service (Spain) MAE = 3.97 years in predicting chronological age using retinal age RAG of patients without DR was 0.609 years, significantly lower than that of patients with DR which was 1.905 years (p < 0.001) eyeAge[10] AI 217,289 fundus images from 100,692 patients from the EyePacs dataset (US screening program) + UKB cohort for external validation (UK) r = 0.95 and 0.87, MAE = 2.86 and 3.30 years for predicting chronological age in EyePacs and UKB datasets respectively Positive association with COPD (p = 0.0048), myocardial infarction (p = 0.049) and mortality risk RetiAGE[11] AI 129,236 retinal photographs from 40,480 participants in the Korean Health Screening Study (South Korea) + 56,301 UKB patients for external validation (UK) AUROC = 0.968 in predicting ≥ 65 years, decreased to 0.756 when testing UKB cohort 4th RetiAge quartile = greater risk of CVD, cancer and mortality (HR = 1.39, 1.18, 4.74 respectively) compared to those in 1st quartile AgeDiff[12] AI 11,223 subjects from the China Bioage investigation Consortium cohort (China) r = 0.91, MAE = 1.94 years in predicting chronological age 4th AgeDiff quartile = greater risk of chronic heart disease, chronic kidney disease, CVD, diabetes, hypertension and stroke (HR = 5.04, 5.25, 5.16, 5.61, 5.78, 4.67 respectively) compared to those in 1st quartile OCT age[13] AI 7,271 OCT B-scans from 278 healthy participants in the Duke Glaucoma Registry (USA) r = 0.860, MAE = 5.82 years in predicting chronological age Not applicable OCT age[14] AI 6,147 pre-operative OCT scans from 3,134 patients in Ray Guard Eye Clinic (China) MAE = 5.78 years in predicting chronological age Not applicable OCT age[15] AI 84,753 OCT scans from 53,159 individuals from the UK Biobank (UK) MAE = 3.27 years in predicting chronological age 5-year increase in OCT age gap associated with an 8% increase in mortality (p = 0.004) LensAge[16] AI 8,255 lens photographs from 1,990 relatively healthy individuals enrolled in the Chinese Cataract Screening Program between 2018 and 2021 (China) R2 = 0.89, MAE = 4.88 years in predicting chronological age Positive LensAge index = greater risk of systemic age-related diseases (OR = 1.26) which include diabetes, hypertension, CVD, cancer, cerebral infarction IOP, visual acuity, lens opacity[17] Non-AI 1,428 research participants in North Hertfordshire (England) Visual acuity and lens opacity had weak positive correlations with chronological age
(r = 0.1, p = 0.04 and r = 0.13, p = 0.01 respectively), whilst IOP demonstrated no correlationNot applicable Microvascular complexity[18] Non-AI 68 patients from the Faculty of Medicine at the University of Montenegro (Montenegro) Advanced chronological age associated with decreased microvascular complexity Not applicable RNFL birefringence and NFI[19] Non-AI 140 retinal photos from 73 healthy subjects from a tertiary eye care facility in South India (India) 1.3 unit increase in NFI and 1µm decrease in RNFL birefringence associated with a one decade increase in age Not applicable RNFL thickness[20] Non-AI 113 individuals recruited from the University of Houston University Eye Institute clinics (US) Both vessel-included and vessel-removed RNFL measurements negatively associated with ageing (−0.234 and −0.206 μm/year, respectively) Not applicable RNFL thickness[21] Non-AI 35 randomly selected healthy subjects in the University Eye Center, Hong Kong Eye Hospital (China), followed over a 4-month period Negative correlation between age and average RNFL thickness (−0.33 μm/year; p = 0.011), longitudinal analysis showed an average rate of change of −0.52 μm/year (95% confidence interval [CI], −0.86 to −0.17) Not applicable RNFL thickness[22] Non-AI 100 healthy volunteers (location not specified) Both total retinal thickness and RNFL thickness significantly reduced with increasing age (R² = 0.133 and 0.094, respectively; p < 0.001) Not applicable Retinal microvascular function[23] Non-AI 123 healthy adult participants from the Vascular Research Laboratory at Aston University in Birmingham (UK) tMC and tMD significantly higher in oldest group compared to youngest and middle age groups Not applicable Retinal vessel wall thickness[24] Non-AI 238 subjects recruited by the Kyoto University Hospital Department of Ophthalmology (Japan) Both arterial and venous wall thicknesses were significantly correlated with age (r = 0.612, p < 0.001 and r = 0.455, p < .001 respectively) Not-applicable Retinal vessel diameter[25] Non-AI 4,926 individuals from the Beaver Dam Eye Study in Wisconsin (US) Retinal arteriolar diameter decreased by 2.1 μm per decade of age (95% confidence interval [CI], 1.5 to 2.7), and retinal venular diameter decreased by 2.3 μm (p < 0.001) for each decade increase in age Not-applicable Retinal vessel density, inner retinal layer thickness, venular blood flow velocity[26] Non-AI 74 healthy subjects from the University of Miami Miller School of Medicine (US) Age negatively associated with retinal vessel density, inner retinal layer thickness, and venular blood flow velocity (p < 0.05), and positively associated with the thickness of the outer plexiform and photoreceptor layers (p < 0.05) Not-applicable CRAE and AVR[27] Non-AI 168 Flemish participants (Belgium) 20% shorter leukocyte telomere length (ageing biomarker) associated with a decrease of 4.57 µm (p = 0.0011) in CRAE and a decrease of −0.020 (p = 0.0018) in AVR Not applicable Lens density, retinal vessel calibre, corneal endothelial cells and retinal nerve fibre layer thickness[28] Non-AI 256 participants from an HIV prevention trial site in a township community of Cape Town (South Africa) CDKN2A expression positively correlated with lens density (p-trend = 0.05), telomere length positively correlated with endothelial cell density (p-trend = 0.08), associations were observed between CDKN2A expression and retinal arteriolar calibre (p-trend = 0.06), and shorter telomere length associated with thinning of the retinal nerve fibre layer (p-trend = 0.05) Greater lens density associated with increasing frailty (p-trend = 0.03) Macular drusen[29] Non-AI 1,037 participants in the Dunedin Study (New Zealand) Statistically insignificant results between the presence of macular drusen and biological age determined by subjective facial age ratings Not applicable AI-based models for ocular ageing
-
So far, nine AI models have been developed for ocular-based ageing biomarkers. Notably, all AI algorithms included in this review used chronological age as a reference standard for training, given the lack of a standardised method to determine biological age in current research.
'Retinal age' is based on a deep learning model trained from 19,200 fundus images from 11,052 participants in the UK Biobank study, which is a large-scale medical database. These patients were part of a demographic without previous diseases, whose biological age was presumed to be synchronised with chronological age[8]. This healthy population thus served as an ideal benchmark for establishing normal ageing features. The 'Retinal Age' model was able to achieve a strong Pearson correlation coefficient (r) of 0.81 between predicted retinal age and chronological age, with a mean absolute error (MAE) of 3.55 years[8]. The algorithm was subsequently validated in the general population, which included individuals exhibiting accelerated ageing compared to the healthy reference cohort. The discrepancy between predicted retinal age and chronological age was proved to be a significant biomarker for ageing and mortality risk[8].
The 'convolutional network-based model' was trained using 98,400 retinal images of patients with diabetes enrolled in the Retislaud program of the Canary Islands health service. The model achieved an MAE of 3.97 years in predicting chronological age[9]. Specifically, this model used chronological age as a reference standard but was trained on retinal images in patients living with diabetes. The authors defined the retinal age gap as the difference between chronological age and retinal age and observed its association with diabetic retinopathy (DR) severity[9].
The 'eyeAge' model was trained using 217,289 fundus images from 100,692 patients from the EyePacs dataset, a US screening program. The model was then tested on both EyePacs and UK biobank datasets and achieved strong Pearson correlation coefficients (r) of 0.95 and 0.87, with an MAE of 2.86 and 3.30, respectively. Notably, the 'eyeAge' project also included a longitudinal element, in which the model was asked to correctly order two visits from each given patient. The model correctly ordered 71% of visits within a year[10], which sheds a promising light on the longitudinal aspect of ocular age.
The 'RetiAGE' model was trained using 129,236 retinal photographs from 40,480 participants recruited from health screening centres in the Korean Health Screening Study (mean [standard deviation, SD] age: 53.8 [9.4], 45.4% female) to predict the probability of an individual being 65 and above years of age. This model was then applied to a UK Biobank cohort of 56,301 participants from the community (mean [SD] age: 57.1[8.3], 53.5% female) for external validation. The 'RetiAGE' model demonstrated very good performance in predicting the probability of being 65 and above in the internal testing set, with an area under the receiver operating characteristic curve (AUROC) of 0.968. However, the AUROC decreased to 0.756 when externally validated in the UK Biobank study, suggesting that there may be ethnic biases in the prediction model[11].
'AgeDiff' is a model based on combined fundus images, 3d facial stereophotogrammetry images and tongue images from 11,223 subjects in the China Bioage Investigation Consortium cohort. This model achieved a strong Pearson correlation of 0.91 and MAE of 1.94[12], which is significantly more precise than pure ocular-based models.
Some studies offer insight into the viability of using optical coherence tomography (OCT) in age prediction rather than traditional 2d images of the retina. Shigueoka et al. investigated the association between age predicted from an OCT-based DL model and chronological age based on 7,271 B-scans from 278 healthy subjects in the Duke Glaucoma Registry. Results showed that DL age prediction from OCT images was correlated with chronological age (r = 0.860, p < 0.001), with an MAE of 5.82 years[13].
Chueh et al. investigated the association between age predicted by a DL model using macular OCT images and chronological age, using 6,147 images from 3,134 patients who had undergone macular OCT examination for preoperative screening for refractive surgery or cataract surgery in Ray Guard Eye Clinic, Taipei, Taiwan. They showed a correlation between OCT-based predicted age and chronological age, with an MAE of 5.78 years[14].
Chen et al. investigated the association between age predicted by a DL model using OCT images and chronological age, using 84,753 high-quality OCT images from 53,159 individuals from the UK Biobank database. They showed a correlation between predicted and chronological age, with an MAE of 3.27 years, representing an improvement over the team's previous retinal image–based model (MAE = 3.55 years)[15].
The 'LensAge' model is derived from 8,255 lens photographs under different settings from 1,990 relatively healthy individuals enrolled in the Chinese Cataract Screening Program between 2018 and 2021. When set to diffuse-light mode, the model achieved an R2 of 0.89 and an MAE of 4.88 years[16] when comparing the predicted age to the chronological age. 'LensAge' offers the distinct possibility of becoming smartphone-based, which could dramatically increase accessibility and usability.
Despite promising results, most of these AI-based biomarkers share the limitation of being cross-sectional in nature, which prevents the determination of causality.
Non-AI-based ocular ageing biomarkers
-
There have been 13 studies which specifically investigated the correlation between ocular parameters and ageing without the use of an AI age prediction model. The non-AI-based ocular ageing biomarkers were compared against either chronological age or various biological age definitions, including objective measurement of biometrics and subjective measures such as facial age.
Sayer et al. investigated the correlation between chronological age and nine parameters from different body systems based on 1,428 people in North Hertfordshire. Three of these parameters were ocular, namely, intraocular pressure (IOP) measured by tonometry, visual acuity and lens opacity using the Lens Opacities Classification System III. Results demonstrated that visual acuity and lens opacity had weak positive correlations with age (r = 0.1, p = 0.04 and r = 0.13, p = 0.01, respectively), whilst IOP demonstrated no correlation[17].
Popovic et al. investigated the correlation between microvascular complexity and chronological age based on 68 patients from the Faculty of Medicine at the University of Montenegro. Retinal images were taken using a hand-held fundus camera. The microvascular complexity was quantified using Sholl's box-counting fractal and lacunarity analysis. The study demonstrated that advanced chronological age is associated with decreased microvascular complexity, regardless of the individual's health status[18]. A particular attribute of this study was the inexpensive nature of the camera used, which did not require specialised training for operation. This could greatly increase accessibility to a broad patient demographic.
Several studies have demonstrated an association between retinal nerve fibre layer (RNFL) measurements and chronological age. Rao et al. studied this relationship, using 140 retinal photos from 73 healthy subjects from a tertiary eye care facility in South India. These were used to generate an NFI (nerve fibre indicator), a 0−100 score which predicted the risk of developing glaucoma. Results showed that each 1.3 unit increase in NFI and 1 µm decrease in RNFL birefringence was associated with a one-decade increase in chronological age[19].
Patel et al. studied the effects of chronological age on OCT measures of RNFL thickness and neuro-retinal parameters in a cohort of 113 individuals recruited from the University of Houston University Eye Institute clinics. Results for both vessel-included and vessel-removed measurements showed similar rates of decline in retinal thickness with ageing (−0.234 and −0.206 μm/year, respectively) and moderate correlations with age (p < 0.01 for both)[20].
Leung et al. took a prospective, longitudinal approach to studying the association between OCT-based RNFL measurements and chronological age in 35 randomly selected healthy subjects in the University Eye Center, Hong Kong Eye Hospital (China), followed over a four-month period. Results showed a significant negative correlation between age and average RNFL thickness (−0.33 μm/year; p = 0.011), with longitudinal analysis showing an average rate of change of −0.52 μm/year (95% confidence interval [CI], −0.86 to −0.17)[21].
Alamouti et al. studied the correlation between both retinal and RNFL thickness with chronological age, in 100 healthy volunteers. They demonstrated that both total retinal thickness and nerve fibre layer thickness were significantly reduced with increasing age, with modest correlations (R² = 0.133 and 0.094, respectively; p < 0.001)[22].
Several other studies demonstrated an association between retinal blood vessel measurements and chronological age. Shokr et al. explored the correlation between retinal microvascular function and chronological age based on 123 healthy adult participants from the Vascular Research Laboratory at Aston University in Birmingham. Retinal microvascular function was assessed using a dynamic retinal vessel analyser. Results showed that the time to reach maximum constriction (tMC) and time to reach maximum diameter (tMD) were significantly higher in the oldest group in comparison with the youngest and middle-aged groups[23].
Muraoka et al. studied the association between chronological age and retinal vessel diameter measurements by OCT in a cohort of 238 subjects recruited by the Kyoto University Hospital Department of Ophthalmology. Results showed that both arterial and venous wall thicknesses were significantly correlated with age (r = 0.612, p < 0.001 and r = 0.455, p < 0.001, respectively)[24].
Wong et al. analysed the correlation between retinal arteriolar and venular diameters with chronological age in a population of 4,926 individuals from the Beaver Dam Eye Study in Wisconsin. Results showed that retinal arteriolar diameter decreased by 2.1 μm per decade of age (95% confidence interval [CI], 1.5 to 2.7), and retinal venular diameter decreased by 2.3 μm (p < 0.001) for each decade increase in age[25].
Wei et al. examined age-related changes in the retinal microcirculation, microvascular network, and microstructure using OCT in 74 healthy subjects from the University of Miami Miller School of Medicine. Results showed that increasing age was significantly associated with reductions in retinal vessel density, inner retinal layer thickness, and venular blood flow velocity (p < 0.05). In contrast, age showed a significant positive association with the thickness of the outer plexiform and photoreceptor layers (p < 0.05)[26].
Some studies have used previously established biological ageing surrogates as benchmarks to validate proposed ocular ageing biomarkers. Martens et al. studied the correlation between central retinal arteriolar equivalents (CRAE) and arteriole-to-venule ratio (AVR) with biological age determined by leukocyte telomere length, amongst 168 Flemish participants. IVAN software was used to generate average arteriolar and venular diameters. Biological age was determined by measuring leukocyte telomere length (LTL). Results showed that a 20% shorter LTL was associated with a decrease of 4.57 µm (p = 0.0011) in CRAE and a decrease of 0.020 (p = 0.0018) in AVR[27].
Pathai et al. investigated the association between four ocular biomarkers (lens density, retinal vessel calibre, corneal endothelial cells and retinal nerve fibre layer thickness) with two cellular ageing biomarkers (leukocyte telomere length and CDKN2A expression) in a cohort of 256 participants from an HIV prevention trial site in a township community of Cape Town, South Africa. Results showed that CDKN2A expression increased with increasing lens density (p-trend = 0.05, with each parameter analysed by quartiles), and a shorter telomere length was associated with decreasing endothelial cell density (p-trend = 0.08). Associations were observed between CDKN2A expression and retinal arteriolar calibre (p-trend = 0.06), as well as between shorter telomere length and thinning of the retinal nerve fibre layer (p-trend = 0.05)[28].
Wilson et al. investigated the association between the presence of macular drusen and biological ageing based on 1,037 participants in the Dunedin Study. A simplified AMD grading scale was used to grade the presence of macular drusen, and biological age was determined by subjective facial age ratings, as well as the pace of ageing, derived from a panel of 19 biomarkers measured longitudinally. Results from this study were insignificant for any correlation between the presence of macular drusen and accelerated pace of ageing or facial ageing[29].
These non-AI studies provide valuable insights into age-related changes in ocular parameters across different anatomical regions of the eye. Such findings can inform the development of future AI models by providing biologically relevant priors for feature weighting and interpretation.
Cross-validation of ocular biomarkers with more established biomarkers
-
While many ocular biomarkers display significant correlations with chronological age, one is still led to question whether these single-system biomarkers are truly representative of an underlying universal ageing process. Thus, in order to properly validate ocular ageing biomarkers, some studies have attempted to draw a correlation between ocular age and more established forms of biological age.
As mentioned prior, Martens et al. drew a significant correlation between retinal microcirculation measurements and leukocyte telomere length. Controversially, the 'eyeAge' study demonstrated little to no correlation between phenoAge (a clinical blood-marker-based clock) and 'eyeAge'[10]. Nusinovici et al., however, were able to demonstrate a moderate positive correlation between 'RetiAge' and phenoAge (0.56 Spearman Rank coefficient, p < 0.001)[11]. This shows that cross-validation of ocular biomarkers with established molecular biomarkers has yielded mixed results. One potential reason for the inconclusive results may be the use of different populations for validation. Further studies are required to conduct head-to-head validation of various ageing biomarkers in order to determine the optimal strategy.
Combining ocular biomarkers with other systemic biomarkers
-
Evidence in the literature seems to suggest that there is no true unifying process that causes multisystem ageing, but rather a variety of insults over time to different systems. Previous studies have observed heterogeneous ageing processes across organ systems and the interplay between multiple organs. However, the role of the eye in systemic ageing has not been investigated[30].
Research by Sayer et al. provides insight into whether all systems age together. Aside from the aforementioned ocular parameters, hearing threshold, cognitive decline, grip strength, skin thickness, number of teeth and systolic blood pressure were also measured, yielding differing r values of 0.13, 0.19, 0.09, −0.18, −0.02, −0.20, and 0.08 respectively[17]. This paper concludes that different systems do not age together due to the unique correlation coefficients. However, this study also faces the limitation of having many potential confounding factors not related to ageing, which could have impacted the results.
The 'eyeAge' study also bears findings which support the theory of Sayer et al. A GWAS component of the study was used to analyse genes which contribute to eyeAgeAccel and phenoAgeAccel (rate of change of eyeAge and phenoAge calculated using linear model residuals), and showed that a different set of genes contributed to eyeAgeAccel as compared with that of phenoAgeAccel[10]. This suggests that different genes are responsible for ageing in different systems and further supports the notion that there is no underlying universal ageing process.
This introduces the possibility that using multiple ageing biomarkers simultaneously could yield more accurate results, better reflective of overall ageing. This was demonstrated in the 'RetiAge' study, which showed a 9% increase in sensitivity for predicting all-cause mortality when combining 'RetiAge' with phenoAge, as compared with using 'RetiAge' alone[11]. The study by Shokr et al. on retinal microvascular function presents somewhat contradictory results, showing that using retinal arterial measurements alone produced the smallest error for age prediction, as compared with using relative telomere length (RTL) and RTL combined with arterial measurements. This study does, however, demonstrate that RTL combined with arterial measurements produce far more accurate results than RTL alone[23], supporting the notion that the hallmarks of ageing are multifaceted and contradicting the notion that molecular ageing biomarkers alone are the most accurate predictors of age. The 'AgeDiff' study shows that age prediction using a combination of facial, tongue and retinal images was much more accurate (MAE = 1.94) compared with using just retinal images (MAE = 2.5)[12].
Overall, the majority of evidence suggests that combining multiple ageing biomarkers yields more accurate age prediction results than using a single biomarker.
Clinical utility and model associations
-
Many of the discussed biomarkers have been shown to possess great clinical utility with regard to disease risk stratification and identifying risk factors for ageing.
The 'convolutional network-based model' has demonstrated a significant correlation between diabetic retinopathy (DR) and retinal age gap (RAG), which is the difference between retinal and chronological age. The RAG of patients without DR (0.609 years) was significantly lower than that of patients with DR (1.905 years) (p < 0.001)[9].
The 'EyeAge' model showed nominally significant associations between 'eyeAge' and both COPD (p-value = 0.0048) and myocardial infarction (p-value = 0.049) and also demonstrated a positive correlation with mortality risk[10].
The 'LensAge' model showed that individuals with a positive 'LensAge' index had a higher risk of visual impairment, senile cataracts and vitreous opacity (OR = 1.65, 1.76, 1.89, respectively) compared to those with a negative LensAge index. A positive LensAge index was also shown to confer a higher overall risk of systemic age-related diseases, including diabetes, hypertension, cardiovascular disease, cancer and cerebral infarction (OR = 1.26).
Additionally, a one-year increase in the LensAge index was associated with an 8% increase in all-cause mortality risk[16].
The 'RetiAge' study showed that individuals in the 4th 'RetiAge' quartile had a greater risk of developing cardiovascular disease (CVD) and cancer (HR = 1.39, 1.18 respectively) compared to those in the 1st quartile. Additionally, individuals in the 4th quartile had a far greater risk of all-cause mortality (HR = 4.74) than those in the 1st quartile[11].
The 'AgeDiff' model showed that individuals in the 4th quartile had a much greater risk of chronic heart disease, chronic kidney disease, cardiovascular disease, diabetes, hypertension and stroke (HR = 5.04, 5.25, 5.16, 5.61, 5.78, 4.67 respectively) compared to those in the 1st quartile[12].
The 'Retinal Age' model has demonstrated associations for each one-year increase in RAG with a 10% increase of Parkinson's disease[31], 3% increase of incident cardiovascular disease[32], 4% increase of stroke[33], 10% increase of incident kidney failure (p = 0.003)[34], 1% increased risk of metabolic syndrome or inflammation[35], 7% increase of DR in diabetic patients[36], and a 2% increase in mortality risk[8]. The research team has also identified several risk factors contributing to increased RAG, such as central obesity (p < 0.001)[37] and increased glycaemic levels (p < 0.001)[38]. Another study investigated the association between seven cardiovascular health (CVH) metrics (smoking, physical activity, diet, body mass index [BMI], total cholesterol, blood pressure [BP], blood glucose) and RAG, with a higher score indicating lower cardiovascular risk. It was shown that each one-unit score increase in overall CVH was associated with a 13% decrease in the retinal age gap (p < 0.001)[39].
In their OCT-based study, Chen et al. also demonstrated that a 5-year increase in the OCT age gap (difference between predicted age by DL model using OCT scans and chronological age) was associated with an 8% increase in mortality (p = 0.004)[15].
Clinical associations have also been demonstrated using non-AI-based ocular ageing biomarkers, with Pathai et al. showing that greater lens density was correlated with increasing frailty (defined by the presence of at least three out of five criteria: (i) unintentional weight loss (ii) low physical activity, (iii) self-reported exhaustion, (iv) weak grip strength, and (v) slow walking speed), with a p-trend of 0.03[28].
This demonstrates the potential clinical utility of ocular ageing biomarkers in disease risk stratification and for guiding treatment plans to target the ageing process itself.
-
This article reviewed all ocular ageing biomarkers that have been studied to date. Whilst this concept has existed for decades, it is only in the past few years that AI and deep learning have been added to the equation. This new development has unlocked the true potential of ocular parameters as ageing biomarkers and highlights the clinical utility of this concept. Many articles have now demonstrated a significant correlation between a given ocular ageing biomarker and age-related diseases, as well as mortality. This emphasises the potential for ocular ageing biomarkers to play a major clinical role in disease risk stratification.
One limitation in most studies, however, is the lack of longitudinal analysis, which limits the investigation of temporal changes of ocular ageing biomarkers as a monitoring tool. While many AI models have demonstrated highly accurate prediction of chronological age, the establishment of a benchmark reference standard for training is still required. For example, the 'convolutional network-based model' was trained using retinal images exclusively from individuals with diabetes. This is suboptimal, as diabetes is associated with accelerated biological ageing. As such, using a diabetic population as the ground truth may obscure true age-related changes, potentially leading to systematic underestimation of ageing effects when the model is applied to healthy populations. In addition, the question of whether these ocular biomarkers truly represent a fundamental ageing process has also been raised. Some articles suggest that different body systems age at different rates[10,17] and some studies have additionally shown that a combination of ageing biomarkers yields more accurate results[11,12]. Perhaps ocular ageing biomarkers should be concurrently analysed with other biomarkers to ensure maximum precision. Regardless, the eye's suitability as an organ for predicting biological age and its significant potential cannot be denied. The quick, cheap and non-invasive nature of ocular ageing biomarkers lends to their unique accessibility and demonstrates their potential for widespread use.
Future research in the field should place emphasis on applying ocular ageing AI models to diverse populations, considering different ages and ethnicities, to ensure applicability across broader demographics. While chronological age is commonly used as a ground truth, future studies should establish standardised protocols for ground truth labelling and consider head-to-head comparisons of established ageing biomarkers to define a benchmark gold standard for training and to improve model accuracy. In terms of real-world application, given their quick, affordable and accessible nature, these biomarkers have the potential to be utilised in primary care settings or integrated with existing eye screening infrastructures. However, future research should evaluate the clinical utility of these biomarkers prior to implementation. For example, if used for early disease detection, their specificity must be considered; if employed as a general health screening tool, their implications for downstream management pathways and identification of high-risk individuals should be explored. In addition, further research should also explore how these biomarkers could be integrated into current medical workflows, as well as assess technology acceptance among primary care physicians and patients[40]. These investigations are essential for transforming the research findings into validated, user-friendly clinical tools that can meaningfully impact preventive care[41].
-
Ocular ageing biomarkers, both AI- and non-AI-based, have demonstrated strong predictive abilities for chronological age, with emerging evidence linking them with clinical outcomes.
Due to their fast and non-invasive nature, their clinical utility extends to disease risk stratification, early detection, personalised medicine, and even policy change in the future. However, there remain several limitations, such as variability in study populations, limited longitudinal data and challenges with integration into clinical workflow. Future large-scale longitudinal research, integration with existing screening programs, and exploration of multi-biomarker approaches are essential to solidify the eye's role as a valuable tool for monitoring systemic ageing and its clinical applications.
-
This study is a review of publicly available literature and does not involve human or animal participants. As such, institutional review board approval was not required. The review was conducted in accordance with PRISMA guidelines to ensure a transparent and rigorous methodology.
This project received grant funding from the NHMRC Investigator Grant (Grant No. 2010072).
-
The authors confirm contribution to the paper as follows: study concept and design: Liu S, Zhu Z; acquisition and analysis, drafting of the manuscript: Liu S; results interpretation, critical revision of the manuscript for important intellectual content: Liu S, Chen R, Hu W, Zhu Z; funding acquisition, study supervision: Zhu Z; administrative, technical, or material support: Hu W, Zhu Z. All authors reviewed the results and approved the final version of the manuscript.
-
All included studies/data were sourced from peer-reviewed publications, and no new data were generated.
-
The authors declare that they have no conflict of interest.
- Appendix A Search strategy.
- Copyright: © 2025 by the author(s). Published by Maximum Academic Press, Fayetteville, GA. This article is an open access article distributed under Creative Commons Attribution License (CC BY 4.0), visit https://creativecommons.org/licenses/by/4.0/.
-
About this article
Cite this article
Liu S, Chen R, Hu W, Zhu Z. 2025. Ocular ageing biomarkers and their clinical utility: a review. Visual Neuroscience 42: e009 doi: 10.48130/vns-0025-0009 

Ocular ageing biomarkers and their clinical utility: a review
- Received: 23 January 2025
- Revised: 11 April 2025
- Accepted: 30 April 2025
- Published online: 13 June 2025
Abstract: The eye serves as a window into systemic health, offering invaluable insights. A growing number of studies predict age using ocular parameters, and recent developments in artificial intelligence (AI) have led to a surge in ocular ageing biomarkers. This article aims to review the literature that discusses both AI- and non-AI-based ocular ageing biomarkers and to evaluate their translational potential. A systemic search using Boolean operators was conducted on both MEDLINE and Embase, using a combination of MeSH terms, subject headings and free text to identify articles that discuss a specific ocular parameter as an ageing biomarker. A total of 31 articles were included in the study, which met the inclusion criteria. Most biomarkers demonstrated strong predictive abilities for chronological age, and some biomarkers were shown to be associated with disease and mortality. This review highlights the accuracy of ocular ageing biomarkers in predicting chronological age, explores the potential of ocular ageing biomarkers for disease risk stratification, and discusses their viability in representing a universal underlying ageing process.