


-
Diabetic retinopathy (DR) represents one of the significant complications of diabetes mellitus (DM) and constitutes a prevalent cause of substantial visual deterioration. The global prevalence of diabetes exhibits a persistent upward trend. Currently, diabetic patients exceed 460 million, with projections indicating further increases over the next decade[1], driving successive growth in the DR patient population.
The pathological progression of DR is principally divided into two phases: non-proliferative diabetic retinopathy (NPDR), and PDR. PDR represents the terminal stage of DR and is one of the predominant causes of blindness worldwide[2]. Over 60% of diabetic patients progress to PDR, with a substantial proportion experiencing profound visual impairment attributable to retinal neovascularization elsewhere (NVE), DME, and optic nerve injury[3]. Despite aggressive prophylactic and therapeutic interventions in PDR, 6% of patients annually require recurrent PPV due to recurrent vitreous hemorrhage (VH), tractional retinal detachment (TRD), or combined tractional-rhegmatogenous retinal detachment—all detrimental to visual acuity.
Concurrently, DME is the predominant cause of visual disability in the global working-age population[4], and may manifest at any point during DR progression[5]. DME is typified by intraretinal/subretinal fluid accumulation and macular thickening. In DME, chronic hyperglycemia upregulates VEGF, increasing vascular permeability and angiogenesis[6]. Inflammatory mediators concurrently play a crucial role in DME pathophysiology, inducing vascular permeability and edema[7]. Anti-VEGF agents constitute the first-line DME treatment; in specific scenarios (e.g., VH, macular epiretinal membrane [MERM]), supplemental options include retinal laser photocoagulation, and PPV[8].
While panretinal photocoagulation (PRP) reduces PDR-related severe vision loss risk, 15% of cases still require PPV due to subsequent complications[9,10]. Anti-VEGF medications possess a short half-life, necessitating monthly administration that imposes substantial economic and psychological burdens; this regimen is less practical for most patients. If PPV is delayed until severe complications (e.g., TRD, neovascular glaucoma [NVG]), inflammatory mediators (including VEGF) within the vitreous significantly increase[11]. Post-PPV, VEGF, and pro-inflammatory cytokines disperse more readily, triggering retinal inflammation and DME recurrence[12]. Critically, PDR complications can cause irreversible macular damage, yielding suboptimal postoperative visual outcomes.
Consequently, to investigate additional treatments for PDR and DME, changes in BCVA, central CMT, DRIL, HF, complication rates, and anti-VEGF injection frequency were retrospectively compared over 24 months following PPV combined with anti-VEGF vs intravitreal anti-VEGF monotherapy. This approach aims to identify additional therapeutic options for patients with PDR and DME.
-
Patients' eyes presenting at the ophthalmology department of the First Affiliated Hospital of Kunming Medical University (Kunming, China) from May 2020 to February 2024 were enrolled. Based on medical history, slit-lamp examination, and auxiliary tests (OCT, FFA, or SLO), eyes with a clear diagnosis of PDR and DME accompanied by mild–to–moderate VH and a DRSS score of 61–71 were identified. Relevant examinations were evaluated by the same physician. Eligible eyes were divided into two groups and treated per unified surgical standard. This study received approval from the Affiliated Hospital of Kunming Medical University Committee. Informed consent was obtained from all enrolled patients and their families.
The inclusion criteria for this study were enumerated as follows: (1) PDR secondary to type 2 diabetes mellitus confirmed via pertinent examinations; (2) Following the 2019 AAO Clinical Practice Guideline for Diabetic Retinopathy, after adequate mydriasis, examination using slit-lamp ophthalmoscopy combined with semi-quantitative stereoscopic fundus photography within the 30°-7 standard visual field identified PDR patients with DRSS scores of 61-71; (3) OCT-confirmed CMT > 250 μm indicating concomitant DME; (4) For both treatment groups: mild-to-moderate VH confirmed by slit-lamp examination, ocular B-ultrasound, and ultra-widefield fundus photography at initial diagnosis; (5) Absence of severe complications (VH, RD, MERM) in anti-VEGF monotherapy eyes during the 24-month follow-up; (6) Stable systemic condition throughout the 24-month follow-up.
The exclusion criteria for this study were delineated as follows: (1) severe glycemic excursions during follow-up, or systemic disorders including uncontrolled hypertension, severe hepatic/renal insufficiency, or hematological pathologies; (2) concomitant ophthalmic diseases (e.g., keratitis, glaucoma, AMD, uveitis); (3) requirement for repeat PPV due to postoperative complications (recurrent VH or RD), surgical contraindications, or hypersensitivity to study medications; (4) prior use of hormones, immunosuppressants, anticoagulants, or coagulation-modulating drugs; (5) inability to complete follow-up, early withdrawal, or refusal to participate.
In the anti-VEGF standalone treatment group, patients underwent PRP performed by a single experienced clinician within the initial 1–3 months of the treatment follow-up period, coupled with a 3 + PRN regimen for subsequent management. Conversely, patients receiving combined PPV and anti-VEGF therapy received PRP intraoperatively during PPV surgery, with postoperative anti-VEGF treatment administered on an as-needed basis during follow-up.
Data collection and measurements
-
Patient demographics (age, gender), anthropometrics (height, weight, BMI), and diabetes duration were recorded. A single fundus specialist diagnosed participants via comprehensive ophthalmic evaluation (medical history, slit-lamp examination, refraction, SLO/OCT/FFA) per international DR staging criteria.
Fifty-one eyes with PDR, DME, mild-moderate VH, and DRSS 61-71 were enrolled. Eyes were stratified into two treatment groups: (1) PPV combined anti-VEGF treatment, and (2) intravitreal anti-VEGF standalone treatment.
Standardized evaluations were conducted at baseline and at 1–24 months post-treatment (1-month intervals for the initial 3 months, then quarterly). All procedures were performed by the same certified technician. Assessments included: BCVA converted to LogMAR equivalents; Macular evaluation was performed using OCT (RTVue XR Avanti, Optovue, Inc., Fremont, CA, USA) with linear scans. Quantitative analyses included: CMT, presence of DRIL, and density of HF < 30 μm in diameter located between the outer nuclear layer and retinal pigment epithelium (RPE), calculated per square millimeter (mm2); SLO (Optos Daytona) for DRSS grading and photographic documentation; and number of anti-VEGF injections administered.
Statistical analysis
-
Data were collected via convenience sampling and analyzed using SPSS 26.0. Normally distributed continuous variables are expressed as mean ± SD; non-normally distributed variables as median (interquartile range). Categorical data are expressed as ratios/rates. Intergroup differences were preliminarily assessed using independent-samples t-tests or Mann-Whitney U tests; intragroup comparisons used paired-samples t-tests; rate comparisons used chi-square tests. p < 0.05 was considered statistically significant. ANCOVA was performed on post-treatment BCVA and CMT, adjusting for age, gender, height, weight, BMI, and diabetes duration.
-
A sum of 51 eyes fulfilled the inclusion criteria of this experimental study. Specifically, the standalone treatment cohort encompassed 24 eyes (47.06%; female: n = 12 eyes, male: n = 12 eyes), exhibiting an average age of 56.960 ± 11.220 years, an average Body Mass Index (BMI) of 22.611 ± 3.574, and an average diabetes mellitus disease course of 10.000 ± 5.650 years. The multimodal treatment group comprised 27 eyes (52.94%; female: n = 12 eyes, male: n = 15 eyes), with an average age of 60.080 ± 10.329 years, an average BMI of 23.351 ± 3.587, and an average of diabetes mellitus disease duration of 9.710 ± 4.112 years. The baseline characteristics of patients were statistically analyzed using the two independent samples t-test. No statistically significant differences were detected between the two groups regarding the gender composition ratio (p = 0.629), age, BMI, and diabetes mellitus disease course, see Table 1.
Table 1. Basic information of the patients.
Group X ± S p Age (years) Standalone treatment 56.960 ± 11.220 0.277 Multimodal treatment 60.080 ± 10.329 Height (m) Standalone treatment 1.641 ± 0.073 0.250 Multimodal treatment 1.618 ± 0.073 Weight (kg) Standalone treatment 61.333 ± 12.294 0.962 Multimodal treatment 61.750 ± 13.642 Body mass index
(BMI) (kg/m2)Standalone treatment 22.611 ± 3.574 0.465 Multimodal treatment 23.351 ± 3.587 Duration of diabetes (years) Standalone treatment 10.000 ± 5.650 0.857 Multimodal treatment 9.710 ± 4.112 Changes in BCVA
-
The BCVA values of the two groups during each follow-up were compared. The findings revealed that following 1 month, 2 months, 18 months, and 24 months of treatment, significant statistical differences in BCVA values were observed between the standalone treatment group (M1: 0.497 ± 0.440, M2: 0.542 ± 0.430, M18: 0.750 ± 0.492, M24: 0.857 ± 0.526), and the multimodal treatment group (M1: 1.023 ± 0.639, M2: 0.774 ± 0.411, M18: 0.678 ± 0.406, M24: 0.582 ± 0.362) (p1 = 0.009; p2 = 0.024; p18 = 0.045; p24 = 0.007). In the remaining months, no statistically significant differences were detected between the two groups (p > 0.05). Refer to Fig. 1 for graphical illustration.
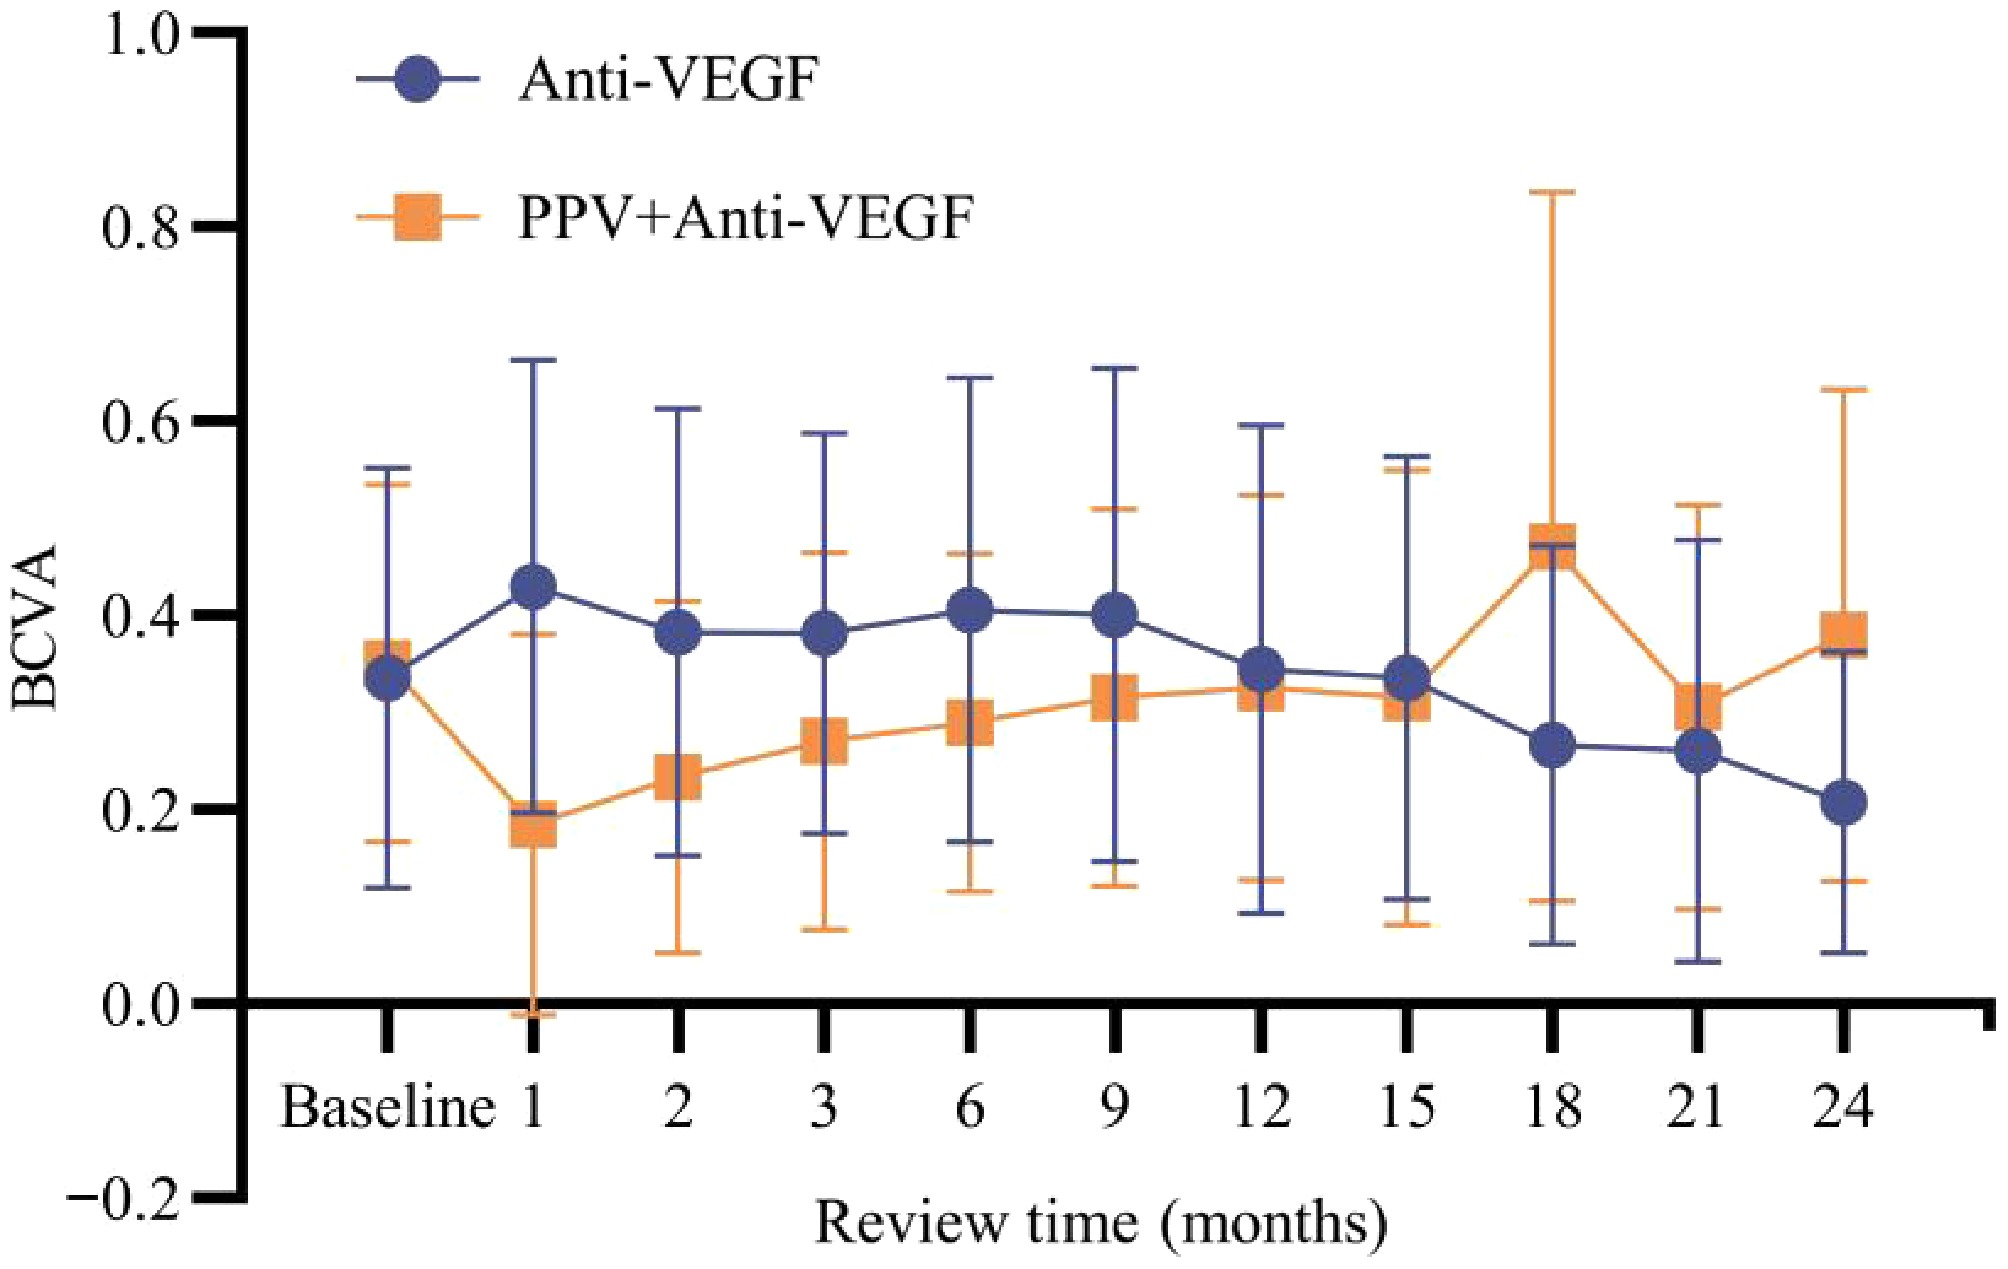
Figure 1.
Comparison of BCVA within 24 months and its development trend between the two groups.
Changes in CMT
-
The comparison of the CMT values of the two groups during each follow-up was conducted. The findings revealed that at 3 months, and 9 months post-treatment, the CMT values in the multimodal treatment group were marginally elevated in comparison to those in the standalone treatment group (M3: 317.125 ± 40.851 μm, M9: 325.500 ± 40.729 μm vs M3: 295.667 ± 34.236 μm, M9: 301.444 ± 36.833 μm), with statistically significant differences (p3 = 0.047; p9 = 0.019). At 24 months after treatment, the CMT value in the multimodal treatment group (M24: 293.917 ± 14.943 μm) was lower than that in the standalone treatment group (M24: 309.296 ± 26.025 μm), and the difference was statistically significant (p = 0.014). In the remaining months, no statistically significant discrepancies were detected between the two groups (p > 0.05). Refer to Figs 2 and 3 for graphical illustration.
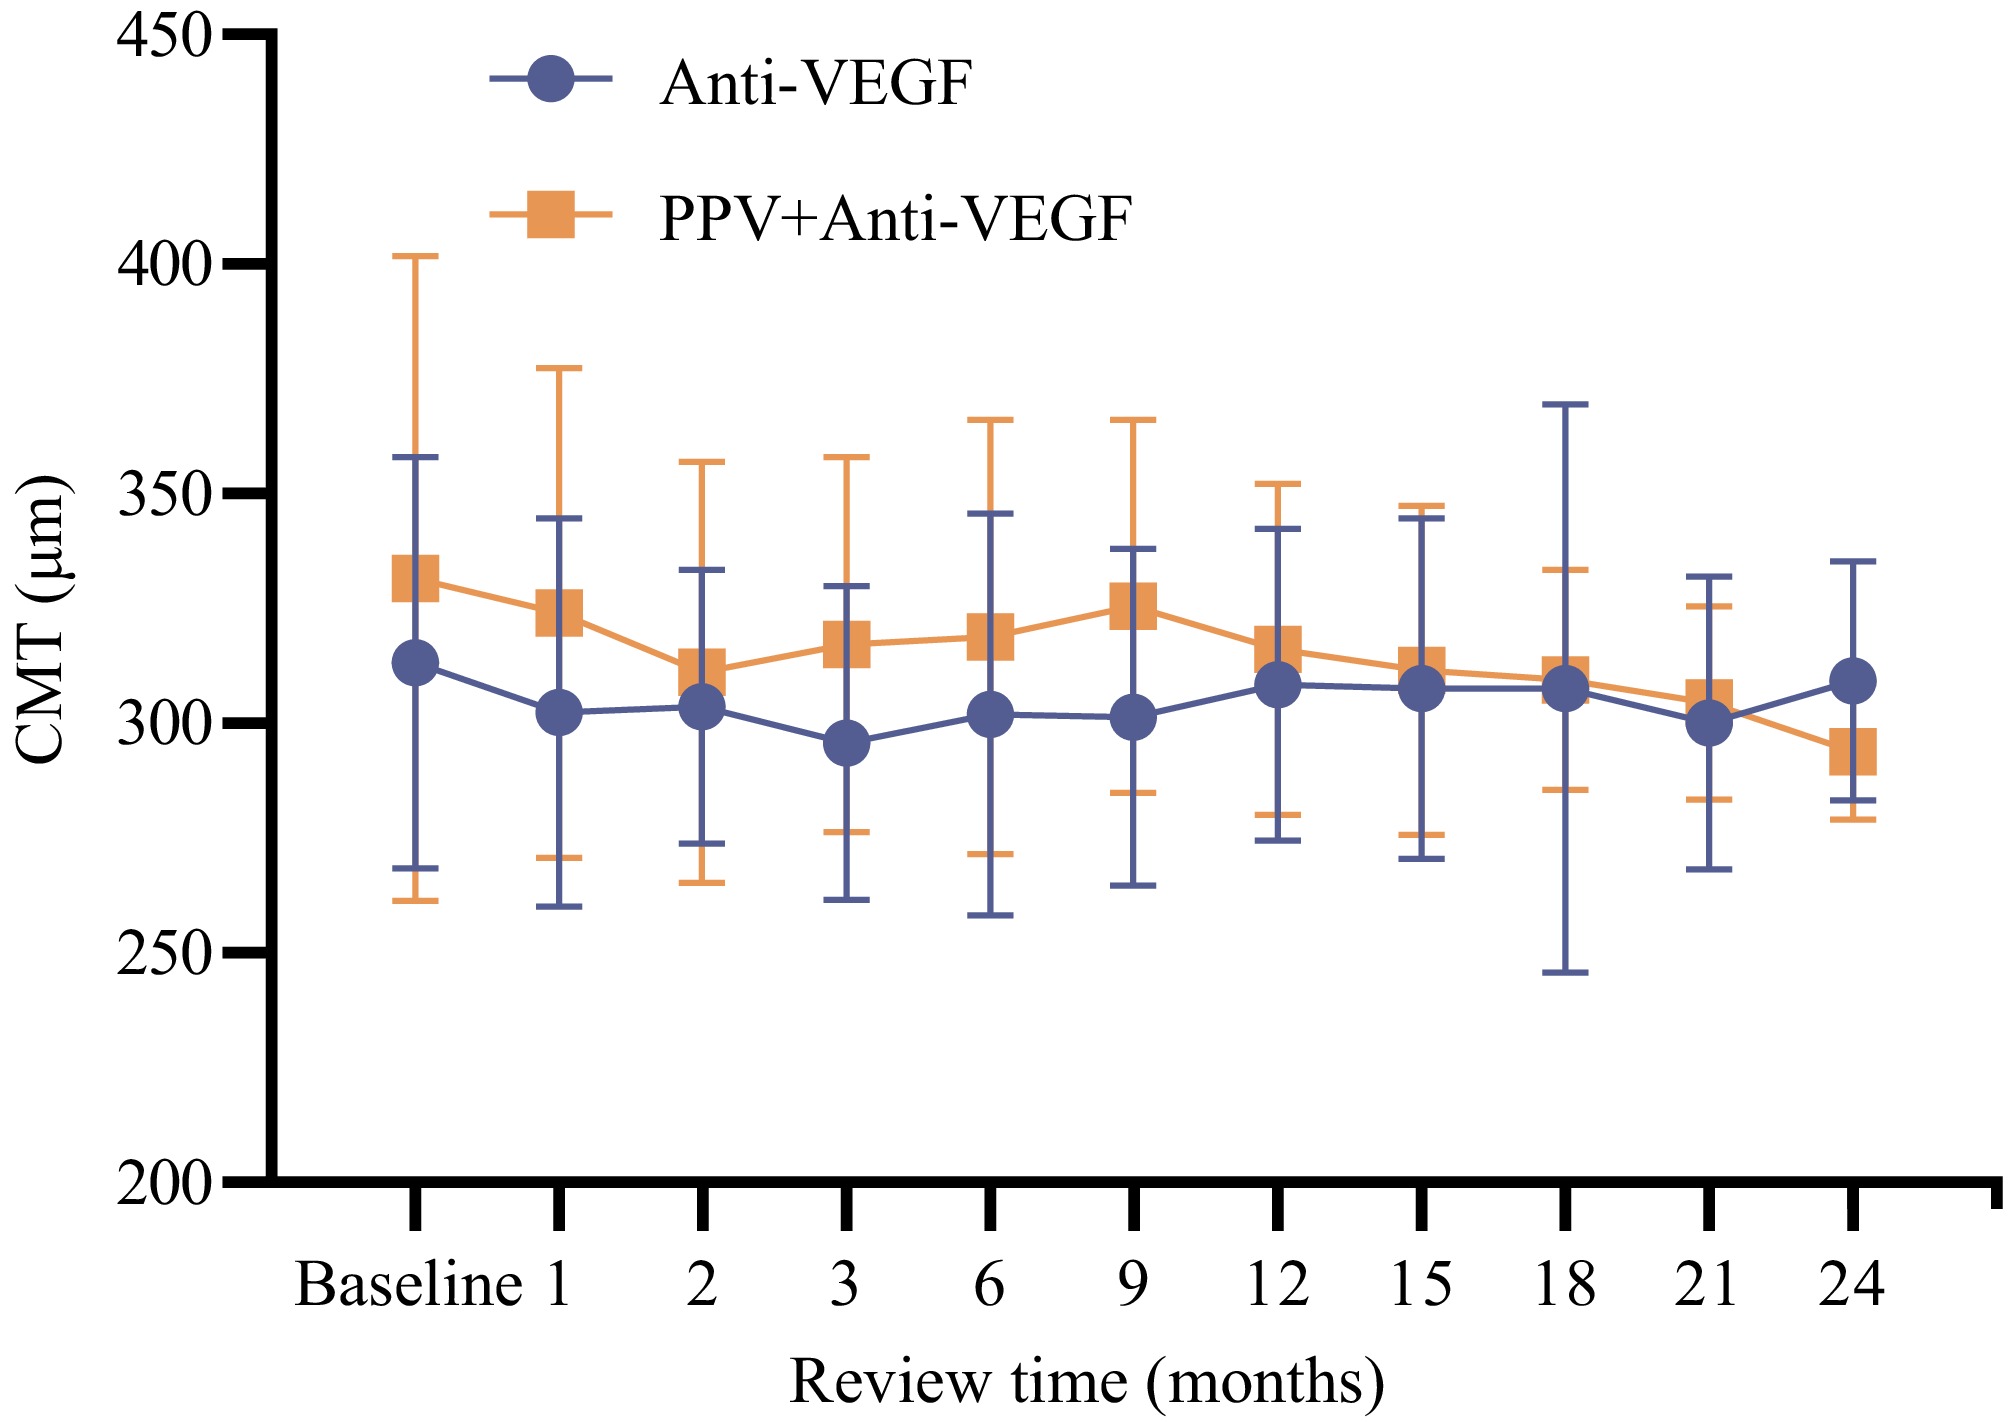
Figure 2.
Comparison of the trends of CMT values during the treatment period between the two groups.
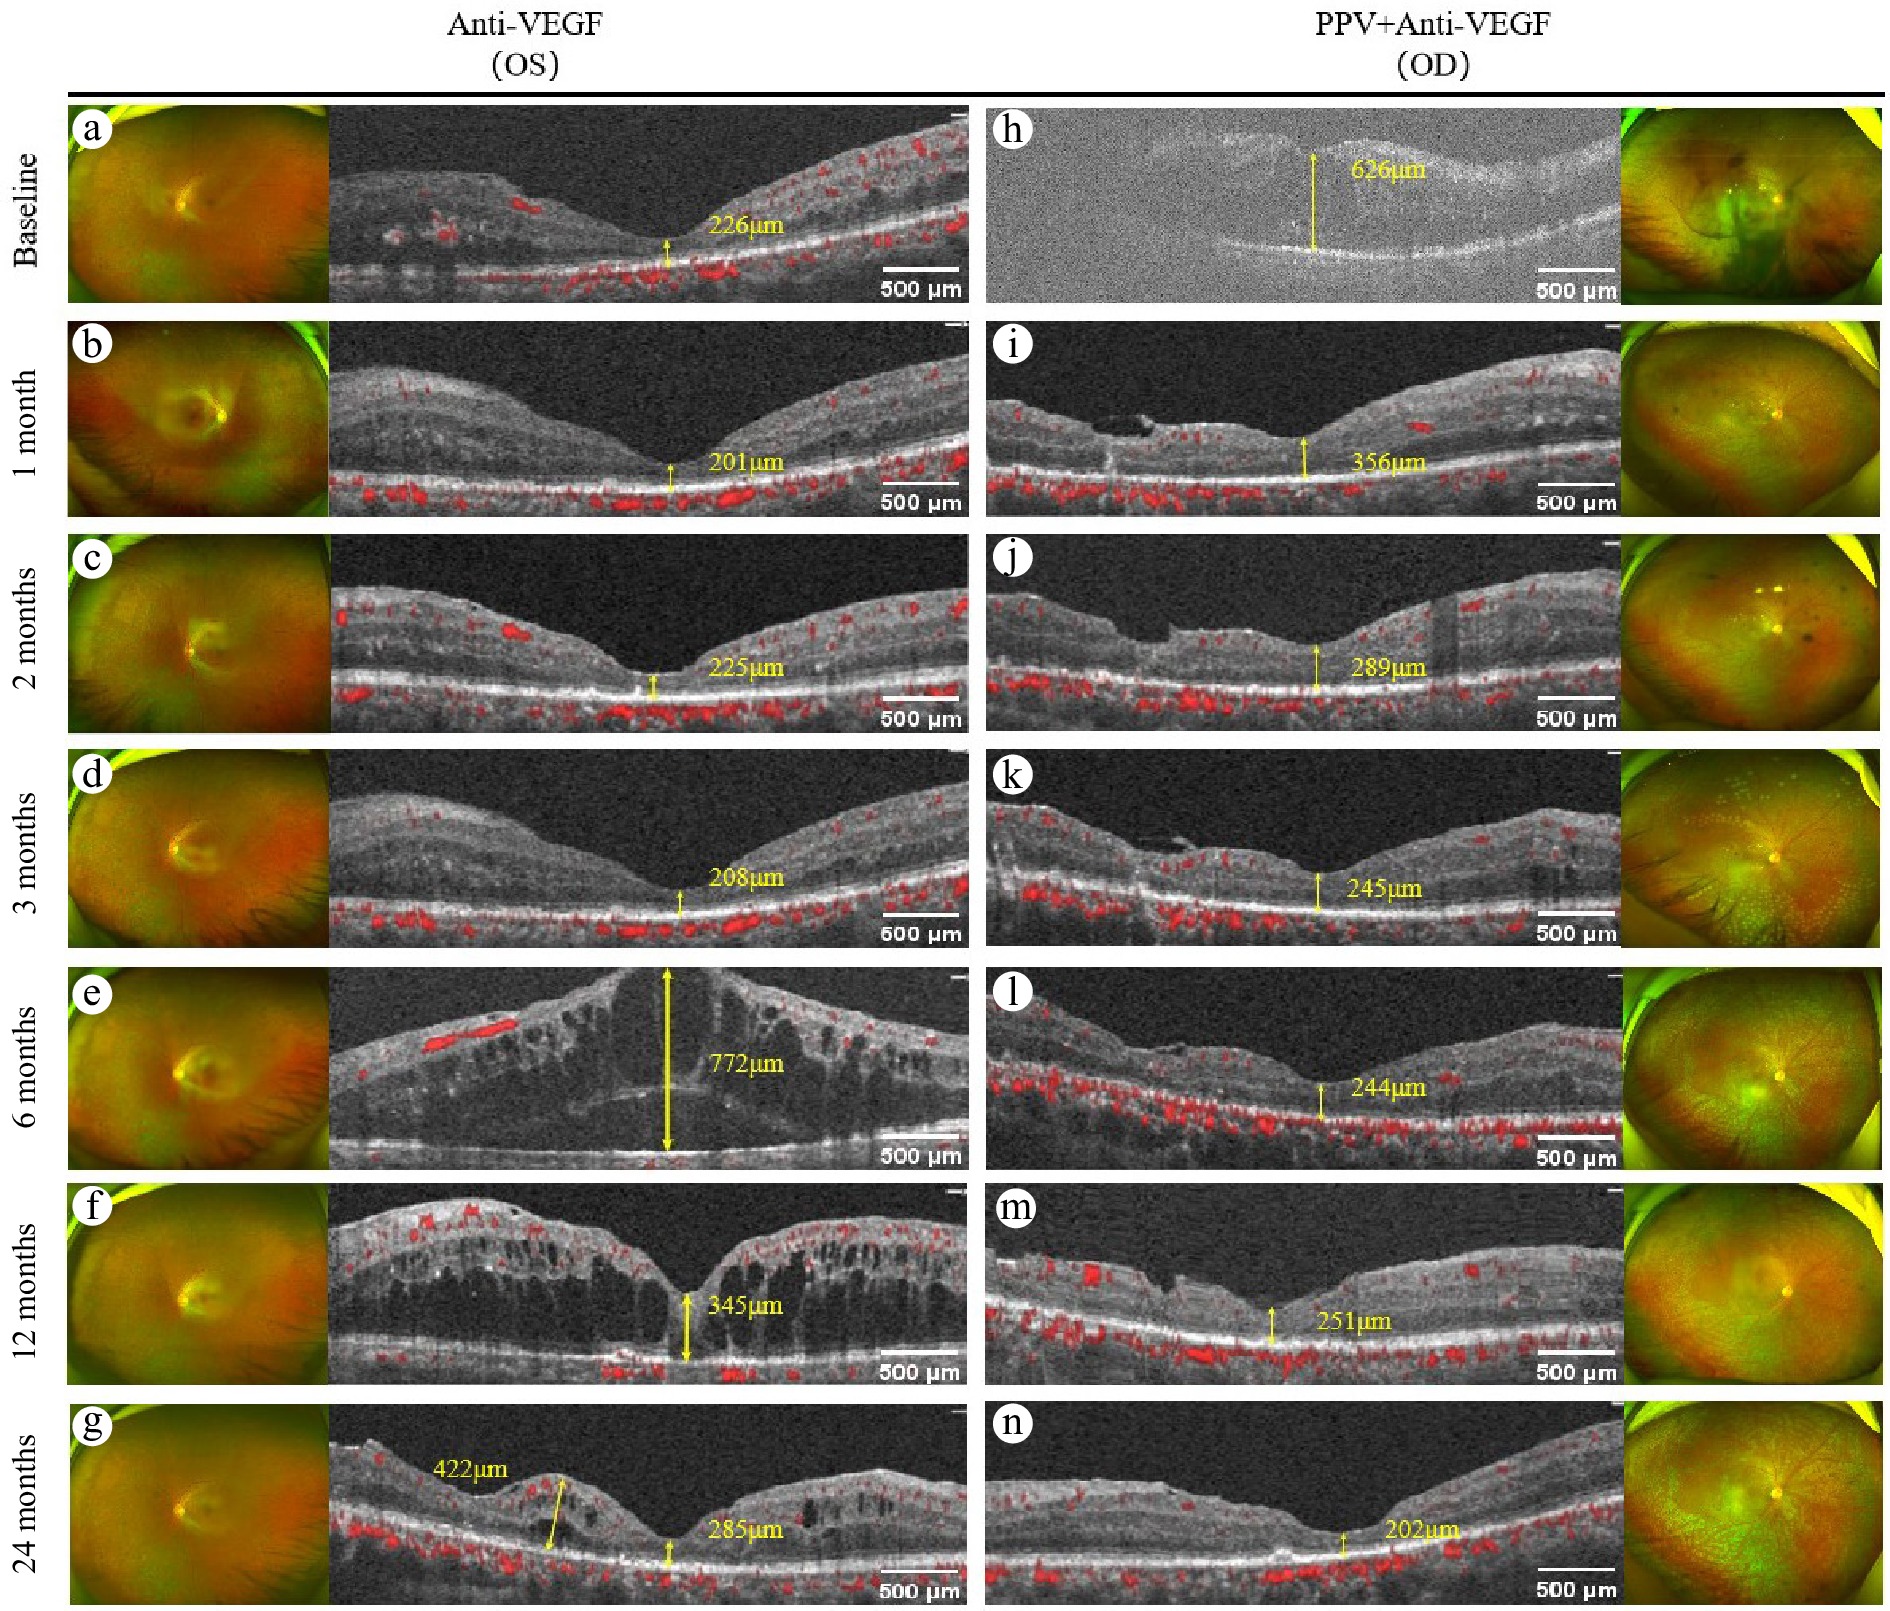
Figure 3.
Comparison of the changes in CMT values of the same patient after different treatment methods. (a)−(g) Show the changes in CMT on OCTA in the left eye after anti-VEGF therapy. Among them: (a) The CMT value at baseline is 226 μm. (b) The CMT value is 201μm after 1 month of treatment. (c) The CMT value is 225 μm after 2 months of treatment. (d) The CMT value is 208 μm after 3 months of treatment. (e) The CMT value is 772 μm after 6 months of treatment. (f) The CMT value is 345 μm after 12 months of treatment. (g) The CMT value is 285 μm after 24 months of treatment. (h)−(n) Show the changes in CMT on OCTA in the right eye following PPV combined with anti-VEGF therapy. Among them: (h) The CMT value at baseline is 626 μm. (i) The CMT value is 356 μm after 1 month of treatment. (j) The CMT value is 289 μm after 2 months of treatment. (k) The CMT value is 245 μm after 3 months of treatment. (l) The CMT value is 244 μm after 6 months of treatment. (m) The CMT value is 251 μm after 12 months of treatment. (n) The CMT value is 202 μm after 24 months of treatment.
Changes in DRIL
-
The patients who exhibited DRIL at any time point during the 24-month period were documented (multimodal treatment group: 13 patients; standalone treatment group: 23 patients). In the multimodal treatment group, statistically significant differences were observed between the incidence of DRIL at the initial diagnosis (92.3%), and that at 6 months (46.2%), 9 months (30.8%), 12 months (38.5%), 15 months (38.5%), 18 months (15.4%), 21 months (23.1%), as well as 24 months (23.1%) after treatment (p < 0.001). In the standalone treatment group, the incidence of DRIL at the first diagnosis was 47.8%, and no statistically significant differences were detected in the incidence of DRIL throughout the follow-up period subsequent to treatment (p > 0.05). See Table 2 for details.
Table 2. Comparison of the incidence rates of DRIL between the two groups during the follow-up period and at the first diagnosis within each group.
Review time
(months)PPV + Anti-VEGF Anti-VEGF N (%) χ2 p N (%) χ2 p Baseline 12 (92.3%) − − 11 (47.8%) − − 1 12 (92.3%) < 0.001 1 10 (43.5%) 0.088 0.767 2 11 (84.6%) < 0.001 1 13 (56.5%) 0.348 0.555 3 8 (61.5%) 1.95 0.163 9 (39.1%) 0.354 0.552 6 6 (46.2%) 4.514 0.034* 8 (34.8%) 0.807 0.369 9 4 (30.8%) 10.4 0.001** 8 (34.8%) 0.807 0.369 12 5 (38.5%) 6.118 0.013* 9 (39.1%) 0.354 0.552 15 5 (38.5%) 6.118 0.013* 11 (47.8%) < 0.001 1 18 2 (15.4%) 15.476 < 0.001*** 8 (34.8%) 0.807 0.369 21 3 (23.1%) 12.764 < 0.001*** 6 (26.1%) 2.333 0.127 24 3 (23.1%) 12.764 < 0.001*** 5 (21.7%) 3.45 0.063 *: < 0.05, **: < 0.01, ***: < 0.001. The incidence of DRIL at the initial diagnosis in the multimodal treatment group was 92.3%, whereas it was 47.8% in the standalone treatment group. Upon comparing the incidence of DRIL at the first diagnosis between the two groups, a statistically significant difference was identified (p = 0.021). At 24 months after treatment, the incidence of DRIL in the multimodal treatment group was 65.3%, and that in the intravitreal standalone treatment group was 61.5%. No statistically significant difference was found in the incidence of DRIL between the two groups at 24 months after treatment (p > 0.05). Refer to Fig. 4.
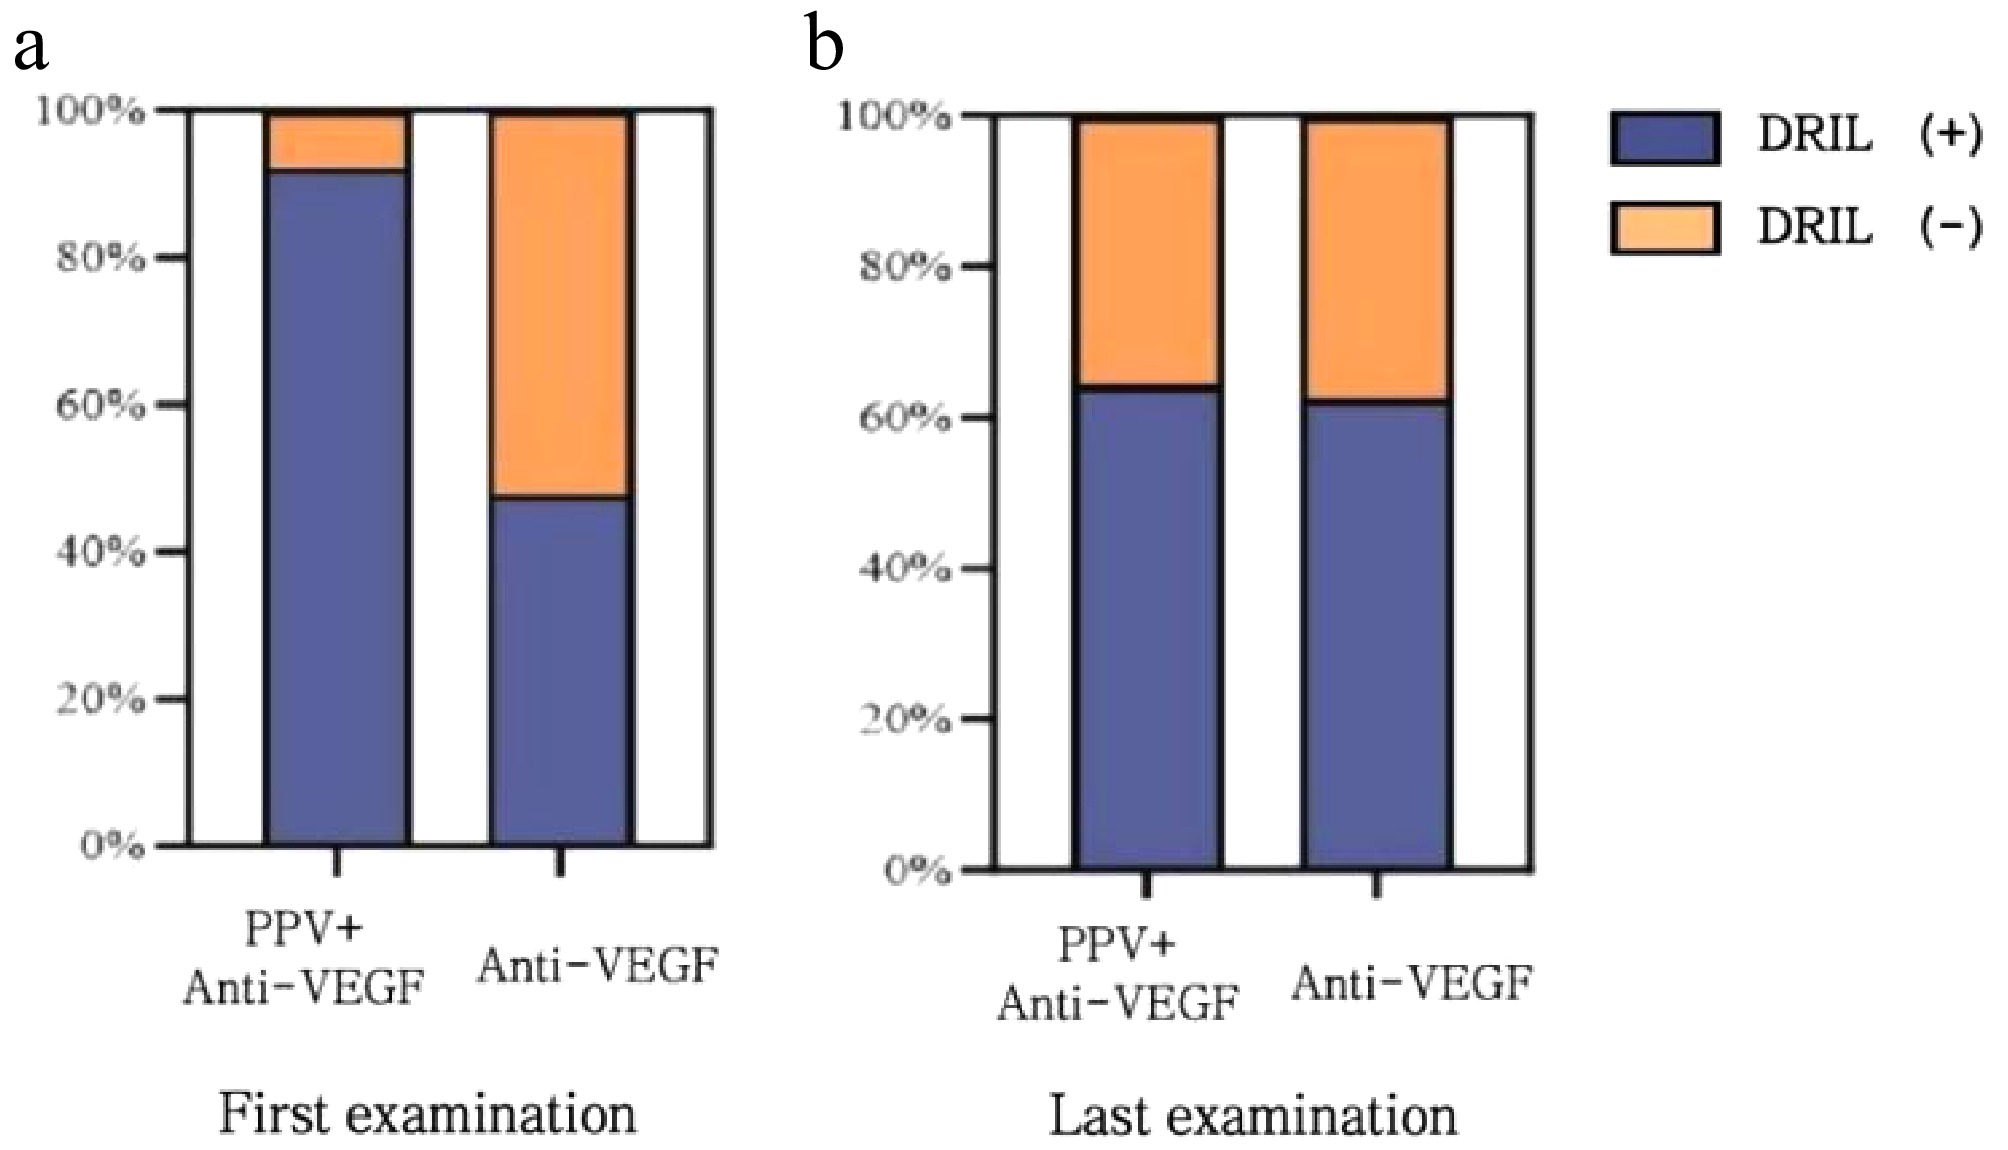
Figure 4.
Comparison of the occurrence rates of DRIL at the first diagnosis and the last visit between the two groups of patients. (a) At the first diagnosis, the incidence rate of DRIL in the multimodal treatment group was 92.3%, and that in the standalone treatment group was 47.8%. The comparison between the two groups showed p = 0.0024; (b) After 24 months of treatment, the incidence rate of DRIL in the multimodal treatment group was 65.3%, and that in the standalone treatment group was 61.5%. The comparison between the two groups showed p = 0.455.
Changes in HF
-
A comparison of the number of HF per square millimeter during the follow-up period between the two groups was carried out. The findings revealed that no statistically significant difference was detected between the two groups (p > 0.05). Although no significant difference was observed between the two groups, both therapies demonstrated a significant reduction in the number of HF within each group over time (p < 0.05).
Concurrently, the alterations in HF within 24 months under diverse treatment regimens within the same patient were observed. See Fig. 5.
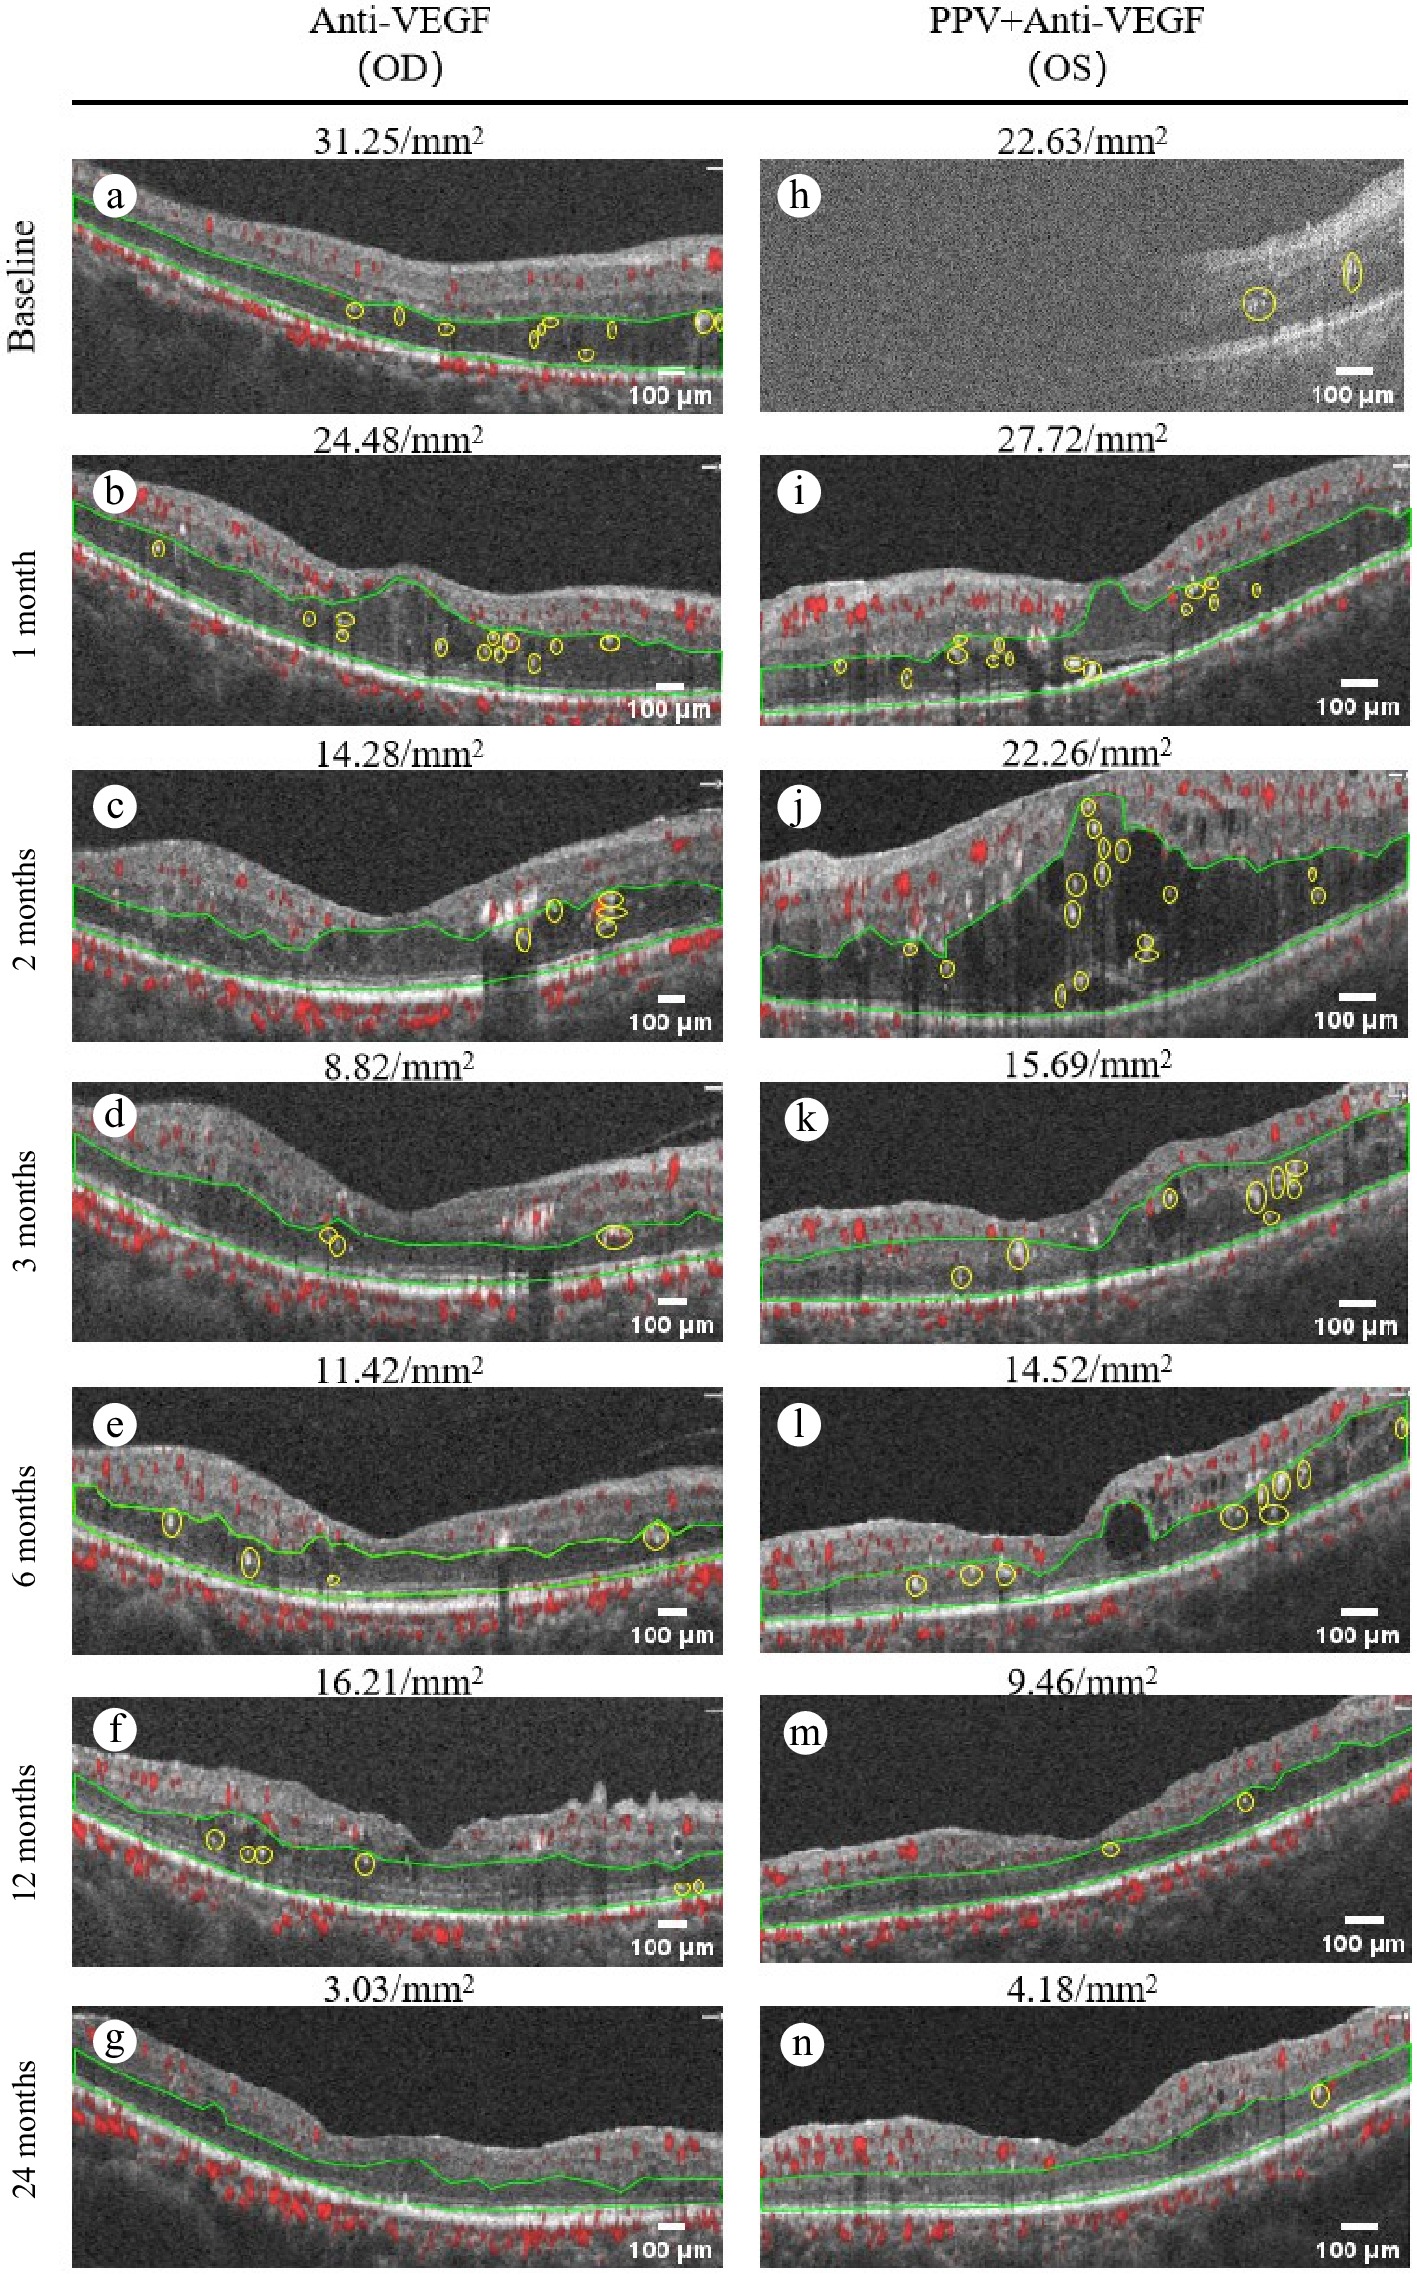
Figure 5.
Comparison of the number of HF in the same patient after different treatment methods. (a)–(g) Show the changes in the number of HF in OCTA during the standalone treatment for the right eye. Among them: (a) The number of HF shown in OCTA before the standalone treatment is 31.25/mm2. (b) The number of HF is 24.48/mm2 after 1 month of treatment. (c) The number of HF is 14.28/mm2 after 2 months of treatment. (d) The number of HF is 8.82/mm2 after 3 months of treatment. (e) The number of HF is 11.42/mm2 after 6 months of treatment. (f) The number of HF is 16.21/mm2 after 12 months of treatment. (g) The number of HF is 3.03/mm2 after 24 months of treatment. (h)–(n) Show the changes in the number of HF in OCTA during the treatment with multimodal treatment for the left eye. Among them: (h) number of HF shown in OCTA before the treatment with multimodal treatment is 22.63/mm2. (i) The number of HF is 27.72/mm2 after 1 month of treatment. (j) The number of HF is 22.26/mm2 after 2 months of treatment. (k) The number of HF is 15.69/mm2 after 3 months of treatment. (l) The number of HF is 14.52/mm2 after 6 months of treatment. (m) The number of HF is 9.468/mm2 after 12 months of treatment. (n) The number of HF is 4.18/mm2 after 24 months of treatment.
Comparison of Anti-VEGF injection frequency over 24 months
-
During the 24-month observation period, the multimodal treatment group demonstrated significantly fewer anti-VEGF injections (8.75 ± 1.48), compared to the standalone treatment group (10.37 ± 1.60), with a statistically significant difference (p < 0.01).
-
In the context of PDR, with the advancement of various large-scale multicenter experiments globally, anti-VEGF medications have been demonstrated to confer a certain degree of stability and improvement in retinal function and morphology[13]. Consequently, intravitreal injection of anti-VEGF has emerged as the first-line therapeutic approach for DME[14]. However, the response to anti-VEGF injection in some patients is suboptimal, with macular edema persisting. Moreover, the prolonged maintenance treatment with anti-VEGF imposes a substantial economic burden on patients. PPV, on the other hand, is predominantly employed in the management of severe complications arising from PDR, such as severe VH, TRD, combined tractional-rhegmatogenous retinal detachment (CTRRD), and other macular disorders induced by proliferative traction within the vitreous cavity[15]. Nevertheless, research on the optimal timing of PPV surgery remains scarce. This retrospective study analyzed patients with PDR accompanied by DME and compared the efficacies of multimodal treatment and standalone treatment, with the aim of furnishing additional treatment alternatives for patients with PDR and DME, providing a scientific rationale for impeding disease progression.
In this study, the BCVA of the multimodal treatment group was marginally inferior to the pre-treatment level at 1 and 2 months following surgery. The present analysis suggests that this temporary visual acuity decrement could be attributed to the absorption of gas within the vitreous cavity and the post-operative recovery process subsequent to PPV. However, between 3 and 24 months, the BCVA remained relatively stable. This stability can be ascribed to the fact that PPV is capable of effectively eliminating the impact of vitreoretinal interface diseases on the retinal structure, thereby safeguarding the structural integrity of the retina and maintaining the BCVA. For instance, prior research has demonstrated that the traction force generated by the contraction of fibrovascular tissue at the vitreoretinal interface frequently affects the macular retinal morphology in patients with DR, with an incidence rate of 76.5%, in young diabetic patients under 40 years of age[16]. Surgical excision of fibrovascular tissue is of paramount importance in preventing the exacerbation of fibrovascular proliferation (FVP). In reported cases, even after anti-VEGF and PRP treatment, FVP may still proliferate on the peripheral retina, vitreous base, and anterior vitreous surface, leading to a significant deterioration in visual acuity[17]. The application of PPV can forestall further traction, thereby averting the onset of severe vitreoretinal diseases, and preserving the patient's BVCA[18]. Concurrently, in patients with PDR who develop CTRRD, FVP, NVG, etc. and subsequently undergo surgery, the relatively late surgical intervention often results in severe damage to the retinal anatomical structure. A proportion of these patients may still experience vision loss due to retinal proliferation-induced RD, or postoperative complications such as elevated intraocular pressure[19].
Therefore, in contrast to patients treated with anti-VEGF alone, those who underwent PPV combined with anti-VEGF treatment achieved a more favorable retinal structure following the alleviation of vitreoretinal traction, enabling the BCVA to remain stable after 9 months of treatment.
DME represents the primary cause of visual impairment in diabetic patients. Its pathogenesis is initiated by retinal hypoxia, which leads to an elevation in intravascular pressure due to impaired vascular autoregulatory function, subsequently increasing the permeability of retinal capillaries[20].
In the present study, the CMT values in the standalone treatment group were lower than those in the multimodal treatment group during the 3−9 months treatment interval. The underlying rationale for this observation is as follows: given that DR is regarded as a chronic microinflammatory condition[21], immune and inflammatory mechanisms play a prominent role in the pathogenesis of both DR and DME[20]. Therefore, the postulated primary cause for the elevation in CMT values following multimodal treatment is the transient macular edema instigated by alterations in various inflammatory and immune factors within the vitreous cavity post-surgery[18]. Once the intra-vitreous factors stabilized, the CMT values in the multimodal treatment group progressively stabilized between 12 and 20 months of treatment. In the meantime, standalone treatment can only diminish the concentration of VEGF within the vitreous cavity, whereas PPV has the capacity to completely eradicate VEGF, IL-6, IL-8, neutrophils, and other inflammatory factors and cells from the vitreous body. This more comprehensive elimination effectively mitigates the stimulation of various inflammation-related factors on the retina, thereby reducing the incidence of DME[18]. This mechanism elucidates the observed fluctuations in CMT values in the standalone treatment group between 9 and 24 months of treatment and the lower CMT values in the multimodal treatment.
DRIL has emerged as a potential biomarker for visual function in patients with DR[22]. Previous studies have established that the presence of foveal DRIL is correlated with poorer baseline visual acuity in patients with DME and is also associated with visual acuity decline in patients with DR[23,24]. Additionally, research has revealed that the presence of DRIL is associated with the exacerbation of DR severity, particularly in PDR. It has also been found that DRIL is correlated with damage to the outer retinal structure, specifically the disruption of the ellipsoid zone (EZ), and the external limiting membrane (ELM)[25]. Thus, DRIL has progressively been recognized as a predictive marker of retinal structure.
In this study, it was noted that the preoperative incidence of DRIL in the multimodal treatment group was higher than that in the standalone treatment group. However, at 24 months post-surgery, the incidence of DRIL in both groups was comparable, signifying that multimodal treatment exerts a stabilizing influence on the inner retinal structure.
The changes in the number of HF were also examined, which were less than 30 µm per square millimeter, in OCT scans within 24 months of the two treatment modalities. These singular, relatively small (< 30 µm), and moderately hyperreflective (resembling the retinal fiber layer) retinal lesion entities can be considered as clinical biomarkers for retinal diseases and may potentially represent aggregates of activated microglia and in vivo markers of retinal inflammation. The identification and quantification of HF can provide an estimate of the level of intraretinal inflammation in retinal disorders[26]. The results of the present study indicate that there is no significant difference in the impact of the two treatment methods on HF, and both can reduce the number of hard exudates. The reduction in HF implies that the two treatment methods possess comparable capabilities in controlling intraretinal inflammation.
-
Combined PPV and anti-VEGF therapy shows advantages in maintaining BCVA, reducing CMT values, and decreasing the occurrence of DRIL in patients with PDR complicated by DME 9 months after treatment. Its effect on HF control is similar to that of anti-VEGF therapy alone.
-
The studies involving humans were approved by the Ethics Review Committee of the First Affiliated Hospital of Kunming Medical University (Grant No. kmmu20220686). The studies were conducted in accordance with the local legislation and institutional requirements. All participants or their legal representatives reviewed and signed written informed consent forms.
This work was supported by the Applied Basic Research Foundation of the Department of Science and Technology of Yunnan Province (Grant No. 202201AY070001-036), the National Natural Science Foundation Project (Grant No. 82260207), and The Innovative Team for Ocular Trauma, the First Affiliated Hospital of Kunming Medical University (Grant No. 202405AS350013).
-
The authors confirm their contributions to the paper as follows: study conception and design: Li Q, Rao L; data collection: Cui Y; analysis and interpretation of results: Shen L, Zheng Y; draft manuscript preparation: Chen Z, Zhang Q, Shang L; supervision, resources, project administration, funding acquisition: Yuan L, Li D. All authors reviewed the results and approved the final version of the manuscript.
-
All data generated or analyzed during this study are included in this published article, further enquiries are available from the corresponding author on reasonable request.
-
The authors declare that they have no conflict of interest.
-
Authors contributed equally: Qirui Li, Lingna Rao
- Copyright: © 2025 by the author(s). Published by Maximum Academic Press, Fayetteville, GA. This article is an open access article distributed under Creative Commons Attribution License (CC BY 4.0), visit https://creativecommons.org/licenses/by/4.0/.
-
About this article
Cite this article
Li Q, Rao L, Shen L, Zheng Y, Zhang Q, et al. 2025. Clinical investigation on the efficacy of vitrectomy in conjunction with Anti-VEGF as opposed to Anti-VEGF monotherapy in the management of PDR complicated with DME. Visual Neuroscience 42: e023 doi: 10.48130/vns-0025-0021 

Clinical investigation on the efficacy of vitrectomy in conjunction with Anti-VEGF as opposed to Anti-VEGF monotherapy in the management of PDR complicated with DME
- Received: 16 May 2025
- Revised: 07 July 2025
- Accepted: 14 July 2025
- Published online: 23 October 2025
Abstract: The aim of this study was to compare the therapeutic efficacy of pars plana vitrectomy (PPV) combined with anti-vascular endothelial growth factor (VEGF) therapy, and anti-VEGF treatment alone in proliferative diabetic retinopathy (PDR) complicated by diabetic macular edema (DME), thereby providing clinical evidence to support the use of combined therapy in this population. This retrospective study analyzed 51 eyes from patients treated at the First Affiliated Hospital of Kunming Medical University between May 2020 and Feb 2024. Participants were stratified into two groups: the multimodal treatment group (n = 27 eyes) receiving PPV combined with anti-VEGF therapy, and the standalone treatment (n = 24 eyes) group receiving anti-VEGF monotherapy. Paired t-tests were performed to analyze intragroup changes in outcome measures, including best-corrected visual acuity (BCVA), central macular thickness (CMT), presence of disorganization of retinal inner layers (DRIL), density of hyperreflective foci (HF) < 30 μm in diameter located between the outer nuclear layer and RPE, anti-VEGF injection frequency during the 24-month follow-up period. The multimodal treatment showed lower BCVA at 1 month (1.023 ± 0.639 vs 0.497 ± 0.440; p = 0.009), and 2 months (0.774 ± 0.411 vs 0.542 ± 0.430; p = 0.024) follow-up intervals, but demonstrated superior visual outcomes at 18 and 24 months compared to standalone treatment (p = 0.045 and p = 0.007, respectively). CMT measurements revealed greater thickness in the multimodal treatment group at 3 and 9 months (317.125 ± 40.851 vs 295.667 ± 34.236 μm, p = 0.047; 325.500 ± 40.729 vs 301.444 ± 36.833 μm, p = 0.019), ultimately achieving significantly greater reduction by 24-month follow-up (293.917 ± 14.943 vs 309.296 ± 26.025 μm, p = 0.014). The multimodal approach demonstrated markedly superior resolution in improving DRIL (p < 0.001), while both groups exhibited comparable reductions in HF (p < 0.05). For patients with PDR complicated by DME, multimodal treatment demonstrates significant long-term advantages over anti-VEGF monotherapy, including better BCVA, greater CMT reduction, and more substantial resolution of DRIL.