


-
Age-related macular degeneration (AMD) is the leading cause of blindness worldwide, affecting millions of patients[1]. With an aging global population, the number of AMD cases is projected to reach 288 million by 2040[2]. AMD is classified into two major subtypes based on the presence of neovascularization: dry AMD (dAMD) and wet AMD. Although over 80% of clinical AMD cases are classified as dAMD, some dAMD cases may progress to wet AMD in the late-stage, which can ultimately lead to serious visual impairment[3]. AMD is correlated with multiple clinical indicators, including race[2,4], smoking[5], alcohol consumption, and sex[6]; however, age remains the most significant factor, given its classification as an age-related disease.
The exact pathogenesis of AMD remains unclear. It is currently well established that AMD is a complex disease, involving a combination of environmental and genetic risk factors. Genome-wide association studies have identified more than 50 single-nucleotide polymorphisms (SNPs) associated with AMD risk, predominantly within the complement pathway (CFH, CFI, C3, and C9) and in lipid-related genes (APOE, CETP, LIPC, and ABCA1)[7,8]. In addition to these genetic markers, promising blood-based biomarkers for early AMD detection have been proposed, particularly given the roles of systemic chronic inflammation, lipid accumulation, oxidative stress, and compromised extracellular matrix maintenance in AMD pathophysiology[9−13]. While these findings have provided valuable insights into cell-intrinsic and genetic contributions to AMD, they cannot fully explain the influence of environmental and systemic factors.
In recent years, metabolomic studies have emerged as an important complementary approach to understanding AMD pathogenesis[14,15]. Large-scale analyses have demonstrated robust associations between serum metabolites and AMD risk. For example, in a multicenter cohort study, Li et al. developed a clinically specific biomarker panel consisting of three metabolites: hypoxanthine, 2-furoylglycine, and 1-hexadecyl-2-azelaoyl-sn-glycero-3-phosphocholine, which were significantly associated with the onset, severity, and progression of AMD[11]. Using a metabolite-genome wide association study approach in over 20,000 samples, Han et al. identified 108 serum metabolites associated with AMD development, which were enriched in multiple biological categories[16]. Similarly, Sim et al. reported that four SNPs in the complement system gene (rs10922109, rs10033900, rs116503776, and rs2230199) were significantly associated with several intermediate lipid metabolites, including total cholesterol in high-density lipoprotein[17]. By comparing the metabolomic differences between patients, with and without AMD in both fecal and serum samples, Yuan et al. found significant differences in the abundance of several metabolites between these groups[18]. Oral 8-aminoguanine, a metabolite, has been shown to be an effective oral treatment for retinal aging diseases[19]. Furthermore, in a large cohort consisting of 2,267 AMD patients and 4,266 control participants, Acar et al. demonstrated that lipoprotein levels were associated with AMD-associated genetic variants, whereas decreased essential amino acids may point to nutritional deficiencies in AMD[20]. Despite these findings, the mechanisms underlying alterations in these metabolites, and their effects on the development of AMD, remain poorly understood.
Neuropeptide VF (NPVF), consisting of eight peptides (VPNLPQRF-NH2), is a secreted neuropeptide and member of the extended RFamide peptide family, characterized by their common arginine (R) and amidated phenylalanine (F) motif at the carboxyl terminus[21]. It is mainly expressed in the dorsomedial hypothalamus and has been suggested to be involved in regulating energy homeostasis, age-associated sleep quality, pain, and metabolism[21−25]. Additionally, NPVF has been reported to promote angiogenesis and osteogenesis in bone tissue[26]. However, the role of NPVF in ocular diseases, especially AMD pathogenesis, remains unexplored. In this study, it was identified that NPVF was significantly overexpressed in AMD, particularly in serum samples from patients with wet AMD, compared with those from normal controls. To investigate its potential role, NPVF was overexpressed in a retinal pigment epithelium (RPE) cell line, and the downstream molecular changes examined. Notably, the expression of hypoxia-inducible factor-1α (HIF-1α) was markedly altered. Next, human umbilical vein endothelial cells (HUVECs) were cultured in the conditioned medium derived from NPVF-overexpressing (NPVF-OE) RPE cells, and enhanced tube formation observed, accompanied by an increased concentration of vascular endothelial growth factor (VEGF) in the supernatant of NPVF-OE RPE cultures. By integrating transcriptomic and metabolomic data of NPVF-OE and control RPE cells, it was discovered that ALDH2 was upregulated, whereas its substrate, D-glycerate, was downregulated. Knocking down ALDH2 or supplementing with D-glycerate led to the downregulation of HIF-1α expression.
-
DNA-free RNA levels of differentially expressed proteins in retinal choroid samples from human donor eyes were screened in two published datasets, the University of Iowa and the Lions Eye Bank of Oregon, as previously described[13,27]. Patients were screened for enrolment at Shanghai General Hospital between October 2018 and December 2018. Patients diagnosed with wet AMD were included and independently assessed by two trained ophthalmologists (Chong and Kun). Exclusion criteria included: (1) history of intraocular surgeries or other pathologies, including congenital ocular diseases, glaucoma, or fundus diseases other than AMD, based on self-reported history or ophthalmic examination; (2) presence of systematic diseases, including liver damage, kidney failure, lung disease, mental illness, autoimmune diseases, or cancer; and (3) inability or unwillingness to provide written consent or verbal assent. Following enrolment, each participant underwent a comprehensive ophthalmic examination, including best-corrected visual acuity (BCVA) evaluation, slit-lamp biomicroscopy, tonometry, fundus examination, and optical coherence tomography. BCVA was measured using a retro-illuminated Early Treatment of Diabetic Retinopathy Study chart at a 4-m distance. For the control group, age- and sex-matched patients with cataracts without fundus diseases who were planned for cataract surgery at Shanghai General Hospital were enrolled. All serum samples were collected from patients with wet AMD and cataract controls, quickly frozen in liquid nitrogen, and stored in a −80 °C refrigerator for a maximum of three months.
Cells and reagents
-
The ARPE-19 human cell line was purchased from American Type Culture Collection (Number: CRL-2302) and cultured in Dulbecco's Modified Eagle's Medium nutrient mixture, F12 (11320033, GibicoTM, USA), supplemented with 10% fetal bovine serum (10099141C, GibicoTM, USA), and 1% penicillin or streptomycin (15140122, GibicoTM, USA). Cultures were seeded at an initial density of 106 cells and maintained at 37 °C and 5% CO2. To mimic AMD-associated NPVF transcriptional upregulation, NPVF-overexpressing (NPVF-OE) ARPE-19 cells were generated using a recombinant lentiviral vector. The NPVF segment was ligated into the GPIPZ vector with a 3xFLAG tag, and the sequence was confirmed by Sanger sequencing. The lentiviruses were produced using Aisa-Vector Biotechnology (Shanghai, China).
The small interfering RNA (siRNA) sequences targeting aldehyde dehydrogenase 2 (ALDH2) are listed in Supplementary Table S1. Subsequently, siRNAs targeting ALDH2 were transfected to the RPE cell line using Lipofectamine™ 2000 transfection reagent (Thermofisher 11668019), following the manufacturer-provided manual. RPE cells were cultured under standard conditions for 24 h. During exogenous D-glycerate exposure, the reagent was diluted to 1 mM in the RPE cell line medium.
Library preparation and sequencing
-
Total RNA was extracted from cell samples, and RNA concentration and purity were assessed using a Nanodrop2000 spectrophotometer. RNA integrity was evaluated using agarose gel electrophoresis, and the RNA integrity number (RIN) was determined using an Agilent 2,100 Bioanalyzer. Messenger RNA (mRNA) was isolated from total RNA by pairing oligo (dT)-attached magnetic beads with PolyA. A fragmentation buffer was added to randomly fragment the mRNA, and magnetic beads were used to select fragments of approximately 300 bp. Complementary DNA (cDNA) was synthesized via reverse transcription, and sticky cDNA ends were repaired using an End Repair Mix to create blunt ends. A single adenine (A) base was added to the 3' end, followed by adapter ligation. Library enrichment and polymerase chain reaction (PCR) amplification were performed for 15 cycles. Target bands were recovered using 2% agarose gel electrophoresis. Samples were quantified using TBS380 (Picogreen), and mixed at the appropriate ratios for sequencing. Bridge PCR amplification was performed on a cBot to generate clusters, followed by sequencing on an Illumina platform using a paired-end library with a read length of 2 × 150 bp.
RNA-seq data and metabolite data processing
-
RNA-seq data were trimmed using Fastp with default parameters, and then mapped to the hg38 human genome using the HISAT software. After extracting raw counts, differentially expressed genes (DEGs) were identified using DESeq2[28]. DEGs were visualized using the R package heatmap. Gene Ontology (GO) term and pathway enrichment analyses were conducted using clusterProfiler[29]. The protein–protein interaction (PPI) network was retrieved from the STRING database[30], and interactions with a combined score greater than 500 were retained. The shortest pathways were identified using iGraph, and network visualization was performed with Cytoscape software[31].
Widely-targeted metabolomics was performed. Metabolites were extracted from cell samples as follows: 250 μL of an ice-cold mixture of methanol-water (8/1, v/v) was added to each sample in a 1.5 mL tube containing two steel beads. The samples were homogenized at 60 Hz at −20 °C for 30 s using a bead beater (JXFSTPRP-CLN-24, Shanghai Jingxin Technology Company, China) and repeated three times. The mixture was centrifuged at 10,000 × g for 10 min, and 200 µL of the supernatant was pipette into a new centrifuge tube and evaporated at room temperature under vacuum. The metabolites were separated using a Vanquish Horizon UPLC system (Thermo Scientific). For the aqueous phase (metabolomics), a ZIC-pHILIC column (2.1 mm i.d. × 150 mm, 5 μm, SeQuant, Sweden) was employed for compound separation at 25 °C. Mobile phase A consisted of 20 mM ammonium bicarbonate and 0.1% ammonium hydroxide solution in water, while mobile phase B consisted of acetonitrile. Ion detection was performed using a TSQ Altis (Thermo Scientific) with an electrospray ionization source operating in fast negative/positive ion switching mode. The raw metabolomics data generated by ultra-performance liquid chromatography-tandem mass spectrometry, which were relative quantification data, were processed using the Xcalibur software to perform targeted feature detection. Differential metabolites were identified based on Variable Importance in Projection scores and p-values (< 0.05).
RNA extraction and qRT-PCR
-
First, 1 mL of TRIzol was added to the cells to lyse them, and the lysates were aspirated. Then 200 μL of chloroform was added, and the tube was inverted several times to mix thoroughly. The mixture was left to stand at room temperature for 5 min. Next, it was centrifuged at 12,000 rpm for 15 min at 4 °C. The upper aqueous phase (approximately 400 μL) was transferred to a new tube, followed by the addition of 400 μL of isopropanol. The solution was mixed thoroughly and left to stand at room temperature for 10 min, before being centrifuged again at 12,000 rpm for 10 min at 4 °C. The supernatant was discarded, and the precipitate was washed three times with chilled 70% absolute ethanol, air-dried for 5–10 min, and dissolved in 20 μL of diethyl pyrocarbonate-treated water. RNA concentration was measured using a spectrophotometer. To synthesize cDNA, 5x TransScript All-in-One SuperMix for qPCR was added to the RNA, gently mixed, and incubated at 42 °C for 15 min, followed by heating at 85 °C for 5 s. The cDNA sample was then diluted. Qualitative PCR was performed using SYBR Green qPCR Master Mix. Design primers for NPVF and GAPDH were used to normalize the results. The primer sequences used in this study are listed in Supplementary Table S1.
Western blot
-
Cells were cultured, and the culture medium was completely aspirated. Subsequently, 150 μL of lysis buffer (100 mM Tris-HCl, 2% SDS, 1 mM mercaptoethanol, 25% glycerol) was added, and the cells were lysed for 10 min. The cell lysates were sonicated on ice using an ultrasonic crusher, followed by centrifugation at 13,000 rpm for 10 min at 4 °C. Cell extracts were boiled in SDS sample buffer (Invitrogen, USA), and equal amounts of cell extracts were separated on 15% SDS-PAGE gels. Electrophoresis was performed at a constant voltage of 80 V until the bromophenol blue indicator formed a line at the junction of the stacking gel, after which the voltage was increased to 100 V until the dye front reached the bottom of the gel. The gel was then removed, and the target band was excised according to the marker. It was rinsed with distilled water and transferred onto a polyvinylidene fluoride (PVDF) membrane (Millipore, USA). The PVDF membrane was soaked in TBST containing 5% non-fat milk powder and blocked on a shaker at room temperature for 1 h. The primary antibodies, including anti-NPVF (PA5-59700, rabbit polyclonal antibody, Thermo Fisher Scientific, USA), anti-ALDH2 (15310-1-AP, rabbit polyclonal antibody, Proteintech, China), and anti-GAPDH (10494-1-AP, rabbit polyclonal antibody, Proteintech, China) were diluted at a ratio of 1:1000 according to the manufacturer's instructions, and incubated overnight at 4 °C. The PVDF membrane was washed thoroughly three times with TBST for 5 min each. Next, the corresponding HRP-labelled secondary antibody (7074S, Cell Signaling Technology, USA) was diluted at a ration of 1:5000 and incubated at 37 °C for 1 h. The membrane was again washed three times with TBST, and the immunoreactive bands were visualized using ECL-PLUS/Kit (GE Healthcare, USA), according to the manufacturer's instructions.
Enzyme-Linked Immunosorbent Assay (ELISA)
-
ELISA was conducted according to the manufacturer's instructions using the Human NPVF Assay ELISA Kit (abx535762, Abbexa, UK), HIF-1α ELISA Kit (E-EL-H6066, Elabscience), and the VEGF ELISA kit (KHG0111, Invitrogen). Absorbance was measured at 450 nm using a microplate reader (Model 680, Bio-Rad, Hercules, CA, USA). The results were analyzed using GraphPad PRISM 5.0 (GraphPad Software Inc., La Jolla, CA, USA). NPVF, HIF-1α, and VEGF concentrations were calculated using a standard curve. The limit of quantification (LOQ) and coefficient of variation (CV) were: LOQ 70 pg/mL and CV < 10% for NPVF, LOQ 37.5 pg/mL and CV < 10% for HIF-1α, LOQ 29.4 pg/mL and CV < 6% for VEGF.
ATP and lactate assays
-
ATP levels were determined using an ATP Assay Kit (S0026, Beyotime, China). Cell culture supernatants were collected and centrifuged to remove debris. Samples were prepared as blank, standard, test, and control tubes according to the manufacturer's instructions. After mixing, the tubes were incubated in a 37 °C water bath for 30 min. Subsequently, 50 μL of precipitant was added to each tube, mixed thoroughly, and centrifuged at 4,000 rpm for 5 min. A total of 300 μL of the resulting supernatant was transferred to a new tube and mixed with 500 μL of chromogenic reagent. After incubation at room temperature for 2 min, 500 μL of stop solution was added, followed by mixing and incubation at room temperature for another 5 min. Absorbance was measured at 636 nm using a microplate reader (Model 680, Bio-Rad, Hercules, CA, USA). Lactate levels were determined using a colorimetric assay kit (E-BC-K044-M, Elabscience, China). Cell culture supernatants were collected and centrifuged to remove debris. Samples were prepared as blank, standard, and test tubes according to the manufacturer's instructions. After mixing, the tubes were incubated in a 37 °C water bath for 10 min. Subsequently, 2 μL of stop solution was added to each tube, followed by thorough mixing. Absorbance was measured at 530 nm using a microplate reader (Model 680, Bio-Rad, Hercules, CA, USA). ATP and lactate concentrations were calculated using a standard curve. The LOQ and CV were: LOQ 1 nM and CV < 5.5% for ATP, LOQ 0.10 mM and CV < 3.5% for lactate.
Tube-formation assay
-
Primary HUVECs from pooled donors were obtained from Lonza (Portsmouth, NH, USA) and maintained in endothelial cell medium (ECM, ScienCell, San Diego, CA, USA). A HUVEC tube formation assay, which measures the ability of endothelial cells plated at sub-confluent densities with the appropriate extracellular matrix support, was used to form capillary-like structures (tubes) to model the reorganization stage of angiogenesis. Experiments were performed using a µ-Slide Angiogenesis kit (81506, Ibidi, Martin Reid, Germany). Precooled growth factor-reduced Matrigel was added to each inner well of cooled µ-Slide plates and incubated at 37 °C for 60 min. Figty µl of HUVECs suspended in conditioned media from NPVF-OE or control ARPE-19 cells (1 × 10⁵ cells/mL) was applied to each upper well. After incubation at 37 °C for 8 h, images were captured using an Olympus FSX100 microscope (Olympus, Tokyo, Japan). The images were analyzed using ImageJ software (National Institutes of Health, Bethesda, MA, USA), and the total tube lengths were quantified.
Cell immunostaining
-
Cultured ARPE-19 cells grown on glass coverslips were fixed in 4% paraformaldehyde (PFA) at room temperature for 1 h, washed with PBS, and then incubated for 20 min at room temperature in a PBS-based blocking buffer containing 0.5% Triton X-100, and 5% bovine serum albumin. The primary antibodies, including anti-NPVF (PC19339, rabbit polyclonal antibody, ab-mart, China), anti-HIF-1α (ab279654, mouse monoclonal antibody, Abcam, UK) were diluted at a ratio of 1:100 according to the manufacturer's instructions, and incubated overnight at 4 °C. Cells were then washed, incubated with fluorophore-conjugated secondary antibodies (SA00013-1 and SA00013-4, Proteintech, China) for 2 h at room temperature under darkness, washed, and then stained with Dapi for 5 min. Images were acquired using a Zeiss LSM 980 confocal microscope. Mean fluorescence intensity (MFI) values were measured using ImageJ software (National Institutes of Health, Bethesda, MA, USA).
Statistical analysis
-
Statistical analyses were performed using the SAS software (version 8.0; SAS Institute, Cary, NC, USA). Continuous variables were presented as means ± standard deviation. The data distribution was examined using Kolmogorov–Smirnov test. All data followed a normal distribution. A two-sided unpaired t-test was used to compare the differences. A p-value ≤ 0.05 (two-tailed) was considered statistically significant.
-
To identify proteins differentially expressed in AMD, transcriptome profiling from GSE29801 (containing RPE-choroid and retina tissue samples from 42 normal eyes and 41 eyes with AMD, including 16 pre-AMD eyes, 16 dAMD eyes, and nine wet AMD eyes) was performed after data pre-processing and quality assessment using R software. Eight hundred and twenty seven upregulated genes, and 592 downregulated genes; the top 100 most significant DEGs of GSE29801 were identified, as was previously reported[27]. Furthermore, tissue-specific expression analyses of these DEGs were conducted to obtain retinal-specific proteins[13]. The NPVF gene, whose expression was significantly higher in the retina than in other tissues, was finally noted. The NPVF gene was upregulated in ocular tissues of patients with AMD compared to that in the control group (Fig. 1a and Table 1). Furthermore, when comparing wet AMD samples with non-wet AMD samples (healthy and dAMD), the wet AMD samples exhibited significantly higher NPVF expression levels (Fig. 1b and Table 1). To validate these findings, serum from 30 healthy donors and 30 patients with wet AMD were collected retrospectively, and their protein abundance quantified using ELISA. The characteristics of the enrolled AMD patients and controls are shown in Table 2. Wet AMD samples consistently showed significantly higher protein levels than healthy controls (Fig. 1c).
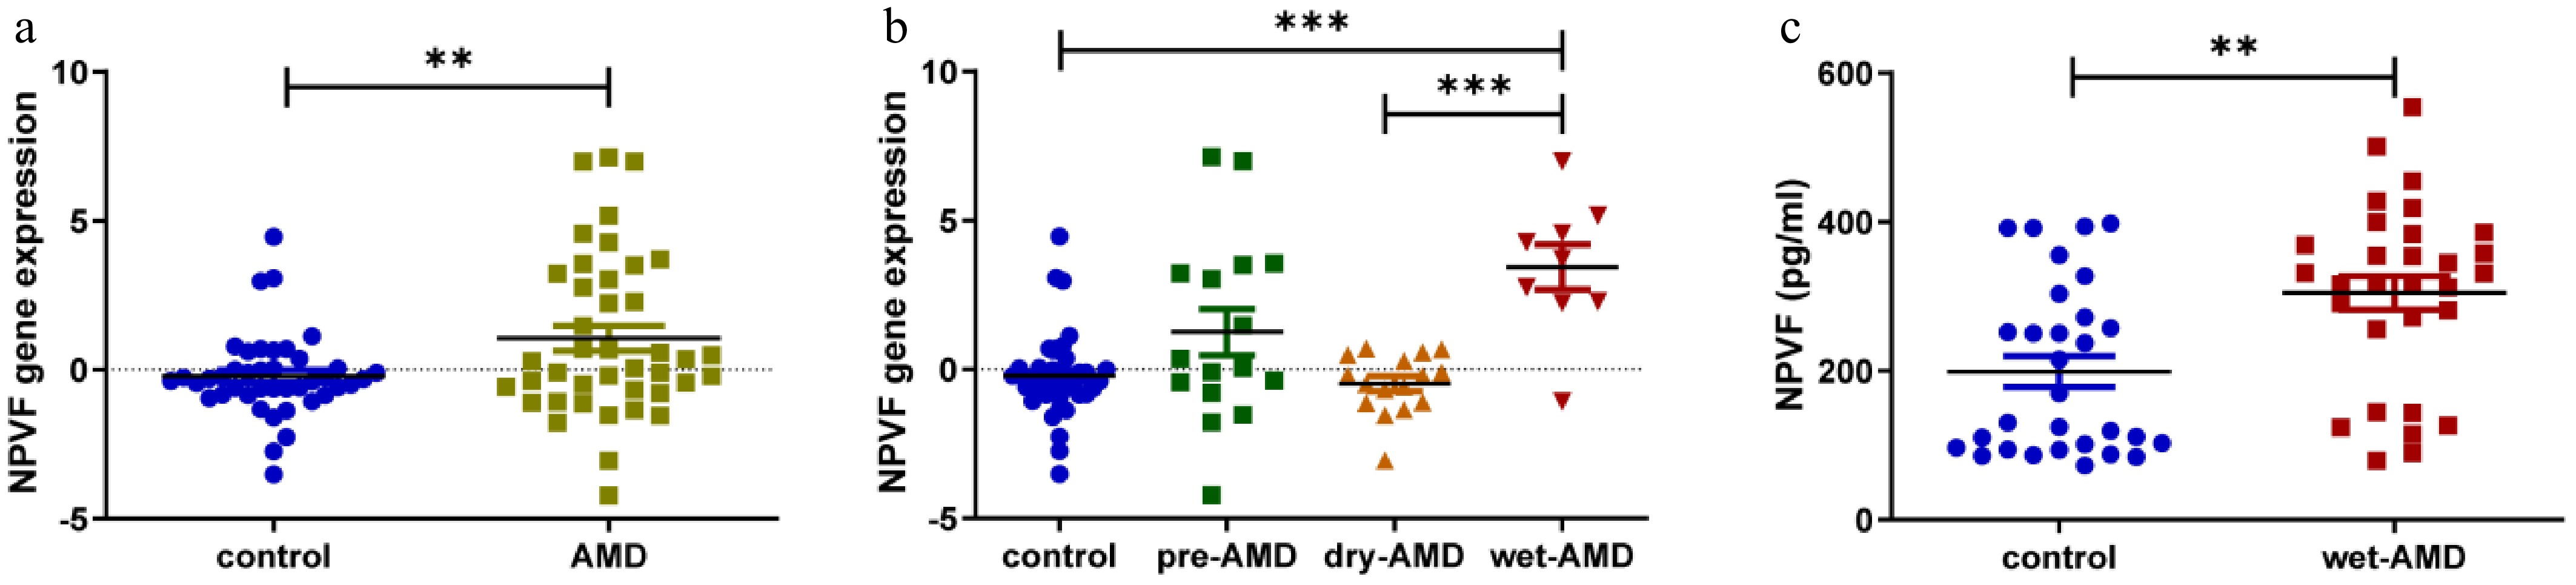
Figure 1.
Neuropeptide VF (NPVF) expression in age-related macular degeneration (AMD) tissue and serum and its effect on hypoxia-inducible factor-1α (HIF-1α). (a) Box plot comparing NPVF gene expression between AMD and control samples from a publicly available database. The y-axis represents gene expression values. (b) Box plot comparing the expression level of NPVF in different groups (control, pre-AMD, dry AMD, and wet AMD). (c) Bar graph showing NPVF protein abundance quantified by enzyme-linked immunosorbent assay (ELISA) in serum samples from 30 healthy and 30 wet AMD donors. NPVF was successfully overexpressed in (d) mRNA, and (e) protein levels. (f) Bar graphs showing the ELISA results of HIF-1α expression after overexpressing NPVF. Two-sided unpaired t-test, ** p < 0.01, *** p < 0.001.
Table 1. NPVF gene expression data in ocular tissues of patients with age-related macular degeneration (AMD), and healthy controls from GSE29801.
NPVF Dry AMD (n = 16) Wet AMD (n = 9) Total (n = 41) Control (n = 42) log2(Fold Change) = −0.2706, p = 0.4799 log2(Fold Change) = 3.647, p < 0.0001 log2(Fold Change) = 1.268, p = 0.0084 Dry-AMD − log2(Fold Change) = 3.918, p < 0.0001 − Table 2. Comparison of age-related macular degeneration (AMD), and control group characteristics.
AMD Controls p-value Sample size 30 30 Age (year) 72.13 ± 9.45 72.37 ± 8.29 0.92 Male 15 (50%) 15 (50%) 1.00 Stage Wet AMD − − Effects of NPVF on RPE cell functions
-
To investigate the role of NPVF in the pathogenesis of AMD, NPVF was overexpressed in the ARPE-19 cell line (Fig. 2a, b). HIF-1α, a key transcription factor involved in AMD-related neovascularization[32,33] was found to be significantly upregulated in NPVF-OE RPE cells (Fig. 2c–e). Given that HIF-1α is a known upstream regulator of VEGF[34,35], it was next examined whether NPVF overexpression would influence angiogenic activity. To assess this, HUVECs were cultured in conditioned medium derived from NPVF-OE or control RPE cells, and a tube formation assay was performed (Fig. 2f). HUVECs exposed to NPVF-OE conditioned medium exhibited significantly enhanced tube formation capacity compared to controls (Fig. 2f, g). Consistently, VEGF levels in the supernatant of NPVF-OE RPE cells were markedly increased, as measured by ELISA (Fig. 2h). Together, these findings suggest that NPVF promotes angiogenesis in RPE cells by upregulating HIF-1α, which in turn increases VEGF secretion, thereby enhancing endothelial tube formation.
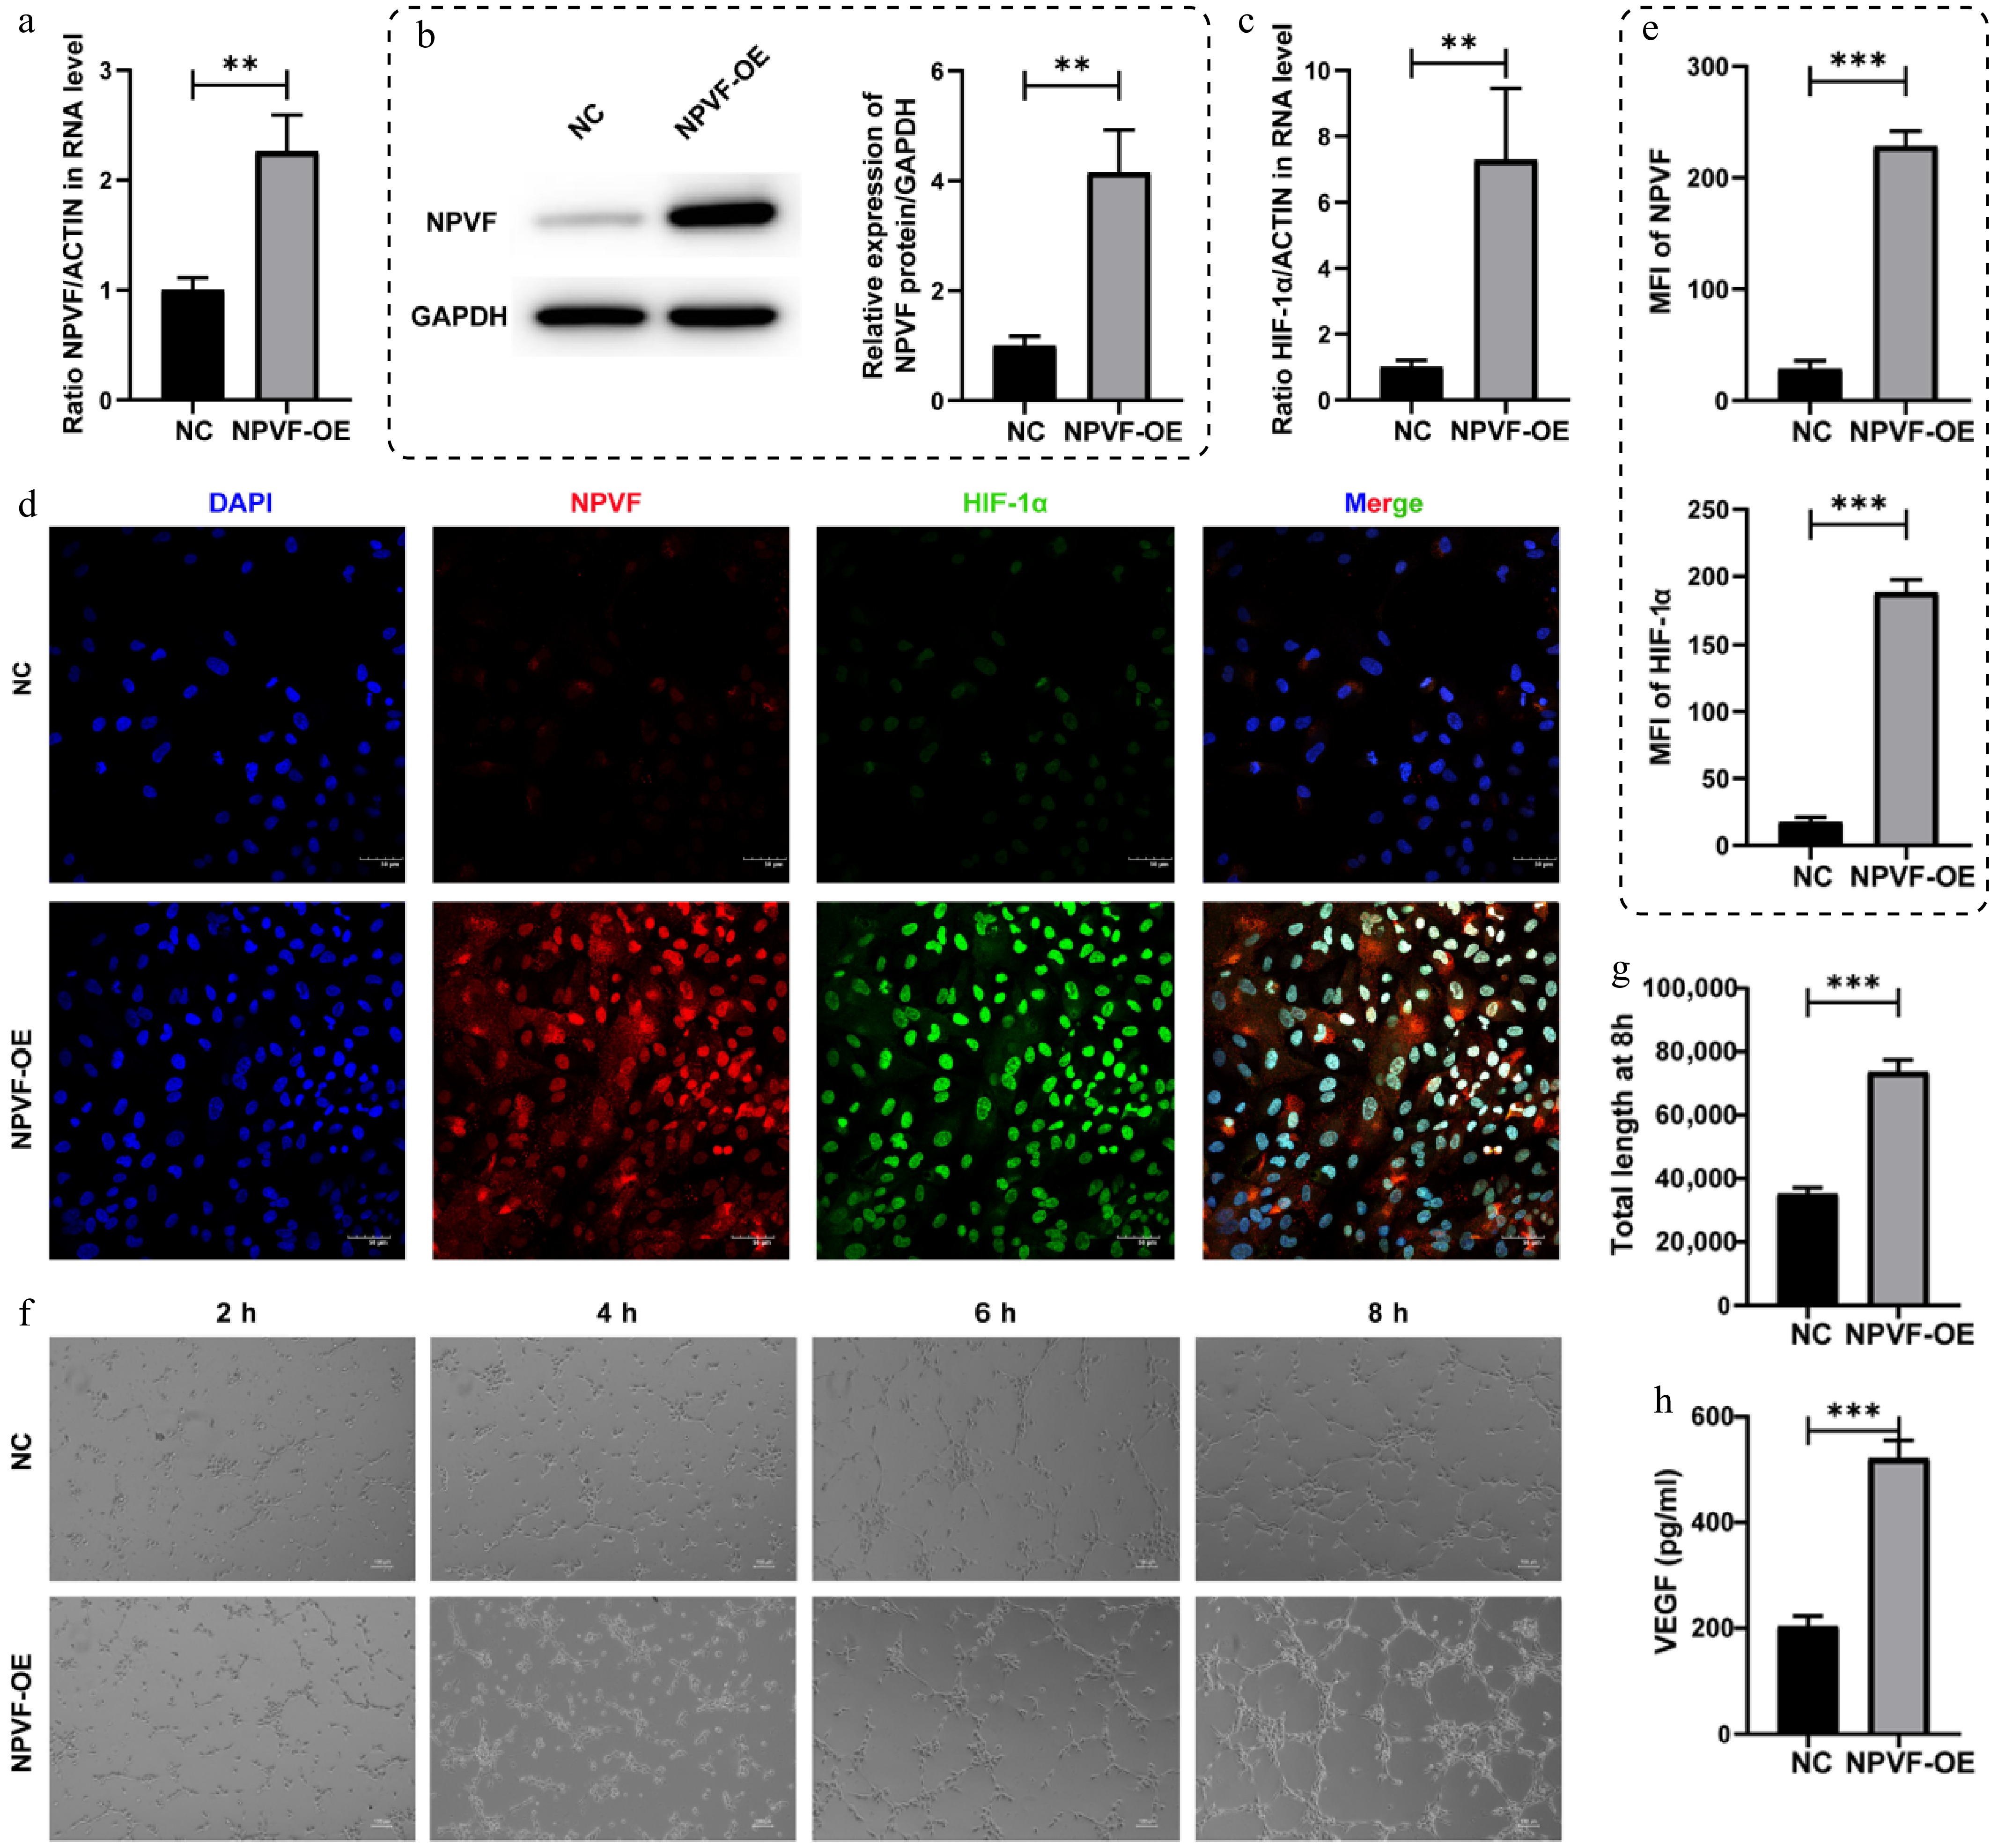
Figure 2.
Effects of neuropeptide VF (NPVF) overexpression on retinal pigment epithelium (RPE) cells. NPVF was successfully overexpressed in (a) mRNA, and (b) protein levels. (c) Bar graphs showing the upregulation of hypoxia-inducible factor-1α (HIF-1α) in mRNA level after overexpressing NPVF. (d) Immunofluorescence staining of NPVF (red) and HIF-1α (green) in NPVF-overexpressing (NPVF-OE) and control (NPVF-NC) ARPE-19 cells. Nuclei were counterstained with DAPI (blue). Scale bar: 50 μm. (e) Quantification of NPVF and HIF-1α immunofluorescence in ARPE-19 cells from (d), showed mean fluorescence intensity (MFI) (n = 3 replicates). (f) Tube formation of human umbilical vein endothelial cells (HUVECs) cultured with conditioned media derived from NPVF-OE or control ARPE-19 cells was tested. (g) Quantification of tube formation at 8h were performed (n = 3 replicates). (h) The concentration of vascular endothelial growth factor (VEGF) in the supernatant of NPVF-overexpressing (NPVF-OE) or control ARPE-19 cells was measured using ELISA. Two-sided unpaired t-test, ** p < 0.01, *** p < 0.001.
NPVF alters AMD-related gene expression
-
To investigate the role of NPVF in AMD pathogenesis, NPVF was overexpressed in the ARPE-19 cell line and differentially expressed genes identified between the NPVF-overexpressing (NPVF-OE) and control (NPVF-NC) groups, each with three biological replicates. In total, 133 upregulated and 105 downregulated genes were identified (Fig. 3a). These differentially expressed genes clearly distinguished between the NPVF-OE and NPVF-NC groups (Fig. 3b). Gene enrichment analysis revealed associations with pathways related to NPVF or AMD, such as 'multicellular organism process', 'response to stimulus', and 'extracellular region' (Fig. 3c). The most enriched KEGG pathways were related to metabolism, including cofactor, vitamin, amino acid, and lipid metabolism (Fig. 3d). Additionally, differential genes that may interact with NPVF were identified using the STRING database[30] (Fig. 3e), with a maximum of three steps in the interaction network. These genes were notably enriched in the glucocorticoid and corticosteroid response pathways. Collectively, these results suggest that NPVF overexpression significantly alters signaling pathways and metabolic processes in RPE cells.
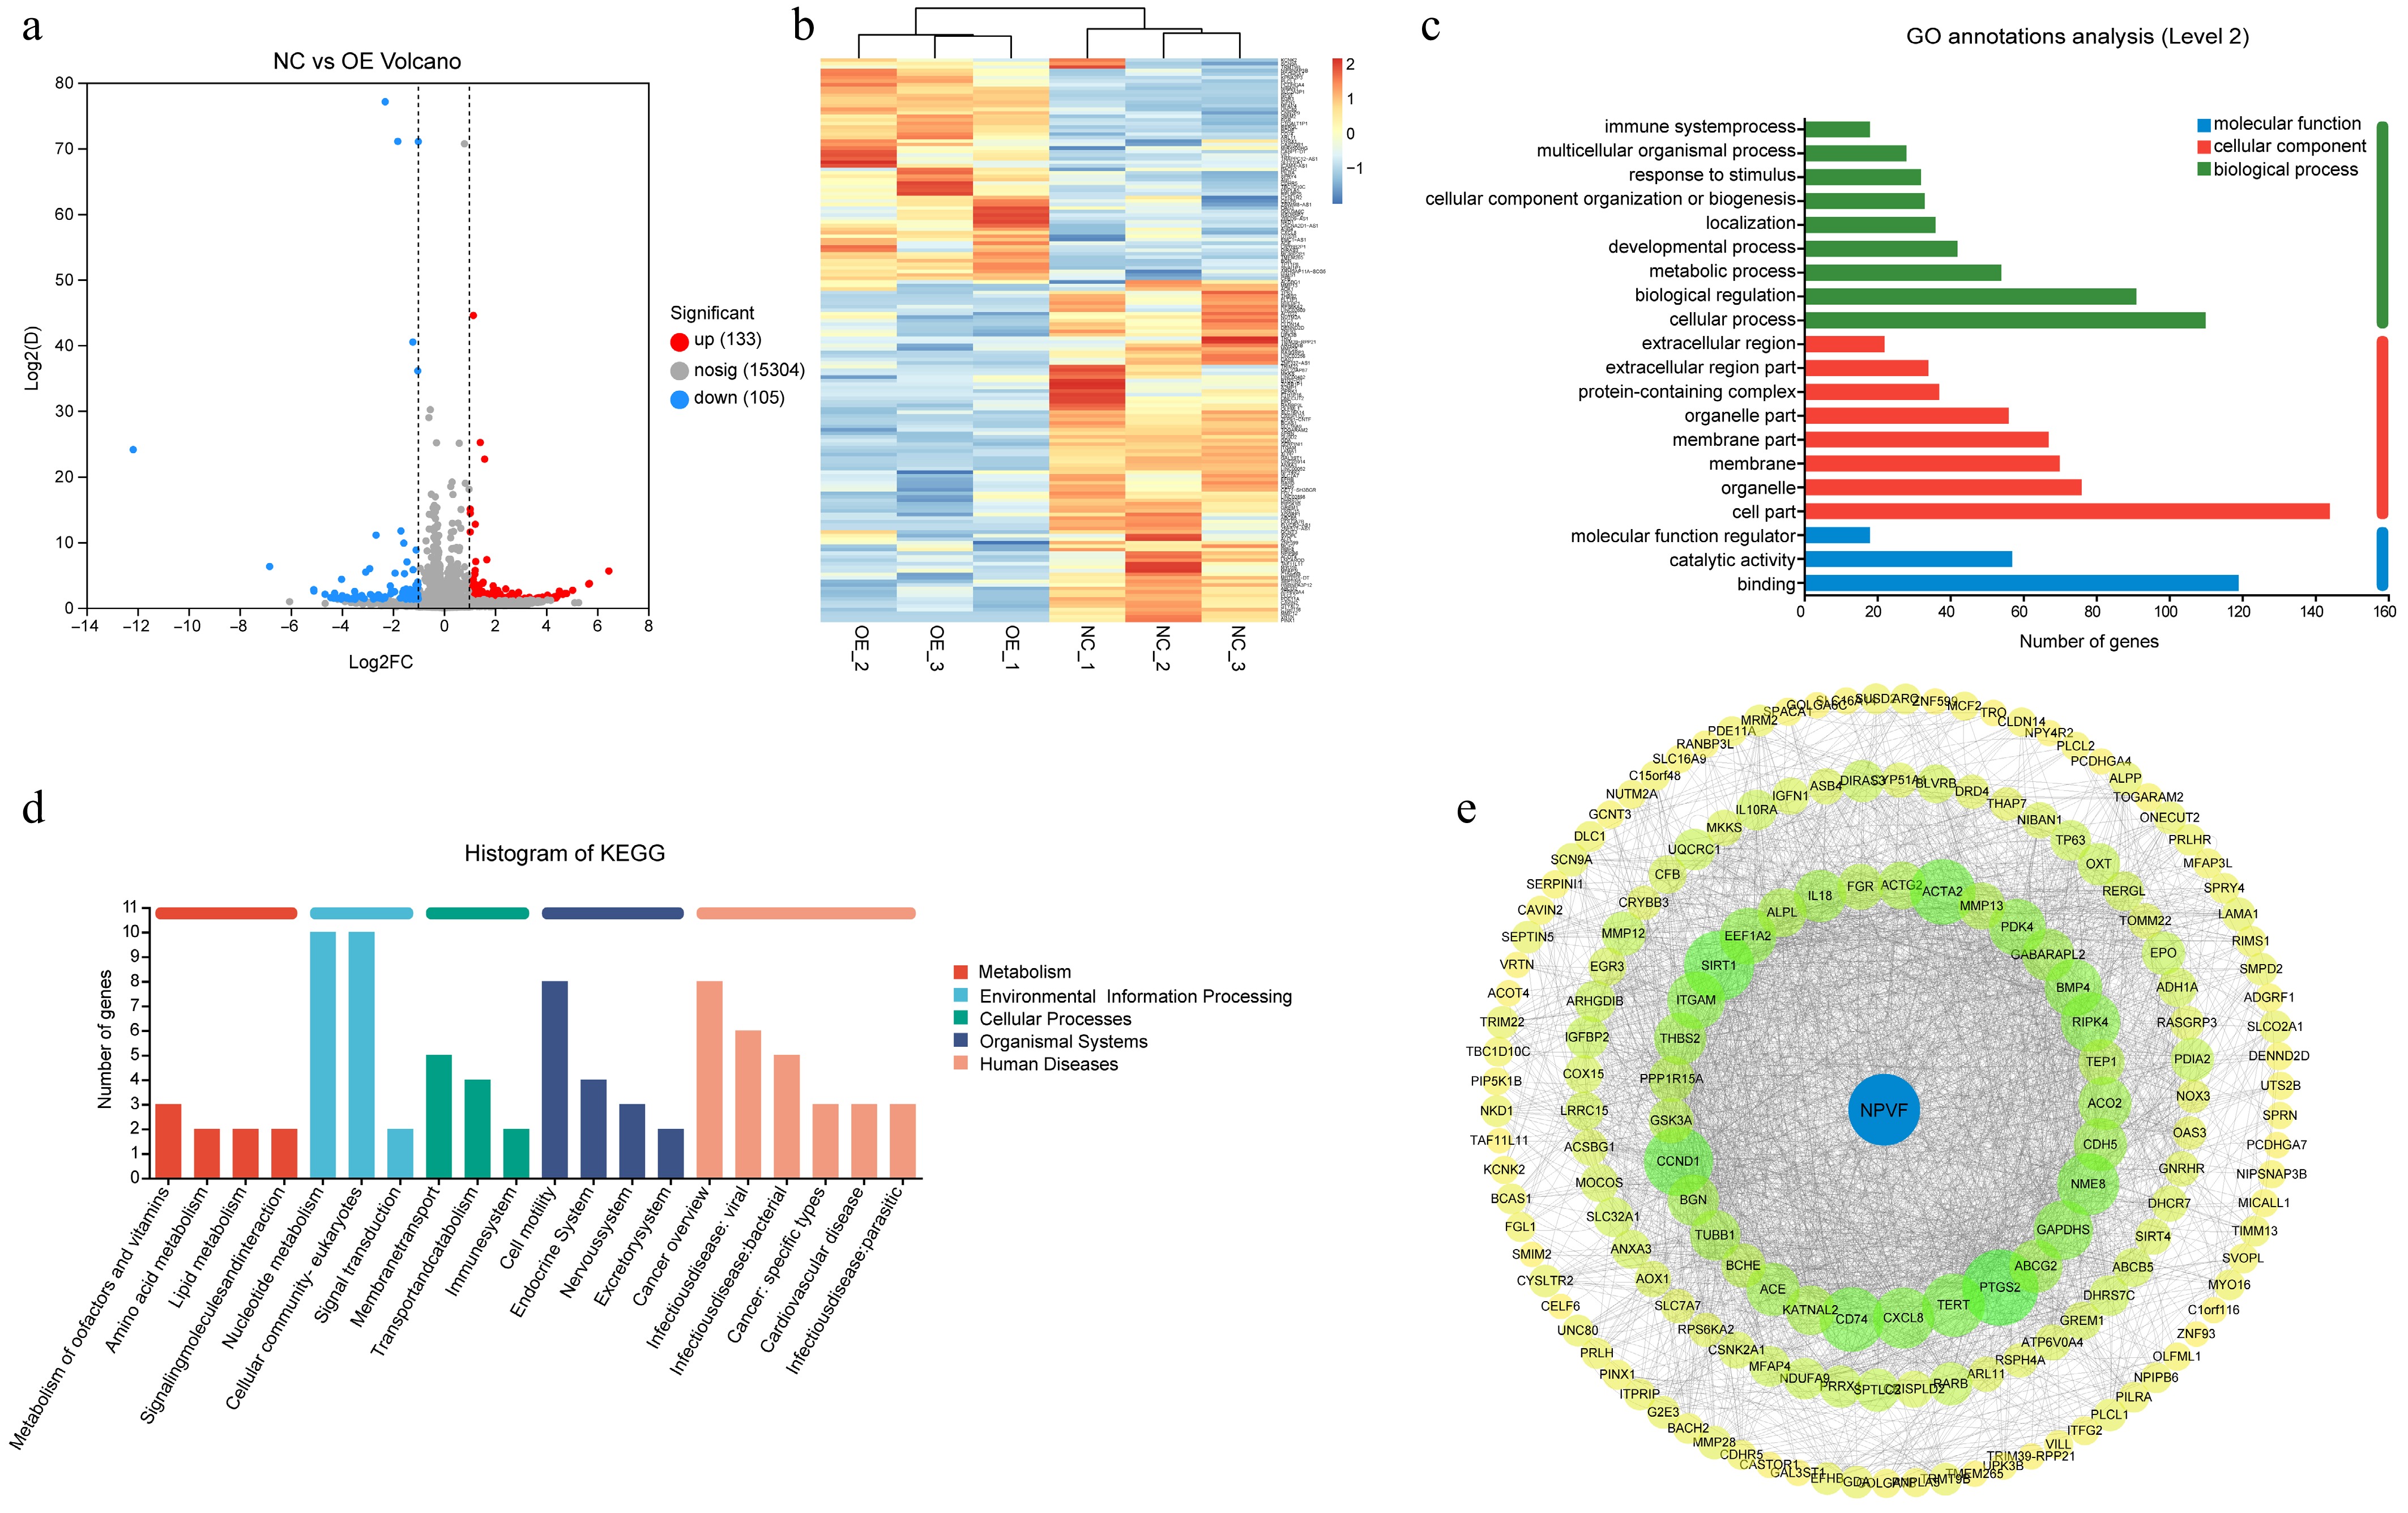
Figure 3.
Alteration of age-related macular degeneration (AMD)-related gene expression by neuropeptide VF (NPVF). (a) Volcano plot showing the differentially expressed genes in NPVF-overexpressing (NPVF-OE), and control (NPVF-NC) retinal pigment epithelium (RPE) cells. The x-axis represents the log2(Fold Change), and the y-axis represents −log10(p-value). A total of 133 upregulated and 105 downregulated genes were identified. (b) Heatmap of differentially expressed genes clearly distinguishing between the NPVF-OE and NPVF-NC groups. (c) Bar graph presenting the enrichment of differential genes, such as 'multicellular organism process', 'response to stimulus,' 'extracellular region'. (d) Bar graph showing the most enriched KEGG pathways. (e) Protein–protein interaction network showing differential genes that may interact with NPVF according to the STRING database with no more than three-step length.
NPVF alters the metabolism of the RPE cell line
-
Given that NPVF overexpression significantly altered metabolic pathways, metabolites in the RPE cell line were quantified before and after NPVF overexpression. A total of 237 metabolites were quantified using targeted metabolomics. Principal component analysis (PCA) clearly distinguished the NPVF-OE and NPVF-NC groups (Fig. 4a). Similarly, orthogonal partial least squares discriminant analysis showed a clear separation between the sample groups (Fig. 4b), consistent with the transcriptomic data indicating that NPVF significantly impacts the metabolism of the RPE cell line. Differential metabolites were identified (Fig. 4c), with a clear separation between the two groups (Fig. 4d). The levels of these metabolites were significantly correlated (Fig. 4e). The enriched metabolic pathways included both amino acid and lipid metabolism (Fig. 4f). Amino acid pathways involved in these changes included 'glycine, serine, and threonine metabolism', 'valine, leucine, and isoleucine metabolism', and 'alanine, aspartate, and glutamate metabolism', while lipid metabolism pathways included 'glycerophospholipid metabolism', and 'glycolipid metabolism'.
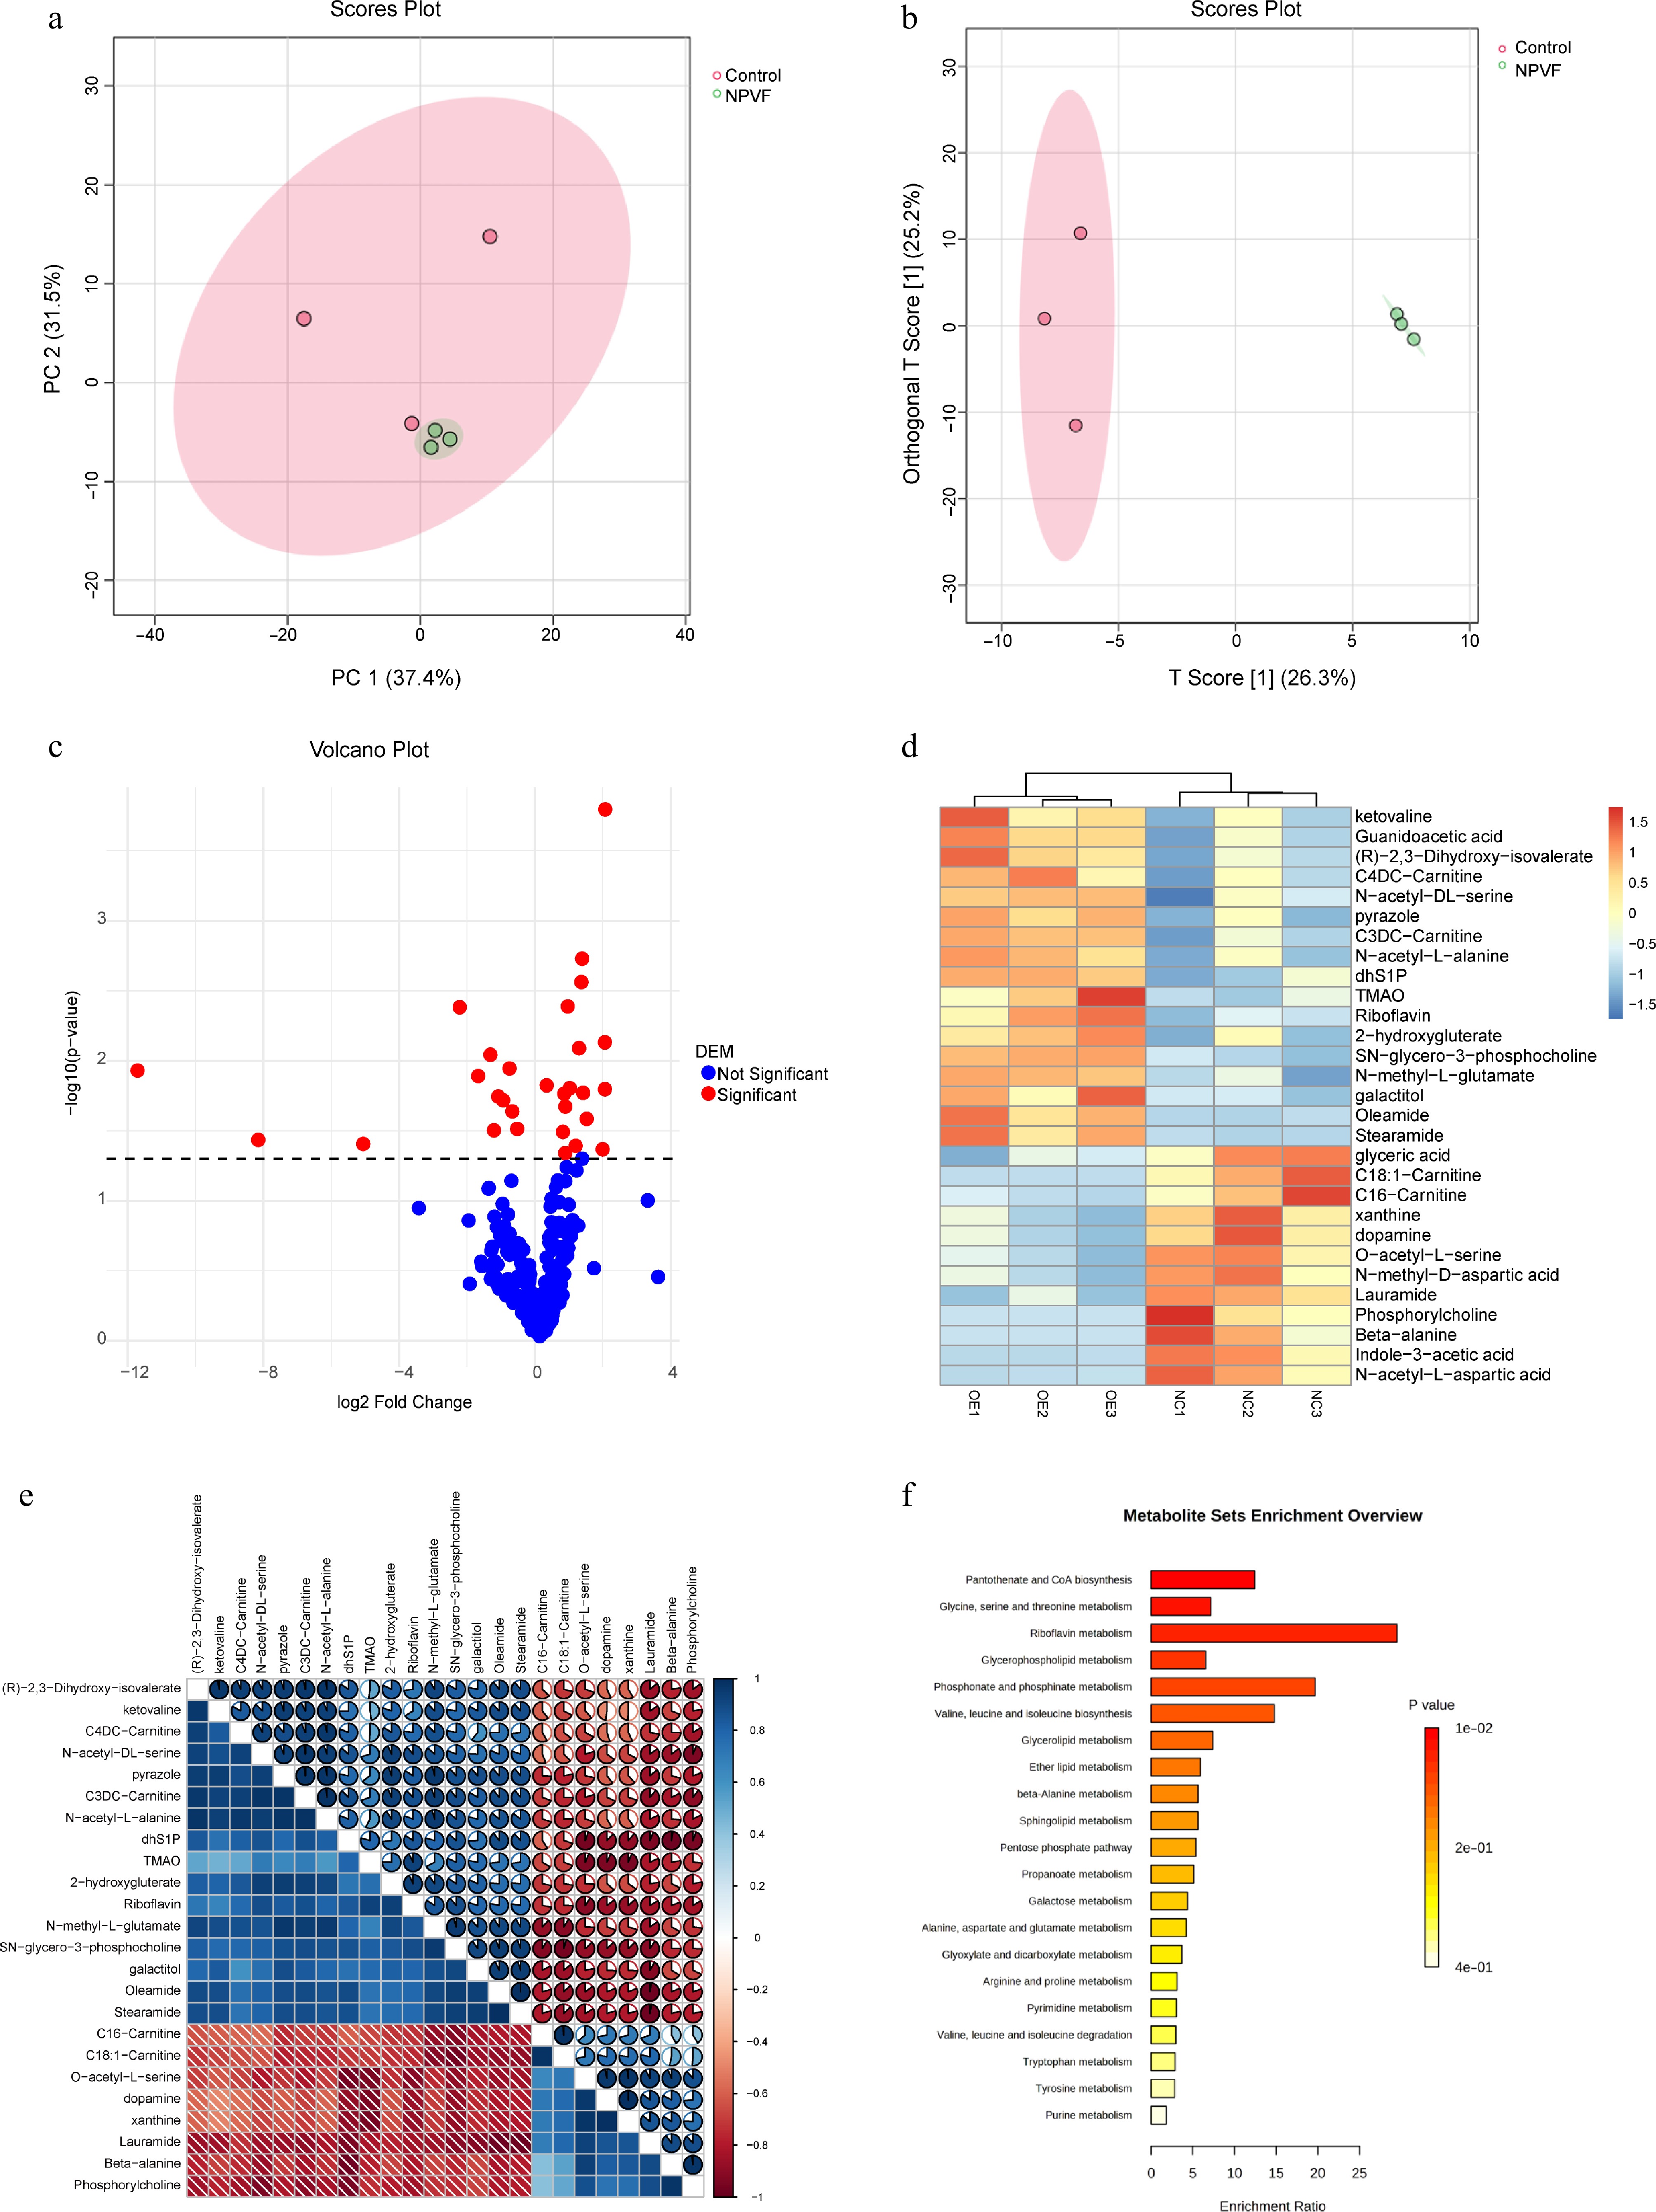
Figure 4.
Alteration of retinal pigment epithelium (RPE) cell line metabolism by neuropeptide VF (NPVF). (a) Scores plot of principal component analyses (PCA) for metabolite quantification in NPVF-overexpressing (NPVF-OE), and control (NPVF-NC) RPE cells. (b) Score plot of OPLS DA analysis, also indicating a clear separation between the NPVF-OE and NPVF-NC groups, consistent with the PCA results and previous transcriptome data. (c) Volcano plot for identifying differential metabolites. (d) Plot showing the separation of the two groups based on differential metabolites. Different colors represent different sample groups. (e) Heatmap showing the correlation of differential metabolites. (f) Bar graph showing enriched metabolic pathways, including amino acid metabolism (such as 'glycine, serine, and threonine metabolism'), and lipid metabolism (such as 'glycerophospholipid metabolism').
Integrated transcriptome and metabolome analyses post NPVF overexpression
-
Next, the DEGs and metabolites were integrated using MetaboAnalyst software. After mapping the metabolites and genes, a landscape of the detected differential metabolites and genes was visualized (Fig. 5a). The most enriched pathways included glycolysis, glycerolipid metabolism, and ether lipid metabolism (Fig. 5b). Although the effect of glycolytic alterations has been widely reported in AMD, glycerolipid metabolism has been less frequently studied (Fig. 5c). Differences in gene expression and metabolite abundance within these pathways was further detailed (Fig. 5d). Notably, ALDH2 and AKR1B10, enzymes of glycerolipid metabolism, were significantly upregulated, whereas the metabolite D-glycerate was markedly reduced in the NPVF-OE group compared to the NPVF-NC group (Fig. 5d). Within these catalytic steps, most reactions were reversible except for the conversion of 2-phospho-D-glycerate to glycolysis intermediates. To further explore the glycolytic shift, ATP and lactate levels in the culture supernatants of NPVF-OE and control RPE cells were measured. The NPVF-OE supernatants showed a significant decrease in ATP along with a marked increase in lactate (Fig. 5e), indicating an enhanced glycolytic flux. The increased levels of ALDH2/AKR1B10, and decreased levels of D-glycerate suggests a metabolic flux shift toward glycerolipid metabolism, potentially further promoting amino acid metabolism and triglyceride formation. Additionally, the decrease in D-glycerate may lead to reduced levels of 2-phospho-D-glycerate and 3-phospho-D-glycerate, both of which are intermediates that connect glycerate metabolism and glycolysis. This shift may further favor glycolytic flux toward D-glycerate as a compensatory adaptation.
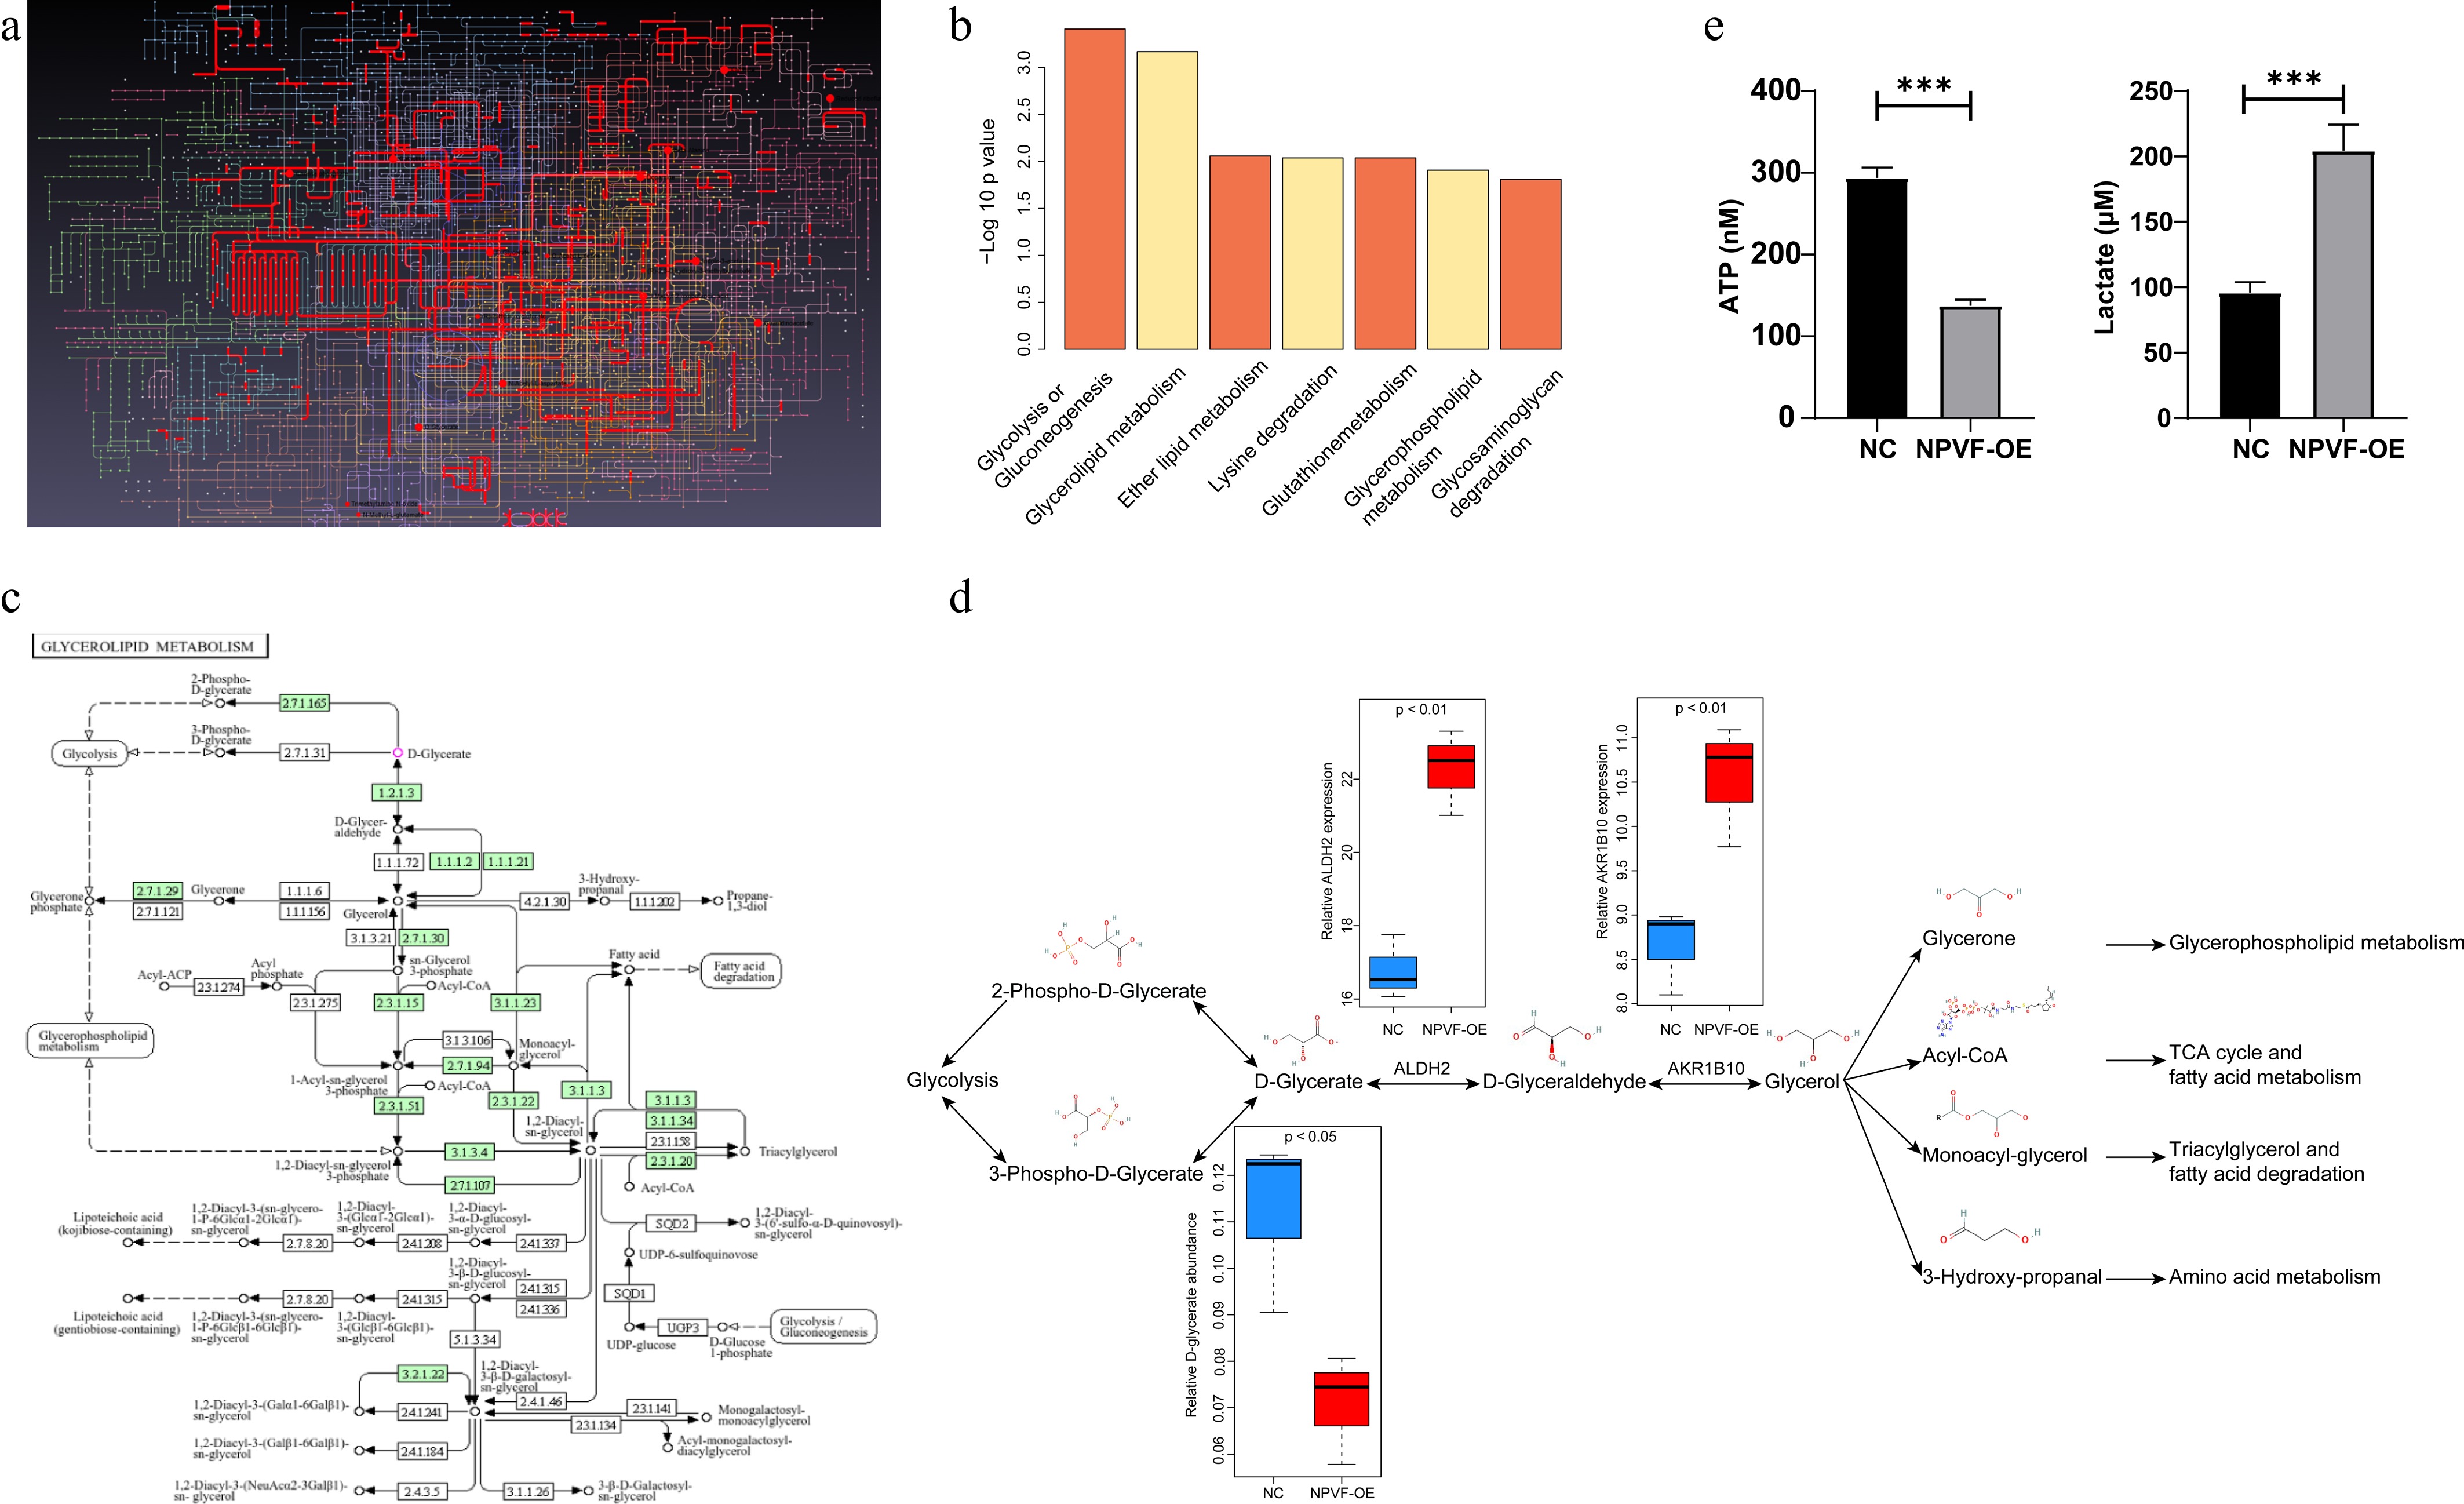
Figure 5.
Integrated analyses of transcriptome and metabolome after neuropeptide VF (NPVF) overexpression. (a) Visualization of the landscape of detected differential metabolites and genes after mapping using the MetaboAnalyst software. Different lines and dots represent different metabolites and genes. (b) Bar graph showing the most enriched pathways, including glycolysis, glycerolipid metabolism, and ether lipid metabolism. The x-axis represents the pathways, and the y-axis shows the significance level [−log10(p-value)[. (c) Schematic diagram highlighting the role of glycolysis and glycerolipid metabolism in age-related macular degeneration (AMD), sourced from the KEGG website (
www.genome.jp/kegg/pathway.html ), and has obtained the necessary permissions from KEGG. (d) Plot illustrating the detailed differences in gene expression and metabolite abundance in glycolysis and glycerolipid metabolism pathways. ALDH2 and AKR1B10 were upregulated, and the metabolite D-glycerate was significantly lower in NPVF-overexpressing (NPVF-OE) than in control (NPVF-NC) cells. (e) ATP and lactate levels in the culture supernatants of NPVF-OE and control RPE cells were measured using an ATP Assay Kit and a colorimetric assay kit (n = three replicates). Two-sided unpaired t-test, *** p < 0.001.NPVF regulates HIF-1α via the ALDH2/D-glycerate axis
-
To further validate these findings, the expression of ALDH2 and AKR1B10 in the RPE cells was quantified before and after NPVF overexpression using qRT-PCR (Fig. 6a and b). Consistent with the RNA-seq data, ALDH2 and AKR1B10 were significantly upregulated in the NPVF-OE group compared to the NPVF-NC group (Fig. 6a and b). Next, ALDH2 expression was knocked down in the NPVF-OE group using siRNA (Fig. 6c–e). Exogenous D-glycerate was added to the NPVF-OE RPE cell line and a significant reduction in HIF-1α expression was observed (Fig. 6f). Consistently, ALDH2 knockdown partially restored NPVF-induced HIF-1α overexpression, as measured by ELISA (Fig. 6g). Both ALDH2 knockdown and exogenous D-glycerate treatment reduced HIF-1α expression in RPE cell lines (Fig. 6h). Collectively, these results suggest that NPVF regulates HIF-1α expression through the ALDH2/D-glycerate axis.
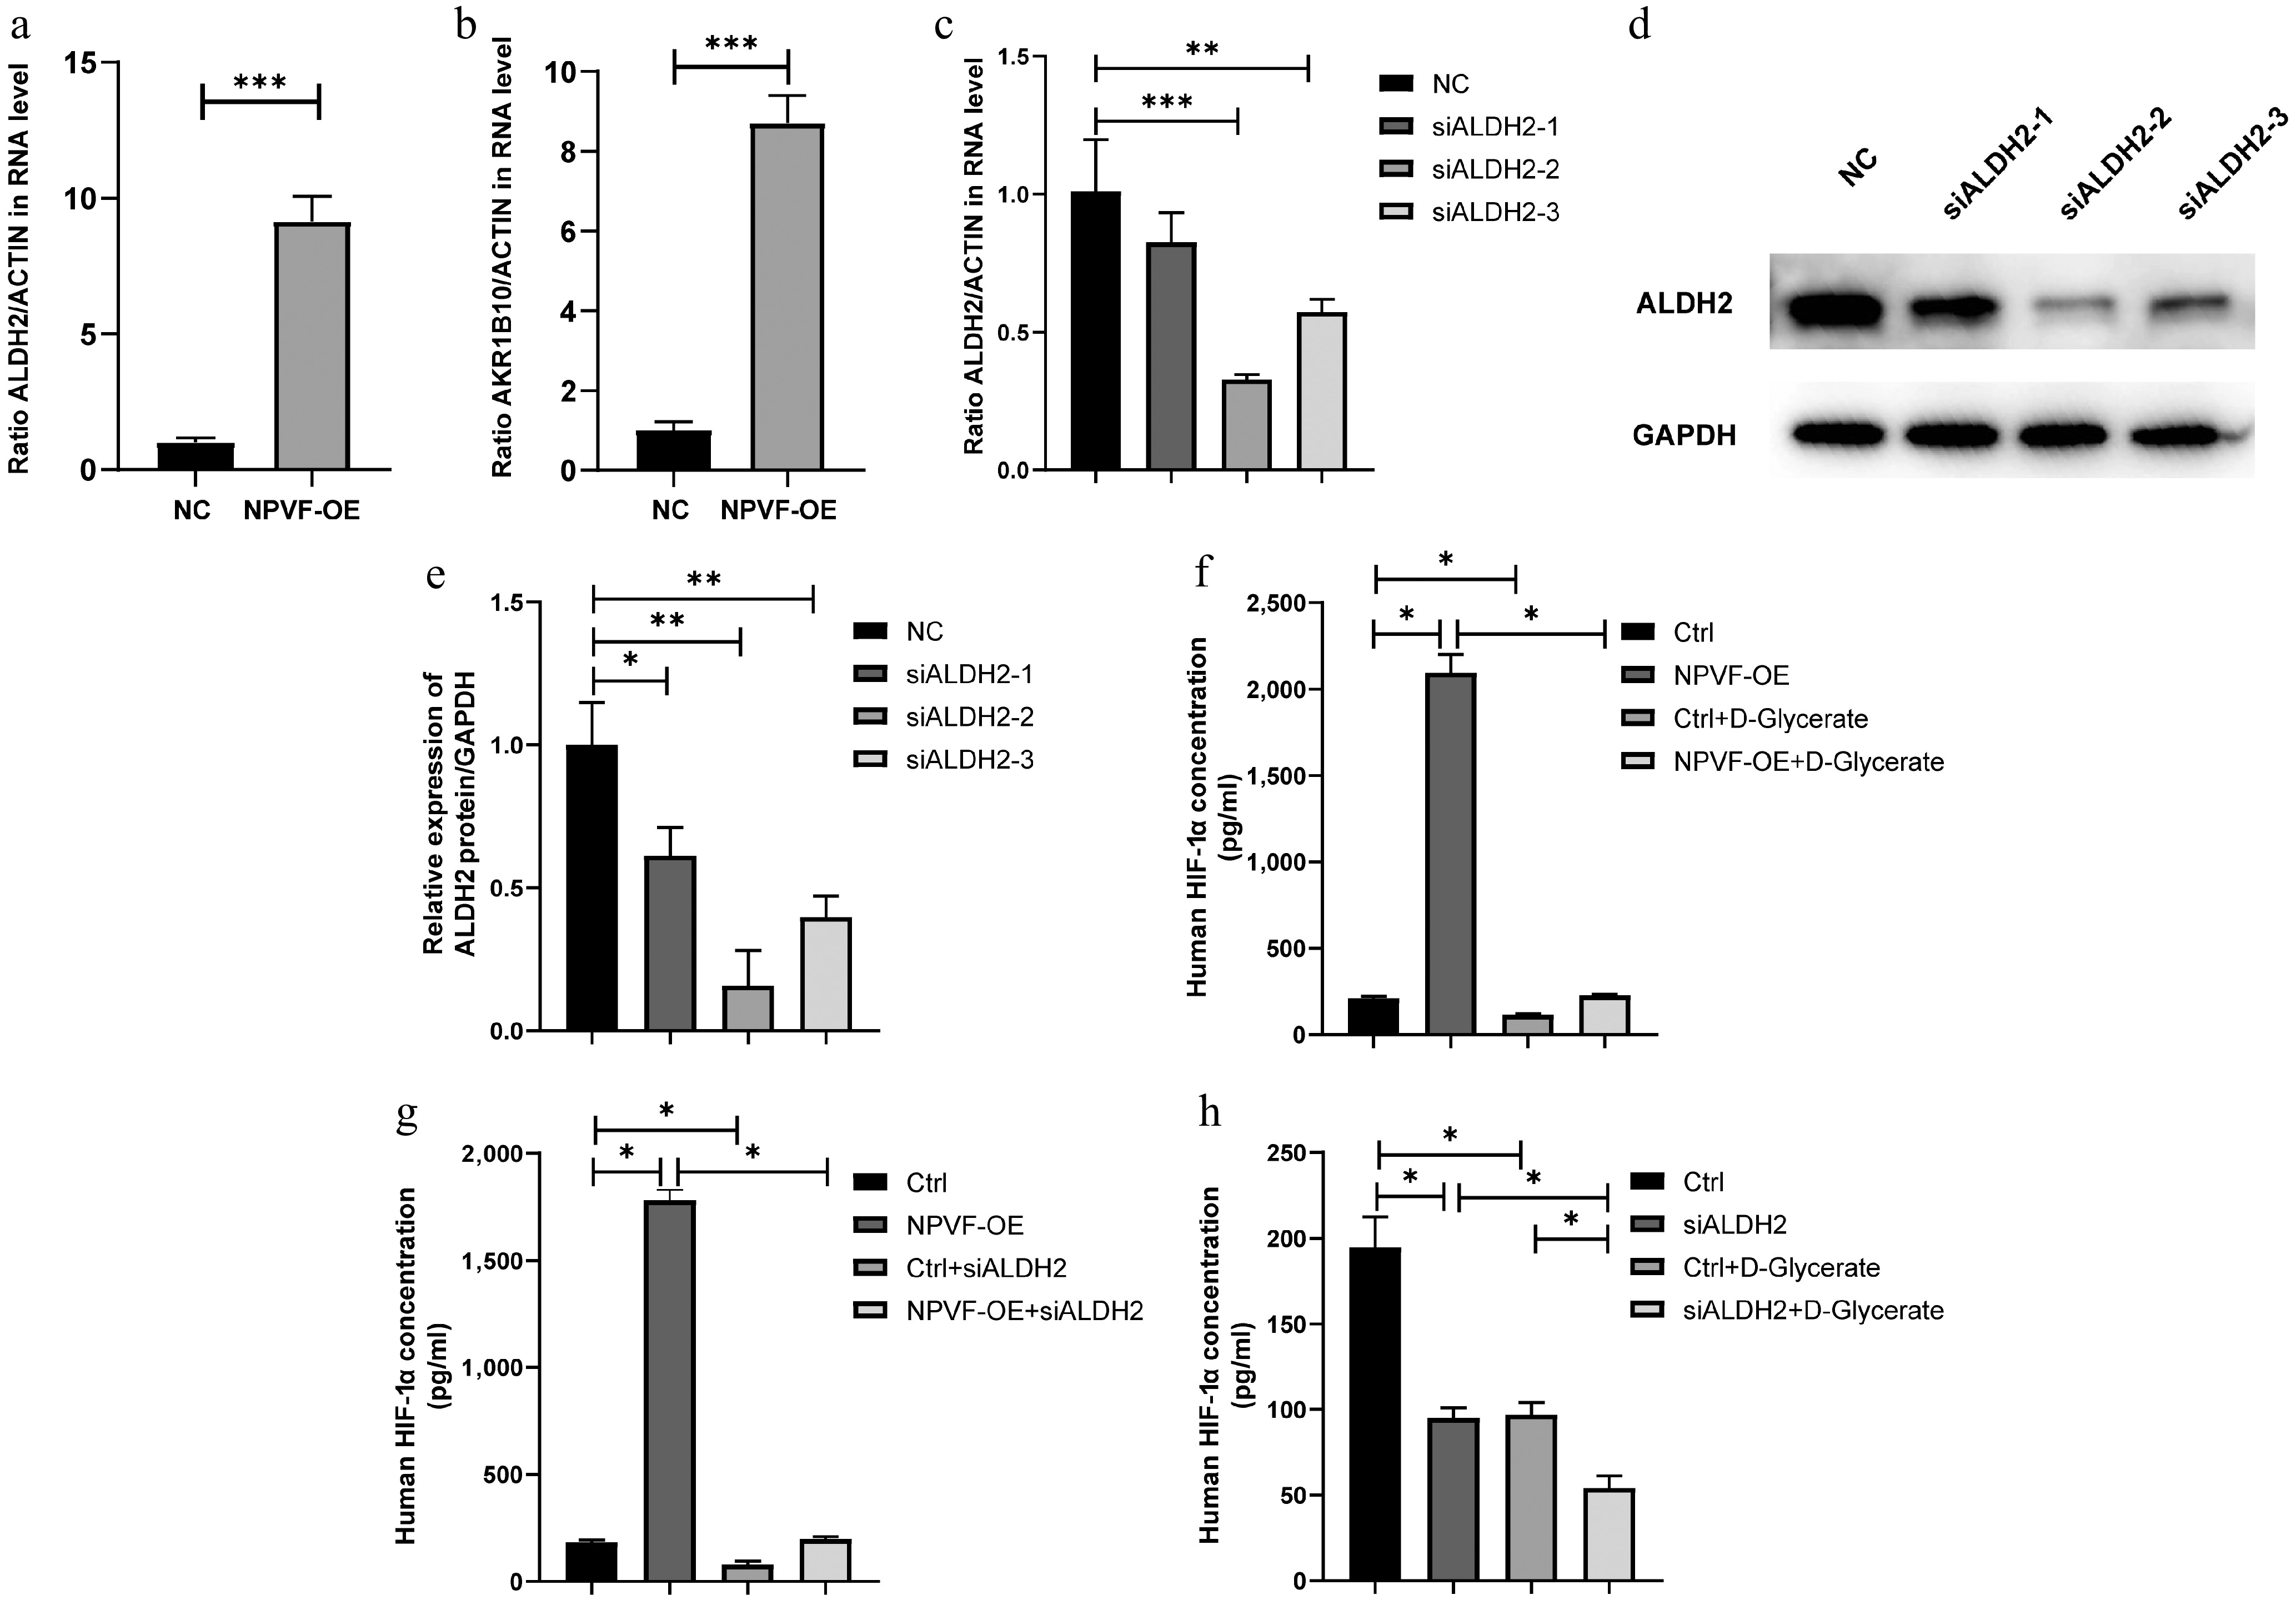
Figure 6.
Neuropeptide VF (NPVF) regulates hypoxia-inducible factor-1α (HIF-1α) via ALDH2/D - glycerate axis. qRT-PCR results showing the expression of (a) ALDH2, and (b) AKR1B10 in NPVF-overexpressing (NPVF-OE), and control (NPVF-NC) retinal pigment epithelium (RPE) cells. (c) qRT-PCR, and (d), (e) western blot results showing the knockdown of ALDH2 gene expression using siRNA in the NPVF-OE RPE cells. (f) Enzyme-linked immunosorbent assay (ELISA) results showing that exogenous D-glycerate inhibited NPVF-induced HIF-1α overexpression. (g) ELISA results showing that ALDH2 knockdown inhibits NPVF-induced HIF-1α overexpression. (h) ELISA results showing that exogenous D-glycerate and ALDH2 significantly reduced HIF-1α. Two-sided unpaired t-test, * p < 0.05, ** p < 0.01, *** p < 0.001.
-
In this study, it was demonstrated that elevated NPVF expression in RPE cells upregulates HIF-1α via ALDH2 further promotes the secretion of VEGF, and enhances endothelial tube formation. The present findings provide new insights into the molecular mechanisms underlying AMD.
Impaired glycolysis has also been reported in AMD. Yokosaka et al. analyzed urinary pyruvate and lactate levels, reporting significantly higher levels in patients with AMD (83.6% and 426.5%, respectively), suggesting that this may result from glycolytic dysfunction[36]. Vallée et al. further demonstrated that elevated pyruvate levels induce the expression of VEGF, a key gene involved in neovascularization in AMD[37]. Additionally, intact aerobic glycolysis is crucial for protecting retinal cells from oxidative damage. Rajala et al. found that the expression of PKM2, a key enzyme in glycolysis, was altered during AMD progression[38]. In this study, it was found that ALDH2 expression and its substrate, D-glycerate, were altered and upregulated in AMD—ALDH2, while D-glycerate levels were reduced. Besides, a decrease in ATP along with an increase in lactate were also noticed. These findings suggest a metabolic flux toward glycerolipid metabolism and a compensatory enhanced glycolysis.
The significant overexpression of NPVF in serum samples from patients with wet AMD suggests its promise as a circulating diagnostic biomarker, which could facilitate earlier detection or stratification of disease subtypes. Importantly, the functional studies in RPE cells demonstrated that NPVF overexpression induces HIF-1α activation and VEGF secretion, thereby promoting angiogenic activity in endothelial cells, an effect that mirrors the pathological neovascularization observed in wet AMD. Given that anti-VEGF therapies remain the mainstay treatment for wet AMD[39], but are limited by non-responsiveness in some patients and the need for repeated injections[39,40], NPVF may represent a novel upstream regulatory target. By modulating NPVF or its downstream pathways (e.g., ALDH2, AKR1B10, D-glycerate-related metabolism), it may be possible to develop complementary or alternative therapeutic strategies that address the metabolic component of disease progression. Further investigation in clinical cohorts and preclinical models is warranted to validate the diagnostic and therapeutic potential of NPVF in AMD management.
There are several limitations to this study. First, the NPVF-ALDH2-HIF-1α axis was not validated in vivo. Although in vitro experiments have provided evidence, the role of NPVF requires further investigation using mouse models, especially in the context of potential clinical applications. Second, targeted quantification of D-glycerate was not performed, as a commercially available and validated standard for this metabolite is currently lacking. Finally, although significant differences in NPVF expression were detected in both serum and tissue samples between patients with AMD and healthy individuals, it remains unclear whether serum NPVF differences are directly associated with retinal tissue. This warrants further investigation to determine its potential as a biomarker for AMD diagnosis or progression.
-
In summary, this study reveals that NPVF is significantly overexpressed in AMD, especially wet-AMD, and promotes HIF-1α expression and pro-angiogenic capability of RPE cells via the ALDH2/D-glycerate axis. Transcriptomic and metabolomic analyses demonstrated that NPVF alters gene expression and metabolic pathways associated with AMD pathogenesis. Elevated ALDH2 and reduced D-glycerate levels suggest metabolic flux shift toward glycerolipid metabolism, potentially contributing to AMD progression and angiogenesis. These findings uncover a previously unrecognized NPVF/ALDH2/D-glycerate/HIF-1α pathway in AMD, highlighting a novel metabolic regulatory mechanism. The present study provides new insights into AMD pathophysiology, and suggests NPVF as a potential biomarker or therapeutic target, bridging gaps between neuropeptide signaling, metabolism, and hypoxia-driven angiogenesis in retinal diseases.
-
This study was reviewed and approved by the Medical Ethics Committee at Shanghai General Hospital, affiliated with Shanghai Jiao Tong University (Approval No. 2016KY115-2; Date: May 17, 2016), and adhered to the tenets of the Declaration of Helsinki. Written informed consent was obtained from all participants. This study involved the use of established human cell lines. The cell lines used in this research were obtained from the Cell Bank of Chinese Academy of Sciences (Shanghai, China) and were used in accordance with institutional and national ethical standards. The cell lines have been previously published or validated, and no new human tissues were used in this study.
This work was supported by the National Natural Science Foundation of China (82000880, 82271096, 82101181), the Natural Science Foundation of Shanghai (25ZR1402437), the Fundamental Research Funds for the Central Universities (No. YG2023ZD17), and Shanghai Jiao Tong University K. C. Wong Medical Fellowship Fund. No funding agency influenced or restricted any part of the trial, its data, or publication.
-
The authors confirm their contributions to the paper as follows: conceptualization: Cheng L, Fang J, Chen C; data curation: Jin P, Qian T, Wei J, Yu F; formal analysis: Cheng L, Liu X; investigation: Liu X, Lv K, Zhang Y, Zhou Y; methodology: Lv K, Zhang Y, Zhou Y, Fang J; Project administration: Liu K, Xu X, Chen C; resources: Liu K, Xu X; Software: Fang J; supervision: Liu K, Xu X, Chen C; Validation: Chen C; Visualization: Cheng L, Liu X; writing – original draft preparation: Cheng L; writing and editing: Cheng L, Fang J, Chen C, Jin P, Qian T, Wei J, Yu F, Liu X, Lv K, Zhang Y, Zhou Y, Liu K, Xu X. All authors reviewed the results and approved the final version of the manuscript.
-
The datasets generated during and/or analyzed in this study, including RNA-Seq data, metabolite data, and raw images for western blot are available at Dryad Digital Repository at https://doi.org/10.5061/dryad.qjq2bvqsf, and are available from the corresponding author upon reasonable request.
-
The authors declare that they have no conflict of interest.
-
Authors contributed equally: Lu Cheng, Xiaoxin Liu
- Supplementary Table S1 Sequences of small interfering RNA (siRNA) and primers used in this study.
- Copyright: © 2025 by the author(s). Published by Maximum Academic Press, Fayetteville, GA. This article is an open access article distributed under Creative Commons Attribution License (CC BY 4.0), visit https://creativecommons.org/licenses/by/4.0/.
-
About this article
Cite this article
Cheng L, Liu X, Lv K, Zhang Y, Jin P, et al. 2025. Neuropeptide VF promotes hypoxia-inducible factor-1α expression in age-related macular degeneration via the aldehyde dehydrogenase 2/D-glycerate axis. Visual Neuroscience 42: e024 doi: 10.48130/vns-0025-0023 

Neuropeptide VF promotes hypoxia-inducible factor-1α expression in age-related macular degeneration via the aldehyde dehydrogenase 2/D-glycerate axis
- Received: 23 June 2025
- Revised: 11 September 2025
- Accepted: 17 September 2025
- Published online: 13 November 2025
Abstract: Age-related macular degeneration (AMD) is the leading cause of blindness; however, its underlying pathogenesis remains unclear. This study investigated the role of the neuropeptide VF (NPVF) in AMD. Transcriptome profiling in retinal-choroid tissues was analyzed using a public dataset. There was an increase in NPVF expression in the retinal-choroid tissues of eyes with AMD, which was more significant in wet AMD. Serological validation was conducted to verify the expression of NPVF in 30 wet AMD patients and 30 controls, and a statistically significant increase in serum NPVF concentration was observed in wet AMD patients. The role of NPVF in AMD was then investigated through in vitro experiments involving the overexpression of NPVF in a human retinal pigment epithelium (RPE) cell line. Overexpression of NPVF resulted in a marked upregulation of hypoxia-inducible factor-1α (HIF-1α), a key regulator implicated in the pathogenesis of AMD and associated neovascularization, and further promotes the secretion of vascular endothelial growth factor and enhances endothelial tube formation. By integrating transcriptomic and metabolomic data, it was found that aldehyde dehydrogenase 2 (ALDH2) was upregulated, whereas its substrate, D-glycerate, was downregulated in NPVF-overexpressing RPE cells. Further experimental validation confirmed that NPVF regulates HIF-1α expression through the ALDH2/D-glycerate axis. In summary, the present findings suggest that NPVF contributes to AMD pathogenesis via the ALDH2/D-glycerate/HIF-1α pathway.