


-
Glaucoma is the primary irreversible blinding eye disease worldwide. Progressive loss of retinal ganglion cells (RGCs) leads to irreversible visual dysfunction and finally total blindness[1,2]. Intraocular pressure (IOP) elevation and aging are currently recognized as the leading risk factors for the pathogenesis of glaucoma[3]. However, glaucoma is a retinal neurodegenerative disease. Our knowledge about the underlying mechanisms of glaucoma is still limited since its pathogenesis is complex and diverse. So far, reduction of elevated IOP by surgical operation or drugs is the sole clinically effective method for glaucoma treatment. At the same time, a combination of neuroprotective drugs is applied to alleviate visual function damage[4,5].
Previous studies have shown that in the lower vertebrates, such as zebrafish, damaged retinas can be fully repaired by the regeneration of major retinal neurons[6]. In injured zebrafish retinas, Müller cells, a major type of glial cell, undergo cell reprogramming, re-entering the cell cycle and dividing asymmetrically to produce pluripotent retinal progenitor cells that are capable of regenerating lost retinal neurons[7,8]. In mammals, even though the majority of retinal Müller cells express the stem cell marker proteins such as Sex determining region Y-box 2 (SOX2), Nestin, achaete-scute complex homolog-like protein 1 (Ascl1), and Ceh-10 homeodomain-containing homolog, neurogenesis by Müller cells is limited in retinal injury and disease[9−11]. Müller cells seem likely to lose their abilities to dedifferentiate into stem cells (precursor cells), instead of hyper-proliferating to form glial scars[5,12].
There is evidence showing that Hippo and Wnt/β-catenin signaling pathways are associated with Müller cell proliferation and dedifferentiation into stem cells (precursor cells)[13,14]. Following retinal injury, the activity of the Yes-Associated Protein (YAP), a key effective factor in the Hippo signaling pathway in responsive Müller cells, is inhibited[13]. Specific knockdown of large tumor suppressor kinase 1 (Lats1) and Lats2, the Hippo signaling pathway components in Müller cells, results in a dramatic upregulation of cyclin D1, and Müller cells lose their matured properties and reach a highly proliferative progenitor-like cell state[13]. These findings suggest that the Hippo signaling pathway acts as an endogenous blocker that sustainably inhibits mammalian Müller cell proliferation and reprogramming. In addition, overexpression of β-catenin, a key factor in the Wnt/β-catenin signaling pathway, stimulates Müller cells to be activated into the cell cycle. Activated Müller cells can be reprogrammed to generate rod photoreceptors through subsequent gene transfer of crucial transcription factors for rod cell fate designations[15].
Previous studies have demonstrated that neuroinflammation plays a crucial role in the pathogenesis of glaucoma[16−19]. Pro-inflammatory factors (such as tumor necrosis factor-alpha [TNF-α] and interleukins) released from activated retinal glial cells directly induce RGC death. Additionally, excessive inflammatory responses could alter the retinal microenvironment[16−21]. Based on the facts that Müller cells perform an indispensable function in maintaining the homeostasis of the retinal internal environment and repairing retinal damage[22], we hypothesize that inflammatory factors such as TNF-α block Müller cell reprogramming through Hippo and Wnt/β-catenin signaling in the glaucomatous retina. In the present study, we investigated whether and how TNF-α modulates the Hippo and Wnt/β-catenin signaling pathways, thus affecting the proliferation and reprogramming of Müller cells in a chronic ocular hypertension (COH) experimental glaucoma mouse model.
-
In this study, all experimental animals were handled in strict accordance with the Animal Research: Reporting of In Vivo Experiments (ARRIVE) guidelines, and the Association for Research in Vision and Ophthalmology (ARVO) statement for the use of animals in ophthalmic and vision research. The Bioethical Committee of the Third Affiliated Hospital of Zhengzhou University has granted approval for this study (approval number: 2024-212-01). Adult male mice (C57BL/6J strain), aged 6–7 weeks, and neonatal C57BL/6J mice (postnatal days 5–6, P5–P6) were purchased from Changsheng Biotechnology Co., Ltd. Under a consistent temperature of 25 °C and a 12-h light/dark regimen, adult mice were given standard food and water without restriction. For this study, 179 animals were employed.
COH mouse model
-
In this study, we used a well-established COH experimental glaucoma model developed in our laboratory, which has been thoroughly validated in our previous studies[21,23]. Briefly, after the mice were deeply anesthetized by 0.6% pentobarbital sodium (Merck, Kenilworth, NJ, USA), 5 μL micromagnetic beads (BM547, Bangs Laboratories, Fishers, USA) were carefully injected into the anterior chamber utilizing a Zeiss ophthalmic surgical microscope; the opposite eye was not treated. An identical volume of physiological saline was injected into the sham-operated eye; the opposite eye was not treated. Intraocular pressure (IOP) measurement in anesthetized mice was conducted between 9:00 am and 11:00 am on different days after the operation using a hand-held digital rebound tonometer (TonoLab, Icare, Finland) to minimize circadian rhythm bias, and a difference of more than 3 mmHg in IOP between the two eyes was considered to be a qualified model of COH.
Intravitreal injections
-
Intravitreal injections were made following the protocols previously described[24]. Following anesthesia, the mice underwent pupil dilation and topical anesthesia. Subsequently, a puncture was performed 1−2 mm below the scleral margin of the cornea under a stereomicroscope (Carl Zeiss) using an insulin injection needle with a 30 G tip. A micro-syringe was then used to inject into the central part of the vitreous cavity through the puncture opening. In the experimental group, only the right eyes (glaucomatous eyes) of the mice were injected with 2 μL of 10 μM R7050, and an inhibitor TNFR1, (5432, Tocris Bioscience, Ellisville, USA). The sham-operated eyes were left untreated and used as controls. In order to avoid destroying the elevated IOP in COH mice, intravitreal injections were performed 2 d prior to the COH operation.
Primary culture of retinal Müller cells
-
Retinal primary Müller cells were derived from neonatal (P5–P6) C57BL/6J mice, which were cultured according to procedures previously described in detail[21]. Briefly, mice were euthanized with an overdose of isoflurane inhalation and then decapitated. Eyeballs were enucleated, followed by isolation and digestion of the retinas. Retinal cells were collected and cultured in an incubator with humidified 5% CO2 at 37 °C. After 2 weeks of culture, Müller cells were purified, and the identification was achieved by employing double immunofluorescence staining with anti-glutamine synthase (GS) and anti-adaptor molecule 1 (Iba1) antibodies, labeling Müller cells and microglia, respectively. The Müller cell purity was 97.7% ± 0.8%, consistent with what we reported before[21].
Western blotting
-
Western blot analysis was conducted according to previously described procedures[24]. In brief, the retinal homogenate was lysed. The concentrations of total proteins in the supernatant of the lysates were detected using the Omni-Rapid™ Rapid Protein Quantification Kit (#ZJ103, Epizyme Biotech, China). SDS-PAGE gels at 10% to 15% were used to separate proteins of different molecular weights using Mini-PROTEAN 3 (Bio-Rad, Hercules, USA). Subsequently, the proteins were transferred onto a PVDF membrane (#IPVH00010, Millipore, USA) using a Mini Trans-Blot Electrophoretic Transfer System (Bio-Rad). The membranes underwent overnight incubation with primary antibodies at a temperature of 4 °C. The following primary antibodies, purchased from Cell Signaling Technology (CST), were used: anti-GAPDH (1:10,000, #2118) , anti-YAP (1:1000, #12395), anti-phospho-YAP(Ser127) (1:1000, #4911), anti-β-catenin (1:1000, #9582), anti-phospho-β-catenin (1:1000, #9567), anti-GSK3β (1:1000, #12456), anti-Stat3 (1:1000, #9139), anti-phospho-Stat3 (1:1000, #9145), anti-MST1 (1:1000, #3682), and anti-phospho-MST1/MST2 (1:1000, #49332). The antibodies from other companies are as followed: anti-phospho-GSK3β(Y216) (1:1000, #612312, BD Bioscience, USA), anti-Nestin (1:1000, #ab6320, Abcam, UK), and anti-Wnt3a (1:1000, #ab2194121, Abcam, UK). After washing, the membranes underwent incubation with secondary antibodies, which included the HRP-labeled donkey anti-rabbit antibody (1:5000, #711-035-152, Jackson ImmunoResearch Labs, West Grove, USA) and the HRP-labeled donkey anti-mouse secondary antibody (1:5000, #715-035-020, Jackson ImmunoResearch Labs), for 2 h at ambient temperature. The blots were visualized by using an enhanced chemiluminescent reagent (#WBKLS0050, Millipore), and imaged with a protein chemiluminescent developer (Bio-Rad). Quantitative analysis of the protein band grayscale values was performed with ImageJ software (NIH, Bethesda, MD, USA).
Immunofluorescence
-
Immunofluorescent staining was conducted essentially according to the method outlined in a previous study[24], with minor modifications. Briefly, for retinal tissues, eye cups from anesthetized mice were obtained and fixed in 4% paraformaldehyde at 4 °C for 2 h, and then dehydrated in 10% sucrose solution for 2 h, 20% sucrose for 2 h, and then 30% sucrose overnight at 4°C. After being embedded in OCT compounds (Tissue Tek, Torrance, CA, USA), retinas were sectioned vertically at a thickness of 14 μm on a cryostat microtome (Leica, Nussloch, Germany). Retinal slices were blocked in PBS containing 5% bovine serum albumin (BSA) and 0.1% Triton X-100 for 2 h at room temperature, and then conjugated to primary antibodies for 72 h at 4 °C. The following primary antibodies were used: anti-Nestin (1:50, # ab6320, Abcam, UK) and anti-Ascl1 (1:100, #556604, BD Pharmingen, USA). For cell culture, cultured Müller cells were fixed with 4% PFA, and then blocked in PBS containing 5% BSA and 0.1% Triton X-100 at room temperature for 2 h, followed by incubation of the primary antibodies at 4 °C: anti-GS (1:300, #MAB302, Millipore) and anti-Iba1 (1:300, #ab5076, Abcam). The secondary antibodies used in this study were as follows: Alexa Fluor 488-conjugated donkey anti-mouse (1:500, #715-545-150, Jackson ImmunoResearch Labs), Alexa Fluor 488-conjugated donkey anti-rabbit (1:500, #711-545-152, Jackson ImmunoResearch Labs), Cy™3-conjugated donkey anti- mouse (1:500, #715-165-151, Jackson ImmunoResearch Labs), and Alexa Fluor 594-conjugated donkey anti-rabbit (1:500, #711-585-152, Jackson ImmunoResearch Labs). Coverslips were sealed with an antifade sealing medium after being stained with DAPI and rinsed. The equipment used to acquire the images was a laser scanning confocal microscope (Nikon, Japan) and a two-photon confocal microscope (Carl Zeiss, Germany).
The collected immunofluorescence images were analyzed using ImageJ software (NIH, Bethesda, MD, USA) by measuring the mean gray level of the immunofluorescence signal after nonspecific background subtraction. The immunofluorescence intensity of Nestin and Ascl1 was measured both in each whole image and in Müller cells (co-localized with GS) of each image by selecting the Nestin/Ascl1-positive region that overlapped with the GS-positive region. A total of 30 images of random fields from 15 slices of 5 retinas in each group were used for the fluorescence quantification.
5-Ethynyl-2'-deoxyuridine (EdU) assay
-
EdU labeling was conducted strictly following previous experimental procedures[20]. In brief, Müller cells on cell-attached slides were treated with a medium containing 10 mM EdU for 24 h. The following steps were conducted according to the instructions of Click-iT™ EdU Cell Proliferation Kit (#C10339, Invitrogen, USA). Microscopic imaging was conducted following GS immunofluorescence staining using a confocal laser scanning microscope (Nikon), with four to six random fields acquired per sample. The ratio of EdU+/GS+ double-positive cells relative to total GS+ cells in each field was determined by performing three independent replicates.
RNA extraction and quantitative PCR
-
Methods for RNA extraction and quantitative PCR (qPCR) of primary Müller cells and retinas have been described in previous reports[20,21]. During the PCR reaction, the cycles started with a 10-min denaturation at 95 °C, followed by 50 cycles of 95 °C for 15 s, and 60 °C for 60 s. The 2−ΔΔCᴛ method was used for relative quantification. All samples were assayed in triplicate. The forward and reverse primer sequences used in this study are as follows: CCND1 forward: 5'-ATGTTCGAGGCGCGCCTGGTC-3'; CCND1 reverse: 5'-CTAAGATCCTTCTTCA TCCTC-3'; CCND2 forward: 5'-TACCTGGACCGTTTCTTGGC-3'; CCND2 reverse: 5'-CCTGA GGCTTGATGGAGTTGT-3'; GAPDH forward: 5'-GGAGCGAGATCCCTCCAAAAT-3'; GAPDH reverse: 5'-GGCTGTTGTCATACTTCTCATGG-3'.
Statistical analysis
-
Data analysis was conducted using GraphPad Prism (v9.05, Graphpad Software, La Jolla, CA, USA). The data were presented as mean ± SEM. In all animal experiments, n indicates the number of independent animals (one eye per animal). Appropriate statistical tests, including one-way ANOVA and paired t-tests, were applied. In all tests, p-values less than 0.05 were considered statistically significant.
-
A stable and repeatable COH mouse model was produced, similar to that previously reported[21]. The average IOP in operated eyes of COH mice was significantly higher than that in contralateral eyes and sham-operated eyes from the fourth post-operative day (G4d) to the fourth week (G4w) (Fig. 1a). We quantified the dynamic changes in mRNA levels of TNF-α in COH retinas. Our qPCR results showed that the levels of TNF-α were increased to 846.4% ± 154.9% (n = 6, p = 0.0003), and 534.2% ± 137.9% (n = 7, p = 0.0471) of control (Ctr), at G1w and G2w, respectively, and then declined to control levels (Fig. 1b).
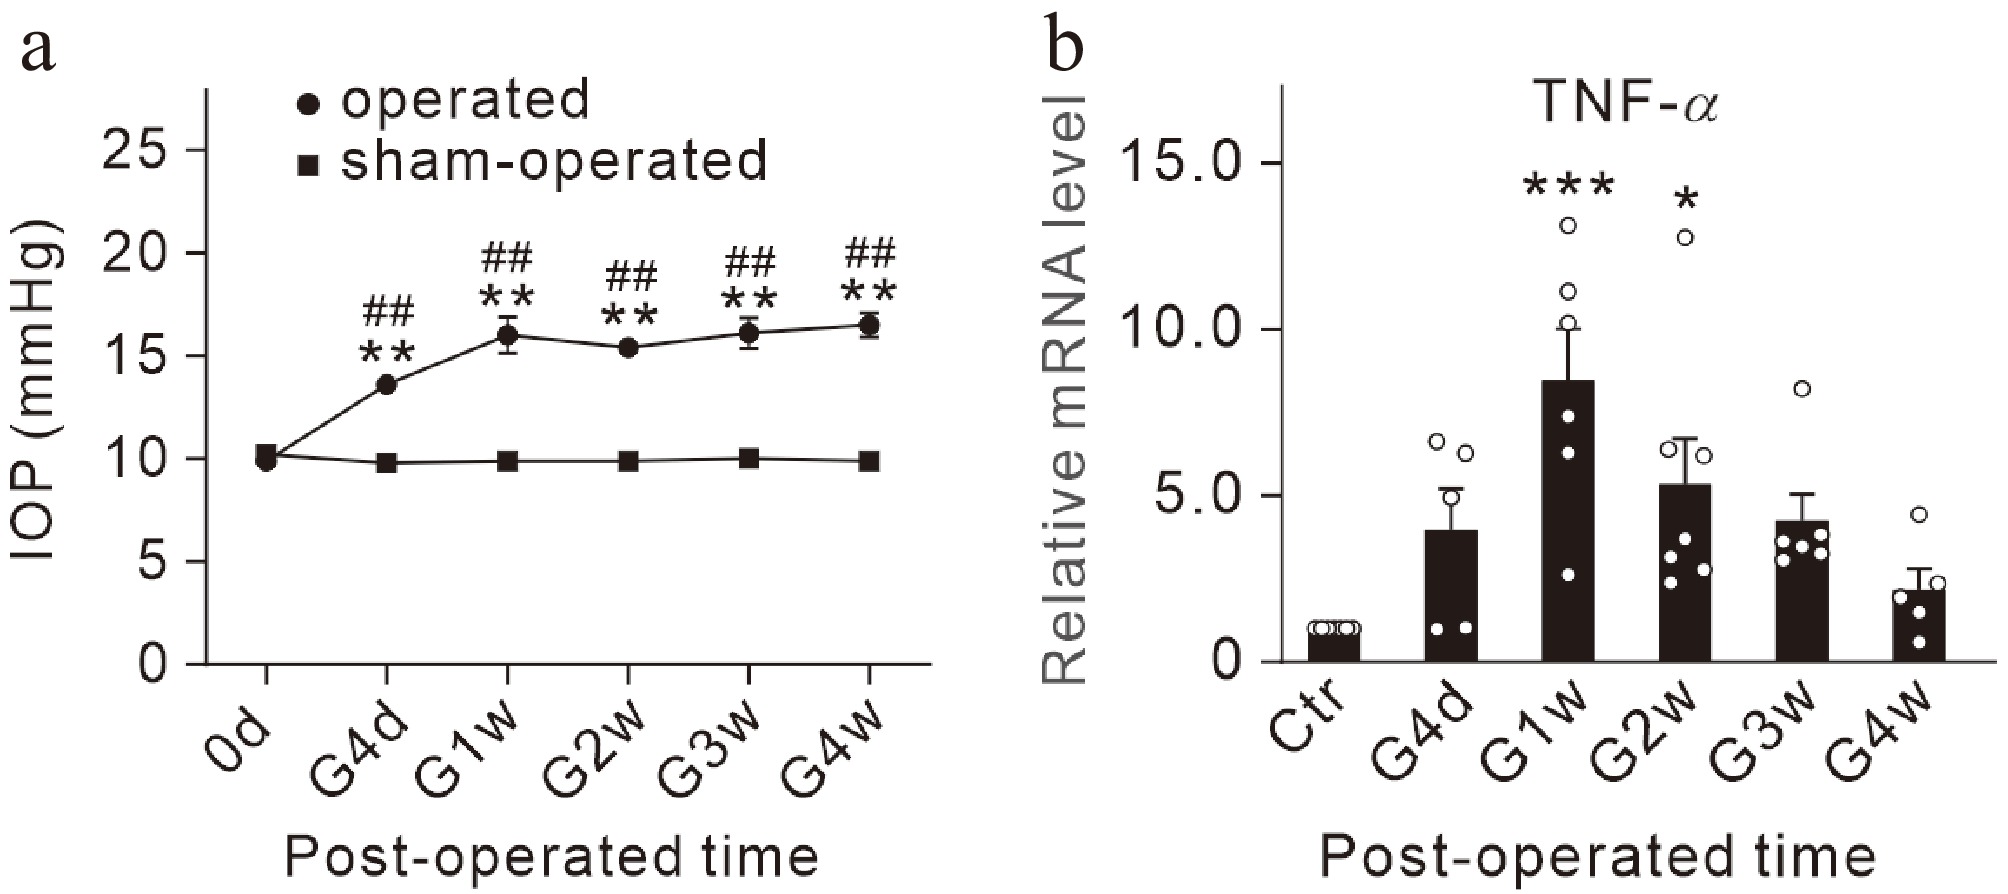
Figure 1.
Dynamic changes in mRNA levels of TNF-α in COH retinas. (a) Changes of IOP values in sham-operated and operated eyes. n = 10 for each group. ** p < 0.01 vs. 0 d; ## p < 0.01 vs. sham-operated eyes at the same time point. (b) Bar graph summarizing the average TNF-α mRNA levels in COH mice at different post-operational times. n = 5~7 for each group; * p < 0.05, and *** p < 0.001 vs. the data before operation (control, Ctr).
TNF-α inhibits the activities of β-catenin and YAP in COH retinas
-
Previous studies have shown that β-catenin is a key effector in the classical Wnt/β-catenin pathway that regulates gene transcription[25,26]. YAP has been shown to be ubiquitously distributed in many ocular tissues (e.g., cornea, lens, and retina) and is a key effector molecule and regulatory endpoint of the Hippo signaling pathway[27,28]. We explored whether IOP elevation in COH mice affects the Wnt/β-catenin and Hippo pathways by examining the changes in protein levels of β-catenin and YAP. Given that β-catenin and YAP are constantly being synthesized and degraded by phosphorylation within cells[29,30], the phosphorylated protein/total protein ratio of them was calculated, respectively, to represent the activation status of the two signaling pathways. It is noted that decreased phosphorylation of β-catenin and increased phosphorylation of YAP indicate the activation of the two signaling pathways. As shown in Fig. 2, the protein level of p-β-catenin was significantly increased at 4 d post-operation (G4d) (142.4% ± 10.1% of Ctr, n = 5, p = 0.0348), and then declined to the control (Fig. 2a, b) although no significant difference in β-catenin protein levels was detected at different post-operative time points (Fig. 2a, c). This resulted in an increased p-β-catenin/β-catenin ratio at G2w (119.0% ± 6.8% of Ctr, n = 5, p = 0.0225) (Fig. 2d). Additionally, an increase in p-YAP proteins was observed (145.8% ± 14.1% of Ctr, n = 6, p = 0.0262, and 147.9% ± 15.5% of Ctr, n = 6, p = 0.0179), at G4d and G1w, respectively, while it decreased at G4w (56.0% ± 8.0% of Ctr (n = 6, p = 0.0375) (Fig. 2e, f). The total YAP proteins were increased to 132.1% ± 8.1% of Ctr (n = 6, p = 0.0383) at G4d, followed by a decrease, which was lower than the control at G2w (68.0% ± 6.1% of Ctr, n = 6, p = 0.0453), and thereafter (Fig. 2e, g), which resulted in an increase in the p-YAP/YAP ratio at G2w (117.4% ± 6.4% of Ctr, n = 6, p = 0.0221) (Fig. 2e, h). These results suggest that the Hippo signaling pathway in COH retina is activated, while Wnt/β-catenin may be inhibited.
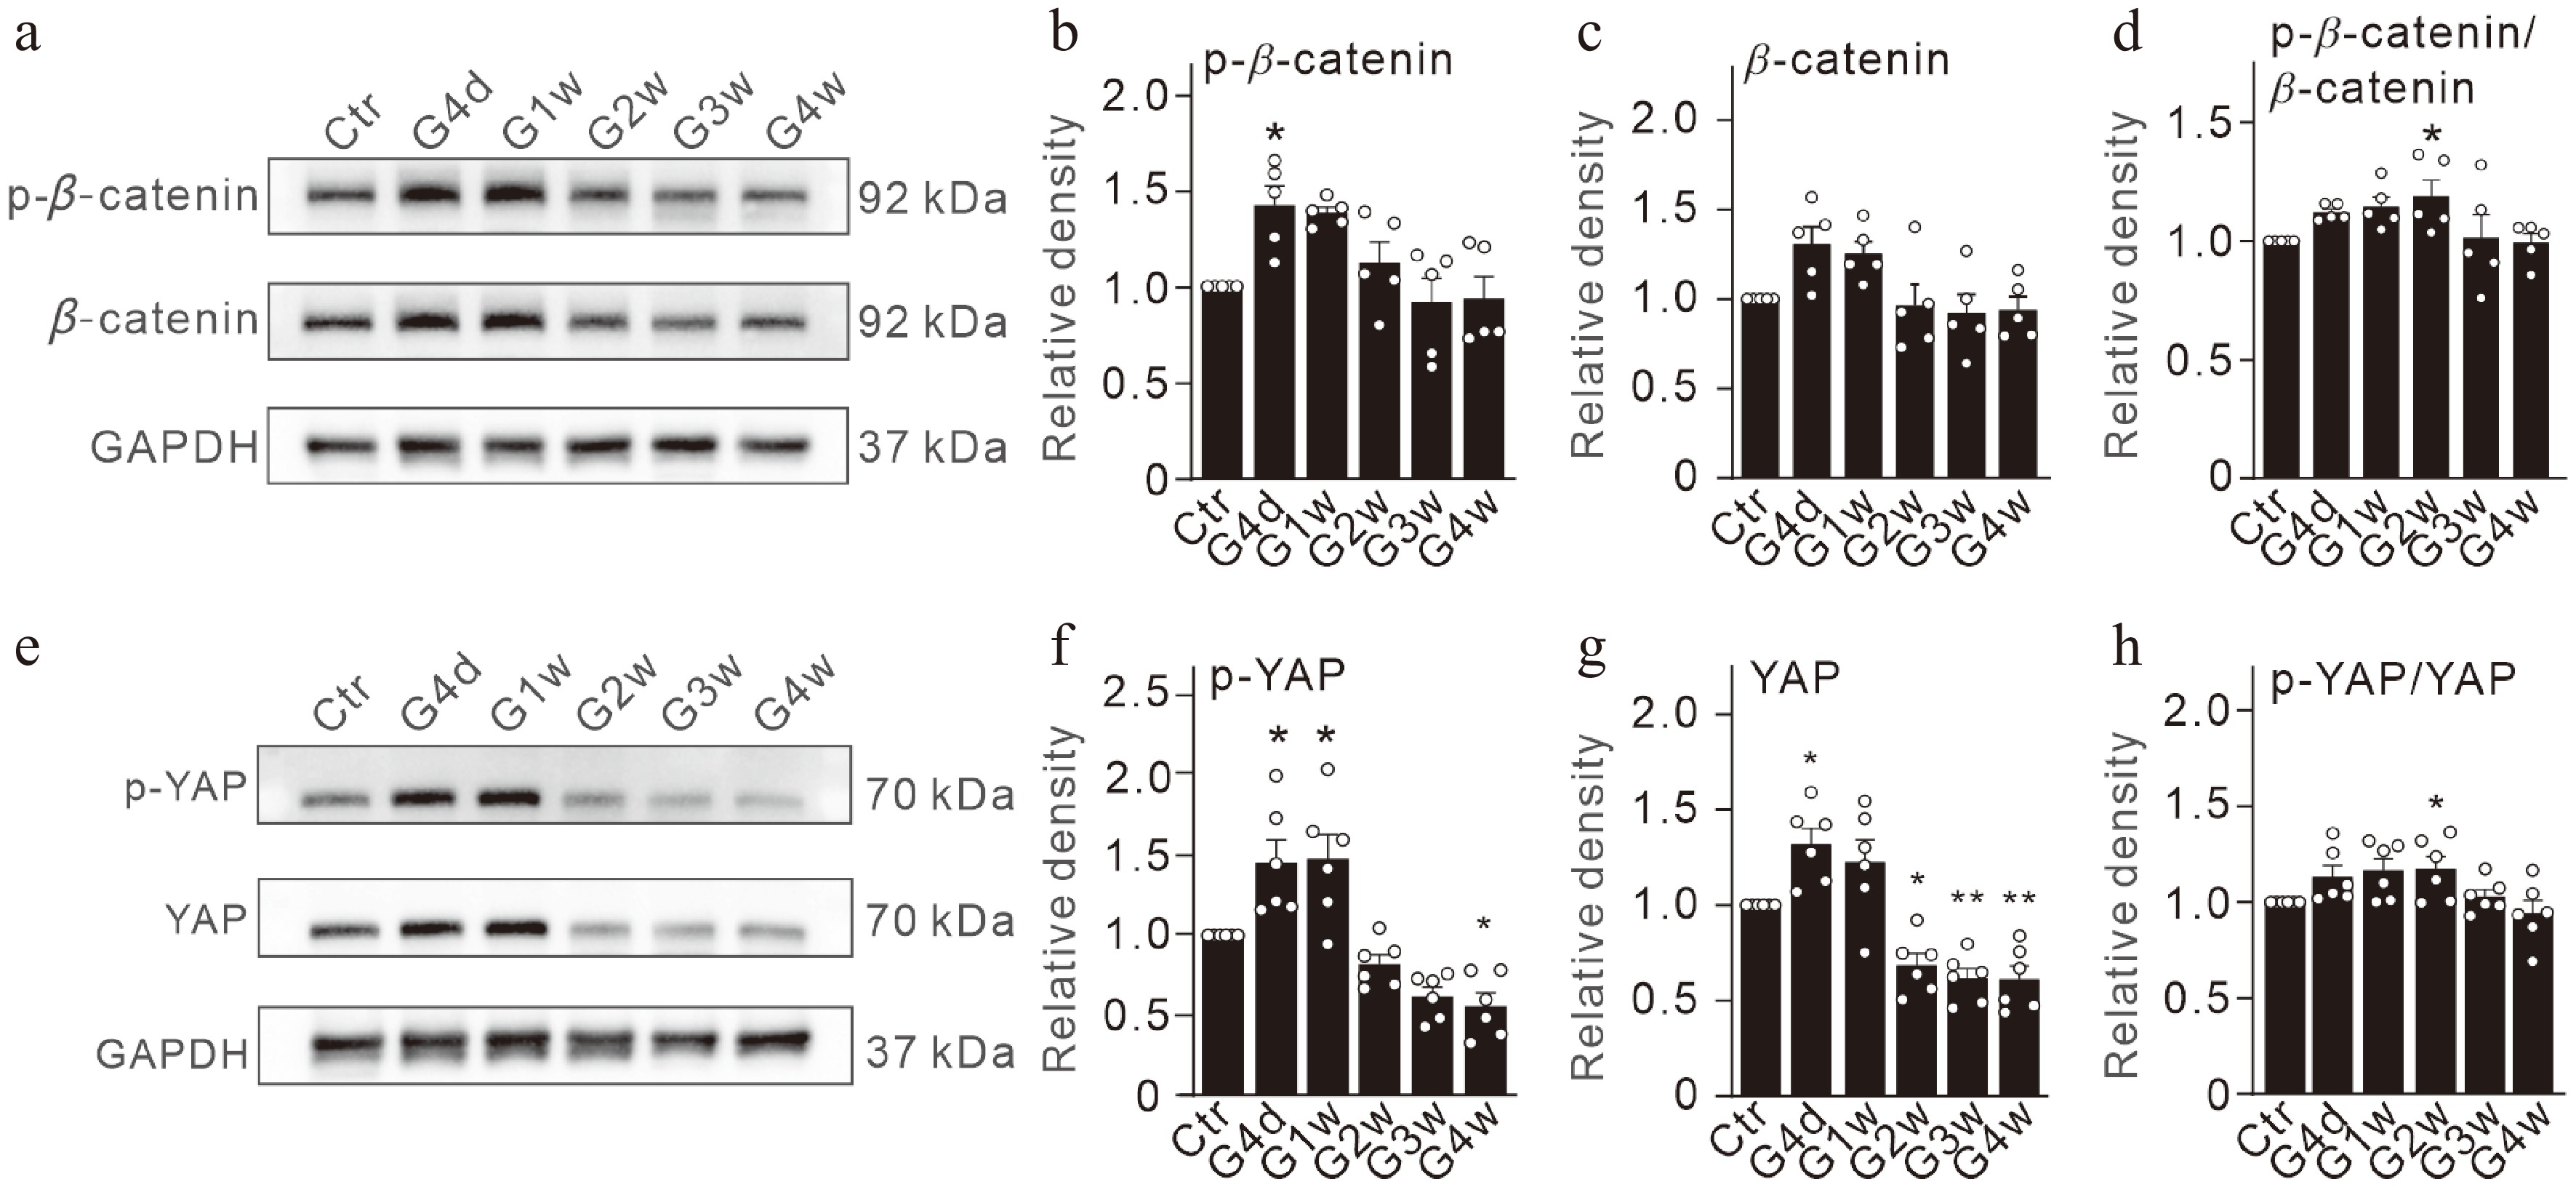
Figure 2.
Changes in the expression of β-catenin and YAP in COH retinas. (a) Representative immunoblots showing changes in p-β-catenin and β-catenin in retinas at different times after the operation (G4d, G1w, G2w, G3w, G4w). (b)−(d) Quantitative comparisons of the mean relative optical densities of immunoreactive bands of (b) p-β-catenin, (c) β-catenin, and (d) p-β-catenin/β-catenin ratios under the conditions as shown in panel (a). All data are normalized to their corresponding GAPDH and then to the control (Ctr). (e) Representative immunoblots showing changes in p-YAP and YAP in retinas at different times after the operation (G4d, G1w, G2w, G3w, G4w). (f)−(h) Quantitative comparisons of the mean relative optical densities of immunoreactive bands of (f) p-YAP, (g) YAP, and (h) p-YAP/YAP ratios under the conditions as shown in panel (e). All data are normalized to their corresponding GAPDH and then to Ctr. n = 5~6 for each group. * p < 0.05, and ** p < 0.01 vs. Ctr.
We then studied whether TNF-α had an effect on the protein expression levels of β-catenin and YAP. R7050, a TNF receptor 1 (TNFR1) antagonist[24] was intravitreally pre-injected before the COH model was made. As shown in Fig. 3, no significant changes in β-catenin and YAP protein levels occurred in R7050 pre-injected COH retinas as compared to the saline injection. The level of p-β-catenin proteins showed a decrease in the R7050 group at G2w (73.5% ± 14.1% of Ctr, n = 5, p = 0.0277), and p-β-catenin/β-catenin and p-YAP/YAP ratios in R7050 group were reduced to 91.0% ± 17.8% of control (n = 5, p = 0.0324) and 106.2% ± 9.0% of control (n = 6, p = 0.0214) at G2w (Fig. 3a–g). Overall, these results suggest that increased TNF-α in COH retinas may modulate the activities of Wnt/β-catenin and Hippo/YAP signaling.
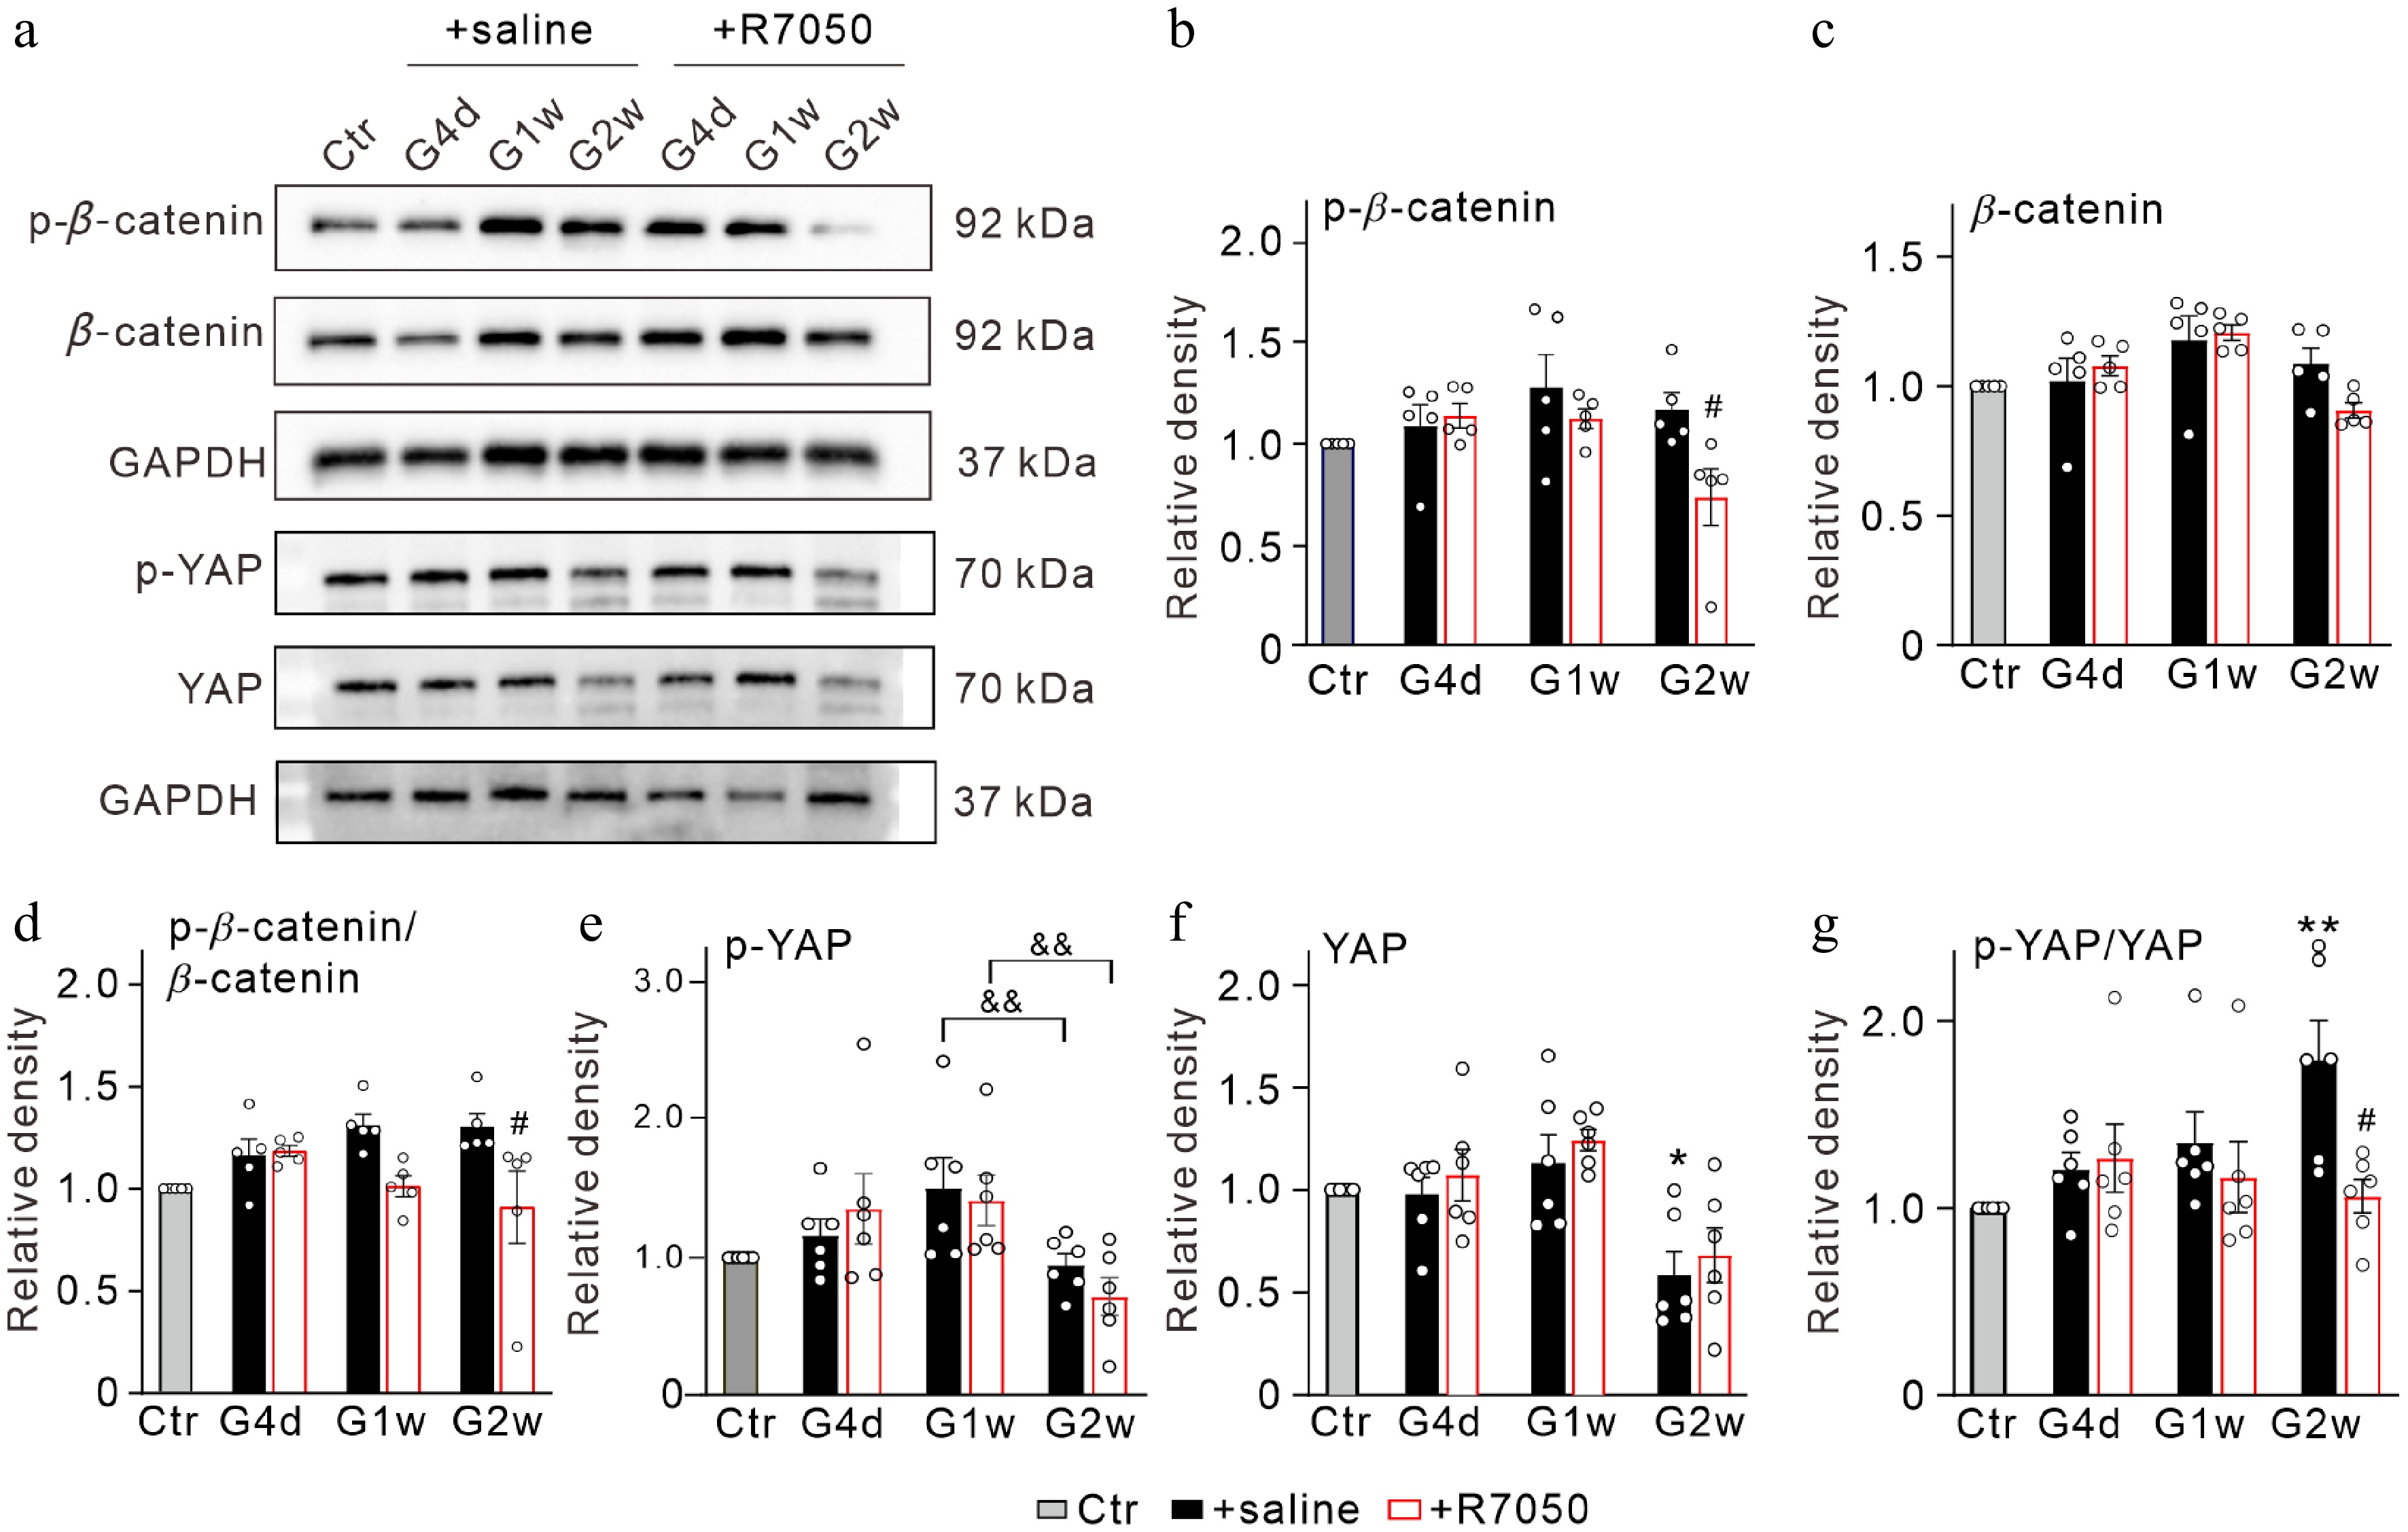
Figure 3.
TNF-α-mediated changes in β-catenin and YAP in COH retinas. (a) Representative immunoblots showing the changes in β-catenin and YAP expression in control (Ctr) and COH retinas with intravitreal injections of saline (2 μL) or 10 μM R7050 (2 μL) at different times postoperatively (G4d, G1w, G2w). (b)–(d) Bar charts comparing the average relative optical densities of immunoreactive bands of (b) p-β-catenin, (c) β-catenin, and (d) p-β-catenin/β-catenin ratios under the conditions as shown in panel (a). (e)–(g) Bar charts comparing the average relative optical densities of immunoreactive bands of (e) p-YAP, (f) YAP, and (g) p-YAP/YAP ratios under the conditions as shown in panel (a). All data are normalized to corresponding controls. n = 5~6 for each group. * p < 0.05, and ** p < 0.01 vs. Ctr; # p < 0.05 vs. corresponding + saline group at the same time point; && p < 0.01.
TNF-α-mediated modulation of Wnt/β-catenin and Hippo/YAP signaling pathways in activated primary Müller cells
-
Changes in Wnt/β-catenin and Hippo/YAP signaling pathways in COH retinas may occur in various cells. We further investigated whether TNF-α modulates the Hippo/YAP and Wnt/β-catenin signaling pathways in activated primary cultured Müller cells. Primary cultured Müller cells were activated by group I metabotropic glutamate receptor (mGluR I) agonist DHPG[31,32].
We first examined the changes in Wnt3a, one of the representative members of the Wnt family[30]. In primary cultured Müller cells, treatment with TNF-α, DHPG, and DHPG + TNF-α did not significantly change Wnt3a protein levels, while Wnt3a expression was increased when R7050 was added in the DHPG + TNF-α group (182.7% ± 22.5% of the control, n = 4, p = 0.0018 vs DHPG + TNF-α) (Fig. 4a, b). Glycogen synthase kinase-3β (GSK3β) is downstream of Wnt signaling. Active phosphorylated GSK3β(Tyr216) (p-GSK3β) inhibits the activity of β-catenin[33−35]. Western blot results revealed that total GSK3β proteins showed an increased tendency when R7050 was added to TNF-α-treated activated Müller cells, whereas p-GSK3β levels remained unchanged, which resulted in a decreased p-GSK3β/GSK3β ratio (69.0% ± 11.3% of the control, n = 4, p = 0.0213 vs. DHPG + TNF-α) (Fig. 4b–f). In addition, β-catenin protein levels in DHPG-activated Müller cells were elevated by TNF-α treatment (118.1% ± 6.9% of control, n = 4, p = 0.0339 vs. TNF-α), and further increased to 124.7% ± 7.4% of the control (n = 4, p = 0.0089 vs. TNF-α) (Fig. 4g, h). Furthermore, p-β-catenin in activated Müller cells treated with TNF-α was increased to 117.4% ± 4.7% of the control (n = 4, p = 0.0168), which was reversed to 76.7% ± 1.3% of the control when R7050 was added (n = 4, p < 0.0001 vs. DHPG + TNF-α, and p < 0.01 vs Ctr) (Fig. 4g, i). The ratio of p-β-catenin/β-catenin was elevated in DHPG-pre-activated Müller cells after TNF-α intervention (117.4% ± 4.7% of the control, n = 4, p = 0. 0168 vs. Ctr), whereas addition of R7050 treatment significantly decreased p-β-catenin/β-catenin ratio to 76.7% ± 1.3% of the control (n = 4, p < 0.0001 vs. DHPG + TNF-α) (Fig. 4g, j).
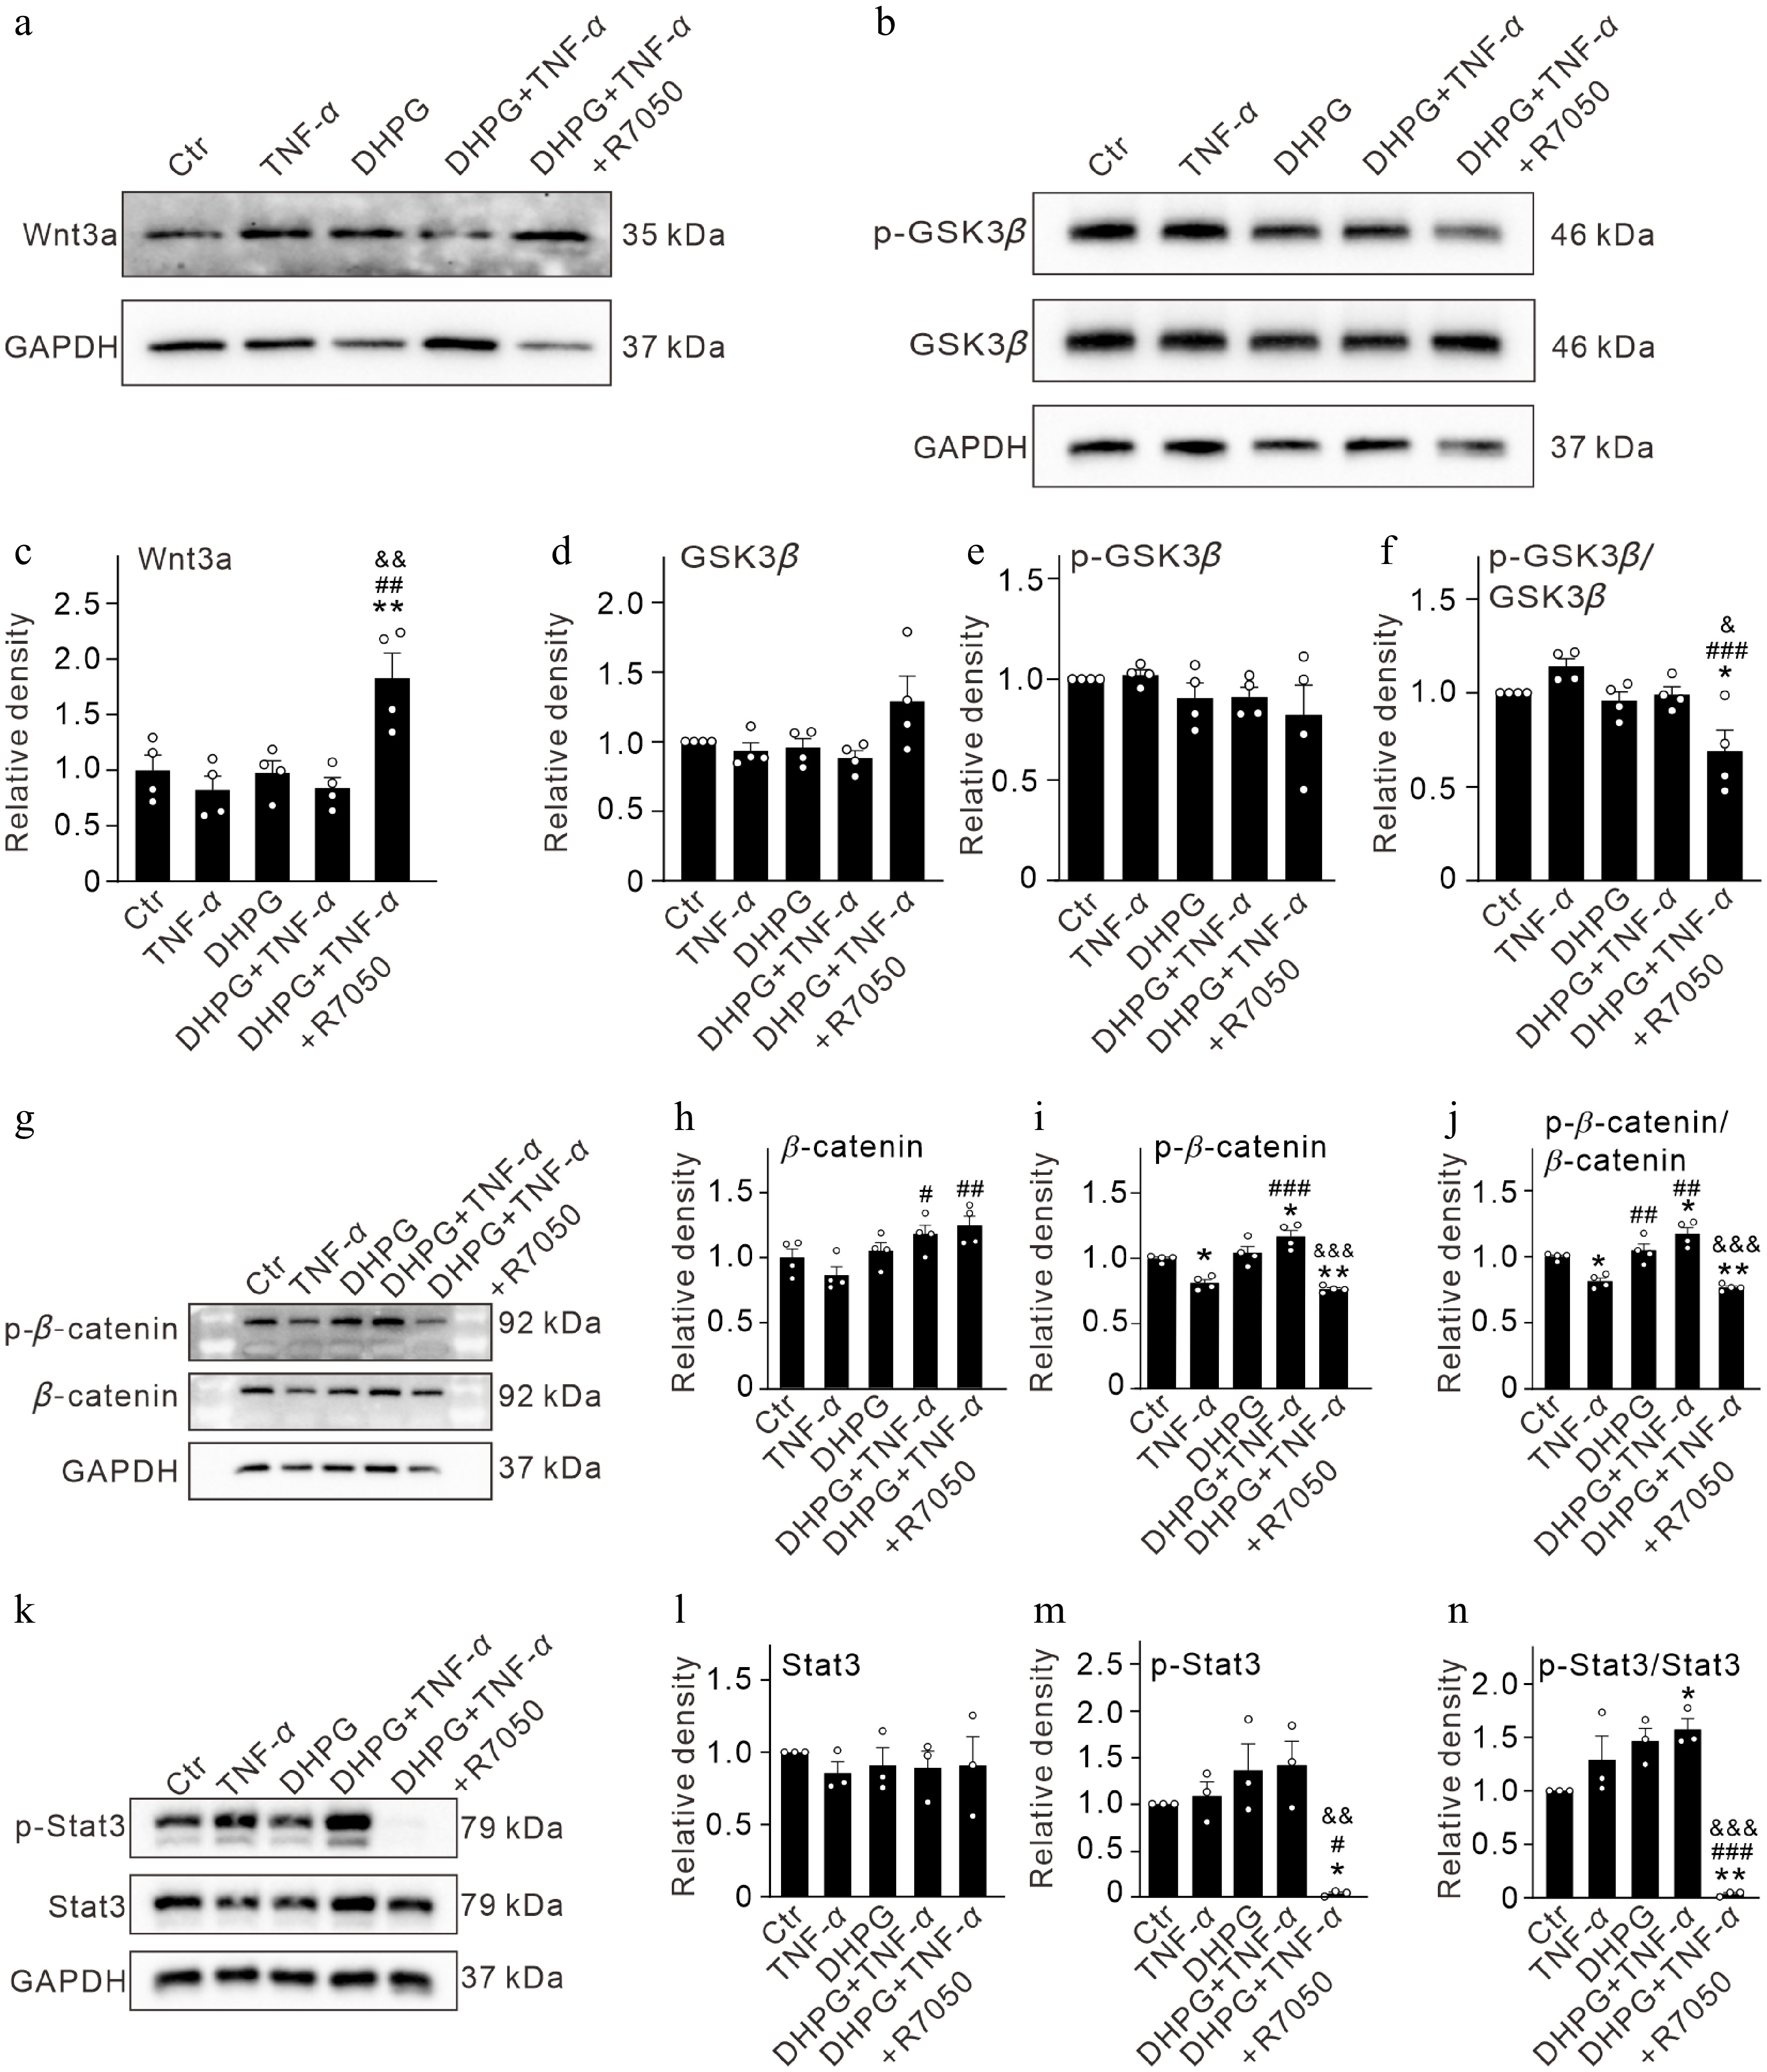
Figure 4.
TNF-α inhibits Wnt/β-catenin signaling pathways in activated Müller cells through activating TNFR1. (a) Representative immunoblots showing the changes in protein levels of Wnt3a in control (Ctr) and activated Müller cells (pretreated by 100 μM DHPG for 12 h) after treatment with TNF-α (10 ng/mL) and TNF-α + R7050 (10 μM) for 24 h. (b) Bar graphs summarizing the quantification of the average optical density of immunoreactive bands of Wnt3a proteins under different conditions as shown in panel (a). (c) Representative immunoblots showing the changes in protein levels of p-GSK3β and GSK3β in control (Ctr) and activated Müller cells (pretreated by 100 μM DHPG for 12 h) after treatment with TNF-α (10 ng/mL) and TNF-α + R7050 (10 μM) for 24 h. (d)–(f) Bar graphs summarizing the quantification of the average optical density of immunoreactive bands of p-GSK3β and GSK3β proteins, and p-GSK3β/GSK3β ratios under different conditions as shown in panel (c). (g) Representative immunoblots showing the changes in protein levels of p-catenin and catenin in control (Ctr) and activated Müller cells (pretreated by 100 μM DHPG for 12 h) after treatment with TNF-α (10 ng/mL) and TNF-α + R7050 (10 μM) for 24 h. (h)–(j) Bar graphs summarizing the quantification of the average optical density of immunoreactive bands of p-β-catenin and β-catenin proteins, and p-β-catenin/β-catenin ratios under different conditions as shown in panel (g). (k) Representative immunoblots showing the changes in protein levels of p-Stat3 and Stat3 in control (Ctr) and activated Müller cells (pretreated by 100 μM DHPG for 12 h) after treatment with TNF-α (10 ng/mL) and TNF-α + R7050 (10 μM) for 24 h. (h)–(j) Bar graphs summarizing the quantification of the average optical density of immunoreactive bands of p-Stat3 and Stat3 proteins, and p-Stat3/Stat3 ratios under different conditions as shown in panel (k). n = 3–4 for each group. * p < 0.05, and ** p < 0.01 vs. Ctr. ## p < 0.01, ### p < 0.001 vs. TNF-α. & p < 0.05, && p < 0.01, &&& p < 0.001 vs. DHPG + TNF-α.
Signal transducer and activator of transcription 3 (Stat3) regulates a variety of cellular functions, including inflammation, immune response, and glial cell response[36,37]. Activated Stat3 (p-Stat3) enables NF-κB dimers to enter the nucleus and bind to specific target genes that mediate inflammatory responses[36,38]. Stat3 expression was stable in primary cultured Müller cells with different treatments (Fig. 4k, l). Although no change in p-Stat3 was observed in the DHPG + TNF-α group, it dramatically decreased to 3.9% ± 1.7% of the control in the DHPG + TNF-α + R7050 group (n = 3, p = 0.0025 vs DHPG + TNF-α) (Fig. 4k, m). The ratio of p-Stat3/Stat3 was increased by TNF-α in DHPG-activated Müller cells (157.6% ± 10.0% of the control, n = 3, p = 0.0461 vs Ctr). This elevated ratio of p-Stat3/Stat3 was significantly reduced after R7050 treatment (3.8% ± 1.3% of the control, n = 3, p < 0.0001 vs DHPG + TNF-α) (Fig. 4n). This suggests that Stat3 signaling may be involved in the TNF-α-induced inhibition of the Wnt/β-catenin signaling and activation of the Hippo signaling in activated Müller cells.
Next, we explored the changes in the levels of YAP and its upstream protein mammalian sterile20-like kinases 1 (MST1) in primary Müller cells under different conditions by Western blotting. As shown in Fig. 5, the MST1 protein levels remained unchanged among different groups (Fig. 5a, b). p-MST1 showed a slight increase in the DHPG + TNF-α group, which was reduced to 62.5% ± 8.6% of the control (n = 3, p = 0.0497 vs DHPG + TNF-α (Fig. 5a, c). Accordingly, the ratio of p-MST1/MST1 was significantly elevated in the DHPG + TNF-α group (164.7% ± 30.5% of the control, n = 3, p = 0.032 vs TNF-α alone), which was reversed to 74.8% ± 9.8% of the control by R7050 (n = 3, p = 0.0139 vs. DHPG + TNF-α) (Fig. 5d).
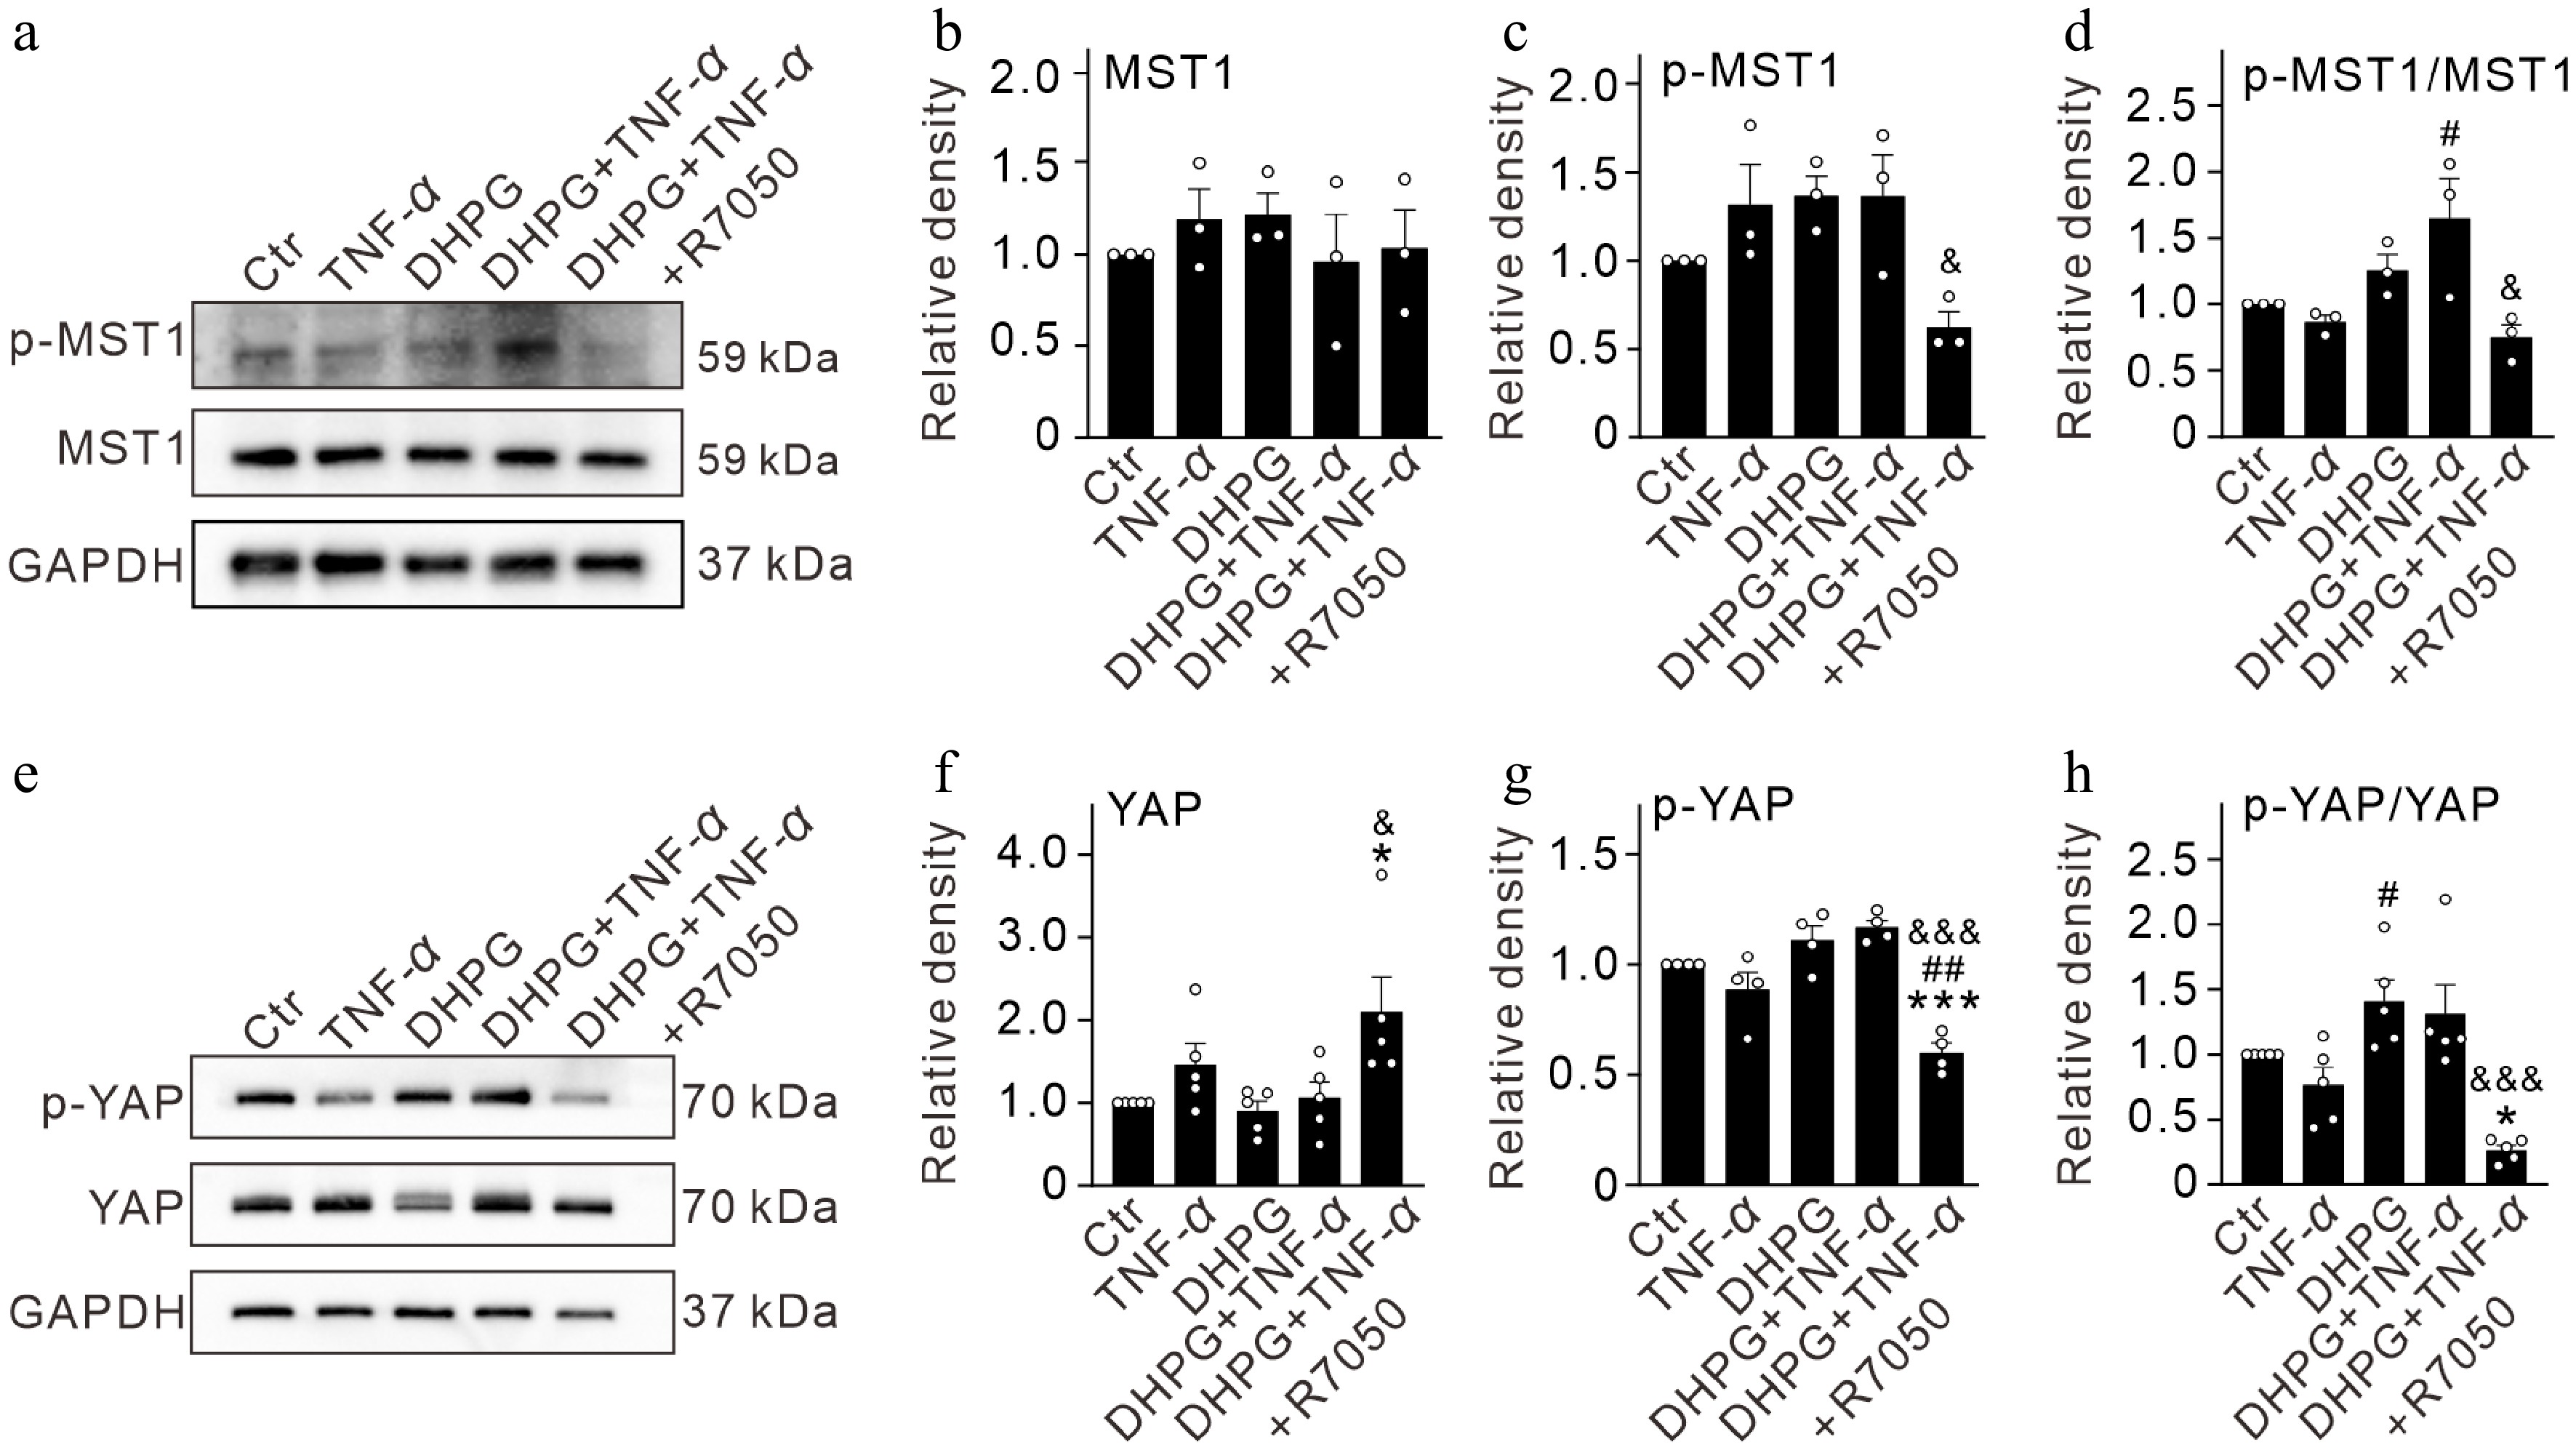
Figure 5.
TNF-α induced activation of Hippo signaling pathways in activated Müller cells by binding TNFR1 in vitro. (a) Representative immunoblots showing the changes in protein levels of p-MST1 and MST1 in control (Ctr) and activated Müller cells (pretreated by 100 μM DHPG for 12 h) after treatment with TNF-α (10 ng/mL) and TNF-α + R7050 (10 μM) for 24 h. (b)–(d) Bar graphs comparing the average optical density of the immunoreactive bands of MST1, p-MST1, and p-MST1/MST1 ratios under different conditions. (e) Representative immunoblots showing the changes in protein levels of p-YAP and YAP in control (Ctr) and activated Müller cells (pretreated by 100 μM DHPG for 12 h) after treatment with TNF-α (10 ng/mL) and TNF-α + R7050 (10 μM) for 24 h. (f)–(h) Bar graphs comparing the average optical density of the immunoreactive bands of YAP, p-YAP, and p-YAP/YAP ratios under different conditions. n = 3~5 for each group. * p < 0.05, and *** p < 0.001 vs. Ctr. # p < 0.05, and ## p < 0.01 vs. TNF-α, & p < 0.05, and &&& p < 0.001 vs. DHPG + TNF-α.
The YAP and p-YAP protein levels in TNF-α treated activated Müller cells did not show significant changes (Fig. 5e–g). However, addition of R7050 increased the levels of YAP to 209.8% ± 42.6% of the control (n = 5, p = 0.0475 vs DHPG + TNF-α) (Fig. 5e, g), and reduced the p-YAP levels to 60.0% ± 4.4% of the control (n = 4, p < 0.0001 vs. DHPG + TNF-α), which resulted in decreased p-YAP/YAP ratio (26.6% ± 3.9% of the control, n = 5, p = 0.0003 vs. DHPG + TNF-α) (Fig. 5e, g, h). Finally, we measured total YAP and p-YAP levels separately in nuclear and cytoplasmic fractions using a Nuclear and Cytoplasmic Protein Extraction Kit (Beyotime, P0027). Due to technical limitations of conventional low-salt extraction for chromatin-loosely-bound YAP, neither YAP nor p-YAP was detectable in nuclear fractions (Supplementary Fig. S1e). In cytoplasmic fractions, neither TNF-α nor DHPG treatment alone altered YAP or p-YAP levels (Supplementary Fig. S1a–S1c). However, combined treatments significantly increased both cytoplasmic YAP and p-YAP levels, with an unaltered p-YAP/YAP ratio indicating impaired YAP nuclear translocation (Supplementary Fig. S1a–S1d). Notably, R7050 administration markedly attenuated cytoplasmic p-YAP abundance and induced a modest, non-significant reduction in total YAP levels, collectively leading to a decreased p-YAP/YAP ratio (Supplementary Fig. S1a–S1d). These observations suggest that TNFR1 blockade modulates cytoplasmic YAP phosphorylation dynamics, thereby potentially enhancing its nuclear translocation. These results indicate that TNF-α induces shutdown of Wnt/β-catenin signaling and maintains Hippo signaling in an activated state in activated Müller cells.
TNF-α inhibits reprogramming of Müller cells through Hippo and Wnt/β-catenin signaling pathways
-
We further explored whether TNF-α could change the proliferation of primary cultured Müller cells by EdU labeling. TNF-α treatment of activated primary Müller cells reduced the percentage of EdU-positive cells (20.5% ± 1.1%, n = 3, p = 0.0419 vs. the control value of 37.13% ± 4.9%, n = 3). The percentage of EdU-positive cells was upregulated to 67.5% ± 3.8% (n = 3, p = 0.0002 vs. DHPG + TNF-α with co-application of R7050 (Fig. 6a, b). When the Hippo signaling pathway is inactivated, YAP/TAZ enters the nucleus and binds to transcription factors to promote cyclin D1 expression[13]. When Wnt signaling is activated, β-catenin enters the nucleus and binds to the cyclin D1 promoter with transcription factors such as the lymphoid enhancer-binding factor 1(LEF-1) to promote its transcription, and a large amount of expressed cyclin D1 pushes the cell into the S-phase and promotes cell proliferation[39]. Cyclin D2 is essential for maintaining adult neurogenesis, and it has been shown that ablation of cell cyclin D1 does not affect neurogenesis during development, whereas knockout of cyclin D2 results in complete loss of proliferating progenitor cells[40]. We also examined the changes in cyclin D1/D2 expression in cultured Müller cells. The qPCR results showed that TNF-α treatment of activated Müller cells did not affect the protein levels of cyclinD1 and cyclinD2; however, addition of R7050 significantly increased the protein levels to 1,021% ± 197.4% of the control (n = 3, p = 0.0002 vs. DHPG + TNF-α), and 591.7% ± 120.3% of the control (n = 3, p = 0.0055 vs. DHPG + TNF-α), respectively (Fig. 6c, d).
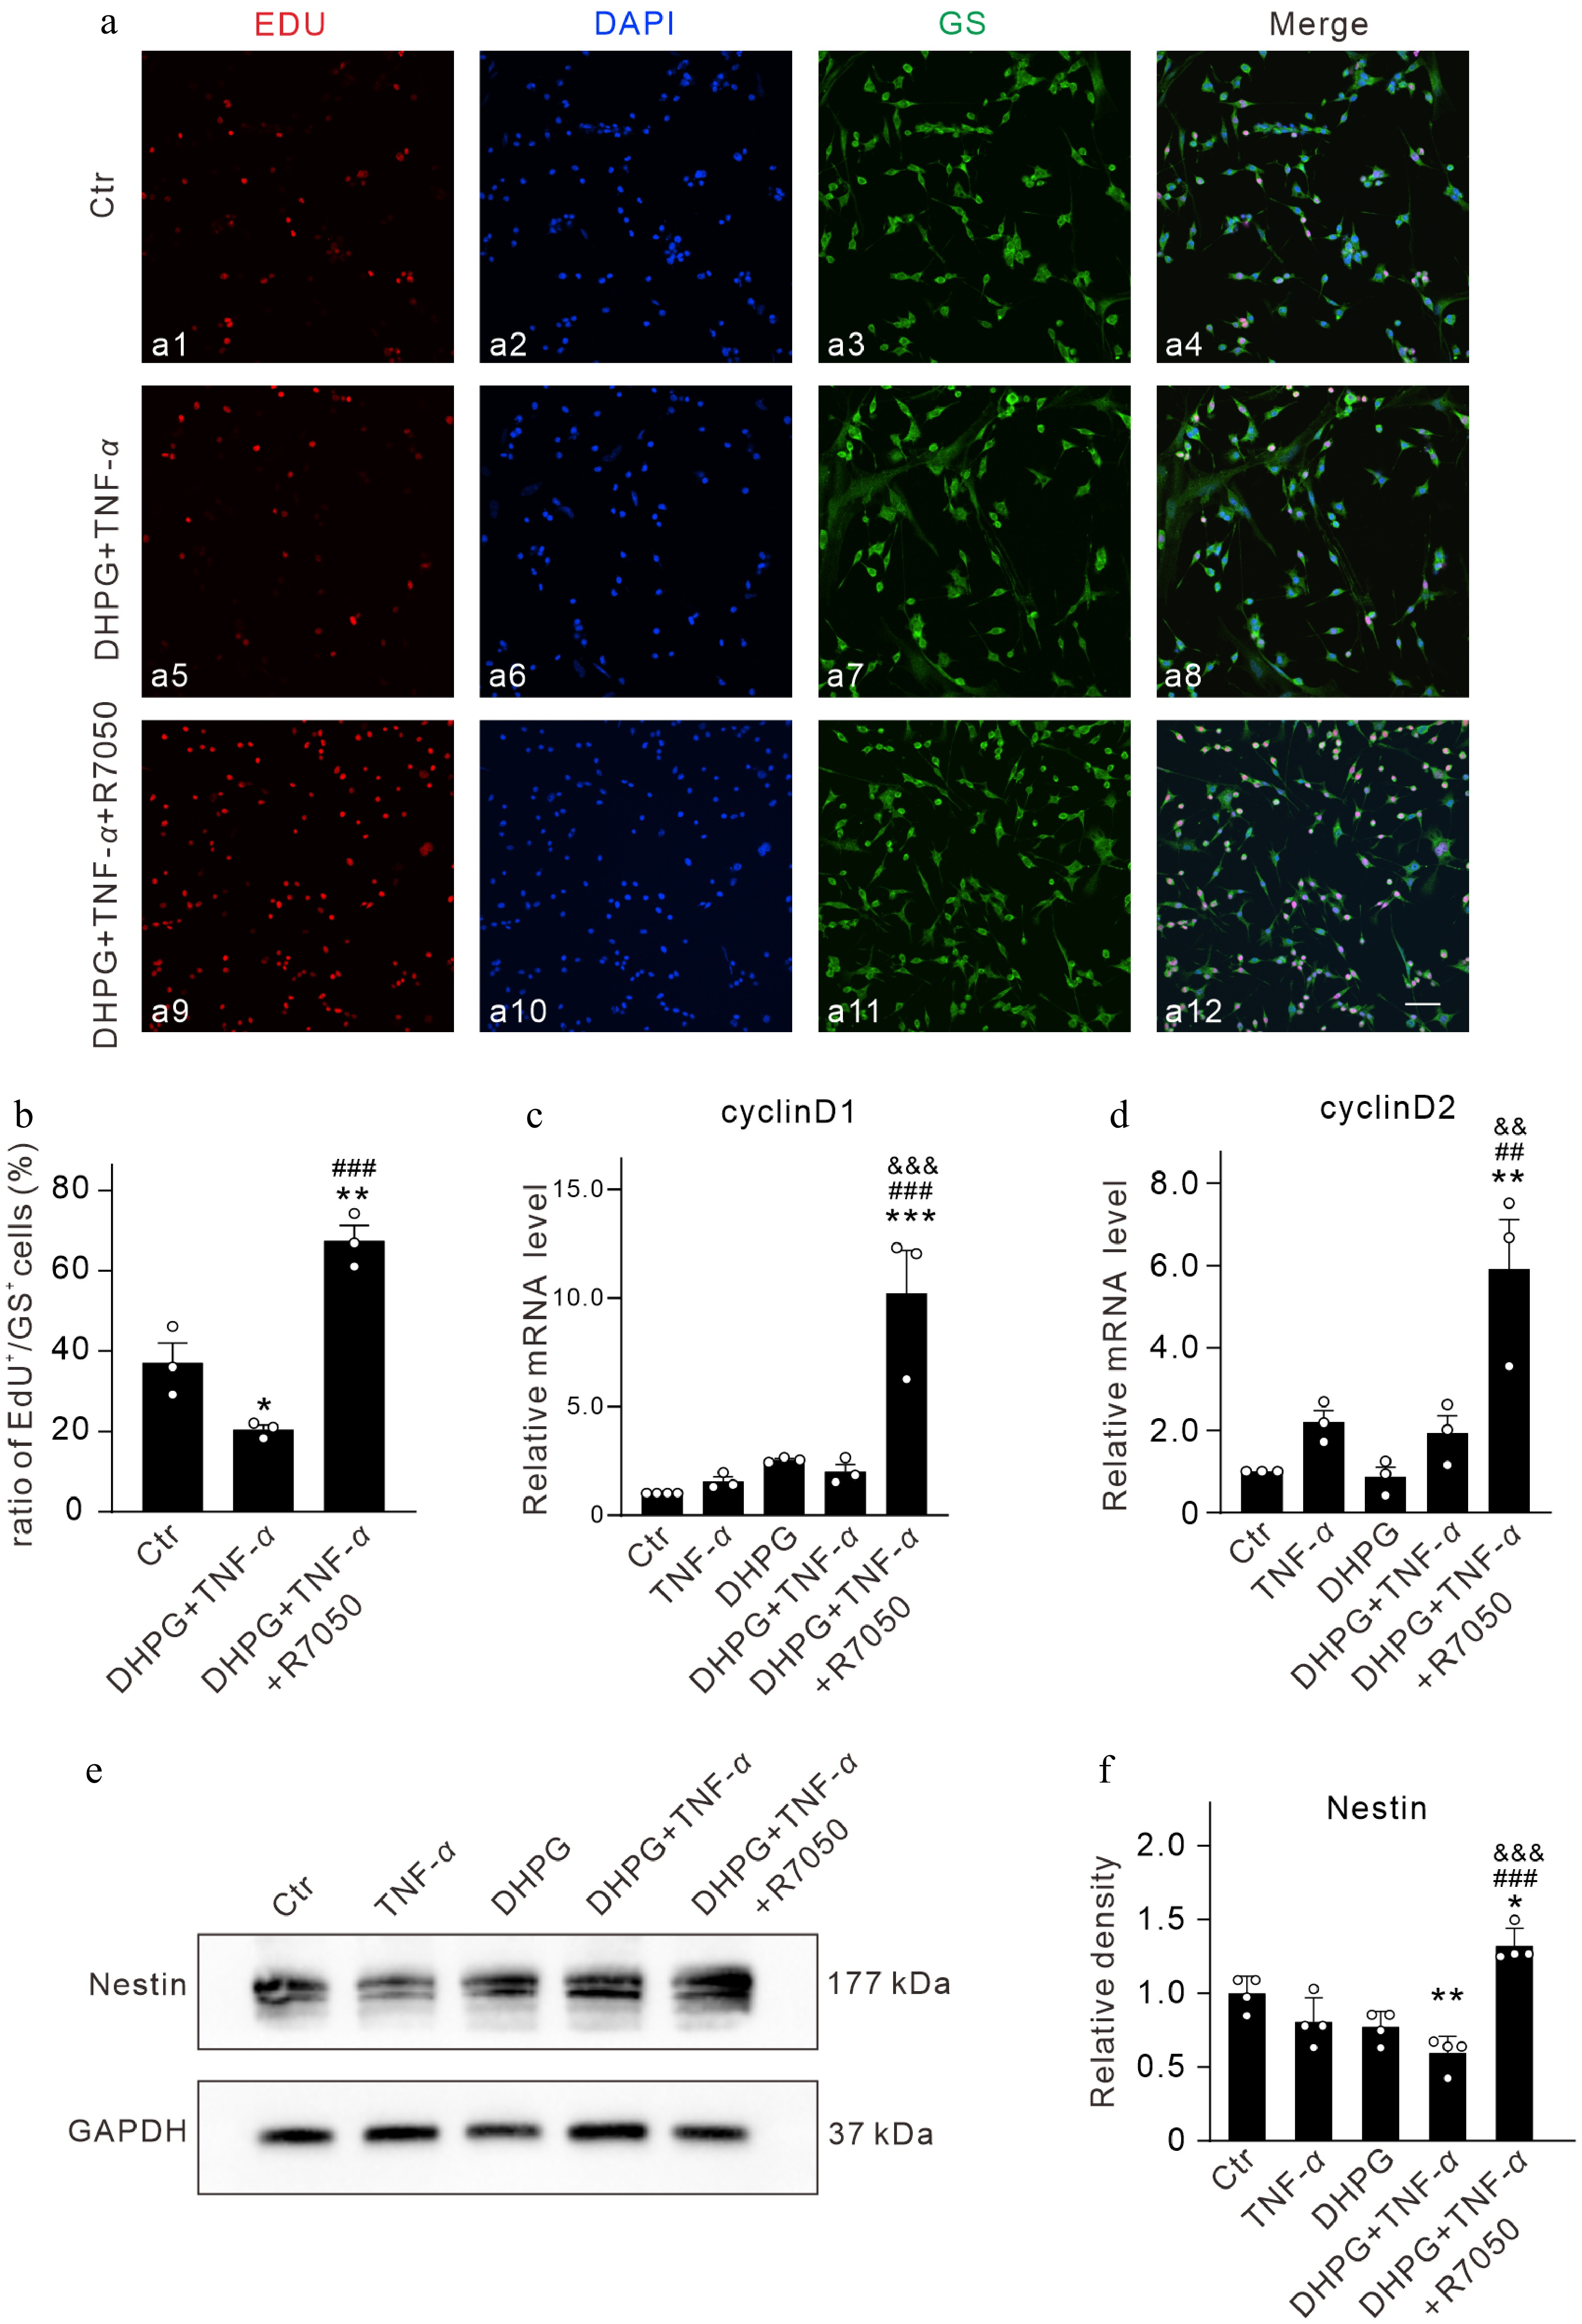
Figure 6.
TNF-α attenuates the proliferation and the ability of dedifferentiation of activated Müller cells via activating TNFR1 in vitro. (a) Representative images of EdU labeling in control (Ctr) and DHPG-activated Müller cells after treatment with TNF-α (10 ng/mL) and TNF-α + R7050 (10 μM) for 24 h. Nucleus were stained with DAPI. Scale bar is 100 μm for all images. (b) Summarized data showing the changes in percentage of Edu-labeled cells under different conditions. n = 3 for each group. * p < 0.05, and ** p < 0.01 vs. Ctr; ### p < 0.001 vs. DHPG + TNF-α. (c), (d) Bar graphs summarizing the average mRNA levels of (c) cyclinD1, and (d) cyclinD2 after 24 h of treatment with TNF-α and TNF-α + R7050. All data are normalized to corresponding controls. n = 3 for each group. ** p < 0.01, and *** p < 0.001 vs. Ctr. ## p < 0.01, and ### p < 0.001 vs. TNF-α. && p < 0.01, and &&& p < 0.001 vs. DHPG + TNF-α. (e) Representative immunoblots showing changes in Nestin expression in Ctr and DHPG-activated Müller cells after treatment with TNF-α (10 ng/mL) and TNF-α + R7050 (10 μM) for 24 h. (f) Bar graph quantifying the average density of Nestin immunoreactive bands under different conditions. All data are normalized to the Ctr. n = 4 for each group. * p < 0.05, and ** p < 0.01 vs. Ctr. ### p < 0.001 vs. TNF-α. &&& p < 0.001 vs. DHPG + TNF-α.
Nestin is a marker of cell dedifferentiation and stem cells[41−43]. Western blot analysis showed that the protein expression of Nestin was reduced by TNF-α treatment in activated Müller cells (59.3% ± 5.7% of the control, n = 4, p = 0.0028 vs Ctr), while addition of R7050 enhanced it to 132.0% ± 6.0% of the control (n = 4, p < 0.0001 vs. DHPG + TNF-α) (Fig. 6e, f). These results suggest that TNF-α may inhibit the proliferation and dedifferentiation of activated Müller cells toward neuronal progenitor cells.
Mammalian Müller cells can be reprogrammed to a neurogenic state by forced expression of the pre-neural transcription factor Ascl1[9]. We explored whether TNF-α may affect Nestin and Ascl1 expression in Müller cells of COH retinas. In vertical retinal sections, we first measured the mean fluorescent intensity of Nestin and Ascl1 immunofluorescent staining in each whole image. Both results showed no significant difference among the groups (for Nestin, n = 5, Fig. 7 a1–a3, and b; for Ascl1, n = 5, Fig. 7 d1–d3, and e). However, double immunofluorescent staining showed that the mean fluorescent intensity of Nestin in GS positive Müller cells was 34.3 ± 44.9 (n = 5) similar to the control value of 42.6 ± 2.7 (n = 5) in COH retinas at G2w, while intravitreal injection of R7050 obviously increased it to 49.2 ± 2.6 (n = 5, p = 0.0296 vs. G2w + Saline) (Fig. 7a, c). Similarly, the mean fluorescent intensity of Ascl1 in GS-positive Müller cells was 3.2 ± 0.3 (n = 5) similar to the control value of 5.4 ± 0.4 (n = 5) in COH retinas at G2w, which was increased to 8.6 ± 1.1(n = 5, p = 0.0005 vs. G2w + Saline) (Fig. 7d, f). In summary, R7050 induces transcriptional plasticity in COH retinal Müller cells, characterized by upregulation of Nestin and Ascl1, suggesting partial activation of progenitor programs when TNFR1 was blocked. These results suggest that elevated TNF-α in COH retinas may inhibit the partial shift of Müller cells toward a progenitor-like transcriptional state and their reprogramming toward stem cells.
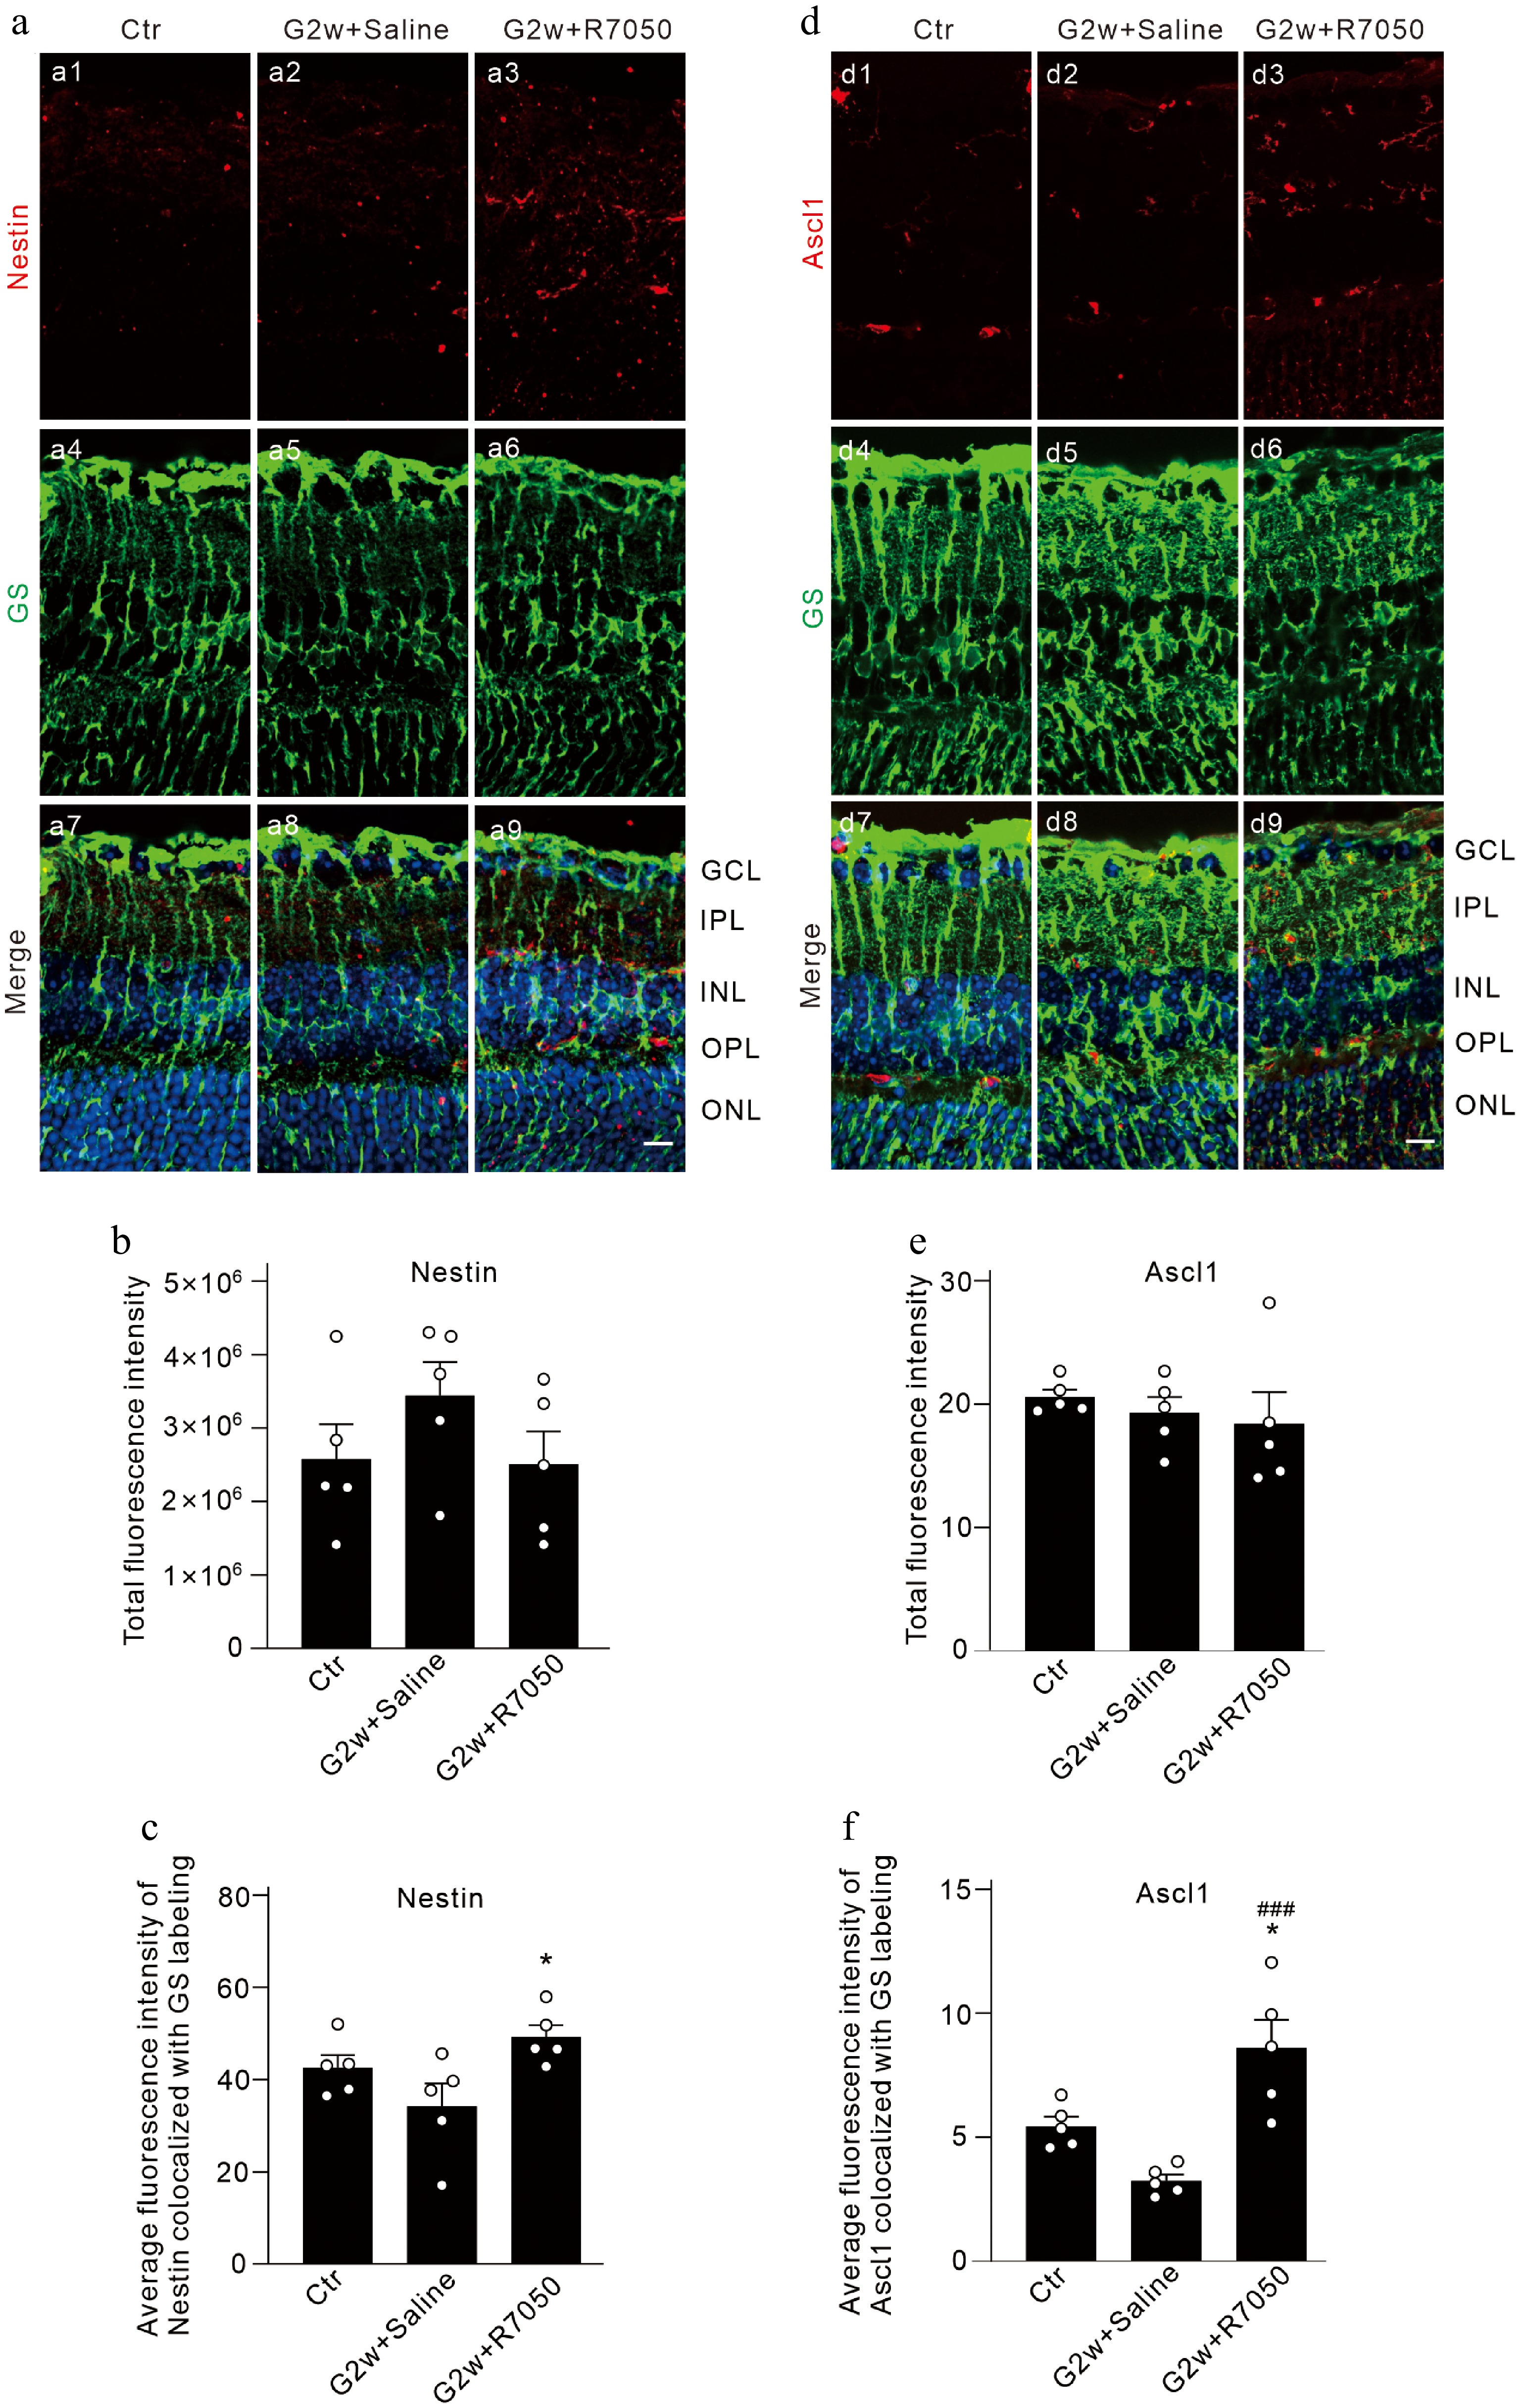
Figure 7.
TNF-α inhibits the transcriptional plasticity of COH retinal Müller cells toward stem cells. (a), (d) Representative images of (a) GS and Nestin, and (d) Ascl1 double immunofluorescence labeling in vertical sections of COH retinas with intravitreal injection of 2 μL of saline/10 μM R7050 at the 2-week time point after the operation (G2w), and retinal sections from sham-operated mice (control, Ctr). Scale bar: 10 μm for all images. (b), (e) Bar graphs comparing the average fluorescence intensity of (b) Nestin, and (e) Ascl1 immunofluorescent labeling. (c), (f) Bar graphs comparing the average fluorescence intensity of (c) Nestin, and (f) Ascl1 immunofluorescent labeling co-labeled with GS. n = 5 for each group. * p < 0.05 vs. Ctr. ### p < 0.001 vs. G2w + Saline. GCL: ganglion cell layer, IPL: inner plexiform layer, INL: inner nuclear layer, OPL: outer plexiform layer, ONL: outer nuclear layer.
-
In mammals, Müller cells undergo a short period of proliferation and extremely weak neurogenesis in states of retinal injury or disease (including glaucoma), followed by gliosis[12,44,45]. The reprogramming of Müller cells seems to be turned off by a switch of some kind, in which the Hippo and Wnt/β-catenin signaling pathways may be involved[13,46,47]. It is known that β-catenin and YAP are the key effective molecules of the classic Wnt/β-catenin and Hippo signaling pathways, respectively. In this study, we showed that a transient increase in protein levels of β-catenin, p-β-catenin, YAP, and p-YAP was observed at the early stages in COH retinas, suggesting that Müller cells tend to dedifferentiate into stem cells or precursor cells[13,14], consistent with previous reports[13,48]. With sustained IOP elevation, the expression levels of these proteins declined, and YAP protein levels were lower than those of the control, indicating that the Wnt/β-catenin signaling pathway was inhibited and the Hippo/YAP signaling pathway was activated, thus terminating Müller cell reprogramming. The changes in these two signaling pathways may result from the changes in the retinal microenvironment in COH retinas. Indeed, our results showed increased mRNA expression of TNF-α, an inflammatory cytokine, which plays an extremely important role in glaucoma[16,17,20]. In our previous study, increased protein levels of TNF-α and TNFR1 were observed by Western blotting, and elevated TNF-α was mainly observed in the retinal ganglion cell layer and the inner plexiform layer by immunofluorescence[23]. Although we observed that the mRNA levels of TNF-α in COH retinas were significantly increased 1 and 2 weeks after the IOP elevation, the increased tendency was also observed at other time points, similar to previous reports[21,23]. We speculate that the transient increase in TNF-α mRNA levels is enough to trigger the synthesis and release of TNF-α proteins from glial cells in COH retinas, thus contributing to retinal neuroinflammation. The mRNA may be degraded then by RNases or reduced through translation inhibition mediated by microRNAs[49].
The levels of p-β-catenin and p-YAP were significantly reduced when TNFR1 was blocked by intravitreal pre-injection of R7050, suggesting that TNF-α suppressed the activities of β-catenin and YAP in COH retinas. It is noted that R7050 did not completely reverse the changes of YAP expression, suggesting that there might be other factors regulating YAP expression in COH retinas. The underlying mechanism deserves to be further studied.
Since β-catenin and YAP may be expressed in many retinal cells, it is not certain that the effects of TNF-α on these key factors occurred in COH Müller cells. Therefore, we conducted a series of experiments in vitro using primary cultured Müller cells. In our previous study, we demonstrated that TNF-α exacerbates pre-existing gliosis, inhibits proliferation, and induces apoptosis in DHPG-activated Müller cells. We further showed that TNF-α induces diverse cytokine responses in normal Müller cells, which are differentially modulated by DHPG pre-activation. Notably, TNF-α-induced elevation of inflammatory factors persists at high levels in DHPG-pre-activated Müller cells[21]. In the present study, our results showed that in DHPG-activated Müller cells, the protein levels of Wnt3a and p-GSK3β were not altered by TNF-α stimulation, but co-application of R7050 and TNF-α significantly upregulated the levels of Wnt3a and decreased the levels of p-GSK3β. In the absence of Wnt, cytoplasmic β-catenin is phosphorylated by the Axin complex (mainly by p-GSK3β) and then constantly degraded through ubiquitination and a proteasome-dependent pathway[35,50], thus preventing the entry of β-catenin into the nucleus. Subsequently, the target gene transcription is repressed by the DNA-bound T cell factor/lymphoid enhancer-binding factor (TCF/LEF) family of proteins[34]. The Wnt/β-catenin pathway is activated when Wnt binds to Frizzled (Fz) and low-density lipoprotein receptor-related protein 6 (LRP6), leading to LRP6 activation and Axin complex recruitment. This inhibits β-catenin phosphorylation, stabilizes β-catenin, and allows it to accumulate and move to the nucleus, where it forms complexes with TCF/LEF and activates target gene expression[25]. We showed that TNF-α exacerbated the phosphorylation of β-catenin in DHPG-activated Müller cells, which was cancelled by blocking TNFR1, and the p-β-catenin levels were even lower than those of the control. These results are sufficient to demonstrate that TNF-α inhibits the Wnt/β-catenin signaling pathway in activated Müller cells.
In this study, we found that the levels of p-MST1 and p-YAP were reduced by co-application of R7050 and TNF-α in activated Müller cells, indicating that TNF-α exacerbated the phosphorylation of MST proteins and inhibited the activity of YAP, that is, TNF-α activated the Hippo signaling pathway in activated Müller cells. When the Hippo signaling is activated, the MST1/2 kinase (the Drosophila homolog of Hippo) and SAV1 form a complex that phosphorylates and activates LATS1/2. This activation leads to the phosphorylation and inhibition of the transcriptional coactivators YAP and TAZ, which are the primary downstream effectors of the Hippo pathway. Conversely, when Hippo signaling is inhibited, YAP/TAZ translocate to the nucleus, where they interact with TEAD1-4 and other transcription factors to promote the expression of genes that enhance cell proliferation and suppress apoptosis[47]. In the present study, we detected increased mRNA expression of established YAP target genes Cyclin D1 and Cyclin D2 following R7050 treatment. Together with our finding that TNFR1 blockade concurrently promotes YAP nuclear translocation, these data support YAP-mediated transcriptional regulation of downstream targets. While our analysis has focused on canonical cell cycle regulators, a more comprehensive characterization of YAP-dependent gene networks in Müller cells remains to be fully explored.
The molecular link between TNFR1 and Hippo pathway activation involves multiple context-dependent mechanisms. Given our observation that TNF-α induces MST1 phosphorylation in activated Müller cells, the most characterized route proceeds through TNF receptor-associated factor 2 (TRAF2)-mediated recruitment and activation of MST1 at the TNFR1 signaling complex (TNF-RSC), leading to LATS1/2-dependent YAP phosphorylation[51]. Furthermore, TNF-α-induced reactive oxygen species (ROS) can activate MST1 through TRAF2-dependent mechanisms[52]. While our data are consistent with the TRAF2-mediated mechanism, direct validation of TRAF2 recruitment to the TNF-RSC in Müller cells warrants future investigation.
Additionally, we showed that the phosphorylation level of Stat3 was reduced in activated Müller cells by the co-application of R7050 and TNF-α, suggesting Stat3 may be involved in mediating the effects of TNF-α on the proliferation and dedifferentiation of Müller cells. However, this single result is not sufficient to prove whether this signaling pathway mediates the effects of TNF-α. Further exploration of the specific roles of Stat3 deserves to be conducted in future studies.
TNF-α inhibits Müller cell proliferation and dedifferentiation toward stem cells in COH retinas
-
The Wnt/β-catenin signaling pathway and the Hippo signaling pathway play central roles in cell proliferation, differentiation, and maintenance of tissue homeostasis[28,30]. Cyclin D1 and cyclin D2 are members of the cyclin D family, which regulate the cell cycle by forming complexes with CDK4/6[53]. Cyclin D1 promotes G1 to S phase transition via Rb phosphorylation and is involved in cell proliferation, differentiation, and migration, and cyclin D2 is key to embryonic development and tissue growth[53,54]. In this study, we observed that TNF-α reduced the proliferation of DHPG-activated Müller cells, but co-application of TNF-α and R7050 elevated the proliferation of activated Müller cells by increasing the mRNA levels of cyclin D1/D2. Nestin is essential for the proliferation of neuronal progenitor cells[10]. Previous studies have demonstrated that Nestin is highly expressed in immature Müller cells, downregulated in adult Müller cells[41], and upregulated again in reactive Müller cells after retinal injury, which is thought to be a marker of dedifferentiation[41−43]. In rat retina, knockdown of Nestin in vivo inhibited Müller cell proliferation while transiently stimulating microglia/macrophage infiltration and phagocytic clearance of dead photoreceptors[10]. We showed that the protein expression of Nestin was decreased by TNF-α stimulation and increased by co-application of TNF-α and R7050 in DHPG-activated Müller cells. These results indicate that TNF-α may inhibit the proliferation and dedifferentiation of activated Müller cells by inhibiting the expression of cyclin D1 and cyclin D2.
Ascl1 is another stem cell marker. Previous studies have shown that ASCL1 is indeed expressed in Müller cells of mouse retina[9]. Pharmacological induction promotes ASCL1 expression in mouse Müller cells in injured retinas. Specific expression of ASCL1 in Müller cells via transgenic techniques can endow these cells with regenerative capabilities similar to those observed in non-mammalian species[9,45]. In the present study, we explored the expression changes of Nestin and Ascl1 in R7050-treated COH retinas by immunofluorescent staining. It is noted that the immunofluorescent intensity of Nestin or Ascl1 immunofluorescent staining in the whole image was unchanged by intravitreal injection of R7050. This may result from the specificity issues of the two mouse polyclonal antibodies, which also label the blood vessels non-specifically in mouse retinas. Thus, we manually measured the immunofluorescent intensity of Nestin and Ascl1 staining that only colocalized with GS staining. The double immunofluorescent staining results showed that Nestin and Ascl1 expression in Müller cells of COH mice were kept at similarly low levels, and intravitreal injection of R7050 increased their expression significantly, suggesting that TNF-α inhibits the partial shift of Müller cells toward a progenitor-like transcriptional state and their reprogramming toward stem cells in COH retinas through activating TNFR1. It should be mentioned that previous studies have reported that TNF-α is required for both Stat3 expression and Müller cell proliferation during zebrafish retinal regeneration[55,56], which is inconsistent with our findings. The postulated possibility is that the zebrafish possess a distinct mechanism for coping with retinal injury compared to mice, to the extent that they can rebuild the retina following injury[6].
In conclusion, our results demonstrate that TNF-α prevents Müller cell reprogramming by inhibiting the Wnt/β-catenin signaling pathway and awakening the Hippo signaling pathway via binding TNFR1 in COH mouse retinas. However, the current study has several limitations. First, the exact mechanism underlying the regulation of TNF-α on these signaling pathways and potential crosstalk between them remains to be thoroughly investigated. Second, in the complex microenvironment of mammalian retinas, whether additional synergistic or compensatory mechanisms exist has not yet been clarified. Third, whether Nestin and Ascl1 changes induced by blocking TNFR1 in COH retinas represent complete functional dedifferentiation with neuronal regenerative capacity remains to be determined. Definitive evidence would require lineage-tracing experiments to confirm the fate of these cells, as well as functional integration assays to assess whether their progeny can differentiate into functional retinal neurons and integrate into existing neural circuits. These important questions will be the focus of our future investigations, which may ultimately enable activated Müller cells to bypass direct Hippo pathway activation, overcome Wnt/β-catenin inhibition, and promote truly effective retinal regeneration in mammalian glaucomatous retinas.
-
This study was approved by the Bioethical Committee of the Third Affiliated Hospital of Zhengzhou University (approval number: 2024-212-01) on June 19, 2024. All animal procedures were conducted in strict accordance with the 3Rs principles (Replacement, Reduction, and Refinement) to minimize harm to animals.
-
The authors confirm their contributions to the paper as follows: conceptualization: Han L, Lei B, Wang Y, Wang Z; investigation, writing − original draft: Han L; writing − review and editing: Han L, Wang Y, Wang Z; data curation, methodology: Han L, Qu Y, Zhang L, Li J, Xin X, Zhang X; validation: Qu Y, Zhang L, Li J, Xin X, Zhang X, Lei B, Wang Y, Wang Z; funding acquisition: Wang Y, Wang Z; project administration: Wang Z. All authors reviewed the results and approved the final version of the manuscript.
-
The datasets generated during and/or analyzed in the current study are available from the corresponding author on reasonable request.
-
We would like to thank Dr. Xiongli Yang for helpful discussion and critical comments on the manuscript. This work was supported by the National Natural Science Foundation of China (32471057; 32271043), the Postdoctoral Research Special Fund of the Third Affiliated Hospital of Zhengzhou University (BSHQDJ2025004), the Joint Construction Project of the Henan Provincial Medical Science and Technology Research Program (LHGJ20240357), and the Natural Science Foundation of Henan Province (262300422179).
-
The authors declare that they have no known competing financial interests or personal relationships that could have appeared to influence the work reported in this paper.
-
accompanies this paper online at: https://doi.org/10.48130/vns-0026-0021.
- Supplementary Fig. S1 Analysis of p-YAP and total YAP levels in cytoplasmic and nuclear cytoplasmic fractions of Müller cells.
- Copyright: © 2026 by the author(s). Published by Maximum Academic Press, Fayetteville, GA. This article is an open access article distributed under Creative Commons Attribution License (CC BY 4.0), visit https://creativecommons.org/licenses/by/4.0/.
-
About this article
Cite this article
Han L, Qu Y, Zhang L, Li J, Xin X, et al. 2026. TNF-α modulates Hippo and Wnt/β-catenin signaling pathways in retinal Müller cells in experimental glaucoma. Visual Neuroscience 43: e023 doi: 10.48130/vns-0026-0021 

TNF-α modulates Hippo and Wnt/β-catenin signaling pathways in retinal Müller cells in experimental glaucoma
- Received: 24 October 2025
- Revised: 08 April 2026
- Accepted: 29 April 2026
- Published online: 31 May 2026
Abstract: Hippo and Wnt/β-catenin signaling are associated with retinal Müller cell proliferation and dedifferentiation into stem cells (precursor cells). However, in mammals, Müller cells are difficult to dedifferentiate into stem cells in retinal injury and diseases, which may be related to the altered retinal microenvironment. TNF-α is a major inflammatory cytokine released by activated retinal glial cells in glaucoma. Here, we investigated the roles and underlying mechanisms of TNF-α on Hippo and Wnt/β-catenin signaling in chronic ocular hypertension (COH) experimental glaucoma and primary cultured Müller cells. The activities of β-catenin and YAP, the key effective factors of Wnt and Hippo signaling, were inhibited by TNF-α in COH retinas. In activated Müller cells, TNF-α inhibited the activity of β-catenin and YAP. Following intervention with the TNFR1 antagonist R7050, Wnt3a protein levels increased, β-catenin, Stat3, and YAP phosphorylation decreased, and the activities of GSK3β and MST1 were suppressed. Additionally, R7050 elevated Müller cell proliferation and increased cyclin D1/D2 and Nestin protein expression. In COH retinas, intravitreal injection of R7050 increased Nestin and Ascl1 expression in Müller cells. These results demonstrate that TNF-α inhibits the proliferation and reprogramming of Müller cells by awakening the Hippo pathway and inhibiting the Wnt/β-catenin pathway in COH retinas.