


-
Visual information is generated by the photoreceptors of the retina, then processed through the successive neuronal layers and finally transmitted to the brain via the optic nerve. Two types of photo responses have been described in the output neurons of the retina, the ganglion cells: A transient response characterized by a rapid increase and decrease in activity (< 400 ms), and a sustained response, which exhibits a slower rise, a gradual decline, and a longer duration[1,2]. In mammals, two major pathways project from the retina to central visual structures in the brain, known as the on- and off-channels[3]. These two channels originate at the level of the bipolar cells in the retina and remain segregated through the visual pathway. Sudden increases in light intensity activate the on-channel, whereas sudden decreases activate the off-channel. The interaction between these two channels provides an efficient mechanism for contrast sensitivity[3], which is essential for distinguishing an object from its background by detecting differences in luminance[4].
In mammals, the superior colliculus (SC) has alternating layers of neurons which can be subdivided into the superficial (SCs), intermediate (SCi), and deep (SCd) layers. In rodents, approximately 85%–90% of retinal ganglion cells project to the SC[5]. The SCs is organized into the stratum zonale, griseum superficiale, and opticum. Retinal input to the SC is denser in the stratum griseum superficiale, with the uppermost sublamina containing the highest density of retinotectal terminals[6]. Neurons in the SCi receive projections from subcortical structures, including the cerebelar nuclei, the pedunculo-tegmental nucleus, and the ventral posteromedial thalamic nucleus[7]. The SC is a center for visual sensory and motor responses and is involved in orienting attention and multimodal processing[8].
Dopamine (DA) modulates synaptic and gap-junction signaling in neuronal tissues, including the retina[9]. In mammalian retinas, DA cell bodies are found among the layer of amacrine cells, at the border of the inner nuclear and inner plexiform layers[10]. Dopamine receptors are grouped into two families: the D1-like receptors, which include D1R and D5R, and D2-like receptors, which include D2R, D3R, and D4R. It is believed that the mammalian retina includes all but D3R[11]. Studies using autoradiography and immunocytochemistry techniques have shown D5R in the pigment epithelium and ganglion cell layer[12], D1R and D4R in photoreceptors[13], and D2R in the photoreceptors and bipolar, horizontal, amacrine, and ganglion cells[10,14]. Because DA levels increase with ambient light intensity and vary between day and night, this neurotransmitter is considered to be a key neuromodulator of light adaptation[9,10,15].
The biochemistry and distribution of dopaminergic neurons in the retina have been extensively characterized[10,16]. However, little is known about the specific role of DA in the processing of visual information. In this study, we analyzed the effects of DA on both the visual on- and off-channels by simultaneously recording the electroretinogram (ERG) and the activity in the SC of rats. Since we used a flashing light stimulus, the stimulus's onset selectively activated the on-channel, whereas the stimulus' offset activated the off-channel. This dual recording technique provides a novel approach to studying the functional effects of this neurotransmitter on visual information processing at the early stages of the visual pathway.
-
Female Sprague–Dawley rats weighing 250 g (CEBEGA, University of Santiago de Compostela, Santiago de Compostela, Spain) were used in this study. The animals were anaesthetized by intraperitoneal injection with 42.5 mg/kg ketamine hydrochloride (Imalgene© 100 mg/ml, Merial Laboratorios S.A., Barcelona, Spain) and 3.6 mg/kg xylacine hydrochloride (Rompum© 20 mg/mL, Bayer Hispania S.L., Barcelona, Spain) in saline. Mydriasis was induced by instillation of 10 mg/mL tropicamide eye drops (Colircusi Tropicamida, Alcon Cusi S.A., Barcelona, Spain). The internal temperature of the animals was kept constant using a heating plate placed beneath them (Animal Temperature Controller, Model ATC2000, World Precision Instruments, Hitching, UK). The experiments typically lasted 1–3 h. Additional anesthesia was given every time the pneumogram showed irregularities (usually 25.5 mg/kg ketamine + 2.4 mg/kg xylacine every 30 min). In all cases, the animals were euthanized after the experiments by means of an overdose of 200 mg/mL pentobarbital delivered interperitoneally (Dolethal, Vetoquinol S.A., Madrid, Spain).
The experimental setup has been previously described[17]. Briefly, the anesthetized animals were placed in a stereotaxic apparatus. The electrocardiogram (ECG) and pneumogram were recorded with standard biological amplifiers (ECG100C and TSD160B, Differential Pressure XDCR, Biopac Systems, Goleta, CA, USA). The ERG was recorded from the stimulated eye (left eye) using a conventional amplifier (AM502 Differential Amplifier, Tektronix Inc., Beaverton, OR, USA) with the active gold electrode on top of the cornea. Recordings were collected and stored on a recording device (CED Power 1401 mk II, Cambridge Electronic Design Ltd., Cambridge, UK). CED Spike2 software was used for data acquisition and online monitoring (Version 7.01, Cambridge Electronic Design Ltd., Cambridge, UK). The animal studies were approved by the Conselleria do Medio Rural da Xunta de Galicia (Exp. 15012/2023/001).
Multiunit neuronal recordings and visual stimulation
-
Multiunit recordings were made in the SC contralateral to the stimulated eye. To access the SC, a craniotomy 3 mm in diameter was made, centered on the stereotaxic coordinates +2.2 mm interaurally (−6.8 mm posterior to the bregma) and 1 mm laterally from the midline on the right hemisphere[18]. The craniotomy was performed using a surgical microscope (Takagi OM-5, 220-2; Tokyo, Japan), with the eyes of the animals covered by a patch. Then an electro-hydraulic microdriver (Narishige International Ltd., London, UK) with a tungsten microelectrode attached (3–5 MOhm, A-M Systems Inc., Sequim, WA, USA) was placed vertically over the craniotomy[17]. Contact with the dura and penetration of the microelectrode through the dura were visualized by means of a surgical microscope. The microelectrode was then advanced into the brain until the first layer of the SC was reached (D +7.0 mm interaurally). This was easily detected because the collicular visual response to the flashing light was clearly observed in the recordings as a change in the frequency of spikes triggered by the onset and offset of the light used as the stimulus[18]. At this point, the electrode was kept steady. To avoid the possible bleaching effect of the surgical microscope's light, the animals were kept under dim light for at least 15 min. Afterwards, the recordings were initiated. The signal of the microelectrode was amplified and filtered using conventional electronic equipment (DAM50 Extracellular Amplifier, World Precision Instruments, Hitching, UK).
The methodology used for visual stimulation has been described previously[9]. Briefly, the animals were dark-adapted overnight and kept in darkness until the experiments started. Experiments were performed under very dim illumination. During mydriasis, the ERG and SC recordings were performed simultaneously. The visual stimulus was produced by a small panel (2 cm × 3 cm) with a light-emitting diode (LED) matrix (labeled as 3,000 ºK) placed in front of the left eye at a distance of 5 cm with a visual angle of 30.9 × 21.8° and centered on the visual field area that elicited the best collicular response. The light intensity was 140 cd/m2 (Digi- Spot L-488, Sekonic Co. Ltd., Tokyo, Japan), the stimulation consisted of a 3-s flash of light with an interstimulus time of 3.5 s (3 s with the light on, 3.5 s with the light off). While the left eye was being stimulated, the right eye remained occluded by means of a black opaque patch. The LED matrix was driven by an LED driver controller (Mightex LED Driver, SLA Series, Mightex Toronto, Canada) connected to a computer.
Experimental protocol and intravitreal injections
-
The anesthetized animals were placed in a stereotaxic apparatus with the pneumogram's pressure transducer, and the ECG electrodes were put in place. Then a craniotomy was made to expose the region of the brain surface on top of the SC with the dura mater intact. A syringe with a 34G needle containing the neurotransmitter (DA, 32 mg/mL) was placed with a holder next to the animal. The needle was inserted into the eyeball before the insertion of the microelectrode into the brain. The injection was made in the temporal-inferior direction through the sclera at about 1 mm from the limbus. With the help of the surgical microscope, we ensured that the total length of the bevel was facing toward the lens inside the eyeball, placing the needle tip between the lens and the retina. Care was taken to avoid damage to the posterior capsule of the lens. Next, the ERG active electrode was placed on the cornea of the left eye, and the microelectrode was inserted into the brain on the contralateral hemisphere. The microelectrode was inserted perpendicularly to the surface of the brain while the animals were under visual stimulation. When the microelectrode registered the first responses to the light stimulation, the electrode's penetration stopped. At this point, the ERG and SC activity were recorded for approximately 20 min. After that, 5 µL of the DA solution was injected into the vitreous. The syringe holder allowed us to push the syringe piston by turning a small screw, thus injecting the solution smoothly (for about 10 to 20 s) without moving the needle previously inserted into the eyeball. Recordings were continued for at least 20 min without removing the needle to prevent fluid reflux. To test the effect of a DA antagonist, 0.5 µL of a 0.66 mM solution of haloperidol (HA) was injected into the vitreous of a different set of animals. For control purposes, 5 µL of a saline solution (0.9% NaCl) under similar conditions was injected into the control animals.
ERG and SC response assessment and statistical analysis
-
Values are expressed as the mean ± standard deviation (SD). Average values were compared by using either one-way analysis of variance (ANOVA) with Tukey's range test for post hoc comparisons or the t-test between two datasets. P-values less than 0.05 were considered to be statistically significant. GraphPad Prism Version 8.0 (Dotmatics, San Diego, California, USA) software was used for the calculations.
The ERG and SC neuronal activity were recorded simultaneously. By applying a 3-s flash of light, responses to both the onset and offset of the stimulus could be distinguished. In the ERG, the onset response appeared as a phasic positive component at the light's onset, whereas a distinct offset response was observed at the stimulus's offset (Fig. 1). The amplitude of the ERG's onset response was measured as the difference between the positive and negative peaks, whereas the offset response was quantified as the difference between the negative peak and the baseline.
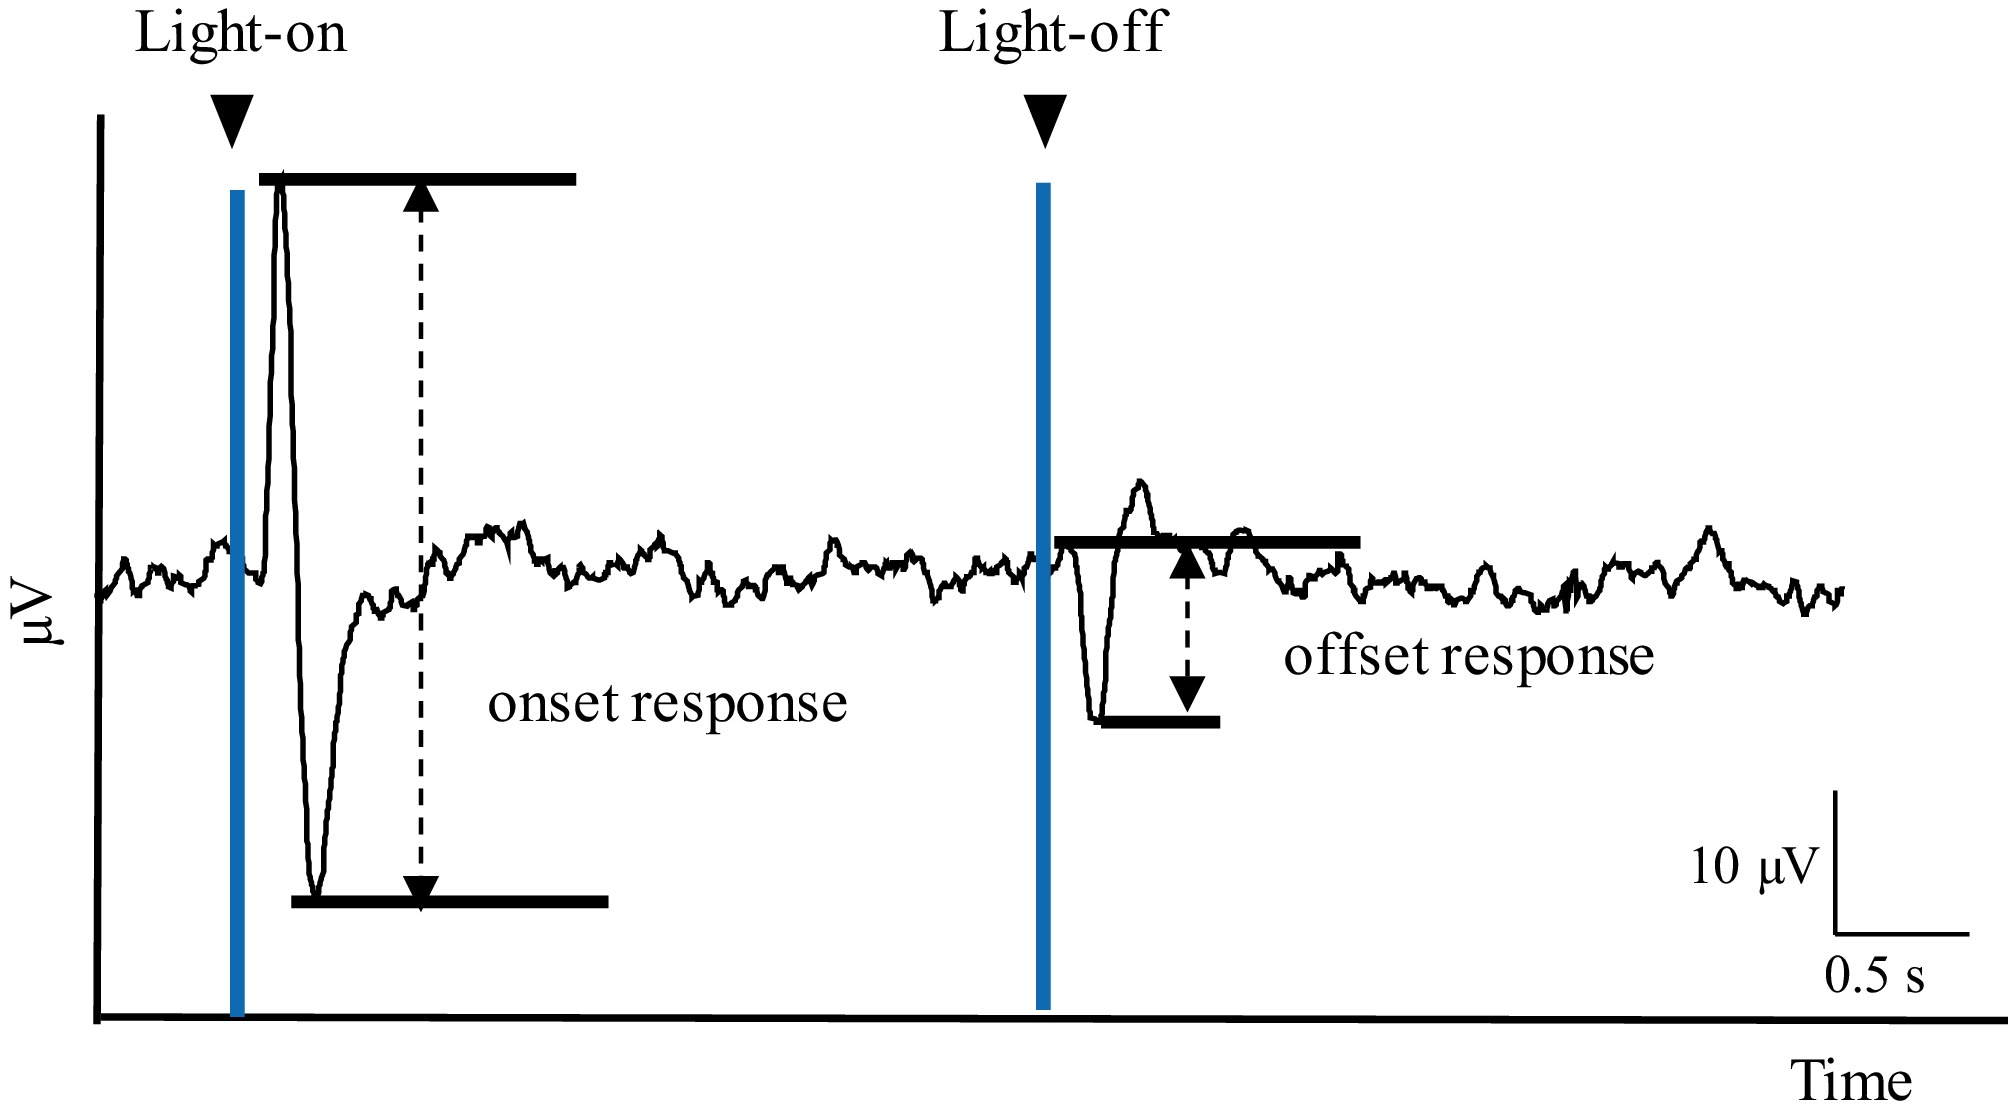
Figure 1.
Example of an ERG showing the assessment of the different types of responses recorded in the retina. The difference between the positive and the negative peak elicited by the stimulus' onset (light-on) was measured to obtain the onset response's amplitude. The amplitude of the offset response to the stimulus was obtained by measuring the negative peak elicited by the stimulus' offset (light-off).
The amplitude of the onset and offset collicular responses was quantified by comparing the average spike rate within a 400-ms time window preceding the stimulus' onset (Fig. 2; basal) with the corresponding 400-ms time window immediately following the stimulus' onset (Fig. 2; On–transient) and the stimulus' offset (Fig. 2; Off–transient), respectively. A 2-s time window beginning 400 ms after light-on was used to assess the tonic activity in response to light (Fig. 2; On–sustained). Population ERG and collicular response histograms were generated by averaging the data collected from a single animal over a 15-min recording period (approximately 130 trials). Histograms were constructed using a bin size of 33 ms.
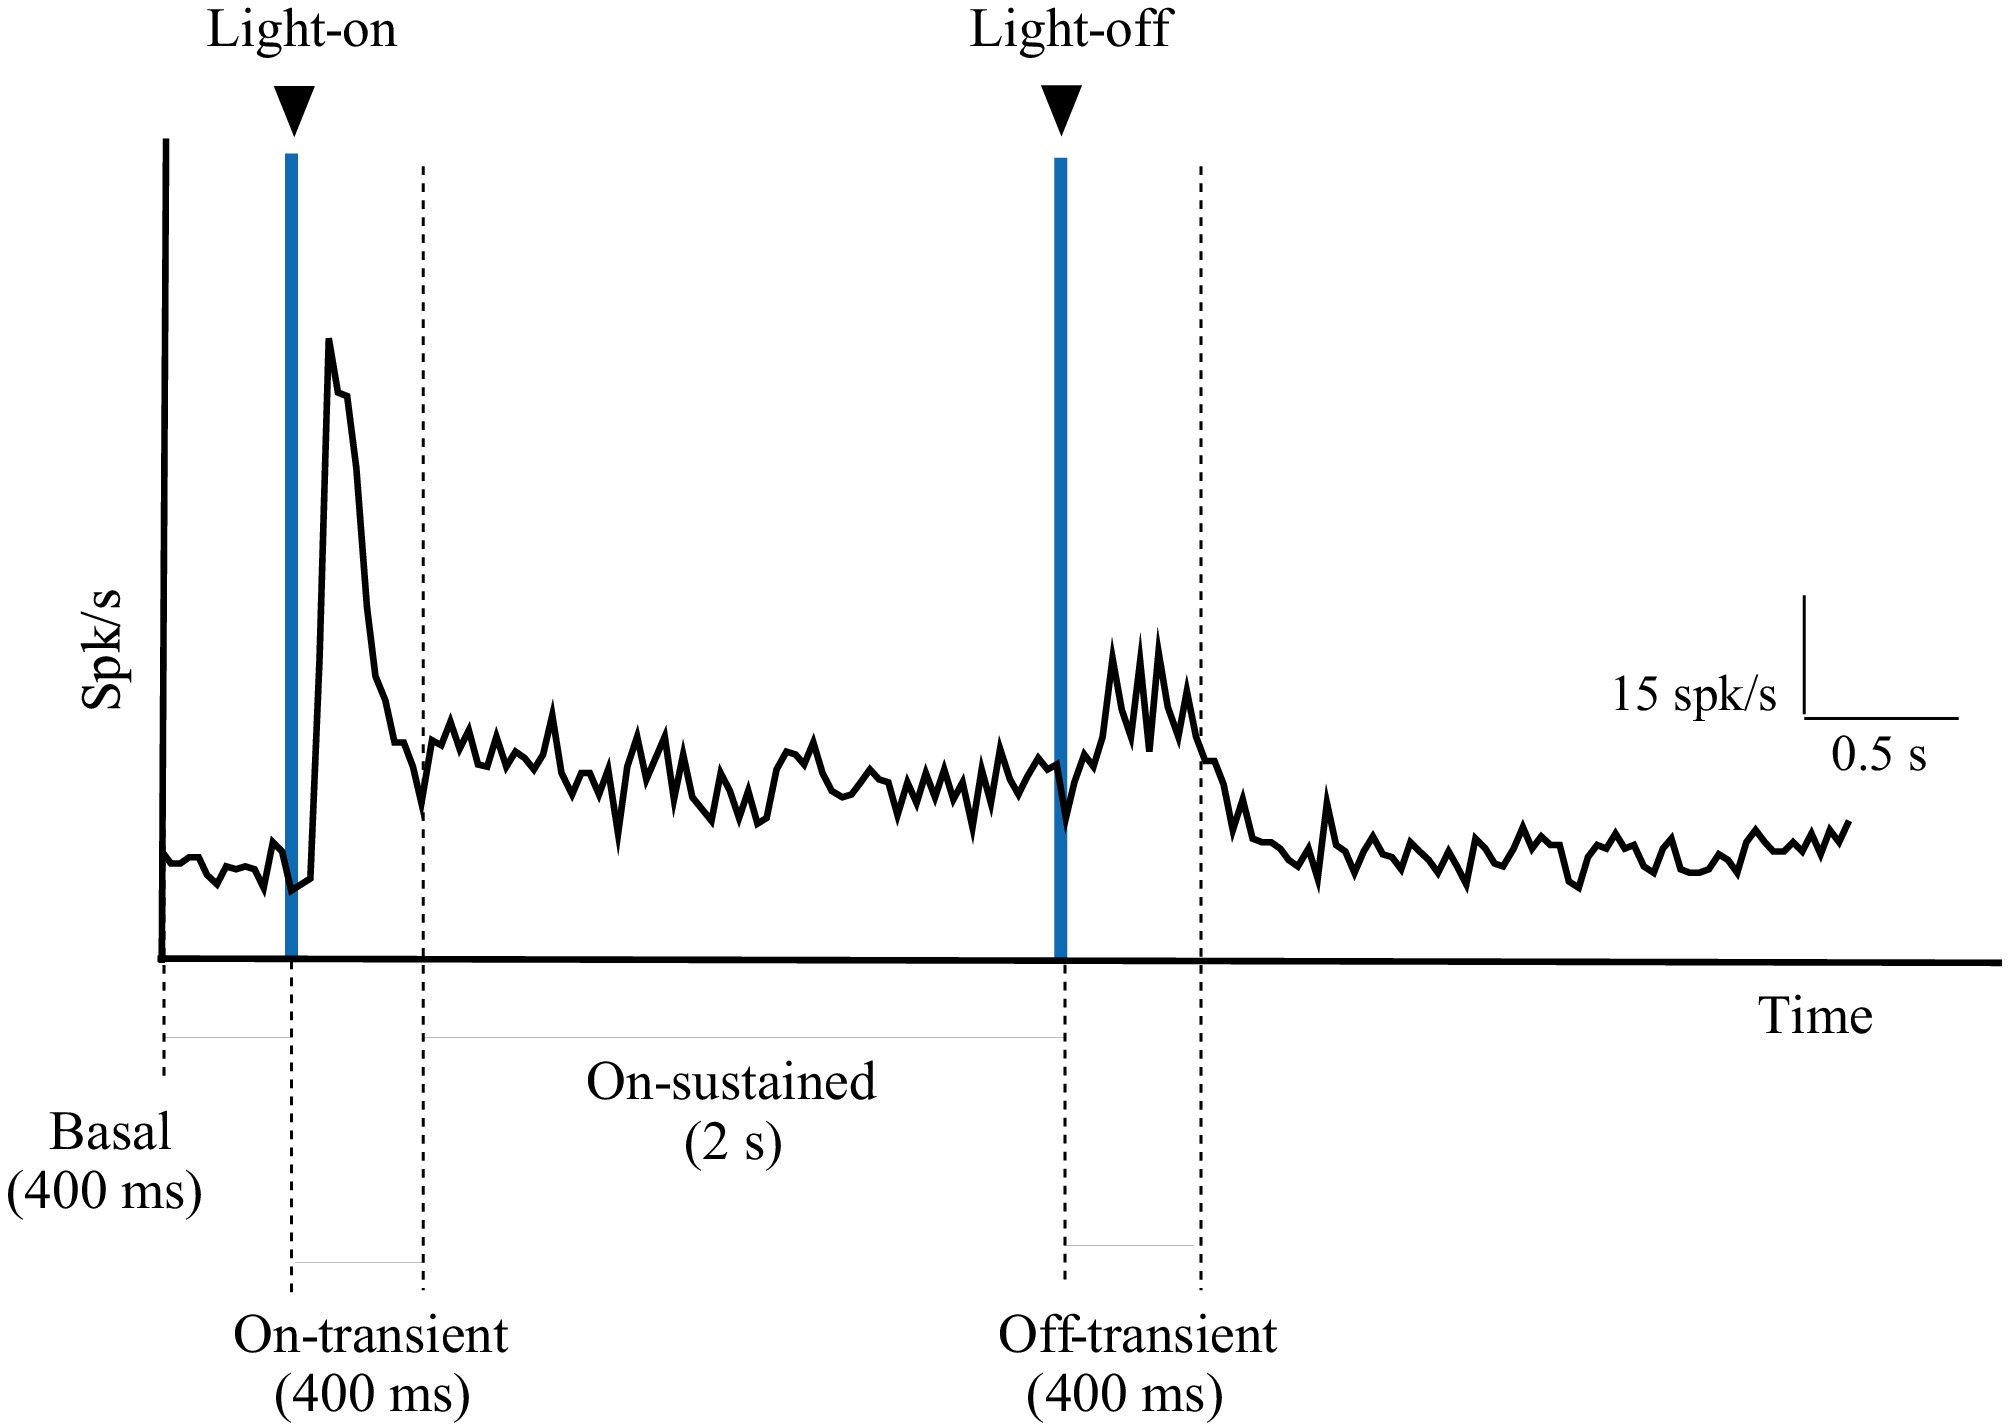
Figure 2.
Example of a histogram showing the assessment of the different types of responses recorded in the SC. The basal response was the activity recorded 400 ms before the stimulus's onset (light-on). The transient response (On–transient) was considered to be the phasic response elicited 400 ms after the stimulus' onset. The sustained response (On–sustained) was considered to be the tonic response to light between 400 ms and 2 s after the stimulus's onset. The phasic response elicited by the stimulus' offset (light-off) was considered to be the transient response (Off–transient).
-
In total, 19 recordings were obtained from 19 animals. Nine animals received an intravitreal injection of DA, eight received HA, and the remaining two received a saline solution. Both ERG and SC responses were recorded simultaneously before, during, and after the injection without interruption in all animals. Intravitreal saline injections did not produce significant changes in visual activity, either in the retina (stimulus onset response amplitudes: 42.3 and 39.8 µV pre-injection and post-injection, respectively, p = 0.191; amplitudes of the response to the stimulus's offset: 12.1 and 10.5 µV for pre-injection and post-injection, respectively, p = 0.093) or in the SC (amplitudes of the response to the stimulus's onset: 32.1 and 34.2 spikes/s for pre- and post-injection respectively; p = 0.245; amplitudes of the response to the stimulus' offset: 10.1 and 9.8 µV for pre-injection and post-injection, respectively, p = 0.150) (Fig. 3).
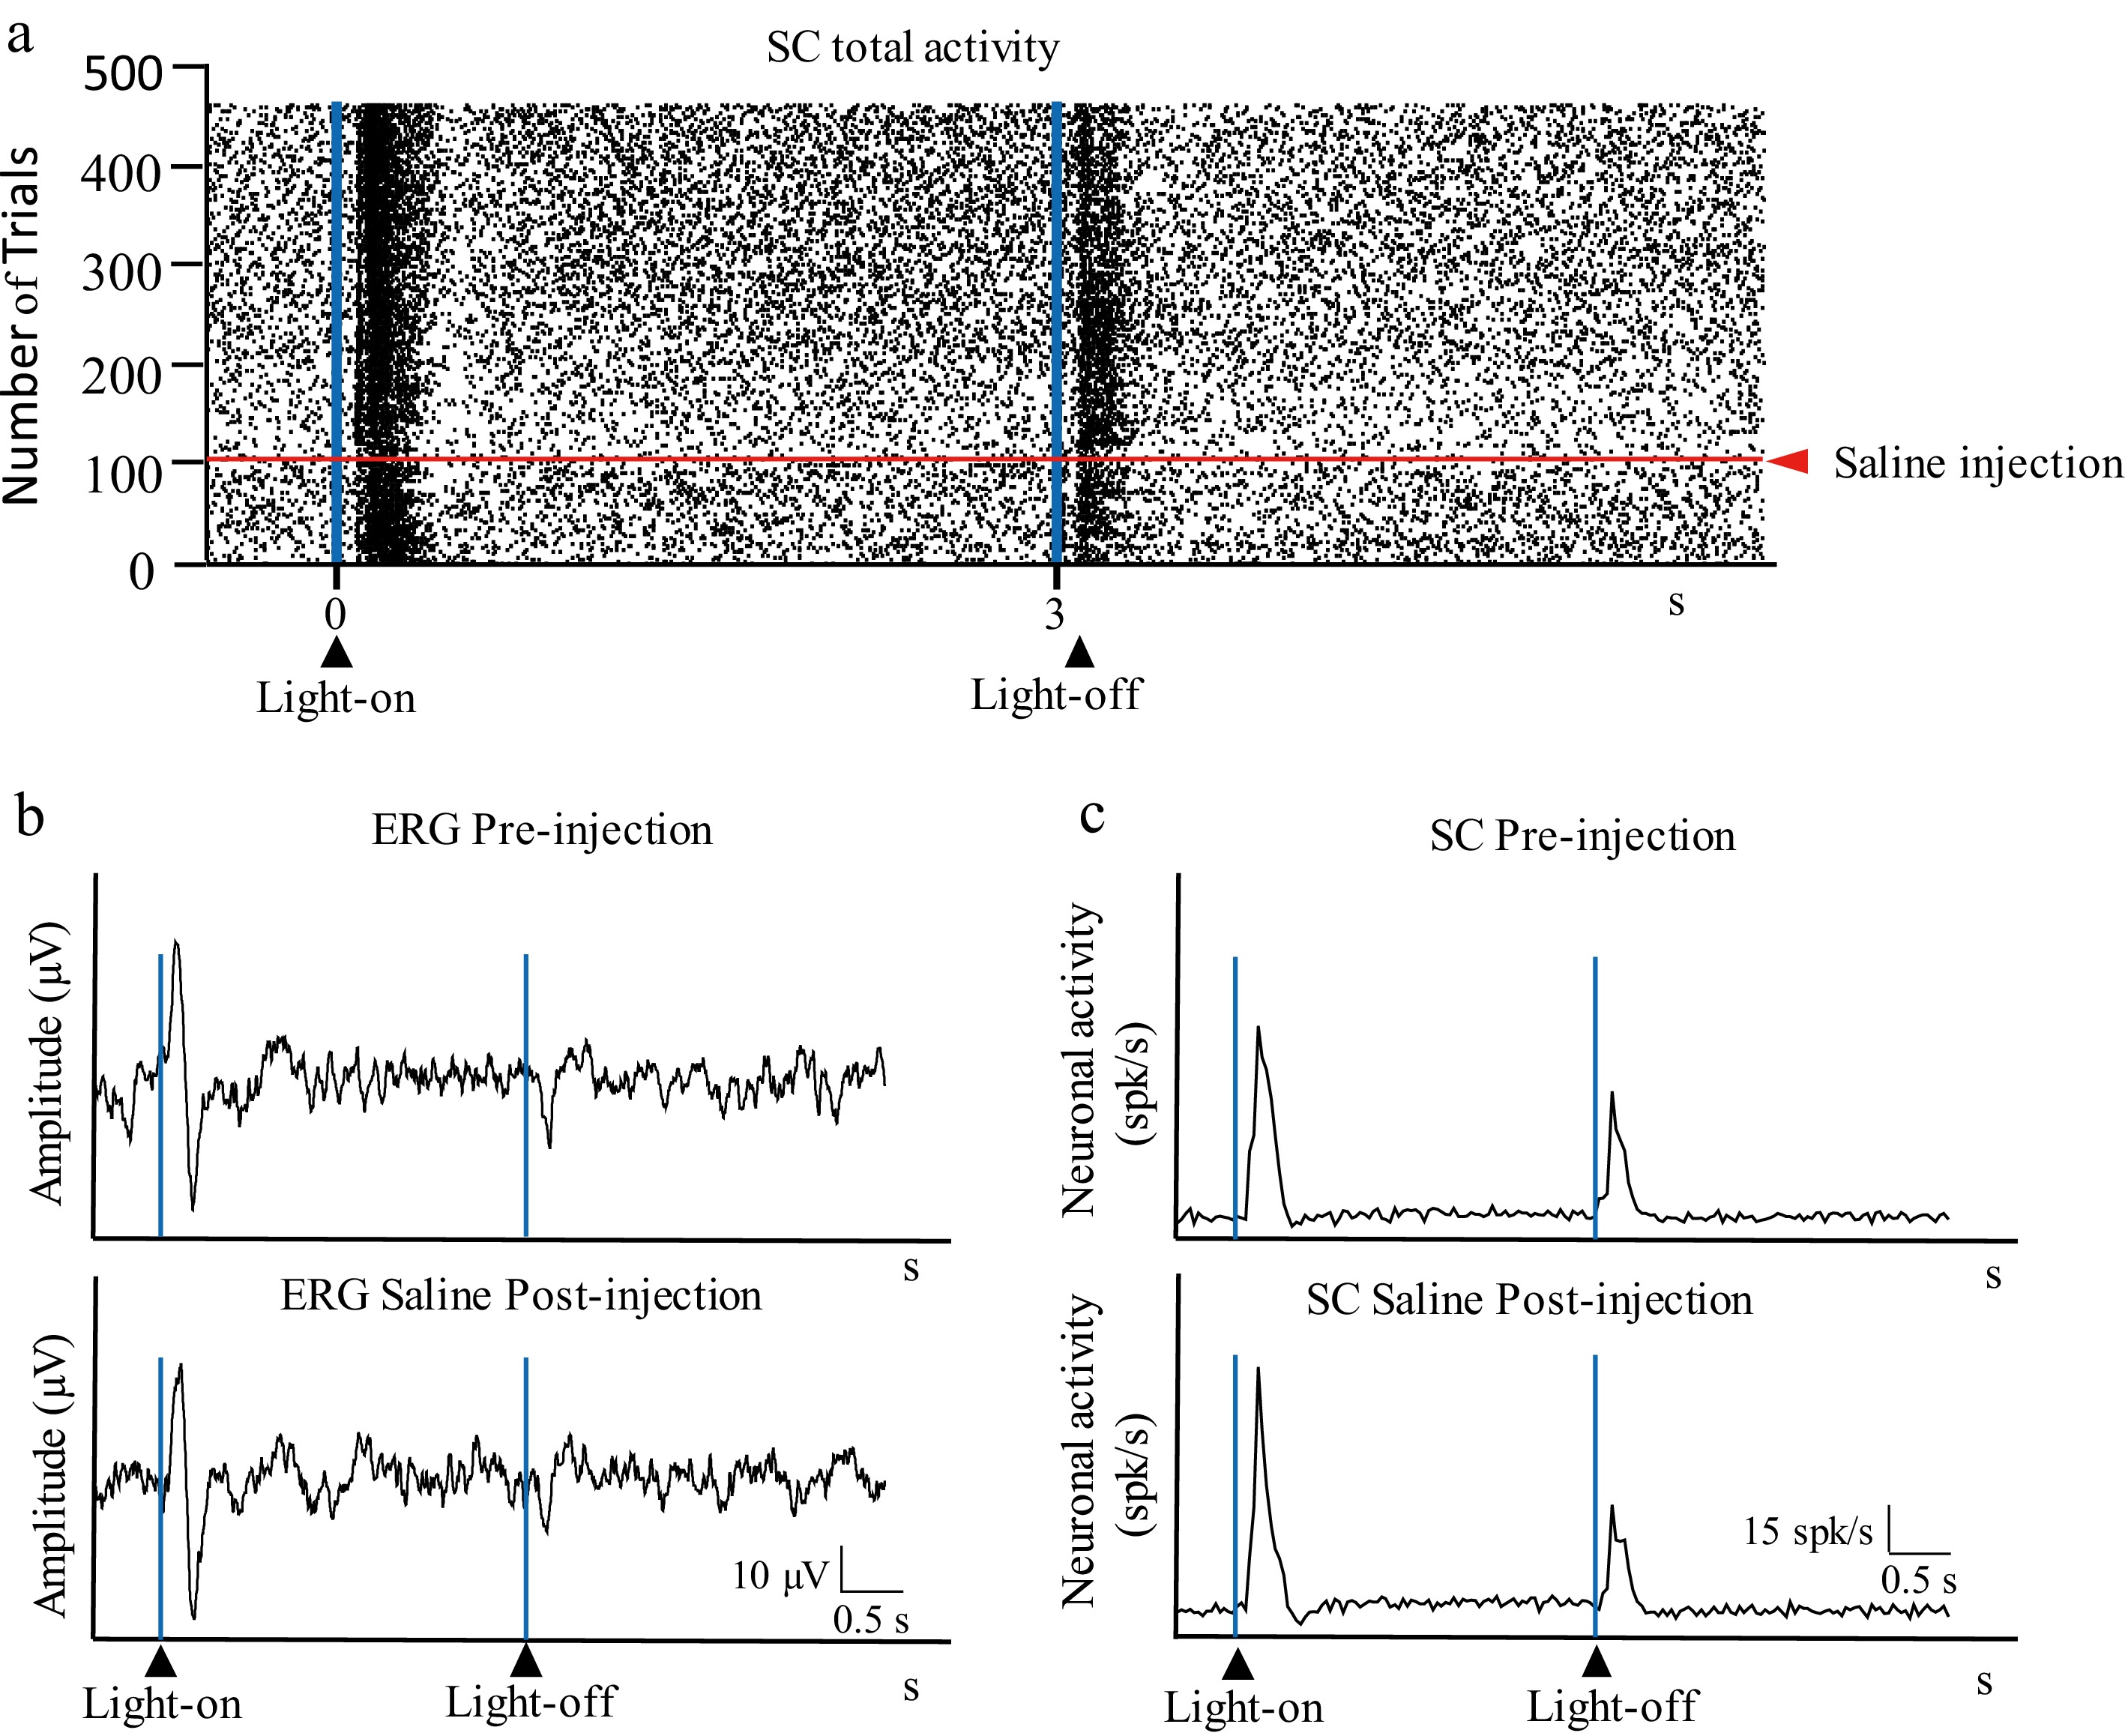
Figure 3.
Intravitreal injection of saline. (a) Raster showing the activity in the superior colliculus (SC, total activity) before and after intravitreal of 5 µL of saline. (b) Retinal activity before (ERG pre-injection) and after (ERG post-injection) the intravitreal injection of saline. (c) Histogram showing the activity in the SC before (SC pre-injection) and after (SC post-injection) intravitreal injection of saline; the vertical axis indicates the average spikes/s of the trials shown in (a).
Dopamine reduced the On–sustained activity in the SC
-
Injection of DA into the vitreous induced the disappearance of the positive wave from the ERG's response profile (amplitude of the response to the stimulus' onset: 44.5 ± 27.2 µV and 17.4 ± 7.9 µV for pre-injection and post-injection respectively; p = 0.025) (Figs. 4 and 5). In the SC, both the On– and Off–transient responses did not significantly change their amplitude (On–transient response: 21.41 ± 4.02 and 22.95 ± 6.15 spikes/s for pre- and post-injection, respectively; Off–transient response: 7.67 ± 5.66 and 9.18 ± 4.76 spikes/s for pre- and post-injection, respectively; p = 0.540), whereas the On–sustained response dropped significantly (11.94 ± 6.89 and 5.4 ± 4.42 spikes/s for pre-injection and post-injection, respectively; p = 0.029) (Fig. 5).
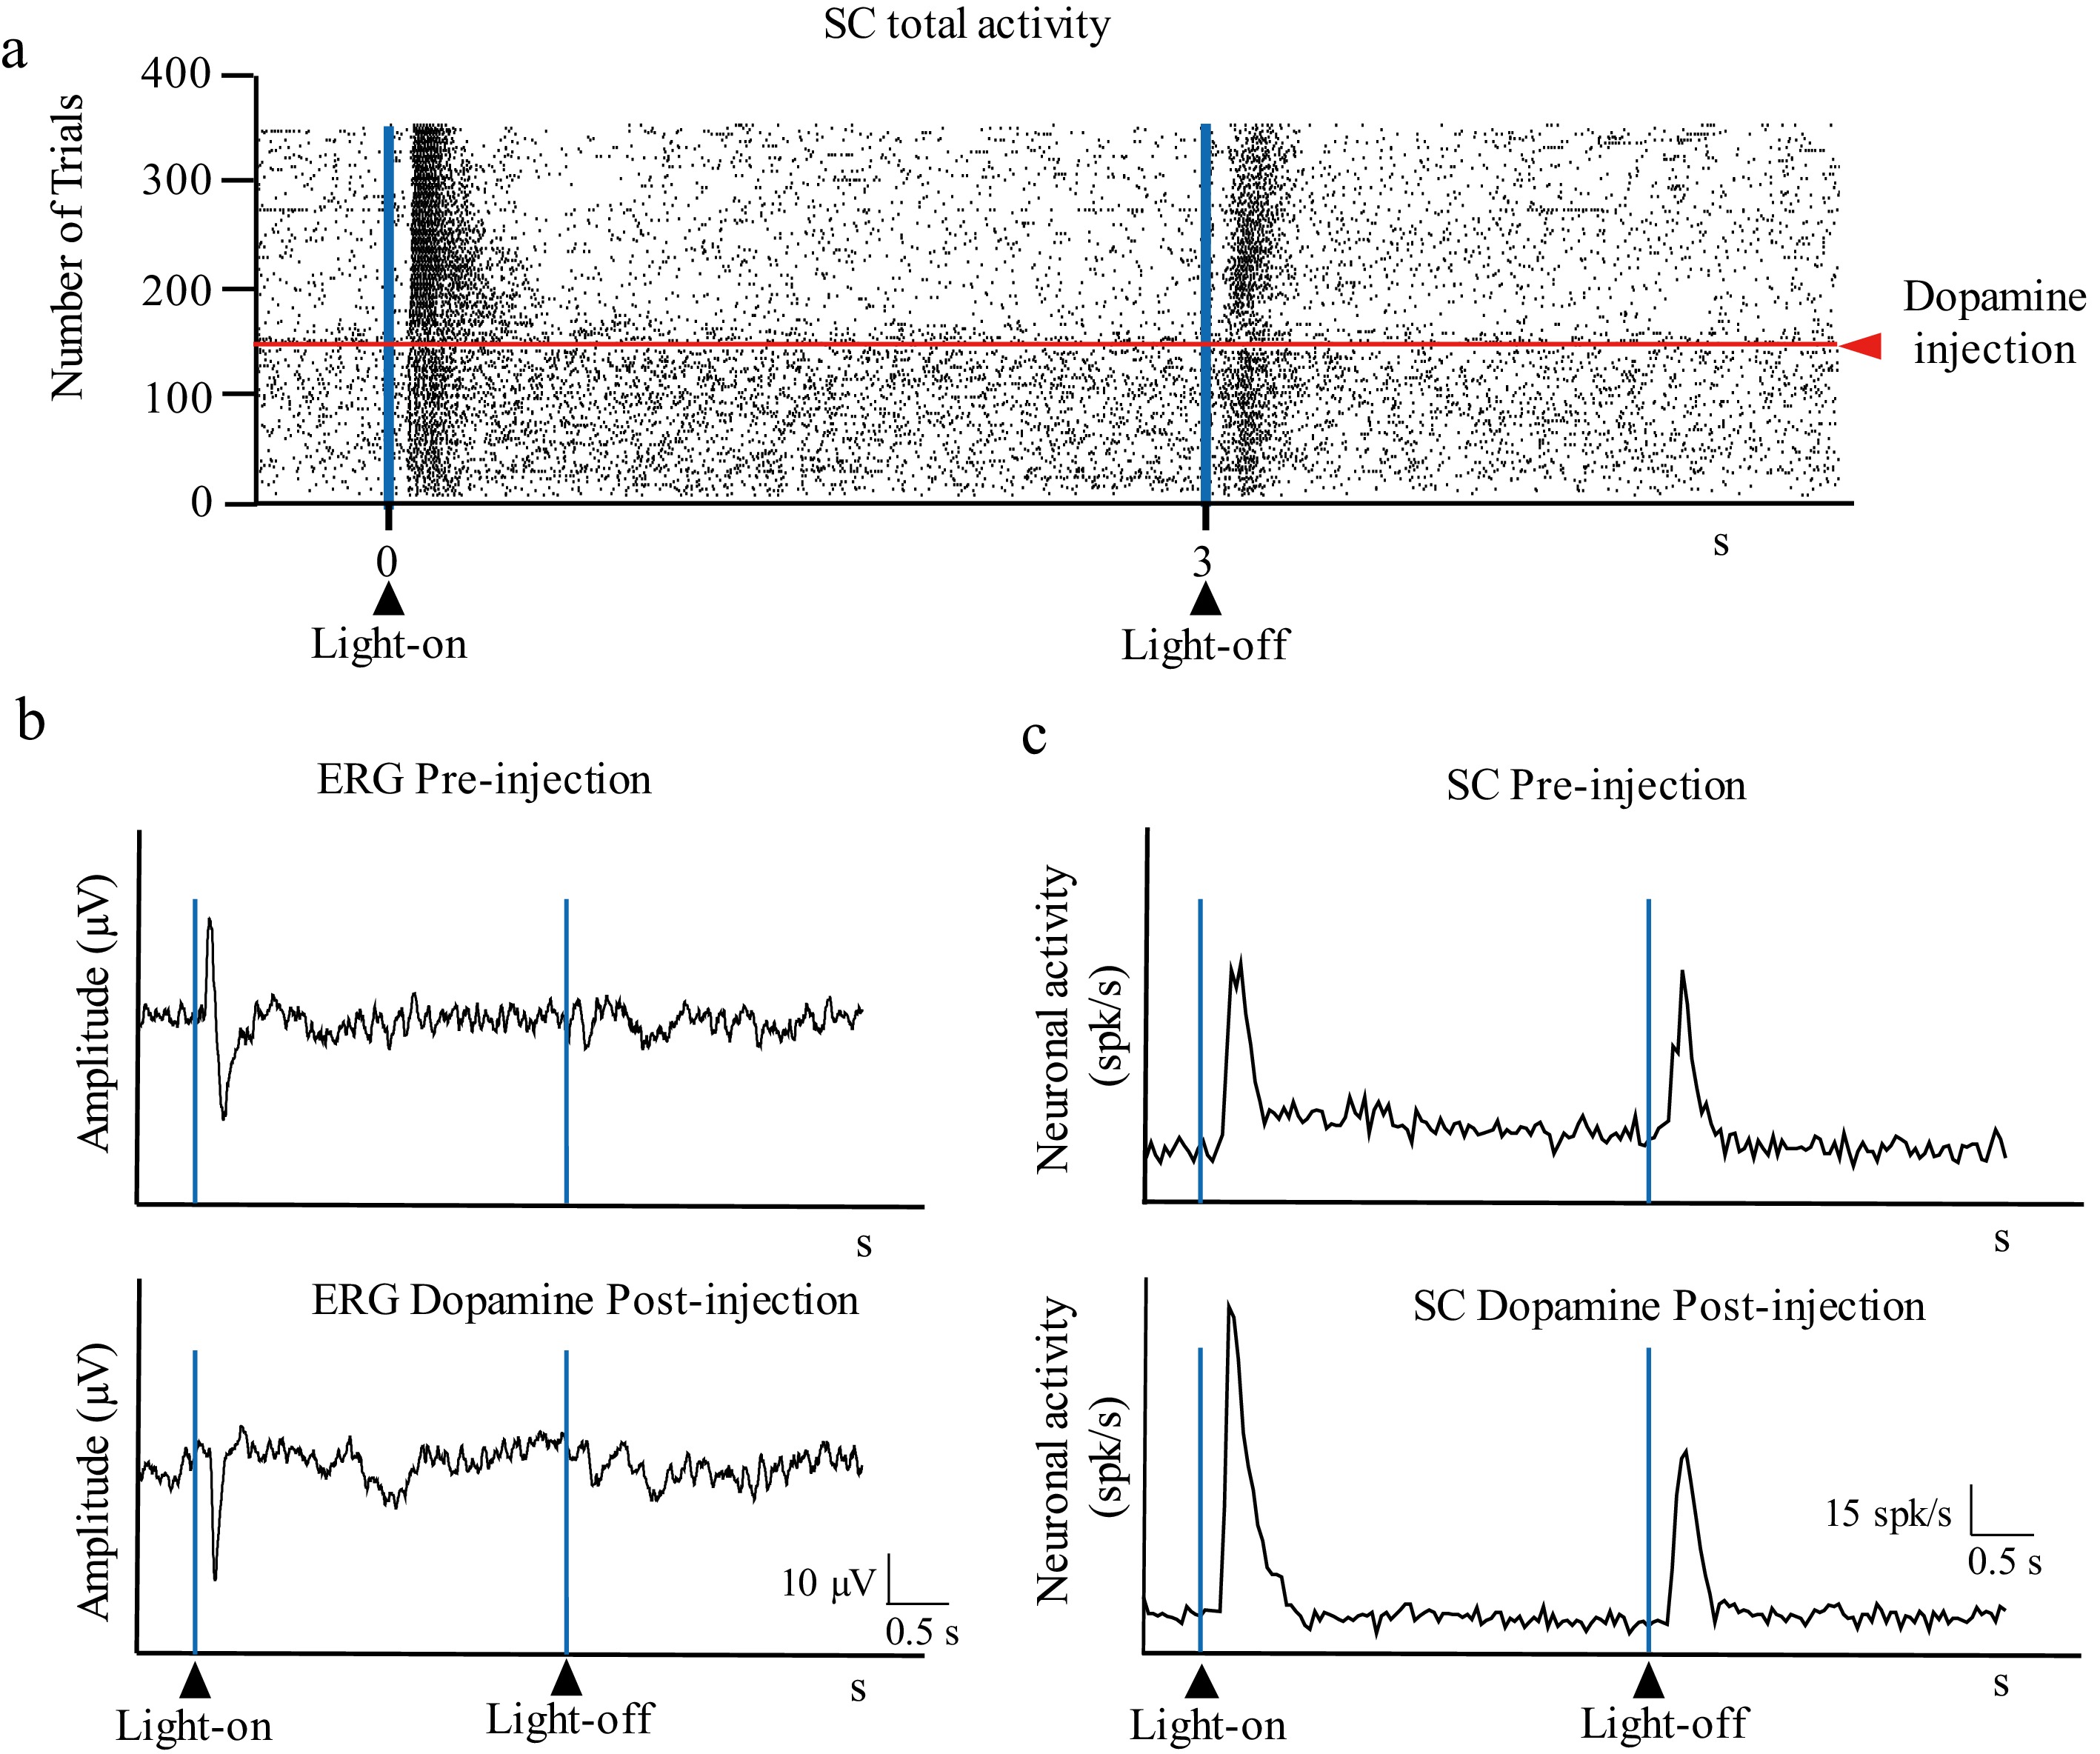
Figure 4.
Effect of intravitreal injection of DA on visual responses. (a) Raster showing the activity in the SC (total activity) before and after intravitreal injection of 5 µL dopamine. (b) Retinal activity before (ERG pre-injection) and after (ERG post-injection) injection of DA (32 mg/mL) intravitreal injection. (c) Histogram showing the activity in the SC (pre-injection) and after (post-injection) intravitreal injection of DA; the vertical axis indicates the average spikes/s of the trials shown in (a).
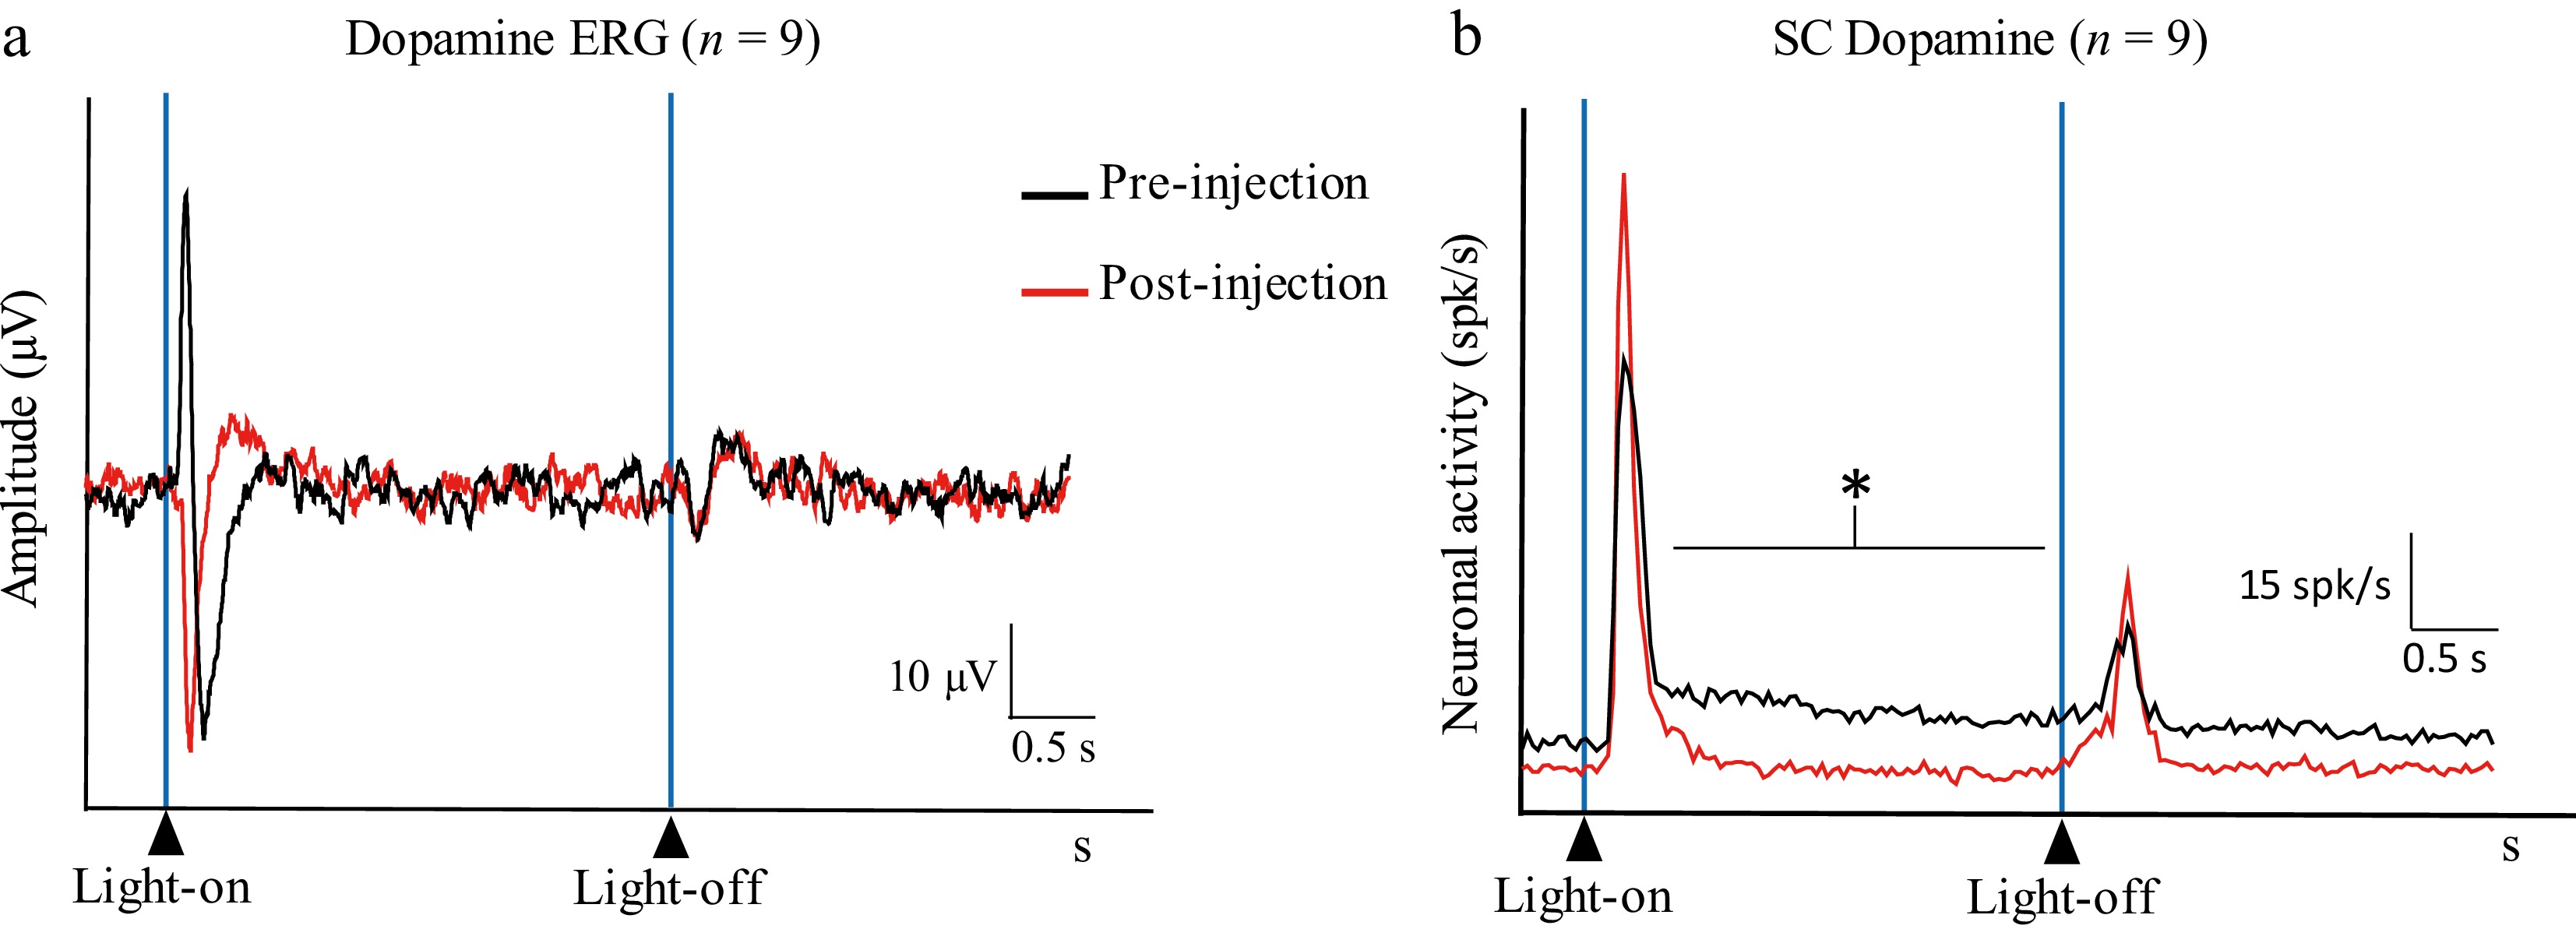
Figure 5.
DA population histograms showing (a) the retinal activity (Dopamine ERG) and (b) the activity in the SC (Dopamine SC) before (pre-injection; black line) and after (post-injection; red line) intravitreal injection of DA (32 mg/mL) (average of n = 9 multiunit recordings made in nine different animals) (* p < 0.05).
Haloperidol reduced the response to the stimulus's offset but not its onset in the SC
-
To assess the effect of the DA antagonist, 0.66 mM of HA was injected intravitreally. The HA injection reduced the amplitudes of both the on- and off-waves in the ERG response profile (response to the stimulus's onset: 90.4 ± 61.1 µV and 13.3 ± 9 µV for pre-injection and post-injection, respectively, p = 0.012; response to the stimulus's offset: 71.3 ± 47.6 µV and 7.5 ± 6.3 µV for pre- and post-injection, respectively, p = 0.009) (Figs. 6 and 7). In the SC, HA significantly reduced the Off–transient response (13.42 ± 6.94 and 2.49 ± 2.21 spikes/s for pre- and post-injection, respectively; p = 0.0008), whereas the On–transient and On–sustained responses to light remained unchanged (On–transient response: 25.52 ± 7.71 and 17.89 ± 6.52 spikes/s for pre- and post-injection, respectively; p = 0.051; On–sustained response: 3.82 ± 2.56 and 1.84 ± 1.23 spikes/s for pre- and post-injection, respectively; p = 0.090) (Fig. 7).
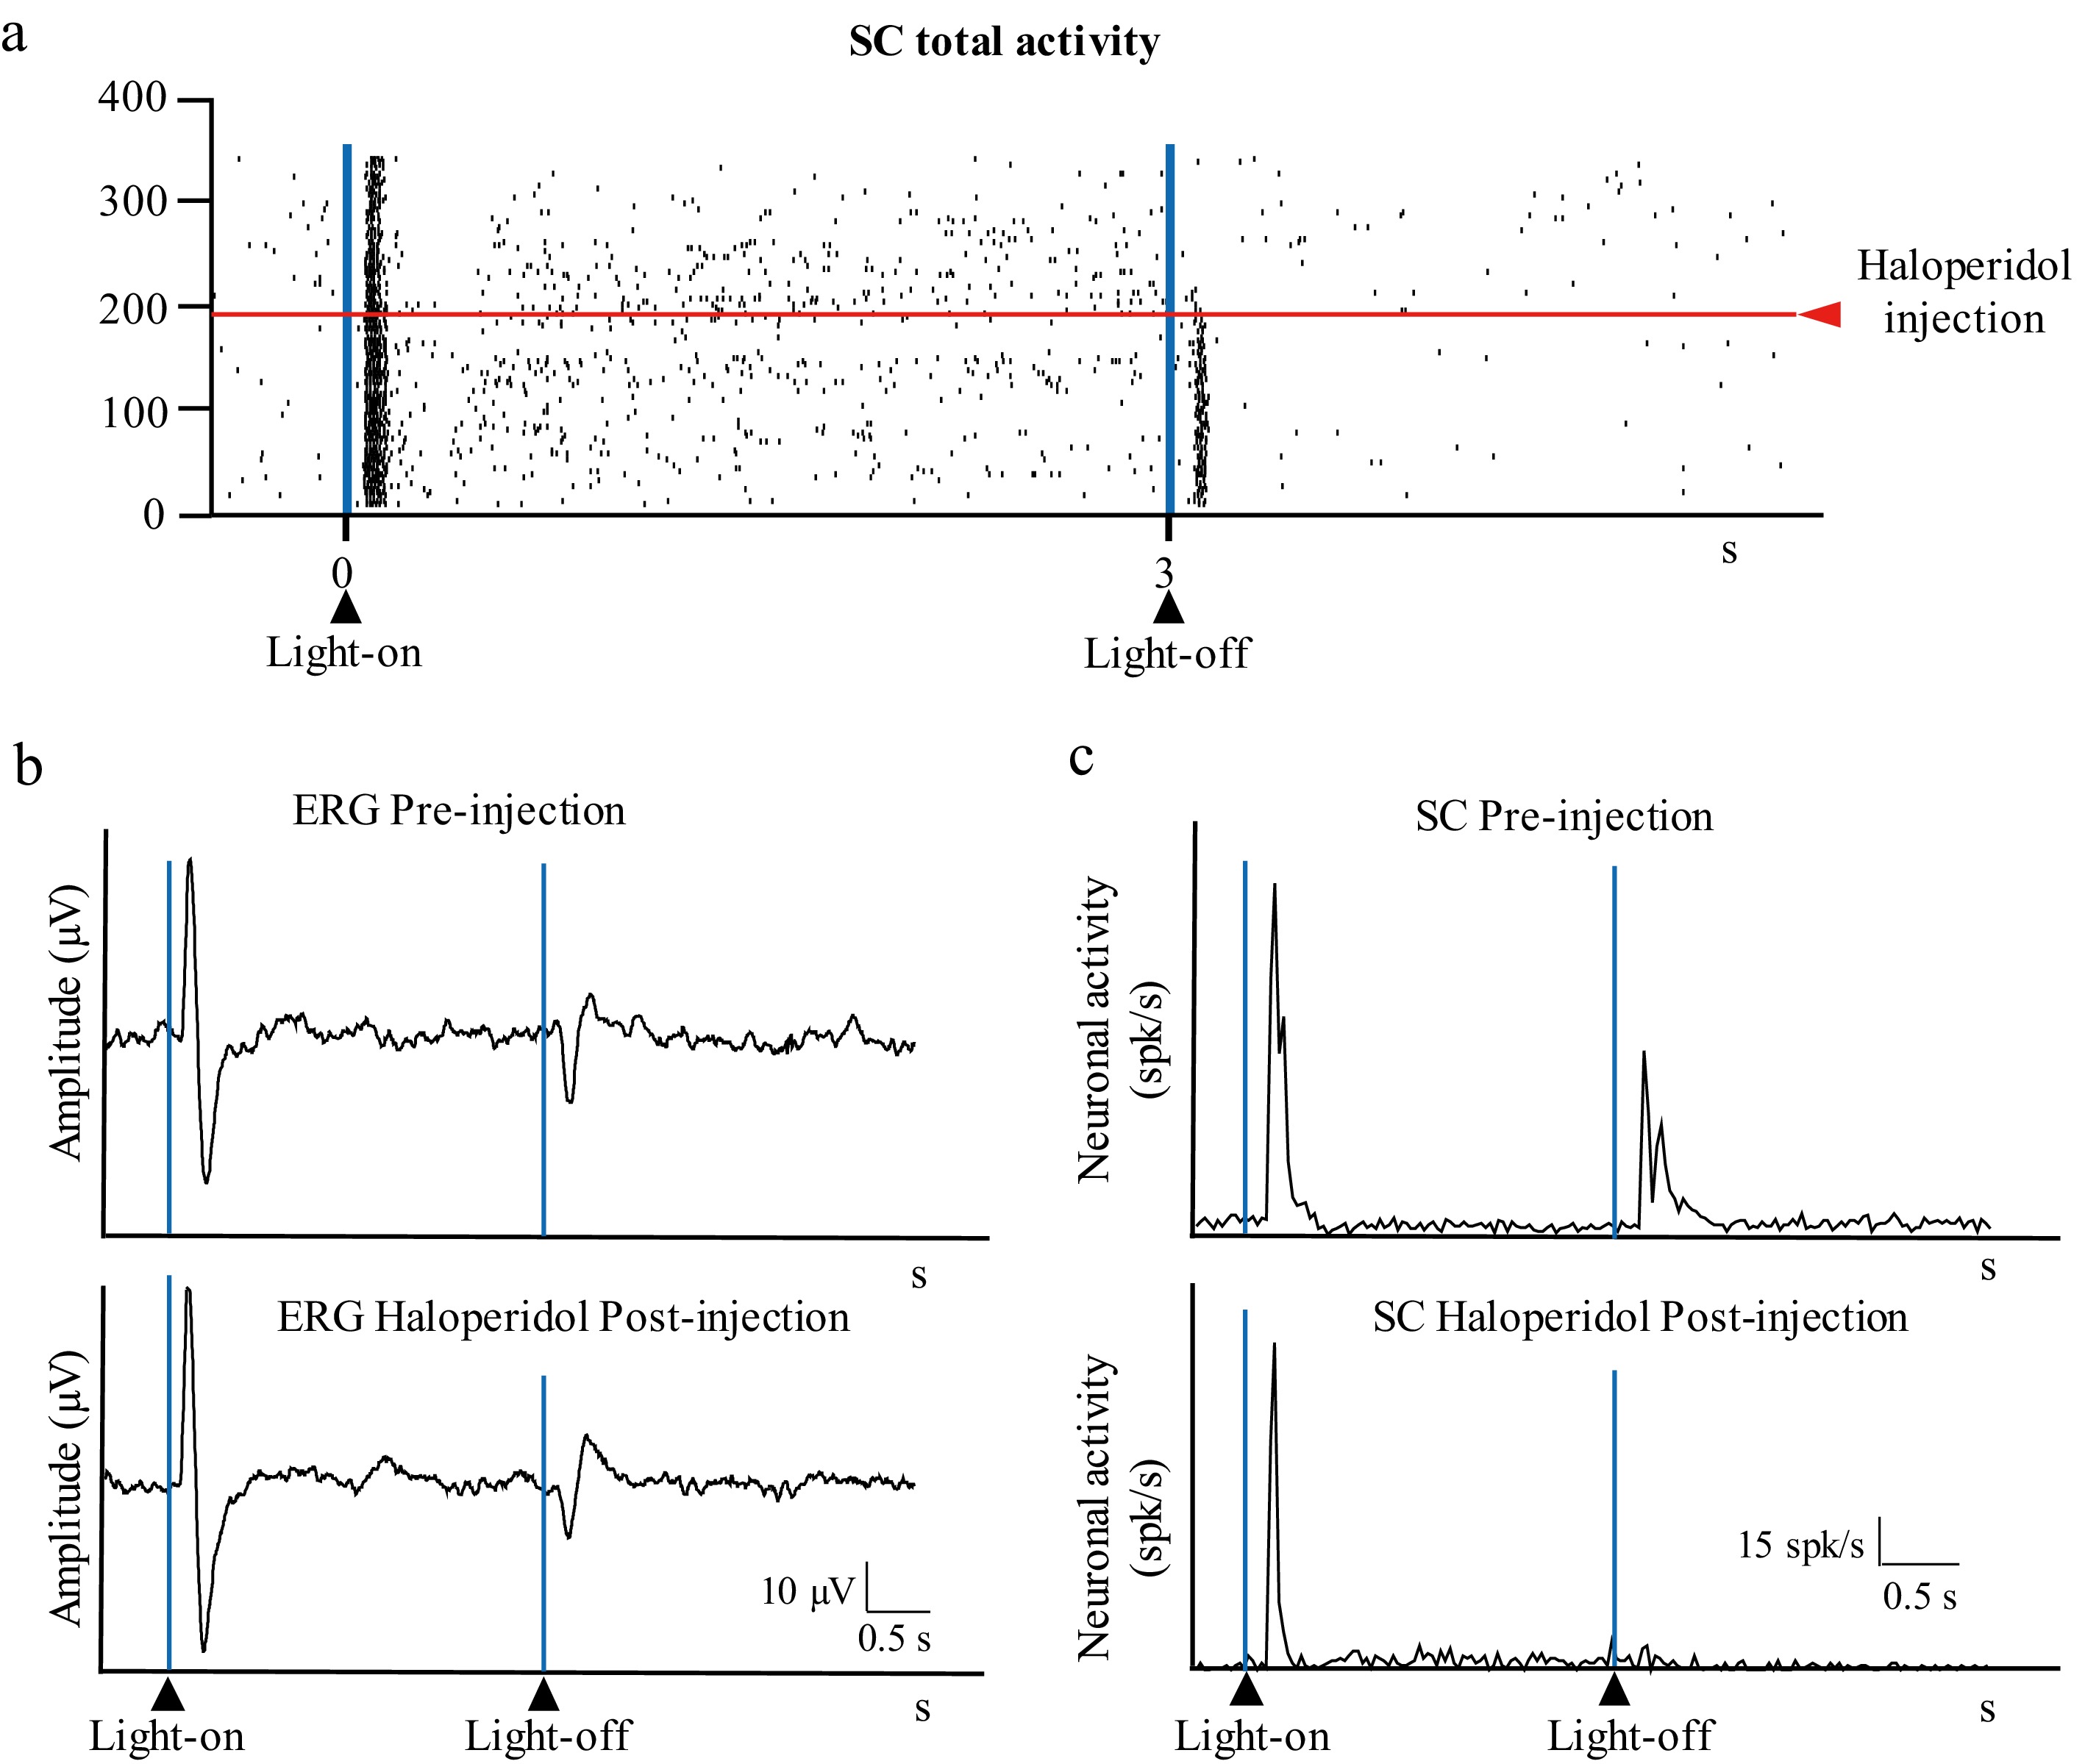
Figure 6.
Effect of HA intravitreal injection on visual responses. (a) Raster showing the activity in the SC (total activity) before and after intravitreal of 5 µL HA. (b) Retinal activity before (ERG pre-injection) and after (ERG haloperidol post-injection) the intravitreal injection. (c) Histogram showing the activity in the SC before (SC pre-injection) and after (SC haloperidol post-injection) intravitreal injection of HA (0.66 mM); the vertical axis indicates the average spikes/s of the trials shown in (a).
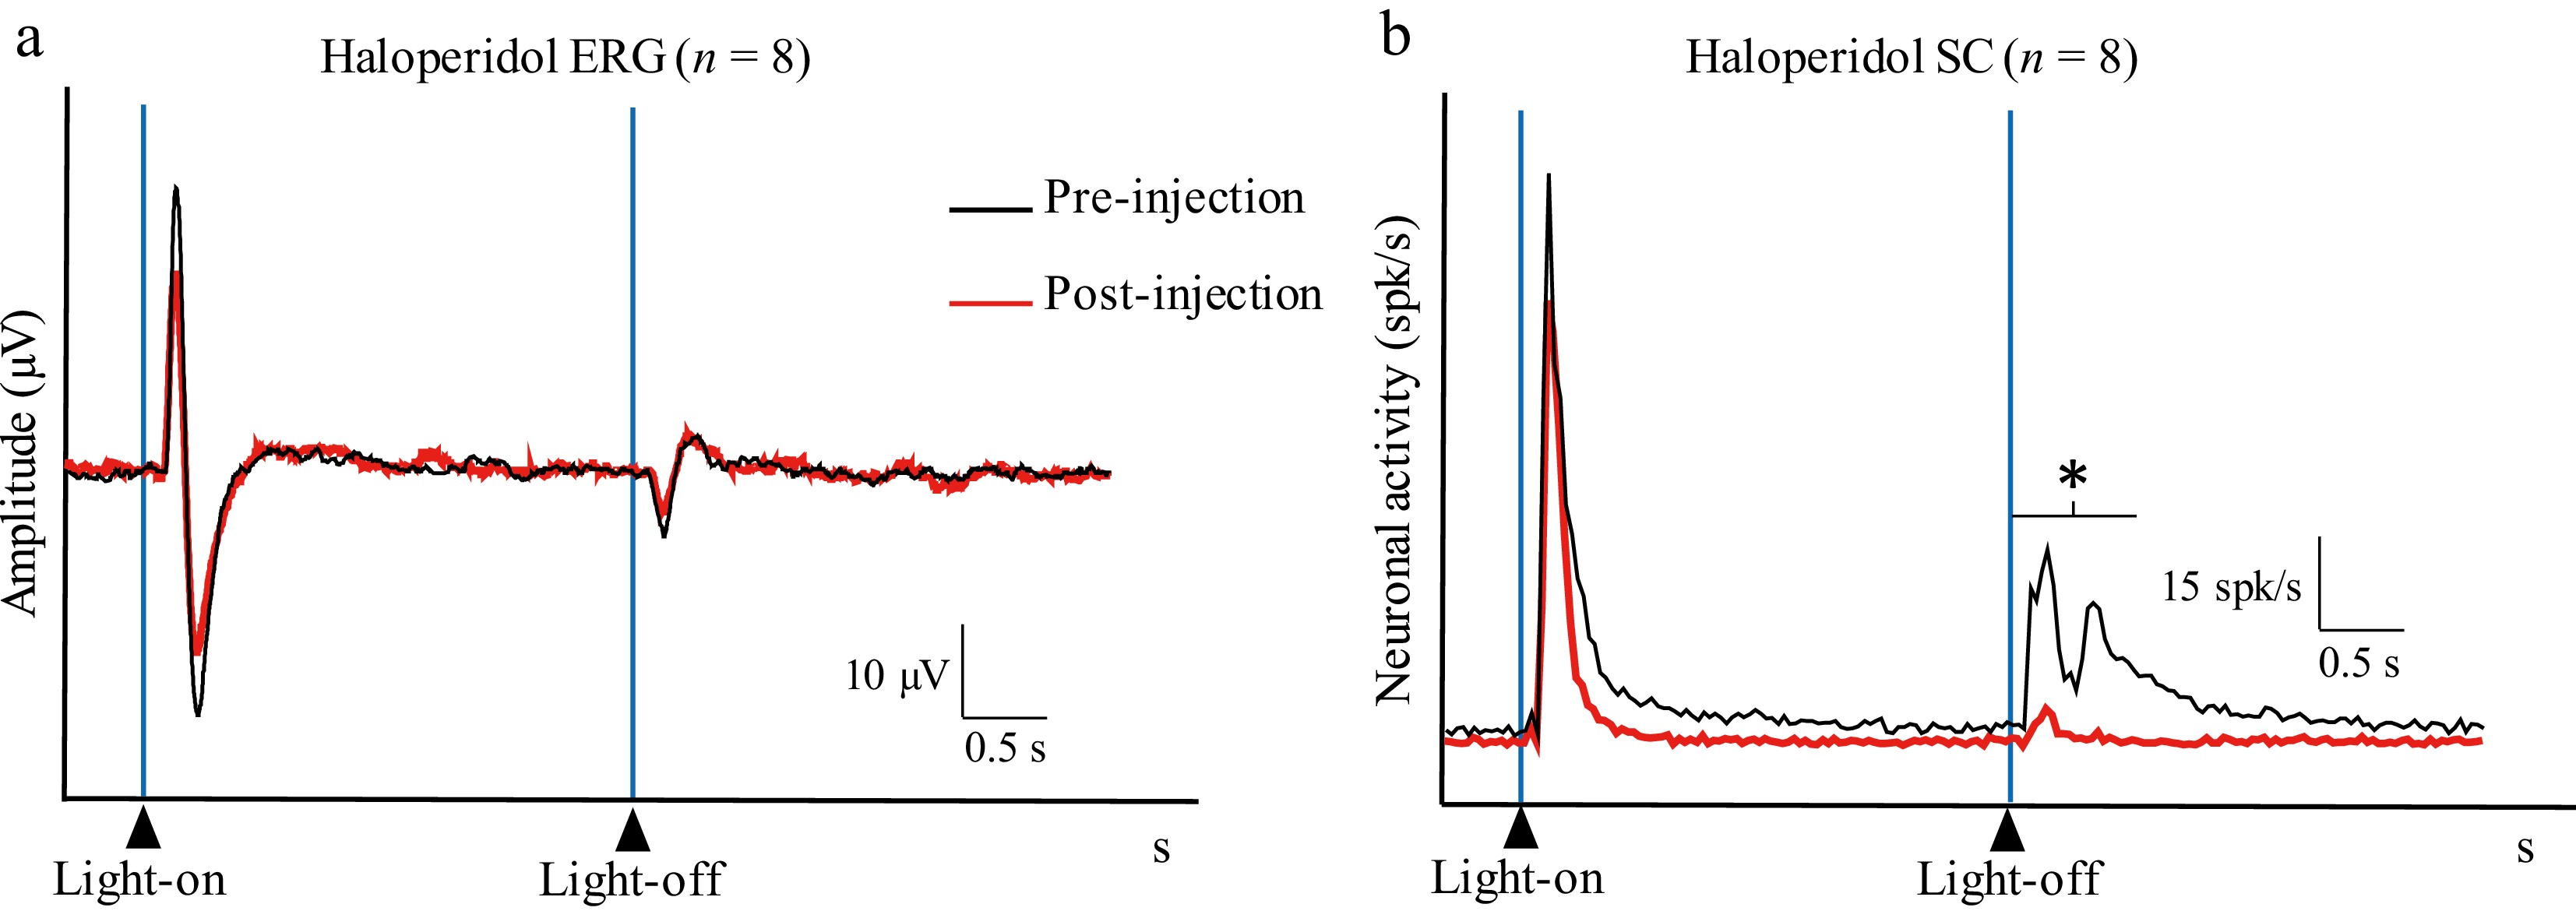
Figure 7.
HA population histograms showing (a) the retinal activity (Haloperidol ERG) and (b) the activity in the SC (Haloperidol SC) before (pre-injection; black line) and after (post-injection; red line) intravitreal injection of HA (0.66 mM) (average of n = 8 multiunit recordings made in 8 different animals) (* p < 0.05).
-
The standard photopic ERG is typically recorded with a short-duration flash (< 50 ms). With such a brief stimulus, the general function of the retina is captured, and the resulting b-wave reflects the combined activity of both the on- and off-channels. In fact, the off-channel visual response is masked by the response to light's onset[19,20]. By applying a longer flash of light, retinal responses to the onset and offset of the stimulus can be distinguished: The onset response appears at the light's onset as a phasic positive component followed by a rapid oscillation[21], whereas a distinct offset response component can be observed at the offset of the stimulus[21,22]. It is believed that the ERG wave evoked by the stimulus's onset originates primarily from photoreceptors (mainly rods), Müller cells and on-bipolar cell activity, whereas the ERG wave evoked by the stimulus's offset is mostly attributed to off-bipolar activity[17,19−21,23,24]. The SC in rodents receives 80%–90% of the retinal output[25]. Simultaneous recordings from the retina and SC thus allow assessment of the functional effects of substances injected into the vitreous on retinal processing.
DA neurons receive excitatory (glutamatergic) and inhibitory (GABAergic and glycinergic) inputs that modulate their firing rates, which fluctuate between day and light. High levels of DA released in the retina tune vision for daylight conditions, whereas low levels tune vision for nightlight conditions[9,15]. DA also modulates gap junction coupling between retinal cells. Under photopic conditions, when DA levels are elevated, coupling among rod and cone photoreceptors and among horizontal cells is reduced[26,27]. This, in turn, would reduce horizontal transmission and potentiate the vertical transmission of visual information through the neuronal layers, producing narrower surrounds and smaller receptive fields (RFs), which may improve visual acuity[9] (Fig. 8). The center-surround antagonism of RFs is crucial for spatial vision and contrast perception. Horizontal cells are thought to contribute to RF surrounds; therefore, changes in their activity may induce changes in center-surround RF organization and thereby affect spatial sensitivity[28]. This hypothesis is supported by the finding that reduced retinal DA in Parkinsonian patients is associated with decreased visual contrast sensitivity[10,29].
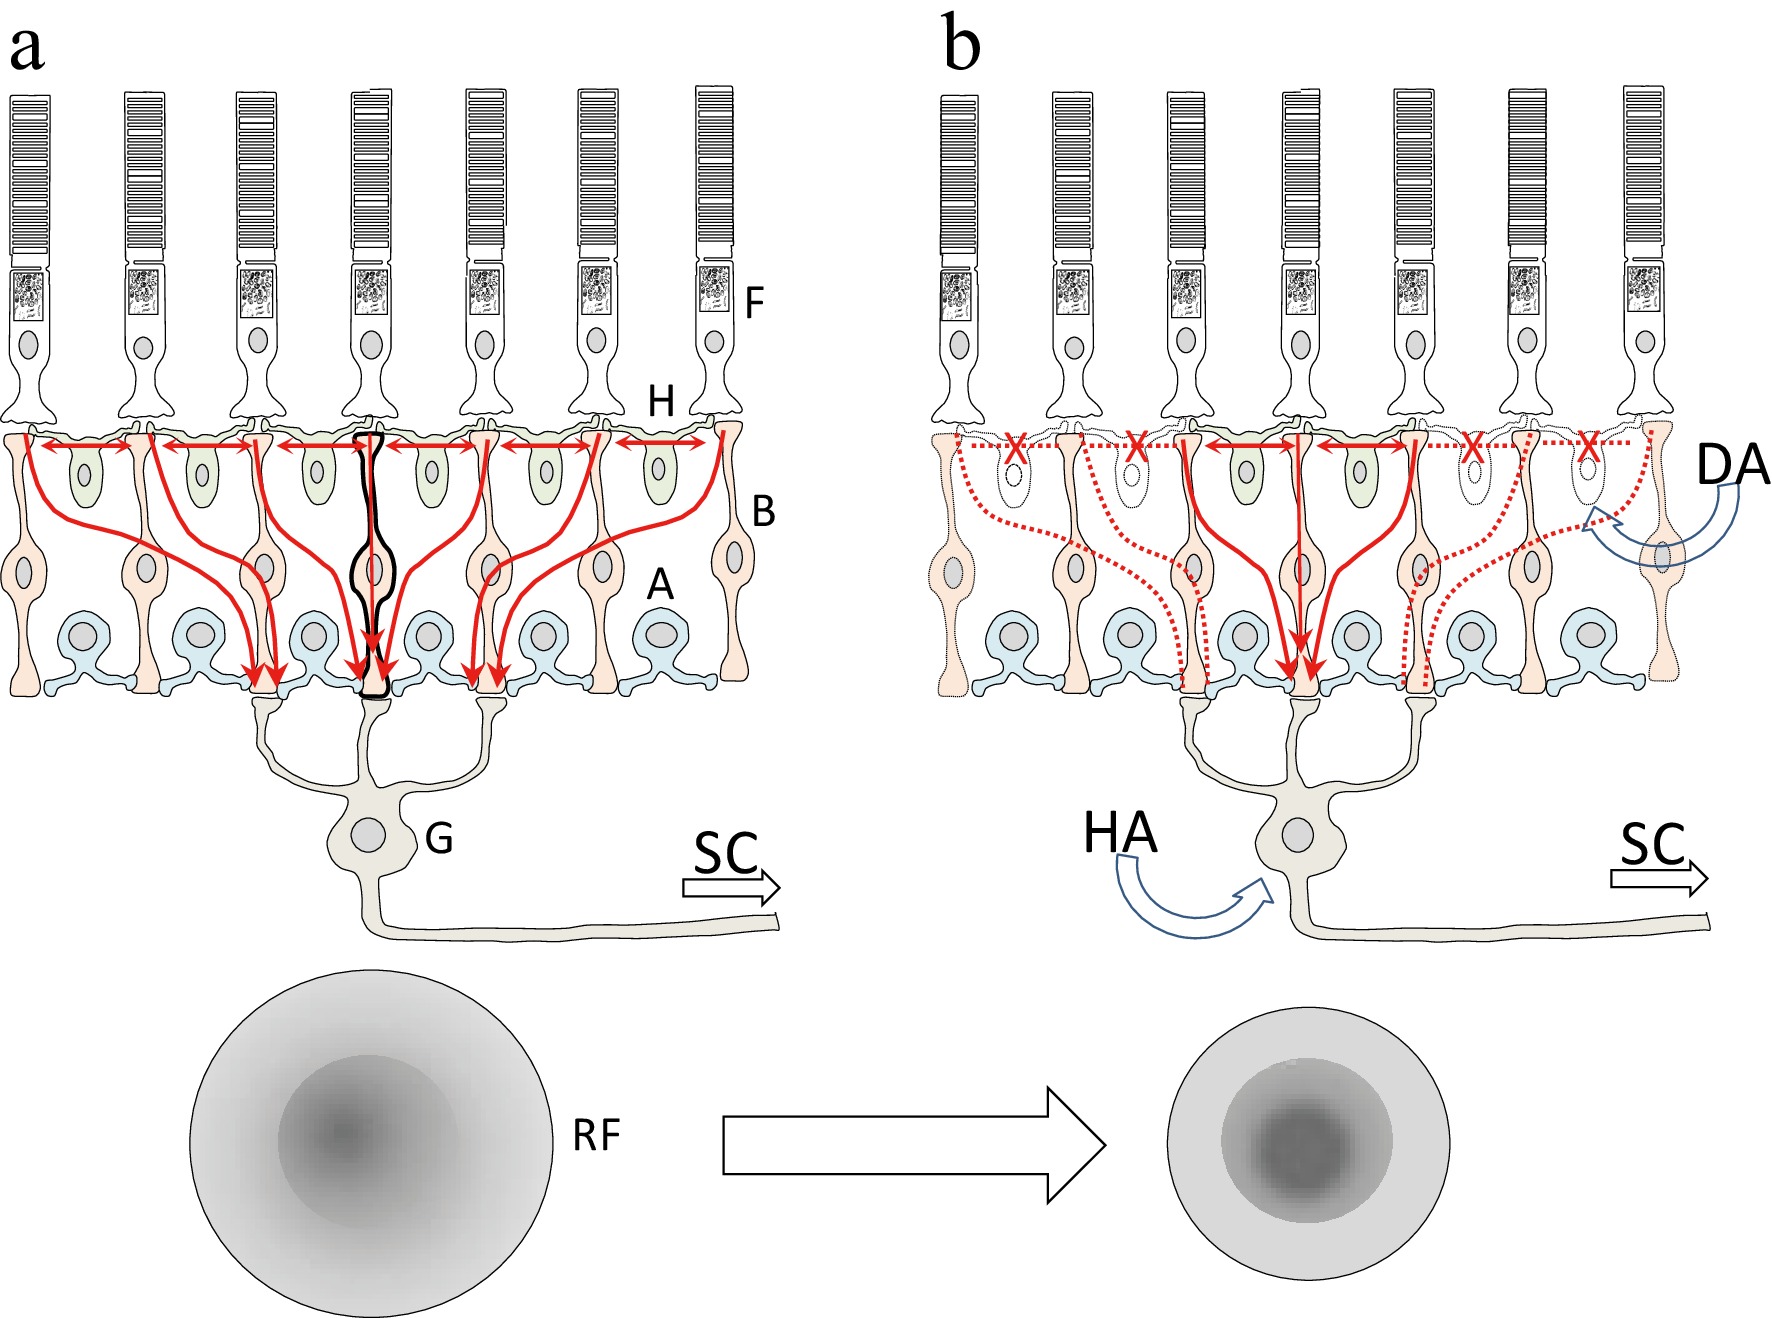
Figure 8.
Diagram illustrating the proposed mechanism of an intravitreal injection of DA. The receptive fields of the retinal ganglion cells (G) exhibit a center-surround organization with opposing effects, which is the basis of contrast sensitivity. Horizontal cells (H) play an important role in shaping these receptive fields by horizontally connecting photoreceptors (F) and bipolar cells (B). Dopamine may act on the DA receptors of the horizontal cells, thereby altering the center-surround structure of the ganglion cells' receptive fields and consequently modifying their contrast sensitivity. Haloperidol may also induce changes in the receptive fields' structure, acting primarily on the ganglion cells responsible for the off-response in the SC. Vertical red arrows indicate the vertical flow of signals from the photoreceptors to a ganglion cell, whereas horizontal red arrows indicate the horizontal flow of signals mediated by horizontal cells. (a) Under normal conditions, signals from several photoreceptors converge onto a single ganglion cell (red arrows). (b) After intravitreal injection of DA, horizontal cell connections are disrupted (crossed horizontal dotted red lines), leading to changes in the vertical flow of signals (vertical red dotted lines) and altering the center-surround structure of the ganglion cells' receptive fields. RF: schematic representation of the receptive field of a ganglion cell with a centre-surround organization. A, amacrine cells; DA, dopamine; HA, haloperidol; SC, superior colliculus.
Intravitreal saline injections served as a control to ensure that injecting 5 µL did not alter the average responses. Immediately following the injections, the sudden increase in intraocular pressure (IP) elicited a slight reduction in SC-related neuronal activity, which was visible in the raster plots but not in the averaged histograms, as IP returned to the baseline after a few trials without altering the overall response profile. This effect became slightly more evident in the collicular offset responses, which are known to be more sensitive to retinal injuries such as those induced by transient changes in IP[17].
In our experiment, the exogenously injected DA was added to the endogenous retinal DA levels (estimated at approximately 1.5 ng/mg in rats), leading to a widespread dissemination of DA across all retinal DA receptors and gap junctions[30]. To reach the retina, DA must diffuse across the hyaloid membrane and the internal limiting membrane of the retina, and through the different retinal layers. Since DA is lipophobic, its diffusion across these barriers is limited, making not possible to determine the exact retinal concentration achieved with our intravitreal injections. We believe that a substantial amount of DA reached the retina, but not at functionally toxic levels, as the transient retinal onset and offset signals both reached the colliculus to elicit reliable responses. The ganglion cell layer expresses D1 and D2 receptors, and HA has affinity for both. As the ganglion cell layer is the most exposed layer in the retina, in direct contact with the vitreous, it could be more affected by the injected solutions, or at least the one receiving the highest concentration. Either D1 or D2 receptors are present in all layers of the retina, including photoreceptors and the retinal pigment epithelium. It is likely that the high dose of injected DA reached saturation levels in the retina, presumably affecting all layers, producing an acute reduction in the positive component of the ERG response to the light's onset, reflecting a change in retinal visual processing. This alteration in retinal activity led to reduced sustained activity in the SC without altering the On– and Off–transient responses, which may contribute to optimizing the phasic response to light reaching the brain and therefore visual contrast sensitivity. This observation suggests a direct relation between the positive ERG wave elicited by the light's onset in the retina and the On–sustained response transmitted to the SC. Given that DA is known to reduce horizontal coupling in the retina, the ERG wave elicited by the stimulus's onset and the On–sustained SC activity could reflect the horizontal transmission of visual information.
The dopamine antagonist HA has been widely used to block DA receptors in studies of impaired dopaminergic transmission[31−33]. HA binds preferentially to D2-like receptors, although binding to D1-like receptors has also been reported[31,34]. It has been shown that HA reduces the activity of the off-center ganglion cells[31]. In the present study, we found a reduction in the collicular response to the stimulus's offset. This finding suggests that DA mediates the offset response: Blocking retinal DA receptors prevents the offset response from reaching the SC (Fig. 7). The presence of an ERG offset response after HA injection may be caused by the selective blocking of the cells that transmit the offset signal to the SC, whereas the remaining cells in the retina remain active. However, we did not observe an increase in the response to the stimulus's offset following the DA injection. One possible explanation is that endogenous DA levels were enough to saturate the DA receptors and, therefore, additional DA had no significant effect. It has been reported that high doses of HA injected intraperitoneally affected the latency and intensity of the b-wave in an ERG[35]. In our study, the ERG's onset and offset responses both remained unchanged, suggesting that the HA concentration used did not reach toxic levels.
-
In conclusion, this study shows that increasing retinal DA levels alter retinal activity, leading to a reduction in the sustained response to light in the SC, whereas the transient responses to the onset and offset of the stimulus remain unaffected. The observed optimization of the phasic signal that reaches the brain may be related to the role DA plays in visual contrast sensitivity. Furthermore, the DA antagonist HA selectively reduced the stimulus offset response in the SC, suggesting that the effect of DA is mediated, at least in part, through the off-channel.
-
All animal studies were approved by the Conselleria do Medio Rural da Xunta de Galicia (Exp. 15012/2023/001, 17 January 2023), and complied with the EU Directive 2010/63/EU for animal experiments or the National Research Council's Guide for the Care and Use of Laboratory Animals. The research followed the "replacement, reduction, and refinement" principles to minimize harm to the animals.
-
The authors confirm their contributions to the paper as follows: designed and performed the experiments: Bermudez MA, Gonzalez F; wrote the manuscript and analyzed the data: Bermudez MA; gave technical and financial support and contributed to the discussion of the results: Gonzalez F. Both authors reviewed the results and approved the final version of the manuscript.
-
The datasets generated during and/or analyzed during the current study are available from the corresponding author on reasonable request.
-
This work was financially supported by ISCIII (RETICS RD16/0008/0003), Xunta de Galicia (Centro Singular de Investigación de Galicia Accreditation 2019−2022, ED431G 2019/02), and the European Union (European Regional Development Fund - ERDF).
-
The authors declare that they have no conflict of interest.
- Copyright: © 2026 by the author(s). Published by Maximum Academic Press, Fayetteville, GA. This article is an open access article distributed under Creative Commons Attribution License (CC BY 4.0), visit https://creativecommons.org/licenses/by/4.0/.
-
About this article
Cite this article
Bermudez MA, Gonzalez F. 2026. Effect of intravitreal dopamine overdose on the retino-collicular pathway. Visual Neuroscience 43: e024 doi: 10.48130/vns-0026-0019 

Effect of intravitreal dopamine overdose on the retino-collicular pathway
- Received: 03 February 2026
- Revised: 22 March 2026
- Accepted: 27 April 2026
- Published online: 05 June 2026
Abstract: Dopamine (DA) modulates signaling within the retina. The biochemistry and distribution of dopaminergic neurons in the retina have been extensively characterized. However, little is known about the effect of a high dopamine concentration in the retina on the retino-collicular pathway. In this experiment, functional neural activity was recorded simultaneously in the retina by electroretinogram (ERG) and in the superior colliculus (SC) in rats. Recordings were made without interruption before, during, and after intravitreal injections of DA and its antagonist, haloperidol (HA). A 3-s flash of light allowed discrimination between responses to the onset and offset of the stimulus. We found that a high dose of intravitreal injection of DA altered the ERG waveform and significantly (~50%) reduced the sustained response to light in the SC, whereas both transient onset and offset responses remained unchanged. Conversely, injection of the DA antagonist HA did not affect the ERG waveform but drastically (~80%) reduced the offset response in the SC. Our results support the idea that DA contributes to enhancing contrast sensitivity. Furthermore, our data indicate that this effect may occur through a reduction in the sustained response while preserving transient responses to stimulus onset and offset.
-
Key words:
- On response /
- Off response /
- Visual pathway