













-
MiRNAs, as small non-coding regulatory molecules, play a prominent role in the formation of neural circuits that control physiological functions and many cellular processes through posttranscriptional fine-tuning of gene expression involved in differentiation, development, inflammation, growth, and show spatiotemporally defined distribution in the retina[1−4]. The biomarker role of miRNAs is also well described in several retinal studies, which anticipate an opportunity for their application in potential therapeutic strategies[5]. The use of antagomirs—chemically modified oligonucleotides designed to silence specific miRNAs—stands out as a promising tool. Beyond its potential therapeutic implications, this methodology also provides valuable insights into the precise relevance of individual miRNAs in tissue-specific processes.
Among the hundreds of retinal miRNAs, miR-9 is recognized as one of the most significant for development, influencing both neurological and angiogenic pathways[5−8]. During retinal development, retinal cells can be divided into two main groups depending on the timing of their generation. Early-born cells are generated during embryonic development, such as retinal ganglion and amacrine cells, cones, and horizontal cells, while late-born cells (bipolar cells, rods, and Müller cells) are generated postnatally. Concurrent with the sequential generation of different retinal cell types, miRNAs show dynamic expression profiles that reflect their involvement in distinct stages of retinal maturation[1,4,9,10]. In our previous study, we described the precise spatiotemporal expression pattern of miR-9 in the rat retina during the first 3 postnatal weeks. Our findings revealed that miR-9 expression is characterized by two distinct peaks: a minor peak at postnatal day 3 (P3) and a more prominent peak at postnatal day 10 (P10)[11].
It was also demonstrated that miR-9 is predominantly localized in the retinal ganglion cells and horizontal cells[11], with some evidence for its presence in Müller glia cells[8,12]. Former studies also confirmed the elevation of miR-9 expression levels at P10 in mouse retina[13]. These results provide a foundation for understanding the functional significance of miR-9 in retinal development and underscore the importance of targeting its activity during the critical developmental time-frame.
For a better understanding of the role of miR-9 in the formation of the retina, we have intravitreally treated albino Wistar rats with antagomir-9 during the postnatal development at P9, one day before the more prominent peak at P10. To verify the effect of this treatment, histological, in situ hybridisation, and immunocytochemical techniques were used to follow the cell-specific effects after 1-month survival.
-
All experimental procedures were approved by the Institutional Animal Care and Use Committee of the University of Pécs (BAI/35/51-58/2016) and were conducted in accordance with ARRIVE guidelines. Albino Wistar rats were housed under identical conditions (12:12 h light/dark cycles, food and water ad libitum). Intravitreal injections were performed at postnatal day 9 (P9), and tissue collection took place at 1 month of age. Rats were divided randomly into three groups: antagomir-9 treated, negative control, and untreated. Intravitreal injections were performed in the left eye using a Hamilton microsyringe (10 µl; Kvalitex, Budapest) with Hiperfect Transfection Reagent (Qiagen, Germany), while the right eye served as an internal control. The left eyes in the antagomir-9 group received 2.5 µl (100 pmol) of mirVana miRNA inhibitor hsa-mir-9-3p (Thermo Fisher Scientific, Waltham, MA, USA) mixed with HiPerfect Transfection Reagent (Qiagen). In the control condition, the right eyes received the same volume of either transfection reagent diluted in 0.9% saline, HiPerfect transfection reagent alone, or a non-targeting negative control miRNA inhibitor (100 pmol) (Thermo Fisher Scientific, Waltham, MA, USA). During data analysis, no significant differences were detected among these three control subgroups across any measured parameter; therefore, they were pooled into a single control group to increase statistical power and simplify presentation. At 1 month of age, rats were anesthetized by inhalation using Forane before sacrifice.
Histology
-
After enucleation, eyecups were immersion-fixed overnight in 4% paraformaldehyde (PFA; Merck, Hungary) and 1% glutaraldehyde prepared in 0.1 M phosphate buffer (PB; Spektrum3D, Hungary). The following day, tissues were rinsed in distilled water and dehydrated through a graded ethanol series (30%, 50%, 70%, 90%, 100%). Samples were then transferred to propylene oxide (VWR, Budapest, Hungary), infiltrated with a propylene oxide-epoxy resin mixture, and embedded in Durcupan ACM resin (Merck, Budapest, Hungary). Polymerisation was performed at 60 °C for 48 h.
Semi-thin (2 μm) sections were cut (Leica microtome, Germany) within a 1–2 mm distance of the optic nerve head to ensure consistent sampling of the central retina. Sections were stained with 1% toluidine blue (Sigma, Budapest, Hungary) and examined using a Nikon Eclipse 80i microscope (20× magnification objective; SPOT Basic program). Section orientation was adjusted if it was needed. The measurements from retinal sections were made as follows: from the outer limiting membrane (OLM) to the inner limiting membrane (ILM). For each animal (n = 4 per group), 10 non-overlapping fields were analyzed, and values are presented as mean ± SD (GraphPad Prism 8.1).
Immunohistochemistry
-
Eyecups were fixed in 4% paraformaldehyde for 2 h, rinsed in phosphate-buffered saline (PBS), and cryoprotected in 15% and 30% sucrose solutions. Tissues were embedded in a cryomedium (Shandon Cryomatrix, USA) and sectioned in a cryostat (Leica, Germany) at 10 μm thickness. Primary antibodies included markers for retinal ganglion cells (Brn3a)[14], horizontal cells (calbindin), amacrine cells (calretinin, parvalbumin, tyrosine hydroxylase), rod bipolar cells (PKCΑα), and Müller glia (GFAP) and OneCut2 protein (Supplementary Table S1). Sections were incubated with primary antibodies overnight at room temperature, followed by fluorescent secondary antibodies (anti-rabbit IgG conjugated with Alexa Fluor '568'; anti-rabbit IgG conjugated with Alexa Fluor '488'; anti-mouse IgG conjugated with 'Cy3.5'; and anti-mouse IgG conjugated with Alexa Fluor '488') in the dark for 2 h at room temperature (Supplementary Table S2). Slides were mounted with Prolong Gold antifade reagent containing DAPI (Thermo Fisher Scientific, Waltham, MA, USA). Images were acquired using an Olympus Fluoview FV-1000 confocal microscope (Olympus IX 81 inverse platform; Olympus, Tokyo, Japan) with fixed laser intensities across all samples.
Quantitative analysis was performed on 10 central retinal fields per animal (n = 4 per group), sampled within 1–2 mm of the optic nerve head. Brn3a-positive retinal ganglion cells were counted manually at 20× magnification and expressed as the number of labeled cells per 100 μm retinal length. Image acquisition and cell counting were performed by different investigators, and the observers were blinded to the treatment groups during counting. For all other markers, fluorescence intensity was quantified using standardized regions of interest in the central retina. Normality of data distribution was assessed using D'Agostino–Pearson, Shapiro–Wilk and Kolmogorov–Smirnov tests in GraphPad Prism 8.0.1. Except for Brn3a (which met normality criteria and was tested with parametric statistics, one-way ANOVA with Bonferroni's post hoc test), all immunolabelling datasets were analyzed with non-parametric statistics (Kruskal–Wallis test with Dunn's multiple comparisons test). Data are presented as mean ± SD together with adjusted p-values, and differences were considered significant at p < 0.05. (Supplementary Tables S3–S8).
MicroRNA in situ hybridisation
-
Eyecups were prepared and fixed (4% PFA for 20 min), cryoprotected, embedded in Shandon Cryomatrix, cut at 12 µm in a cryostat and stored at −80 °C until use. Methodology of microRNA ISH with miR-9 (Exiqon, sequence: TCATACAGCTAGATAACCAAAGA) was described in detail in our previous work[11,15]. Briefly, after postfixation (4% PFA for 10 min), sections were treated with proteinase K (5 mg/mL for 10 min; Sigma-Aldrich, Budapest, Hungary), acetylated in acetic anhydride/triethanolamine and pre-hybridized in a hybridization solution for 4 h at 37 °C (50% formamide, 0.3 M sodium-chloride (pH 7.0), 20 mM Tris-HCl; 5 mM EDTA, 1 × Denhardt's solution, 0.5 mg/mL yeast tRNA, 1 × Denhardt's solution). Then, retinal tissues were hybridized with a 5′ DIG-labelled LNA detection probe in a hybridization solution at 56 °C overnight. After hybridization, sections were washed with saline-sodium citrate (SSC) solutions (5 × SSC, 0.2 × SSC, 1 × SSC) and incubated with a TNB (0.1 M Tris-HCl [pH 7.5], 0.15 M NaCl, 0.5% Blocking Reagent [Roche, Budapest, Hungary]) blocking solution for 30 min (Roche, Welwyn Garden City, UK) at room temperature. Then sections were incubated with a mouse anti-DIG horseradish peroxidase (HRP) antibody (1:500, Perkin Elmer, Per-Form Hungary Kft., Budapest, Hungary) for 30 min. After this step, slides were washed in the TNT (Tris–NaCl–Tween) buffer (3 × 5 min). ISH signals were detected using the TSA (tyramide signal amplification) system according to the manufacturer's instructions (1:50, Perkin Elmer, Per-Form Hungary Kft., Budapest, Hungary). After TNT buffer washes (3 × 5 min), sections were mounted in Prolong Gold antifade reagent with DAPI (Thermo Fisher Scientific, Waltham, MA, USA). The following day, slides were imaged and analysed in a confocal microscope (Olympus IX 81 inverse platform, Olympus Fluoview FV-1000 Laser Confocal Scanning Microscope; Olympus, Tokyo, Japan) with adequate laser beams.
Protein–protein interaction network analysis (STRING)
-
To investigate the molecular context and possible interactions among retinal marker proteins examined in this study, we performed a protein–protein interaction network analysis using the STRING v11.5 (Search Tool for Retrieval of Interacting Genes/Proteins) database (
https://string-db.org )[16]. The analysis included the proteins GFAP, PKCα (Prkca), calbindin (Calb1), calretinin (Calb2), parvalbumin (Pvalb), tyrosine hydroxylase (Th), and the transcriptional factor OneCut2. Official gene symbols were used for all queries (organism: Rattus norvegicus). The network was generated using default interaction sources (experiment database, co-expression, neighborhood, gene fusion, and co-occurrence), and a medium confidence interaction score (0.4). -
To clarify the impact of miR-9 on early postnatal retinal development, we examined the structural and cellular effects of intravitreal antagomir-9 treatment at P9, focusing on outcomes after 1 month of survival. Our analyses included in situ hybridization for miR-9, morphometric analysis of retinal thickness, and immunohistochemical characterization of multiple neuronal and glial markers.
In situ hybridization
-
The miR-9 expression decreased in antagomir-9-treated retinas (Fig. 1c) compared to both the untreated and negative control groups (Fig. 1a, b). We have found that miR-9 positive cells are mainly localized in the ganglion cell layer both in the untreated (Fig. 1a) and in the negative control retinas (Fig. 1b). There was almost no labelling seen in the antagomir-9-treated group (Fig. 1c).

Figure 1.
Localization of miR-9 in the (a) non-treated control group. (b) negative control group, and (c) antagomir-9-treated group. Insert images demonstrate the overlap of miR-9 with 4′,6-diamidino-2-phenylindole (DAPI); arrows indicate cells in the ganglion cell layer. GCL, ganglion cell layer; IPL, inner plexiform layer; INL, inner nuclear layer; OPL, outer plexiform layer; ONL, outer nuclear layer. Scale bar represents 50 and 25 µm on the inserts.
Retinal histology
-
Retinal thickness, measured from the outer limiting membrane (OLM) to the inner limiting membrane (ILM), showed significant differences in the negative control group compared to non-treated controls (Fig. 2a). Immunohistochemical staining for Brn3a, a marker of retinal ganglion cells, demonstrated a reduced number of ganglion cells in the antagomir-9-treated group (Fig. 2e) compared to both the untreated and negative control groups (Fig. 2c, d), as quantified in Fig. 2b. The number of Brn3-positive cells in the GCL was counted per 100 μm segment.
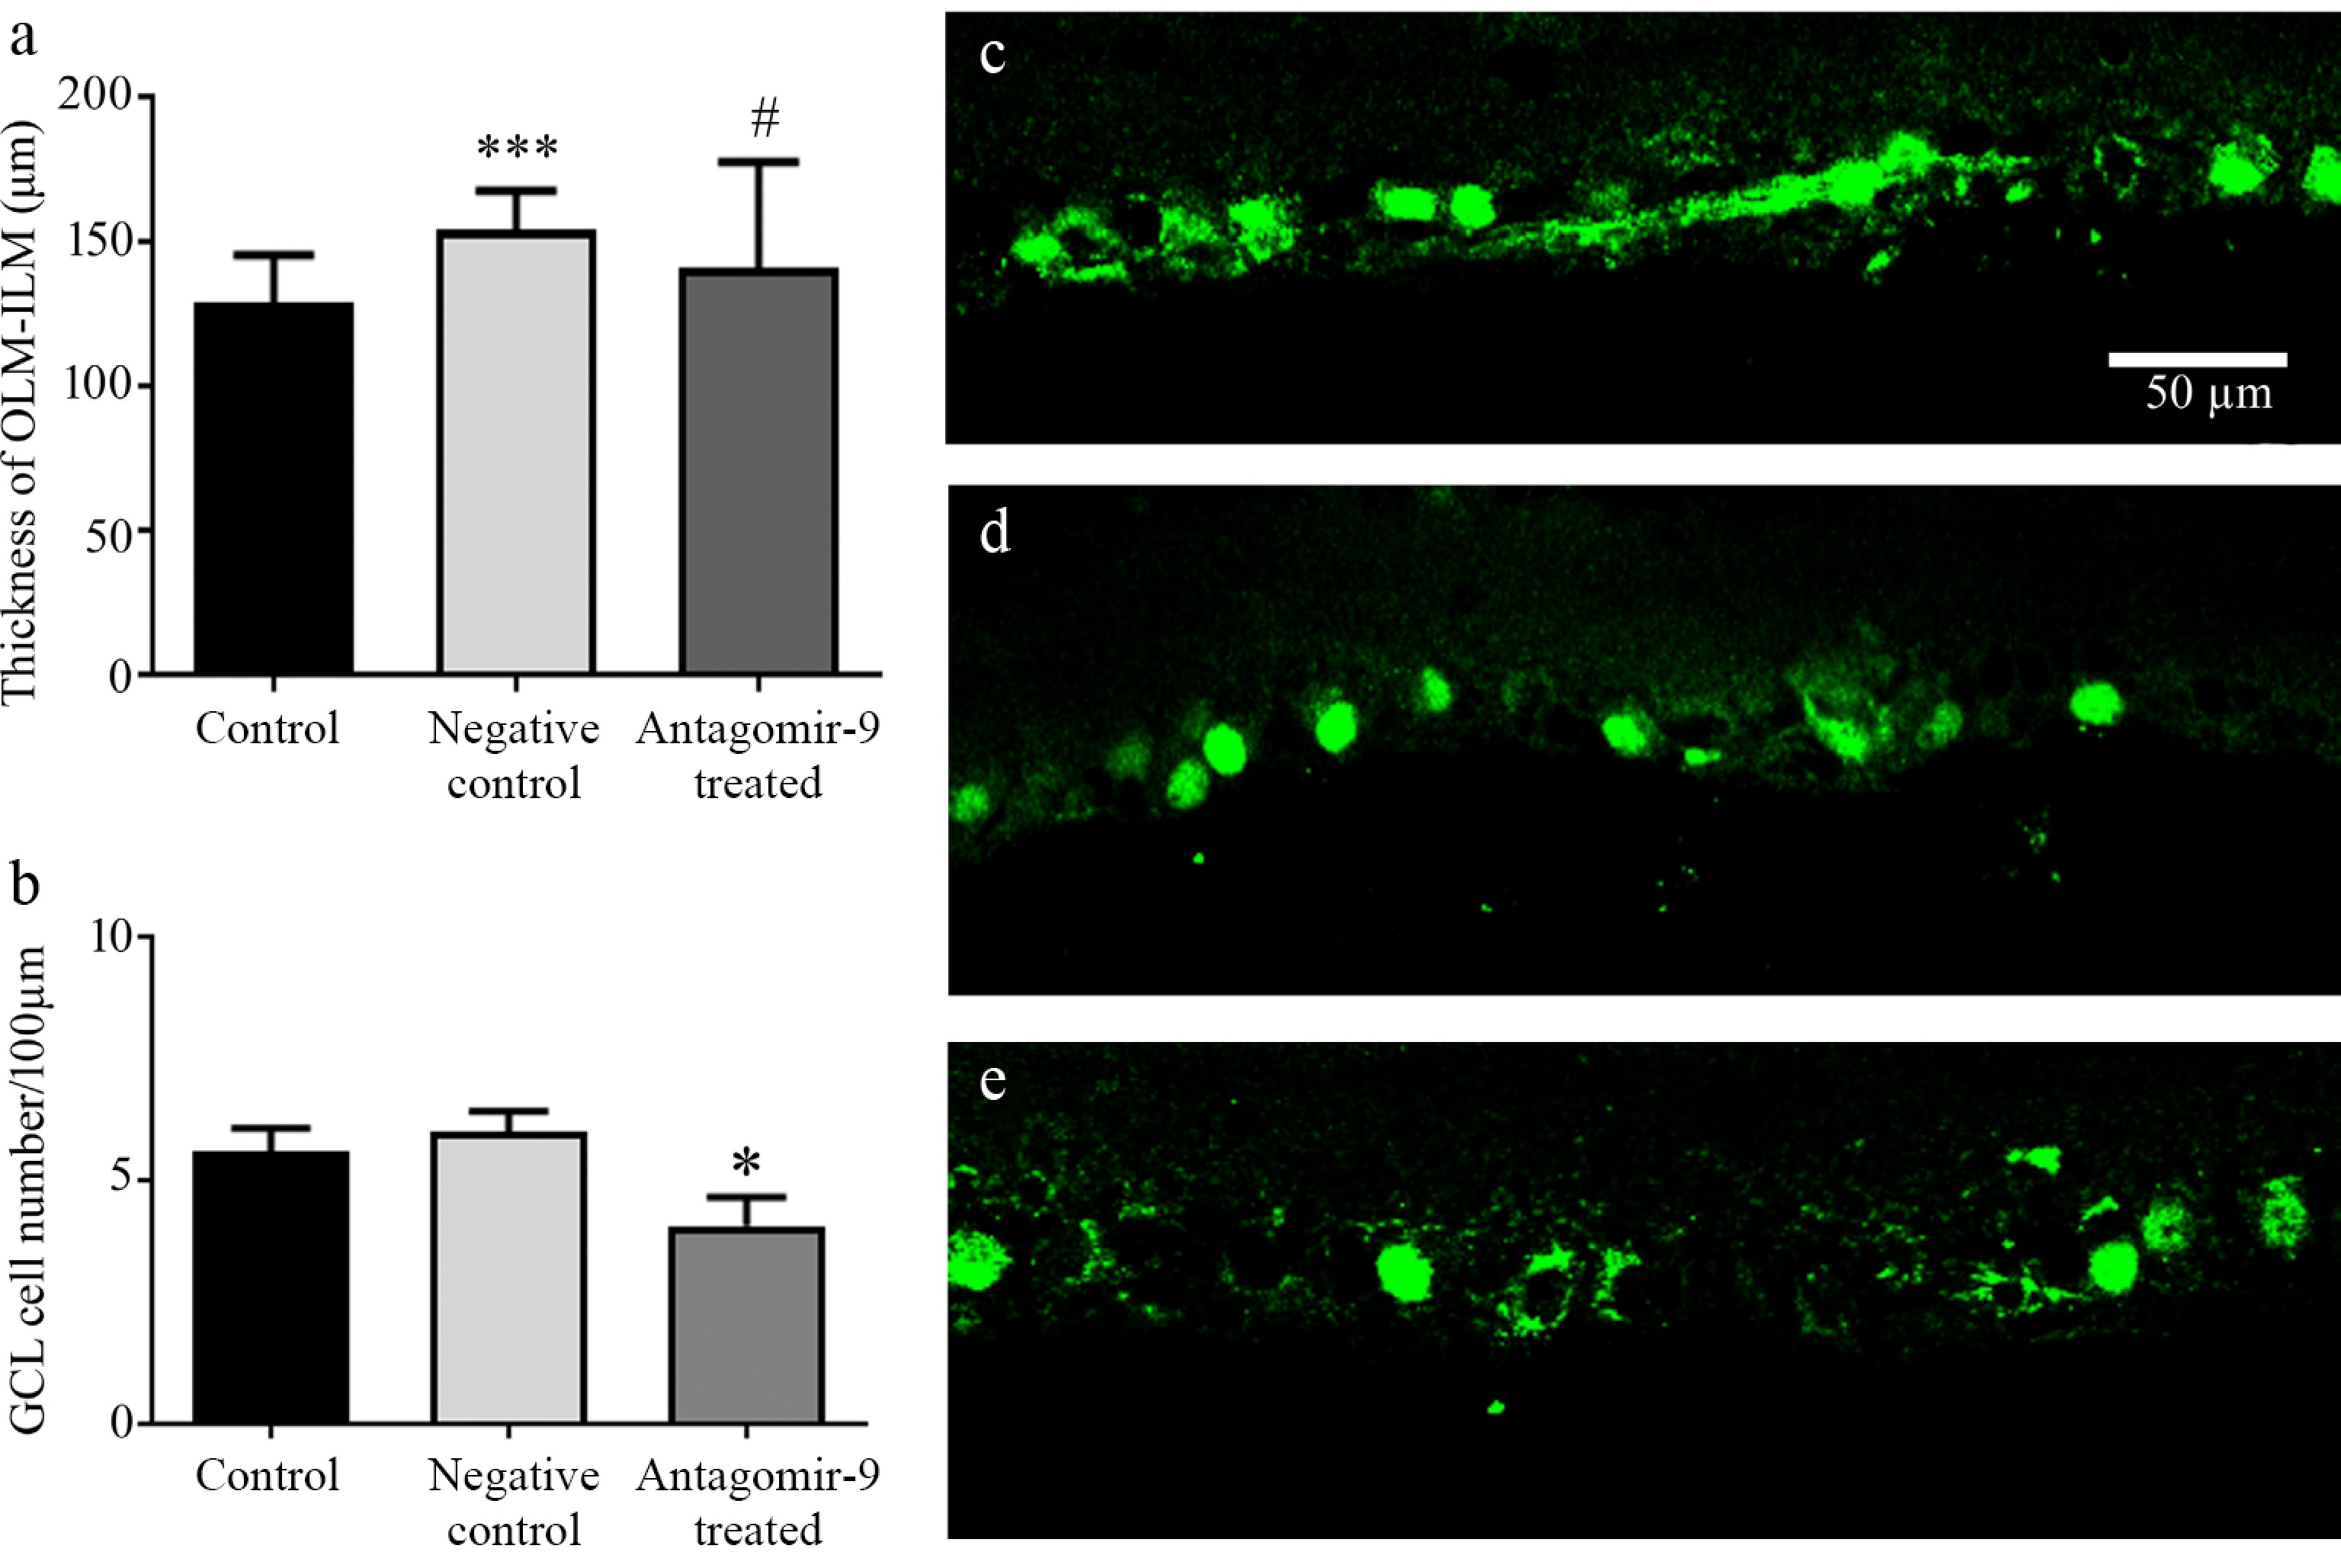
Figure 2.
(a) Retinal thickness and (b) ganglion cell number in different groups. Brn3a positive ganglion cells in rat retinas after different treatments: (c) non-treated control group; (d) negative control group; and (e) antagomir-9 treated group. Data are presented as mean ± SD, where * compared to control, # compared to negative control * or # indicate p < 0.05; and *** indicates p < 0.001. Statistical analysis was performed with n = 4 animals per group (biological replicates), counting 10 non-overlapping microscopy frames per eye. Normality of data was assessed by D'Agostino–Pearson, Shapiro–Wilk, and Kolmogorov–Smirnov tests. Group differences were analyzed using one-way ANOVA followed by Bonferroni's post hoc test. OLM, outer limiting membrane; ILM, inner limiting membrane; GCL, ganglion cell layer. Scale bars represent 50 µm.
Immunohistochemistry
-
Calbindin immunofluorescence intensity differs substantially between experimental groups for both cell bodies and axons. Calbindin expression decreased both in the cell body and the processes of horizontal cells after antagomir-9 treatment (Fig. 3a, c) compared to non-treated and negative controls (Fig. 3a [1], [2]; Kruskal–Wallis test: H = 8.167, p = 0.0169; Dunn's post hoc test: control vs. negative control, p > 0.9999; control vs. antagomir-9, p = 0.1841; negative control vs. antagomir-9, p = 0.0150; Fig. 3b; see also Supplementary Table S3.
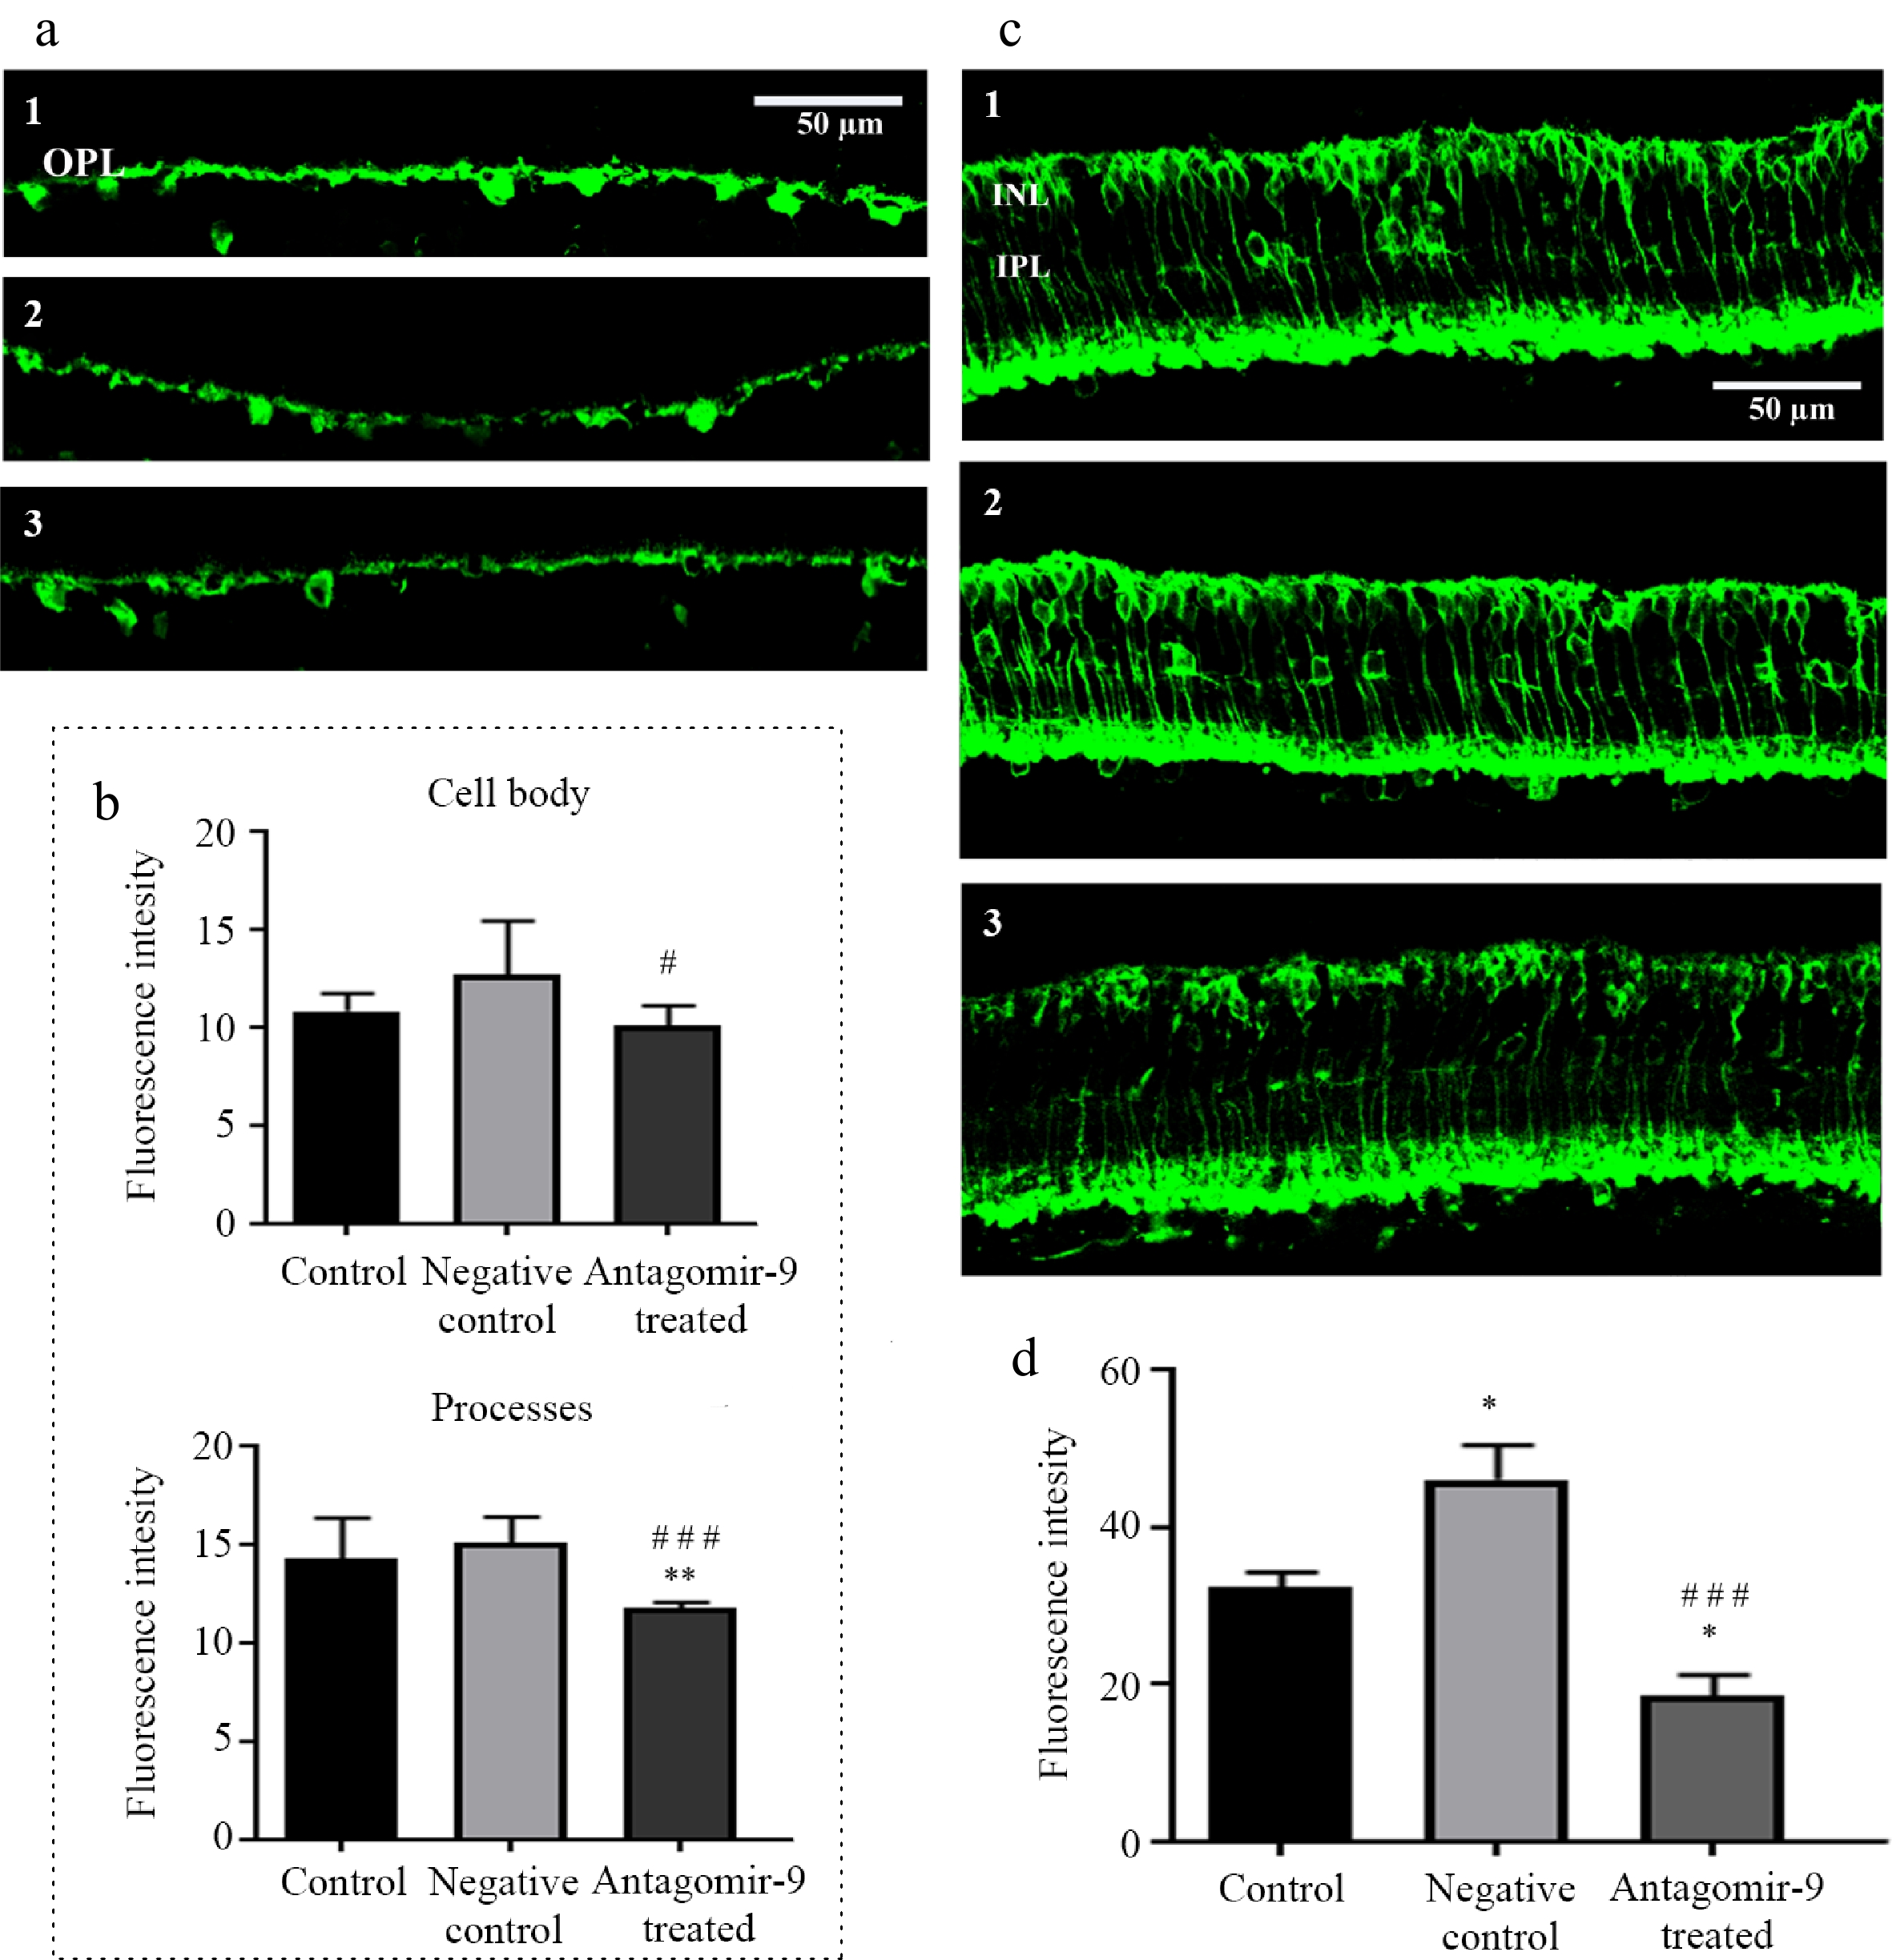
Figure 3.
Calbindin and PKCα expression in horizontal and rod bipolar cells after different treatments. (a) Representative retina sections stained for calbindin. (b) Quantification of calbindin immunofluorescence intensity in horizontal cell bodies and their processes in the outer plexiform layer (OPL). (c) Representative PKCΑα immunostaining in rod bipolar cells across the three experimental groups, showing reduced labeling of the cell bodies in the inner nuclear layer (INL) after antagomir-9 treatment, while terminals in the inner plexiform layer (IPL) remain relatively preserved. (d) Quantification of PKCα immunofluorescence intensity in rod bipolar cell bodies. For all quantifications, n = 4 animals per group (biological replicates); for each retina, values were obtained from 10 non-overlapping fields in the central retina. Data are presented as mean ± SD. Group differences were analyzed with the Kruskal–Wallis test followed by Dunn's multiple-comparison test. rat retina. * Compared to control; # compared to negative control; * indicates p < 0.05 and ### indicates p < 0.001. The numbers indicate the following conditions: (1) non-treated control group; (2) negative control group; and (3) antagomir-9 treated group. Abbreviations: outer plexiform layer (OPL), inner plexiform layer (IPL); and inner nuclear layer (INL). Scale bar represents 50 µm.
PKCα expression was markedly reduced in rod bipolar cells of retinas from the antagomir-9-treated group (Fig. 3c [3]) compared to untreated controls (Fig. 3c [1]). This reduction was particularly evident in the cell bodies in the inner nuclear layer, which exhibited an obvious loss of immunoreactivity in the antagomir-9 group (Fig. 3c [3]), as opposed to both the control (Fig. 3c [1]) and negative control groups (Fig. 3c [2]). In the IPL, the terminals of rod bipolar cells did not lose much of their immunoreactivity. The Kruskal–Wallis test of PKCα expression levels showed a highly significant overall difference (H = 26.12, p < 0.0001). Post hoc pairwise comparisons using Dunn's test revealed that PKC α expression was significantly higher in the negative control group compared to the control group (mean ± SD: 45.98 ± 4.35 vs. 32.42 ± 1.78; adjusted p = 0.0318), and significantly decreased in the antagomir-9-treated group compared to both the control (18.60 ± 2.57 vs. 32.42 ± 1.78; adjusted p = 0.0318) and negative control groups (18.60 ± 2.57 vs. 45.98 ± 4.35; adjusted p < 0.0001; Fig. 3d; Supplementary Table S4).
For Tyrosine hydroxylase (TH) immunoreactivity, significant alterations were primarily detected in the processes rather than the cell bodies (Fig. 4a, b; Supplementary Table S5). The most pronounced difference in the processes was observed between the untreated and negative controls (Fig. 4a, b) vs. the antagomir-9-treated group (Fig. 4a, c); adjusted p = 0.0026 and p = 0.0150, respectively. The immunoreactivity of the cell bodies changed similarly (adjusted p = 0.0196 and p < 0.0001, respectively) but remained detectable in the antagomir-9-treated preparations (Fig. 4b; Supplementary Table S5).
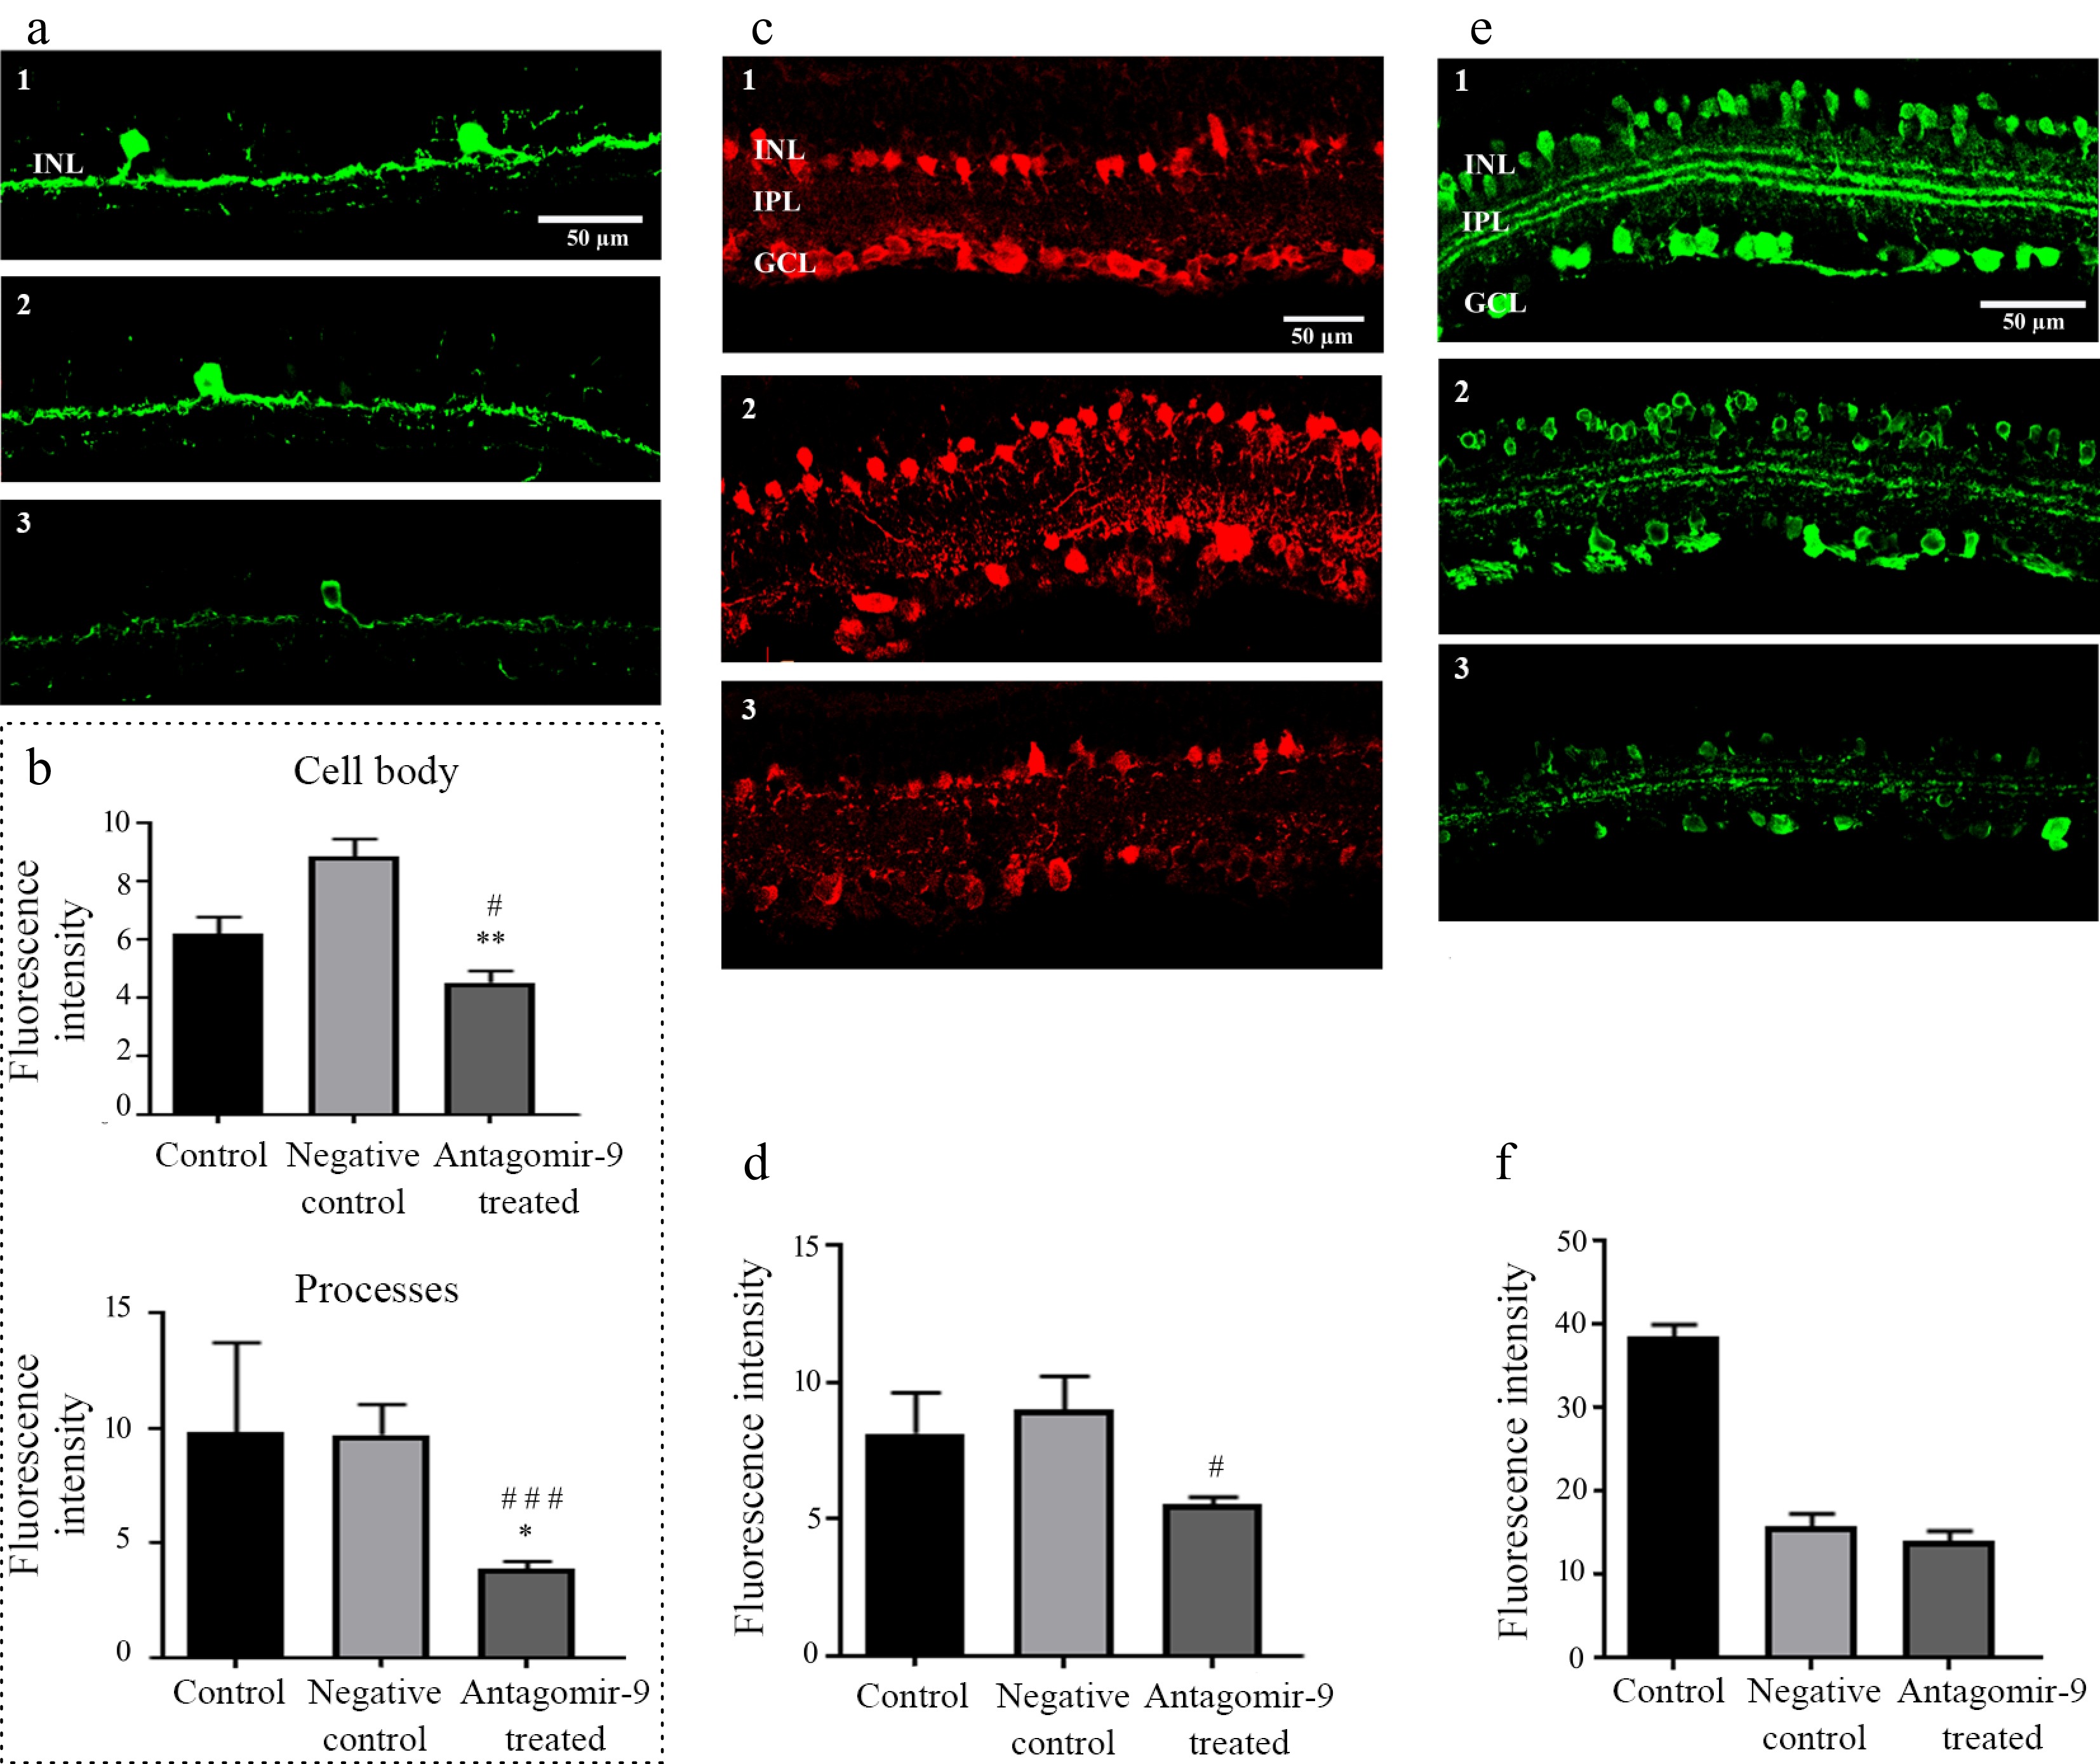
Figure 4.
Amacrine and inner retinal markers after different treatments. (a) Representative retina sections stained with tyrosine hydroxylase (TH) immunostaining. (b) Quantification of TH immunofluorescence intensity in retinal processes and cell bodies. (c) Representative parvalbumin immunostaining, illustrating loss of parvalbumin-positive somata in the ganglion cell layer and weaker labelling in amacrine cells after treatment. (d) Quantification of parvalbumin immunofluorescence intensity. (e) Representative calretinin immunostaining, showing reduced labelling of amacrine cell bodies and their processes in the inner plexiform layer (IPL) following antagomir-9 treatment. (f) Quantification of calretinin immunofluorescence intensity. For all quantifications, n = 4 animals per group (biological replicates); for each retina, values were obtained from 10 non-overlapping fields in the central retina. Data are presented as mean ± SD. Normality was tested using D'Agostino–Pearson, Shapiro–Wilk and Kolmogorov–Smirnov tests; group differences were analyzed with Kruskal–Wallis test followed by Dunn's multiple-comparison test. * Compared to control, ** indicates p < 0.01. The numbers indicate the following conditions: (1) non-treated control, (2) negative control, (3) antagomir-9-treated group. Abbreviations: inner nuclear layer (INL), inner plexiform layer (IPL), and ganglion cell layer (GCL). Scale bar represents 50 µm.
Parvalbumin (PA) immunoreactivity was markedly altered in antagomir-9-treated retinas, as illustrated in Fig. 4c, d. The most pronounced changes were observed in the ganglion cell layer, where numerous cell bodies were no longer detectable following treatment. Additionally, the remaining amacrine cell bodies exhibited notably weaker PA labeling (Fig. 4c [3]) compared to controls (Fig. 4c [1]). These findings indicate a substantial reduction in PA expression, particularly affecting both ganglion and amacrine cell populations in the treated retinas (Fig. 4c [3]). Quantitative analysis confirmed a significant reduction in PA expression in the antagomir-9 group compared to the negative control group (mean ± SD: 5.50 ± 0.23 vs. 9.00 ± 0.98; adjusted p = 0.0128), as determined by the Kruskal–Wallis test with Dunn's post hoc correction. No significant differences were found between the control and negative control (p = 0.60) or between the control and antagomir-9 groups (p = 0.34; Fig. 4d; Supplementary Table S6).
Calretinin expression was markedly reduced in the antagomir-9-treated group (Fig. 4e [3]) compared to both the untreated control (Fig. 4e [1]) and the negative control group (Fig. 4e [2]). Notably, amacrine cells exhibited substantially weaker calretinin immunoreactivity in the antagomir-9 group, including reduced labeling of their processes within the inner plexiform layer (IPL), relative to controls. Quantitative analysis confirmed a significant decrease in calretinin intensity in antagomir-9-treated retinas (mean ± SD: 14.07 ± 0.97) vs. untreated controls (30.97 ± 9.12; adjusted p = 0.0069; n = 4/group), as assessed by the Kruskal–Wallis test with Dunn's post hoc comparison. No significant difference was found between the negative control and antagomir-9 group (adjusted p = 0.50) or between the control and the negative control groups (adjusted p = 0.28; Fig. 4f; Supplementary Table S7).
The control group (Fig. 5a [1]) displayed the highest GFAP fluorescence intensity. Similar staining was observed in the negative control group (Fig. 5a [2]), while the antagomir-9-treated group (Fig. 5a [3]) showed less intense fluorescence. Quantitative analysis by the Kruskal–Wallis test (Fig. 5b; Supplementary Table S8) revealed a significant overall difference (p < 0.0001). Dunn's post hoc test confirmed significantly lower GFAP intensity in the antagomir-9 group (mean ± SD: 2.14 ± 0.11) vs. both the control (4.37 ± 1.21; mean rank difference = 10.5; adjusted p = 0.0017) and the negative control (3.13 ± 0.18; mean rank difference = 7.5; adjusted p = 0.0412) groups. No significant difference was found between the control and the negative control groups (adjusted p = 0.97).
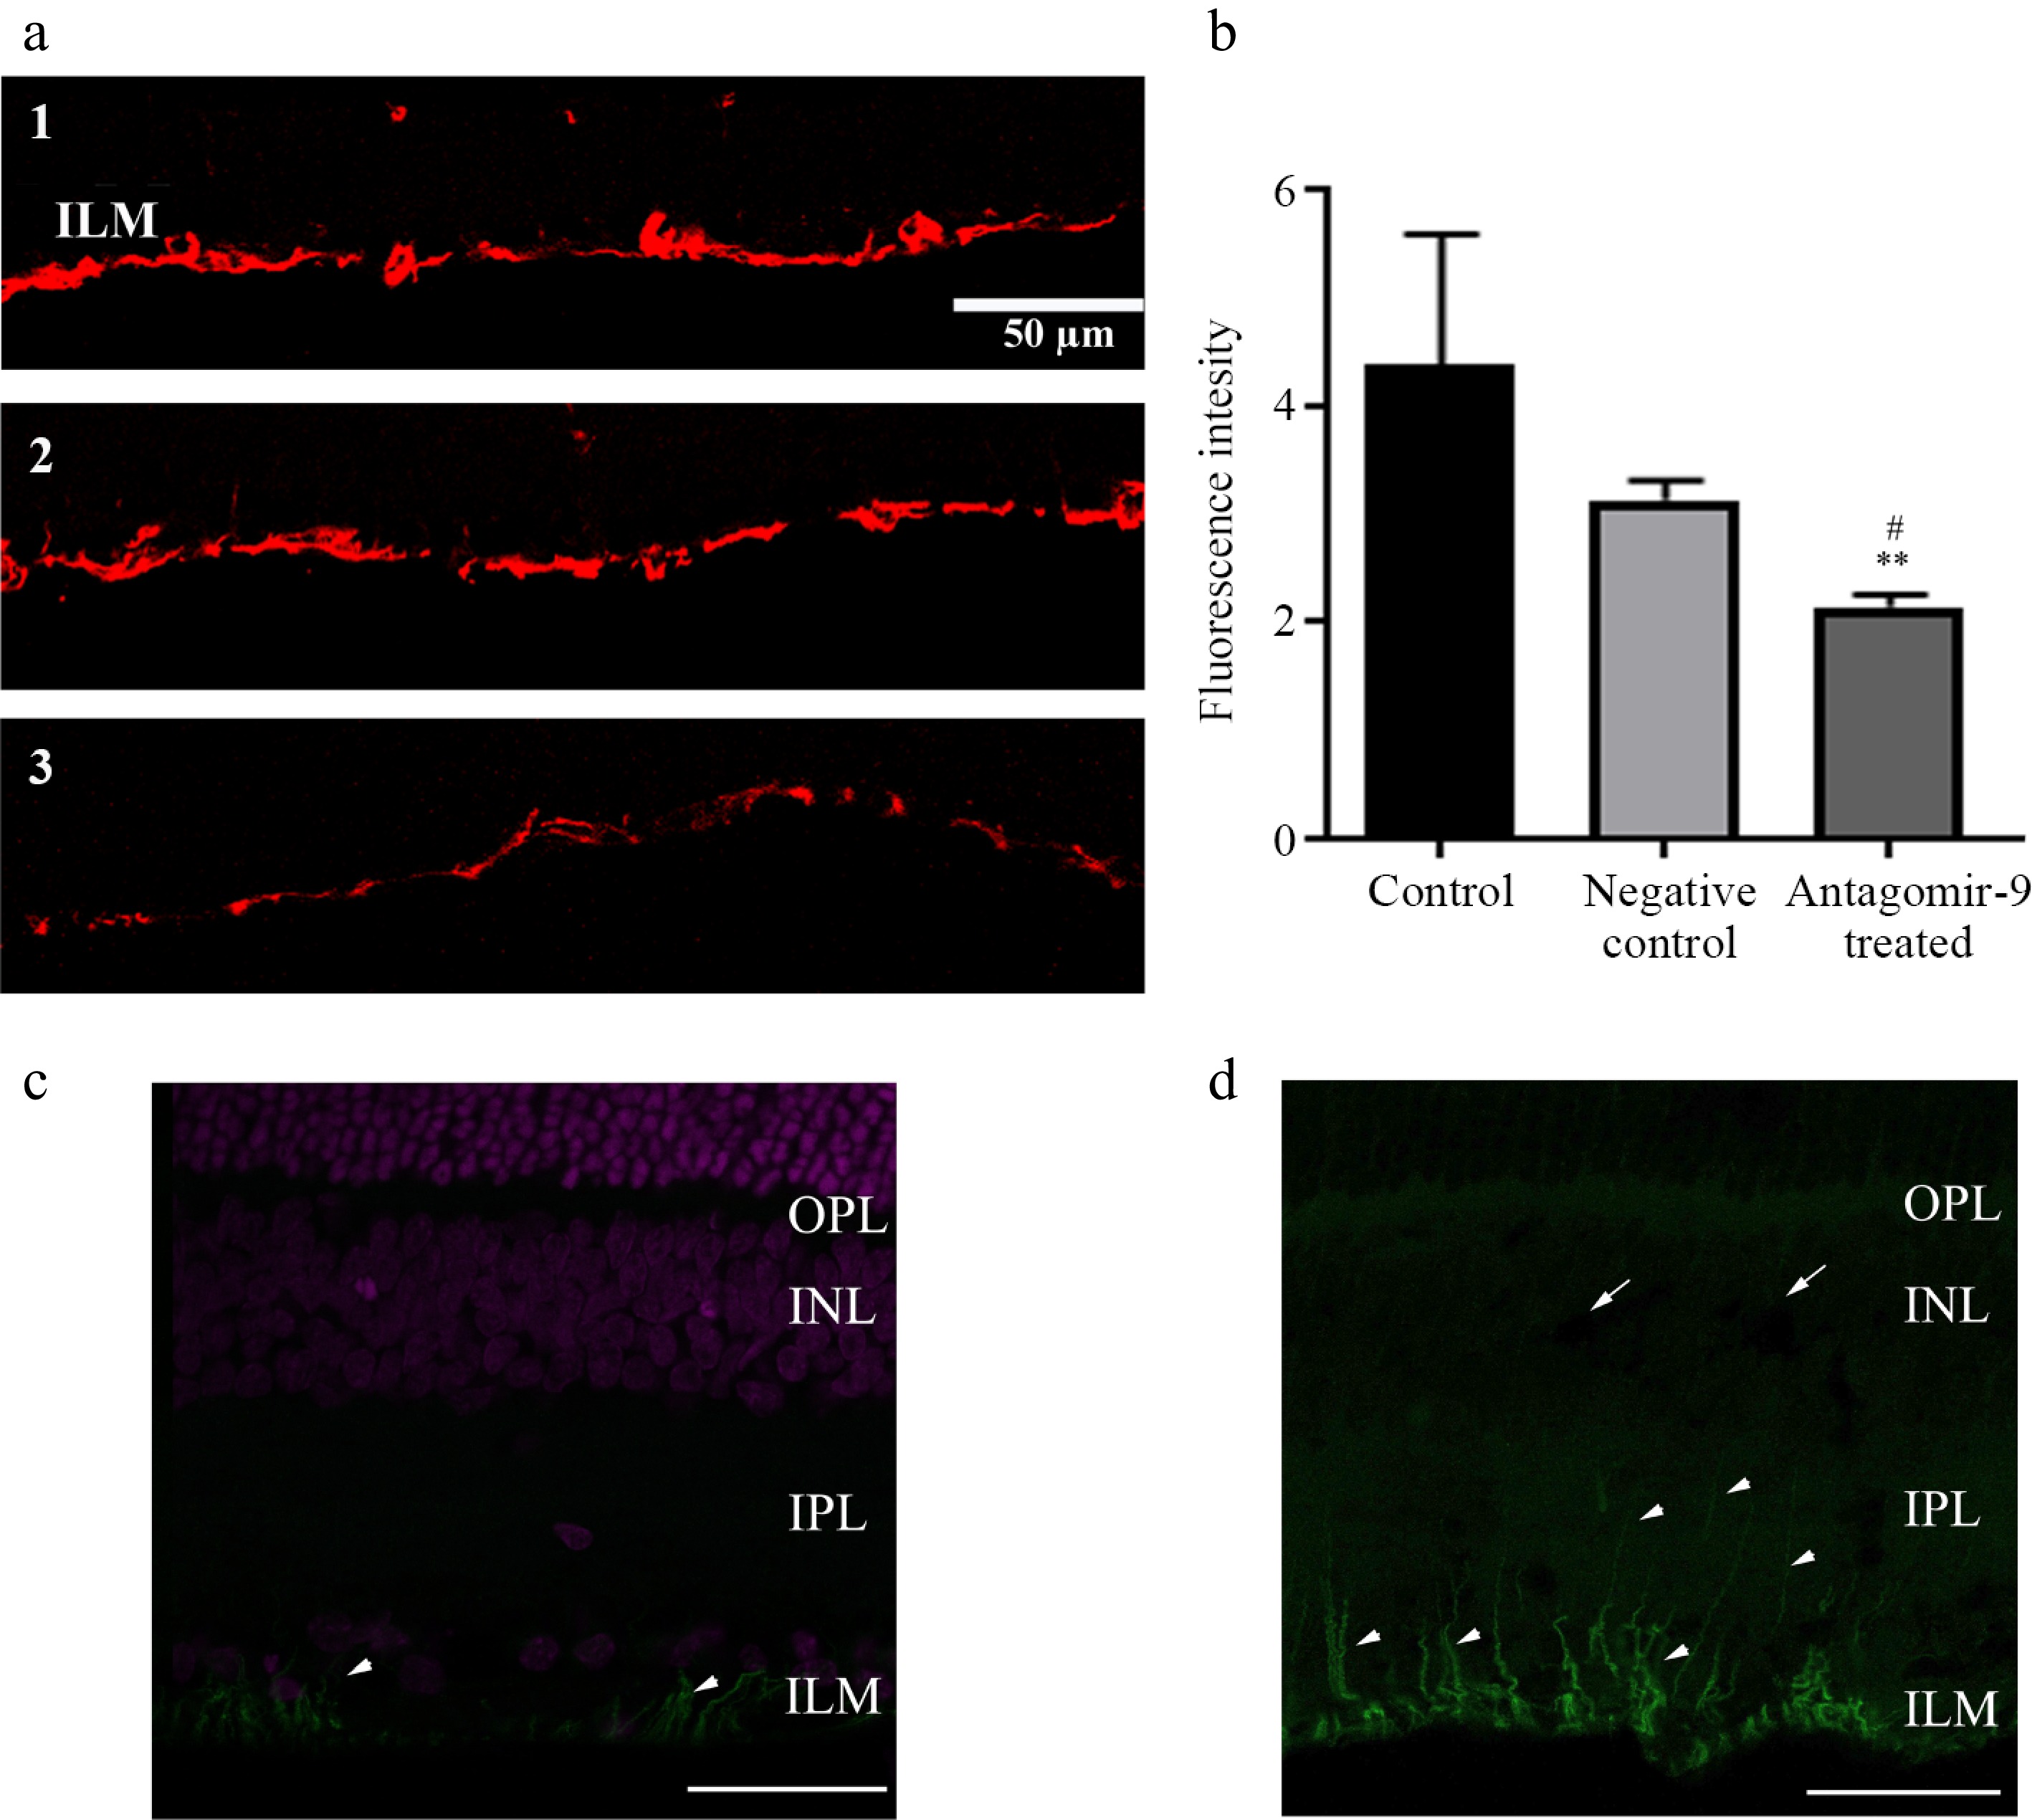
Figure 5.
GFAP immunolabeling and OneCut2 expression in rat retina. (a) GFAP immunostaining retinal sections from different experimental conditions: (1) non-treated control group, (2) negative control group, (3) antagomir-9-treated group. (b) Quantification of GFAP fluorescence intensity in the different experimental groups (n = 4 animals per group; 10 non-overlapping fields per retina in the central region). Normality was tested (D'Agostino–Pearson, Shapiro–Wilk, Kolmogorov–Smirnov); group differences were analyzed with non-parametric Kruskal–Wallis followed by Dunn's multiple comparison test. * Compared to control, # compared to negative control; ** indicates p < 0.01, # indicates p < 0.05. Representative OneCut2 immunostaining in (c) non-treated control, and (d) antagomir-9 treated retinas. In (c), the immunoreaction appeared around the blood vessels in the nerve fiber layer (arrowheads) reaching up to the level of ganglion cell somas. In (d), immunoreactive fibers extended into the IPL (arrowheads), and immunoreactivity was observed around blood vessels in the OPL (arrows). Abbreviations: inner nuclear layer (INL), inner plexiform layer (IPL), inner limiting membrane (ILM). Scale bar represents 50 µm.
The immunoreactivity of OneCut2, which is known as a target of miR-9, was also studied (as presented in Fig. 5c). In the control material, the immunoreaction appeared around the blood vessels in the nerve fiber layer, but it never extended above the level of ganglion cell somas. After antagomiR-9 injection, however, the immunoreaction became more abundant and immunoreactive fibers extended well into the IPL, up to the level of the amacrine cells. Frequently, immunoreactivity was observed around blood vessels in the OPL (Fig. 5d).
-
MiRNAs, as endogenous single-stranded regulatory elements, have multiple roles in gene expression regulation in the retina. During postnatal development, the time period between P0 and P14 is critical since fate determination, neuronal differentiation, and synaptogenesis take place[17]. Previous studies have demonstrated that miR-9 regulates multiple aspects of cell fate determination in the central nervous system[17−20]. The possible control points are stem cell differentiation, cell lineage formation, cell death, and synaptogenesis. In the case of rat retina, stem cell differentiation and the first apoptotic wave are over by P0, and part of the cell lineage formation happens at a very early stage. Only amacrine cells, rods, bipolar cells, and Müller cells are born between P2 and P10, while cones, ganglion cells, and horizontal cells are formed before birth[21−25]. The second apoptotic phase and the synaptogenesis, however, happen around the peak expression time of miR-9. Since changes in miR-9 expression during postnatal retinal development have a significant effect on the retinal structure presented in this paper, we assume that these latter two processes are in connection with this expression pattern[17,26,27].
We have applied antagomir-9 treatment during this complex process at P9 to investigate if marker expression is altered during retinal layer formation. Since glial cells and bipolar cells are generated during later stages of postnatal development, we have expected alterations in the PKCα and GFAP expression after antagomir-9 treatment. A relationship between reverse changes of PKCα and GFAP expression levels was observed in previous retinal studies[28,29]. Furthermore, GFAP and PKCα coding genes are targets of miR-9 in rats (TargetScan 2024.07.04). Our findings corroborate the results of these previous investigations[28,29].
Decreased ganglion cell number is indicative of the general supportive role of miR-9 on retinal development. However, our result regarding the elevated ILM-OLM distances in negative controls, as well as minor other discrepancies (PKCα, parvalbumin, and calretinin) invites further investigations.
Further, our results indicate that antagomir-9 treatment affects both the vertical and horizontal signaling pathways in the retina. Reduced expression of calbindin, parvalbumin, and TH refers to the alteration of the horizontal pathways. During late postnatal development (P7–P10), the inner nuclear layer (INL) undergoes significant reorganization as interneurons (e.g., bipolar cells, amacrine cells) complete their migration and establish stratified sublaminas. Concurrently, retinal ganglion cells in the ganglion cell layer (GCL) refine their dendritic arbors and synaptic connectivity; processes critical for functional circuit maturation. These developmental events align temporally with the peak expression of miR-9 at P10, suggesting its role in coordinating neuronal positioning and synaptic integration[24,25,30].
The exact role of miR-9, which is one of the most highly enriched key regulator miRNAs in the vertebrate nervous system and in developing mammalian retinas, is not yet fully understood. In the above events, miR-9 causes diverse alterations in molecular pathways where its direct targets occur. OneCut2 (OC-2) and Synaptotagmin-17 (Syt-17) represent two candidate targets (their transcription increases during postnatal retina development)[11]. Both influence neuronal cell-to-cell communication and differentiation in the central nervous system. Their decreased expression could lead to incomplete circuit development. In congruence with our results, OC-2 knockout studies have described calbindin-positive horizontal cell loss[18] and decreased calretinin positivity in amacrine cells[31]. Further, those retinas showed altered GFAP expression while Brn3b and PKCα levels did not change, which only partially agrees with our findings described in the current paper. At the same time, OC-2 null retinas had disrupted OPL, as extensive horizontal cell loss[32], which perfectly aligns with our results. Some studies also infer OneCut2 as a regulator of vascular endothelial growth factor (VEGF) regulation and, as a consequence, retinal vascular development[8]. Vascular changes are prominent in many retinal pathological conditions at later ages[33]; therefore, early disruption of normal blood vessel formation may make the retina prone to early damage during life[34].
The other potential mir-9 target for regulation, Syt-17 (also known as B/K protein), is mainly expressed in ganglion cells and in processes of Müller cells. Furthermore, after ischemia, its expression is upregulated in Müller cells and leads to the loss of SYT-17-positive ganglion cells[35]. Loss of SYT-17 causes abnormal neuronal plasticity in the hippocampus[36], so a similar scenario can also be inferred in the case of the retina. By means of altering Syt-17 expression, a defect in the glutamatergic synaptic effectiveness can be caused, and this may have a serious impact on image formation.
The reduction of parvalbumin and TH expression levels is indicative of the change in the rod pathway (AII and dopaminergic amacrine cells involvement in the treated retinas)[30]. Indeed, all the elements of the rod pathway are involved, although the exact impact of the absence of miR-9 remains unclear. One can speculate that the dark- and light adaptation processes will be disturbed in these retinas.
To gain a broader insight into the molecular context and potential pathways affected by antagomir-9 treatment, we performed a protein–protein interaction network analysis using the STRING database[16]. The analysis included the main marker proteins quantified in our study (GFAP, PKCα, calbindin, calretinin, parvalbumin, and TH). The resulting protein–protein interaction network revealed strong, direct, and indirect links among these proteins, indicating several functional modules of retinal development and neuronal signaling (Fig. 6). The interactome reveals a densely interconnected network, where neuronal (calbindin, parvalbumin, TH, PKCα, calretinin), glial (GFAP), as well as regulatory (OneCut2) proteins participate in overlapping signaling clusters.
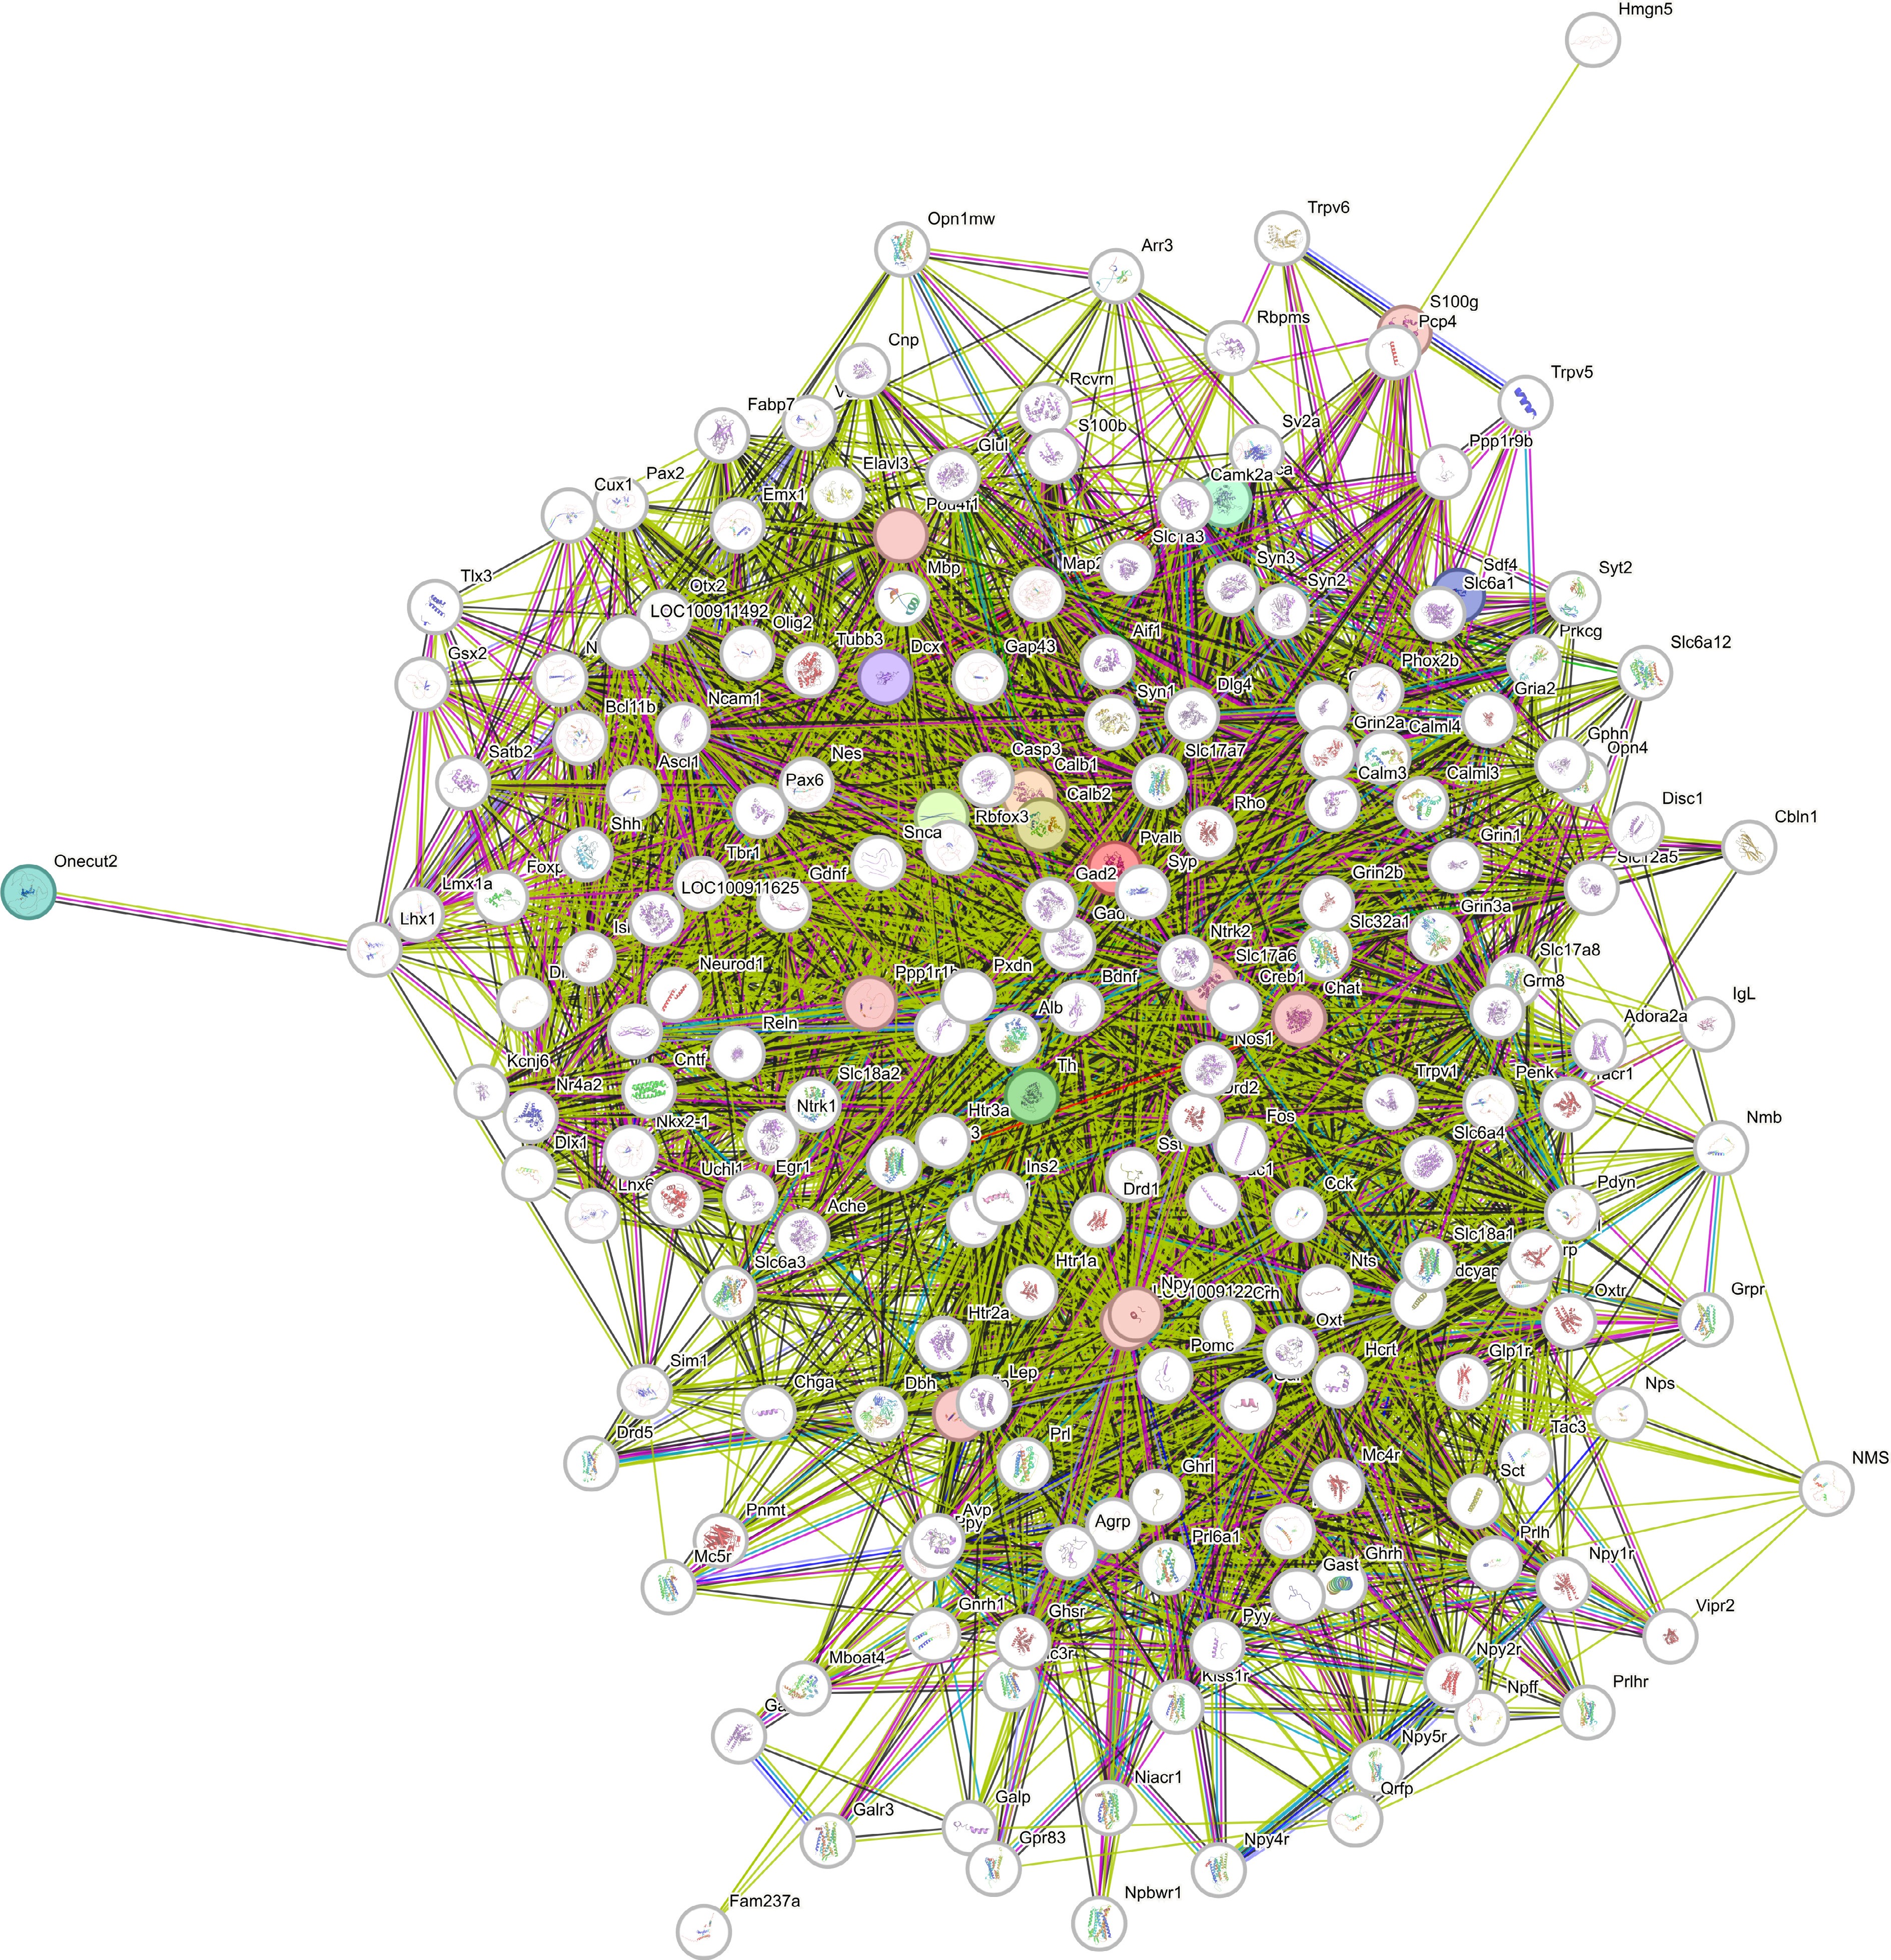
Figure 6.
STRING protein–protein interaction network of key retinal marker proteins. The network shows the interactions between major retinal markers (GFAP, PKCα/Prkca, calbindin/Calb1, calretinin/Calb2, parvalbumin/Parval, tyrosine hydroxylase/Th) and the transcription factor OneCut2 (OC-2), which is a validated, conserved direct target of miR-9 as demonstrated in both of our prior study[11] and independent experimental evidence in the literature (TargetScan 2024.07.04). This network visually underscores the central role and regulatory relationship of miR-9 via OneCut2 in postnatal retinal signaling, affecting complex, interconnected retinal networks.
Our high-throughput profiling and functional analyses have demonstrated that retinal development is regulated by a complex network of miRNAs, which play distinct as well as shared roles in cell fate determination, neuronal differentiation, and circuit formation[10,11]. In addition to miR-9, several other miRNAs have been identified as key modulators during postnatal retinal development. Comprehensive RNA sequencing of developing rat retina revealed persistent high expression of the let-7 family, miR-124, miR-181, miR-183, miR-19, and miR-101 throughout the postnatal period, suggesting their essential contribution to retinal cell homeostasis, maturation, and synaptic organization. Other miRNAs show temporally distinct expression patterns. For example, miR-20a, miR-206, miR-133, miR-466, and miR-1247 display high expression early after birth (P0–P3), simultaneous with the genesis and early migration of ganglion, amacrine, and horizontal cells; in contrast, miR-29, miR-96, miR-125, and miR-344 increase later, paralleling the differentiation of bipolar cells, photoreceptors, and Müller glia. This suggests that the different subsets of miRNAs coordinate sequential waves of neurogenesis[10,11].
Cross-regulation among miRNAs further expands the complexity of posttranscriptional control during retinal development. Several target genes—such as OneCut2 and Synaptotagmin-17—are regulated not only by miR-9 but also by other miRNAs (miR-135, miR-218, and let-7 family members), indicating strong cross-regulation and compensatory mechanisms. The combined activity of these miRNAs ensures robust differentiation and network formation of neuronal and glial cells, highlighting the retina's multilayered post-transcriptional regulation[7,8,11,13].
To gain a more comprehensive understanding of the regulatory processes mediated by miR-9 in the postnatal rat retina, additional investigations are needed to reveal the upstream mechanisms that lead to the above-described changes.
Study limitations
-
This study has several important limitations that should be carefully considered when interpreting the results. First, the sample size was relatively small (n = 4 animals per group), which constrains the precision of effect size estimates even though the observed differences were large and consistent across markers. Second, our analyses focused exclusively on structural and immunohistochemical endpoints; functional assessments such as electroretinography and apoptosis-specific assays were not performed in this experimental series, and therefore we cannot directly link the observed changes to retinal function or definitively distinguish transient downregulation of marker expression from actual cell loss. Third, the mechanistic interpretation involving miR-9 targets such as OneCut2 and Synaptotagmin-17 relies on bioinformatic predictions and prior literature rather than direct protein-level validation in the present model, and should thus be viewed as a working hypothesis for future studies. Finally, all measurements were performed in the central retina near the optic nerve head to ensure anatomical consistency, which does not exclude the possibility of regional differences across the retinal surface or at other developmental time points. Overall, these limitations do not diminish the novelty of the observed cellular patterning and molecular changes but highlight the need for follow-up work to clarify their functional relevance, temporal dynamics, and underlying molecular mechanisms.
Limitations
-
This study has several limitations that should be considered when interpreting the findings. (1) No physiology measurement; incorporate into future experimental series. (2) Limited sample size. (3) The temporal resolution of the experiment; only a single time point; extend the analysis to multiple time points. (4) Single methodological approach; future work should integrate additional techniques (array-based platforms or sequencing).
-
The exact role of miR-9 in developing mammalian retina is not yet fully understood; however, our study provides additional clues to some of the underlying events. Although miR-9 does not appear to directly alter the molecular pathways regulating the major retinal markers analyzed here, its indirect influence may be mediated through OneCut2, a well-known transcription factor.
Although our study has several limitations, it highlights the need for future work to clarify the functional relevance, time-course, and upstream mechanism that leads to the refined regulation of microRNAs in retinal development.
The authors thank Alina Bolboaca for the excellent technical assistance and Dr. Ákos Lukács for assistance with the intravitreal injections. This research did not receive any specific grant from funding agencies in the public, commercial, or not-for-profit sectors.
-
All procedures were reviewed and pre-approved by the Ethics Committee of the University of Pécs (BAI/35/51-58/2016, last revised May 10, 2021). The research followed the 3Rs: 'Replacement, Reduction, and Refinement' principles to minimize harm to animals.
-
The authors confirm their contributions to the paper as follows: study conception and design: Gábriel R, Kovács-Valasek A; data collection: Kovács-Valasek A, Pöstyéni E; analysis and interpretation of results: Pöstyéni E, Sétáló G Jr., Kovács-Valasek A; draft manuscript preparation: Pöstyéni E, Kovács-Valasek A, Gábriel R. All authors reviewed the results and approved the final version of the manuscript.
-
All data generated or analyzed during this study are included in this published article and its supplementary information files. Datasets are available from the corresponding author on reasonable request.
-
The authors declare that they have no conflict of interest.
-
accompanies this paper online at: https://doi.org/10.48130/vns-0026-0031.
- Supplementary Table S1 Primary antibodies used in immunohistochemical analysis.
- Supplementary Table S2 Secondary antibodies used in immunohistochemical analysis.
- Supplementary Table S3 Multiple comparisons of protein expression levels of calbindin in different treatment groups, analyzed by Kruskal–Wallis test followed by Dunn's post hoc test.
- Supplementary Table S4 Statistical comparisons of PKC α protein expression levels across different treatment groups using the Kruskal–Wallis test followed by Dunn's multiple comparison post hoc test.
- Supplementary Table S5 Multiple comparisons of tyrosine hydroxylase (TH) immunoreactivity in retinal cell bodies and axons among different treatment groups, analyzed by Kruskal–Wallis test followed by Dunn's post hoc test.
- Supplementary Table S6 Quantitative comparison of parvalbumin (PA) immunoreactivity in the retina across the experimental groups, analyzed by Kruskal–Wallis test followed by Dunn's multiple comparisons test.
- Supplementary Table S7 Quantitative comparison of calretinin immunoreactivity in the rat retina across experimental groups, analyzed by Kruskal–Wallis test followed by Dunn's multiple comparison test.
- Supplementary Table S8 Quantitative comparison of GFAP fluorescence intensity in rat retinas across experimental groups, analyzed by Kruskal–Wallis test with Dunn's multiple comparisons test (n = 4 animals per group).
- Copyright: © 2026 by the author(s). Published by Maximum Academic Press, Fayetteville, GA. This article is an open access article distributed under Creative Commons Attribution License (CC BY 4.0), visit https://creativecommons.org/licenses/by/4.0/.
-
About this article
Cite this article
Pöstyéni E, Gábriel R, Sétáló G, Kovács-Valasek A. 2026. Antagomir-9 treatment influences early postnatal development in rat retina. Visual Neuroscience 43: e034 doi: 10.48130/vns-0026-0031 

Antagomir-9 treatment influences early postnatal development in rat retina
- Received: 21 January 2026
- Revised: 22 April 2026
- Accepted: 15 May 2026
- Published online: 24 July 2026
Abstract: MiRNAs have a fundamental role in the molecular control of several physiological processes in the central nervous system. During retinal development, miR-9 exerts an important regulatory function in neuroglial development and angiogenesis. To expand our knowledge about the role of miR-9 in postnatal retinal development, we injected rats intravitreally with antagomir-9 at postnatal day nine, one day before the expression peak of miR-9. Classical morphometric, in situ hybridisation, and immunocytochemical techniques were used to follow the cell-specific effects of the applied treatment after 1-month survival. Morphometric analysis showed a reduction of ganglion cell number and retinal thickness, particularly in the inner nuclear and outer plexiform layers. The miR-9 expression decreased in the antagomir-9-treated retinas; moreover, several cellular markers (calbindin, protein-kinase C alpha, tyrosine hydroxylase, parvalbumin, and glial fibrillary acidic protein) have also shown decreased levels in treated retinas. At the same time, a slight increase was observed in the level of OneCut2, a direct target of miR-9, which plays a role in vascular endothelial growth factor regulation. Our results have shown that both vertical (bipolar cells, ganglion cells) and horizontal (horizontal cells, amacrine cells) signaling pathways are affected in the developing retina. Besides, angiogenesis may also be directly affected. These findings highlight the importance of spatiotemporally correctly expressed miR-9 in the formation of the final architecture of the retina.
-
Key words:
- Retina /
- Antagomir /
- Development /
- Cell types