













-
Retinitis pigmentosa (RP) is a group of inherited retinal dystrophies that primarily affects the photoreceptors and retinal pigment epithelium (RPE), leading to progressive vision loss and eventual blindness. The condition is characterized by the initial degeneration of rod photoreceptors, responsible for night and peripheral vision, followed by the secondary degeneration of cones, which are essential for daylight and color vision[1]. Clinically, RP manifests as night blindness (nyctalopia), peripheral visual field loss, and, in advanced stages, central vision impairment[2].
High-resolution imaging techniques, such as optical coherence tomography (OCT) and fundus autofluorescence (FAF), have significantly improved the diagnosis and monitoring of RP[3,4]. These technologies enable detailed visualization of retinal structural changes over time, providing invaluable information for both diagnosis and treatment assessment. Among these, adaptive optics (AO) represents a major advancement in ophthalmic imaging over the past two decades. Originally developed to correct atmospheric distortion in astronomy, AO has been repurposed for ophthalmology to enhance the resolution of retinal images. By compensating for the eye's optical aberrations, AO allows clinicians and researchers to visualize the retina at a cellular level[5]. This capability has facilitated novel insights into disease progression and the efficacy of emerging therapies[6,7].
AO imaging has been particularly transformative in the study of inherited retinal diseases (IRDs), including RP, Stargardt disease, and choroideremia. These conditions exhibit distinct patterns of retinal degeneration that AO can visualize at various stages[7−16]. Previous studies have demonstrated that AO can detect abnormal cone density and spatial arrangement in RP patients long before functional deficits become evident[17]. By documenting the characteristic pattern of cone loss, which typically begins in the peripheral retina and progresses centrally, AO provides critical information for monitoring disease progression[7−9,11].
Moreover, AO enables differentiation of photoreceptor subtypes affected by RP, offering insights into specific cellular vulnerabilities. In RP patients, AO imaging has revealed remnants of 'cone outer segments', indicative of ongoing degeneration[18]. These findings highlight the potential of AO in stratifying patients for targeted therapies and underscore its value as a noninvasive tool for tracking RP progression.
Therefore, the purpose of this cross-sectional study was to characterize and compare photoreceptor mosaic metrics using AO and microvascular parameters using OCT angiography (OCTA) in patients with RP, asymptomatic RP carriers, and healthy controls, in order to identify potential pre-symptomatic biomarkers of the disease.
-
This was a cross-sectional observational study conducted in accordance with the tenets of the Declaration of Helsinki and approved by the Ethics Committee of The First Affiliated Hospital of Chongqing Medical University (Approval Number: 2024-162-01, dated June 20, 2024). All participants provided written informed consent.
Patients with a clinical diagnosis of RP and genetically confirmed asymptomatic carriers were prospectively recruited from the ophthalmology clinic of our hospital between July 2024 and November 2024. The inclusion criteria for RP patients were: (1) clinical diagnosis based on characteristic symptoms (e.g., night blindness, visual field constriction), fundus findings (e.g., bone spicule pigmentation, attenuated retinal vessels, waxy optic disc pallor), and family history; (2) availability of genetic testing results. For enrolled patients with RP, we further stratified subjects into three stages according to the residual length of the ellipsoid zone (EZ) within the 2,500 μm radius of the fovea measured on the structural B-scan images acquired by OCTA: stage 1 (early RP, EZ length > 2,500 μm), stage 2 (mid-stage RP, 0 μm < EZ length ≤ 2,500 μm), and stage 3 (late-stage RP, complete EZ loss, EZ length = 0 μm)[19]. Asymptomatic carriers were defined as individuals within a known RP-associated family who were likely to carry a confirmed mutation but did not present any subjective or objective clinical signs of RP (normal visual acuity, fundus examination, and visual fields). Age-matched healthy controls with no history of retinal disease were also enrolled. The exclusion criteria for all participants included: (1) presence of other ocular diseases that could confound the results (e.g., diabetic retinopathy, age-related macular degeneration, glaucoma); (2) media opacities precluding high-quality AO or OCTA imaging; (3) history of prior ocular surgery; (4) history of infectious diseases such as syphilis or HIV.
Genetic testing
-
Peripheral venous blood samples were collected from all RP probands and asymptomatic family carriers, with genomic DNA extracted using the QIAamp DNA Extraction Kit (Qiagen, Hilden, Germany) per the manufacturer's protocol. Whole-exome sequencing (WES) was performed for RP probands and asymptomatic parents of probands using Roche KAPA HyperExome probes (targeting exonic regions and ± 20 bp flanking splice sites) on the DNBSEQ-T7 platform (MGI Tech, Shenzhen, China; 150 bp paired-end reads, mean target coverage ≥ 200×, > 98.5% of regions covered at > 20×). Reads were aligned to the GRCh37/hg19 reference genome; PCR duplicates were removed with Picard v2.27, SNVs/indels were called with GATK, and exon-level CNVs were detected with ExomeDepth. For asymptomatic parents, synchronous trio WES was performed with the proband using the identical pipeline; for asymptomatic siblings and offspring, carrier status was verified via targeted Sanger sequencing of the proband's confirmed mutation loci.
All variants were annotated per HGNC/HGVS nomenclature and filtered against gnomAD/ExAC (minor allele frequency < 0.001). Pathogenicity was classified per ACMG/AMP 2015 guidelines and ClinGen specifications, with in silico functional predictions from SIFT and SpliceAI. All variants included in the genotype-phenotype analysis were validated by Sanger sequencing.
To further explore how genetic background affects clinical features, RP patients with confirmed mutations were grouped into four subtypes based on gene function (Table 1): the Cilium group (e.g., USH2A, CEP290), the RNA Splicing group (e.g., SNRNP200), the Phototransduction group (e.g., RHO, CNGB1), and the Metabolism-Related group (e.g., RDH12, IMPDH1). Patients without a clear pathogenic mutation or whose gene did not fit these categories were excluded from this subgroup analysis.
Table 1. Genotype and mutations' profiles in RP patients.
Patient no. Family no. Gender Age Gene Inheritance Gene-related mechanisms Genotype Mutations P1 F1 Male 19 USH2A AR Cilium Compound heterozygote NM_206933.2:c.99_100insT
NM_206933.2:EX37-EX38 DupP2 F2 Female 62 USH2A AR Cilium Compound heterozygote NM_206933.2:c.11156G>A
NM_206933.2:c.13414G>AP3 F3 Male 42 USH2A AR Cilium Compound heterozygote NM_206933.2:c.11156G>A
NM_206933.2:EX4-EX15 DelP4 F4 Male 43 USH2A AR Cilium Compound heterozygote NM_206933.2:c.11549-1G>A
NM_206933.2:c.9958G>CP5 F5 Female 67 EYS AR Cilium Compound heterozygote NM_001142800.1:c.6416G>A
NM_001142800.1:c.6385G>AP6 F6 Male 39 EYS AR Cilium Homozygous NM_001142800.1:c.1798_1800delTTGinsC P7 F7 Female 49 SNRNP200 AD RNA splicing Heterozygote NM_014014.4:c.3260C>T P8 F7 Female 25 SNRNP200 AD RNA splicing Heterozygote NM_014014.4:c.3260C>T P9 F8 Male 30 RHO AD Phototransduction Heterozygote NM_000539.3:c.655_663delATCTTTTTC P10 F9 Female 49 IMPDH1 AD Metabolism Heterozygote NM_000883.3:c.174_183delGACGACACCC P11 F10 Female 42 RP1L1 AR Cilium Compound heterozygote NM_178857.5:c.4700G>A
NM_178857.5:c.149G>A
NM_178857.5:c.32C>TP12 F11 Male 30 RDH12 AR Metabolism Compound heterozygote NM_152443.2:c.437T>A
NM_152443.2:c.193C>TP13 F12 Male 28 CNGB1 AR Phototransduction Compound heterozygote NM_001297.4:c.2284C>A
NM_001297.4:c.2284C>TP14 F13 Male 35 CNGA1 AR Phototransduction Homozygous NM_000087.3:c.1537G>A P15 F14 Male 52 CEP290 AR Cilium Compound heterozygote NM_025114.3: c.1666_1667insA NM_025114.3:c.503G>A P16 F15 Male 37 ALMS1 AR Cilium Compound heterozygote NM_001378454: c.812C>T
NM_001378454: c.12163C>GP17 F16 Female 30 N/A N/A N/A N/A N/A P18 F17 Male 46 N/A N/A N/A N/A N/A P19 F18 Male 46 N/A N/A N/A N/A N/A P20 F19 Female 29 N/A N/A N/A N/A N/A P21 F20 Male 40 N/A N/A N/A N/A N/A P22 F21 Female 9 N/A N/A N/A N/A N/A AR: autosomal recessive, AD: autosomal dominant. General examination
-
All participants underwent a comprehensive ophthalmologic examination, which included best-corrected visual acuity (BCVA), slit-lamp biomicroscopy, color fundus photography, and AO imaging using the rtx1TM adaptive optics retinal camera (Imagine Eyes, Orsay, France). Additionally, RP patients underwent OCTA using the TowardPi system (TowardPi, China).
AO imaging protocol
-
Before imaging, participants were placed in a darkened room and underwent full mydriasis using compound tropicamide eye drops. AO fundus imaging was conducted using the rtx1™ adaptive optics retinal camera. Throughout the imaging process, patients maintained stable fixation using a target displayed within the imaging system. The imaging protocol targeted the cone photoreceptor layer at the foveal center (coordinates 0.0), capturing a 4° × 4° retinal area (approximately 1,200 µm × 1,200 µm).
To ensure optimal image quality, the optical signal strength was maintained above 90%, and the focus was manually adjusted to enhance image clarity. Images with significant artifacts or unstable fixation were excluded.
Image analysis
-
AO imaging analysis was performed using dedicated software, which allowed for the selection of five specific regions of interest (ROI) around the foveal center: Temporal (T), nasal (N), inferior (I), superior (S) at 1.5°, and the eccentric region located at temporal-superior (TS) 0.5°. Each ROI measured 100 µm × 100 µm and was strategically placed to avoid retinal blood vessels, minimizing measurement errors.
Given the limitations of the automated software in precisely identifying all photoreceptors, manual correction of the cone markings was performed by two experienced graders. These graders were masked to the participant group (control, carrier, or RP patient) to minimize observer bias and had received systematic training in cone identification prior to the commencement of the study. ROI T, I, S, and N measurements were averaged and included in subsequent statistical analyses. AO imaging parameters analyzed in each ROI included: Cone density (cones/mm2)—measured as the number of cone photoreceptors per square millimeter; Intercellular spacing (µm)—defined as the average distance between adjacent cones; Cellular regularity (%)—representing the percentage of cones with a consistent number of neighboring cells; Dispersion (%)—indicating the variability in cone distribution across the ROI; Total cone count per ROI—total number of identified cone photoreceptors in each selected area.
OCTA imaging and analysis
-
A 6 mm × 6 mm scanning pattern centered on the fovea was used for all participants. The built-in tracking system was engaged to minimize motion artifacts. Only scans with a signal strength index (SSI) greater than 7/10, without significant segmentation errors or motion artifacts, were included in the analysis. The device's automated software was used to segment the retinal layers and quantify the parameters. The internal limiting membrane (ILM) to the inner plexiform layer (IPL) boundary was defined as the superficial vascular plexus (SVP). The IPL to the outer plexiform layer (OPL) boundary was defined as the deep vascular plexus (DVP). The ILM to OPL boundary was defined as the full retina. Retinal thickness measurements (inner retina, outer retina, and total retina) were automatically generated by the software for the corresponding layers within the 6 mm × 6 mm scan area.
(1) Blood Flow Density: Vessel density was calculated as the percentage of area occupied by blood vessels in the SVP, DVP, and full retina within a circular, fovea-centered region of interest.
(2) Foveal Avascular Zone (FAZ): The non-flow area of the FAZ was automatically delineated and measured in the SVP, DVP, and full retina capillary plexuses (in mm2).
(3) Choroidal Thickness: Subfoveal choroidal thickness was manually measured on the horizontal B-scan crossing the center of the fovea, from the hyperreflective line of the Bruch's membrane to the choroid-scleral junction.
(4) Choroidal Vascularity Index (CVI, %): The CVI was calculated from EDI-OCT B-scans using the system's built-in binarization algorithm, representing the ratio of the luminal (vascular) area to the total choroidal area.
Statistical analysis
-
Statistical analyses were conducted using Python (v3.12.12). The graphical presentation of our data was generated with GraphPad Prism 9.0 (GraphPad Software Inc., San Diego, CA, USA). The normality of continuous variables was tested using the Shapiro–Wilk test. Data conforming to a normal distribution are expressed as mean ± standard deviation (SD).
Inter-group Comparisons and Correlation Analysis: For comparisons among the three groups (controls, carriers, RP patients), continuous variables were analyzed using one-way ANOVA followed by the least significant difference (LSD) test for post-hoc pairwise comparisons if they were normally distributed and variances were homogeneous; otherwise, the Kruskal–Wallis test was applied, with Dunn's test used for post-hoc comparisons. Categorical variables were compared using the Chi-square test or Fisher's exact test, as appropriate. All correlation analyses were performed using Spearman partial correlation to control for the confounding effects of age, gender, and axial length.
Genotype-Phenotype Association Analysis: To compare the differences in AO/OCTA parameters among the different genotype groups (cilium, RNA splicing, phototransduction, metabolism-related), the Kruskal–Wallis test was used for non-normally distributed data. If the overall test was significant, Dunn's test was subsequently employed for post-hoc pairwise comparisons.
Diagnostic Efficacy Analysis: To evaluate the diagnostic performance of AO imaging parameters in distinguishing RP carriers with mild clinical symptoms from healthy controls, binary logistic regression analysis was performed with the healthy control group as the reference (coded as 0) and the RP carrier group as the target (coded as 1). The four core AO parameters—photoreceptor dispersion, density, regularity, and spacing—were separately included as predictor variables in the model. The diagnostic performance of each parameter was assessed using receiver operating characteristic (ROC) curves, and the area under the curve (AUC), sensitivity, specificity, positive predictive value (PPV), and negative predictive value (NPV) were calculated.
A p-value < 0.05 was considered statistically significant for all analyses.
-
A total of 39 eyes from 22 RP patients (mean age: 38.59 ± 13.44 years; range: 9–67 years) were included in the study, comprising 12 males and 10 females. The mean logarithm of the minimum angle of resolution (LogMAR) visual acuity was 0.88 ± 0.85. Genetic analysis identified USH2A as the most frequently affected gene (four patients), followed by EYS (two patients), SNRNP200 (two patients), CEP290 (one patient), RP1L1 (one patient), IMPDH1 (one patient), CNGB1 (one patient), RDH12 (one patient), RHO (one patient), and CNGA1 (one patient). Seven patients did not have identifiable genetic mutations (Table 1; Supplementary Table S1).
The study also included 19 eyes from 11 RP carriers (mean age: 37.45 ± 21.08 years; six males, five females) and 49 eyes from 29 control participants (mean age: 37.78 ± 15.14 years; seven males, 22 females). Their BCVA, fundus photography, FAF, and OCT were all normal. One RP carrier had CEP290, one had RP1L1, three had USH2A, three had ABCA4, and two had EYS mutations. There was also one individual with an unknown mutation. All RP carriers had autosomal recessive inheritance. There were no statistically significant differences in age among the three groups. Further pairwise comparison between RP patients and asymptomatic carriers confirmed no significant difference in age (Mann–Whitney U exact test, p = 0.700). The gender distribution was well balanced between the two groups, with an identical male proportion (54.5% in both RP patients and carriers), and no statistically significant difference was observed (Fisher's exact test, p = 1.000).
Ocular biometric measurements showed an average axial length (AL) of 24.2 ± 0.58 mm and a mean diopter of −1.28 ± 1.96 D in RP patients. Among carriers, the average AL was 24.76 ± 0.94 mm, with a mean diopter of −1.57 ± 3.15 D. Controls had an average AL of 24.20 ± 0.49 mm and a mean diopter of −1.14 ± 1.46 D. There were no statistically significant differences in AL among the three groups. Pairwise comparison with Bonferroni correction further verified no significant difference in AL between RP patients and asymptomatic carriers (Dunn's test, p = 0.079).
AO imaging metrics
-
Significant differences were observed in AO parameters among controls, carriers, and RP patients (Figs 1, 2; Supplementary Fig. S1). Photoreceptor density was highest in controls (32,763.06 ± 3,147.12 cells/mm2), followed by carriers (29,010.73 ± 8,020.02 cells/mm2) and RP patients (26,711.98 ± 8,097.77 cells/mm2). Compared with controls, RP patients exhibited a significant reduction in photoreceptor density (p = 0.0001), while the difference between carriers and patients was not statistically significant (p = 0.2796).
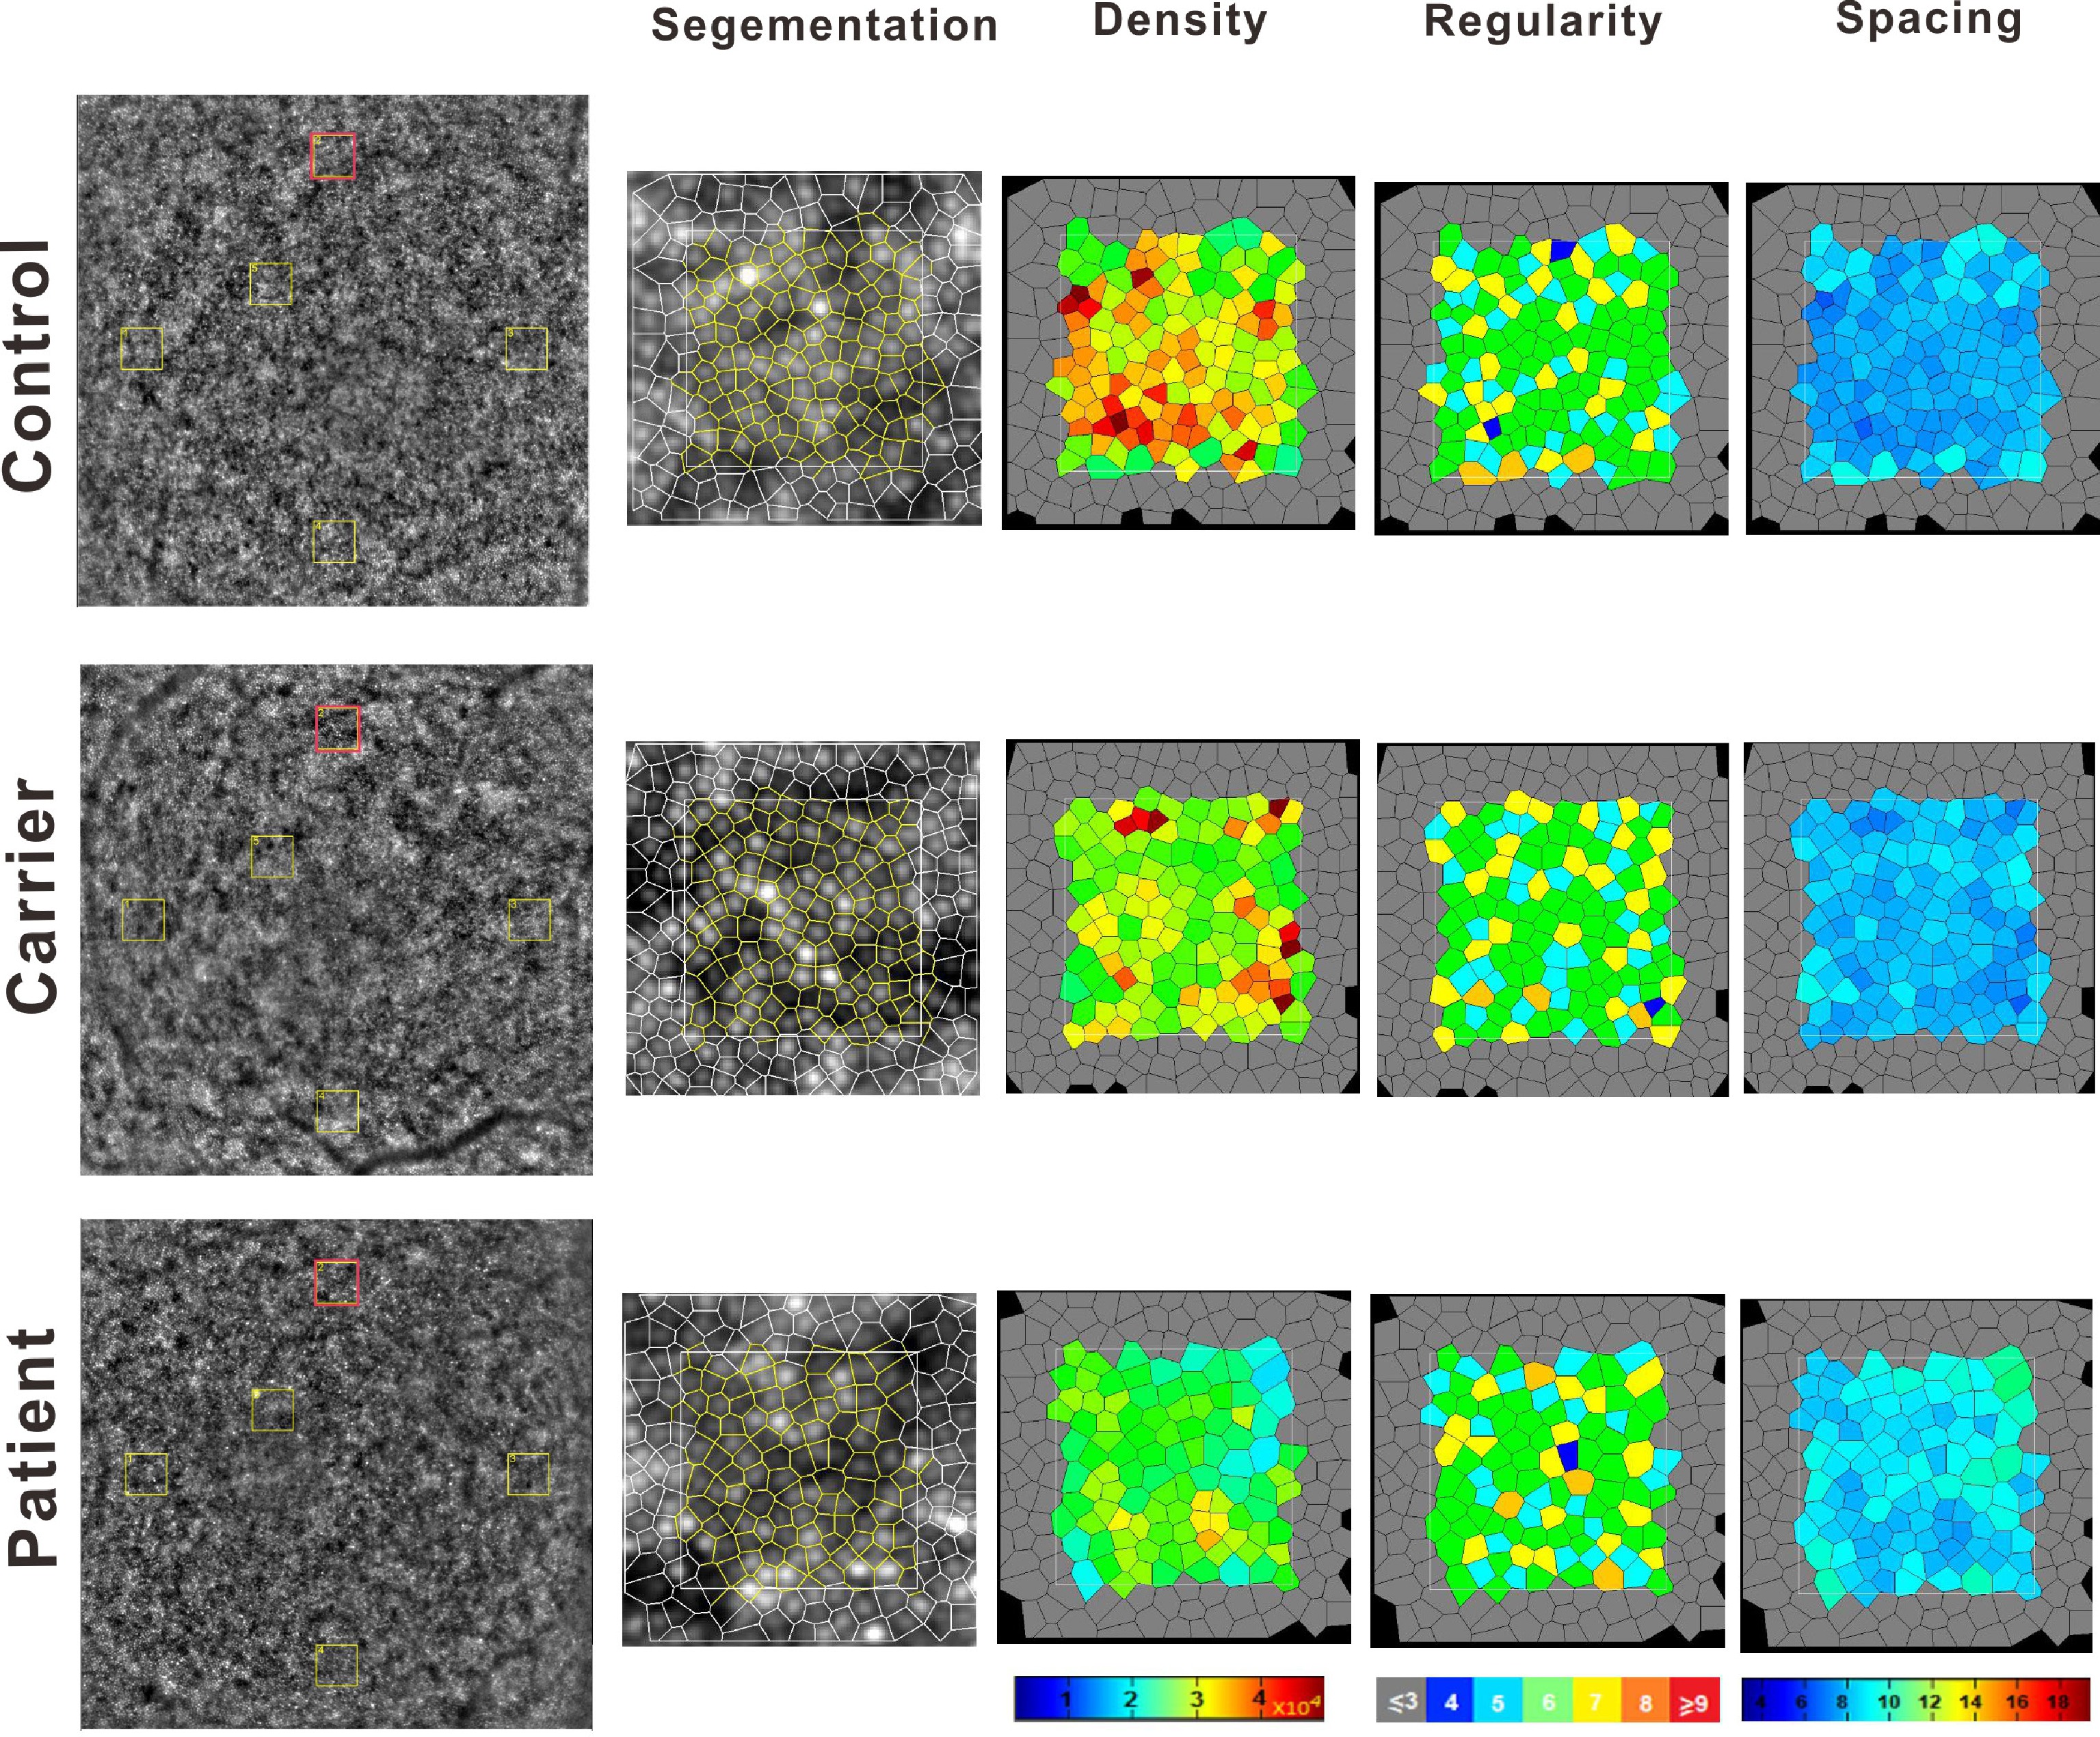
Figure 1.
Foveal adaptive optics (AO) imaging: quantitative comparison of cone photoreceptors. Adaptive optics (AO) imaging of the foveal center (right eye, 4° × 4° field of view). Yellow boxes denote five regions of interest (ROIs): temporal, nasal, superior, inferior (1.5° from foveal center), and superotemporal (0.5°). Red boxes highlight the superior ROI 2. Quantitative results (cone density, spacing, regularity, and distribution) are displayed for three groups (top to bottom): retinitis pigmentosa (RP) patients, RP carriers, and controls.
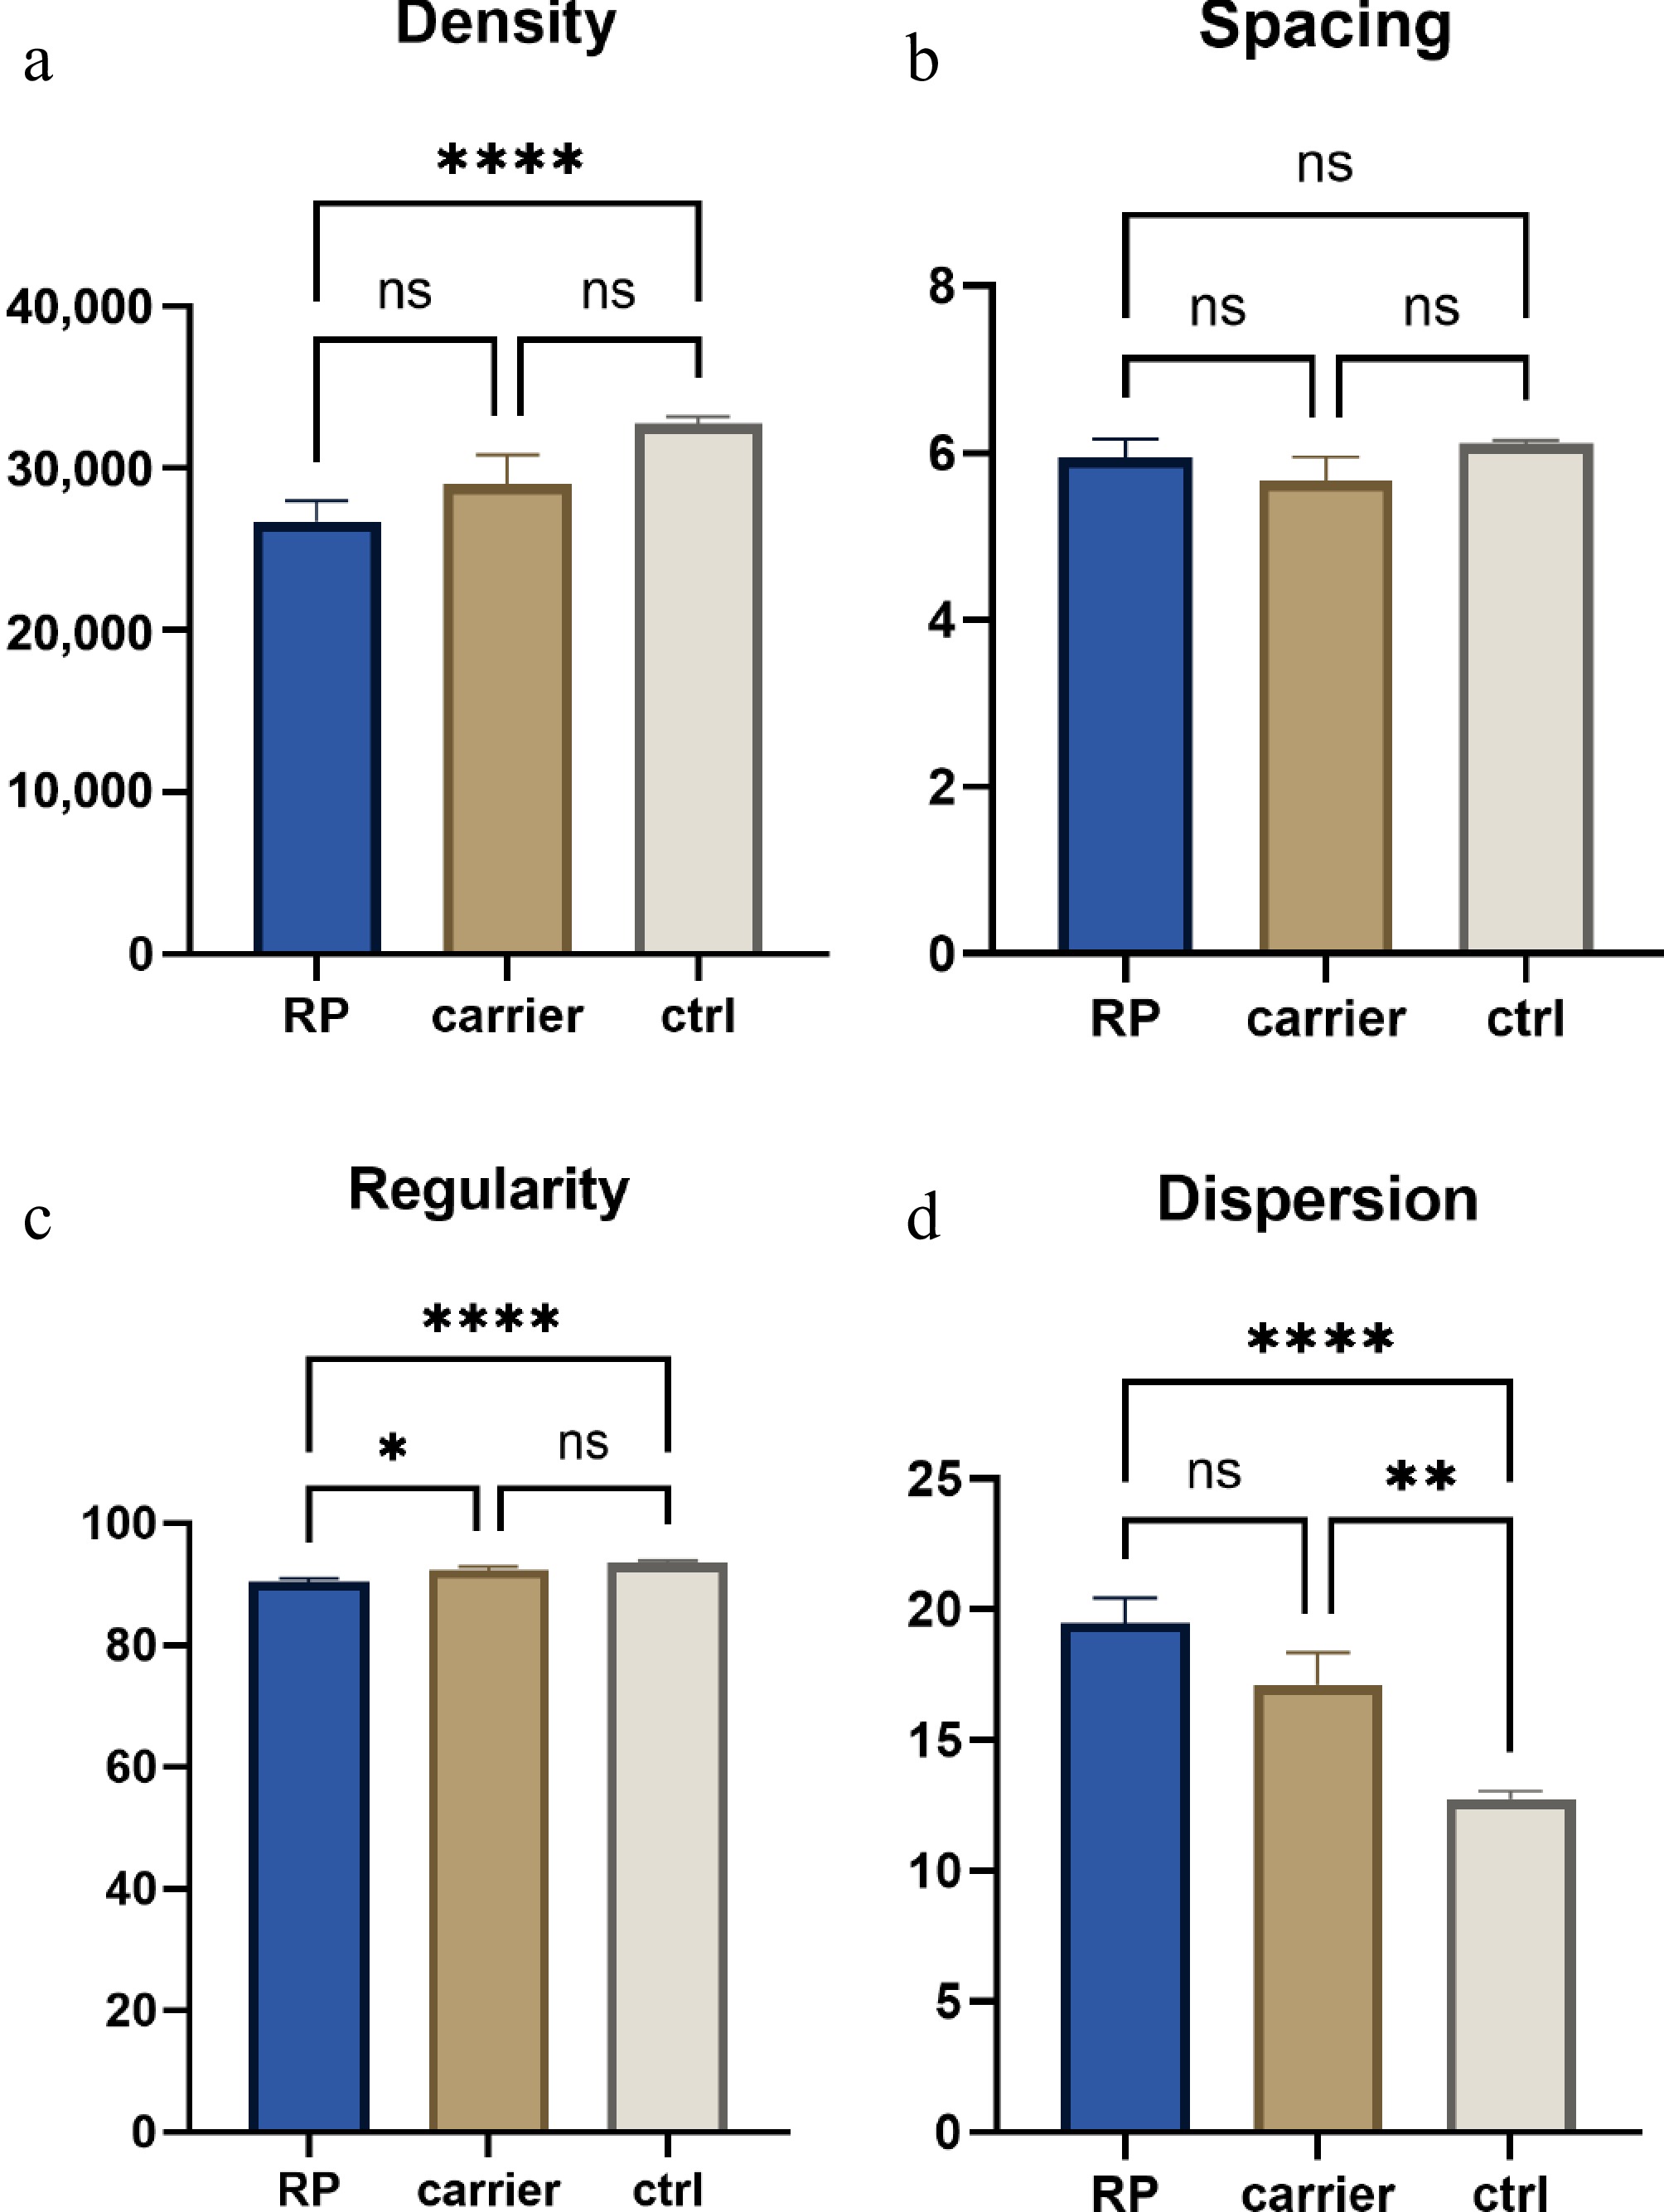
Figure 2.
Quantitative analysis of cone cell metrics in retinitis pigmentosa (RP) patients, carriers, and controls. (a) Cone density (cells/mm2) comparison. (b) Cone spacing (µm). (c) Regularity index (%). (d) Dispersion. Groups: RP (retinitis pigmentosa patients), carriers (RP carriers), ctrl (controls). Sample sizes: 49 control eyes, 19 carrier eyes, and 39 RP eyes. Statistical comparisons were performed using the Kruskal–Wallis test with Dunn's post-hoc test for pairwise comparisons. p < 0.05, * p < 0.01, *** p < 0.0001; ns, not significant.
Photoreceptor dispersion increased progressively from controls (12.74% ± 2.10%) to carriers (17.11% ± 5.35%) and RP patients (19.49% ± 5.88%). Both carriers (p = 0.0036) and patients (p < 0.0001) had significantly greater dispersion than controls, though the difference between carriers and patients was not significant (p = 0.2144).
Photoreceptor regularity was highest in controls (93.57% ± 2.35%), decreasing in carriers (92.33% ± 2.32%) and RP patients (90.33% ± 3.73%). RP patients demonstrated significantly lower regularity compared to both controls (p < 0.0001) and carriers (p = 0.0062), whereas the difference between carriers and controls was not significant (p = 0.1597). Photoreceptor spacing did not show significant differences among the groups (p > 0.05) (Fig. 3).
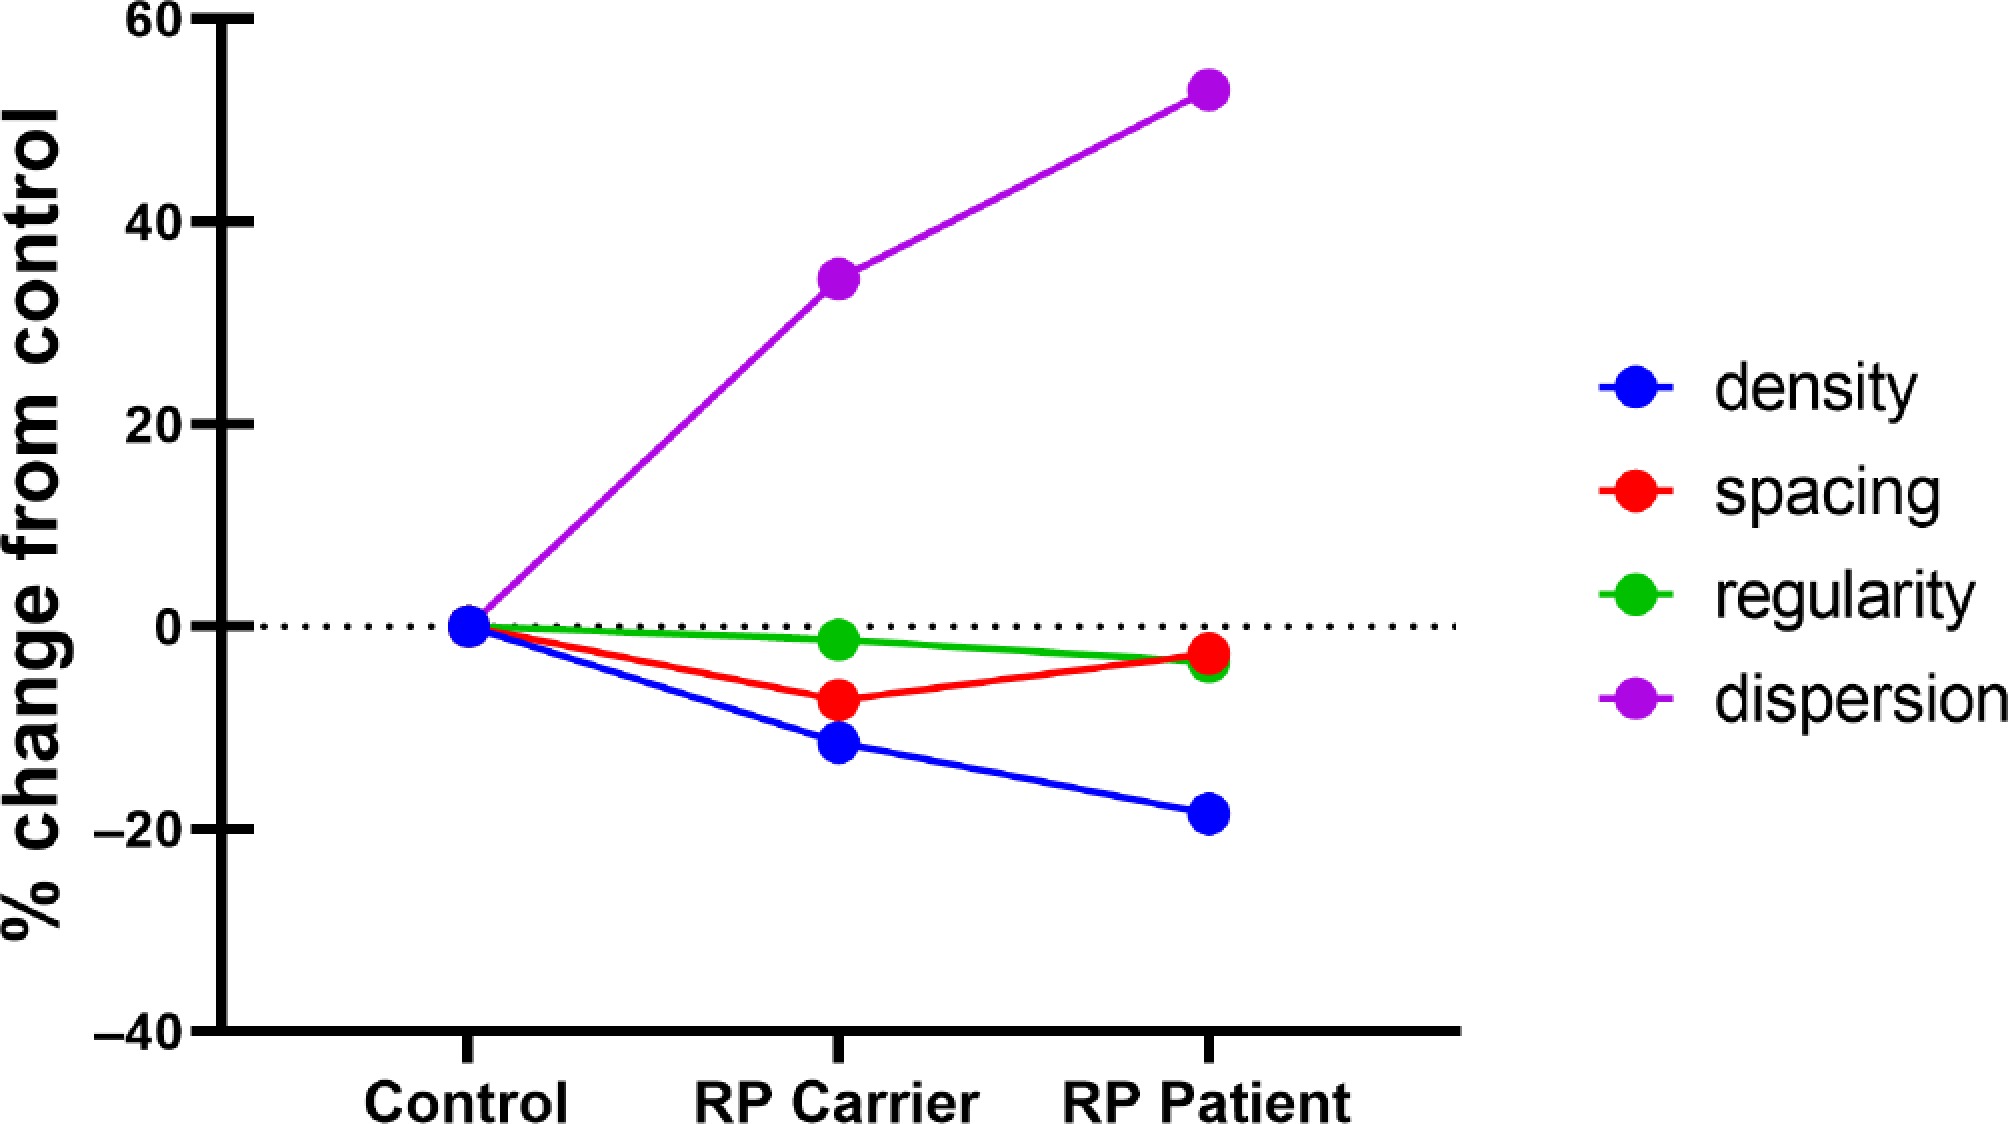
Figure 3.
Percentage change in cone cell metrics relative to controls. Comparison of percentage changes in cone density, spacing, regularity, and dispersion between retinitis pigmentosa (RP) patients, RP carriers, and healthy controls (4° × 4° region). Data are expressed as mean % change from control values (baseline set at 0%).
OCTA findings
-
OCTA analysis provided detailed retinal thickness and blood flow measurements in RP patients (Supplementary Fig. S2; Table 2). The thickness of the inner retina at the foveal center (6 × 6 mm) was 66.34 ± 32.27 µm, while outer retinal thickness was 199.54 ± 66.28 µm. The total retinal thickness at the fovea measured 273.13 ± 73.82 µm. The choroidal thickness beneath the fovea was 255.43 ± 116.90 µm.
Table 2. OCTA parameters of RP patients.
OCTA Mean ± SD Inner retina thickness (µm) 66.34 ± 32.27 Outer retina thickness (µm) 199.54 ± 66.28 Central retina thickness (µm) 273.13 ± 73.82 Choroidal thickness (µm) 255.43 ± 116.90 Retinal blood flow superficial: ILM-IPL_fovea (%) 21.12 ± 12.75 Retinal blood flow deep: IPL-OPL_fovea (%) 11.99 ± 12.68 Retinal blood flow retina_fovea (%) 20.33 ± 13.40 FAZ superficial: ILM-IPL no flow area (mm2) 0.9764 ± 1.7373 FAZ deep: IPL-OPL no flow area (mm2) 1.3357 ± 1.5496 FAZ retina: ILM-OPL no flow area (mm2) 1.1528 ± 1.8098 Choroidal flow: (CVI, %) 49.6429 ± 11.9667 ILM, internal limiting membrane; IPL, inner plexiform layer; OPL, outer plexiform layer; FAZ, foveal avascular zone; CVI, choroidal vascularity index. For blood flow parameters, the superficial retinal blood flow at the fovea was 21.12% ± 12.75%, the deep retinal blood flow was 11.99% ± 12.68%, and the total retinal blood flow at the fovea was 20.33% ± 13.40%. The FAZ no-flow area was measured in the superficial (0.9764 ± 1.7373 mm2), deep (1.3357 ± 1.5496 mm2), and full retinal capillary plexuses (1.1528 ± 1.8098 mm2). CVI at the fovea was 49.64% ± 11.97%.
In RP patients, the residual EZ length at the fovea was measured using OCTA B-scan imaging (Supplementary Fig. S1). The mean residual EZ length was 1,376.44 ± 1,657.73 µm, ranging from 0 to 4,900 µm. After performing partial correlation analysis controlling for age, gender, and AL, we found that EZ length exhibited significant positive correlations with all retinal thickness measurements: inner retinal thickness (r = 0.46, p = 0.0051), outer retinal thickness (r = 0.72, p < 0.001), and central retinal thickness (CRT) (r = 0.57, p < 0.001). Additionally, EZ length was positively correlated with superficial retinal blood flow (r = 0.39, p = 0.018) and whole retinal blood flow (r = 0.34, p = 0.045). LogMAR visual acuity was strongly negatively correlated with outer retinal thickness (r = −0.58, p < 0.001) and CRT (r = −0.41, p = 0.014), confirming that preserved retinal structure is associated with better visual function (Fig. 4b).
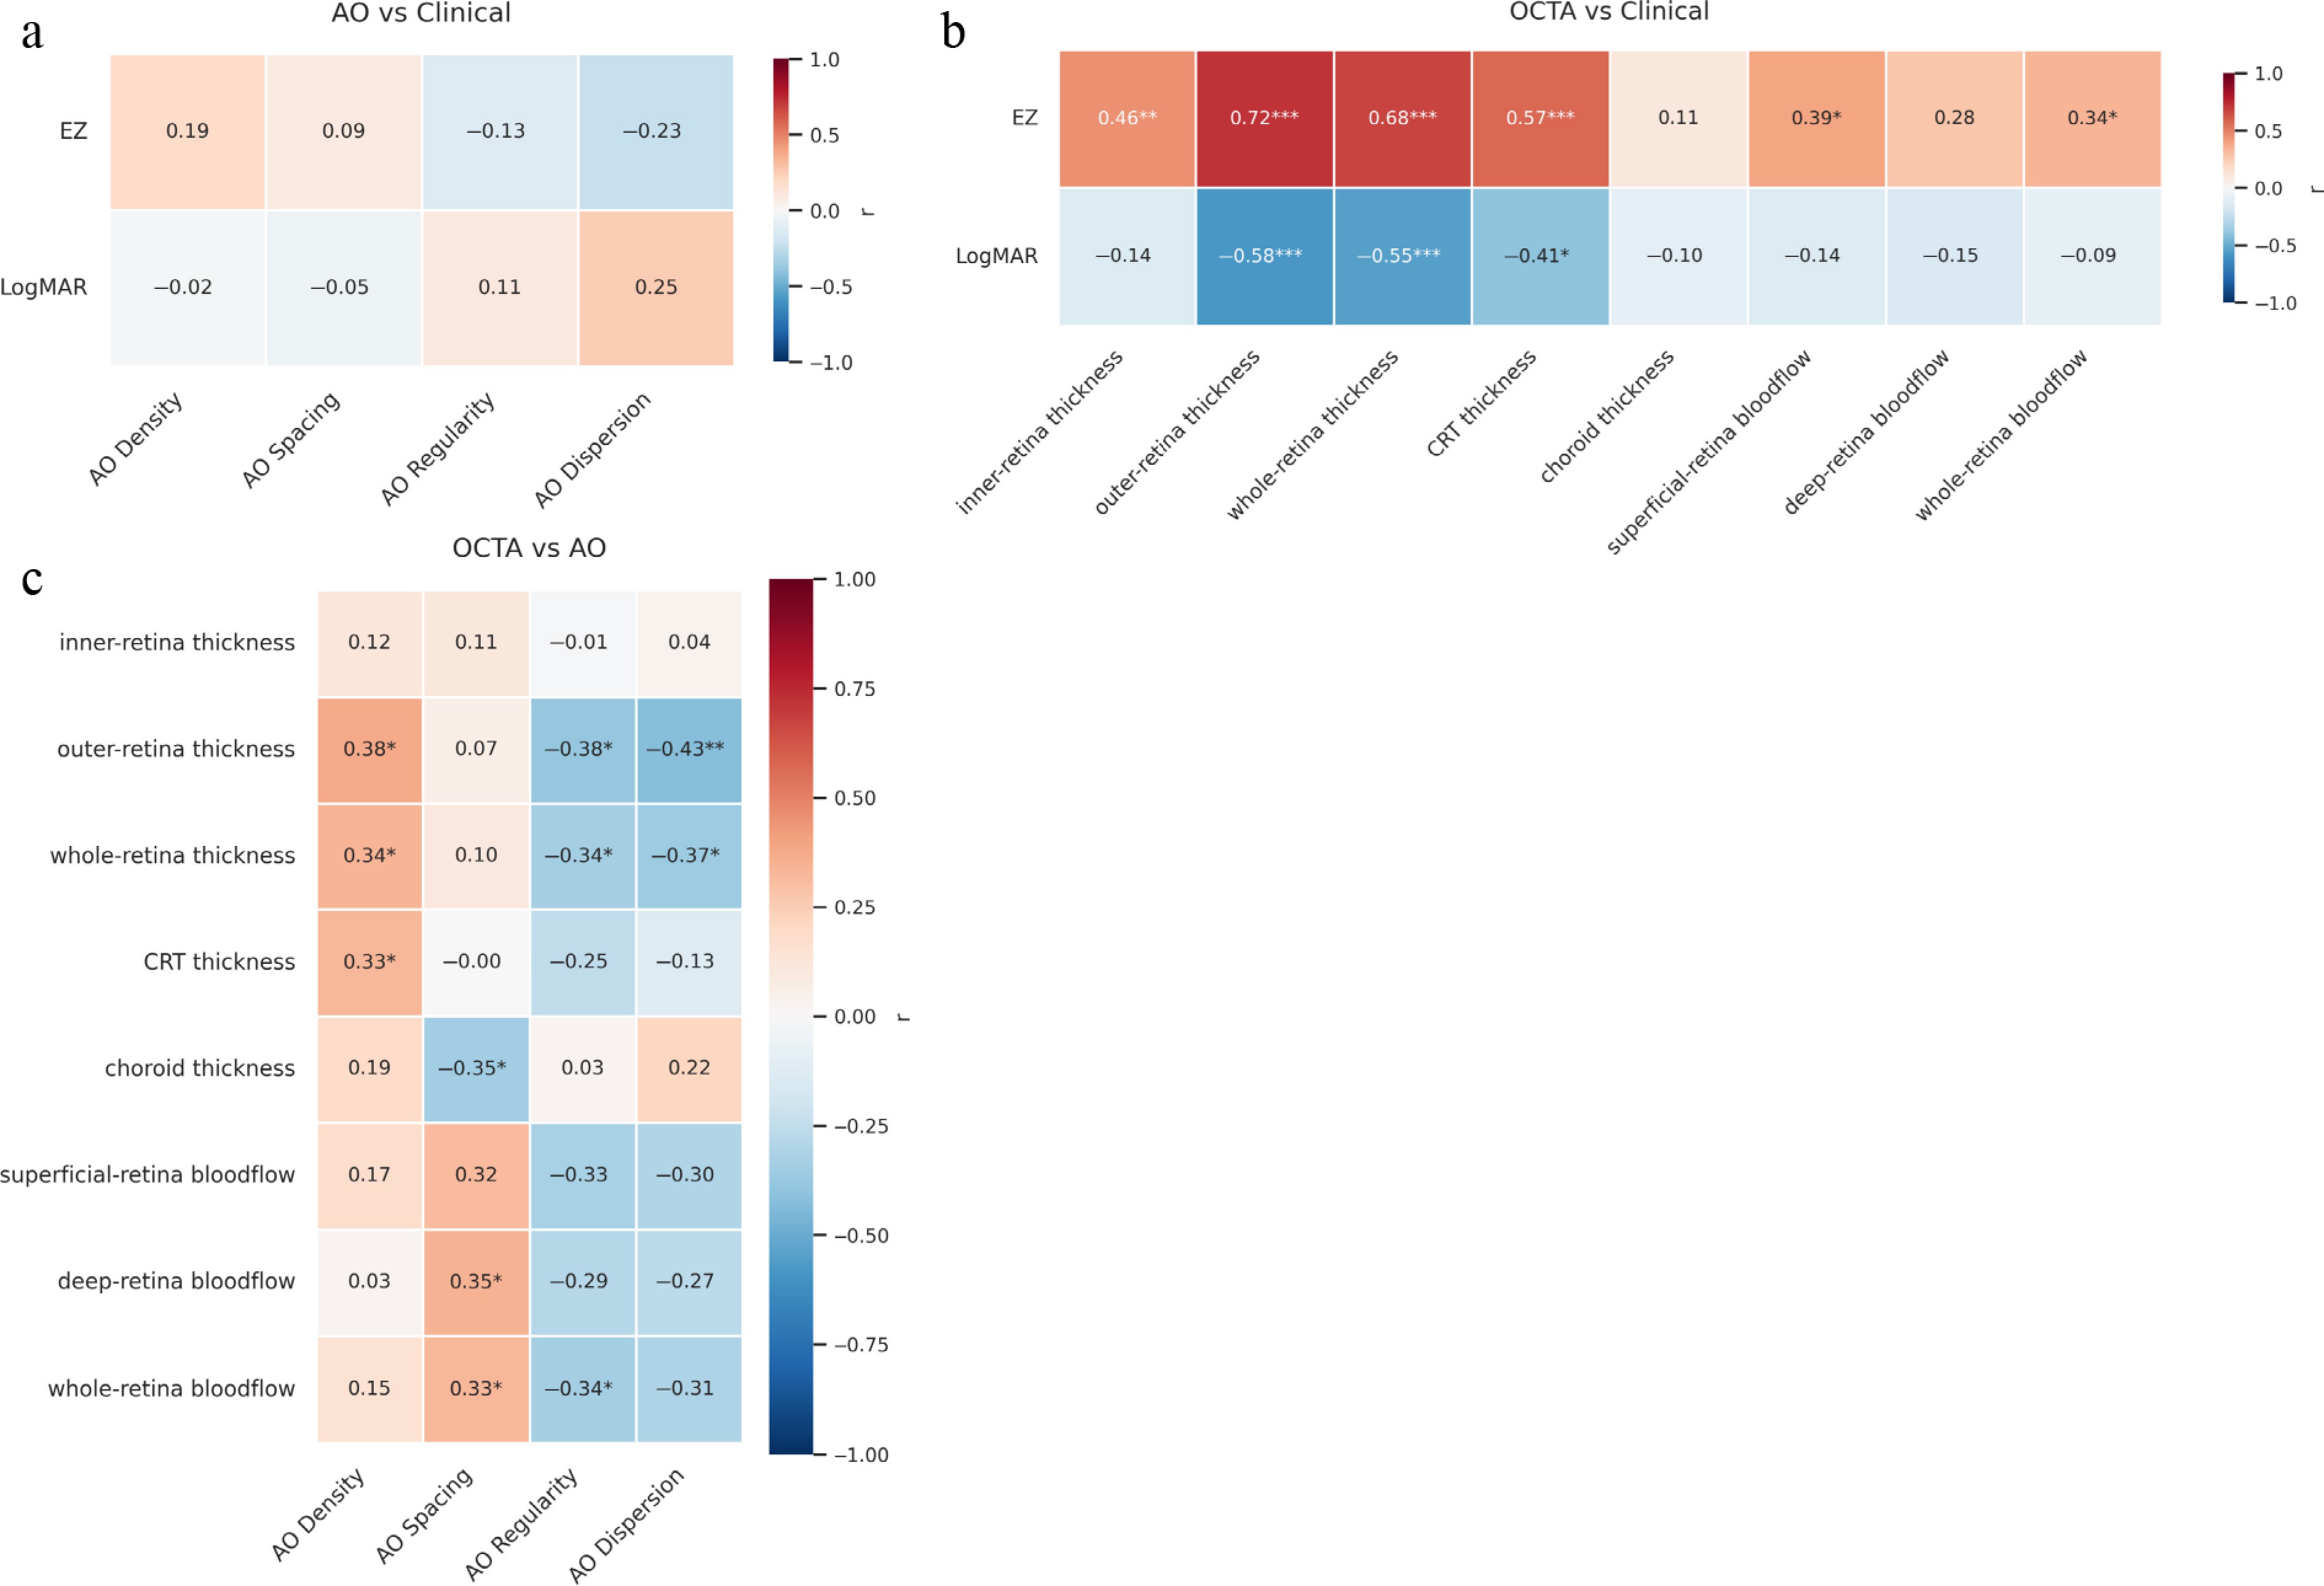
Figure 4.
Multimodal partial correlations in retinitis pigmentosa (RP): AO, OCTA, and clinical metrics, adjusted for age, gender, and axial length. (a) AO-derived photoreceptor metrics (density, spacing, regularity, dispersion) vs clinical parameters (EZ length, LogMAR visual acuity). (b) OCTA-derived structural and vascular parameters vs clinical measures (EZ length, LogMAR visual acuity). (c) Cross-correlations between AO metrics and OCTA parameters. The color intensity indicates the strength of the correlation, with asterisks denoting statistical significance. Sample size: 39 RP eyes. Correlations were calculated using Spearman partial correlation analysis with adjustment for age, gender, and axial length. * represents p < 0.05, ** represents p < 0.01, *** represents p < 0.001. EZ, ellipsoid zone.
RP patients were further stratified into three groups according to the residual length of EZ: stage 1 (early RP, n = 13), stage 2 (mid-stage RP, n = 7), and stage 3 (late-stage RP, n = 19). Compared with early and mid-stage RP, late-stage RP exhibited significantly reduced outer retinal thickness and central retinal thickness (all p < 0.01). Inner retinal thickness was also significantly lower in the late-stage group than in the other two groups (both p < 0.05). Regarding retinal perfusion, only superficial vascular density was significantly lower in late-stage than in mid-stage RP (p = 0.0246). No significant differences were found in adaptive optics-based cone morphologic parameters across all stages (all p > 0.05).
Correlation analysis
-
In partial correlation analyses controlling for age, gender, and AL, the associations between AO metrics and OCTA parameters were as follows (Fig. 4c):
AO density exhibited significant positive correlations with outer retinal thickness (r = 0.38, p = 0.024), whole retinal thickness (r = 0.34, p = 0.041), and central retinal thickness (CRT) (r = 0.33, p = 0.049), indicating that higher cone density is associated with better preservation of retinal structural integrity. Conversely, AO dispersion demonstrated a significant moderate negative correlation with outer retinal thickness (r = −0.43, p = 0.009) and whole retinal thickness (r = −0.37, p = 0.028), confirming that increased photoreceptor spatial disorganization is a hallmark of outer retinal degeneration. Notably, no significant correlations were observed between AO dispersion and choroidal thickness or any retinal blood flow parameters after adjustment for physiological covariates.
AO spacing showed a significant negative correlation with choroidal thickness (r = −0.35, p = 0.038) and significant positive correlations with deep retinal blood flow (r = 0.35, p = 0.036) and whole retinal blood flow (r = 0.33, p = 0.047), suggesting that wider cone spacing is linked to altered choroidal structure and compensatory increased vascular perfusion. AO regularity was significantly negatively correlated with outer retinal thickness (r = −0.38, p = 0.021), whole retinal thickness (r = −0.34, p = 0.042), and whole retinal blood flow (r = −0.34, p = 0.043), demonstrating that reduced cone mosaic regularity is associated with progressive retinal thinning and decreased perfusion.
In contrast, no statistically significant correlations were identified between any of the four AO imaging parameters (density, spacing, regularity, dispersion) and clinical measures, including EZ length or LogMAR visual acuity after controlling for confounding factors (all p > 0.05) (Fig. 4a).
Genotype-specific AO/OCTA phenotypes
-
To further investigate the influence of genetic background on clinical phenotypes, RP patients with confirmed mutations were divided into four groups (the cilium, the RNA splicing, the phototransduction, and the metabolism-related). Analysis revealed significant differences in the microstructure of vessels and photoreceptor cells among the different genotype groups (Fig. 5; Supplementary Table S2).
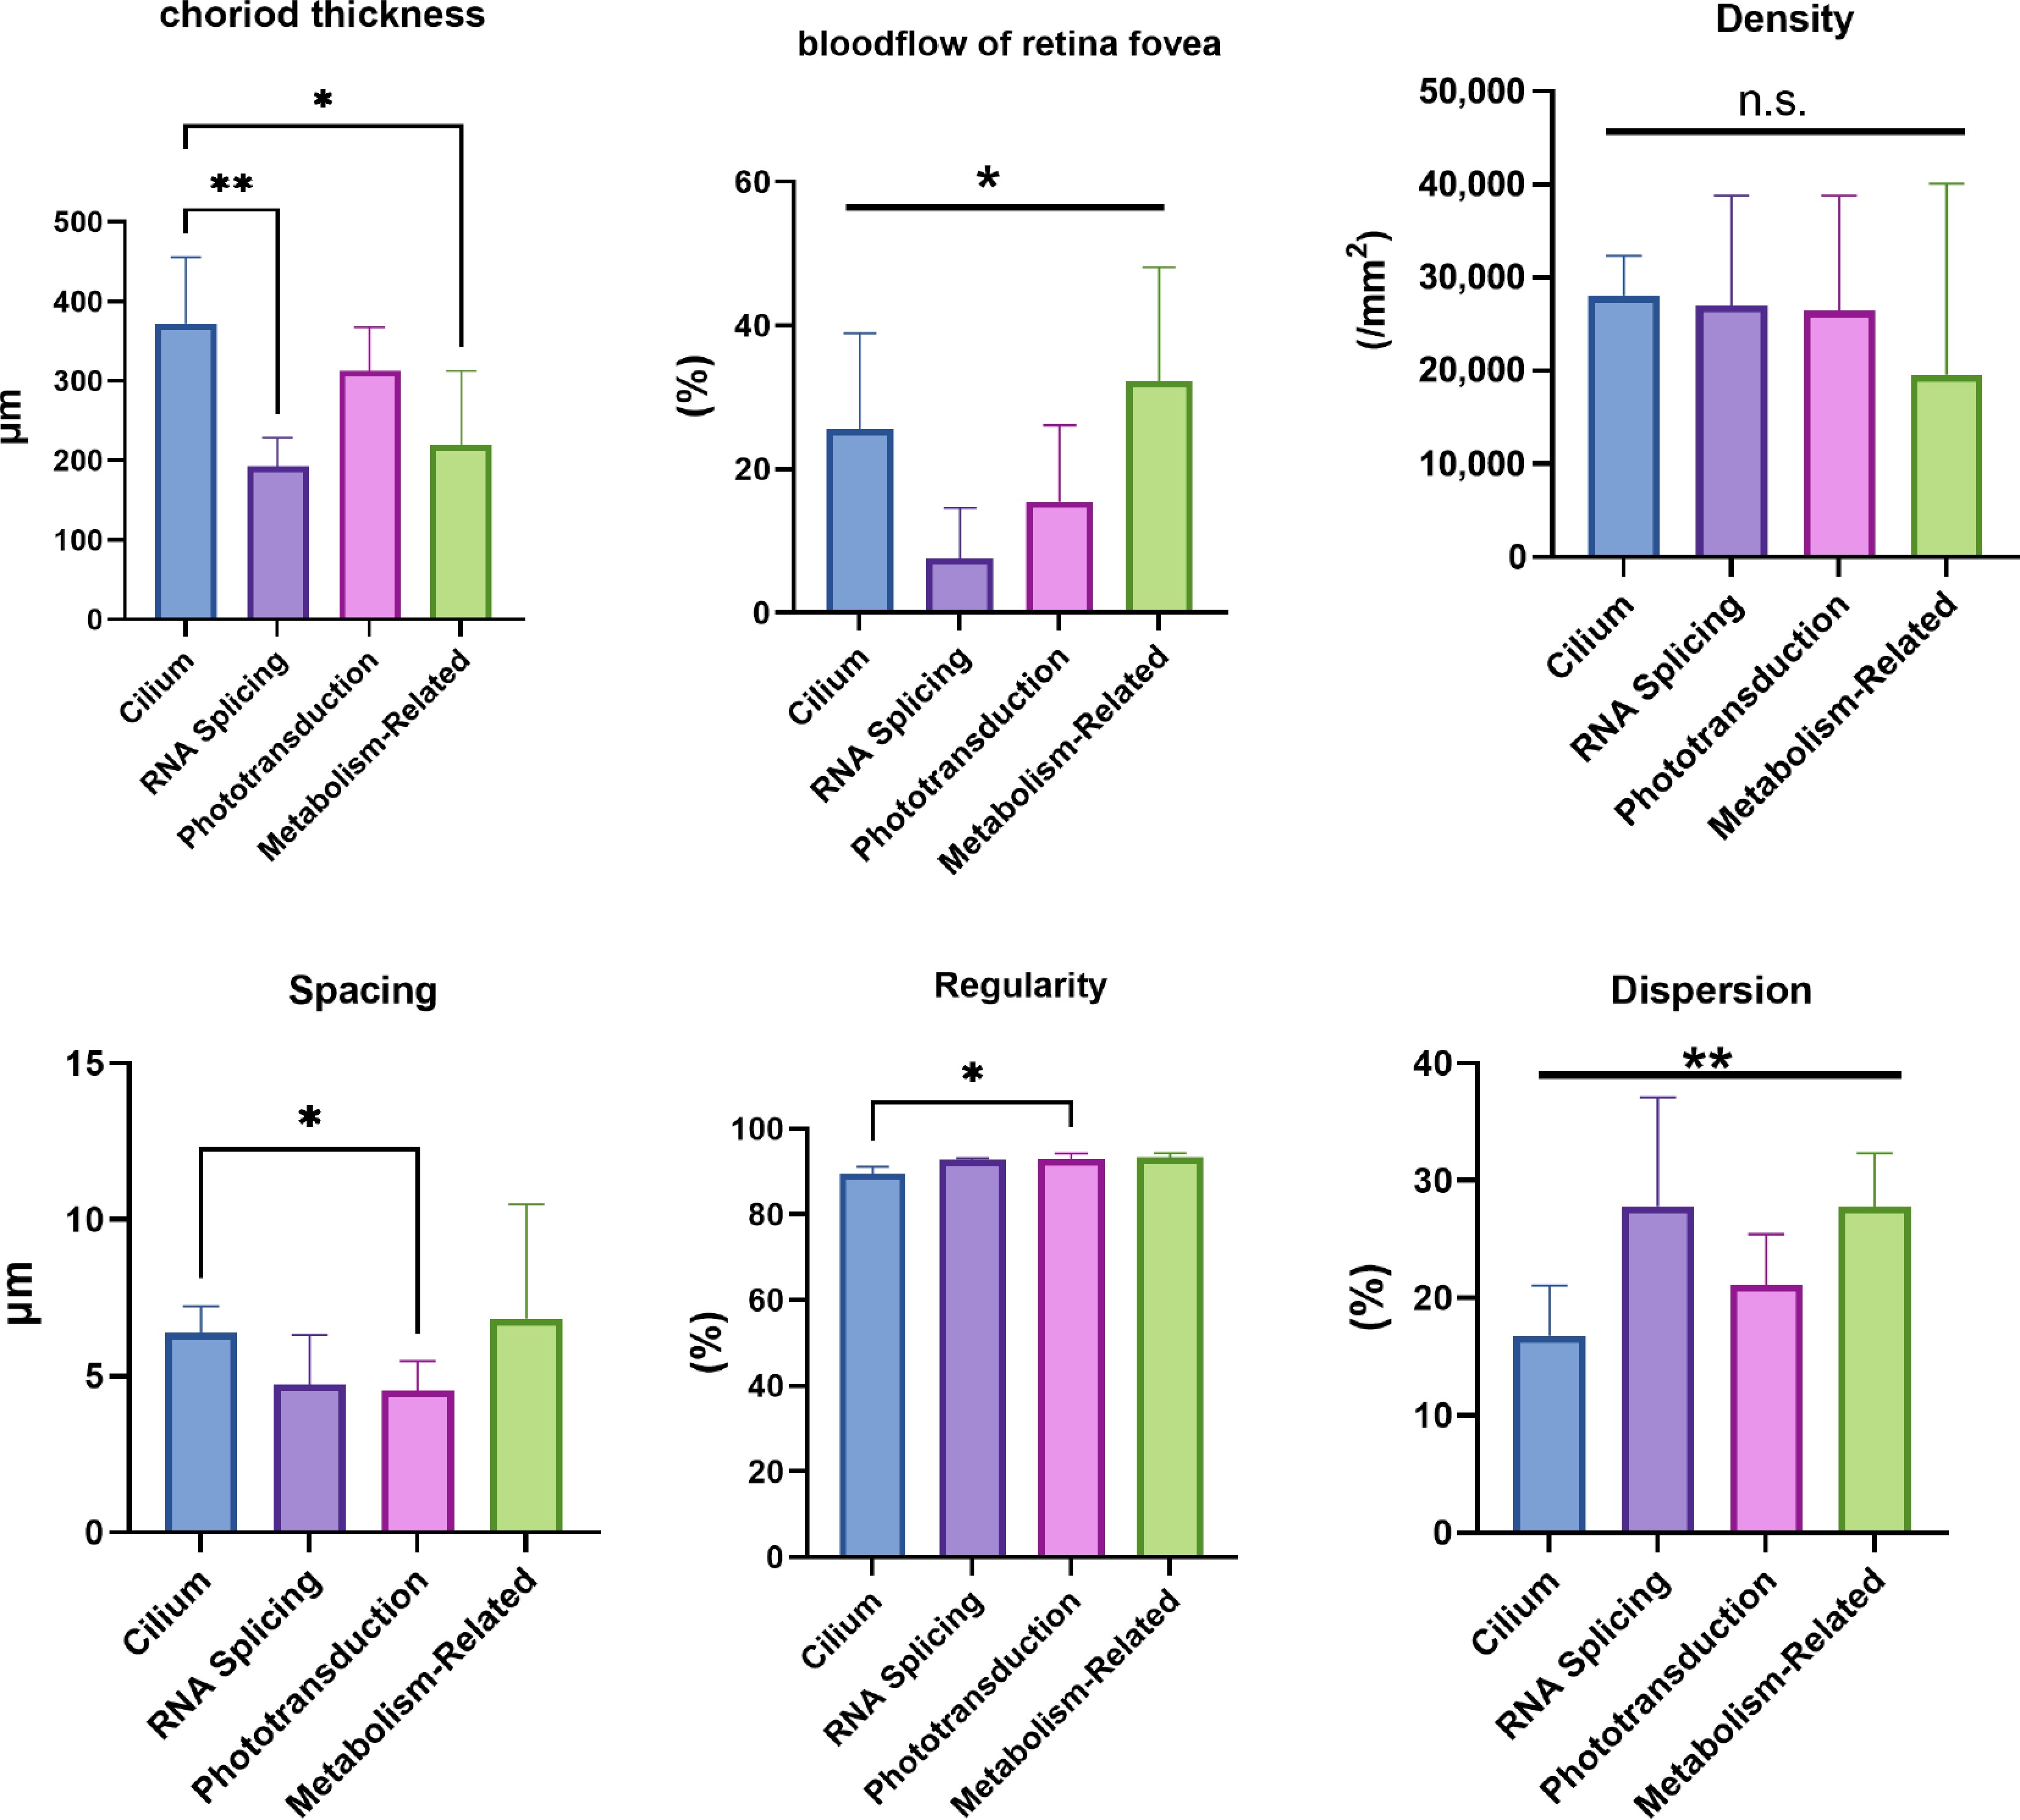
Figure 5.
Genotype–phenotype correlations in retinitis pigmentosa (RP) patients by AO/OCTA. Patients were stratified into four functional mutation groups: cilium, RNA-splicing, phototransduction, and metabolism-related. Inter-group comparisons were performed for choroidal thickness, total retinal blood-flow profile, photoreceptor density, dispersion, regularity, and spacing. Sample sizes: 16 genetically confirmed RP patients stratified into four functional mutation groups. The Kruskal–Wallis test was applied to non-normally distributed parameters; whenever the overall test was significant, Dunn's test was used for post-hoc pairwise comparisons. ** p < 0.01, * p < 0.05; ns, not significant.
Choroidal thickness showed highly significant differences between groups (p = 0.0008). The cilium group had the thickest choroid (372 ± 83.8 μm) and was significantly thicker than both the RNA splicing group (192.6 ± 36.07 μm, p = 0.0045) and the metabolism-related group (219.4 ± 93.32 μm, p = 0.0474). Furthermore, the distribution of full retinal blood flow showed significant variation among the genotype groups (p = 0.0347).
Regarding photoreceptor spatial arrangement, significant between-group differences were observed in dispersion (p = 0.0097), regularity (p = 0.0079), and spacing (p = 0.0141). The cilium group had the lowest regularity (89.66% ± 1.50%) and was significantly lower than the metabolism-related group (93.33% ± 1.03%, p = 0.0106). The spacing in the cilium was lower than in the metabolism-related groups (p = 0.0285). However, there was no significant difference in cone cell density among the four groups.
Diagnostic efficacy of AO parameters for RP carriers
-
To evaluate the potential of AO imaging in identifying preclinical pathology, we analyzed its diagnostic performance in differentiating between RP carriers and healthy controls.
Photoreceptor dispersion demonstrated the best discriminatory ability, with an area under the ROC curve (AUC) of 0.755 (95% CI: 0.615–0.894, p = 0.001). At the optimal cutoff, it achieved a specificity of 95.92%, a positive predictive value (PPV) of 81.82%, and a sensitivity of 47.37% (Fig. 6; Supplementary Table S3).
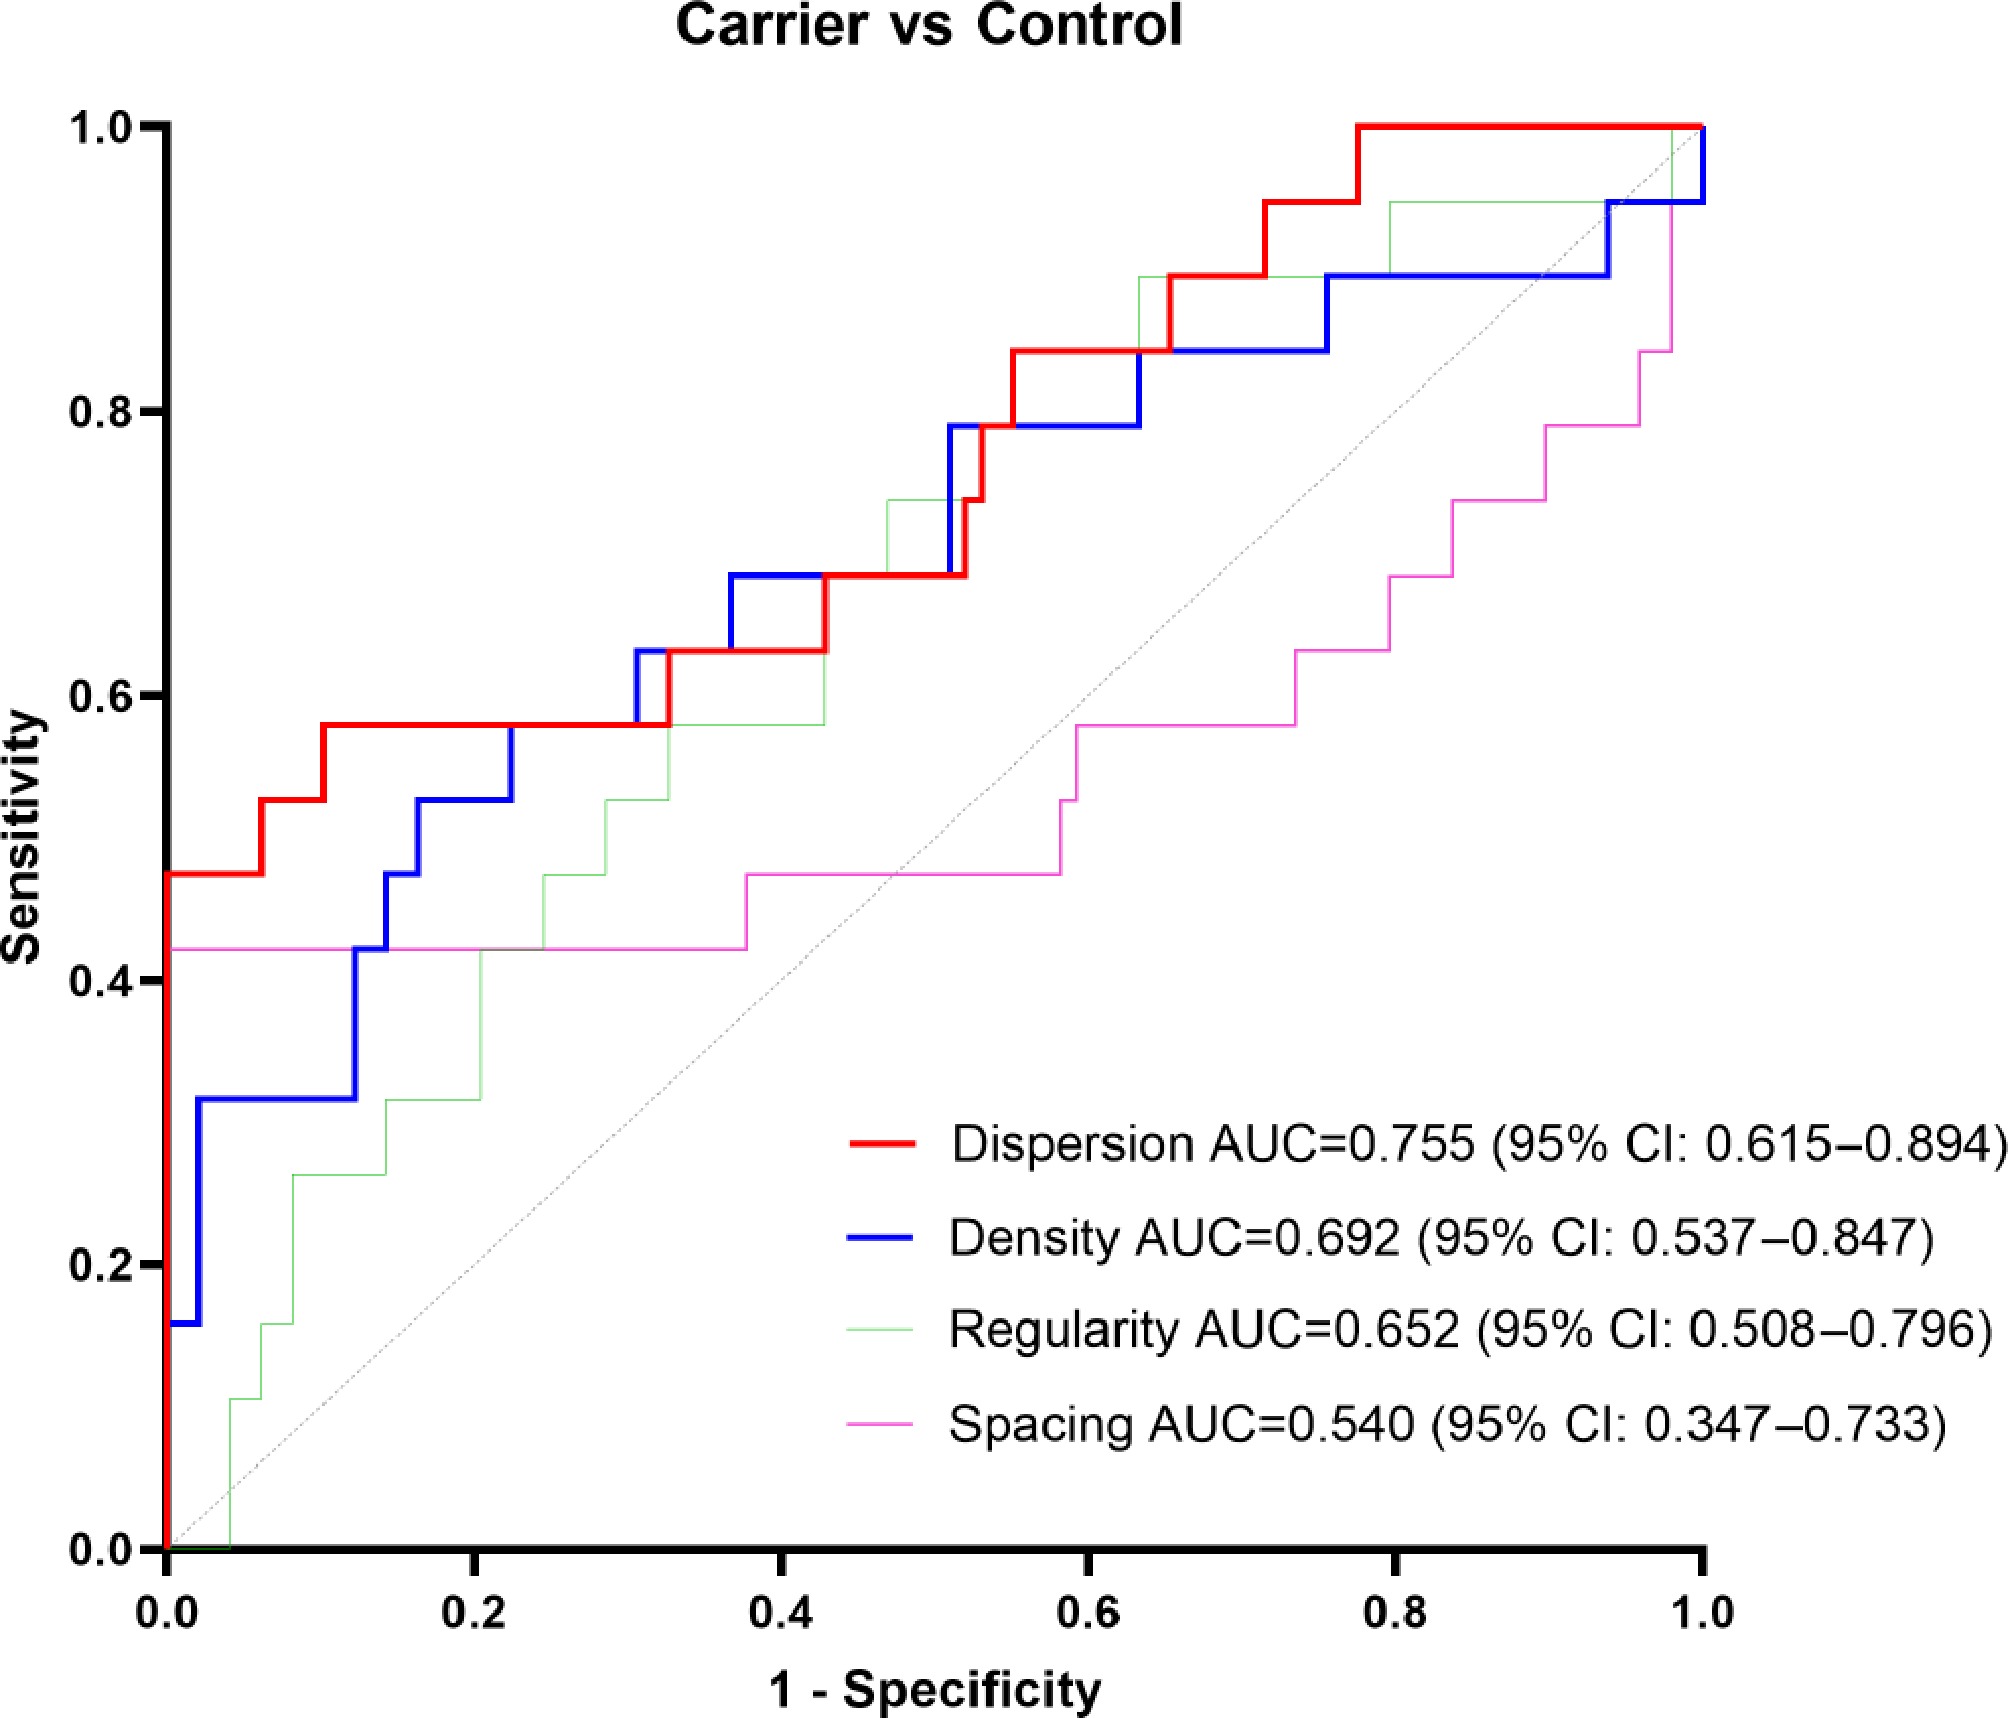
Figure 6.
ROC analysis to distinguish asymptomatic retinitis pigmentosa (RP) carriers from controls. ROC curves show photoreceptor dispersion has the highest discriminative value among four AO-quantified metrics (dispersion, density, regularity, and spacing).
Photoreceptor density had an AUC of 0.692 (p = 0.015), with a specificity of 97.96%, a PPV of 83.33%, and a sensitivity of 26.32%. The discriminatory abilities of regularity and spacing did not reach statistical significance (AUC = 0.652 and 0.540, respectively) (Fig. 6; Supplementary Table S3).
-
This study, by integrating multimodal high-resolution imaging with genetic data, reveals the heterogeneity of RP at both microstructural and functional levels, with three key findings: First, among various parameters, photoreceptor spatial dispersion serves as a highly specific biomarker for identifying preclinical RP. Second, RP exhibits significant genotype–phenotype associations, with different causative genes leading to distinct retinal microstructural alterations. Third, AO imaging uncovers 'structure–function dissociation', opening a new window for therapeutic intervention.
This study confirms that AO imaging can detect subtle retinal microstructural alterations in asymptomatic carriers of RP that are undetectable by conventional examination methods such as funduscopy or even standard OCT. Analysis showed that although the mean cone density and regularity in carriers trended lower than those in the control group, these differences did not reach statistical significance. However, photoreceptor spatial dispersion emerged as a key abnormal indicator: it demonstrated a statistically significant increase in carriers compared to the normal control group (p = 0.0036). This finding indicates that photoreceptor dispersion is one of the earliest and most sensitive detectable structural changes resulting from the genetic defect in RP. Further systematic analyses reinforce its importance: in genotype-based analysis, dispersion was among the most significantly different parameters across groups (p = 0.0097); in diagnostic performance evaluation, its ability to discriminate between RP carriers and healthy controls yielded an AUC as high as 0.755, with excellent specificity (95.92%) and positive predictive value (81.82%). These indicate that microscopic disarray in photoreceptor spatial organization represents the earliest detectable structural alteration caused by the genetic defect, occurring well before significant cell loss or overt functional impairment becomes evident. These findings suggest that AO can identify subtle photoreceptor defects in RP carriers. Previous studies have reported mosaic-like cone loss in X-linked RP carriers[9], where random X-chromosome inactivation leads to patchy areas of photoreceptor dysfunction. However, unlike prior reports, 91% of carriers in our study had autosomal recessive RP inheritance, with no X-linked cases. Additionally, all carriers had normal fundus examinations. No previous studies have reported similar findings. This indicates that RP carriers exhibit mild yet detectable cone disorganization, which may represent an intermediate retinal phenotype between RP patients and normal controls[9]. Furthermore, our findings suggest that RP carriers may exhibit genetically driven photoreceptor disruption, which could serve as an early biomarker for subclinical retinal changes and disease monitoring[9]. This discovery confirms AO as a powerful tool for detecting preclinical pathology, providing a highly credible new imaging basis for disease screening and risk warning before symptoms appear. Cone cell dispersion may serve as a reliable 'red-flag' indicator, applicable for initial screening among RP family members, with priority genetic counseling and follow-up for positive individuals.
This discovery challenges the traditional notion that RP is inevitably accompanied by progressive choroidal atrophy. We hypothesize that RP caused by cilium dysfunction may follow a distinct pathological process, in which cytoskeletal or polarity disturbances in photoreceptors—manifested as decreased regularity and increased dispersion on AO imaging—may occur earlier. Choroidal thickening might represent a compensatory response to photoreceptor damage, or reflect an independent pathological vascular remodeling mechanism specific to this molecular pathway. However, owing to the cross-sectional design of this study, we cannot definitively distinguish the causal direction between photoreceptor disorganization and choroidal thickening, nor verify the functional implication of this phenotype. To validate this hypothesis, future longitudinal follow-up studies are needed to observe the temporal sequence of choroidal thickness changes and photoreceptor structural alterations; meanwhile, combining functional assessments such as CVI measurement and choroidal oxygen metabolism analysis will help further clarify the pathological nature of this paradoxical phenotype. In contrast, the metabolism-related group exhibited greater photoreceptor spacing, which more likely reflects actual photoreceptor cell loss due to metabolic stress. This striking difference strongly suggests that AO imaging can not only quantify cell loss but also distinguish between distinct cellular pathological patterns triggered by different genetic defects—that is, 'disorganization' and 'cell loss' may represent different morphological endpoints driven by distinct molecular mechanisms. Furthermore, although retinal blood flow on OCT showed only marginally significant differences among groups, this indicates that the regulation of retinal microcirculation may also be intricately influenced by genetic background. Future studies with larger sample sizes and more precise layered blood flow analyses are needed to uncover potential genotype–blood flow associations.
After controlling for age, gender, and axial length using partial correlation analysis, we confirmed that cone photoreceptor dispersion remained significantly negatively correlated with outer retinal thickness, reinforcing the notion that photoreceptor spatial disorganization is a core and independent feature of outer retinal degeneration. The positive correlation between AO density and outer retinal thickness also persisted, further supporting the use of AO density as a surrogate marker of photoreceptor layer integrity[20]. Notably, no significant correlations were observed between any AO parameters (density, spacing, regularity, dispersion) and visual acuity, highlighting the complex and non-linear relationship between photoreceptor structural alterations and functional outcomes[21]. Additionally, our adjusted analysis revealed novel significant associations: reduced cone mosaic regularity correlated with both progressive retinal thinning and decreased retinal perfusion, while wider cone spacing was associated with thinner choroid and increased deep retinal blood flow. These findings suggest that distinct AO metrics reflect different aspects of retinal pathophysiology in RP, with dispersion primarily reflecting photoreceptor disorganization and spacing potentially indicating early cell loss and vascular remodeling.
In our stratified analysis of RP patients by EZ-based disease staging, progressive thinning of the outer retina was identified as the most prominent structural change in advanced RP, followed by secondary inner retinal atrophy. Retinal superficial perfusion was significantly decreased in late-stage RP, likely as a secondary response to progressive retinal neurodegeneration. Meanwhile, cone morphology metrics measured by adaptive optics were comparable across all disease stages, which was likely attributed to the relative preservation of foveal cone structure in the residual EZ region across our cohort. The EZ serves as a key OCT biomarker of photoreceptor function, largely driven by mitochondrial density in the inner segments, and its loss is commonly associated with severe visual decline. However, our study shows that AO imaging can still detect cone photoreceptors in areas where the EZ is absent, indicating a dissociation between structural preservation and functional integrity[9]. This discrepancy stems from the high-resolution imaging capability of AO for morphological structures, enabling it to identify residual cone photoreceptors that are undetectable by OCT[5,22]. This indicates that functional loss of photoreceptors may precede their complete structural disintegration. This finding carries significant translational implications: in retinal regions traditionally considered non-functional, there may still exist a substantial number of structurally preserved photoreceptors. These cells could serve as potential therapeutic targets for neuroprotection, gene therapy, or regenerative strategies, thereby opening new possibilities for extending the therapeutic window and preserving residual visual function. AO functional imaging techniques (e.g., optoretinography[23,24], microperimetry[25]) and multimodal AO systems[26−28] further confirm that the absence of the EZ does not equate to complete loss of photoreceptors, offering a novel dimension for therapeutic evaluation.
This study has several limitations. First, the cross-sectional design restricts the ability to analyze disease progression over time. Future studies should incorporate longitudinal AO imaging to better characterize the dynamic changes in photoreceptor structure and function. Second, the manual selection of ROI introduces potential sampling bias, which could impact the reproducibility and generalizability of the findings. Standardization of AO metrics and the development of automated, AI-driven segmentation techniques would enhance measurement consistency and reduce observer-dependent variability. Third, this study grouped patients based on gene function, which aids in understanding phenotypic differences, but the relatively small sample size of each genotype subgroup may limit the robustness of the current genotype–phenotype association results, and genetic heterogeneity persists within each group. It should be noted that RP is a rare inherited retinal dystrophy with extreme genetic heterogeneity, and the recruitment of cases with specific genotype subtypes faces universal challenges in single-center studies, which is further compounded by our strict inclusion of only genetically confirmed cases and asymptomatic carriers. Additionally, some patients were excluded from the analysis due to the absence of clearly identified mutations, which may introduce selection bias. Fourth, we acknowledge that physiological factors such as age, gender, and axial length may influence retinal structure and vascular parameters. To address this potential confounding, we analyzed all correlations using partial correlation analysis to control for these effects, which has strengthened the validity of our core findings. Future large-scale, multi-center cohort studies with sufficient sample size for each genotype subgroup are needed to validate and refine the genotype–phenotype correlations identified in this study, to further enhance the clinical utility of AO imaging in hereditary ocular diseases.
-
This study demonstrates that AO imaging can detect pre-symptomatic photoreceptor disorganization in RP patients and carriers, which correlates with retinal thinning. Notably, we establish for the first time a genotype–phenotype link in RP, with cilia-related mutations showing a unique paradoxical phenotype of severe disorganization yet thickened choroid. Photoreceptor dispersion serves as a sensitive imaging biomarker to distinguish asymptomatic carriers from controls. These findings highlight the potential of AO for early detection, mechanistic subtyping, and monitoring of RP. Future work should integrate longitudinal AO with functional modalities and AI tools to advance personalized management of inherited retinal diseases.
-
The study adhered to the tenets of the Declaration of Helsinki and was approved by the Ethics Committee of The First Affiliated Hospital of Chongqing Medical University (Approval No. 2024-162-01, 20 June 2024). Written informed consent was obtained from all participants prior to enrollment.
-
The authors confirm contribution to the paper as follows: conceptualization, methodology, software, visualization, writing − original draft: Deng WL; methodology, software, data curation, investigation: Liu KY; data curation, investigation: Li ZY, Tang C; data curation: Xiao RY, Zeng C; funding acquisition, supervision: Wan WJ; writing − review and editing, supervision, funding acquisition: Zhang YL; conceptualization, writing − review and editing, supervision, funding acquisition, project administration: Liu SL. All authors reviewed and approved the final version of the manuscript.
-
The datasets generated during and/or analyzed in the current study are available from the corresponding author on reasonable request.
-
This study was supported by grants from the Science and Technology Research Program of Chongqing Municipal Education Commission (Grant No. KJZD-K202400402) and the National Natural Science Foundation of China (Grant Nos 81800814, 81371043, 81970832). These funding organizations had no role in the design or conduct of this research. We are grateful to all participating patients for their essential contribution to this study. We also thank Tang Li (Zhitong Vision Science [Chongqing] Biotechnology Co., Ltd) for technical support and valuable suggestions regarding the AO instrumentation.
-
The authors declare that they have no conflict of interest. Mr. Tang Li from Zhitong Vision Science (Chongqing) Biotechnology Co., Ltd, who was acknowledged for technical guidance on AO instrument operation, did not participate in the study design, data collection and analysis, decision to publish, or manuscript preparation. Mr. Tang Li and Zhitong Vision Science (Chongqing) Biotechnology Co., Ltd have no financial or non-financial competing interests related to this study.
-
accompanies this paper online at: https://doi.org/10.48130/vns-0026-0033.
- Supplementary Table S1 Details of gene variants in patients with retinitis pigmentosa.
- Supplementary Table S2 Genotype–phenotype links in RP identified by AO/OCTA.
- Supplementary Table S3 ROC analysis for differentiating asymptomatic RP carriers from controls by AO.
- Supplementary Fig. S1 Multimodal imaging and cone photoreceptor spatial distribution characteristics in RP patients.
- Supplementary Fig. S2 OCTA layered blood flow analysis in RP patient macular region.
- Copyright: © 2026 by the author(s). Published by Maximum Academic Press, Fayetteville, GA. This article is an open access article distributed under Creative Commons Attribution License (CC BY 4.0), visit https://creativecommons.org/licenses/by/4.0/.
-
About this article
Cite this article
Deng WL, Liu KY, Li ZY, Tang C, Xiao RY, et al. 2026. AO/OCTA uncovers early cone and vascular changes linking genotype to phenotype in retinitis pigmentosa. Visual Neuroscience 43: e035 doi: 10.48130/vns-0026-0033 

AO/OCTA uncovers early cone and vascular changes linking genotype to phenotype in retinitis pigmentosa
- Received: 31 March 2026
- Revised: 10 June 2026
- Accepted: 22 June 2026
- Published online: 31 July 2026
Abstract: Sensitive biomarkers are critical for the early detection and personalized management of retinitis pigmentosa (RP). This study aimed to identify early imaging biomarkers in patients with RP and asymptomatic RP carriers using adaptive optics (AO) and optical coherence tomography angiography (OCTA). A total of 39 eyes from RP patients, 19 eyes from asymptomatic carriers, and 49 healthy control eyes were enrolled. Photoreceptor mosaic metrics (density, spacing, regularity, dispersion) were quantified across all groups, while OCTA-derived structural and vascular parameters were further analyzed in the RP cohort. RP patients showed reduced photoreceptor density (26,712 vs 32,763 cells/mm2) and increased dispersion (19.5% vs 12.7%) vs controls (both p < 0.05). Carriers exhibited intermediate density (29,011 cells/mm2, p = 0.124) but increased dispersion (17.1%, p < 0.05). AO density positively correlated with retinal thickness (r = 0.33–0.38, all p < 0.05). AO dispersion negatively correlated with outer retinal thickness (r = −0.43, p = 0.009). AO spacing positively correlated with deep retinal blood flow (r = 0.35, p = 0.036). Genotype grouping revealed phenotypic differences: cilia-related mutations showed the most disorganization (regularity 89.7%) but the thickest choroid (372 μm) (p < 0.05). Dispersion best distinguished carriers from controls (AUC = 0.755). In conclusion, AO detects photoreceptor disorganization in RP patients that correlates with retinal structural and vascular alterations, and identifies pre-symptomatic microstructural changes in asymptomatic carriers. This first demonstration of genotype–phenotype links via multimodal imaging provides novel biomarkers for early diagnosis and personalized management of RP.