


-
Taro (Colocasia esculenta (L.) Schott) belongs to the Colocasia species of Araceae and originates from Southeast Asia[1]. It ranks fifth in root and tuber crops with 17.72 million tons produced in 2022 (
www.fao.org/faostat/en/#data/QCL/visualize ). Taro is a staple crop and is widely grown for their subterranean edible corms in tropical and subtropical regions of the world[2]. The main types of cultivated taro, including Kui taro, multi-cormels taro, multi-heads taro, and multi-cormels taro are cultivated in southern China. Compared with Kui taro, which is widely distributed in Southeast Asia, the lateral cormels derived from the buds around the mother corm are the main product organs of multi-cormels taro, which are not only a great source of starch but are also rich in bioactive substances such as polysaccharides, proteins, flavonoids, and saponins, playing an important role in the medicinal properties of anti-diarrhea, anti-asthma, anti-skin diseases, anti-high cholesterol, and anti-internal bleeding[2−5]. However, the regulatory mechanism underlying the lateral cormel expansion in multi-cormels taro remains unknown.Expansion of the plant stem (corm and tuber) or root (tuberous root) is a complex biological process involving a series of morphological, physiological, biochemical, and genetic changes[6]. Changes in phytohormones are crucial physiological characteristics that regulate the formation of the corm, tuber, and tuberous roots. Abscisic acid (ABA) plays a positive role in corm development in Gladiolus hybridus, whereas GA has the opposite of ABA function[7]. Auxin has been identified as a negative regulator of cytokinin (CK) perception during potato micro-tuber formation[8]. In our previous study, indoleacetic acid (IAA), zeatin riboside (ZR), and ABA were shown to play positive roles in corm expansion in vitro[9]. However, the exact functions of phytohormones in taro corm expansion are unclear, and limited research has been conducted on the phytohormone regulatory mechanisms of taro corm expansion under natural growth conditions.
Starch accumulation is an important morphological and physiological characteristic involved in the regulation of corm expansion, and key enzymes involved in starch synthesis have been widely studied in tuberous root crops. For example, the resistant starch content of tuberous roots was improved by simultaneously suppressing MeSBE1 and MeSBE2 genes in cassava[10]. Inhibition of AGPase activity can impair starch synthesis, resulting in lowered corm quality and cormel yield in Gladiolus[11]. Transgenic potato simultaneously silencing StISA1, StISA2, and StISA3 resulted in a reduction in starch content and starch granule size in tubers[12]. In taro, the transcriptome dataset revealed 26 candidate contigs associated with starch synthesis[13]. In addition, the cell division and proliferation processes involved in regulating plant corm expansion and overexpression of the sweet potato gene IbEXP1 in Arabidopsis plants resulted in significant increases in seed size, seed number, and seed yield[14]. A TC1 gene encodes a corm globulin protein related to curculin and is involved in cell morphological changes during taro bulb expansion[15].
To reveal the expansion mechanism of lateral cormels of taro, in the present study, based on the studies of the phenotype trait identification, starch content, and related enzyme activities determination, phytohormone level detection, and transcriptome profile analysis at different stages of cormel expansion, the key growth characteristics and candidate genes involved in taro cormel expansion were revealed. These results uncover the preliminary mechanism of taro cormel expansion and provide a valuable foundation for further analysis of gene functions in the future.
-
Two taro cultivars Ganyu2 (T22) and Ganyu4 (T24), were used in this study (Fig. 1a & b). Ganyu2 has globular cormels, Ganyu4 has only long rod-like cormels, and Ganyu4 is a somaclonal variant of Ganyu2[16]. In our study, the two taro cultivars were planted in the experimental farm of Jiangxi Agriculture University, Nanchang, China (115.49° E, 28.45° N), the two materials were cultivated in two ridges, respectively, and 30 plants in each ridge, and the plant spacing was 30 cm × 60 cm, all the taro plant were cultivated in unified management practices. Cormels of the two taro cultivars with intact surfaces, no pets, and no diseases were randomly dug out at 8−10 d (S1), 50−60 d (S2), and 90−100 d (S3) after the formation of cormels (approximately four months after sowing) (Fig. 2a−f). The longitudinal and transverse diameters and weight of the cormels were determined after cleaning with distilled water. At each stage, a total of 15 plants were collected respectively for phenotype trait analysis, three biological replicates, and five plants per replicate were set. Then the taro fleshes were quickly cut into small pieces, and frozen in liquid nitrogen and stored at −80 °C, until further use.
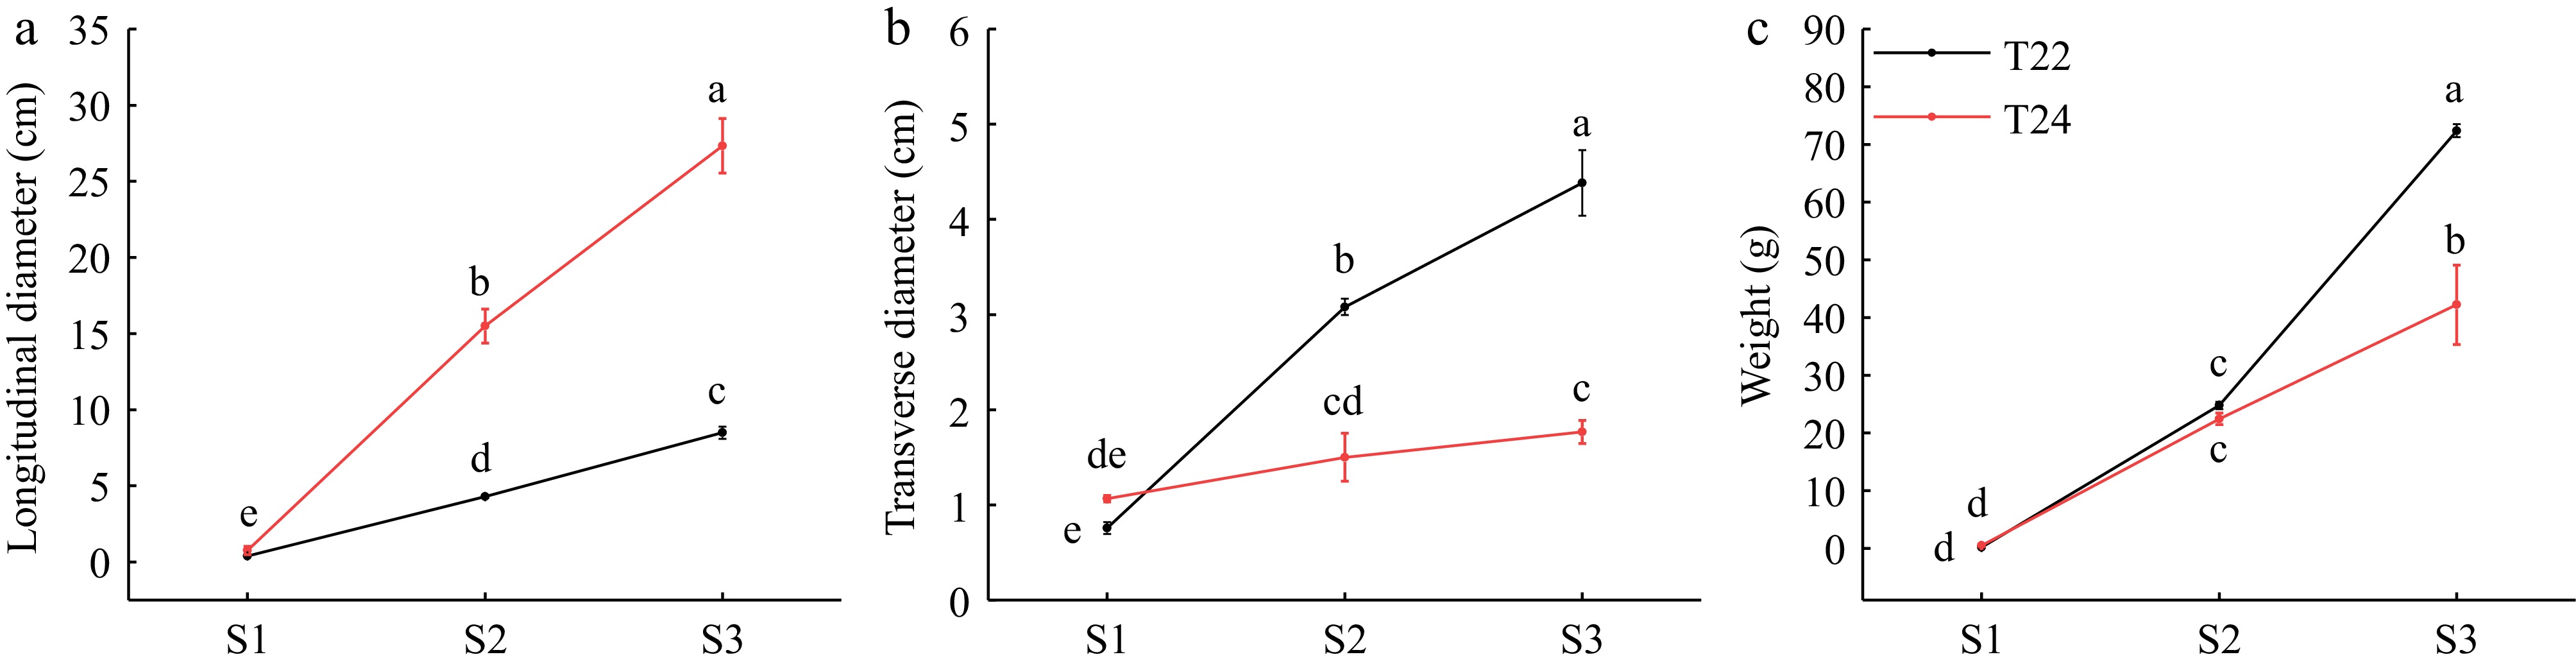
Figure 1.
(a) Longitudinal diameters, (b) transverse diameters, and (c) weights of taro cormel at the different expansion stages in T22 and T24. Data are means (± SE) from at least three biological replicates. Different letters indicate significant differences between means as determined using ANOVA followed by Duncan's multiple range test (p-value < 0.05).
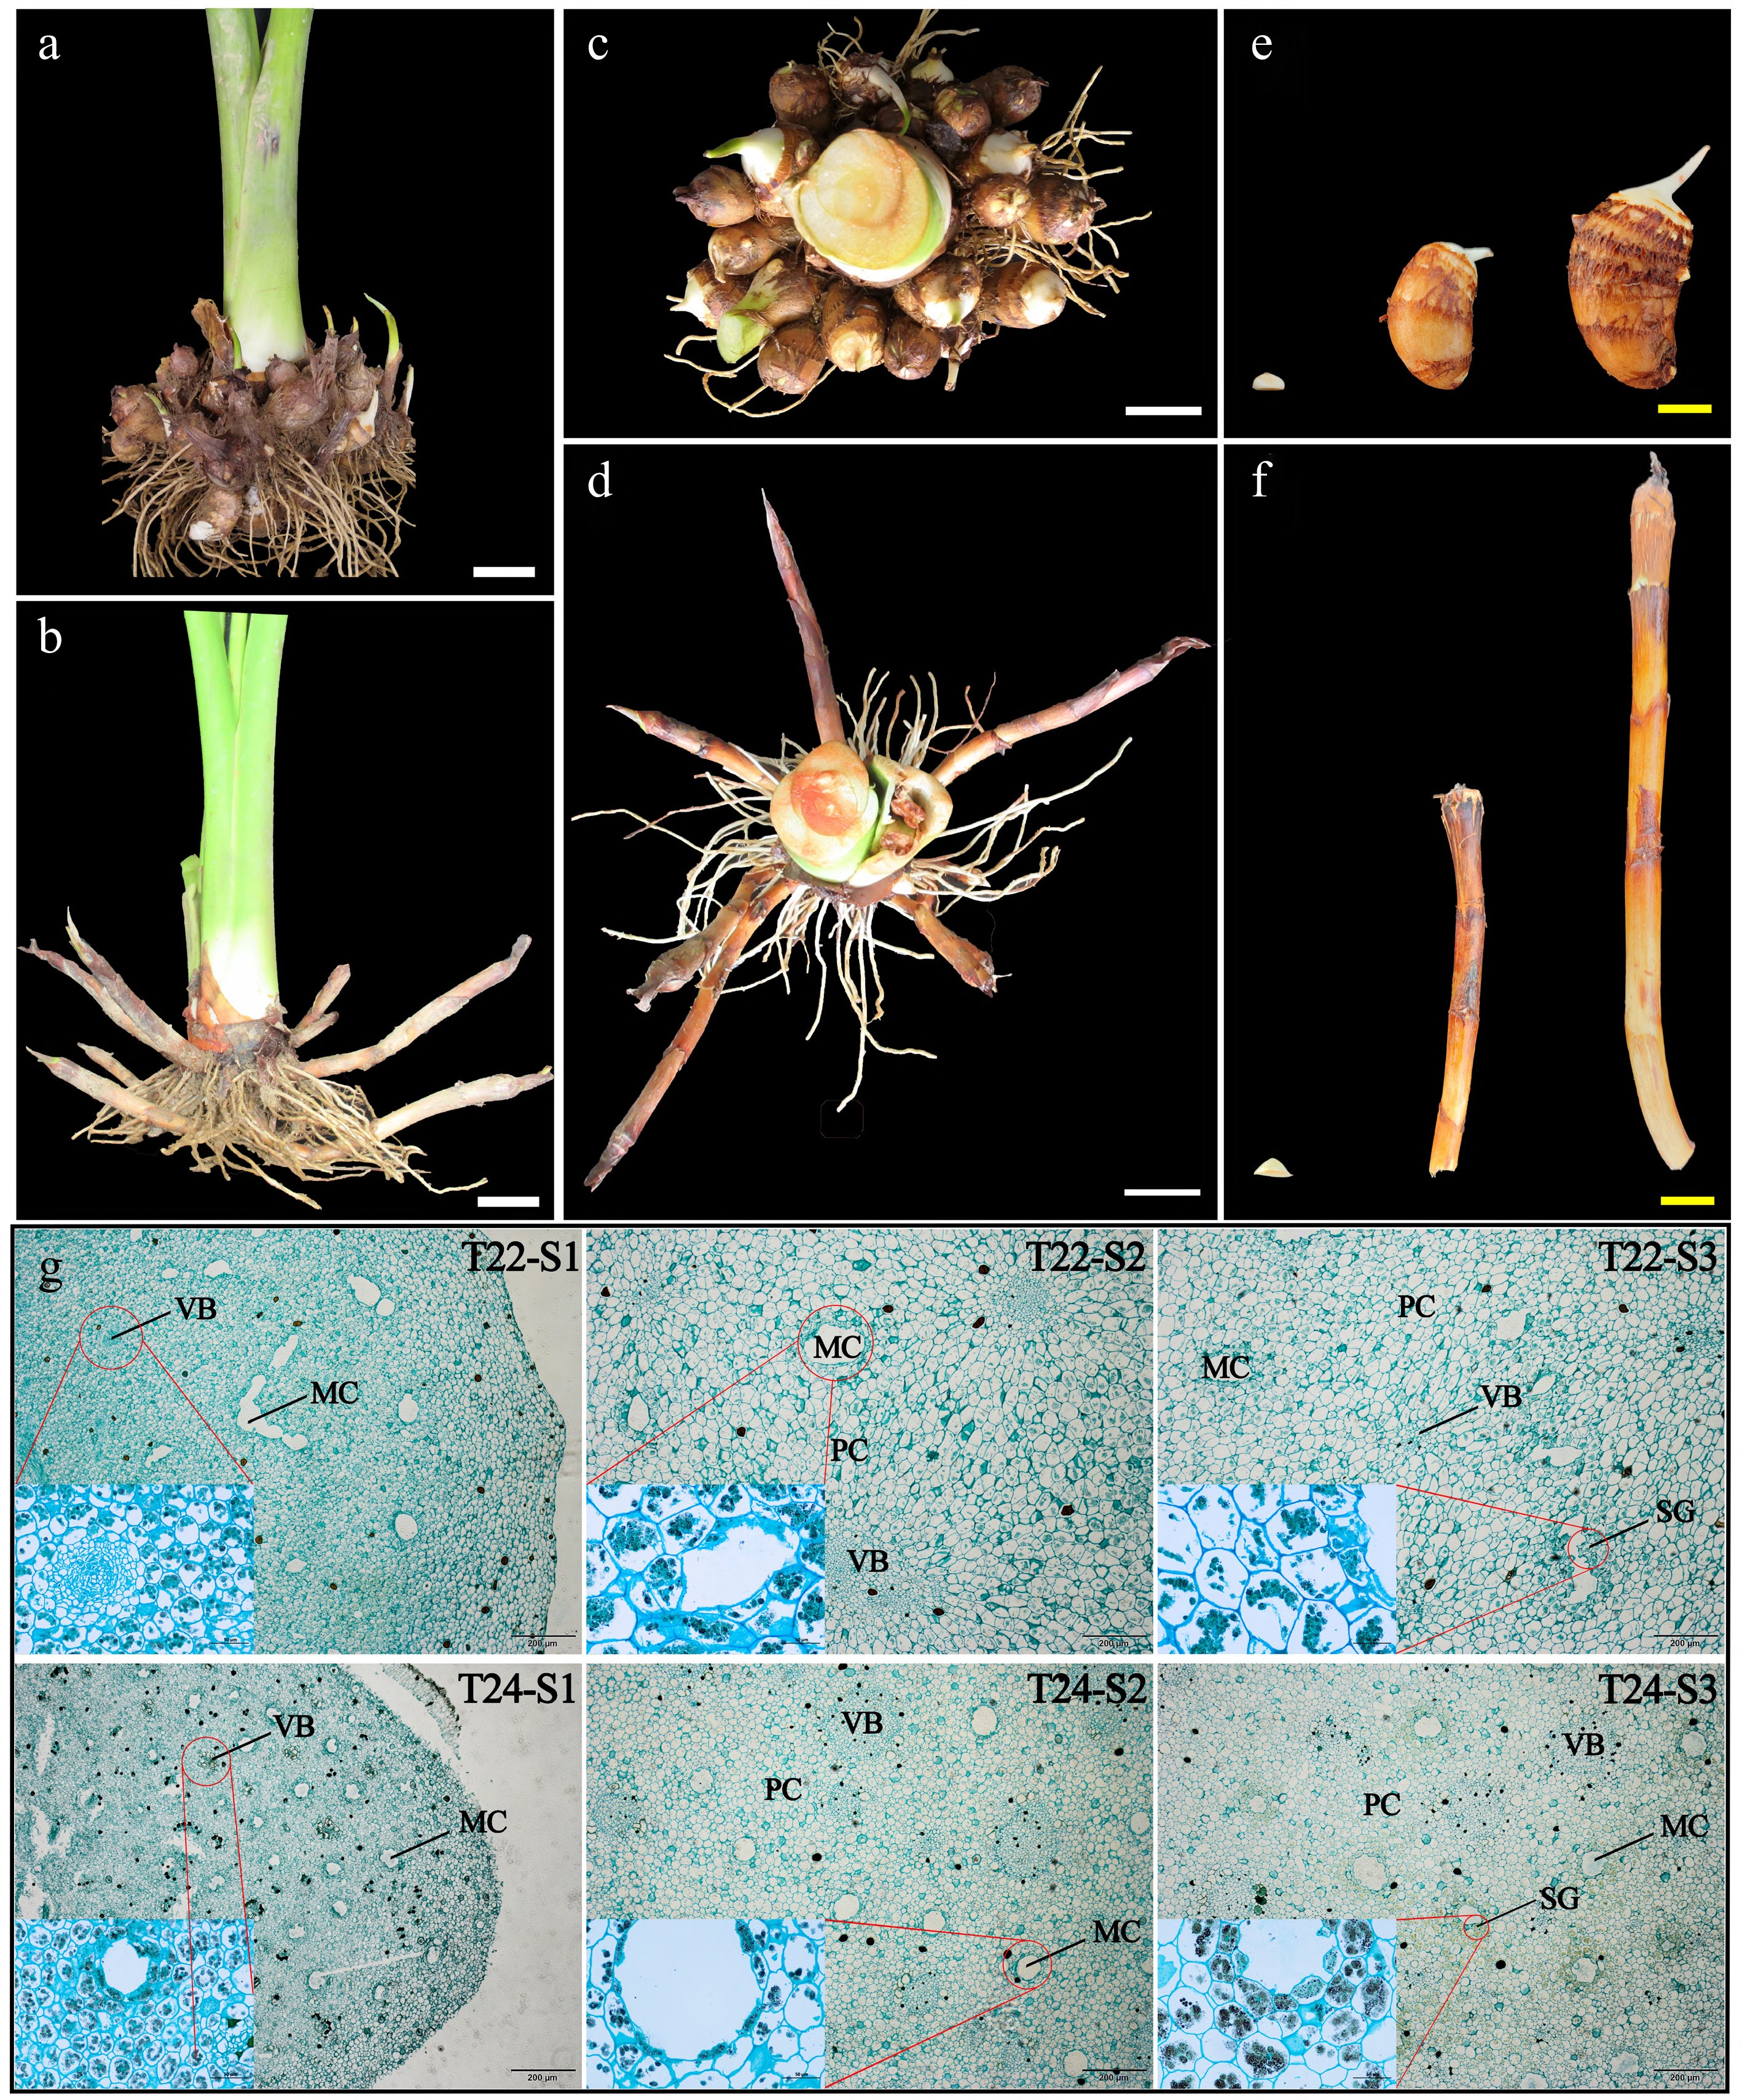
Figure 2.
Phenotypic changes and microscopy observation of taro cormel. (a)−(d) The global state of underground taro (T22 and T24) growth at maturity and taro cormels of (e) T22, and (f) T24 dug out at 8−10 d, 50−60 d, and 90−100 d. White bars = 5 cm and yellow bars = 2 cm. Sections of taro cormels at different expansion stages stained by potassium iodide and solid green from (g) T22 and T24, respectively. MC: mucilage cavities; VB: vascular bundles; PC: parenchyma cells; SG: starch granules.
Determination of the starch content and enzyme activity in taro cormels
-
Starch content was determined as previously described by Gao[17]. Frozen pulp (approximately 0.5 g) was used and every sample was examined in triplicate[18]. The starch content was measured using the anthrone colorimetric method. The activities of ADP-Glucose Pyrophosphorylase (AGP), Sucrose Phosphate Synthase (SPS), and Starch Branching Enzyme (SBE) were determined using enzyme activity assay kits for AGP (AKSU029M), SPS (AKSU022M), and SBE (AKSU032M), respectively, from Beijing Boxbio Science & Technology Co., Ltd. (Beijing, China).
Measurement of the phytohormone in taro cormels
-
The levels of IAA (Indole-3-acetic acid), ZR (Zeatin riboside), DHZR (Dihydrogen zeatin riboside), gibberellic acid (GA3 and GA4), ABA (Abscisic acid), BR (Brassinosteroid) and MeJA (Methyl jasmonate) in the different stages of taro cormel expansion were measured by the Enzyme-Linked Immunosorbent kit (ELISA) using previously described methods[19]. Each experiment was repeated three times.
Paraffin sectioning and microscopy observation
-
To explore the microscopic structural changes in the cormels of two taro cultivars, the cormels collected across the three stages of T22 and T24 were cut into pieces in fresh and fixed in FAA solution (70% ethanol : formalin : acetic acid, 90:5:5) for 24 h at 4 °C. Paraffin sections of taro flesh were prepared according to the methods described in a previous study[20], then observed and photographed under an Olympus IX73 microscope (Olympus Corporation, Tokyo, Japan). Ten complete cells were selected from each longitudinal and transverse section, and the single cell length was measured using ImageJ (v1.53t) software.
RNA extraction and sequencing
-
The total RNA of taro cormels from each stage were isolated using a TaKaRa MiniBEST Plant RNA Extraction Kit (TaKaRa Company, China). Subsequently, total RNA was quantified using a NanoDrop and Agilent 2100 bioanalyzer (Thermo Fisher Scientific, MA, USA). mRNA was purified by Oligo(dT)-attached magnetic beads. The purified mRNA was then fragmented into small pieces with fragment buffer. The 18 samples of RNA were sent to the Beijing Genomic Institute in Shenzhen, China. All cDNA library construction clusters were generated according to the manufacturers' instructions. The cDNA libraries were sequenced with BGIseq500 platform, samples were used with three biological replications.
Transcript assembly and DEGs analysis
-
Clean reads were obtained after filtering raw sequence data using SOAPnuke (v1.4.0) and were aligned to the reference genome of Colocasia esculenta (Taro_JAAS_v1.0) by using HISAT (v2.1.0)[21,22]. Gene expression levels were calculated using RSEM[23,24]. All expressed genes were analyzed to explore the gene expression patterns by hierarchical clustering analysis (HCA) using the superheat library of R software. Finally, the obtained genes and novel transcripts were annotated based on the Nr, GO, KEGG, TFs, and PRG databases using the Phyper function in R software.
DEGs were decided by DESeq2 with settings of |log2(fold-change)| > 1 and p-value < 0.05 according to Poisson distribution[25]. GO enrichment and KEGG pathway enrichments were analyzed using the R package phyper.
Prediction of interaction network of TFs and target genes
-
To investigate the key TFs involved in taro cormel expansion, interaction prediction of TFs with key candidate genes was performed. First, the binding motifs in the differentially expressed TFs were identified using the TF Binding Motif Shift in TBtools-II (v2.154)[26]. Second, the promoter sequences of key candidate genes were extracted from taro genome data. Interactions between TFs and candidate genes were scanned using the Fimo: Binding Motif Scan tool[27]. Correlation analysis of gene expression between key TFs and candidates was performed using the Origin 2021 software (9.8.0.200). Finally, a map of the TFs-target gene interaction network was constructed using the Cytoscapev3.9.1 program[28].
Vector construction and transient transformation of tobacco leaves
-
The CDS of CeAGPase (EVM0000825) was cloned from the total RNA extracted from taro cormels. The full-length of CeAGPase without a termination codon was cloned into the pCAMBIA1300-eGFP vector to obtain the pCAMBIA1300-CeAGPase-eGFP effector. The primers used are listed in Supplementary Table S1. The empty vector and effector constructs were individually transformed into the Agrobacterium strain GV3101. Positive Agrobacerium colonies were inoculated into LB medium with appropriate antibiotics (50 mg·L−1 kanamycin and 25 mg·L−1 rifampicin) overnight; then the cells were collected by centrifugation under 5,000 rpm and resuspended in infiltration buffer (MS liquid medium + 10 mM MgCl2 + 200 μM acetosyringone) to a final OD600 of 0.8. Three groups of infiltration buffer without bacterial suspension or with bacterial suspension carrying empty vector and effector constructs in equal volumes were infiltrated into the leaves of Nicotiana benthamiana plants after 12 h of exposure to light. The infiltrated plants were then cultured under a 16 h light/8 h dark photoperiod for two days. Next, images with green fluorescence signals were examined using a Canon camera under a LUYOR-3280RB excitation light source. And leaves were frozen in liquid nitrogen and stored at −80 °C for RNA extraction and measurement of AGPase activity and starch content.
qRT-PCR validation
-
Total RNA was extracted from taro cormels via the Quick RNA Isolation Kit (Huayueyang Biotechnology (Beijing) Co., Ltd), the first strand cDNA was synthesized using TAKARA PrimeScript™ RT Master Mix Kit, the quantitative real-time polymerase chain reaction (qRT-PCR) was performed on BIO-RAD CFX96 Real-Time System with Hieff UNICON Universal Blue qPCR SYBR Master Mix (Yeasen Biotechnology (Shanghai), Co., Ltd). Specific primers for the candidate genes were designed from the conserved part of their CDS sequences using Prime Primer 5.0[29]. The reaction mixture (20 μL) contained 10 μL of 2 × Realtime PCR Super mix, 0.2 μM each of forward and reverse primer, and 100 ng of the cDNA template. Relative gene expression level was calculated by the 2−ΔΔCᴛ method[30]. All primers were synthesized by Tsingke Biotechnology Co., Ltd. (Beijing, China), and the information is provided in Supplementary Table S1. All experimental data were analyzed using IBM SPSS Statistic (Version 20.0.0), and Origin 2021 (9.8.0.200).
-
Taro cormels grow continuously on the corm after the axillary buds naturally occur on its ring. To characterize the phenotypic changes during taro cormel expansion, we observed the main developmental stages (S1−S3) of the taro cormel at T22 and T24 (Fig. 2e & f). Cormel development at T22 and T24 was highly diverse in terms of phenotypic characteristics, including the cormel longitudinal diameter, transverse diameter, and weight. Over time, the transverse and longitudinal diameters of the T22 cormels increased significantly, but a slow increase in the transverse diameter and a rapid increase occurred in cormel expansion at T24. The longitudinal diameter at T22 was significantly smaller than that at T24 at stages S2 and S3 (Fig. 1a). The transverse diameter of T22 had a maximum value at the S3 stage, which changed significantly and was higher than that of T24 at the S2 and S3 stages (Fig. 1b). The weights of T22 cormels were significantly higher than those of T24 (Fig. 1c). These results suggest that taro cormel expansion in T22 is determined by an increase in transverse diameter and a slow increase in longitudinal diameter.
Cell and starch distributions in taro cormel were observed by potassium iodide and solid green staining. At S1, a large amount of parenchyma along with disordered vascular bundles was distributed in the middle of the taro cormel. During cormel expansion, it was found that the volume of various tissue structures in the cormel, such as vascular bundles, parenchyma cells, and mucous cavities, were dynamically growing with the expansion of the taro cormel, and the number of starch granules in the cells also increased (Fig. 2g). The parenchyma cells of the cormel at T22 were significantly larger than those at T24 at the S2−S3 stages (Table 1). In addition, the transverse growth (with an increase of 10.66 μm·stage−1) of the cells of T22 was greater than that of the longitudinal growth (with an increase of 7.99 μm·stage−1), while the opposite is true in T24 (Table 1). It was also found that there were denser mucous cavities and slightly smaller vascular bundles at T24 than at T22 at each stage of taro cormel development. Interestingly, the closer the cells surround the mucilage cavities, the greater the accumulation of starch granules. This indicates that the transverse growth of parenchyma cells, rapid growth of vascular bundles, and accumulation of starch granules are important factors involved in promoting taro cormel expansion.
Table 1. Longitudinal and transverse cell length of taro cormels in T22 and T24.
Taro cormel in
different stagesLongitudinal cell length (μm) Transverse cell length (μm) Ganyu2 (T22) Ganyu4 (T24) Ganyu2 (T22) Ganyu4 (T24) S1 19.34 ± 0.84 d 16.32 ± 0.17 d 12.46 ± 1.24 c 12.64 ± 0.61 d S2 31.80 ± 0.82 bc 29.40 ± 1.63 c 33.28 ± 2.13 a 22.63 ± 1.06 bc S3 35.34 ± 1.39 b 46.90 ± 2.96 a 33.78 ± 1.82 a 24.18 ± 0.70 b The data represent the mean ± standard error (SE) of three biological with three replicates each. Different letters indicate significant at the 0.05 level. Variations in starch and activity of starch synthesis enzymes during taro cormel expansion
-
Starch is an important nutrient in taro cormels. The starch content of T22 and T24 was measured to explore its relationship with taro cormel expansion. The starch content of the two taro varieties was the lowest in the initial stage but had an abundance of accumulation in the middle and late stages (Fig. 3a). But T22 possessed a higher content of starch than T24 at S1−S3. Therefore, the starch content of taro cormel largely determines its expansion.
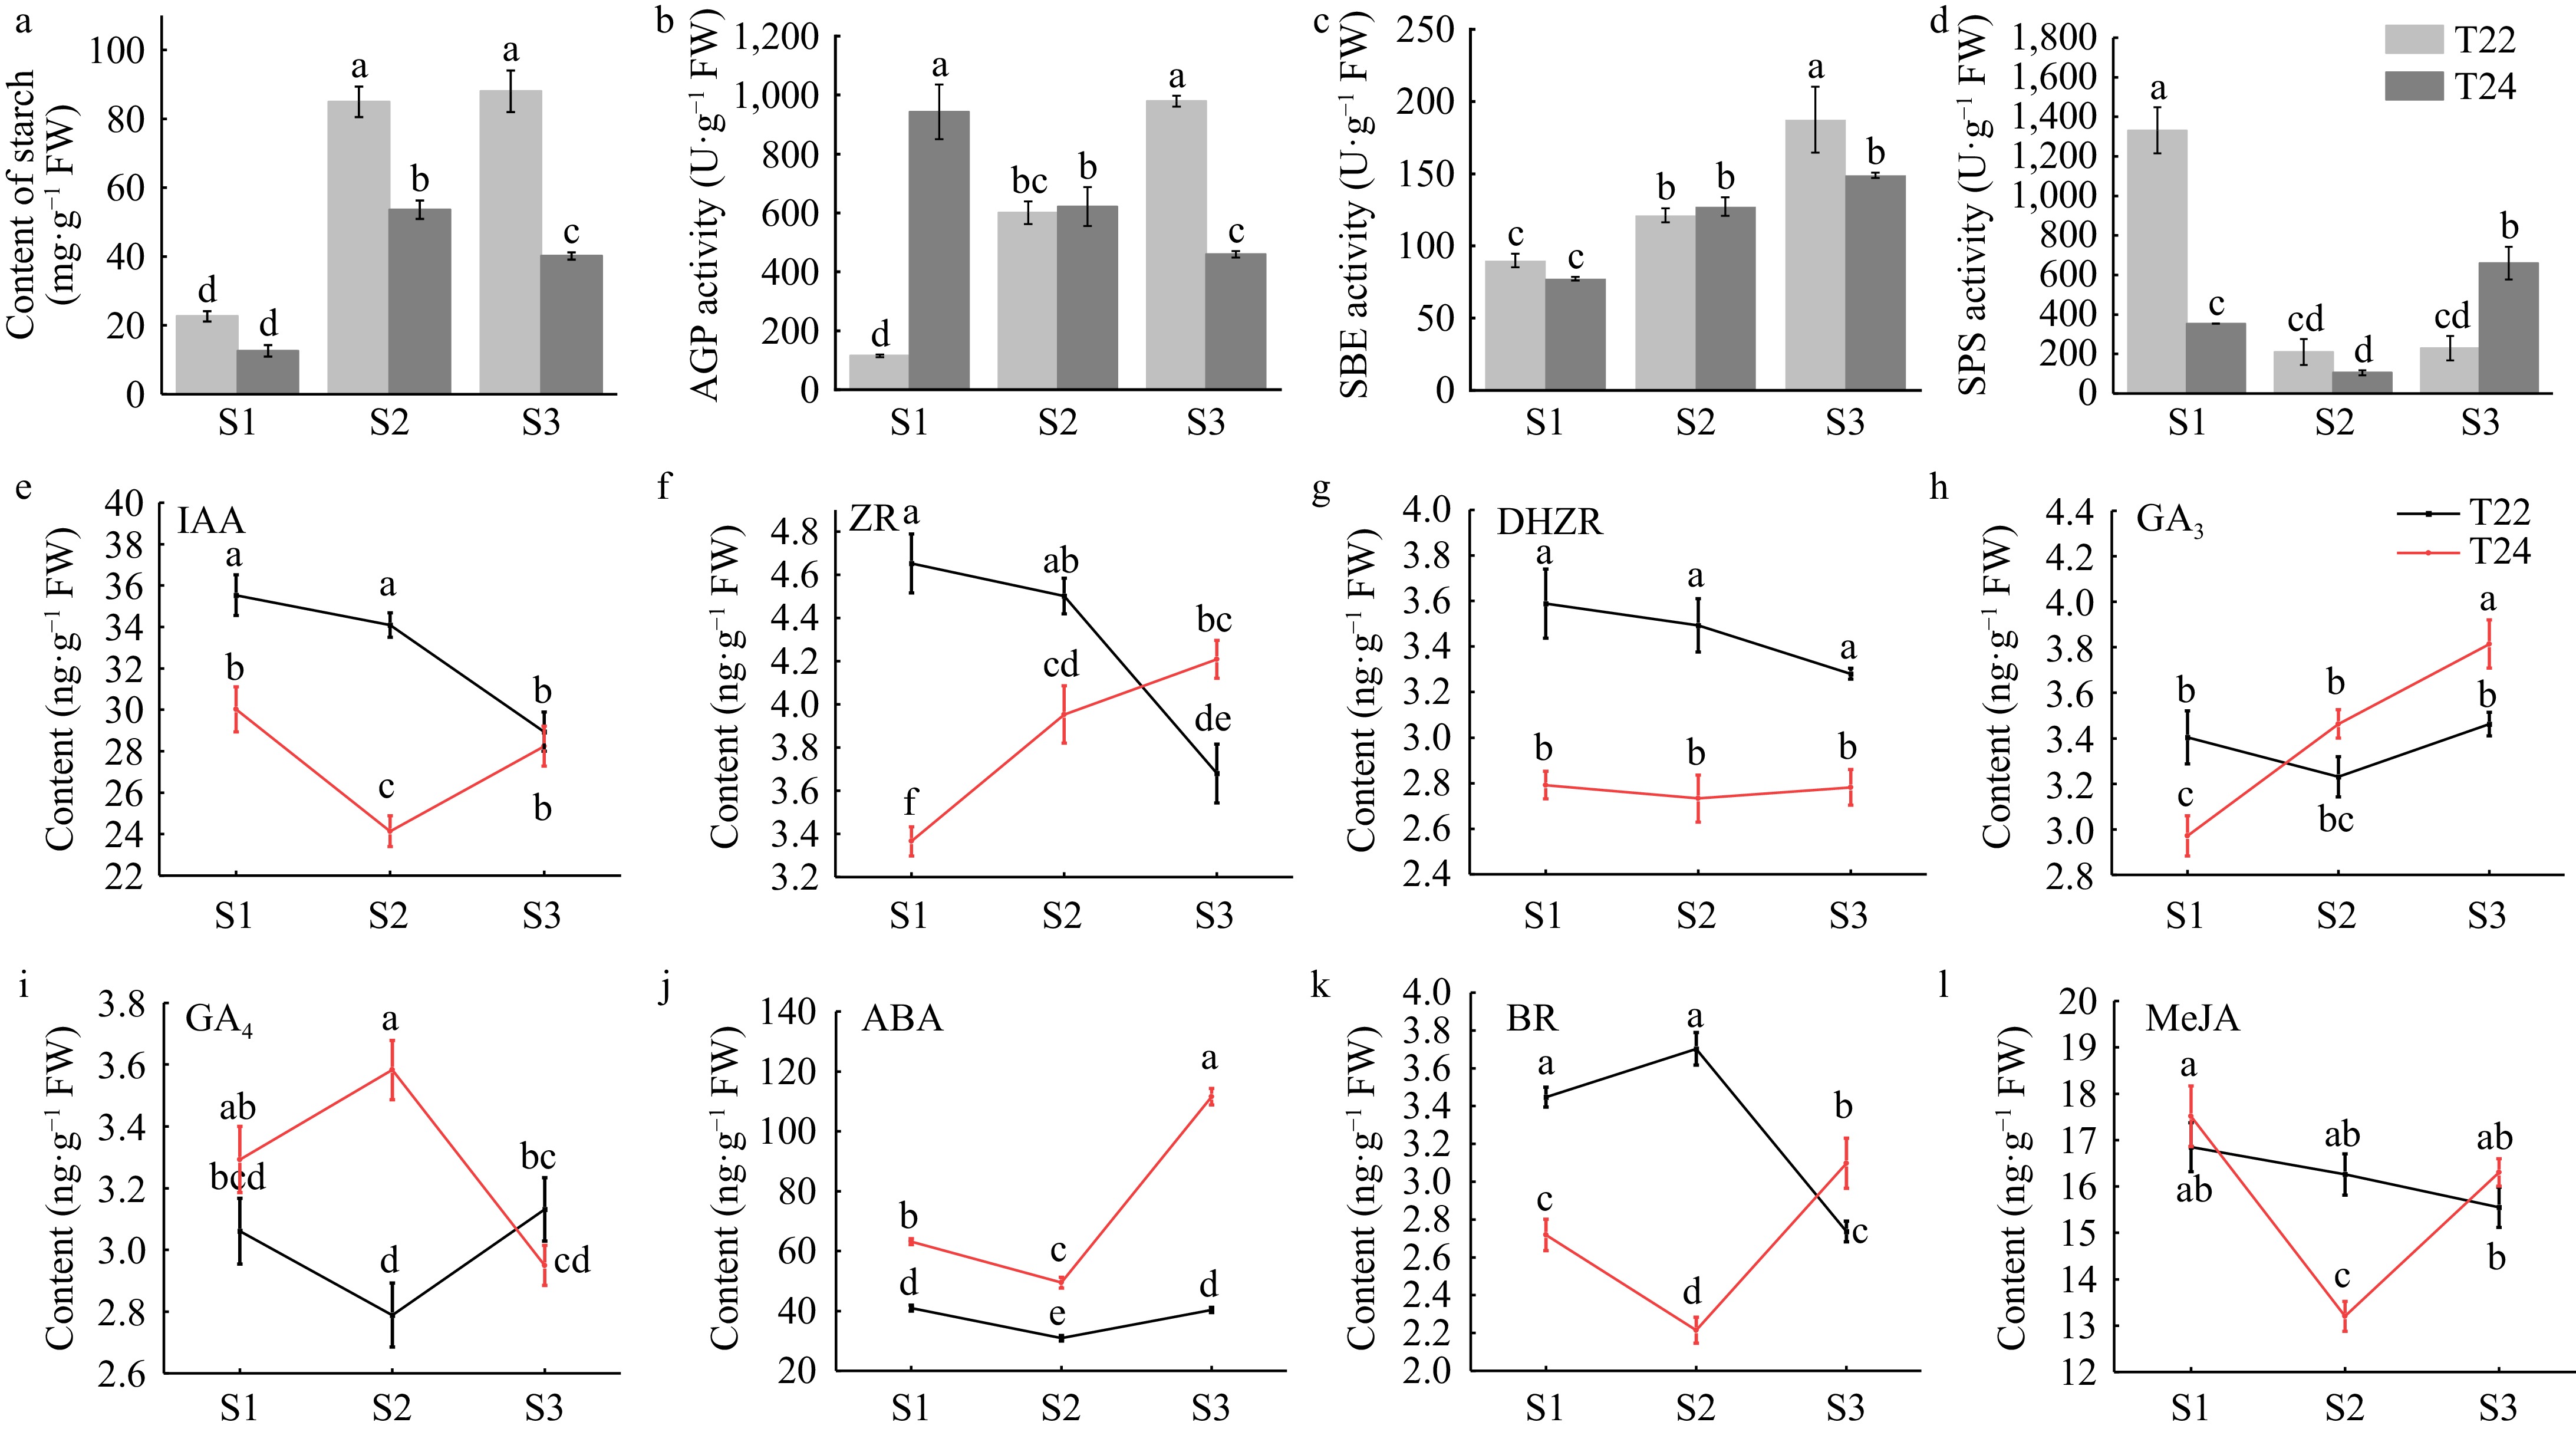
Figure 3.
Trends in starch content, starch synthesis enzymes and phytohormone levels during taro cormel expansion. Content of (a) starch at the different stages of taro cormel expansion. (b) AGP activity, (c) SBE activity, and (d) SPS activity were extracted at the different cormel expansion stages. (e) Endogenous IAA, (f) ZR, (g) DHZR, (h) GA3, (i) GA4, (j) ABA, (k) BR, and (l) MeJA levels at the different cormel expansion stages. Data are means (± SE) from at least three biological replicates. Different letters indicate significant differences between means as determined using ANOVA followed by Duncan's multiple range test (p-value < 0.05).
The activity of starch synthesis enzymes in cormel was also determined. AGP and SBE activity increased at T22 (Fig. 3b & c). Their activity and starch content showed the same increasing trend during cormel expansion at T22. At the key stage (S3) of starch accumulation, AGP and SBE activities increased significantly in T22 compared to T24. SPS activity peaked at the S1 stage of T22, which promoted sucrose production (Fig. 3d). These findings suggest that changes in starch content and activity of starch synthesis enzymes differ between T22 and T24 during cormel expansion.
Endogenous phytohormones measurement of taro cormel during expansion stages
-
Phytohormones play a vital role in plant growth and development. To determine which phytohormones perform the major functions during taro cormel expansion, we measured phytohormone levels. The IAA content decreased markedly and peaked at the S1 stage with 35.53 ng·g−1 fresh weight in T22 and higher than in T24 (Fig. 3e). The ZR content was higher in T22 than in T24 at the S1 stage, but lower in T22 at the S3 stage (Fig. 3f). The content of another cytokinin, DHZR, showed a steady variation trend and a higher level in T22 over the entire expansion stage (Fig. 3g). The content of GA3 continually increased in T24, and higher levels of GA3 were detected at later stages in T24 than in T22 (Fig. 3h). At S2 stages, the content of GA4 reached peak in T24 and nadir in T22 with 3.58 ng·g−1 and 2.79 ng·g−1 fresh weight, respectively (Fig. 3i). In T24, the lowest ABA content was 47.27 ng·g−1 fresh weight at S2 stage. In T22, the maximum ABA content was 99.42 ng·g−1 fresh weight at S2 stage (Fig. 3j). The highest content of BR was 3.70 ng·g−1 fresh weight at S2 stage in T22 and lowest content value (2.21 ng·g−1 fresh weight) in T24 S2 stage (Fig. 3k). MeJA reached a maximum value at S1 and a lower value at the lateral stage (Fig. 3l).
To identify the key factors that influence taro cormel expansion at T22 and T24, correlation analyses of the taro cormel phenotype, starch content, and phytohormone levels were performed. The results showed that the increase in transverse diameter was significantly correlated with starch content (PCC = 0.94, p-value = 0.0051), and the increase in longitudinal diameter was significantly correlated with GA3 content (PCC = 0.85, p-value = 0.035) during taro cormel expansion (Fig. 4). This suggests that the transverse expansion of taro cormel is positively correlated with starch accumulation, and that longitudinal growth is positively correlated with GA3. This may be the major factor causing globular cormels in T22 and long rod-like cormels in T24.
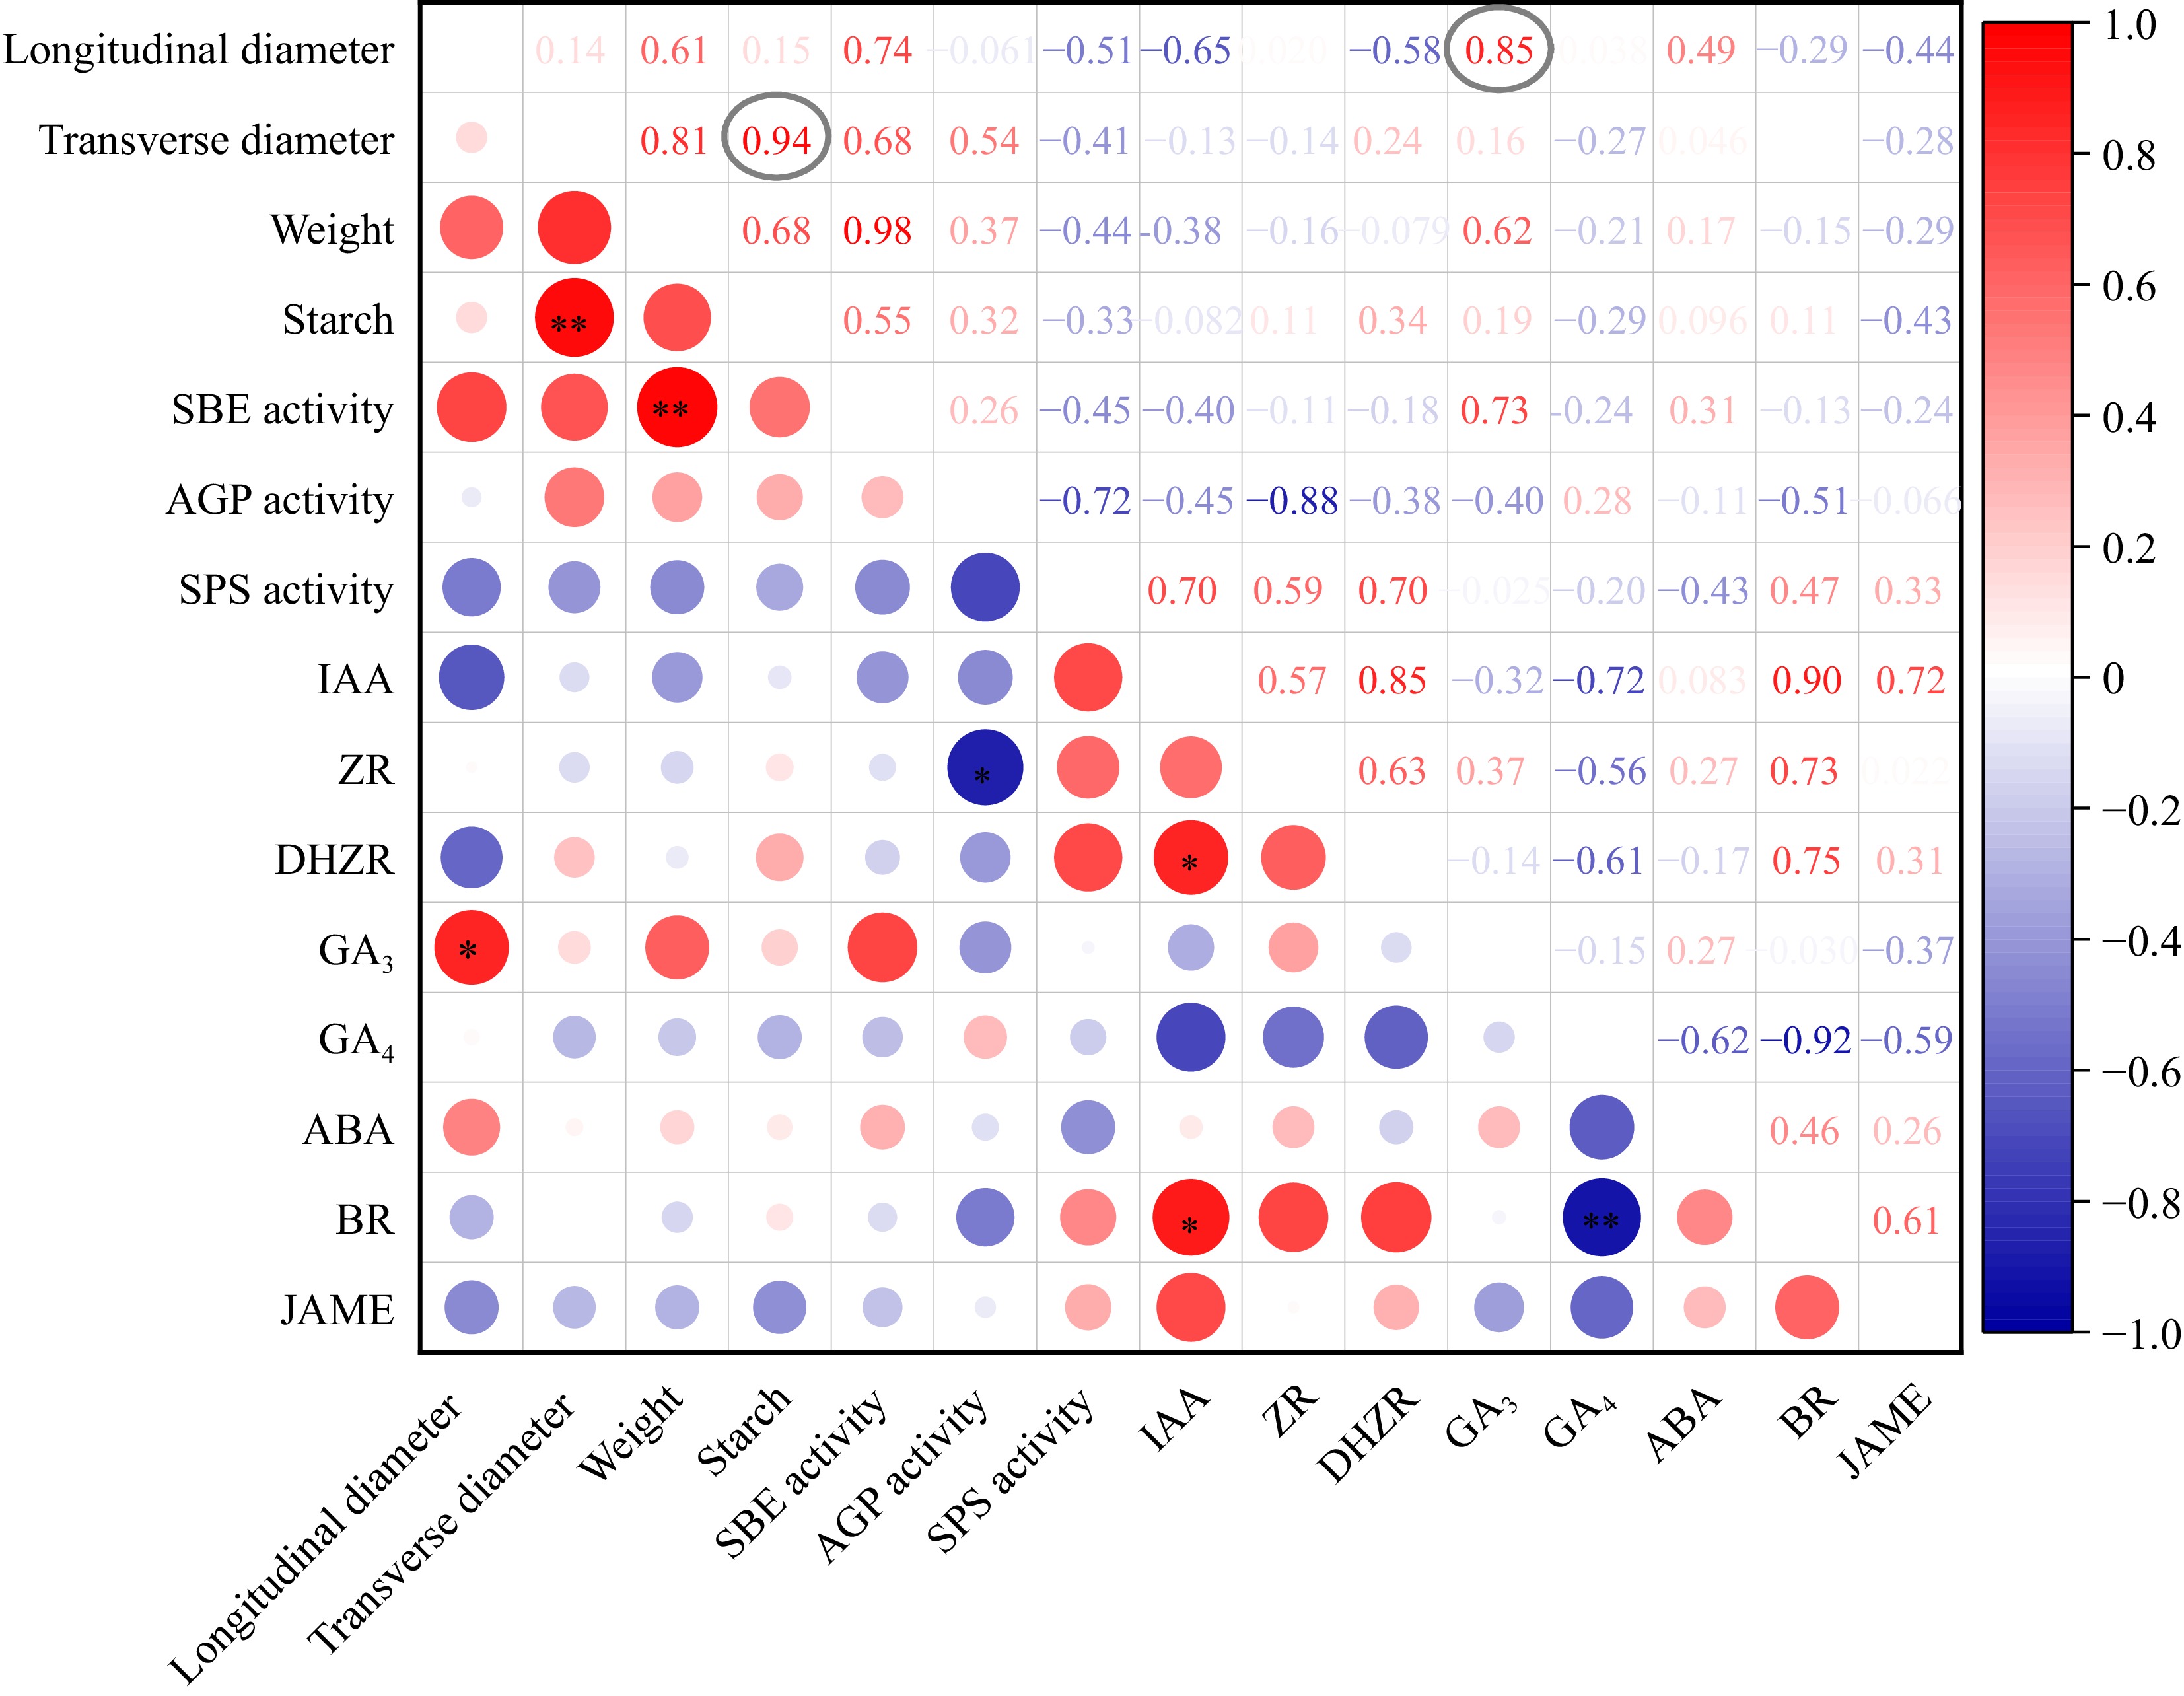
Figure 4.
The correlation analysis of taro cormel phenotype, starch content and phytohormone levels. The Pearson correlation coefficients are colored in red and blue for high and low coefficient between two indexes. The cycle size represented the significance level. * Indicates that the coefficients were significantly enriched at the 0.05 level. ** Indicates that the coefficients were significantly enriched at the 0.01 level.
Transcriptome sequencing in taro during taro cormel expansion
-
To reveal the molecular mechanism underlying taro cormel expansion, 18 mRNA samples were extracted from the two taro varieties at three stages (S1, S2, and S3). After trimming the adaptor sequences and removing low-quality reads, an average output of 6.47 Gb of clean data was obtained for each sample, and the Q30 values ranged from 91.29% to 93.2% (Supplementary Table S2). An expressed gene that has an FPKM of > 1.0 at least one sequenced sample was confirmed, and a total of 23,035 genes were detected, including 19,189 known genes and 3,846 predicted novel genes. Further analysis indicated that 195 (S1), 668 (S2), and 1,704 (S3) genes had high stage-specific expression patterns, but most genes (17,714) were shared at all stages in T22. And in T24, we observed 531 (S1), 434 (S2), and 963 (S3) genes that exhibited stage-specific transcriptional activation; however, most of the genes accumulated at all stages (Fig. 5a; Supplementary Table S3).
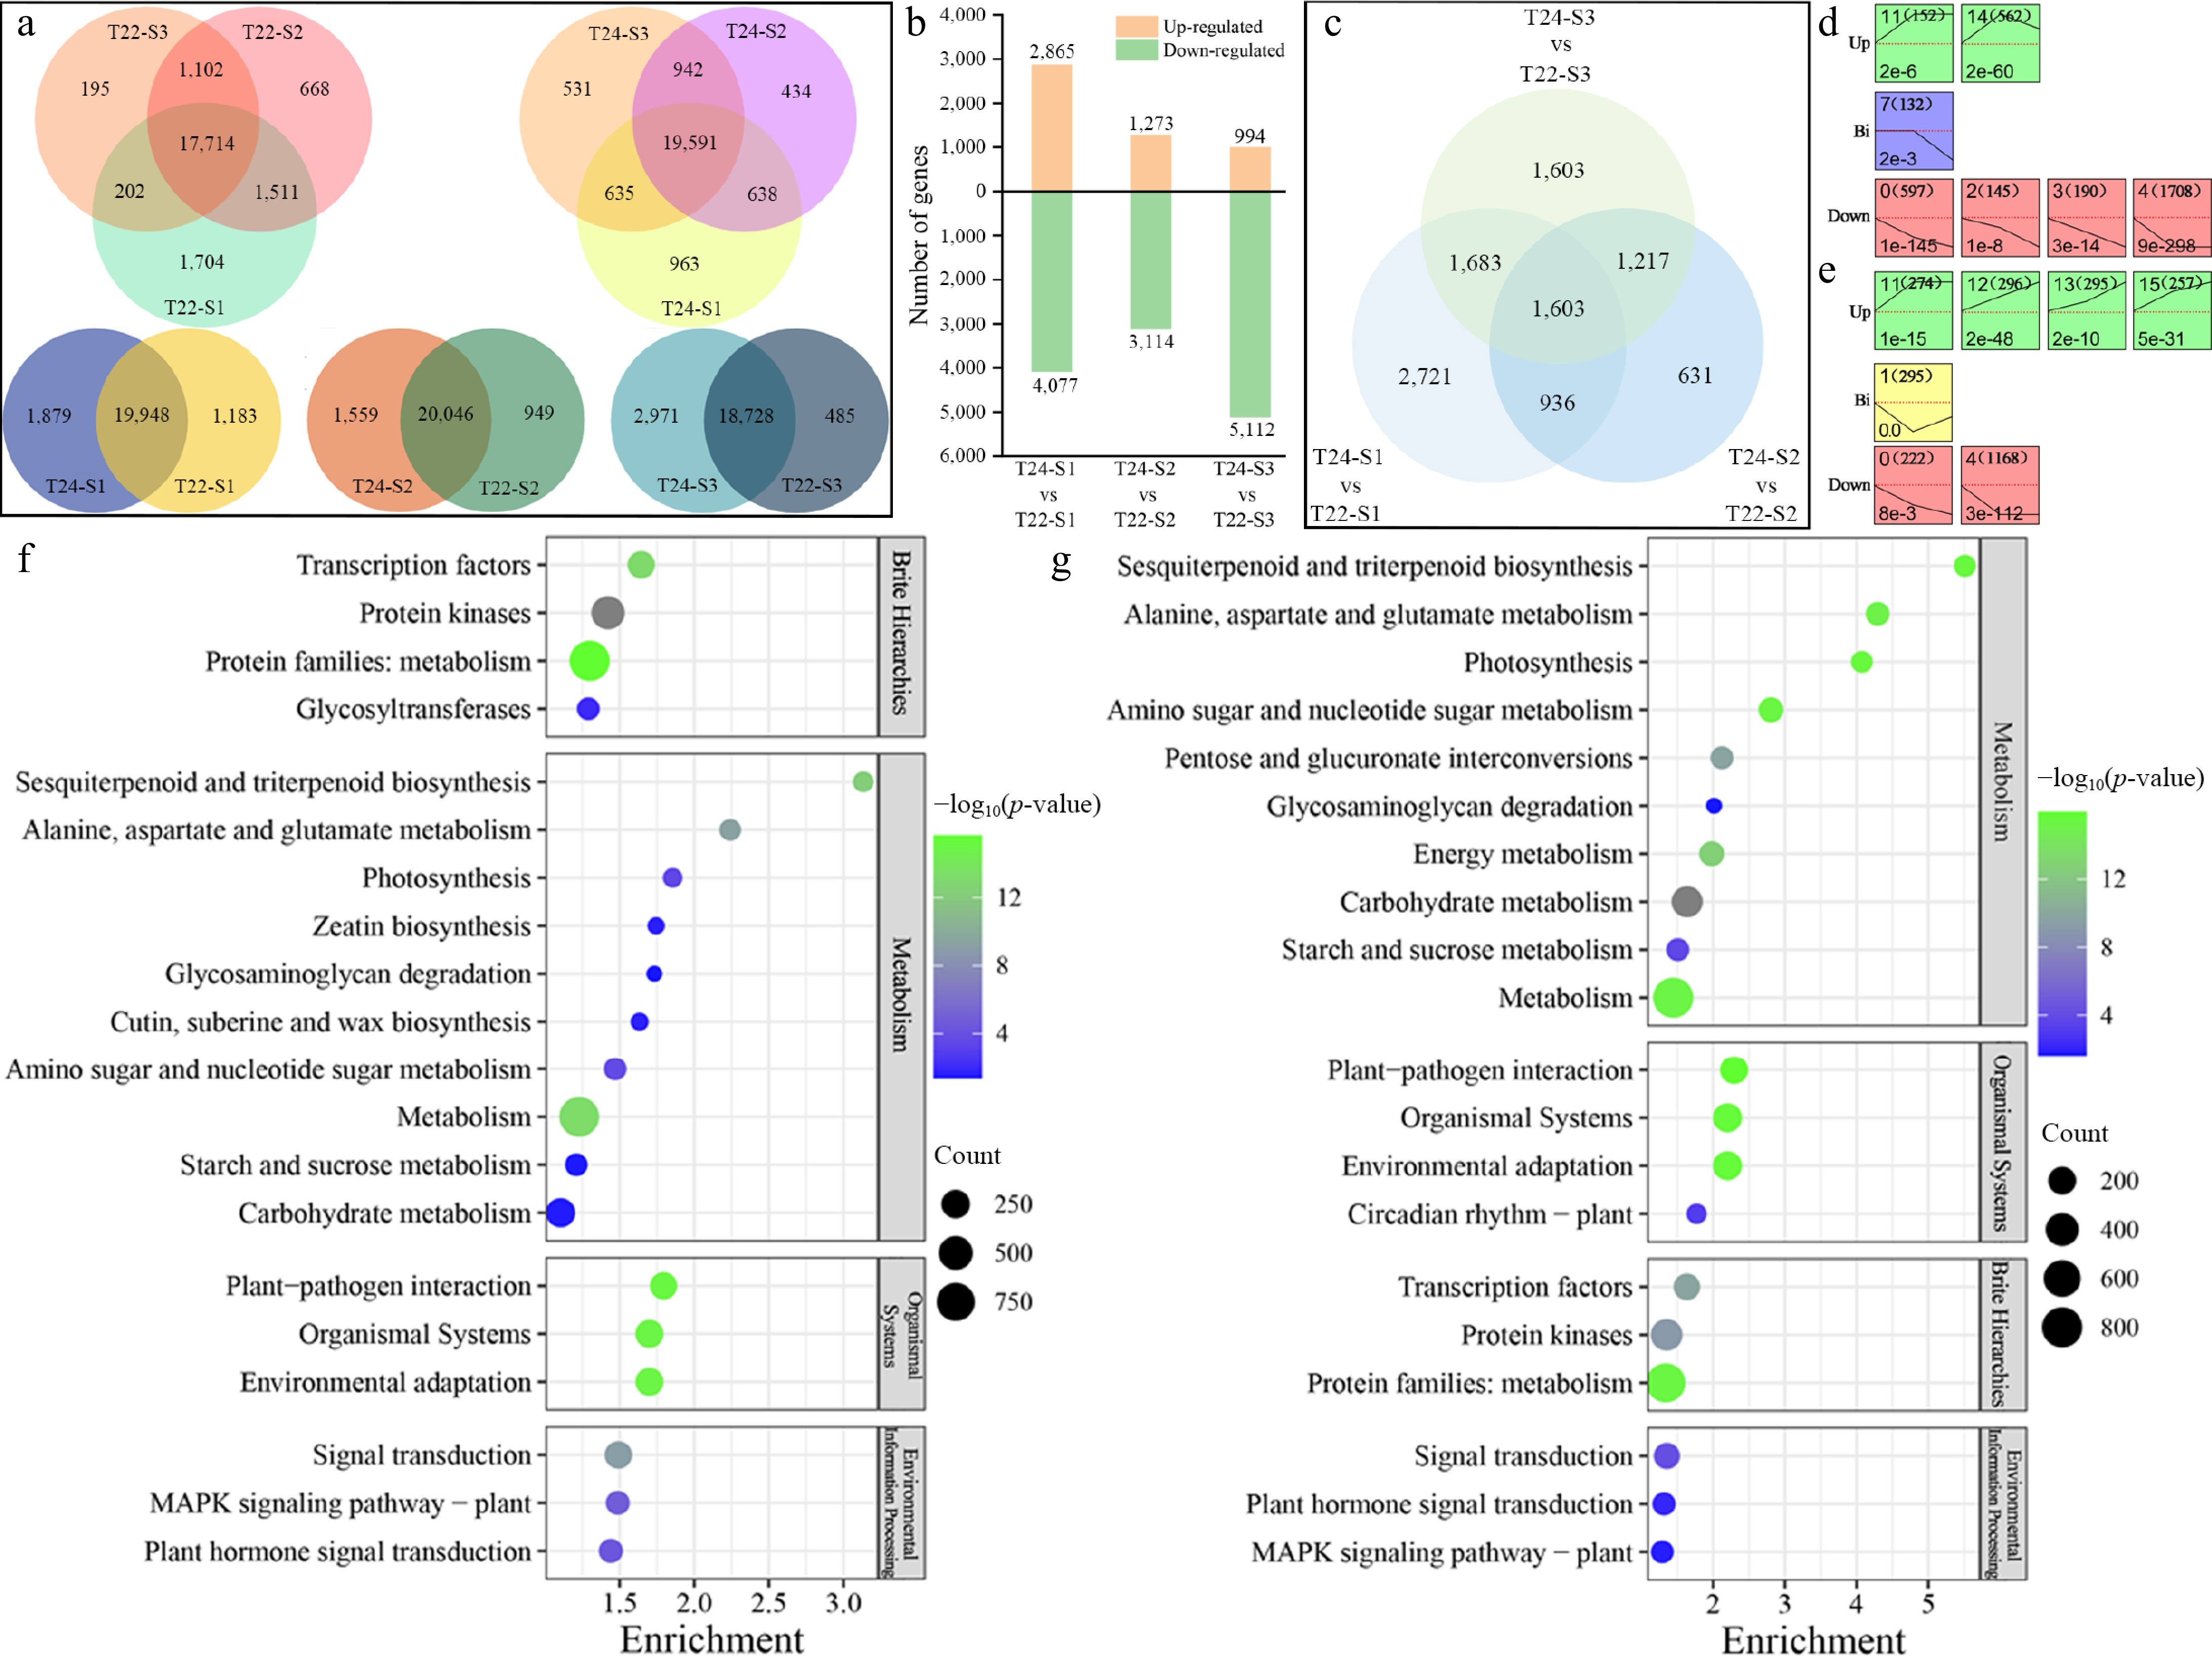
Figure 5.
Detection and analysis of DEGs during taro cormel expansion. (a) Venn diagram showing the numbers of unique and overlapping expressed genes at different stages and in the same stage with T22 and T24. (b) Histogram showing the number of DEGs that were up-regulated and down-regulated in pairwise comparisons. (c) Venn diagram showing the DEGs at different pairwise comparisons. Significantly enriched profiles (p-value < 0.05) during taro cormel expansion as revealed by Short Time-Series Expression Miner analysis. Profiles in (d) T22, and (e) T24. The profiles were classified into three groups, Up (Up-regulated), Bi (Biphasic expression pattern), and Down (Down-regulated). Their profile number following with the number of DEGs in the bracket are shown in the top left-hand corner. The p-value assigned to each profile is shown in the bottom left-hand corner. Significantly different profiles are represented by different background colors. KEGG pathway enrichment analysis of the DEGs profiles in (f) T22, and (g) T24.
DEGs involved in the taro cormel expansion process
-
DEGs from every two different stages of taro cormel development and a comparison of T22 and T24 at the same stage during taro cormel expansion were identified (Fig. 5a). In stage S1, 2,865 up-regulated and 4,077 down-regulated DEGs were obtained at T22 vs T24 (T24 was considered the control sample). 1,273 up-regulated and 3,114 down-regulated DEGs were identified in T22 vs T24 at stage S2, and 994 up-regulated and 5,112 down-regulated DEGs were identified in T22 vs T24 at stage S3 (Fig. 5b, Supplementary Table S4). It can be found that fewer DEGs were detected in the latter stage, indicating that more differences existed in the early stage. Additionally, the above results showed substantial differences in the gene expression profiles among taro cormel growth stages. Hierarchical Clustering Analysis (HCA) using all DEGs revealed three discrete clusters corresponding to the three time points, suggesting a tight linkage of DEGs with taro cormel growth responses at T22 and T24 (Supplementary Fig. S1). The Venn diagram showed that 1,603 genes were differentially expressed in the three comparative groups (Fig. 5c; Supplementary Table S4). A total of 936, 1,217, and 1,683 genes were differentially expressed in S1 ∩ S2, S2 ∩ S3, and S1 ∩ S3, respectively. Because taro cormel expansion is a continuous growth process, DEGs in at least two stages could be considered the primary genes for regulating taro cormel expansion. Therefore, 5,439 DEGs (1,603, 936, 1,217, and 1,683 genes) were used for further analysis.
Seventeen candidate DEGs were selected to validate the results of the transcriptome profiling datasets by qRT-PCR analysis and to correlate the qRT-PCR results with standard data from RNA-Seq analysis. We observed a clear positive correlation between qRT-PCR and RNA-Seq data for the two taro cultivars (Supplementary Fig. S2). This indicated that the qRT-PCR results were consistent with the RNA-Seq results.
GO term analysis of DEGs
-
A total of 5,439 DEGs from T22 and T24 were clustered into 15 profiles using a Short Time-Series Expression Miner (STEM). Specifically, 3,486 DEGs in T22 were significantly clustered into seven profiles (p-value < 0.05), including two types of upregulated patterns (profiles 11 and 14), four types of downregulated patterns (profile 0, profile 2, profile 3, and profile 4), and one biphasic expression pattern (profile 1) (Fig. 5d; Supplementary Table S5a). In contrast, 2,807 DEGs at T24 were clustered into seven profiles, including four upregulated patterns (profiles 11, 12, 13, and 15), two downregulated patterns (profile 0 and profile 4), and one biphasic expression pattern (profile 1) (Fig. 5e; Supplementary Table S5b). The upregulated and downregulated DEGs in the profiles established for T22 and T24 were subjected to GO term analysis and allocated into three core categories: molecular function, cellular component, and biological process (Supplementary Fig. S3). Within the molecular function category, a significant number of up-regulated and down-regulated DEGs were classified into metal ion binding, cation binding, DNA binding, and transition regulator activities. Within the cellular component category, most of the DEGs were classified into membrane, cell periphery, obsolete intrinsic components of the membrane, and extracellular regions. Within the biological process category, response to stress, response to stimuli, cell wall organization or biogenesis, and polysaccharide metabolic processes were the subcategories that contained the most DEGs.
KEGG pathway enrichment analysis of DEGs
-
To identify important metabolic pathways involved in the DEGs, the DEG profiles that were significantly clustered by STEM in T22 and T24 were assigned to significantly enriched KEGG pathways. Moreover, 77.51% (2,702/3,486) of the DEGs in T22 were significantly annotated to 59 different metabolic pathways (p-value < 0.05). In contrast, 75.38% (2,116/2,807) of the DEGs at T24 were significantly assigned to 49 different metabolic pathways (p-value < 0.05). The 20 most significantly enriched and focused KEGG pathways in T22 and T24 are shown in Fig. 5f and g. Based on KEGG enrichment analysis, cutin, suberin, and wax biosynthesis (ko00073) and zeatin biosynthesis (ko00908) were significantly enriched only in T22 (Fig. 5f; Supplementary Table S6), but flavonoid biosynthesis (ko00941) and circadian rhythm plant (ko04712) were significantly enriched only in T24 during taro cormel expansion (Fig. 5g; Supplementary Table S6). Notably, more DEGs in T22 during taro cormel expansion than in T24 were significantly enriched in transcription factors, MAPK signaling pathway-plant, and plant hormone signal transduction, whereas the DEGs in T24 were more significantly involved in KEGG pathways associated with carbohydrate metabolism (p-value = 0 in T24, p-value = 3.49E-2 in T22), Starch and sucrose metabolism (p-value = 1.8E-4 in T24, p-value = 4.12E-2 in T22) and glycosaminoglycan degradation (p-value = 2.39E-2 in T24, p-value = 4.68E-2 in T22).
Analysis of DEGs involved in plant hormone signal transduction pathway
-
KEGG pathway enrichment analysis and phytohormone detection during taro cormel expansion. These DEGs were identified and their correlation with phytohormone levels was further evaluated. First, GA3 was confirmed to play an important role in the longitudinal cormel expansion of taro. During taro cormel expansion, the content of GA3 was firstly decreased and then increased in T22, whereas it persistently increased and peaked at the S3 stage of T24. We found that DEGs were involved in GA synthesis and signal transduction during taro cormel expansion (Fig. 6a; Supplementary Table S7). Four DEGs encoding gibberellin 2-beta-dioxygenase (GA2ox) and four gibberellin regulated protein (GRP) were involved in GA biosynthesis during taro expansion (Fig. 6a). Further analysis indicated GA2ox (EVM0019043) and GRP (EVM0003383 and EVM0020982) were abundant during taro cormel expansion at T22 and T24. The expression trade of EVM0019043 continually decreased in both T22 and T24; however, lower expression levels were detected at the S2 and S3 stages in T24. The expression patterns of GASA (EVM0003383 and EVM0020982) were similar at T22 and T24 during taro cormel expansion; however, an abundant expression level was detected at T24. The trend of these DEGs was contrasted with the GA3 level at T24, which suggested that GASA might be a negative regulator of the longitudinal growth of cormel at T24 (Fig. 3h, Fig. 6a). In this study, the IAA content showed a downward trend at T22 and T24 (Fig. 3e). The expression levels of IAAs and ARFs, auxin-responsive proteins, and auxin-responsive factors were significantly downregulated during taro cormel expansion (Fig. 6a). The cytokinin dehydrogenase (CKX: EVM0008632 and EVM0016657) was enriched only in T22, with peak expression at the S1 stage (Fig. 6a). The levels of BR and genes related to brassinosteroid signal transduction, such as BRL (EVM0022018), showed a similar trend (Fig. 3e, Fig. 6a). However, the expression of BES (EVM0019061 and EVM0008045), which belongs to the BR-resistant transcription factor family, peaked at the S1 stage during taro cormel expansion (Fig. 6a). For MeJA, six DEGs (Tify) related to the regulation of the JA signaling pathway were enriched in T22, but only one Tify (EVM0015896) was enriched in T24 during taro cormel expansion (Fig. 6a).
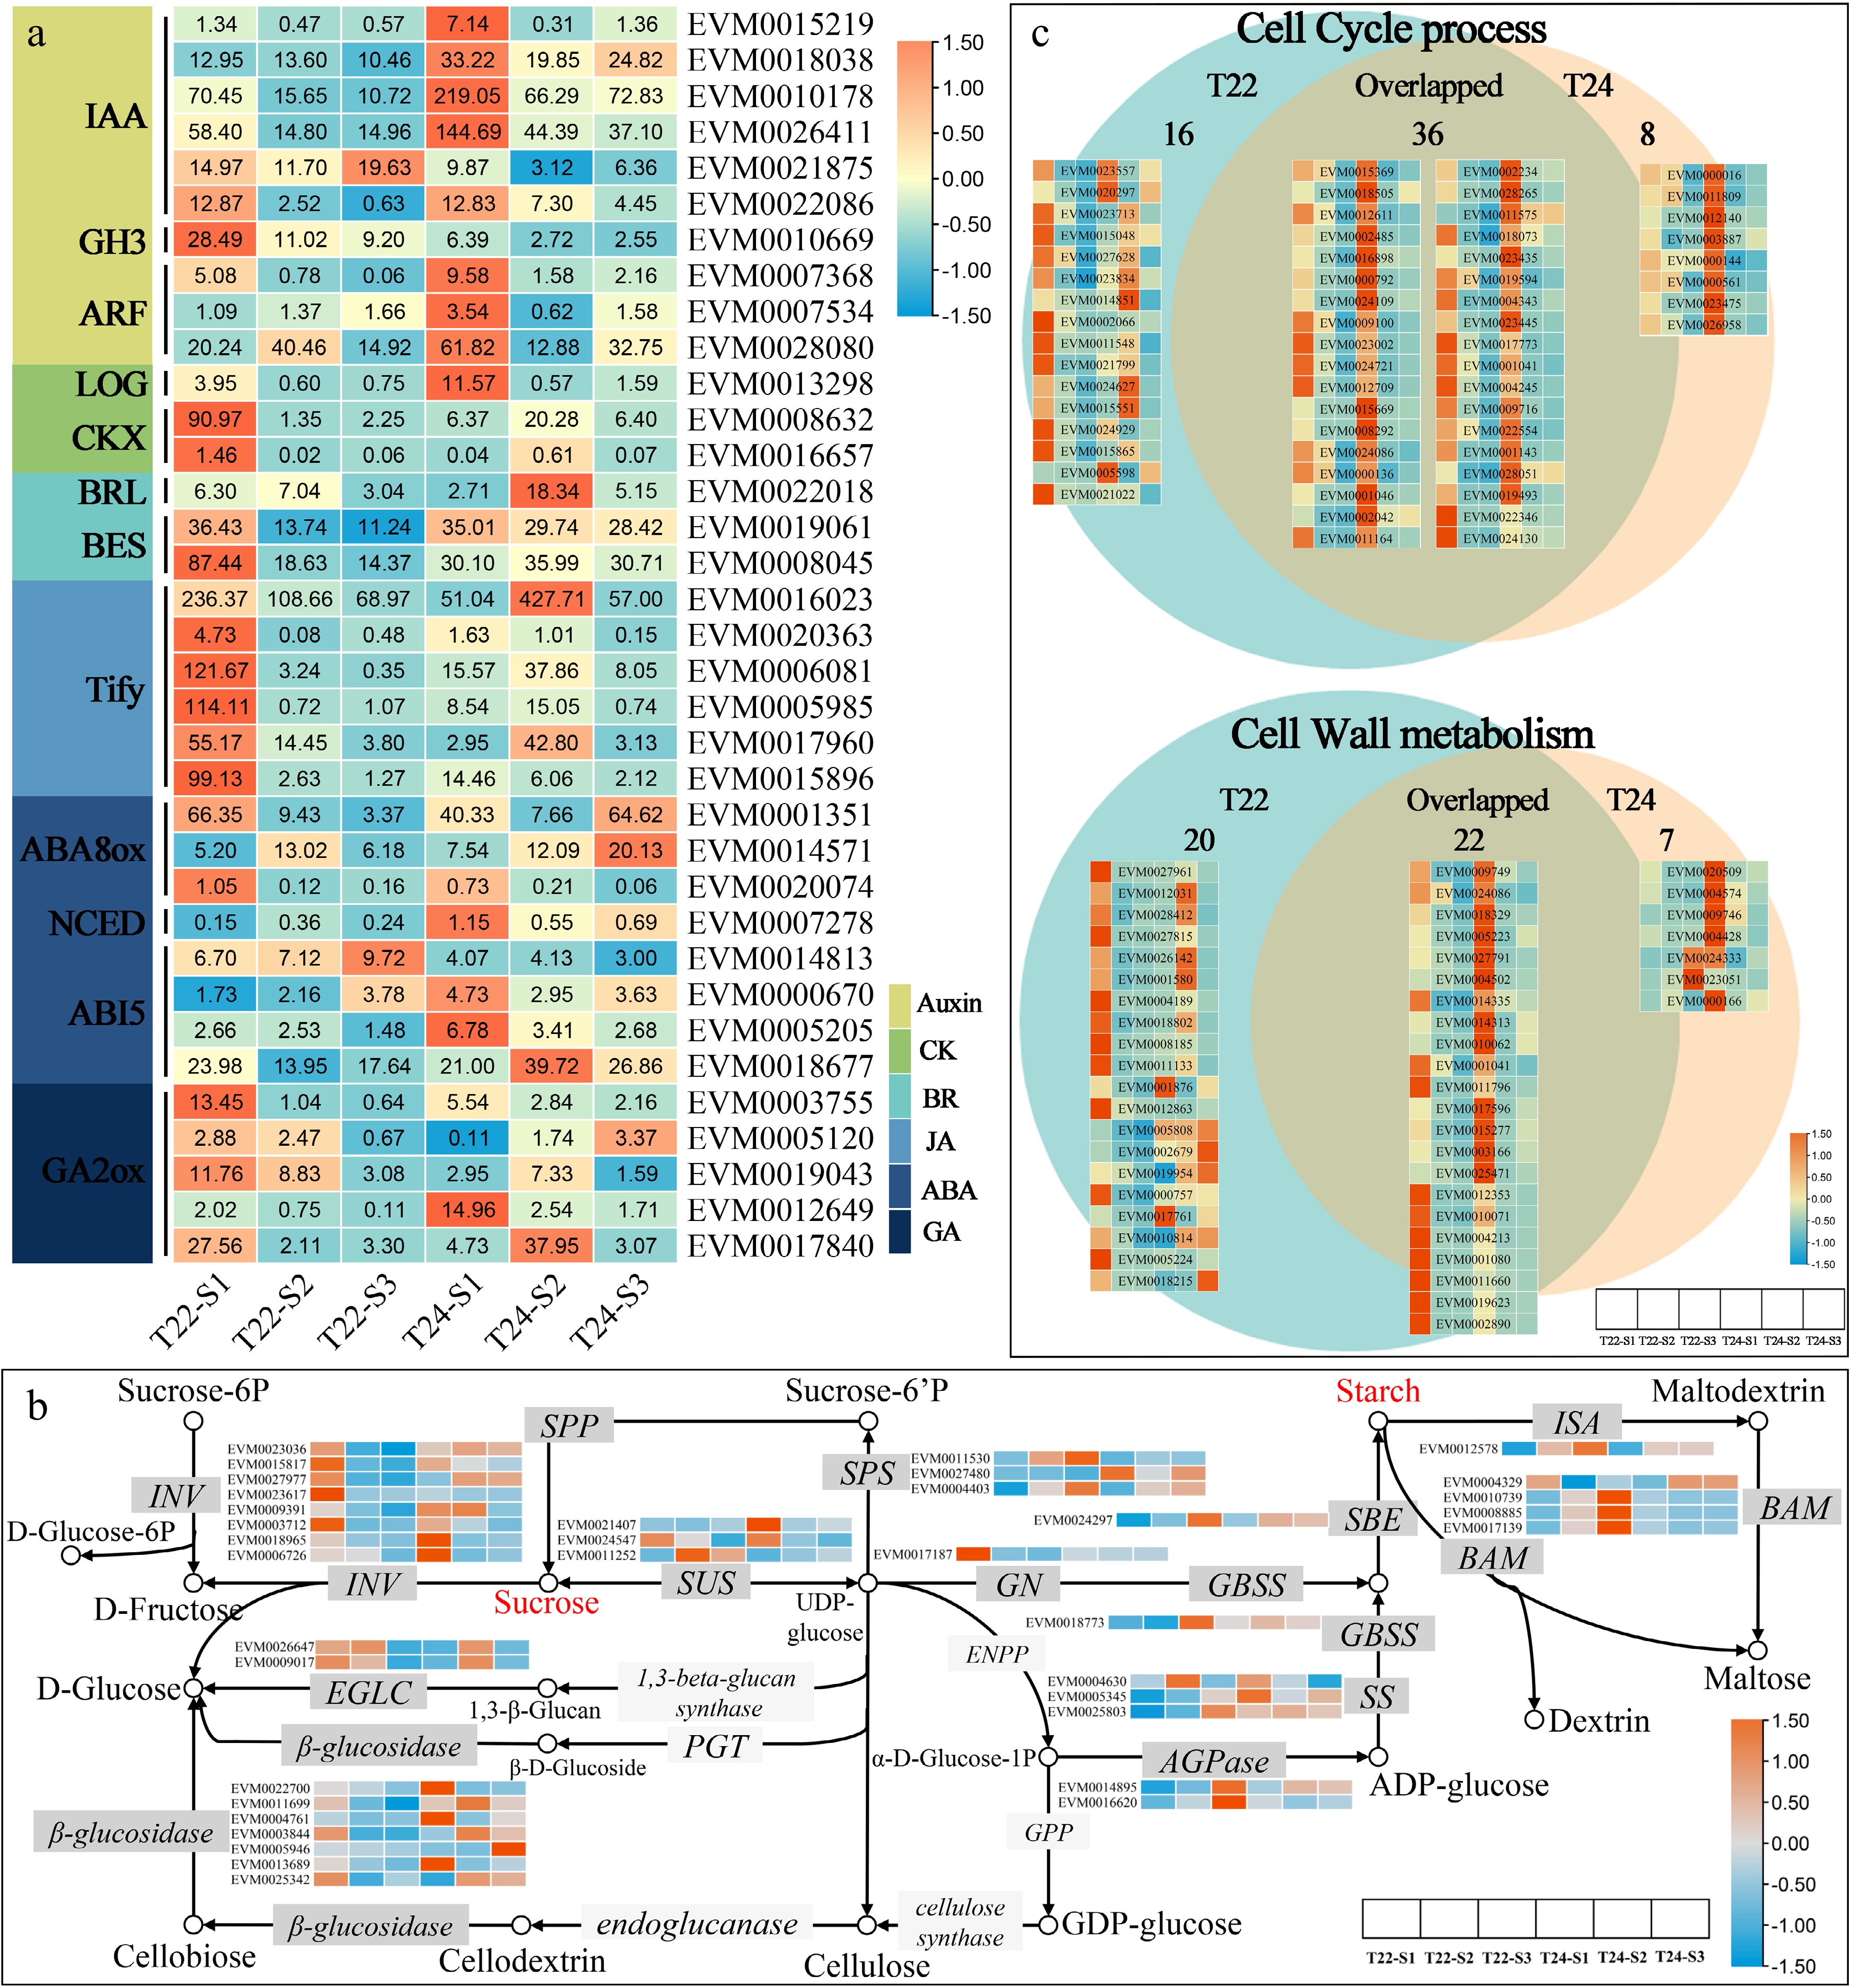
Figure 6.
Expression patterns of DEGs assigned to plant hormone transduction pathway, sucrose and starch metabolism and cell process. (a) Heat maps of gene sets associated with hormone (Auxin, CK, BR, JA, ABA, and GA). The expression levels are log-transformed and colored in orange and blue for high and low expression, respectively. (b) The expression patterns of DEGs assigned to starch and sucrose metabolism in T22 and T24 during taro cormel expansion. The expression values were log-transformed and ranged from −1.5 to 1.5 after normalization. The box with dark grey and light grey colors indicated enzymes with and without transcriptional differentially expressed, respectively. (c) Venn diagram showing the numbers of unique and overlapping DEGs involved in cell cycle and cell wall metabolism between T22 and T24 with the gene expression heatmap. The expression levels are standardized by row scaled and colored in orange and cyan for high and low expression.
Analysis of DEGs involved in starch and sucrose metabolism
-
Several DEGs involved in starch and sucrose metabolism were detected in T22 and T24[31] (Fig. 5f & g), including genes encoding eight β-fructofuranosidase (INV), two glucan endo-1,3-beta-glucosidase 4 (EGLC), seven β-glucosidase (BGLU), three sucrose phosphate synthase (SPS), two ADP-glucose pyrophosphorylase (AGPase), and four β-amylase (BAM), which underwent major modifications during taro cormel expansion (Fig. 6b; Supplementary Table S8). Among these, two AGPase (EVM0014895 and EVM0016620) and SPS (EVM0004403) were upregulated in T22 during taro cormel expansion, with a peak expression level at the S3 stage, which was significantly higher than that at T24 (Fig. 6b). In particular, a gene encoding INV (EVM0027977) was upregulated in T24 but downregulated in T22, with peak expression at the S1 stage during taro cormel expansion. Notably, the starch branch enzyme (SBE: EVM0024297) and isoamylase (ISA: EVM0012578) were upregulated in both T22 and T24, but higher expression levels were detected at the S3 stage of T22. The expression patterns of three soluble starch synthase (SSS: EVM0004630, EVM0005345, and EVM0021407) were opposite and were upregulated in T22 but downregulated in T24 (Fig. 6b).
Analysis of DEGs in volved in cell cycle and cell wall metabolism
-
We found that the transverse growth of parenchyma cells and the rapid growth of vascular bundles could result in the expansion of taro cormel, which is associated with the cell cycle and cell wall morphogenesis (Fig. 2g). In the present study, 52 and 44 DEGs involved in the cell cycle were observed at T22 and T24, respectively, during taro cormel expansion. Several genes encoding cell cycle proteins (CYCs), cyclin-dependent protein kinase inhibitor (CDKI), mitogen-activated protein kinase kinase (MAP2K), mitogen-activated protein kinase kinase kinase (MAP3K), and endo-1,3(4)-beta-glucanase (GLU) were specifically downregulated in the cormel of T22 (Fig. 6c; Supplementary Table S9). Among these, the expression levels of genes encoding CDKI (EVM0023713), CYC (EVM0027628), MAP2K (EVM0024627), and MAP3K (EVM0021799) peaked at the S1 stage of T22 compared to T24.
The number of genes encoding key enzymes involved in cell wall metabolism was much higher in T22 (42) than in T24 (30). In particular, three genes encoding expansin were detected in DEGs T24 with peaked expression levels in T24. The expression pattern of expansin (EVM0023051) was downregulated in T24 but upregulated in T22, with peak expression levels at the S3 stage of T22. The number of xyloglucan endotransglucosylase/hydrolase (XTH, 15) was the highest in this pathway, and most were downregulated during taro cormel expansion in T22 and T24. Among these, XTH (EVM0010814) was downregulated at T22 but upregulated at T24 during taro cormel expansion (Fig. 6c; Supplementary Table S10).
Analysis of TFs involved in taro cormel expansion
-
By regulating the expression of target genes at a specific time and space with a specific intensity, TFs are a group of protein molecules that bind to specific sequences upstream of the target genes. To identify the TFs that play significant roles in taro cormel expansion, DEG profiles from T22 and T24 (DEGs significantly clustered by STEM) were blasted and annotated using the Plant Transcription Factor Database (PlantTFDB). A total of 262 TFs were identified in T22 and 164 in T24. In total, 301 non-overlapping putative TFs were further classified into 36 families (Table 2; Supplementary Table S11). The number of TFs in T22 was higher than that in T24, suggesting that it was necessary for the expansion of taro cormel in T22 to express more TF. Among these differentially expressed TFs, TUB, mTERF and MADS type TF families were only detected in T22, whereas the BBR/BPC type TF family was only detected in T24. In the numerically dominant transcription factor family, the number of DEGs of WRKY, NAC, MYB and Tify type TF families in T22 was far greater than that in T24 (Table 2). To clarify the key TFs involved in taro cormel expansion, regulatory network analysis was used to predict the interactions between candidate genes and TFs. A total of 69, 55, 68, 62, 50, 62, 52, 45, 48, 77, 52, and 53 TFs were predicted from candidate genes, including GA2ox (EVM0019043), GASA (EVM0003383), AGPase (EVM0014895), AGPase (EVM0016620), SSS (EVM0005345), SSS (EVM0021407), SBE (EVM0024297), ISA (EVM0012578), CYC (EVM0027628), CDKI (EVM0023713), XTH (EVM0010814), and expansin (EVM0023051), respectively (Supplementary Fig. S4). Key TFs were identified by correlation analysis of the expression levels of TFs and candidate genes. The results showed key upstream regulatory TFs in the regulatory networks, including AP2-EREBP (2), ARF (2), bHLH (1), E2F-DP (1), HSF (2), MYB (2), NAC (2), and WRKY (4) (Supplementary Fig. S4, Supplementary Table S11). Among these, ARF (EVM0022082), HSF (EVM0008605), MYB (EVM0011663), NAC (EVM0017068), and WRKY (EVM0003609) regulate at least two key candidate genes that might play an important role in taro cormel expansion.
Table 2. List of some of the important differentially expressed TFs in T22 and T24.
TF name T22 Overlap T24 Total AP2-EREBP 25 17 0 42 MYB 24 15 6 45 WRKY 15 8 0 23 NAC 10 5 5 20 bHLH 9 14 4 27 Tify 7 2 0 9 G2-like 6 6 2 14 HSF 6 2 1 9 C2H2 5 2 1 8 GRAS 5 2 0 7 OFP 4 3 4 11 C2C2-Dof 3 6 1 10 Trihelix 3 4 0 7 ABI3VP1 2 3 2 7 MADS 2 0 0 2 ARF 1 4 2 7 BES1 1 0 2 3 LOB 1 4 1 6 TCP 1 4 1 6 bZIP 1 1 1 3 C2C2-CO-like 1 0 1 2 zf-HD 1 2 0 3 PLATZ 1 1 0 2 FAR1 1 0 0 1 mTERF 1 0 0 1 TUB 1 0 0 1 BBR/BPC 0 0 2 2 C2C2-GATA 0 5 1 6 GRF 0 2 1 3 C3H 0 1 1 2 SBP 0 5 0 5 C2C2-YABBY 0 2 0 2 E2F-DP 0 2 0 2 ARR-B 0 1 0 1 HB 0 1 0 1 RWP-RK 0 1 0 1 Transient overexpressing CeAGPase promoted starch accumulation in the leaves of tobacco
-
Previous studies suggested that CeAGPase (EVM00014895) plays a crucial role in starch biosynthesis during taro cormel expansion. ADP-glucose pyrophosphorylase (AGPase) is a key enzyme that catalyzes the rate-limiting step in starch synthesis in bacteria and plants. To further explore the functional role of CeAGPase, it was transiently overexpressed CeAGPase in tobacco leaves using a recombinant plasmid vector (Fig. 7a). We then obtained three independent tobacco transient overexpression (OE) lines and compared them with the negative control (NC) and empty control (EC) lines. Under 488 nm fluorescent excitation, green fluorescence was observed in the leaves of EC and OE (Fig. 7b). qRT-PCR analysis confirmed that the mRNA level of CeAGPase was significantly higher by 10.76, 11.73, and 13.74 times in the leaves of the three OE lines compared to that in the NC line (Fig. 7c). These results confirmed successful expression of the pCAMBIA1300-CeAGPase-eGFP vector in tobacco leaves. To further elucidate the molecular pathway of CeAGPase in starch biosynthesis, the AGPase activity and starch content were determined. Compared to the EC line, in the OE lines, AGPase activity was significantly increased by 116%, 124%, and 104% (Fig. 7d), and starch content was significantly increased by 64%, 91%, and 85% (in OE-1, OE-2, and OE-3, respectively) (Fig. 7e). The results showed that overexpressing CeAGPase promoted starch accumulation by activating AGPase activity. This suggests CeAGPase functions as a positive regulator of starch accumulation in taro cormels. However, the mechanism interacting with CeAGPase in taro to regulate cormel expansion requires further investigation.
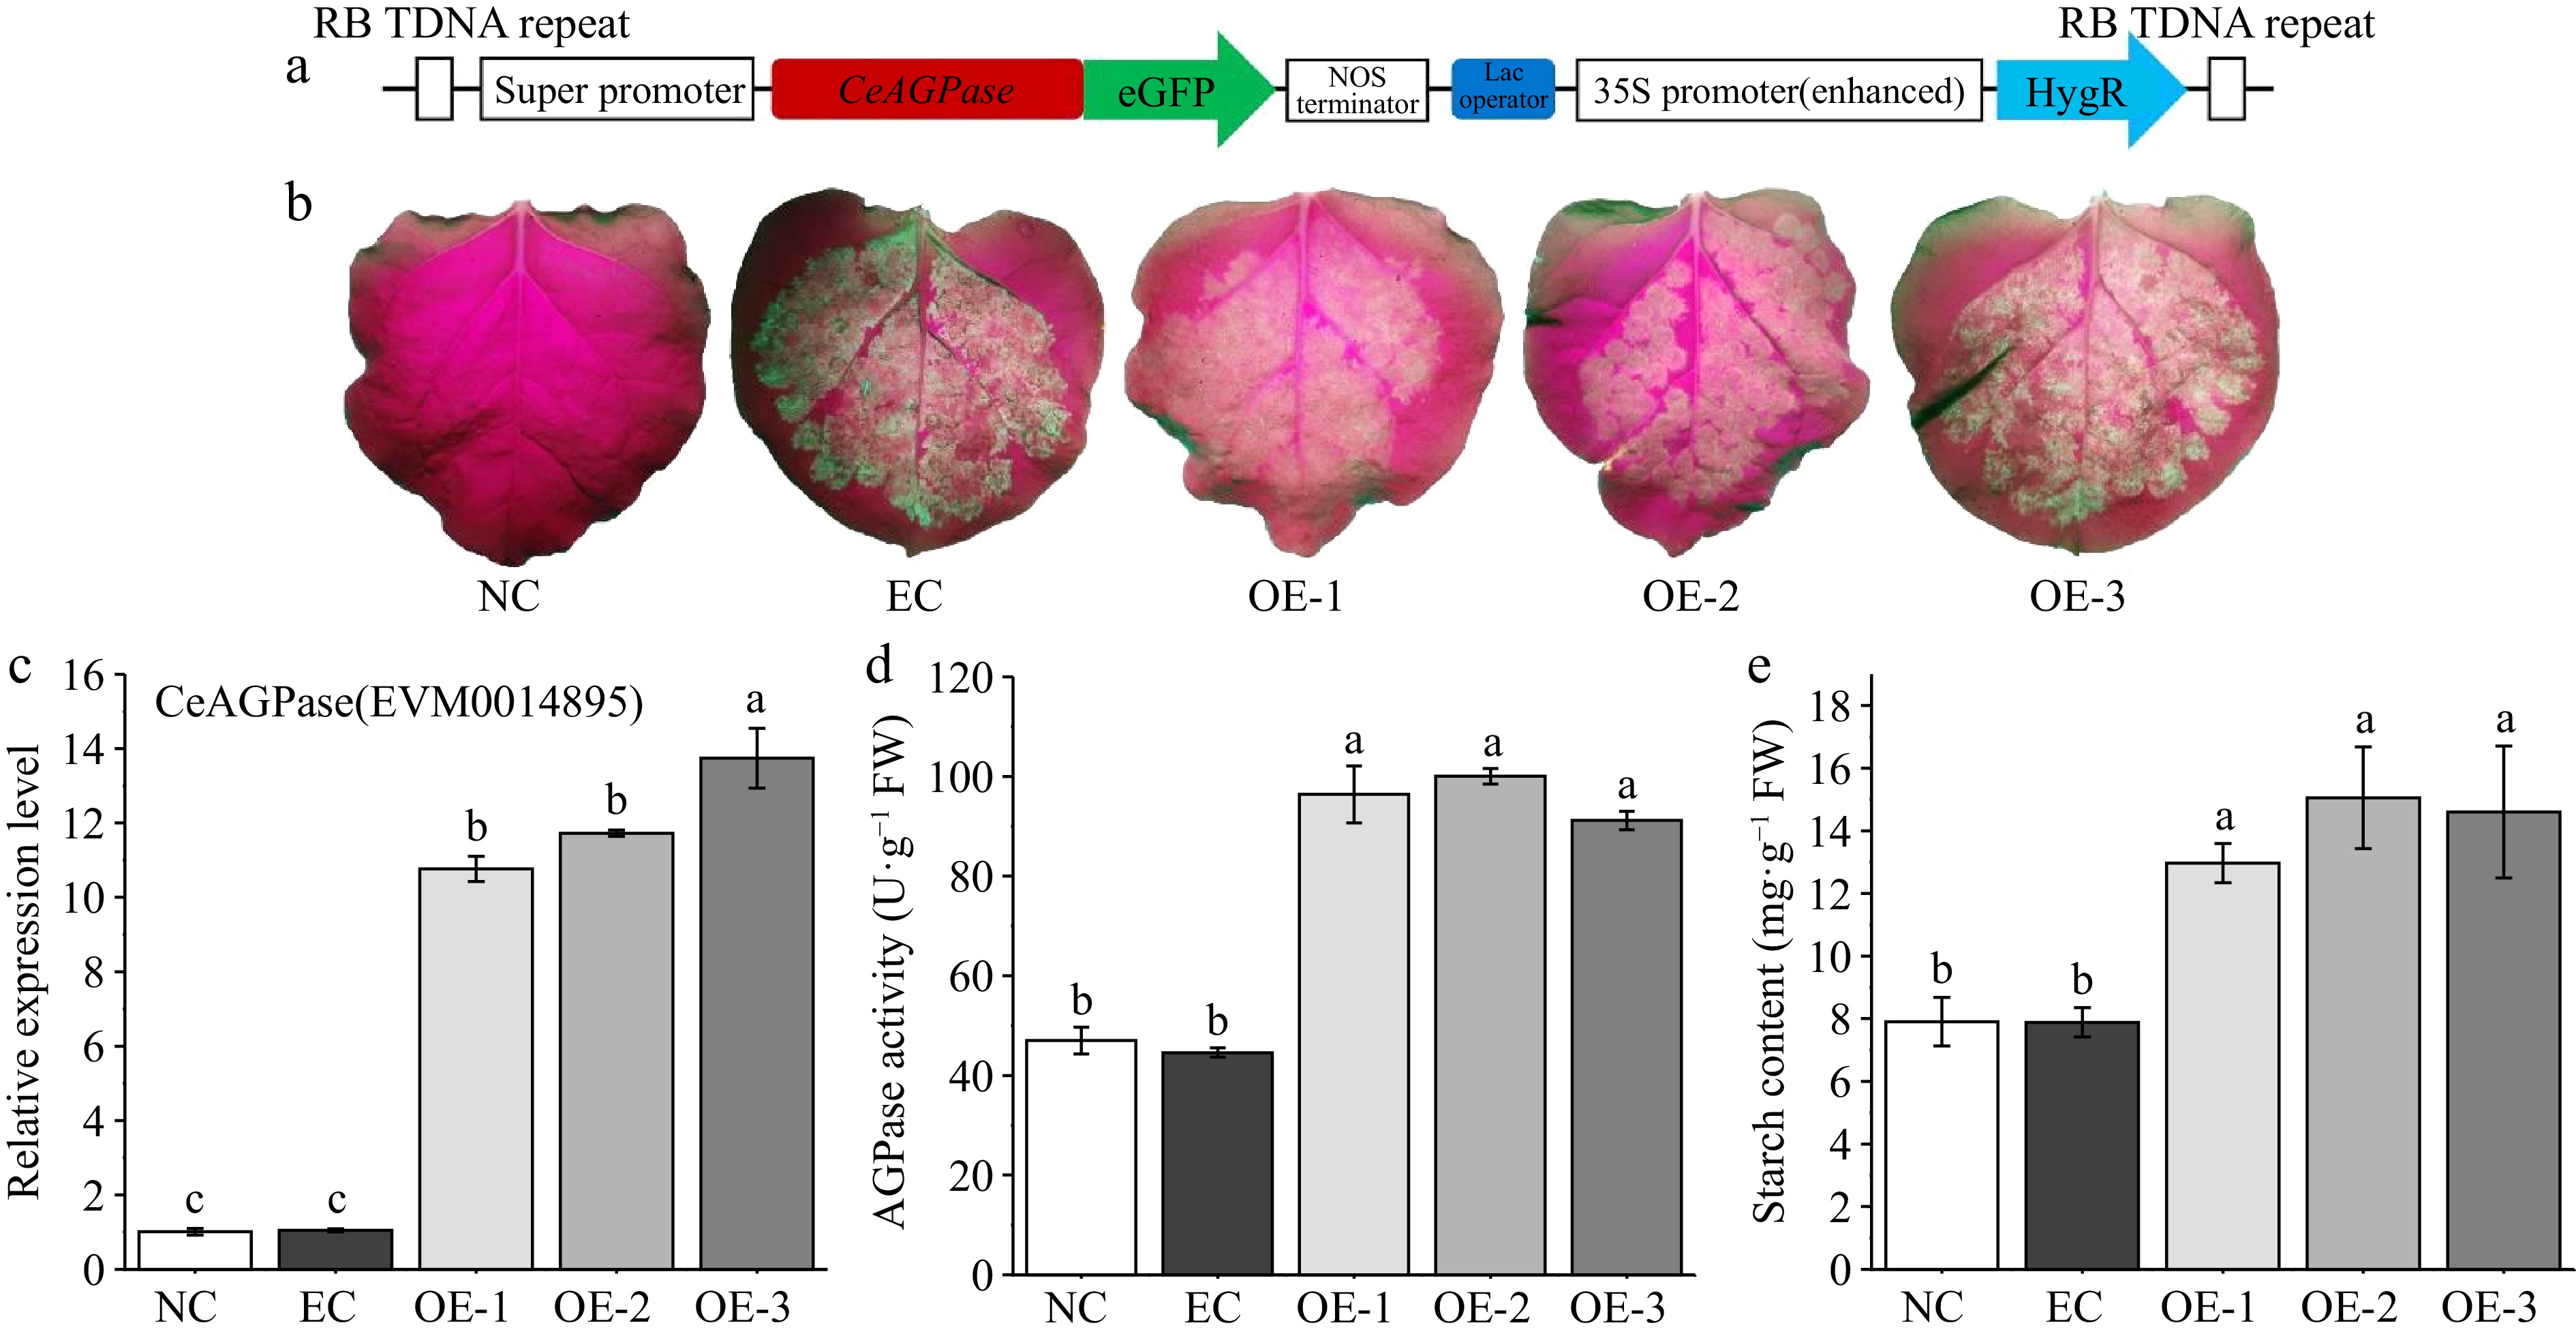
Figure 7.
Transient overexpression analysis of CeAGPase in tobacco leaves. (a) Schematic representation of the overexpression vector. (b) Enhanced Green Fluorescent observation of tobacco leaves after 3 d of resting cultivation. (c) The relative expression levels of CeAGPase in the tobacco leaves from negative control (NC) line, empty vector control (EC) line and overexpressing (OE) line. (d) AGPase activity was assayed in the tobacco leaves from NC line, EC line and OE line. (e) Analysis of the starch content in the tobacco leaves from NC line, EC line and OE line. Data are means (± SE) from at least three replicates. Different letters indicate significant differences between means as determined using ANOVA followed by Duncan's multiple range test (p-value < 0.05).
-
The expansion and development of taro cormel is a highly complicated and genetically programmed process that mainly involves endogenous hormone signaling and starch enrichment[6]. Integrating the spatiotemporal gene expression profiles with different physiological properties is pivotal for clarifying the expansion of plant metamorphic stems. In this study, multi-phenotypic and physiological properties combined with RNA-seq technology were used to identify the DEGs between T22 and its mutant T24 during taro cormel expansion and to reveal the regulatory mechanism of taro cormel expansion. Among them, 5,439 common DEGs were detected to analyze the enrichment of GO and KEGG, some DEGs were identified to be involved in plant hormone signal transduction, starch and sucrose metabolism, cell cycle, and cell wall metabolism might have important functions in taro cormel expansion (Fig. 5c−g). Several key genes regulated in these pathways and their upstream regulatory TFs are shown in Fig. 8. This research is the first to study and demonstrate the molecular regulatory network of taro cormel expansion during cultivation. Current evidence reveals the key growth characteristics and regulated genes involved in taro cormel expansion.
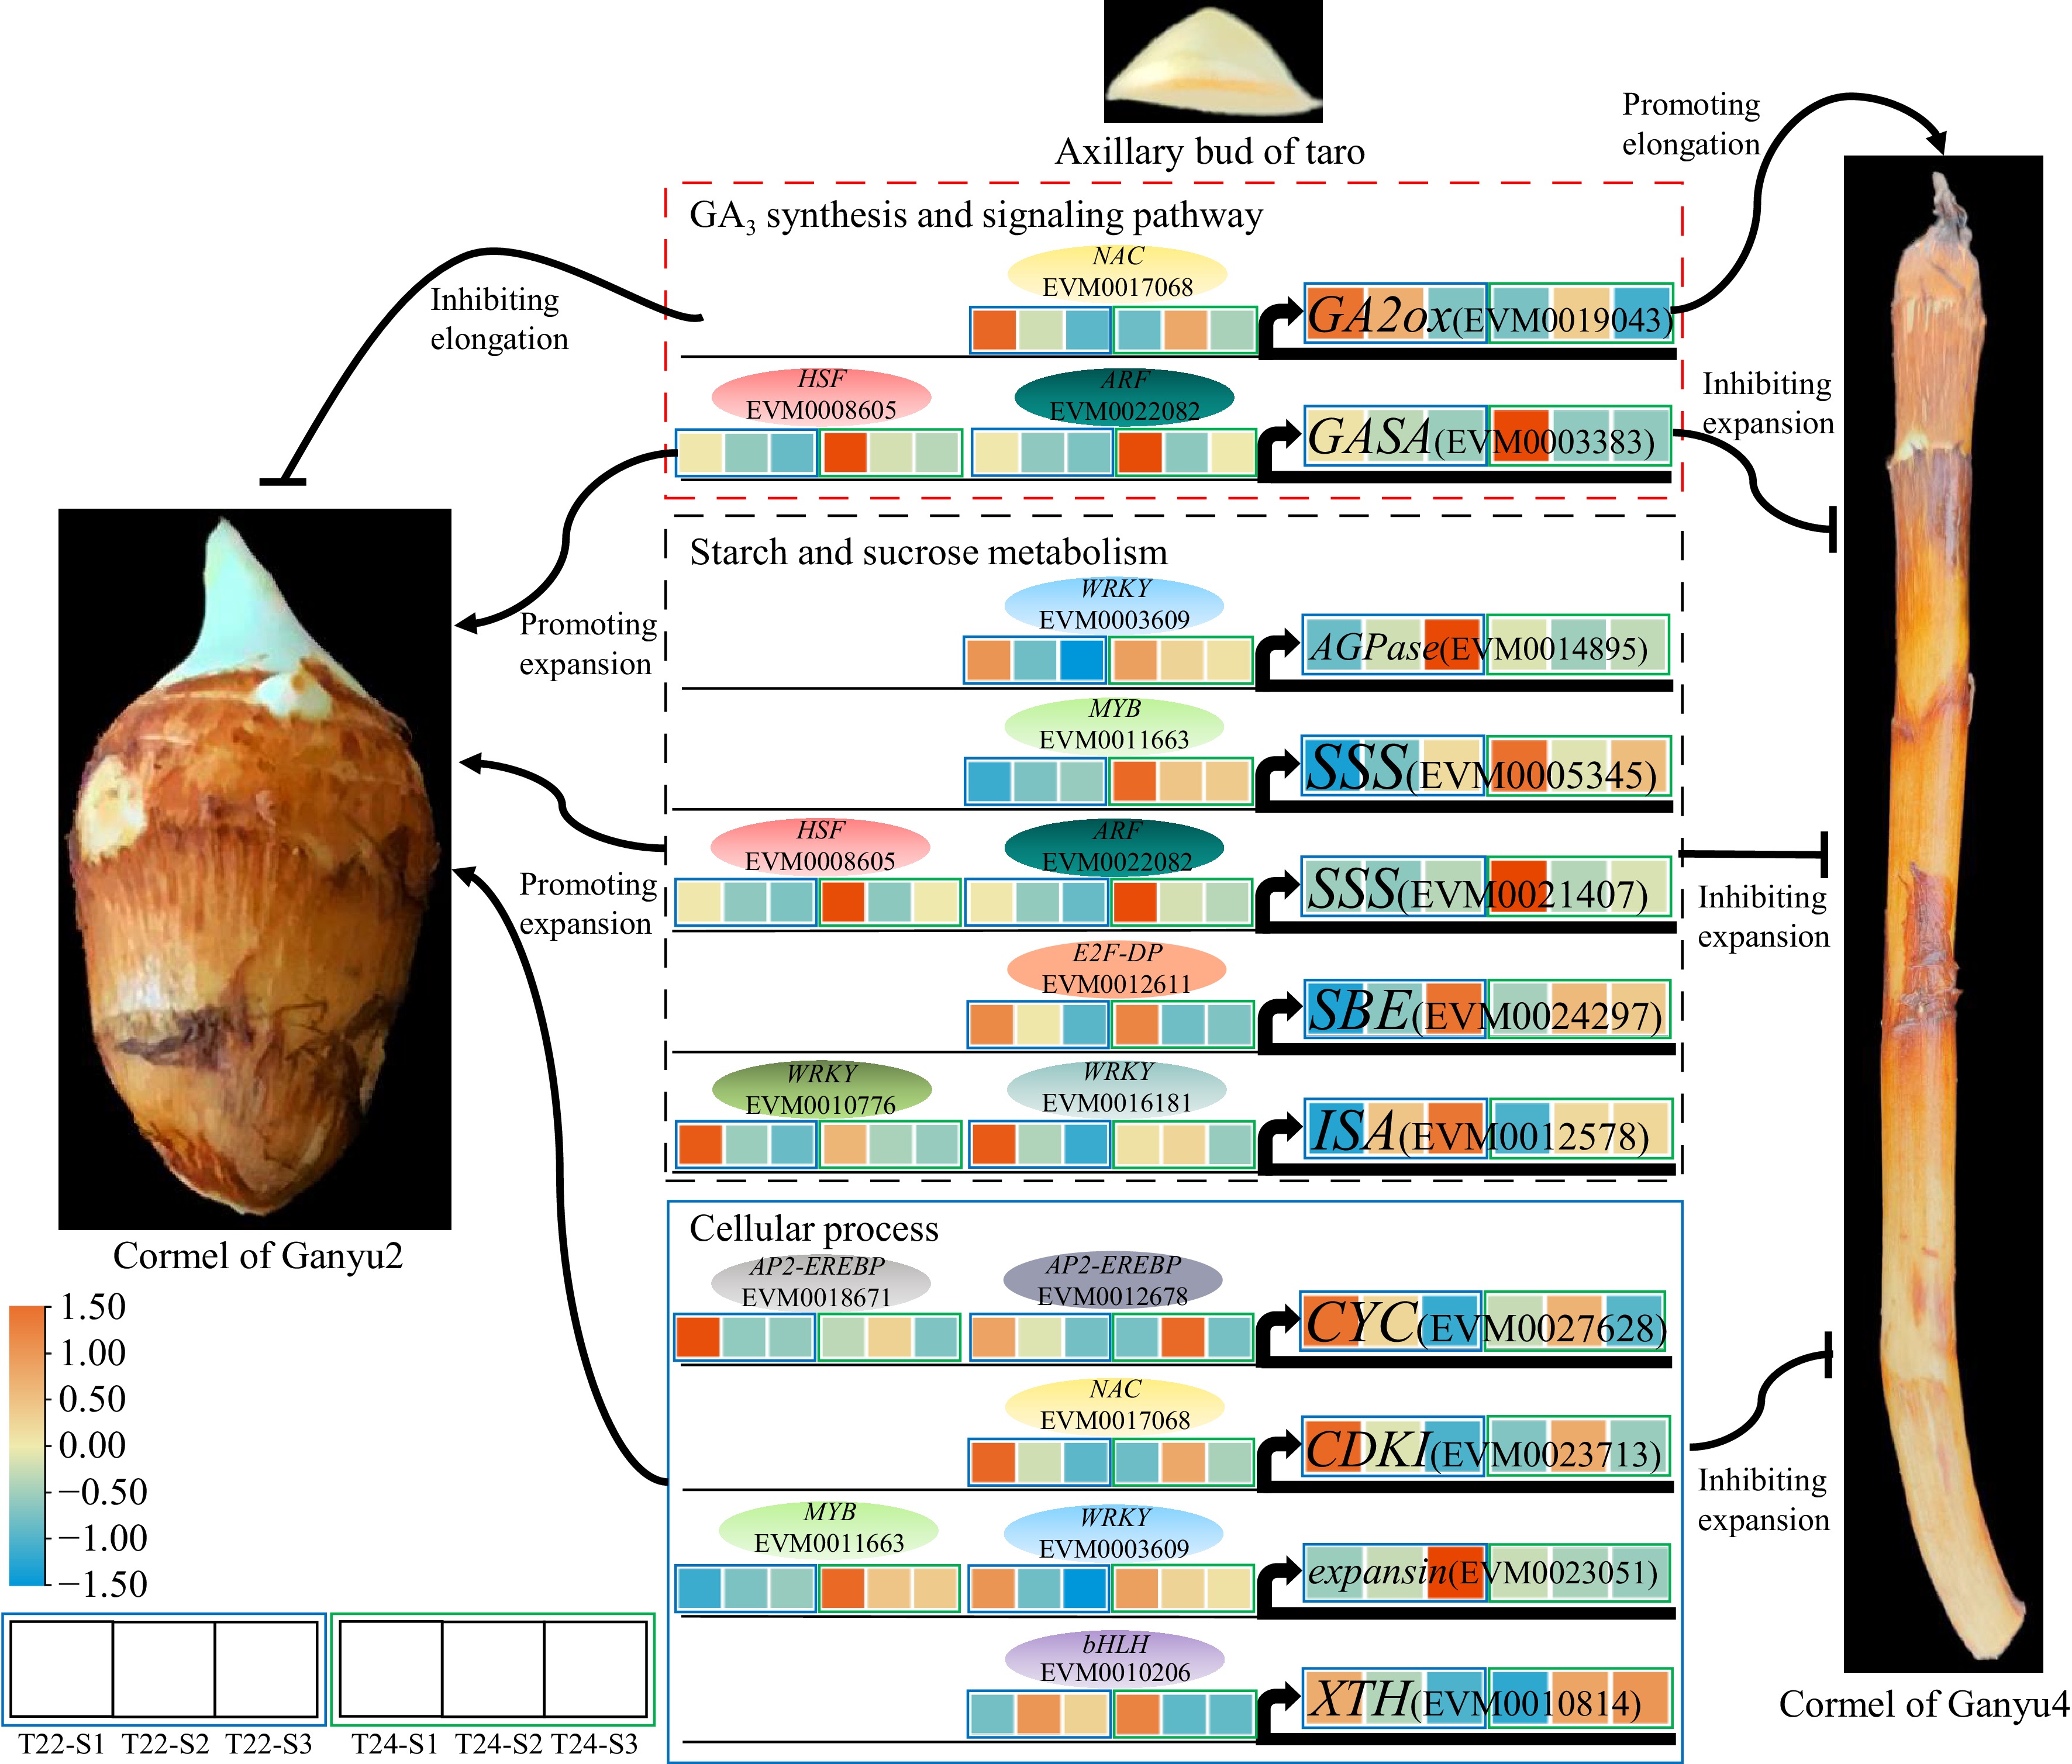
Figure 8.
A proposed model for genes regulation of taro cormel expansion. The heat map showed expression levels of genes which are standardized by row scaled and colored in orange and cyan for high and low expression. The oval modules indicate key candidate TFs.
Hormonal signaling regulation
-
Plant hormones regulate various processes of plant growth and development and environmental adaptation, including auxin, cytokinin, gibberellic acid, abscisic acid, jasmonic acid, brassinosteroid, and ethylene, and have been found to play important roles in tuberization and root development of tuberous and root crops[32]. In this study, based on KEGG pathway enrichment annotation, the plant hormone signaling pathway was one of the most enriched pathways. In total, 705 DEGs were identified in plant hormone signaling pathways during taro cormel expansion (Fig. 6a; Supplementary Table S7). We found that GA3 plays an important role in the longitudinal growth of taro cormels. Further analysis indicated that eight and seven DEGs encoding enzymes related to GA biosynthesis and GA response pathways in T22 and T24, respectively. GA2ox encodes gibberellin 2-oxidases that inactivate bioactive gibberellins via a 2-beta-hydroxylation reaction[33]. In the present study, GA2ox (EVM0019043) was downregulated during cormel expansion in T24, in contrast to the change in GA3 levels in T24. The expression level of GA2ox at the S2 and S3 stages of T22 was higher than that at T24 but was lower at the S1 stage of T22 (Fig. 6a). A previous study revealed that StGA2ox1 is upregulated in the early stages of potato tuber development, similar to the expression level of GA2ox in T22[34]. An elongated tuber phenotype was detected by reducing the transcript levels of StGA2ox1 in potato tuber-suppression clones. These results suggest that high levels of GA3 might promote the longitudinal development of taro cormel at the lateral stages at T24. GA2ox might be a negative regulatory factor in this process. In addition, OsGA20ox1 and OsGA20ox3 are activated by OsNAC120 and promote their expression[35]. This indicated that NAC (EVM0017068) might be a positive regulator of GA2ox (EVM0019043) in taro cormel expansion (Fig. 8; Supplementary Fig. S4). Furthermore, a significant negative correlation between NAC (EVM0017068) and AGP activity indicates that NAC may negatively regulate starch accumulation in taro cormels (Supplementary Fig. S5). Gibberellin Acid Stimulated Proteins (GASA/Snakin) are key proteins in the plant cell response to gibberellin signaling[36]. Our results showed that GASA (EVM0003383) was highly expressed at the S1 stage of taro cormel at both T22 and T24 (Fig. 6a). However, higher expression levels were observed at the S1 stage of T24 and the lateral stage of T22 during taro cormel expansion, which was in contrast with the GA3 level in the taro cormel (Fig. 6a, Fig. 3h). Genome-wide analysis of Snakin/GASA family in potatoes revealed that Snakin-2 is highly expressed in tubers and participates in tuberization and biotic stress tolerance[37]. This also suggested that GASA might also be involved in taro cormel expansion. Additionally, the expression pattern of Snakin-1 was detected mainly in the active growth tissue and cell division zones using in situ hybridization. GA levels are enhanced by silencing Snakin-1 in potato[38]. This indicates that GASA might be a negative regulator of GA3 levels, which causes rapid expansion of the T22 cormel in the early stage and promotes longitudinal growth of the T24 cormel in the lateral stages. The bHLH transcription factor AtHBI1 has been identified to directly activate three GASA genes in Arabidopsis[39]. This indicated that bHLH (EVM0004888) might be a positive regulator of GASA (EVM0003383) in taro cormel expansion (Fig. 8; Supplementary Fig. S4). Although other hormones did not play key roles in taro cormel expansion in this study, further research is essential to determine the specific roles of other hormones.
Carbohydrate and storage metabolism
-
Starch is considered one of the main storage carbohydrates and produces both energy sources and structural components of cells and cell walls. Starch synthesis is also positively related to storage organ enlargement in potato, sweet potato, taro, radish, and lotus[40−44]. KEGG enrichment analysis revealed that DEGs were significantly enriched in starch and sucrose metabolism pathways during taro cormel expansion at T22 and T24 (Fig. 5f & g; Supplementary Table S8). Starch content increased gradually in taro cormel from the S1 to S3 stages and was much higher in Ganyu2 than in Ganyu4. These results suggest that starch biosynthesis is an important metabolic pathway for taro cormel expansion. In this study, we identified several key genes involved in starch biosynthesis. Among these, EVM0014895 and EVM0016620 encode ADP-glucose pyrophosphorylase which is a key enzyme responsible for catalyzing starch synthesis and an important part of energy storage in plants[45]. The two AGPase were upregulated in T22 during taro cormel expansion, with a peak expression level at the S3 stage, which was significantly higher than that in T24 (Fig. 6b). In addition, the activity of AGP during taro cormel expansion in T22 and T24 was also similar with the gene expression level (Fig. 3b). In gladiolus, an AGPase gene (GhAGPS1) was highly expressed in corms and cormels, and silencing GhAGPS1 in corms decreased starch content, which resulted in lowered cormel yield and cormel quality[11]. Inhibition of the expression of AGPase in transgenic potato plants results in the abolition of starch formation in tubers, and more tubers per plant and stolon[46]. This suggests that AGPase (EVM0014895 and EVM0016620) might promote the expansion of taro cormel by increasing starch accumulation. Furthermore, a previous study showed that AGPase does not play a role in tuber formation alone but is closely associated with cell proliferation. Therefore, further investigations are needed to focus on the interaction between AGPase and cell proliferation-related genes in taro cormel expansion. Additionally, AtWRKY20 functions directly as a transcriptional activator of the IbAGP1 promoter which enhances the expression of IbAGP1 in sweet potato[47]. This suggests that WRKY (EVM0014164) may also be a positive regulator of AGPase (EVM0016620), which can promote starch accumulation during taro cormel expansion (Fig. 8; Supplementary Fig. S4). Moreover, a significant positive correlation between the expression level of AGPase (EVM0014895) and the weight of taro cormels is shown in Supplementary Fig. S5. CeAGPase has been verified to be a positive regulator of starch accumulation (Fig. 7). This suggests that taro cormel expansion may be promoted by AGPase activity-mediated starch accumulation. The expression level of WRKY (EVM0003609) was significantly positively correlated with the transverse diameter, weight, and starch content in taro cormels (Supplementary Fig. S5). This indicates that WRKY might be a negative regulator of AGPase (EVM0014895). Starch synthase is a key enzyme that catalyzes starch synthesis, is mainly responsible for binding glucose units to starch molecules, and plays a crucial role in the development and storage function of tubers and tuberous roots. There are two main types of starch synthases: granule-bound starch synthases (GBSS) and soluble starch synthases (SSS). GBSS is primarily responsible for amylose synthesis, whereas SSS is involved in amylopectin synthesis[48]. In our study, the expression levels of two SSS (EVM0005345 and EVM0021407) were upregulated in T22, but downregulated in T24 during taro cormel expansion (Fig. 6b). This result was similar to those of previous studies in which four IbSSSs and one PnSS gene were significantly upregulated during root tuber and root expansion in sweet potato and Panax notoginseng, respectively[49,50]. The different expression patterns of SSS between T22 and T24 may have caused the expansion of the taro cormel in T22 and the unexpanded cormel in T24. Many cis-regulatory elements, including DRE, GCC, and CAACA box, are found in the promoter region of starch synthesis genes, which can be recognized by AP2-EREBP with the AP2 domain[51]. In a study on the regulation of starch biosynthesis in maize, ZmMYB14 directly bound to the promoters of six starch-synthesizing genes, ZmGBSSI, ZmSSI, ZmSSIIa, ZmSBE1, ZmISA1, and ZmISA2 in yeast[52]. This indicated that the targeted upregulation of SSS (EVM0021407) by AP2-EREBP (EVM0019785) and MYB (EVM0024103 and EVM0025439) may be involved in starch accumulation during taro cormel expansion (Supplementary Fig. S4, Supplementary Table S12).
Cellular process
-
The morphological development of the cormel is intimately associated with cell division and enlargement[53]. In our study, the growth velocity of the cormel transverse diameter in Ganyu2 was higher than that in Ganyu4, and the growth velocity of the cormel longitudinal diameter was the opposite in the two taro varieties (Fig. 1a & b). This suggests that the expansion of the cormel in Ganyu2 was mainly caused by transverse cell division and enlargement, whereas longitudinal cell division and elongation occurred primarily in the cormel of Ganyu4. The results of the paraffin sections also indicated that the expansion of taro cormel was associated with the transverse growth of parenchyma cells, rapid growth of vascular bundles, and accumulation of starch granules (Fig. 3g). GO term analysis revealed several key genes involved in the cell cycle and cell wall metabolism, including CYCs, CDKI, expansin, and XTH. The core of cell cycle regulators are CYCs and cycle-dependent kinases (CDK). CYCs are periodically synthesized and degrade proteins that play a role in different phases of the cell cycle, activating specific CDKs and promoting cell cycle progression during plant growth[54]. The expression levels of CDKI (EVM0023713) and NAC (EVM0017068) (which are potential regulators of CDKI) were significantly negatively correlated with AGP activity (Supplementary Fig. S5). This indicated that NAC might positively regulate the expression of CDKI in taro cormel. In our study, CYC (EVM0027628) was downregulated at T22, with the highest expression level at the S1 stage, but presented a tendency to increase and then decrease at T24 during taro cormel expansion. Notably, the expression levels of CYC at the S2 and S3 stages of T24 were higher than those at T22 (Fig. 6c). The expression level of D3 cyclin gene significantly increased during the early stages of tuberous root formation and then gradually decreased during the later stages of tuber formation in sweet potatoes[55]. RNA-seq analysis of tiger nut tuber expansion revealed that the expression level of 19 CYCs was higher in the S1−S3 stage, but significantly decreased in the S4−S6 stage[56]. These results were similar to the expression levels of CYC in T22, suggesting that CYC might play an important role in promoting cell division in the early stages of taro cormel expansion. In the lateral stages, CYC may play a critical role in promoting longitudinal cell division at T24. The AP2-EREBP transcription factor AtERF7 was found to bind to the GCC box and regulate the expression of downstream genes[57]. This indicates that AP2-EREBPs (EVM0018671 and EVM0012678) may promote the expression of CYC (EVM0027628) during taro cormel expansion (Fig. 8; Supplementary Table S4). Expansins are a group of plant cell wall stretching and stress-relieving proteins that play important roles in promoting cell expansion and tuber growth by regulating cell wall extensibility[58]. In this study, we found that the expansin (EVM0023051) gene was upregulated in T22 but downregulated in T24, with the highest expression level at the S3 stage of T22 during taro cormel expansion (Fig. 6c). Several expansin genes (StEXP1, StEXP7 and StEXP8) accumulate in high abundance in young expanding potato tubers[59]. Transgenic plants with increased seed size, number, and seed yield were obtained by overexpressing the sweet potato gene IbEXP1[14]. This suggests that expansin (EVM0023051) may play an active role in taro cormel expansion by inducing cell wall extension and promoting cell expansion. However, the expression level of WRKY (EVM0003609) was significantly negatively correlated with the transverse diameter, weight, and starch content in taro cormels (Supplementary Fig. S5). This suggests that expansin is negatively regulated by WRKY.
-
Our study showed that taro cormel expansion was determined by the increase in transverse diameter and slow increase in longitudinal diameter, the transverse growth of parenchyma cells, the rapid growth of vascular bundles, and the accumulation of starch granules, which were the important factors involved in promoting taro cormel expansion; the transverse expansion of taro cormel was promoted by starch accumulation and low levels of GA3. Transcriptome profiling revealed key candidate differentially expressed genes and transcription factors involved in GA3 synthesis and signal transduction, starch and sucrose metabolism, cell cycle, and cell wall metabolism during taro cormel expansion. Finally, a model of the genetic regulatory network associated with taro cormel expansion was proposed. And CeAGPase is verified to be a positive regulator of starch accumulation and may promote taro cormel expansion.
This work was supported by the National Natural Science Foundation of China (Grant No. 32060683), the Key Research and Development Program of Jiangxi Province (Grant No. 20212BBF61001), the Natural Science Foundation of Jiangxi Province (20242BAB25381), and the Graduate Innovative Special Fund Projects of Jiangxi Province (YC2023-B133).
-
The authors confirm contribution to the paper as follows: conceptualization: Zhu Q; methodology: Xiao Y; investigation, validation, writing-original draft: Li B, Zhu Q; resources: Zhu Q, Sun J; formal analysis: Li B; software: Li B, Shan N; data curation: Wang S; funding acquisition: Zhou Q; writing-review & editing, supervision, project administration: Huang Y, Zhou Q. All authors reviewed the results and approved the final version of the manuscript.
-
All data generated or analyzed during this study are included in this published article and its Supplementary information files. The raw sequence data can be accessed at the China National GeneBank DataBase (CNGBdb) with Accession No. CNP0006307.
-
The authors declare that they have no conflict of interest.
-
# Authors contributed equally: Bicong Li, Qianglong Zhu
- Supplementary Table S1 List of the primer sequences used for qRT-PCR analyses.
- Supplementary Table S2 Quality metrics of clean reads.
- Supplementary Table S3 The analysis of genes with an FPKM value > 1 in at least one of the six comparisons.
- Supplementary Table S4 The analysis of DEGs during taro cormel expansion.
- Supplementary Table S5 (a) GO enrichment analysis of the upregulated genes in taro cormel of T22 and T24. GO terms with corrected p-value < 0.05. (b) GO enrichment analysis of the downregualted genes in taro cormel of T22 and T24. GO terms with corrected p-value < 0.05.
- Supplementary Table S6 Enrichment of KEGG pathway in taro cormel of T22 and T24.
- Supplementary Table S7 The DEGs involved in taro cormel expansion related signaling pathways.
- Supplementary Table S8 The DEGs involved in starch and sucrose metabolism pathway.
- Supplementary Table S9 The DEGs involved in Cell cycle.
- Supplementary Table S10 The DEGs involved in Cell wall metabolism.
- Supplementary Table S11 The analysis of differentially expressed TFs.
- Supplementary Table S12 TFs interacted with key candidate genes involve in taro cormel expansion.
- Supplementary Fig. S1 Hierarchical clustering analysis of all specific DEGs across different stages in "Ganyu2" and "Ganyu4".
- Supplementary Fig. S2 qRT-PCR validation of differential expression. The transcript levels of 17 genes, including 7 genes involved in starch metabolism.
- Supplementary Fig. S3 Go terms analysis of the up-regulated DEGs (a) and down-regulated DEGs (b) in T22 and T24.
- Supplementary Fig. S4 Regulatory networks from interaction analysis of TFs and candidate genes were visualized by Cytoscape.
- Supplementary Fig. S5 The correlation analysis of taro cormel phenotype, starch content and phytohormone levels between candidate gene expression levels.
- Copyright: © 2025 by the author(s). Published by Maximum Academic Press, Fayetteville, GA. This article is an open access article distributed under Creative Commons Attribution License (CC BY 4.0), visit https://creativecommons.org/licenses/by/4.0/.
-
About this article
Cite this article
Li B, Zhu Q, Xiao Y, Wang S, Sun J, et al. 2025. Integrated physiological characters and transcriptome analyses reveal the expansion mechanism of lateral cormels of Colocasia esculenta. Vegetable Research 5: e015 doi: 10.48130/vegres-0025-0013 

Integrated physiological characters and transcriptome analyses reveal the expansion mechanism of lateral cormels of Colocasia esculenta
- Received: 13 December 2024
- Revised: 11 March 2025
- Accepted: 01 April 2025
- Published online: 20 May 2025
Abstract: Multi-cormels taro is one of the main cultivation types of taro in southern China, and its yield and quality are largely determined by cormel expansion. Identifying the regulatory mechanisms related to multi-cormels taro cormel expansion would be useful for improving its yield and quality. In this study, Ganyu4, a mutant of multi-cormels taro with long rod-like cormels from the somatic variation during the tissue culture, and its wild type (Ganyu2, the lateral cormels are globular) were used as material, and the morphological and physiological characteristics of cormels in different developmental stages were investigated and determined after differentially expressed genes related to cormel expansion were screened using transcriptome sequencing analysis. The results showed that the external features of taro lateral cormel expansion were reflected in the continuous and uniform growth of transverse and longitudinal diameters in Ganyu2, and the internal features were reflected in the transverse growth of parenchyma cells, rapid growth of vascular bundles, and accumulation of starch granules. The positive correlations were detected between longitudinal diameter and GA3 content, as well as between transverse growth and starch accumulation. Transcriptome profiling revealed key candidate DEGs involved in GA3 synthesis and signal transduction, starch and sucrose metabolism, the cell cycle, and cell wall metabolism during taro cormel expansion. CeAGPase was verified to be a positive regulator of starch accumulation and may promote taro cormel expansion. These results provide novel insights into the molecular mechanisms underlying taro cormel expansion.