


-
To date, more than 150 countries around the world have made commitments to carbon neutrality and have introduced a series of targeted policy measures[1]. Natural gas and hydrogen play an important role in the process of energy transition[2,3], as natural gas produces almost no sulfur compounds, dust, or other pollutants during combustion, and its carbon dioxide emissions are significantly lower than those of coal and oil. Hydrogen, on the other hand, is widely recognized as a zero-emission, high-energy-density clean energy source. How to transport CH4 and H2 from production sites to various end-use consumers in an efficient, safe, and economical manner is currently a popular research topic in the field of energy transportation.
With the continuous growth of fuel energy demand and the imbalance in energy resource distribution in China, large-scale CH4 transmission networks have emerged[4]. Long-distance pipeline transportation of CH4 will continue to play an important role in the field of energy transportation[5]. This is because pipeline transportation of CH4 has significant advantages over other transportation methods, such as tanker trucks and gas cylinders, in terms of transportation efficiency, safety, transportation costs, and maintenance costs. For ultra-long-distance CH4 transportation, the efficiency of long-distance pipelines can be more than 20 times greater than that of road transportation[6]. Similarly, for large-scale and long-distance H2 transportation, compared with liquid H2 transportation, compressed H2 cylinder transportation, and solid-state H2 storage transportation, pipeline transportation is theoretically the optimal method in terms of transportation costs, efficiency, safety, and technological stability (Table 1). Although the construction of dedicated H2 pipeline networks is costly[7], the problem can be solved by using existing CH4 pipelines. By blending H2 into CH4 transmission and distribution networks and leveraging existing infrastructure, low-cost, large-scale H2 transportation can be achieved[8−10].
Table 1. Comparison of different H2 transportation methods[11].
State Transportation method Pressure (MPa) Load per carriage (kg) Volume density (kg·m−3) Cost (CN¥/kg) Economic distance (km) Gaseous H2 Long L 20 300−400 14.5 5 < 150 Pipeline 1−4 3.2 0.3 ≥ 500 Liquid H2 Liquid H2 tanker 0.6 7,000 64 13.57 ≥ 200 Solid organic H2 Truck 4 300−400 50 < 150 CH4 and H2/CH4 pipelines are extensively utilized owing to their numerous advantages, with applications typically involving underground and submarine settings. Buried pipelines have obvious advantages in urban residential areas, commercial zones, and industrial parks. First, being underground avoids accidental impacts from surface activities, reducing the risk of leaks caused by third-party damage. At the same time, the soil provides some protection for the pipelines, reducing the impact of environmental factors, such as extreme weather, on pipeline corrosion and damage. Second, buried pipelines do not interfere with traffic, urban landscape planning, or daily human activities, maintaining a clean and orderly surface environment. Third, the relatively stable underground environment is conducive to the long-term and stable operation of pipelines, reducing the costs and inconveniences of frequent repairs and replacements, and ensuring the continuity and reliability of gas supply. Submarine gas pipelines are mainly applicable for scenarios where they span across rivers, lakes, and seas, connecting terrestrial gas transmission networks separated by bodies of water, and are commonly seen in situations such as coastal cities supplying gas to offshore islands and mutual gas supply across riverbanks. From a stability perspective, the underwater environment is relatively stable and less disturbed by human activities, which can effectively reduce the risk of pipeline damage caused by terrestrial construction and traffic, thereby ensuring the safe and stable transportation of gas. In terms of resource utilization, there is no need to allocate a large amount of land space for pipeline construction, conserving valuable land resources, which is especially significant in coastal areas where land resources are scarce[12]. However, buried and subsea natural gas and H2/CH4 pipelines may also experience leakage and diffusion accidents during use due to factors such as material aging and corrosion, substandard construction, manufacturing defects, and external damage[13−15,16]. Leaks can trigger secondary disasters such as explosions and poisoning, while also polluting water and soil resources, leading to significant economic losses. Therefore, studying the diffusion patterns of leaks is of great importance for developing emergency response measures and optimizing pipeline design. To address these concerns, domestic and international scholars have applied numerical simulations and experimental methods to study how various factors influence the consequences of CH4 and H2/CH4 pipeline leaks. For example, Bu et al.[17] used numerical simulations to explore the effects of soil characteristics, pipeline pressure, burial depth, and leak hole diameter on methane leakage rates and early warning systems of underground CH4 pipelines; Zhu et al.[18] investigated the effects of different H2 blending ratios, release pressures, and leak directions on H2/CH4 pipeline consequences; Houssina-Agbomson et al.[19] studied the impacts of gas types, release pressures, leak directions, and soil types on underground pipeline leak diffusion; Ren et al.[20] employed both experimental and numerical simulations to examine how soil characteristics like porosity and particle size, as well as environmental factors such as soil temperature, affect CH4 diffusion in soil; and Ji et al.[21] used numerical simulations to analyze the effects of multiple leak holes on submarine pipeline leaks. Zhu et al.[22] employed experimental methods to analyze the impact of leak point depth, hole size, and leak pressure on the consequences of submarine pipeline leaks. Significant progress has been made in both domestic and international research, but there are still some limitations, such as the lack of studies on gas diffusion patterns in real, complex geographic environments and the diffusion patterns under the coupling of multiple factors. Moreover, most studies are simulations and lack experimental validation. This review will provide a detailed overview of the current research status by domestic and international scholars on two pipeline scenarios: soil and seabed. The aim is to summarize and analyze the impact patterns of various factors under different conditions and, based on existing research findings, provide guidance on the prevention and control of natural gas and H2/CH4 pipeline accidents in these two scenarios.
-
Compared to experimental research, Computational Fluid Dynamics (CFD) offers numerous advantages such as lower costs, higher efficiency, and enhanced safety. When simulating the leakage and diffusion of CH4 and H2/CH4, it is possible to consider multiple influencing factors simultaneously and monitor various parameters, including the distribution of leaked gas concentrations, velocity vectors, temperature distribution, etc. Among these, numerical simulation software such as ANSYS FLUENT, FLACS, COMSOL Multiphysics, OpenFOAM, AUTODYN, FDS (Fire Dynamics Simulator), and STAR-CCM+ has shown good consistency between simulation and experimental results in the study of gas leakage processes, and are thus widely used in research on the consequences of leakage and diffusion during pipeline transportation[23].
Mathematical modeling
-
In the context of underground and submarine leakage environments, influencing factors typically include pipeline H2 blending ratios, pipeline operating pressures, the size and shape of the leak opening, the location and direction of the leak, external ventilation, pipeline burial depth, soil characteristics, water depth, and water flow conditions. Due to the multitude of factors affecting pipeline leaks and the inherent complexity of the leakage process, theoretical models are often simplified[24]:
The general form of the continuity equation is as follows[25]:
$ \dfrac{\partial \rho }{\partial t}+\dfrac{\partial \left(\rho u\right)}{\partial x}+\dfrac{\partial \left(\rho v\right)}{\partial y}=0 $ (1) where, u and v represent the velocity components in the x and y directions, respectively, and ρ denotes the fluid density[25].
$ \dfrac{\partial }{\partial t}\left(\rho {u}_{i}\right)+\dfrac{\partial }{\partial {x}_{j}}\left(\rho {u}_{i}{u}_{j}\right)=-\dfrac{\partial p}{\partial {x}_{i}}+\dfrac{\partial {\tau }_{ij}}{\partial {x}_{j}}-\rho {g}_{j} $ (2) In these equations,
$ \text{ρ} $ $ {\tau }_{ij} $ The energy equation is derived from the first law of thermodynamics, which is the principle of conservation of energy. It is shown as follows[26]:
$ \dfrac{\partial \left(\rho E\right)}{\partial t}+\dfrac{\partial }{\partial {x}_{i}}\left[{u}_{i}(\rho E+p)\right]=\dfrac{\partial }{\partial {x}_{i}}\left[{k}_{\text{eff}}\dfrac{\partial T}{\partial {x}_{i}}-\sum _{{j}^{\mathrm{\text{'}}}} {h}_{{j}^{\mathrm{\text{'}}}}{J}_{{j}^{\mathrm{\text{'}}}i}+{\left({\tau }_{ij}\right)}_{\text{eff}}{u}_{j}\right] $ (3) In the context provided, E represents the total specific energy, defined as E = e + u2/2; where e is the internal energy per unit mass (specific internal energy); keff denotes the effective thermal conductivity; hj refers to the enthalpy of substance j'.
The equations for component transport and mixture density are shown as follows[27]:
$ \dfrac{\partial \left(\rho \omega \right)}{\partial t}+\dfrac{\partial }{\partial {x}_{j}}\left(\rho {u}_{j}\omega \right)=\dfrac{\partial }{\partial {x}_{j}}\left({u}_{i}\frac{\partial \omega }{\partial {x}_{j}}\right) $ (4) $ \rho =\dfrac{P}{RT}\dfrac{{M}_{v}{M}_{\alpha }}{\left[\omega {M}_{\alpha }+(1-\omega ){M}_{v}\right]} $ (5) where ρ represents the gas density (kg/m3), t denotes the gas flow time (s), P refers to the absolute pressure (Pa), and ω indicates the mass fraction of the component (%), Mα and Mv are the molecular weights of the combustible components.
Compared to other turbulence models, the standard k-
$ \epsilon $ (1) The k-equation:
$ \dfrac{\partial }{\partial t}\left(\rho k\right)+\dfrac{\partial }{\partial {x}_{i}}\left(\rho k{u}_{i}\right)=\dfrac{\partial }{\partial {x}_{j}}\left[\left(\mu +\dfrac{{\mu }_{t}}{{\sigma }_{k}}\right)\dfrac{\partial k}{\partial {x}_{j}}\right]+{G}_{k}+{G}_{b}-\rho \varepsilon -{Y}_{M}+{S}_{k} $ (6) (2) The
$ \varepsilon $ $ \dfrac{\partial }{\partial t}\left(\rho \varepsilon \right)+\dfrac{\partial }{\partial {x}_{i}}\left(\rho \varepsilon {u}_{i}\right)=\dfrac{\partial }{\partial {x}_{j}}\left[\left(\mu +\dfrac{{\mu }_{t}}{{\sigma }_{\varepsilon }}\right)\frac{\partial \varepsilon }{\partial {x}_{j}}\right]+{C}_{1\varepsilon }\dfrac{\varepsilon }{k}\left({G}_{k}+{C}_{3\varepsilon }{G}_{b}\right)-{C}_{2\varepsilon }\rho \dfrac{{\varepsilon }^{2}}{k}+{S}_{\varepsilon } $ (7) Where Gk represents the turbulence kinetic energy produced by the mean velocity gradient; Gb is the turbulence kinetic energy generated by buoyancy; YM refers to the contribution of compressible turbulence dissipation to the overall dissipation rate in compressible flows. The model constants C1ε typically have a value of 1.44, C2ε takes a value of 1.92, σk is 1.0, and σε equals 1.3.
For various operating conditions, the continuity, momentum, and energy equations are adjusted with appropriate correction factors to improve the accuracy of numerical simulation outcomes. For example, Bu et al.[31] introduced a diffusion coefficient D (m2/s) in the component transport calculation model when investigating the leakage of CH4 in soil, as illustrated below:
$ \dfrac{\partial }{\partial t}\left(\rho \omega \right)+\dfrac{\partial }{\partial {x}_{j}}\left(\rho {u}_{j}\omega \right)=\dfrac{\partial }{\partial {x}_{j}}\left(\rho D\dfrac{\partial \omega }{\partial {x}_{j}}\right) $ (8) Ren et al.[20] further studied Eqn (8) and estimated the diffusion coefficient Deff in soil using the diffusion coefficient D0 of methane in air, as shown in the following equation:
$ \dfrac{\partial }{\partial t}\left(\varepsilon {C}_{i}\right)+{\boldsymbol u}\cdot \nabla {C}_{i}+\nabla \cdot \left({D}_{\text{eff}}\nabla {C}_{i}\right)={Q}_{\varepsilon} $ $ {D}_{\mathrm{e}\mathrm{f}\mathrm{f}}=\dfrac{\varepsilon }{\tau }{D}_{0} $ (9) where, C denotes the concentration of the gas component (mol/m3), Deff represents the gas diffusion coefficient in soil (m2/s), Qc is the molar mass source term,
$ \tau $ Temperature also influences D0, and the Fuller equation[32] can be used to calculate D0 at different temperatures.
$ {D}_{0}=\dfrac{0.101{T}^{1.75}\sqrt{\dfrac{1}{{M}_{A}}+\dfrac{1}{{M}_{\mathrm{B}}}}}{P{\left[\left(\sum \mathrm{v}\mathrm{A}\right)+{\left(\sum \mathrm{v}\mathrm{B}\right)}^{1/3}\right]}^{2}} $ (10) where, MA is the molar mass of the gas component A (g/mol);
$ \sum \mathrm{v}\mathrm{A} $ The tortuosity
$ \tau $ $ \varepsilon $ $ \tau ={\varepsilon }^{-\frac{1}{3}} $ (11) In addition, Bu et al.[17] also revised the momentum equation calculation model during the simulation process of buried pipelines, introducing the soil porosity
$ \phi $ $ \dfrac{\partial }{\partial t}\left(\phi \rho \stackrel{\rightharpoonup }{u}\right)+\nabla \cdot \left(\phi \rho \stackrel{\rightharpoonup }{u}\overrightarrow{u}\right)=-\phi \nabla p+\nabla \cdot \phi {\bar{\bar{\tau }}}_{eff}+\phi \rho \overrightarrow{g}+{S}_{ i} $ $ {S}_{i}=-\left(\dfrac{\mu }{\alpha }{u}_{i}+\dfrac{{C}_{2}\rho }{2}\left|u\right|{u}_{i}\right) $ (12) The diffusion process of methane in soil is influenced by the resistance of the porous medium, including viscous resistance and inertial resistance. These two types of resistance make up the source term Si in the momentum equation.
When studying the leakage of submarine pipelines, the gas density will change with the surrounding pressure after leakage. Li et al.[33] adjusted the gas density formula for underwater bubbles as follows:
$ \begin{aligned}& {\rho }_{\mathrm{b}}=\dfrac{{M}_{\mathrm{b}}P}{RT}\\ & P={P}_{0}+{\rho }_{l}g{H}_{p}\end{aligned} $ (13) where, Mb is the relative molecular mass of the leaked gas; R is the universal gas constant [J/(kmol·K)]; P is the hydrostatic pressure experienced by the bubble (Pa); P0 is the atmospheric pressure (Pa); and Hp is the water depth where the bubble is located (m).
Cassano et al.[34] introduced Mk into the momentum equation when studying submarine leakage, which consists of drag, lift, virtual mass, turbulent diffusion, and surface tension forces. The adjusted momentum equation is as follows[35]:
$ \dfrac{\partial }{\partial t}\left({\alpha }_{k}{\rho }_{k}\overrightarrow{{u}_{k}}\right)+\left({\alpha }_{k}{\rho }_{k}\overrightarrow{{u}_{k}}\cdot \nabla \right)\overrightarrow{{u}_{k}}=-{\alpha }_{k}\nabla \mathrm{p}+\nabla \cdot \left({\alpha }_{k}{\rho }_{k}\nabla \overrightarrow{{u}_{k}}\right)+{\alpha }_{k}{\rho }_{k}g+{M}_{k} $ (14) where, αk is the volume fraction of the leaked gas (%);
$ {\rho } $ $ \overrightarrow{{u}_{k}} $ Ji et al.[21]introduced the heat flux qJ into the energy conservation equation when studying the consequences of leakage and diffusion from submarine oil and gas mixed pipelines, as follows:
$ \dfrac{\partial }{\partial t}\left(\rho E\right)+\dfrac{\partial }{\partial {x}_{J}}\left(\rho {u}_{t}E+{u}_{j}p\right)-\dfrac{\partial }{\partial {x}_{J}}\left({u}_{i}{\tau }_{lj}+{u}_{i}{\tau }_{ij}^{-1}\right)+\dfrac{\partial }{\partial {x}_{J}}\left({q}_{J}+{q}_{J}^{-1}\right)=0 $ (15) Experimental research
-
Compared to numerical simulation studies, experimental research on pipeline leak dispersion is relatively limited, primarily due to the high costs and significant risks associated with conducting such experiments. This paper reviews the experimental design schemes for pipeline leak dispersion in two distinct leakage environments: buried and subsea.
In investigating leakage scenarios for buried pipelines, Zhu et al.[18] conducted experiments to examine the effects of different H2 blending ratios, release pressures, and leak orientations on the consequences of H2/CH4 leaks. The experimental setup is shown in Fig. 1a, and the scene is illustrated in Fig. 1b. The system consists of four main components: a gas supply unit, a gas displacement system, a concentration detection system, and a data acquisition system. The gas supply unit, which includes an H2/CH4 cylinder bank, is connected to the main pipeline through a manifold. The H2/CH4 mixture is metered and regulated before entering the emission pipeline. Methane concentration detectors are arranged in five layers, while H2 concentration sensors are buried in three layers within the soil.
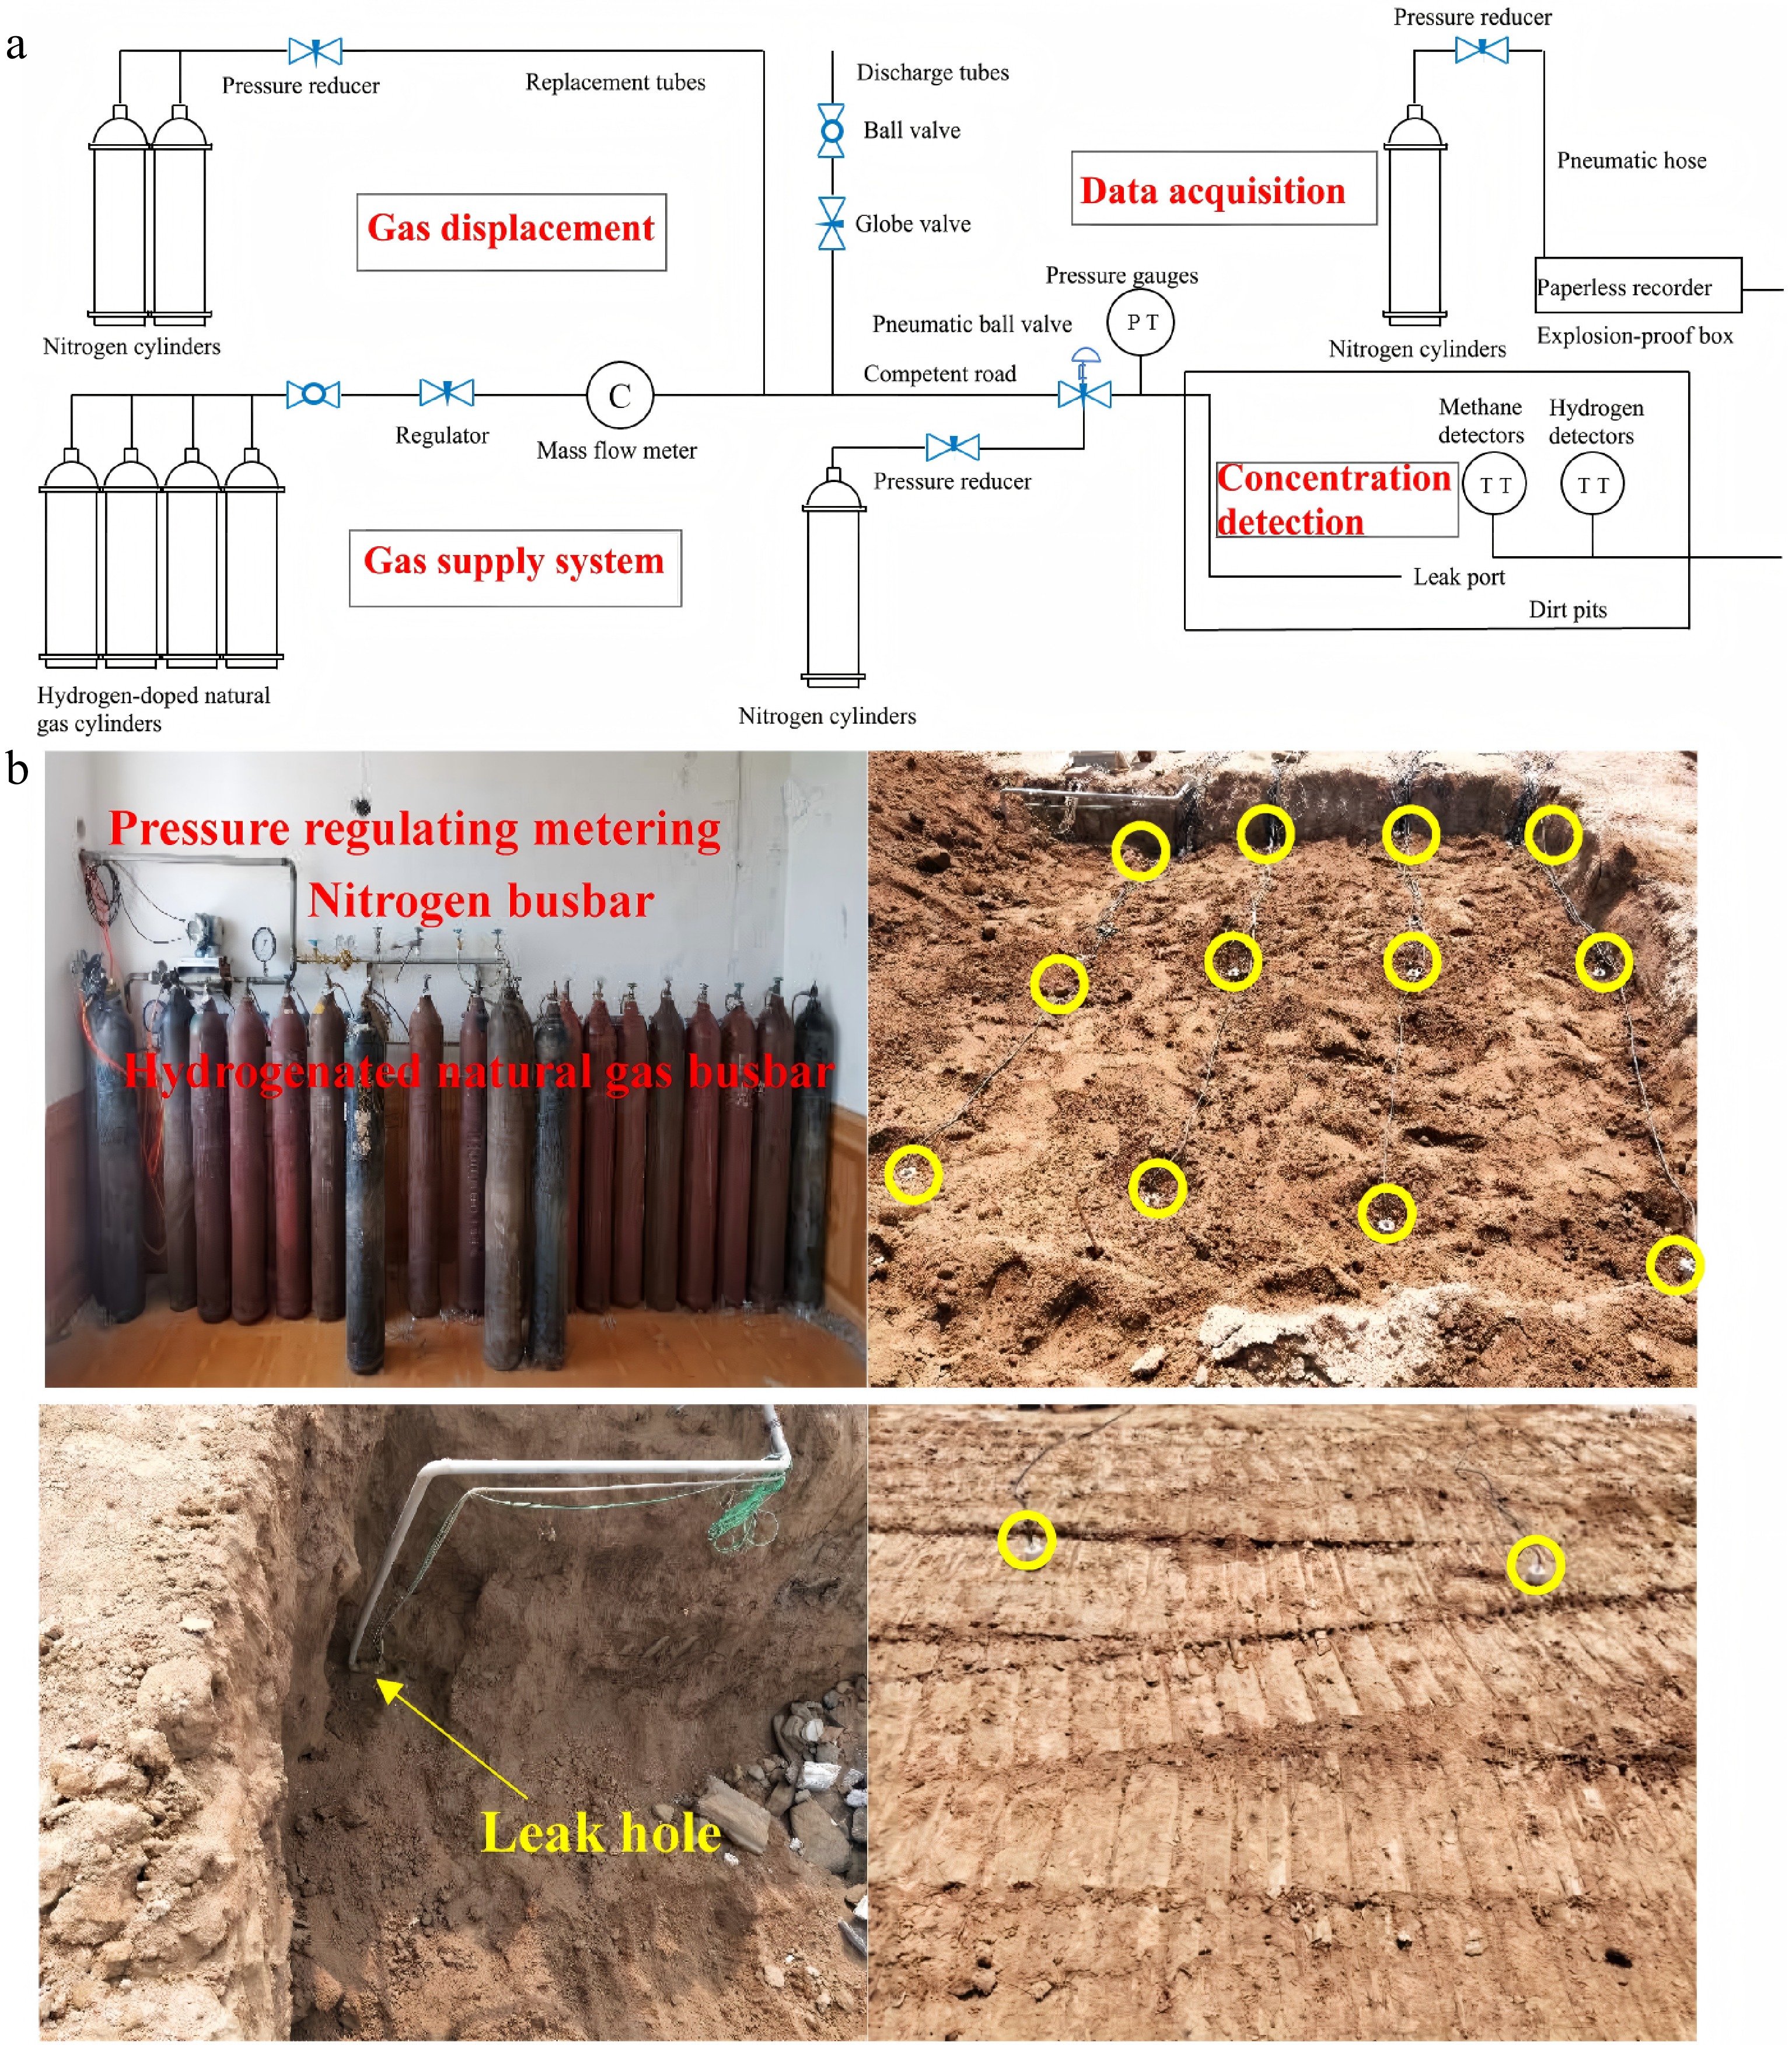
Figure 1.
(a) Leakage test system of H2-doped CH4 underground pipeline. (b) Diagram of the experiment site[18].
Houssin-Agbomson et al.[19]investigated the impact of gas type, gas release pressure, leak hole diameter, leakage direction, and backfill soil type on the consequences of gas leakage from buried pipelines. The experimental system primarily consisted of a gas source, delivery pipelines, a control system, an inerting system, and the experimental pipeline. By utilizing burst discs of various specifications, the release pressure at the leak orifice was controlled. The experimental setup involved placing the pipeline below ground level and filling the trench with soil (clay or sand) to simulate the actual soil environment surrounding buried pipelines (Fig. 2).
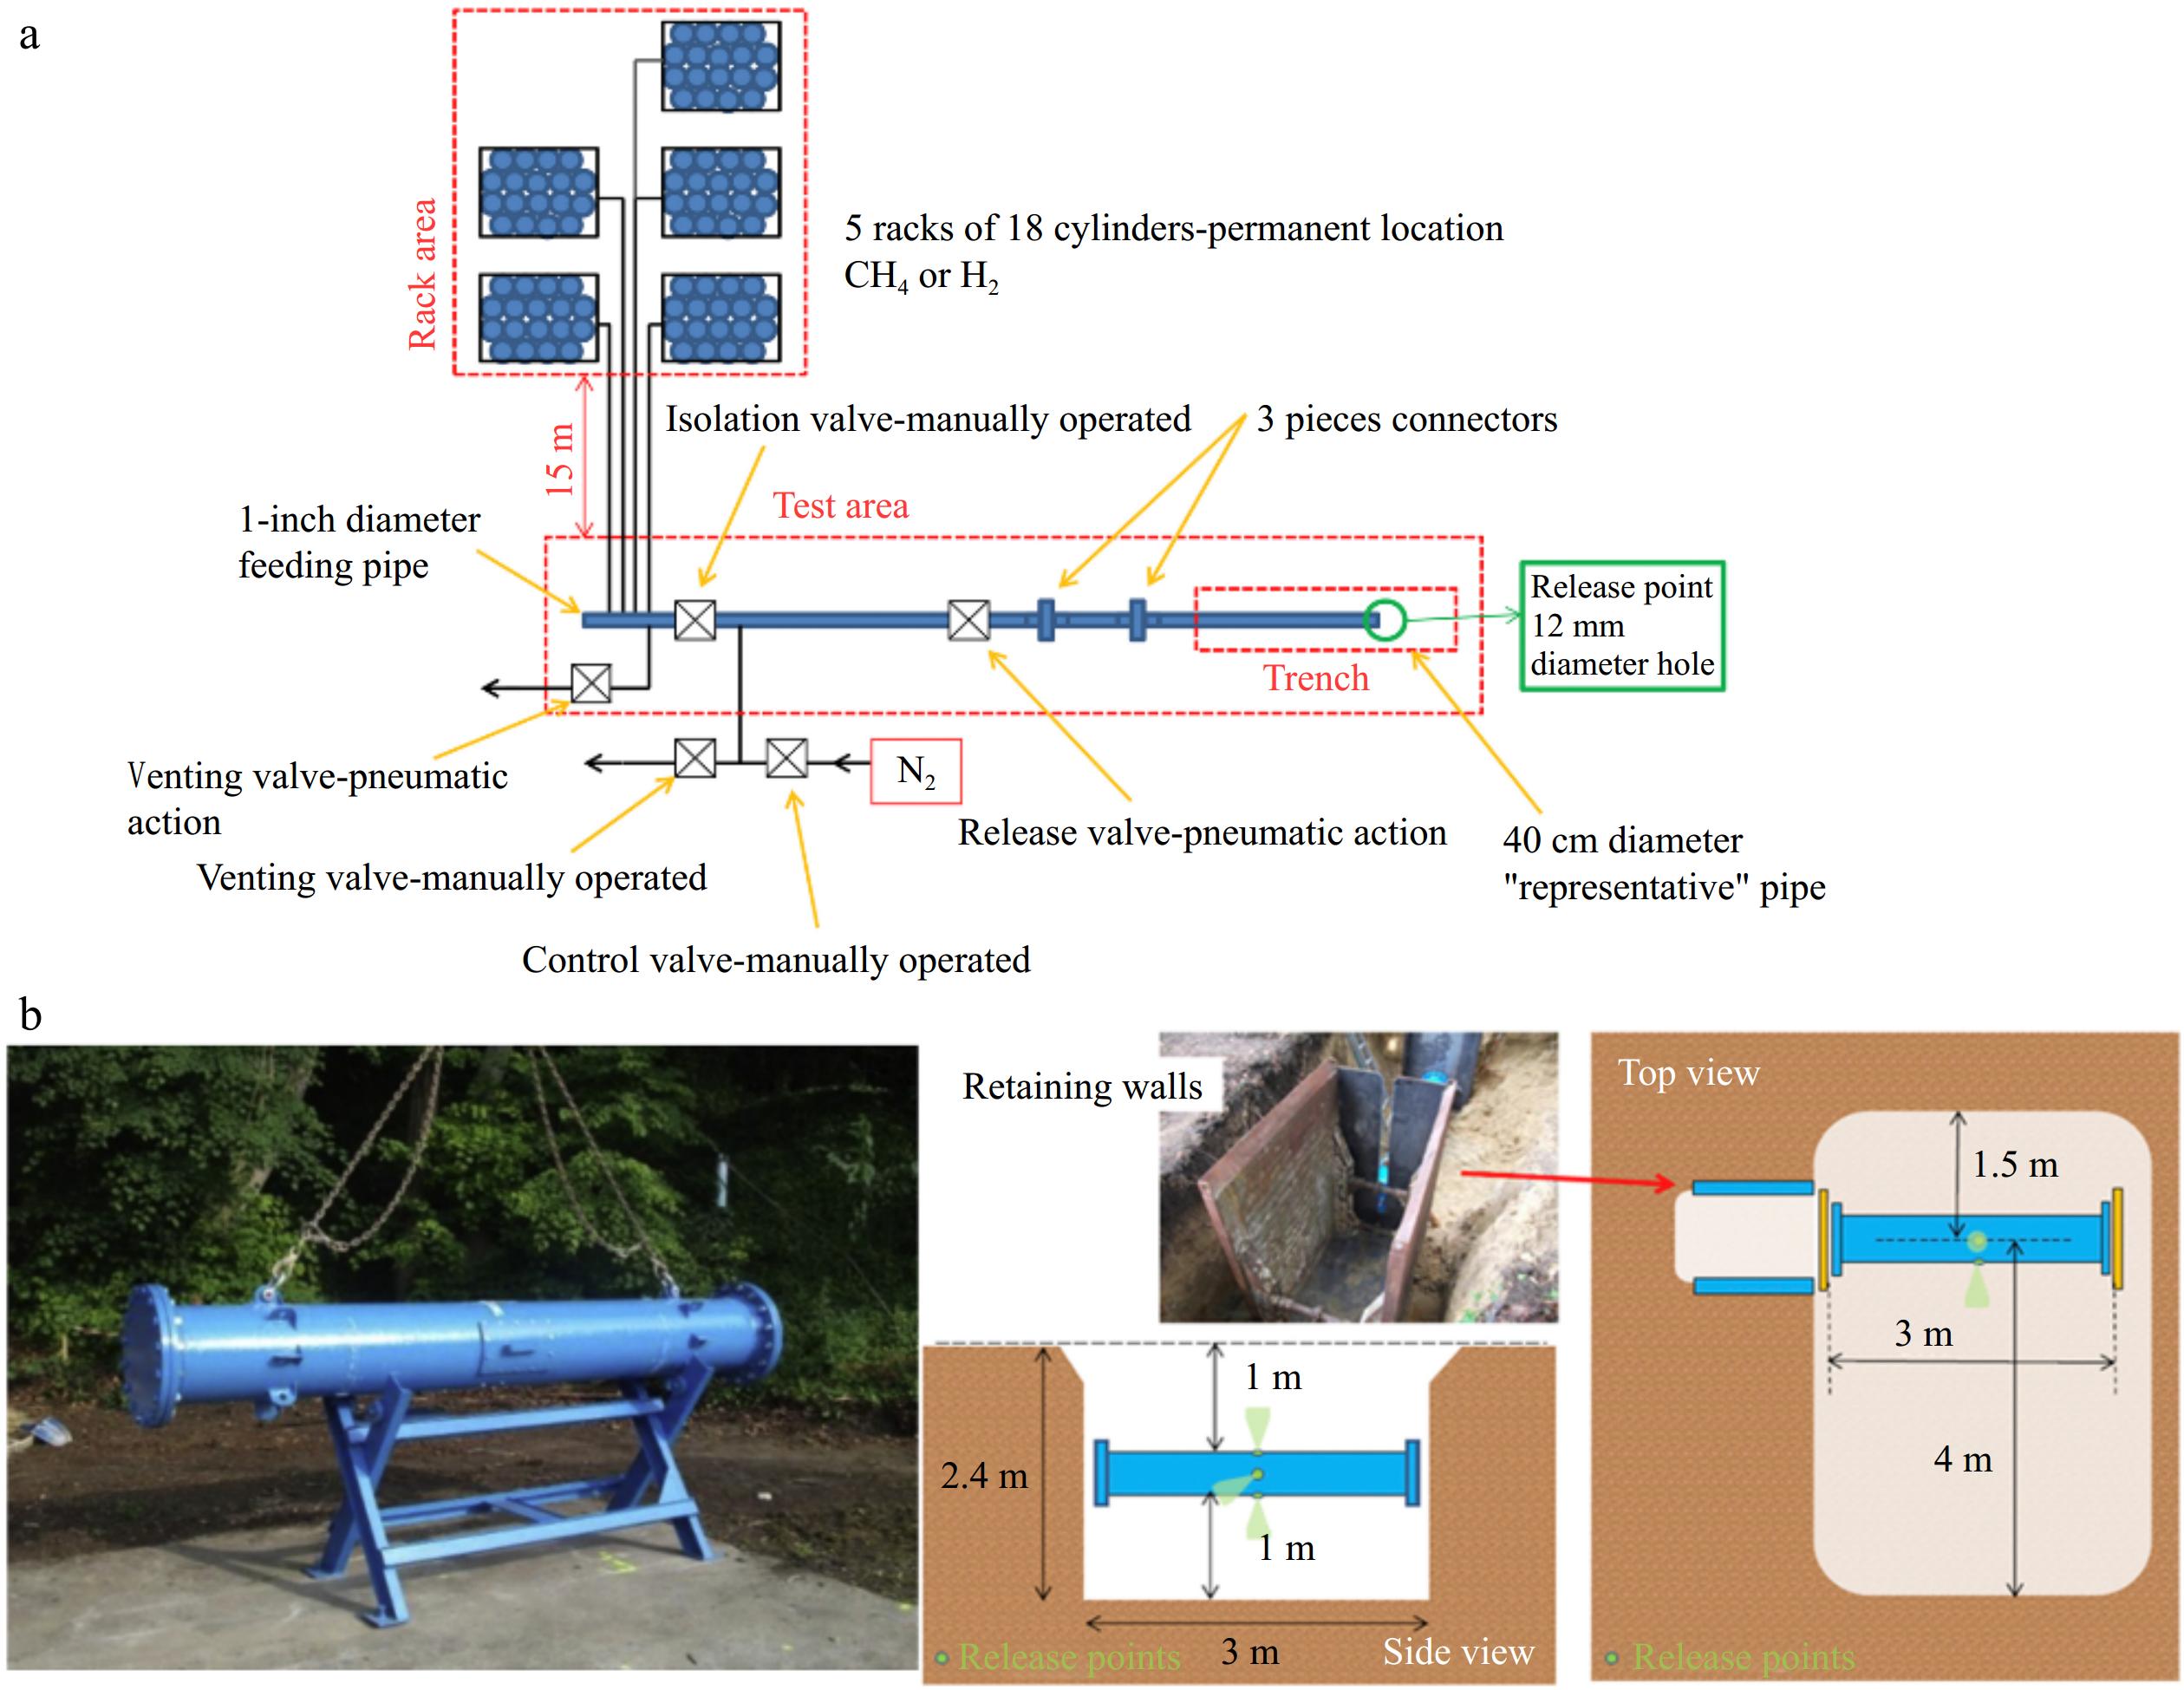
Figure 2.
(a) Schematic layout of leakage simulation test facility. (b) The 40 cm diameter test pipe and the position of the pipe in the trench[19].
In the context of subsea leakage scenarios, Zhang et al.[36] conducted experimental research to investigate how varying water depths, leak orifice sizes, and leakage pressures influence the consequences of CH4 pipeline leaks and dispersion. The experimental setup is shown in Fig. 3. The system consisted of a testing tank (serving as the gas source), a wind tunnel, experimental piping, and a monitoring system. The LNG storage tank was connected to an insulated pipe via a leakage tube. Within the LNG discharge pipe, a leak nozzle simulated the vertical release of LNG jets underwater. Two different orifice shapes (circular and rectangular) were used to simulate various leakage conditions. A high-speed camera positioned in front of the tank captured the characteristics of the underwater dispersion of the leaked CH4.
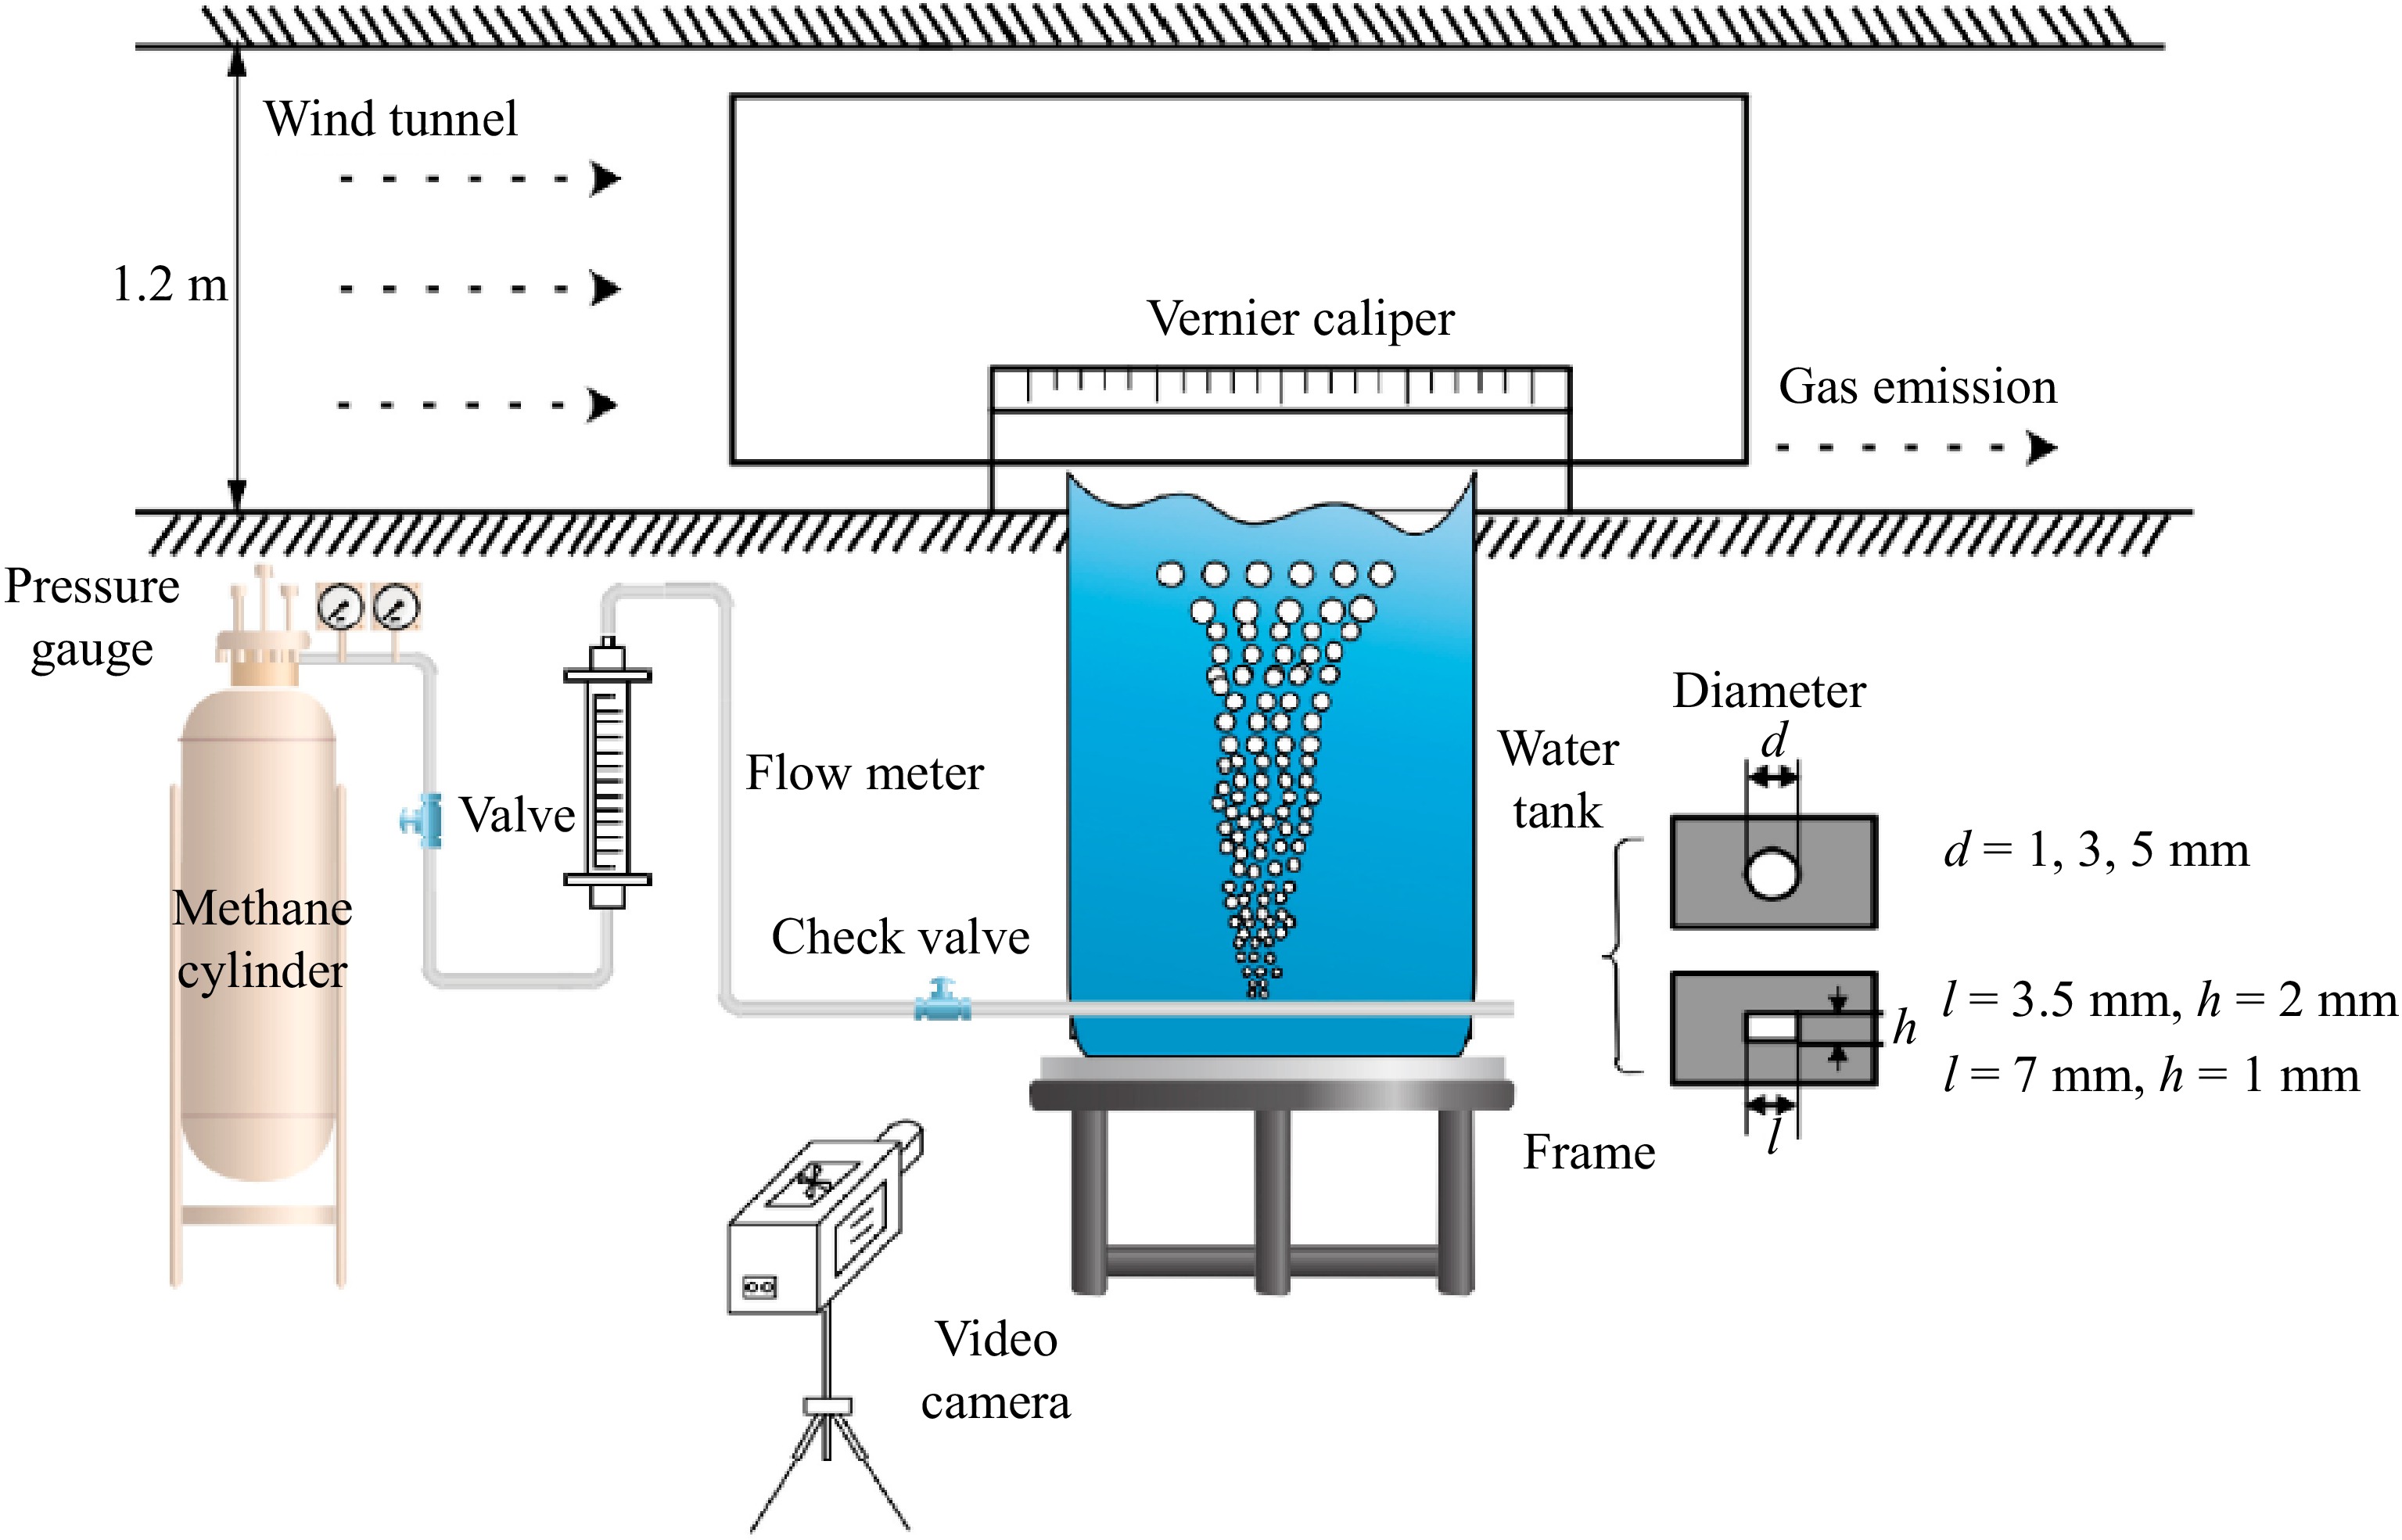
Figure 3.
Schematic diagram of experimental device[36].
Peng et al.[37] also conducted experimental research to examine how leak orifice depth and leakage flow rate affect the consequences of underwater CH4 pipeline leaks and dispersion. The experimental setup used by these researchers is shown in Fig. 4. The apparatus included a leak control device and a water tank, which was filled with seawater of similar salinity to that of the ocean. The front and back sides of the tank were made of transparent glass, allowing for easy observation and measurement of the bubble plume.
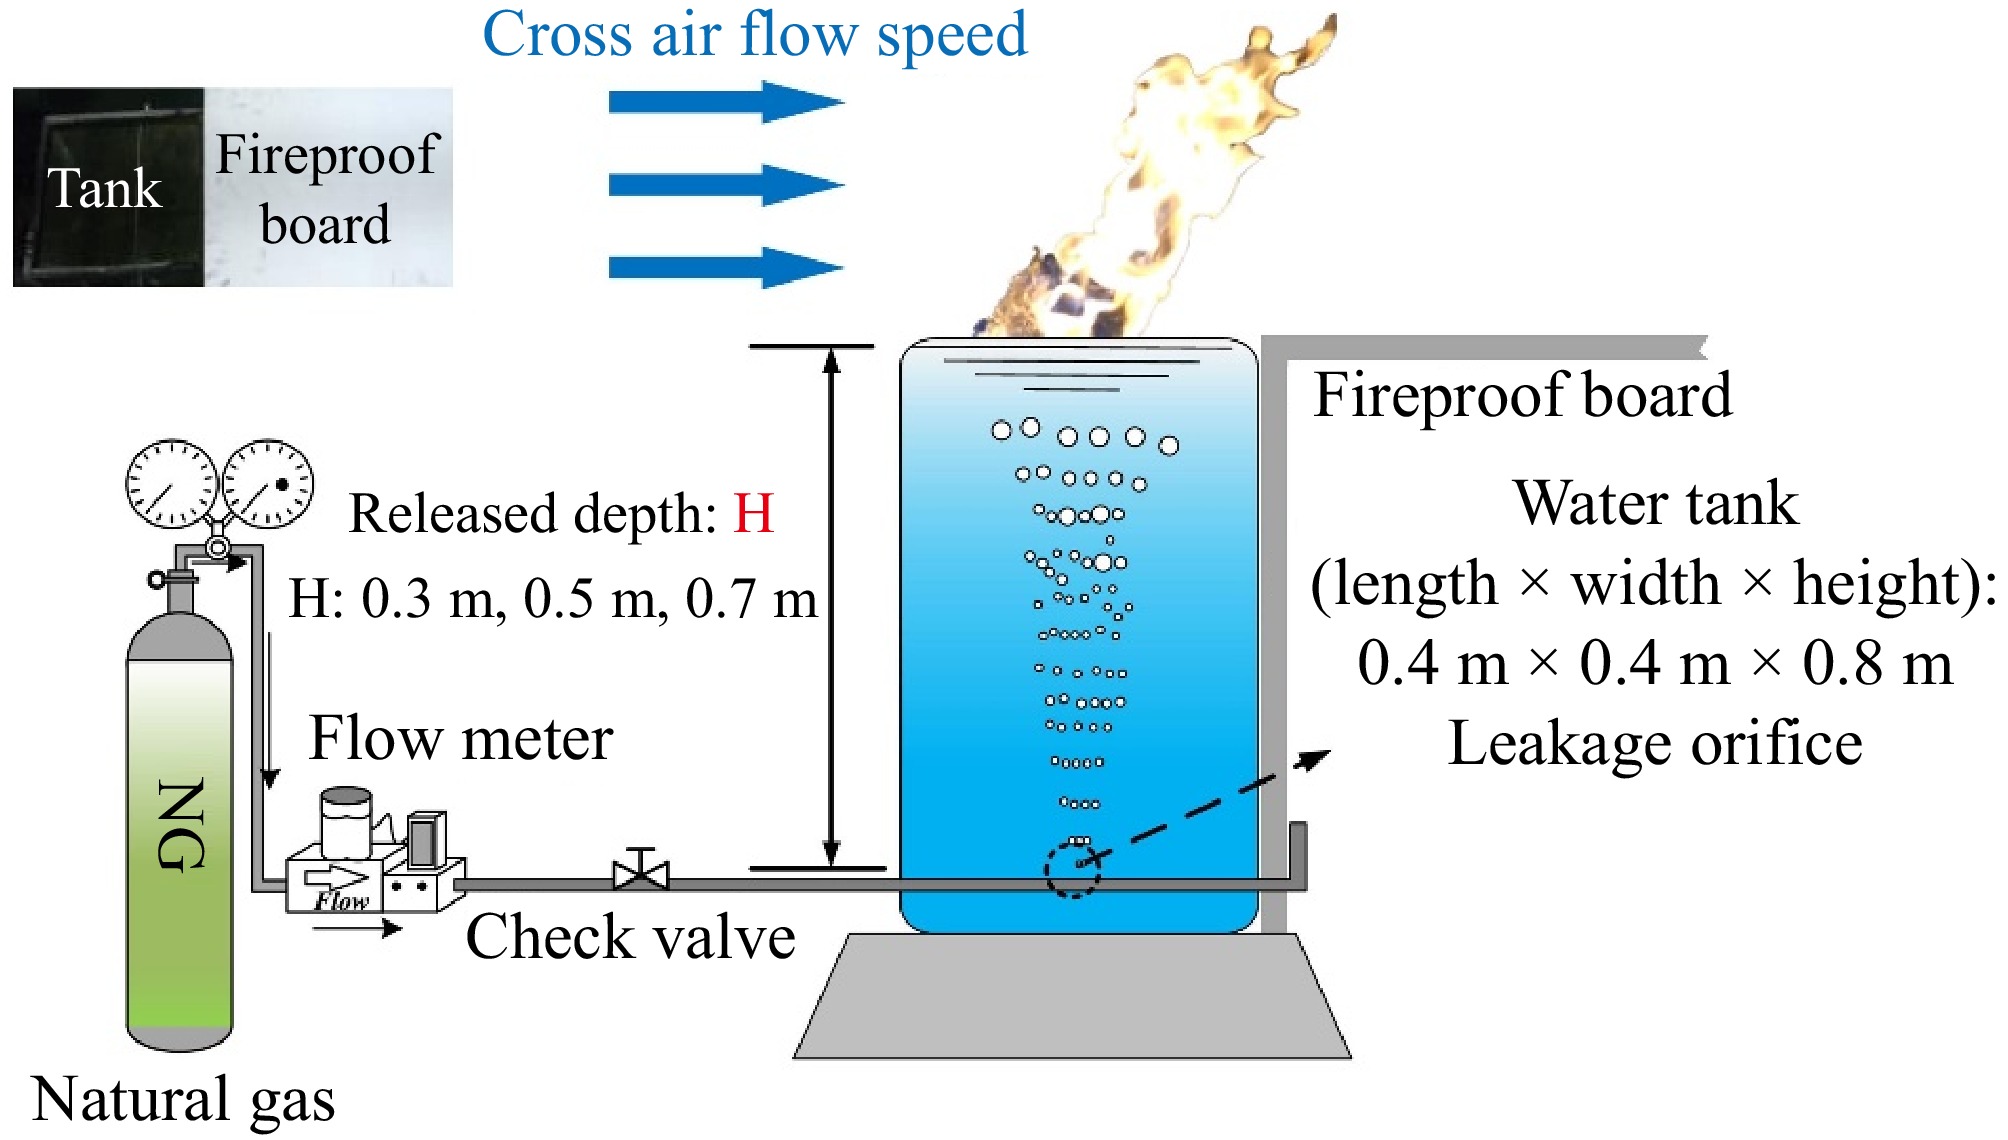
Figure 4.
Schematic diagram of experimental setup[37].
-
The transportation of CH4 and H2/CH4 through buried pipelines offers numerous advantages, such as high safety, strong stability, and efficient space utilization[38−40]. However, during operation, pipelines may be compromised by factors such as corrosion, external pressure, material degradation, and design or construction flaws, which could lead to leakage incidents, triggering fires and explosions. Therefore, studying the leak diffusion process of buried CH4 pipelines is crucial. Table 2 presents representative literature on the leak diffusion processes of buried CH4 and H2/CH4 pipelines.
Table 2. Research status of pipeline leakage and diffusion of CH4, H2 and its mixture in the buried scenario.
Ref. Research subject Influencing factors Software models Research methods Bu et al.[31] CH4 Leak pressure, leak orifice diameter, pipeline burial depth, soil properties, wind speed, surface structures ANSYS FLUENT Numerical simulation Bu et al.[17] CH4 Soil properties, pipeline operating pressure, pipeline burial depth, leak diameter ANSYS FLUENT Numerical simulation Liu et al.[41] CH4 Leak pressure, pipeline burial depth, leak direction, soil properties, leak orifice diameter ANSYS FLUENT Numerical simulation Liu et al.[42] CH4 Leak pressure, leak orifice diameter, soil properties ANSYS FLUENT Numerical simulation Ren et al.[20] CH4 Seepage pressure, leak orifice diameter, soil properties, soil temperature ANSYS FLUENT Numerical simulation, experiment Zeng et al.[43] CH4 Leak pressure, pipeline leak orifice diameter and position ANSYS FLUENT Numerical simulation Zhang et al.[44] CH4 Leak hole quantity (single vs. double hole comparison) ANSYS FLUENT Numerical simulation Bezaapour et al.[45] CH4 Soil characteristics, slope,moisture content, leak pressure, leak orifice diameter ANSYS FLUENT Numerical simulation Bu et al.[46] CH4 Leak pressure, leak orifice diameter, pipeline burial depth, pipeline diameter, leak direction, soil characteristics ANSYS FLUENT Numerical simulation Wang et al.[27] CH4 Leak orifice size and position, leak pressure, soil properties ANSYS FLUENT Numerical simulation Houssin-Agbomson et al.[19] CH4, H2 Gas type, leak pressure, leak orifice diameter, leak direction, soil characteristics / Experiment Zhou et al.[47] CH4 Leak pressure, leak orifice diameter, soil characteristics ANSYS FLUENT Experiment, numerical simulation Liu et al.[48] H2/CH4 H2 ratio, soil characteristics, wind speed ANSYS FLUENT Numerical simulation Li et al.[49] H2/CH4 Leak pressure, H2 ratio, ground hardening degree, leak orifice diameter, pipeline burial depth ANSYS FLUENT Numerical simulation Wang et al.[50] H2/CH4 Heat transfer coefficient, leak pressure, H2 ratio OLGA Numerical simulation Lu et al.[51] H2/CH4 H2 ratio, leak pressure, soil porosity, leak orifice diameter ANSYS FLUENT Numerical simulation Wu et al.[52] H2/CH4 Leak pressure, leak orifice diameter, soil temperature, soil characteristics, soil moisture content, H2 ratio ANSYS FLUENT Numerical simulation Zhu et al.[18] H2/CH4 H2 ratio, leak pressure, and leak direction ANSYS FLUENT Experiment, numerical simulation Bu et al.[17] conducted a study on the impact of soil characteristics (such as saturation, porosity, viscous resistance coefficient, and inertial resistance coefficient), pipeline operating pressure, pipeline burial depth, and leak orifice diameter on the methane leakage rate and methane diffusion early warning boundary (EWB) under two types of ground surface conditions: unhardened surface ground (UHSG) and hardened surface ground (HSG). The research revealed that the viscous resistance coefficient, inertial resistance coefficient, pipeline operating pressure and leak orifice size significantly influence the methane leakage rate, That is, the greater the soil viscous resistance coefficient and the inertial resistance coefficient, the smaller the leakage rate; while the greater the pipeline operating pressure and leak hole diameter, the greater the leakage rate. This conclusion is consistent with the findings of Liu et al.[41], Ren et al.[20], and Zeng et al.[43]. Zeng et al.[43] also found that the larger the leak hole diameter, the higher the rate of increase in the volume concentration of leaked natural gas. However, when the natural gas concentration in the soil reaches a certain volume concentration, the rate of increase in volume concentration becomes very small, indicating that the leakage is gradually stabilizing. The burial depth of the pipeline, surface wind speed, and surface buildings have little to no effect on the methane leakage rate. Bu et al.[17] developed a general formula that links the methane leakage rate to the soil's viscous resistance coefficient, inertial resistance coefficient, pipeline operating pressure, and leak orifice diameter[17]. This formula can be used for a quantitative analysis of the consequences of methane gas leakage.
$\begin{split} {Q}_{m}=\;&1.8046\times {10}^{-3}+2.0512\times {10}^{-3}(p\cdot d{)}^{\frac{1}{4}}+8.0834\times {10}^{-7}{d}^{2}-\\&3.5196\times {10}^{-5}{\left(\dfrac{1}{\alpha }\cdot {C}_{2}\right)}^{\frac{1}{8}}+1.385\times {10}^{-6}{\left(\dfrac{1}{\alpha }\right)}^{\frac{1}{4}}+\\&2.7724\times {10}^{-5}{C}_{2}^{\frac{1}{4}} \end{split}$ (16) $ \text{s.t.}\left\{\begin{array}{l}0.2\leqslant p\leqslant 0.4\;\mathrm{M}\mathrm{P}\mathrm{a}\\ d\le 80\;\mathrm{m}\mathrm{m}\end{array}\right. $ (17) In the formula, Qm represents the leak mass flow rate (kg/s), p denotes the leak pressure (MPa), d signifies the leak diameter (mm), 1/α is the soil's viscous resistance coefficient (1/m2), and C2 represents the soil's inertial resistance coefficient (1/m).
Later, Bu et al.[17] reviewed and assessed existing studies, focusing on how soil properties, pipeline operating pressure, burial depth, and leak diameter affect the EWB under different ground conditions. Equation (19)[17] introduces the EWB model for various soil types under HSG (Hardened Surface Ground) and UHSG (Unhardened Surface Ground) conditions. This model can estimate the methane diffusion range from buried pipelines, which is vital for establishing safety zones and preventing leak incidents from worsening. As shown in Fig. 5, Bu et al.[17] found good consistency between the results of numerical simulations and model calculations under the same conditions, verifying the accuracy of the EWB calculation model for different soil properties under HSG and UHSG conditions.
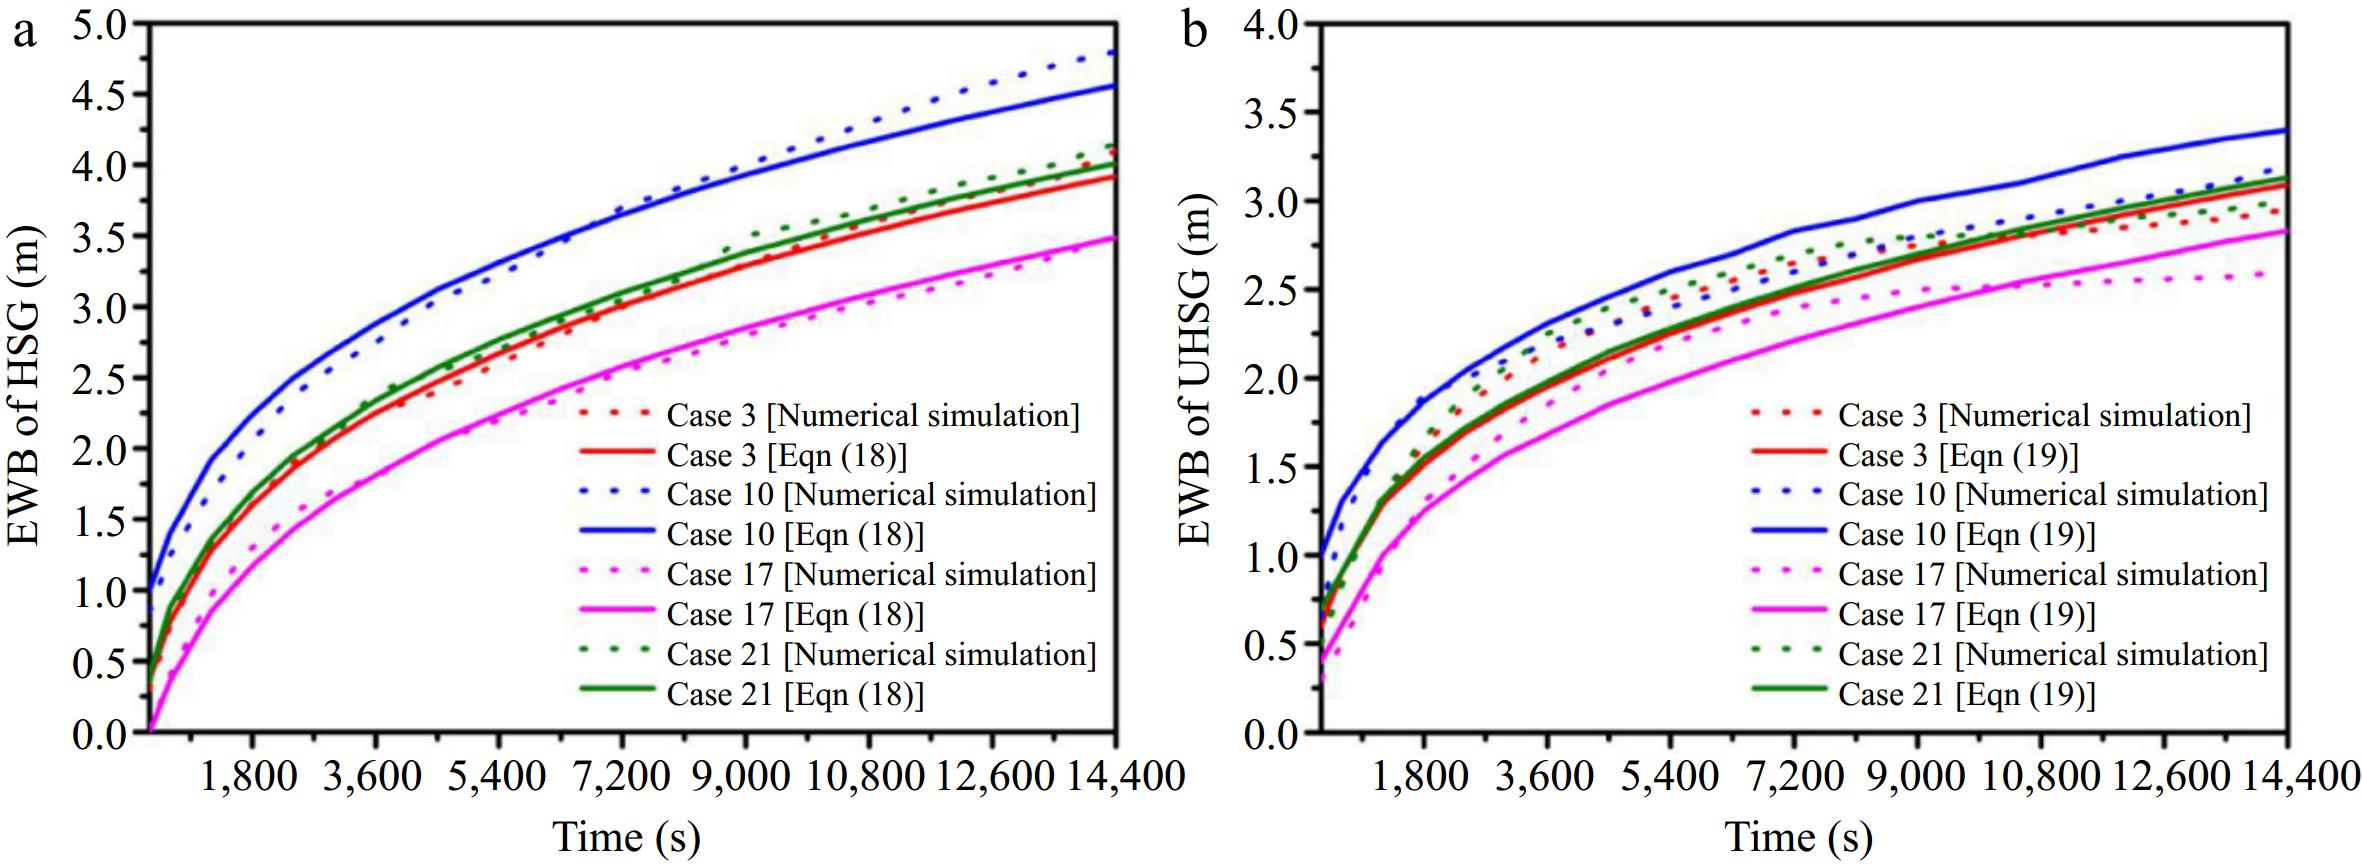
Figure 5.
(a) Verification of the EWB calculation model under HSG conditions. (b) Verification of the EWB calculation model under UHSG conditions[17].
$ \begin{split} EWB_{HSG}=\; & -2.6118+0.6678(p\cdot d)^{\frac{1}{4}}+1.0339\mathrm{d}^{\frac{1}{4}}-0.0528\left(\dfrac{t}{H}\right)^{\frac{1}{4}} \\ &-5.1787\phi(1-0.01S)-0.0539(1/\alpha)^{\frac{1}{8}}-0.0042C_2^{\frac{1}{4}} \\ &+0.5757t^{\frac{1}{4}} \end{split} $ (18) $ \begin{split}\quad\; EWB_{UHSG}= & -2.1487+0.2462(p\cdot d)^{\frac{1}{4}}+0.9478\mathrm{d^{\frac{1}{4}}}-0.2749\left(\dfrac{t}{H}\right)^{\frac{1}{4}} \\ &-2.1806\phi(1-0.01S)-0.0300(1/\alpha)^{\frac{1}{8}}-0.0026C_2^{\frac{1}{4}} \\ &+0.6399t^{\frac{1}{4}} \end{split} $ (19) $ \text{s.t.}\left\{\begin{array}{l}0.2\leqslant p\leqslant 0.4\;\mathrm{M}\mathrm{P}\mathrm{a}\\ d\leqslant 80\;\mathrm{m}\mathrm{m}\\ 300\;\text{}\mathrm{s}\leqslant t\leqslant 14400\;\mathrm{s}\\ \text{if}:\;\;EWB \lt 0,\;\;EWB=0\end{array}\right. $ (20) In this context, EWBHSG refers to the Early Warning Boundary (EWB) under Hardened Surface Ground (HSG) conditions, while EWBUHSG refers to the EWB under Unhardened Surface Ground (UHSG) conditions. H denotes the pipeline burial depth (m), t represents the leakage time (s),
$ \phi $ The time it takes for CH4 to reach the ground after a leak (FDT), the maximum distance it can spread horizontally from a buried pipeline (GDR), and the radius of the hazardous zone on the surface caused by the gas spreading (FDR) are critical parameters for assessing the severity of CH4 leak incidents. Liu et al.[41] employed numerical simulations to explore how factors such as pipeline pressure, burial depth, leak direction, soil characteristics, and leak orifice diameter influence FDT, GDR, and FDR. Their findings indicated that larger leak orifice diameters and higher leak pressures resulted in shorter FDT and larger GDR, but had minimal effect on FDR. Increasing burial depth raised FDT, GDR, and FDR, while variations in leak direction had a negligible impact on all three parameters. Soil properties played a substantial role in defining the hazardous boundary: the FDT in sandy soil is 1/8 that of loam soil and 1/15 that of clay soil; the FDR in sandy soil is 1/3 that of loam soil and 1/10 that of clay soil; the GDR in sandy soil is 1/6 that of loam soil and 1/11 that of clay soil (Fig. 6).
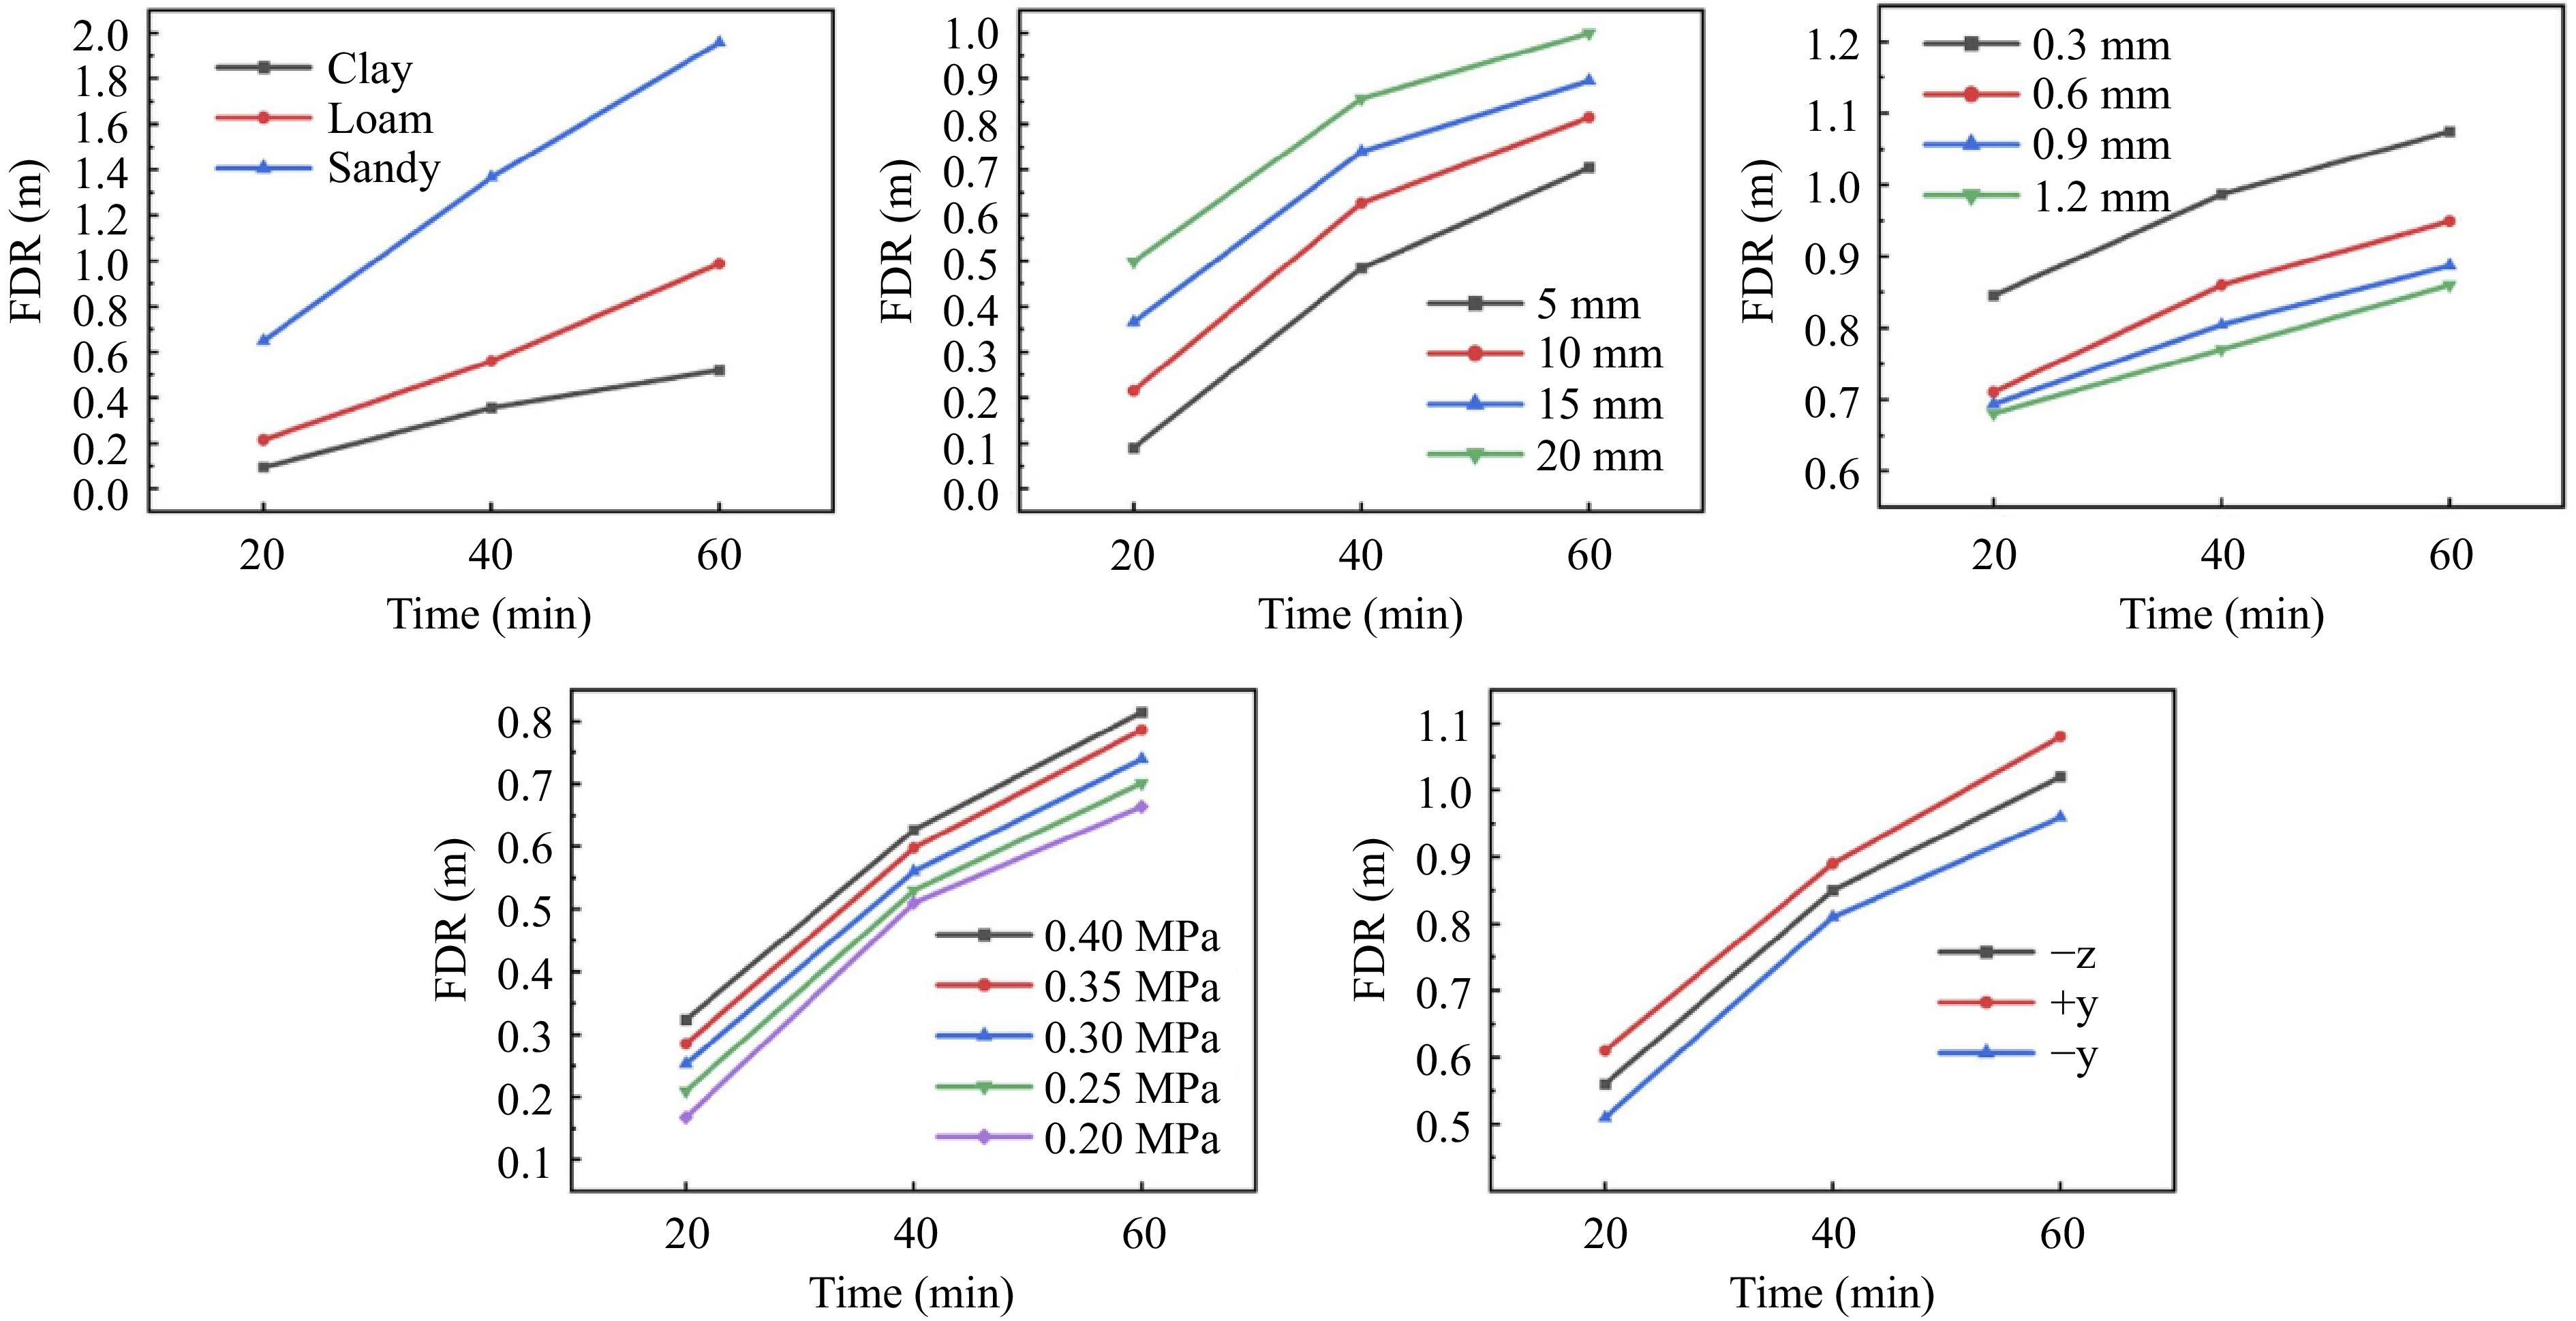
Figure 6.
FDR varies with different parameters[41].
Some researchers have also investigated the impact of soil temperature on the consequences of leakage. Ren et al.[20] compared experimental results with simulation outcomes and found that changes in soil temperature had a negligible effect on the methane leak diffusion process. The conclusion of this study is consistent with the findings of Wu et al.[52], who through studying the effect of soil temperature on the lateral diffusion distance of methane, found that the diffusion distance is positively correlated with soil temperature, but the degree of change is minimal. Figure 7 illustrates that at the same monitoring point, the methane leak concentrations detected under different temperature conditions were almost identical.
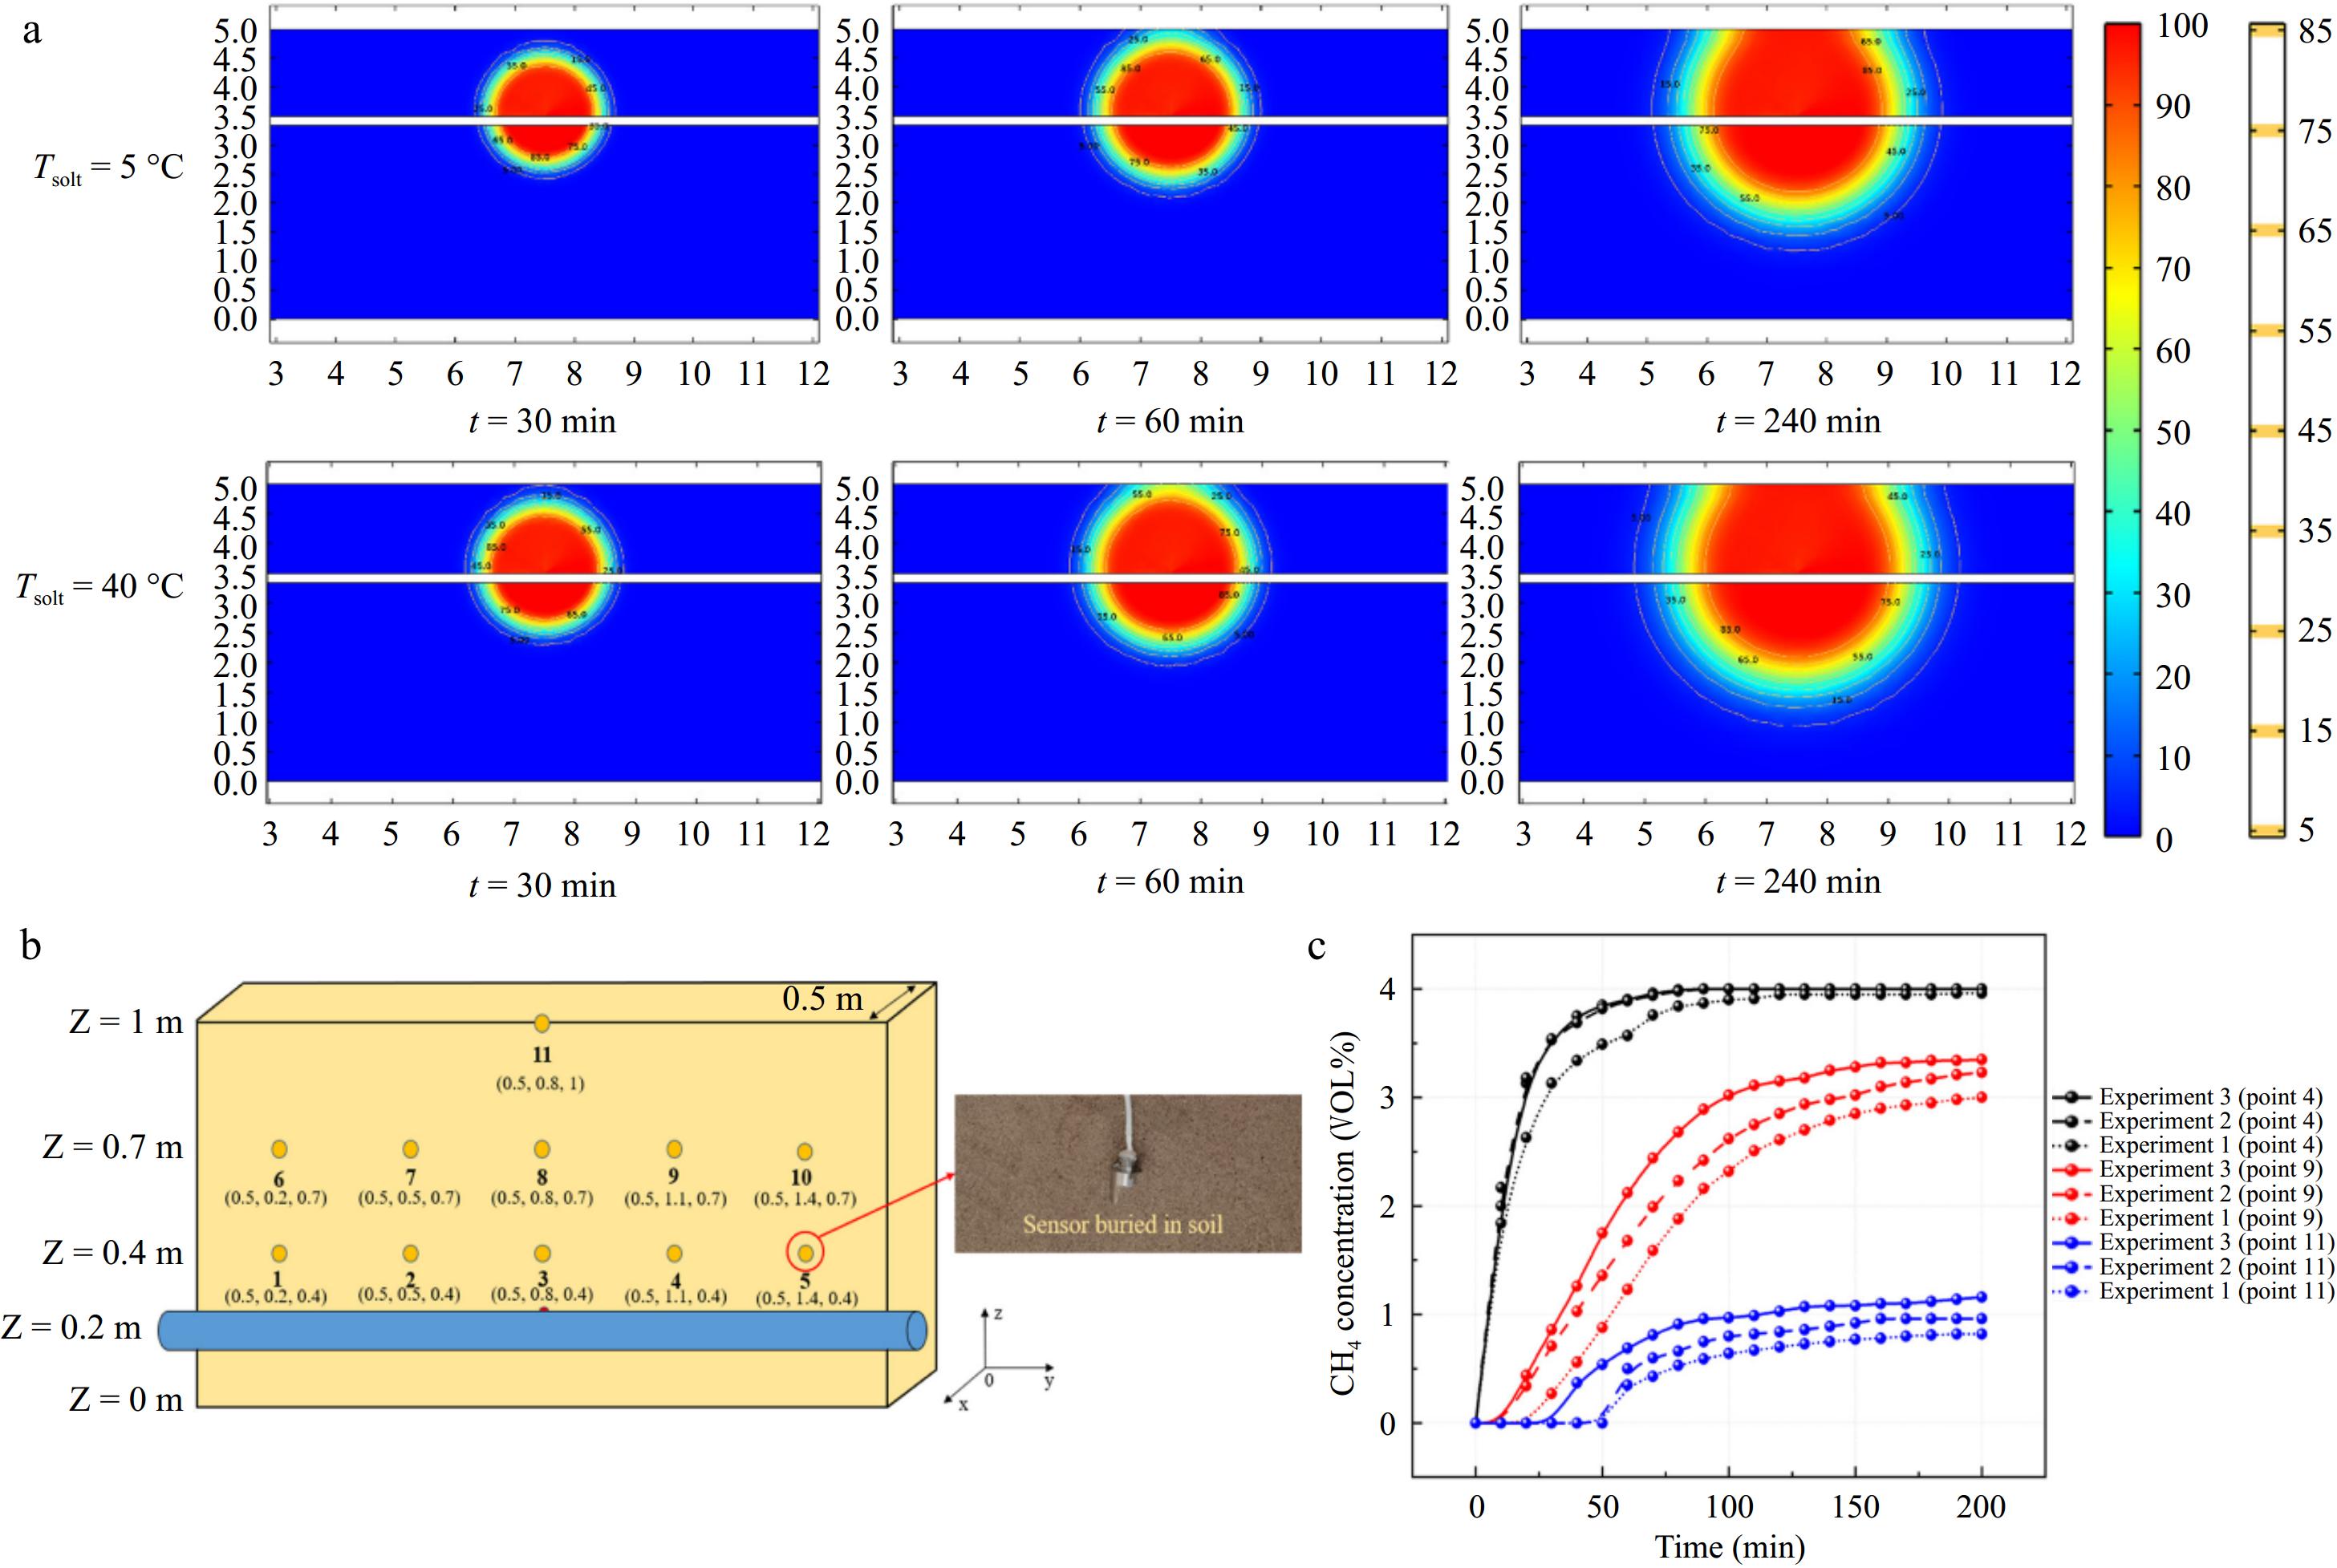
Figure 7.
(a) Contour of methane concentration changes with time at different soil temperatures obtained from simulations. (b) Layout and number of sensors. (c) Comparison of concentrations at different temperatures from experiments (Experiment 1: T = 5 °C, Experiment 2: T = 15 °C, Experiment 3: T = 25 °C)[20].
Additionally, Houssin-Agbomson et al.[19] conducted an experimental study to investigate how the type of gas released affects pipeline leak consequences, focusing on H2 and CH4. The results indicated that under similar conditions, the impacts and surface damage caused by different leaked gases are nearly identical upon release.
In addition to conventional CH4 pipelines, using existing CH4 transmission networks to transport H2 is becoming an important method for energy distribution. The potential effects of H2/CH4 leaks from buried pipelines are a significant research focus. Lu et al.[51] employed numerical simulations to examine the influence of H2-to-gas ratio, pipeline pressure, soil porosity, and leak diameter on the leakage and diffusion characteristics of buried H2/CH4 pipelines. Their findings revealed that as the H2 ratio increases, the time taken for monitoring points to trigger an alarm (when the combustible gas concentration exceeds 6%) becomes shorter (Fig. 8). The findings of Liu et al.[48], Li et al.[49], and Wang et al.[50] also validate this conclusion. Wang et al.[50] further discovered that as the hydrogen blending ratio increases, the gas leakage in the pipeline is accelerated. These phenomena are all due to the fact that H2 has a lower molecular mass compared to alkanes, which leads to a decrease in the overall molecular mass of the combustible gas mixture. This, in turn, increases the diffusion rate. Moreover, higher H2 ratios result in a broader diffusion range and faster leakage speed in the soil. Additionally, elevated pipeline pressure and higher leak flow rates lead to a quicker response time for monitoring points to detect the leak.
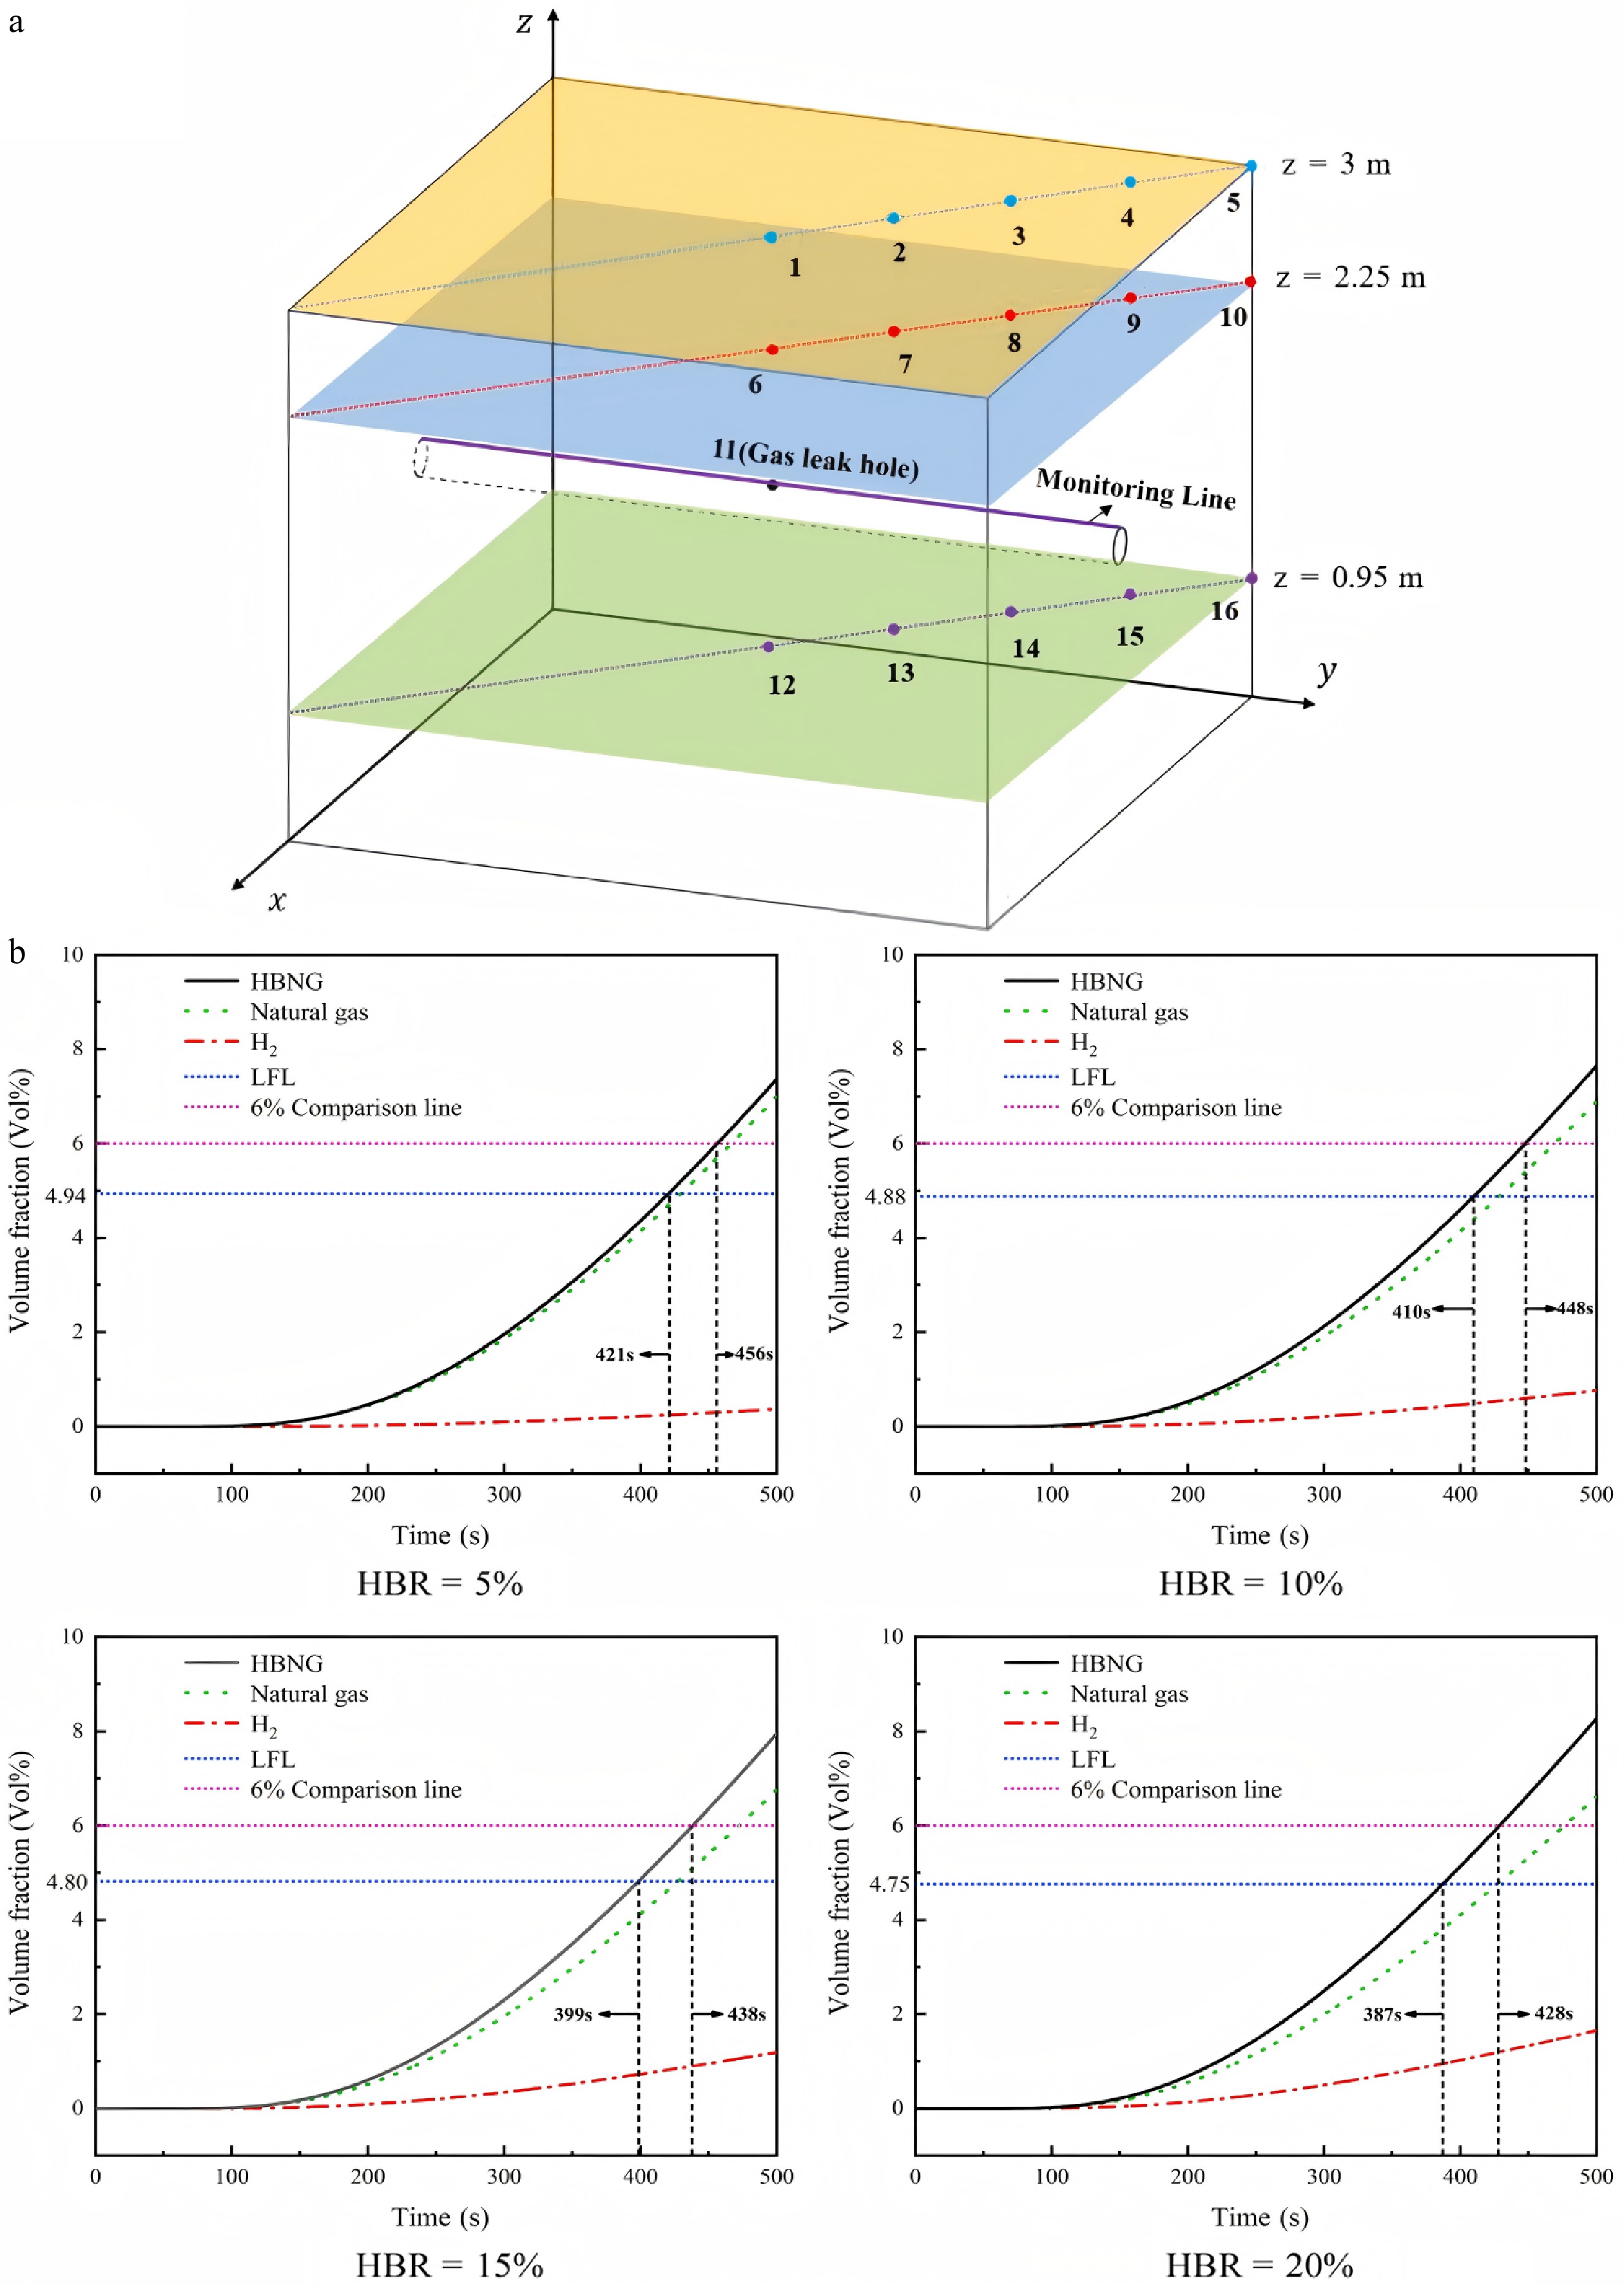
Figure 8.
(a) Layout of leakage ports and monitoring points. (b) Changes in the concentration of H2-doped CH4 at monitoring point 2 within 500 s[51].
Other researchers have also explored additional factors affecting the leakage of H2/CH4 pipelines. For instance, Wu et al.[51] investigated the impact of soil temperature, soil characteristics, and soil moisture content on the consequences of H2/CH4 leaks from buried pipelines. As shown in Fig. 9, their findings indicated that, within the same time frame, H2/CH4 diffused most rapidly in sand. This is due to the lower inertial and viscous resistance in sand compared to clay and loam. The impact of soil temperature on the diffusion of H2/CH4 was found to be minimal. However, as soil moisture content increased, the gas concentration detected at the same monitoring point continuously decreased.
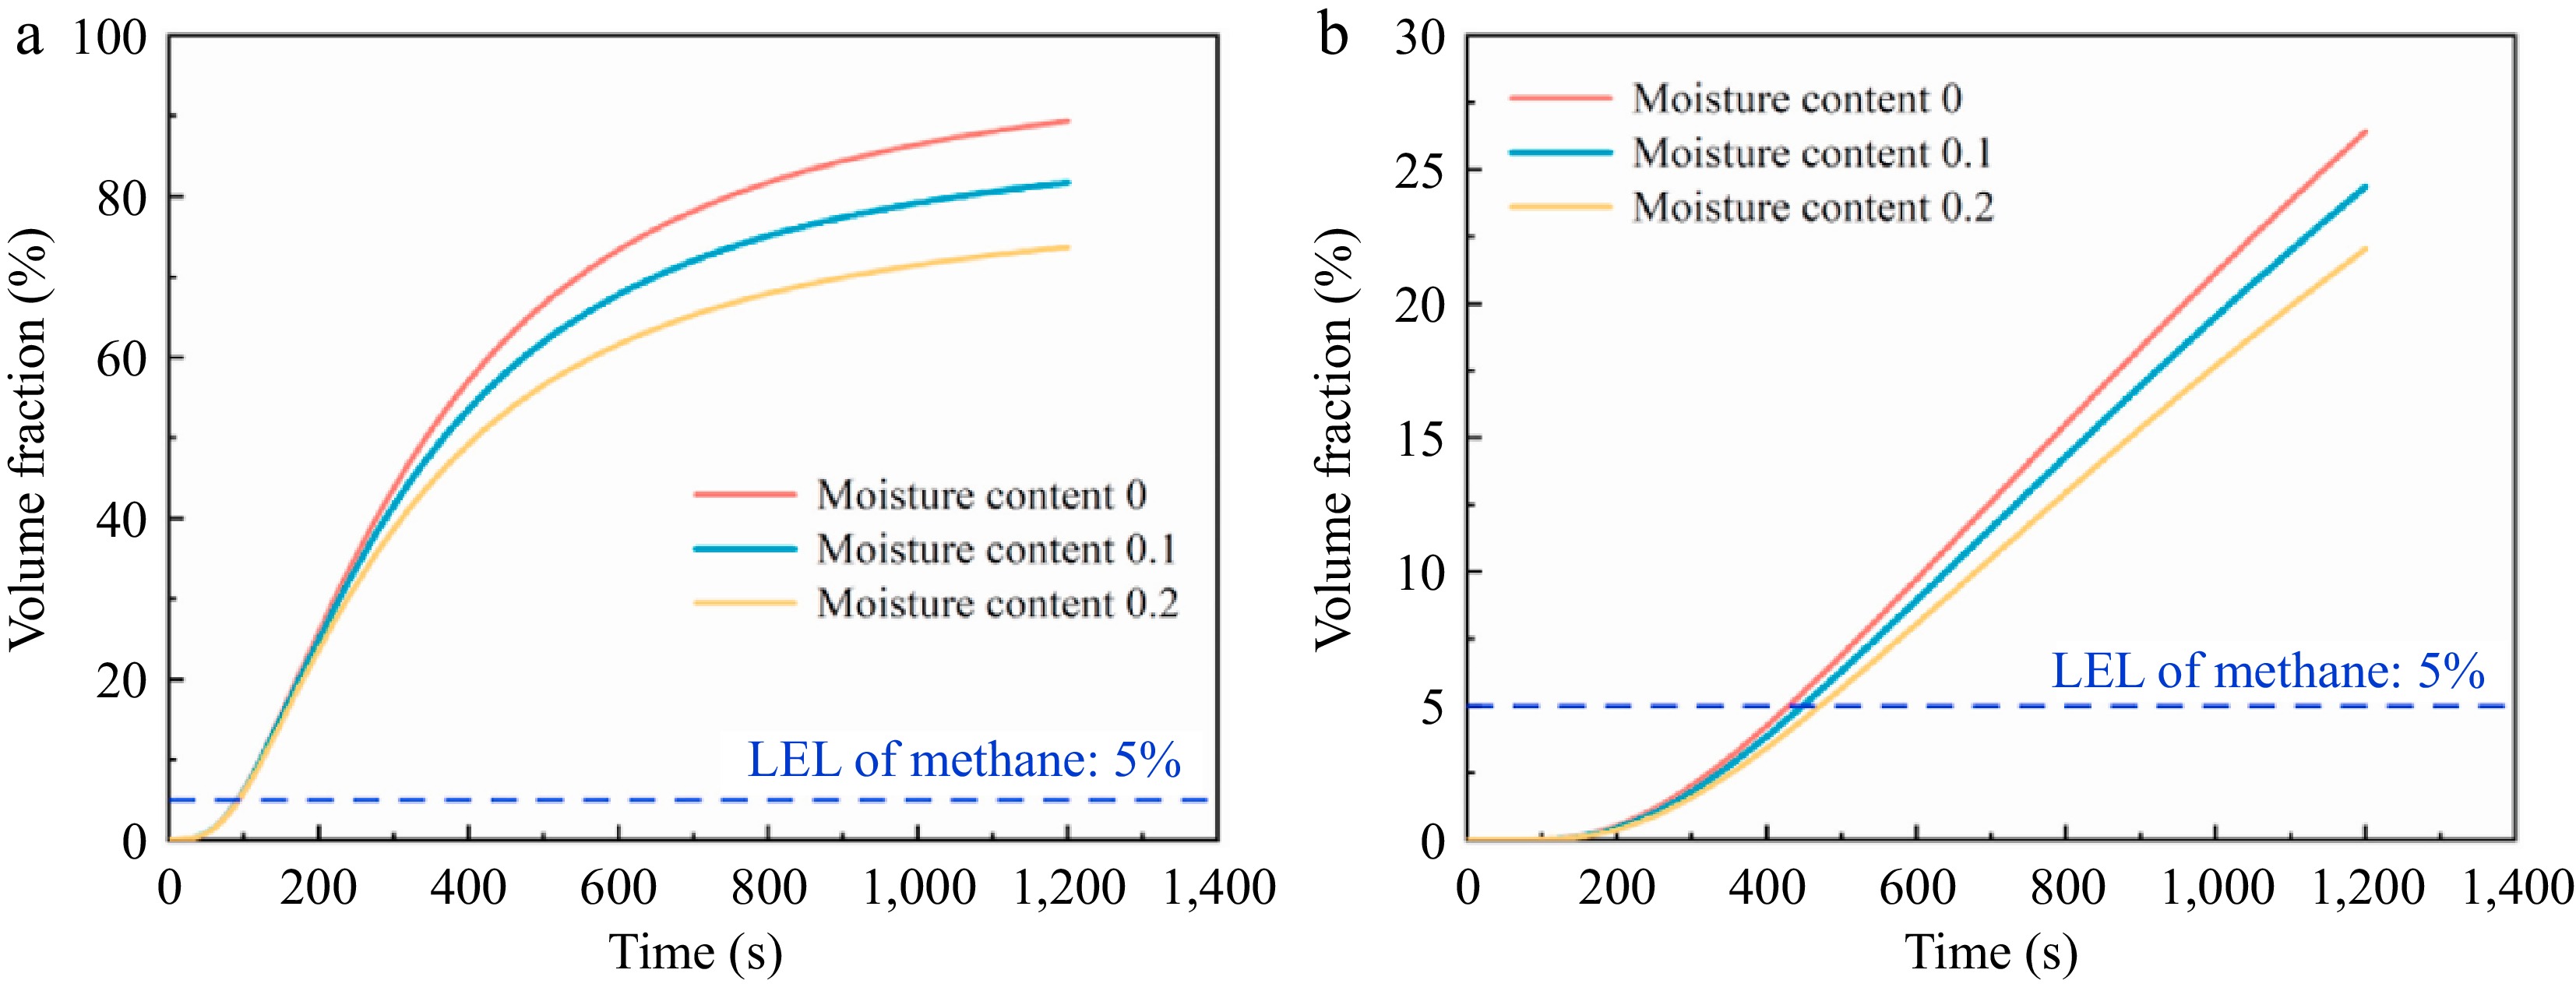
Figure 9.
Effect of soil moisture content on gas volume fraction. (a) and (b) present data from different monitoring points[52].
Subsea pipeline leak diffusion
-
Subsea pipelines are one of the critical components in the long-distance transportation of CH4. When it is necessary to transport extracted marine gas resources to land or other facilities via pipelines, subsea pipelines can significantly reduce transportation costs and enhance efficiency and safety[53]. Compared to buried pipelines, subsea gas pipelines are subject to fewer external destructive factors. However, they can still suffer from leakage and diffusion accidents due to seabed organisms, corrosion, passing vessels, seabed tectonic activities, and defects in design and manufacturing processes[54−56]. If the leaked gas is not promptly managed, it can often lead to severe consequences such as ecological damage, fire and explosion, and significant economic losses. Moreover, the management and monitoring of subsea CH4 pipeline leaks represent a complex field with relatively few research outcomes. Therefore, there is an urgent need to strengthen the study of the factors influencing leaks and their consequences. The following section lists representative research literature on the leakage and diffusion of combustible gas pipelines in subsea scenarios (Table 3), and provides a summary, discussion, and outlook on these studies.
Table 3. Research status of pipeline leakage and diffusion of CH4 and H2 and their mixtures in underwater scenarios.
Ref. Research subject Influencing factors Software model Research method Ellethy et al.[57] CH4 Leak orifice diameter, water depth ANSYS FLUENT Numerical simulation Wang et al.[58] CH4 Leak pressure, leak orifice diameter ANSYS FLUENT Numerical simulation Yang et al.[59] CH4 Leak point water depth, leak orifice diameter, leak pressure, ocean current speed ANSYS FLUENT Numerical simulation Chai et al.[60] CH4 Leak orifice diameter, leak rate, water flow velocity ANSYS FLUENT Numerical simulation Wang et al.[61] CH4 Leak rate, water depth ANSYS FLUENT Numerical simulation Ji et al.[21] CH4 Leak velocity, leak orifice diameter, water flow velocity ANSYS FLUENT Numerical simulation Li et al.[62] CH4 Leak velocity, water depth, water flow velocity, leak location ANSYS FLUENT Numerical simulation Yousef Abdulhafed et al.[63] CH4 Leak orifice diameter ANSYS FLUENT Numerical simulation Peng et al.[37] CH4 Leak orifice depth, leak flow rate ANSYS FLUENT Numerical simulation, experiment Cassano et al.[34] CH4 Release depth, release flow rate, ocean current, wind speed ANSYS FLUENT Numerical simulation Zhang et al.[64] CH4 Leak orifice diameter, leak pressure ANSYS FLUENT Numerical simulation Liu et al.[65] CH4 Pressure, leak orifice diameter, water depth ANSYS FLUENT Experiment, numerical simulation Lin et al.[66] CH4 Leak orifice diameter, different leak positions ANSYS FLUENT Numerical simulation Zhang et al.[36] CH4 Water depth, leak orifice diameter, leak pressure / Experiment Zhang et al.[67] CH4 Leak orifice diameter / Experiment Zhu et al.[22] CH4 Leak point water depth, leak orifice diameter, leak pressure / Experiment Researchers primarily employed two methods-numerical simulation and experimental techniques to conduct their investigation. Yang et al.[59] employed numerical simulations to explore the effects of factors such as water depth at the leak point, diameter of the leak orifice, leak pressure, and ocean current speed on the consequences of subsea CH4 pipeline leakage and diffusion. Their study revealed that when CH4 enters the seawater, it forms a gas cloud that rises continuously due to the pressure inside the pipeline and the buoyancy of the seawater. As more CH4 is released, it disturbs the seawater, causing the gas cloud to gradually assume a mushroom shape. However, as a result of the interaction between the gas and liquid phases, the gas cloud eventually breaks into smaller bubbles that float and spread towards the sea surface. The conclusion of this study is similar to that of Zhang et al.[36], who found that the leakage bubbles form a conical structure from the release point to the water surface, and both the leak hole diameter and leak pressure have a significant impact on the radial diameter of this conical structure. Furthermore, Chai et al.[60] discovered that as the gas cloud nears the sea surface, the decreasing pressure in the seawater makes it more challenging for the gas to accumulate, leading to the fragmentation of the gas cloud into smaller pieces. Additionally, Yang et al.[59] found that the higher the pipeline pressure, the quicker the gas will reach the surface. The deeper the leak orifice, the longer it takes for the CH4 to reach the surface. An increase in the diameter of the leak orifice also leads to a higher amount of CH4 being released, as well as an increased ascent velocity and a wider spread towards the surface (Fig. 10). Ocean current speed primarily influences the lateral movement of the leaked gas in the direction of the water flow; the faster the current, the further the CH4 is transported from the leak orifice to the sea surface. The conclusion of this study is consistent with the findings of Ji et al.[21]. In addition, Ji et al.[21] also found that at lower natural gas leakage rates, the effect of the current on the lateral diffusion of gas is significantly greater than at higher leakage rates.
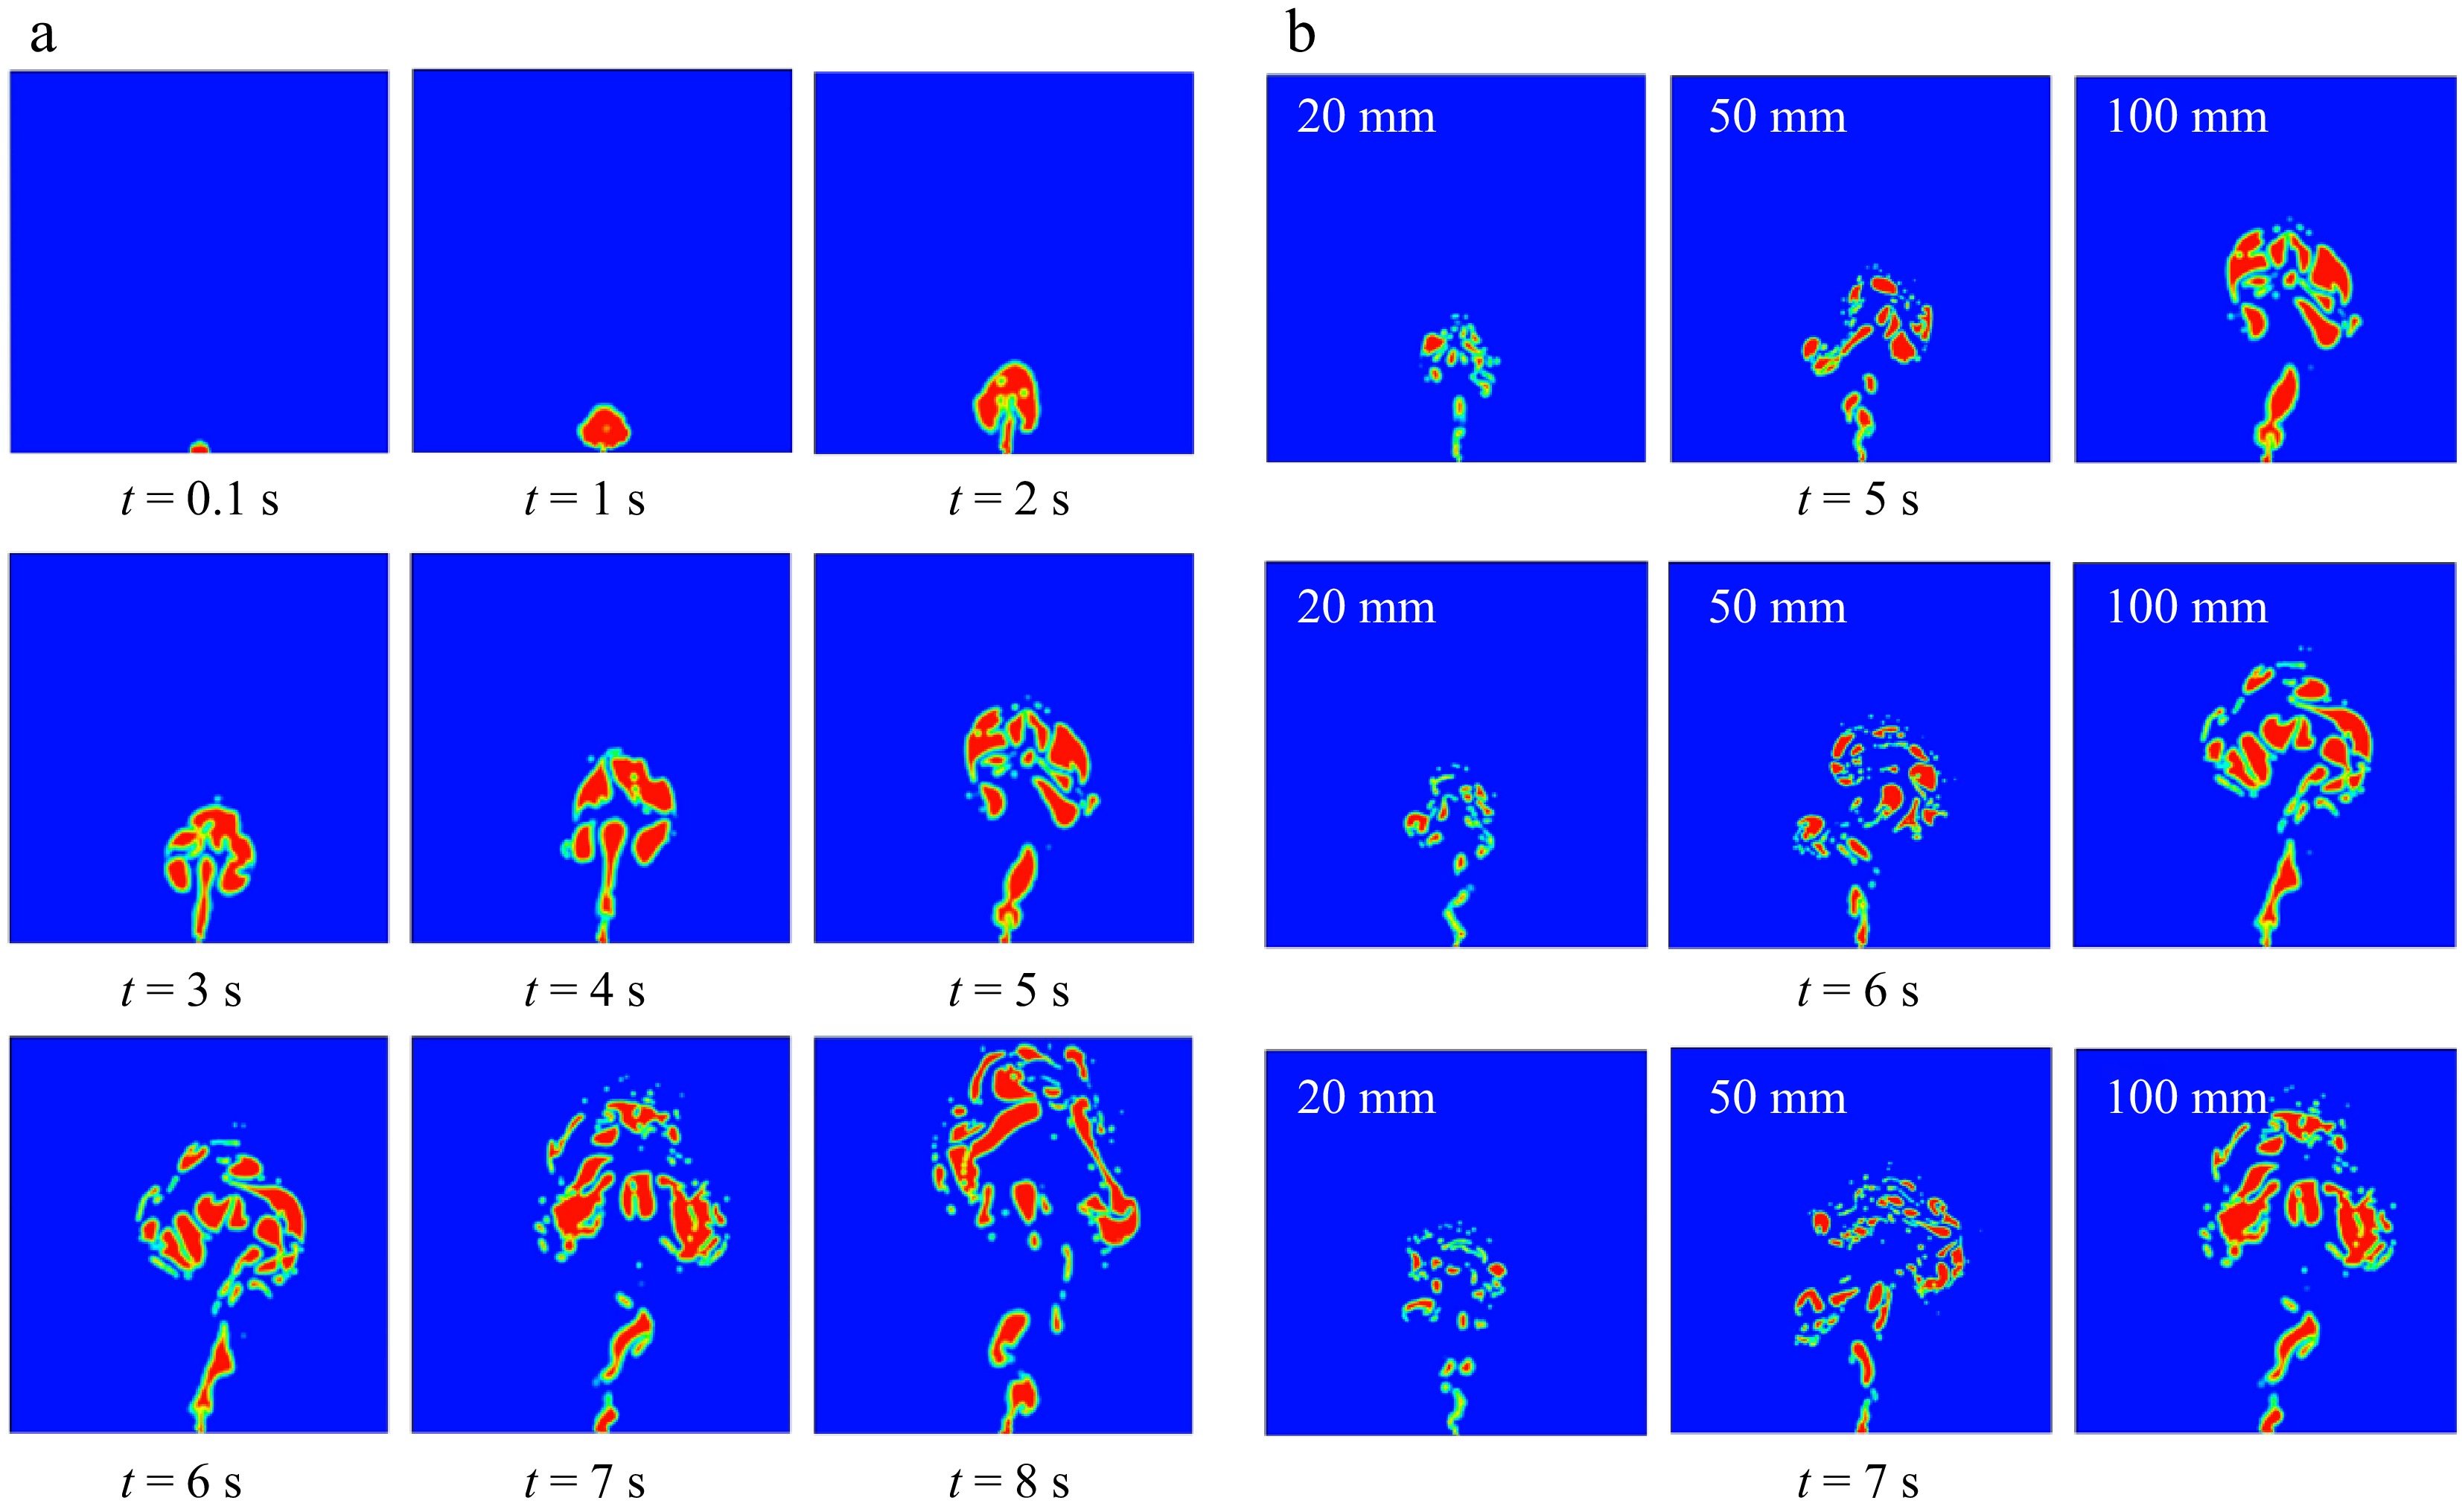
Figure 10.
(a) Gas leakage and diffusion from a submarine pipeline over time. (b) Gas leakage and diffusion over time for leak apertures of 20, 50, and 100 mm, respectively[59].
Li et al.[62] performed numerical simulations to assess the influence of factors like gas release rate, ocean current speed, and leak location on subsea CH4 pipeline leaks. They evaluated these factors using parameters such as the time it takes for the gas to reach the liquid surface, the diffusion radius of the gas in the sea, and the distance it travels. As illustrated in Fig. 11, their study showed that as the gas release rate increases, the ascent time decreases significantly, while the diffusion radius expands and the horizontal diffusion distance contracts. Ji et al.[21] and Cassano et al.[34] reached the same conclusion when studying the effect of current velocity on the horizontal diffusion of leaked gas. This occurs because ocean currents primarily affect the horizontal movement of the gas cloud; gas released at higher rates has more kinetic energy, resulting in a more vertical ejection path until it reaches the sea surface, thus reducing the effect of ocean currents as the release rate rises. As ocean current speed increases, both the ascent time and horizontal diffusion distance increase in proportion to the current speed, though the diffusion area shows irregular changes with rising current speed. Their analysis of leak location effects indicated that, assuming the subsea pipeline is laid perpendicular to the ocean current, gas released from the left side (downstream), top (free release), or right side (upstream) of the pipeline initially gains velocity in the direction of the current. Consequently, it travels a greater horizontal distance before dispersing.
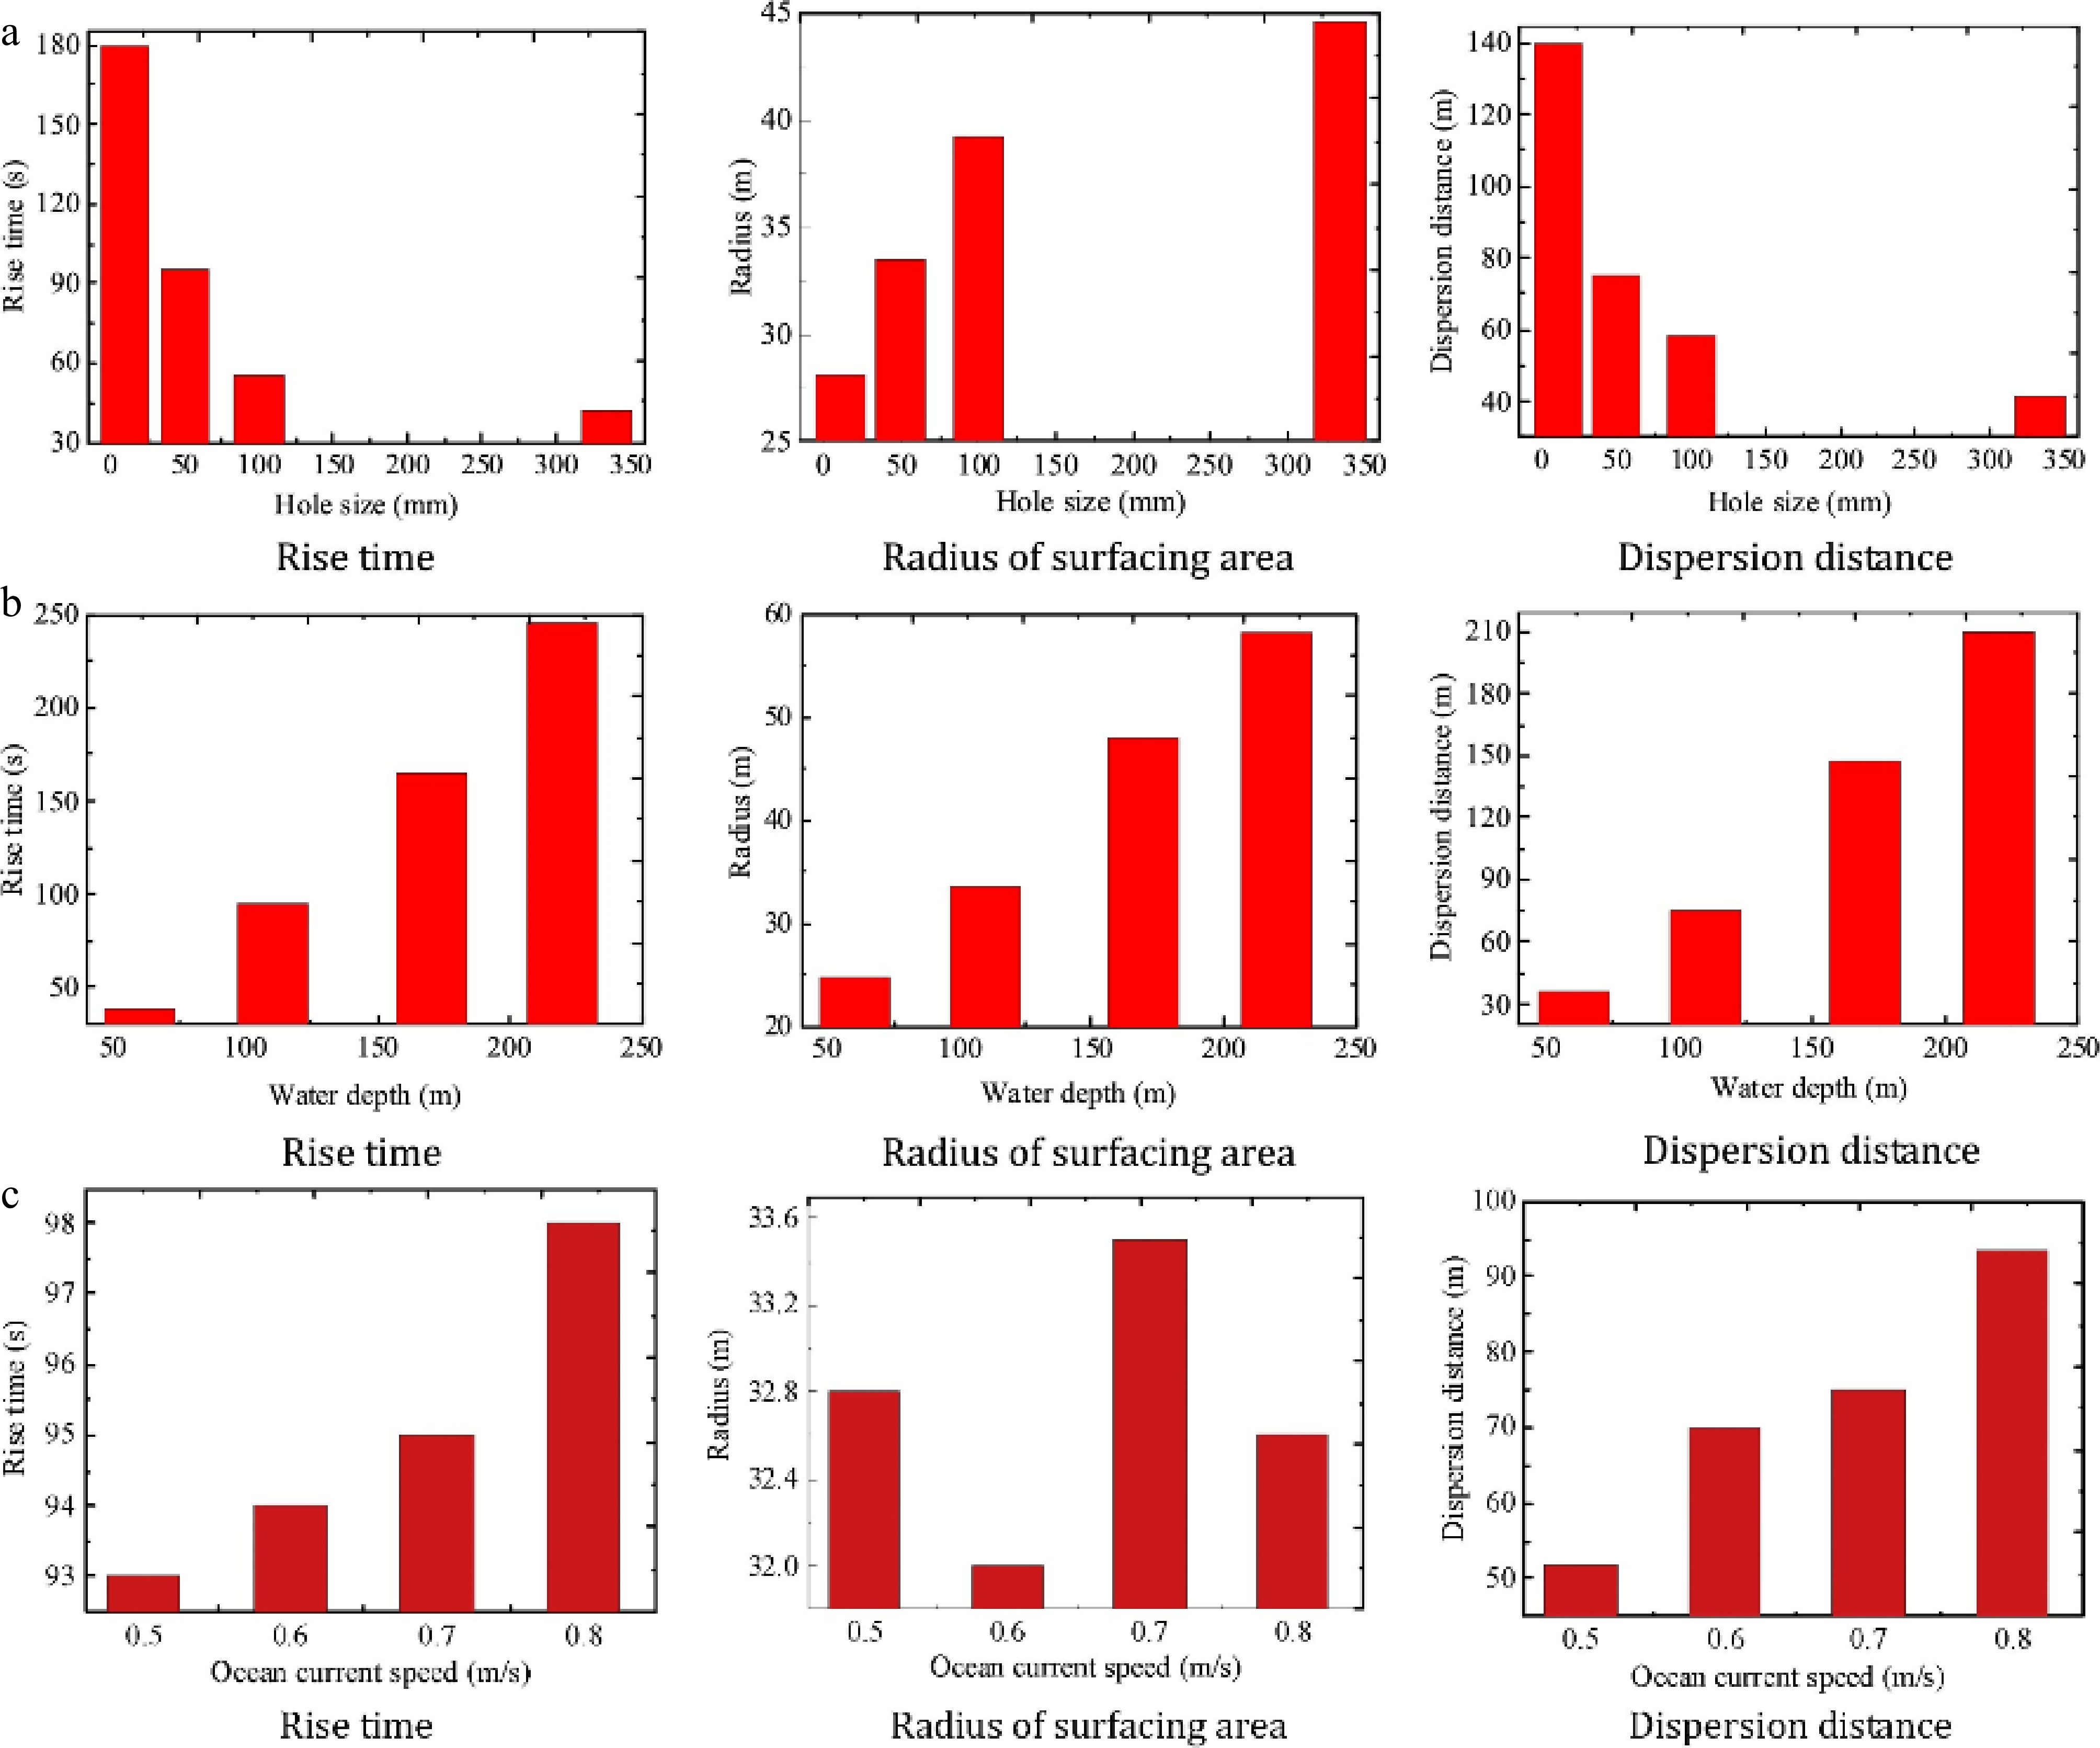
Figure 11.
(a) Comparison of gas diffusion parameters at different leakage depths. (b) Comparison of gas diffusion parameters at different ocean velocities. (c) Comparison of gas diffusion parameters at different release rates[62].
Wang et al.[61] expanded on previous studies and developed a quantitative relationship between the width and axial diffusion velocity of the gas plume from a subsea CH4 pipeline leak, the leak flow rate, and the water depth at the leak point[61]. They used numerical simulations to validate the accuracy of the formulas.
$ \tilde{z}=\dfrac{z}{{H}_{\mathrm{v}}+{H}_{\mathrm{p}}} $ (21) $ \tilde{b}=\dfrac{b}{2\alpha \left({H}_{\mathrm{v}}+{H}_{\mathrm{p}}\right)} $ (22) $ \tilde{v}=v{\left(\dfrac{1+{\lambda }^{2}}{2{\text π} \gamma {\alpha }^{2}}\dfrac{g{Q}_{\mathrm{g}}}{{H}_{\mathrm{v}}+{H}_{\mathrm{p}}}\right)}^{-1/3} $ (23) In these equations, g represents gravitational acceleration; QB is the gas volumetric flow rate; Hv refers to the water depth; Hp denotes the water depth at atmospheric pressure, which is 10.33 m in clear water and slightly less than 10 m in seawater under standard atmospheric conditions; γ is the momentum amplification coefficient; α is the entrainment coefficient; λ is the width ratio; v is the slip velocity;
$ \tilde{s}=(1+{\lambda }^{2}){\tilde{v}}_{\mathrm{s}} $ $ \tilde{z},\;\tilde{b} $ $ \tilde{v} $ Table 4. Recommended empirical parameters[61].
Ji et al.[21] conducted a numerical simulation study on the impact of multiple underwater leak orifices on the consequences of leakage. The research found that when the leak orifices are arranged along the direction of the ocean current, the strong turbulent motion at the upstream leak orifice due to the interaction between several orifices leads to an increase in the horizontal component of the seawater velocity. This horizontal kinetic energy affects the horizontal velocity of the gas cloud leaking from the downstream orifice, thereby increasing the diffusion range of the CH4, as shown in Fig. 12.
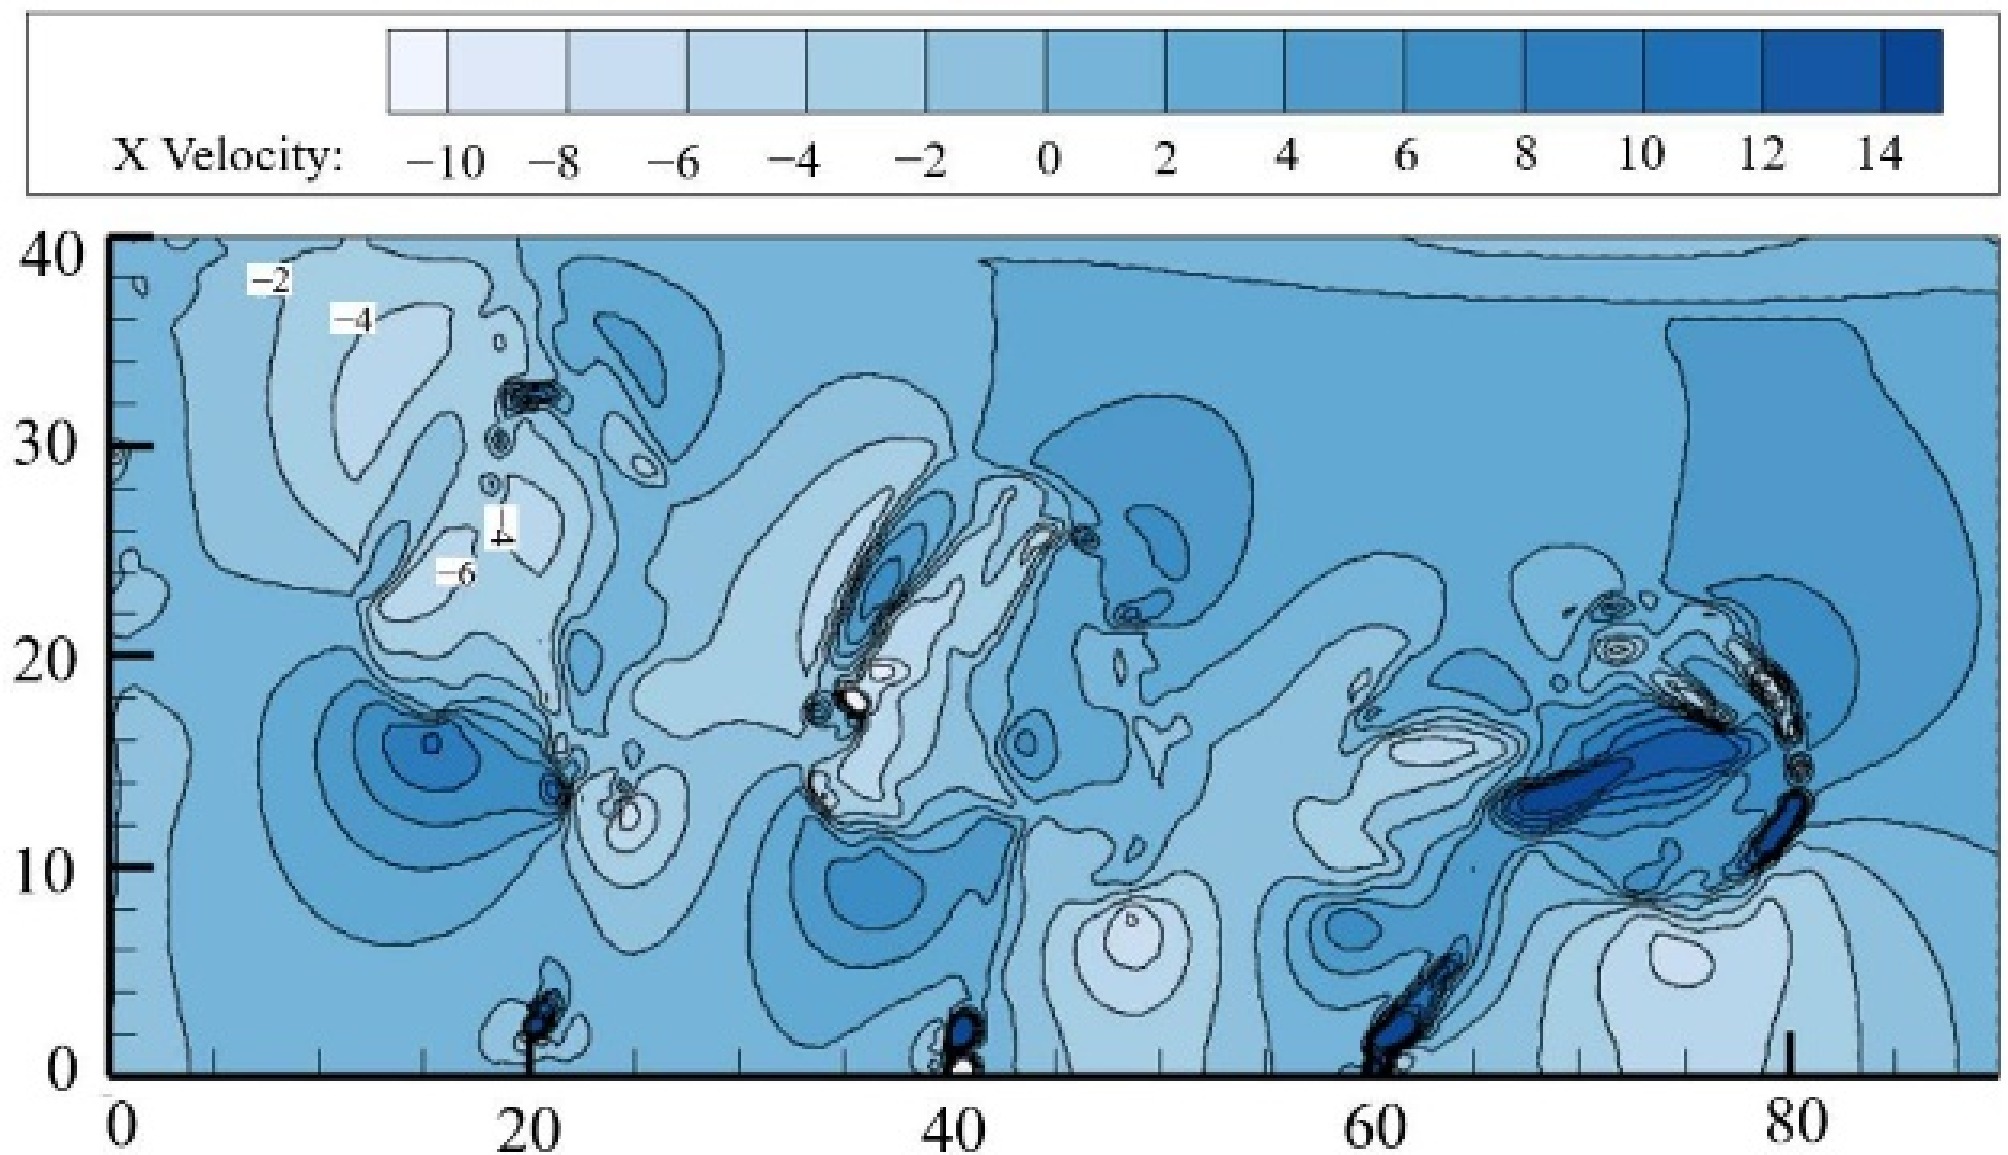
Figure 12.
The morphology of methane plumes under porous leakage[21].
In addition to numerical simulations, a few experimental studies were conducted to validate the simulation results. For example, Zhang et al.[67] applied experimental techniques to assess the impact of water depth, leak orifice size, and leak pressure on the consequences of subsea liquefied CH4 (LNG) pipeline leakage and diffusion. The study showed that for rectangular leak orifices, a larger aspect ratio (length-to-width ratio) results in a greater angle of the gas jet, which in turn leads to a wider gas diffusion range to the surface, as seen in Fig. 13a, Zhang et al.[36] further studied the consequences of natural gas leakage from a circular leak hole and similarly found that the larger the leak hole diameter, the greater the gas jet angle. The research also found that when a fire occurs on the surface due to combustible gas, the ratio of flame height Hf to the radius of the flame coverage area D increases with the leak orifice diameter and flow rate, as shown in Fig. 13b.
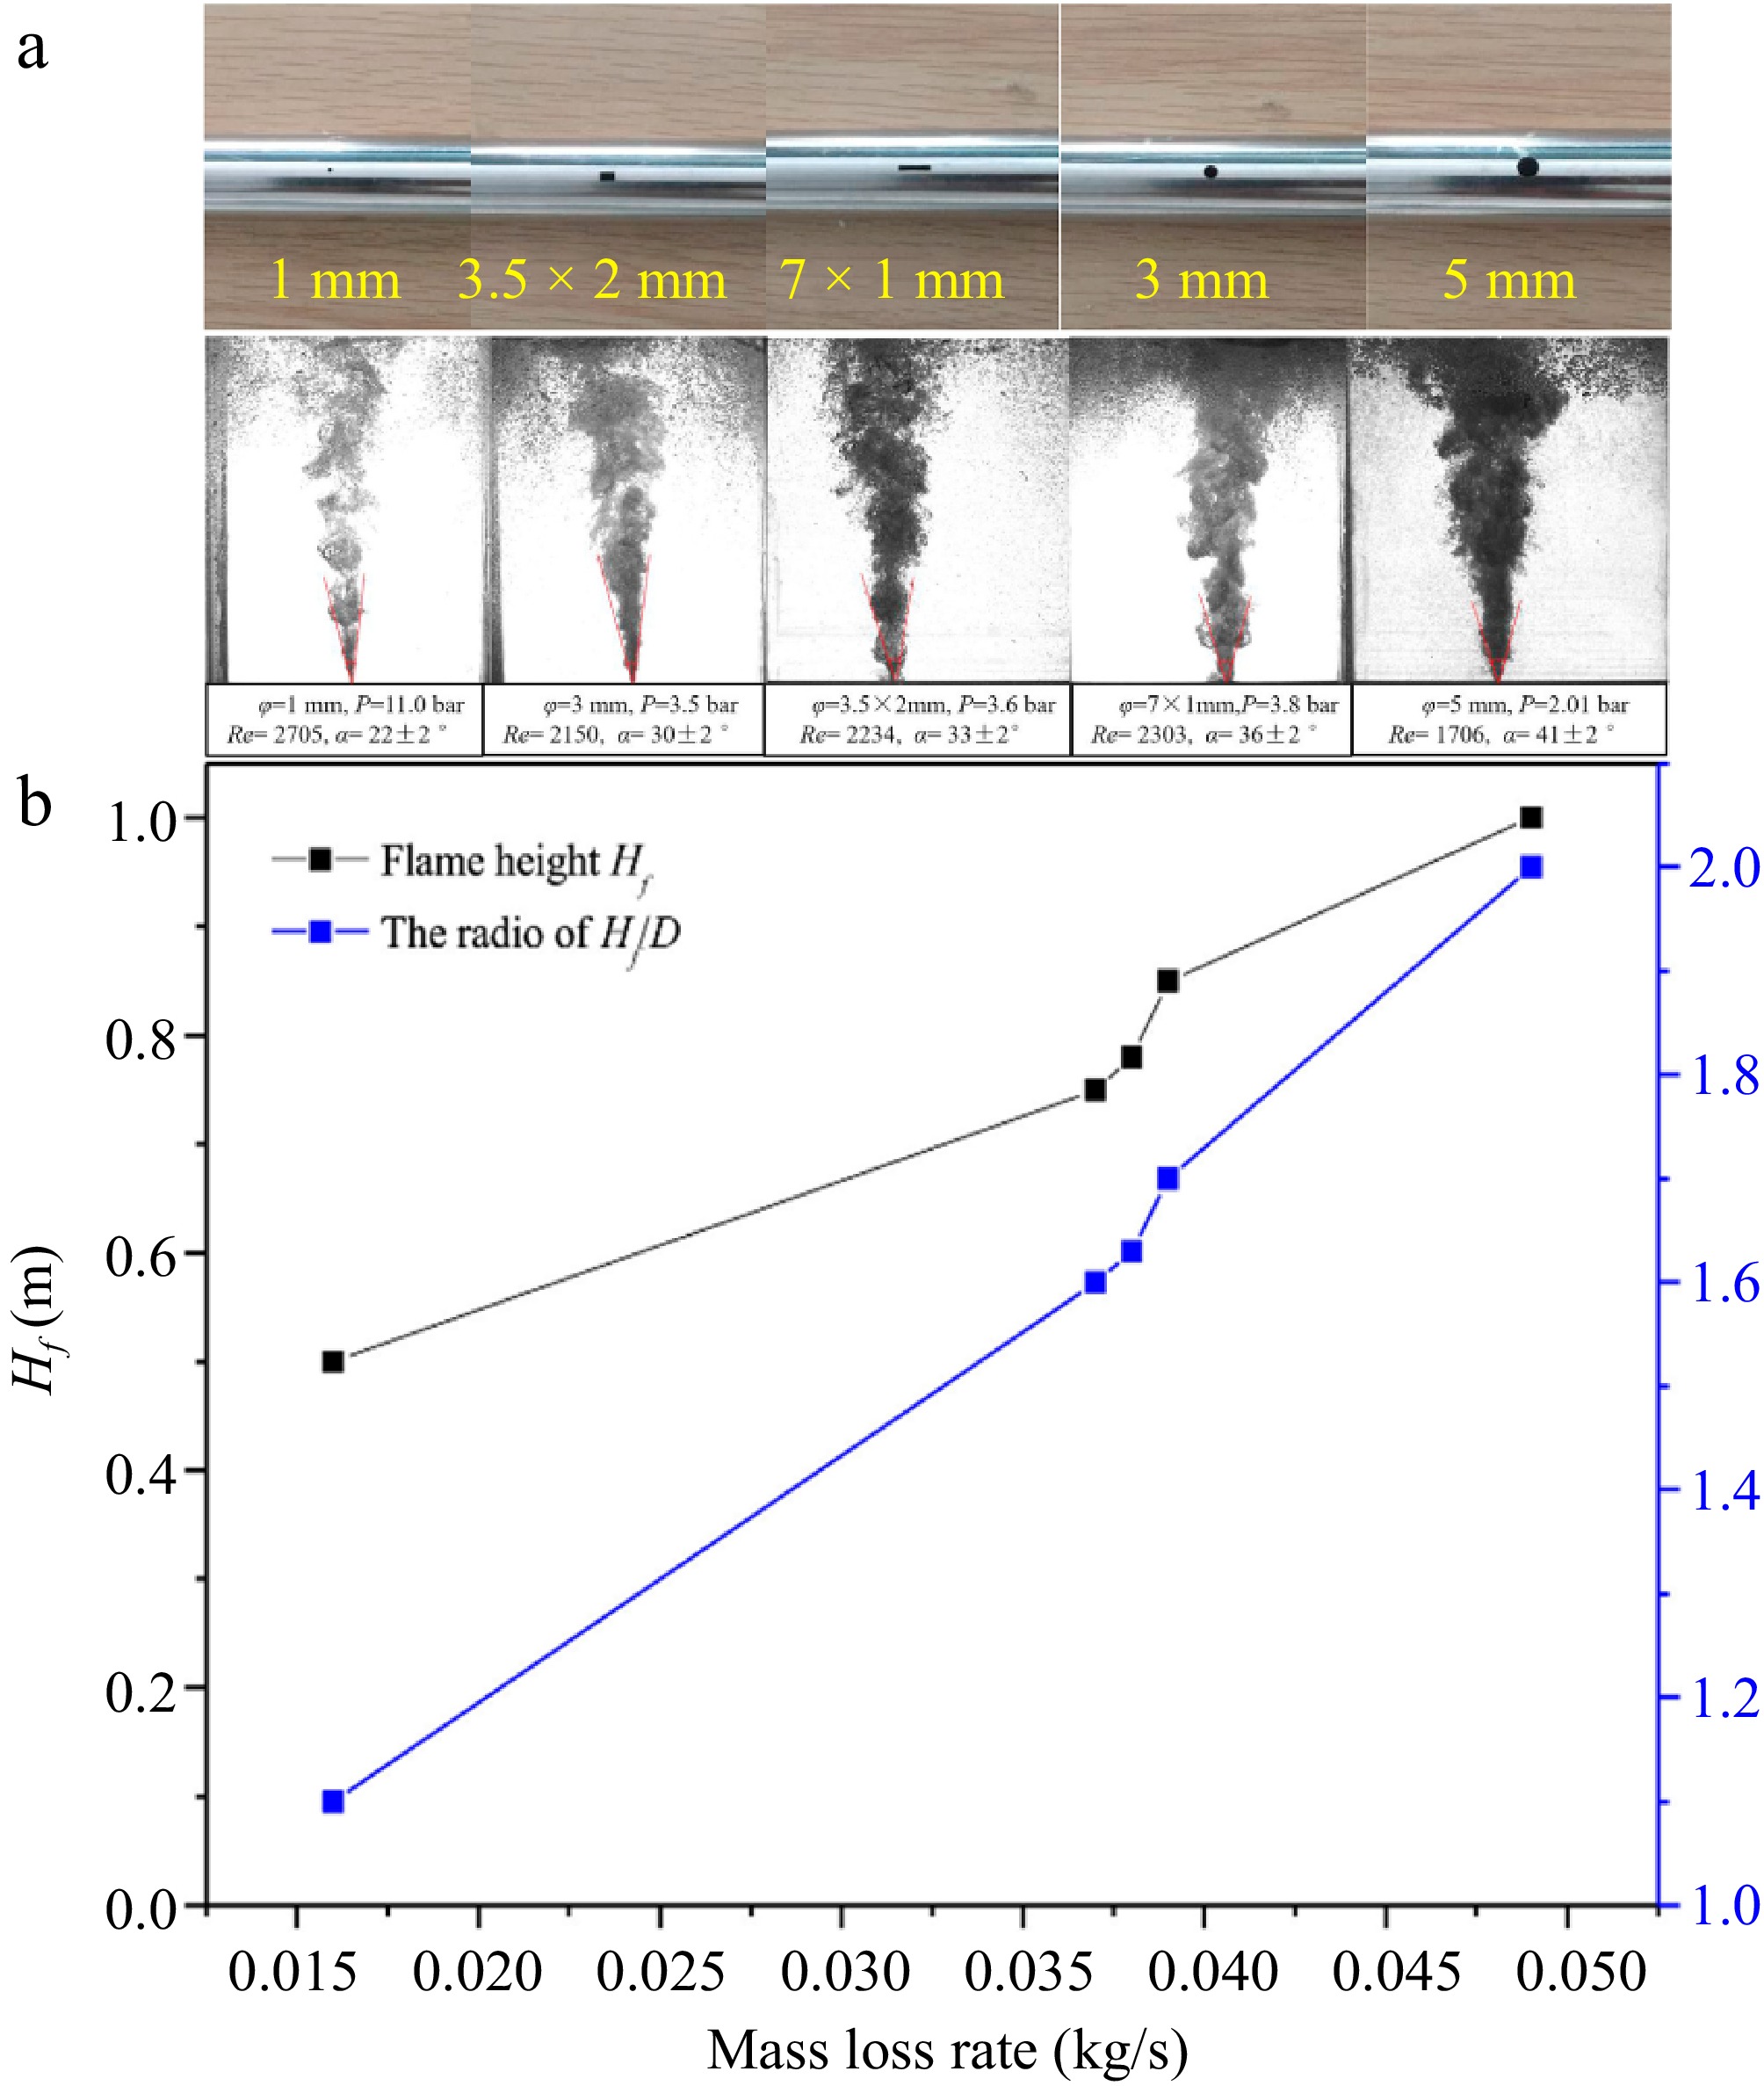
Figure 13.
(a) Different leakage apertures and their leakage gas jet states. (b) Flame height and Hf/D along with the change of mass loss[67].
Zhu et al.[22] utilized experimental methods to investigate the impact of leak point water depth, leak orifice size, and leak pressure on the consequences of subsea CH4 pipeline leakage and diffusion. As shown in Fig. 14, the study found that under high-pressure conditions, smaller leak orifice sizes result in discontinuous combustion flames when the leaked gas burns at the water surface. This may be due to the smaller leak orifice diameter leading to a smaller amount of leaked gas, which is insufficient to support sustained combustion. However, as the leak orifice size increases, a stable, continuous conical flame structure appears. The conclusion of this study is consistent with the findings of Peng et al.[37]. In addition, Peng et al.[37] also found that an increase in leak hole depth leads to a shorter flame duration. Under certain conditions, when the depth exceeds a certain value, a stable flame cannot form on the liquid surface.
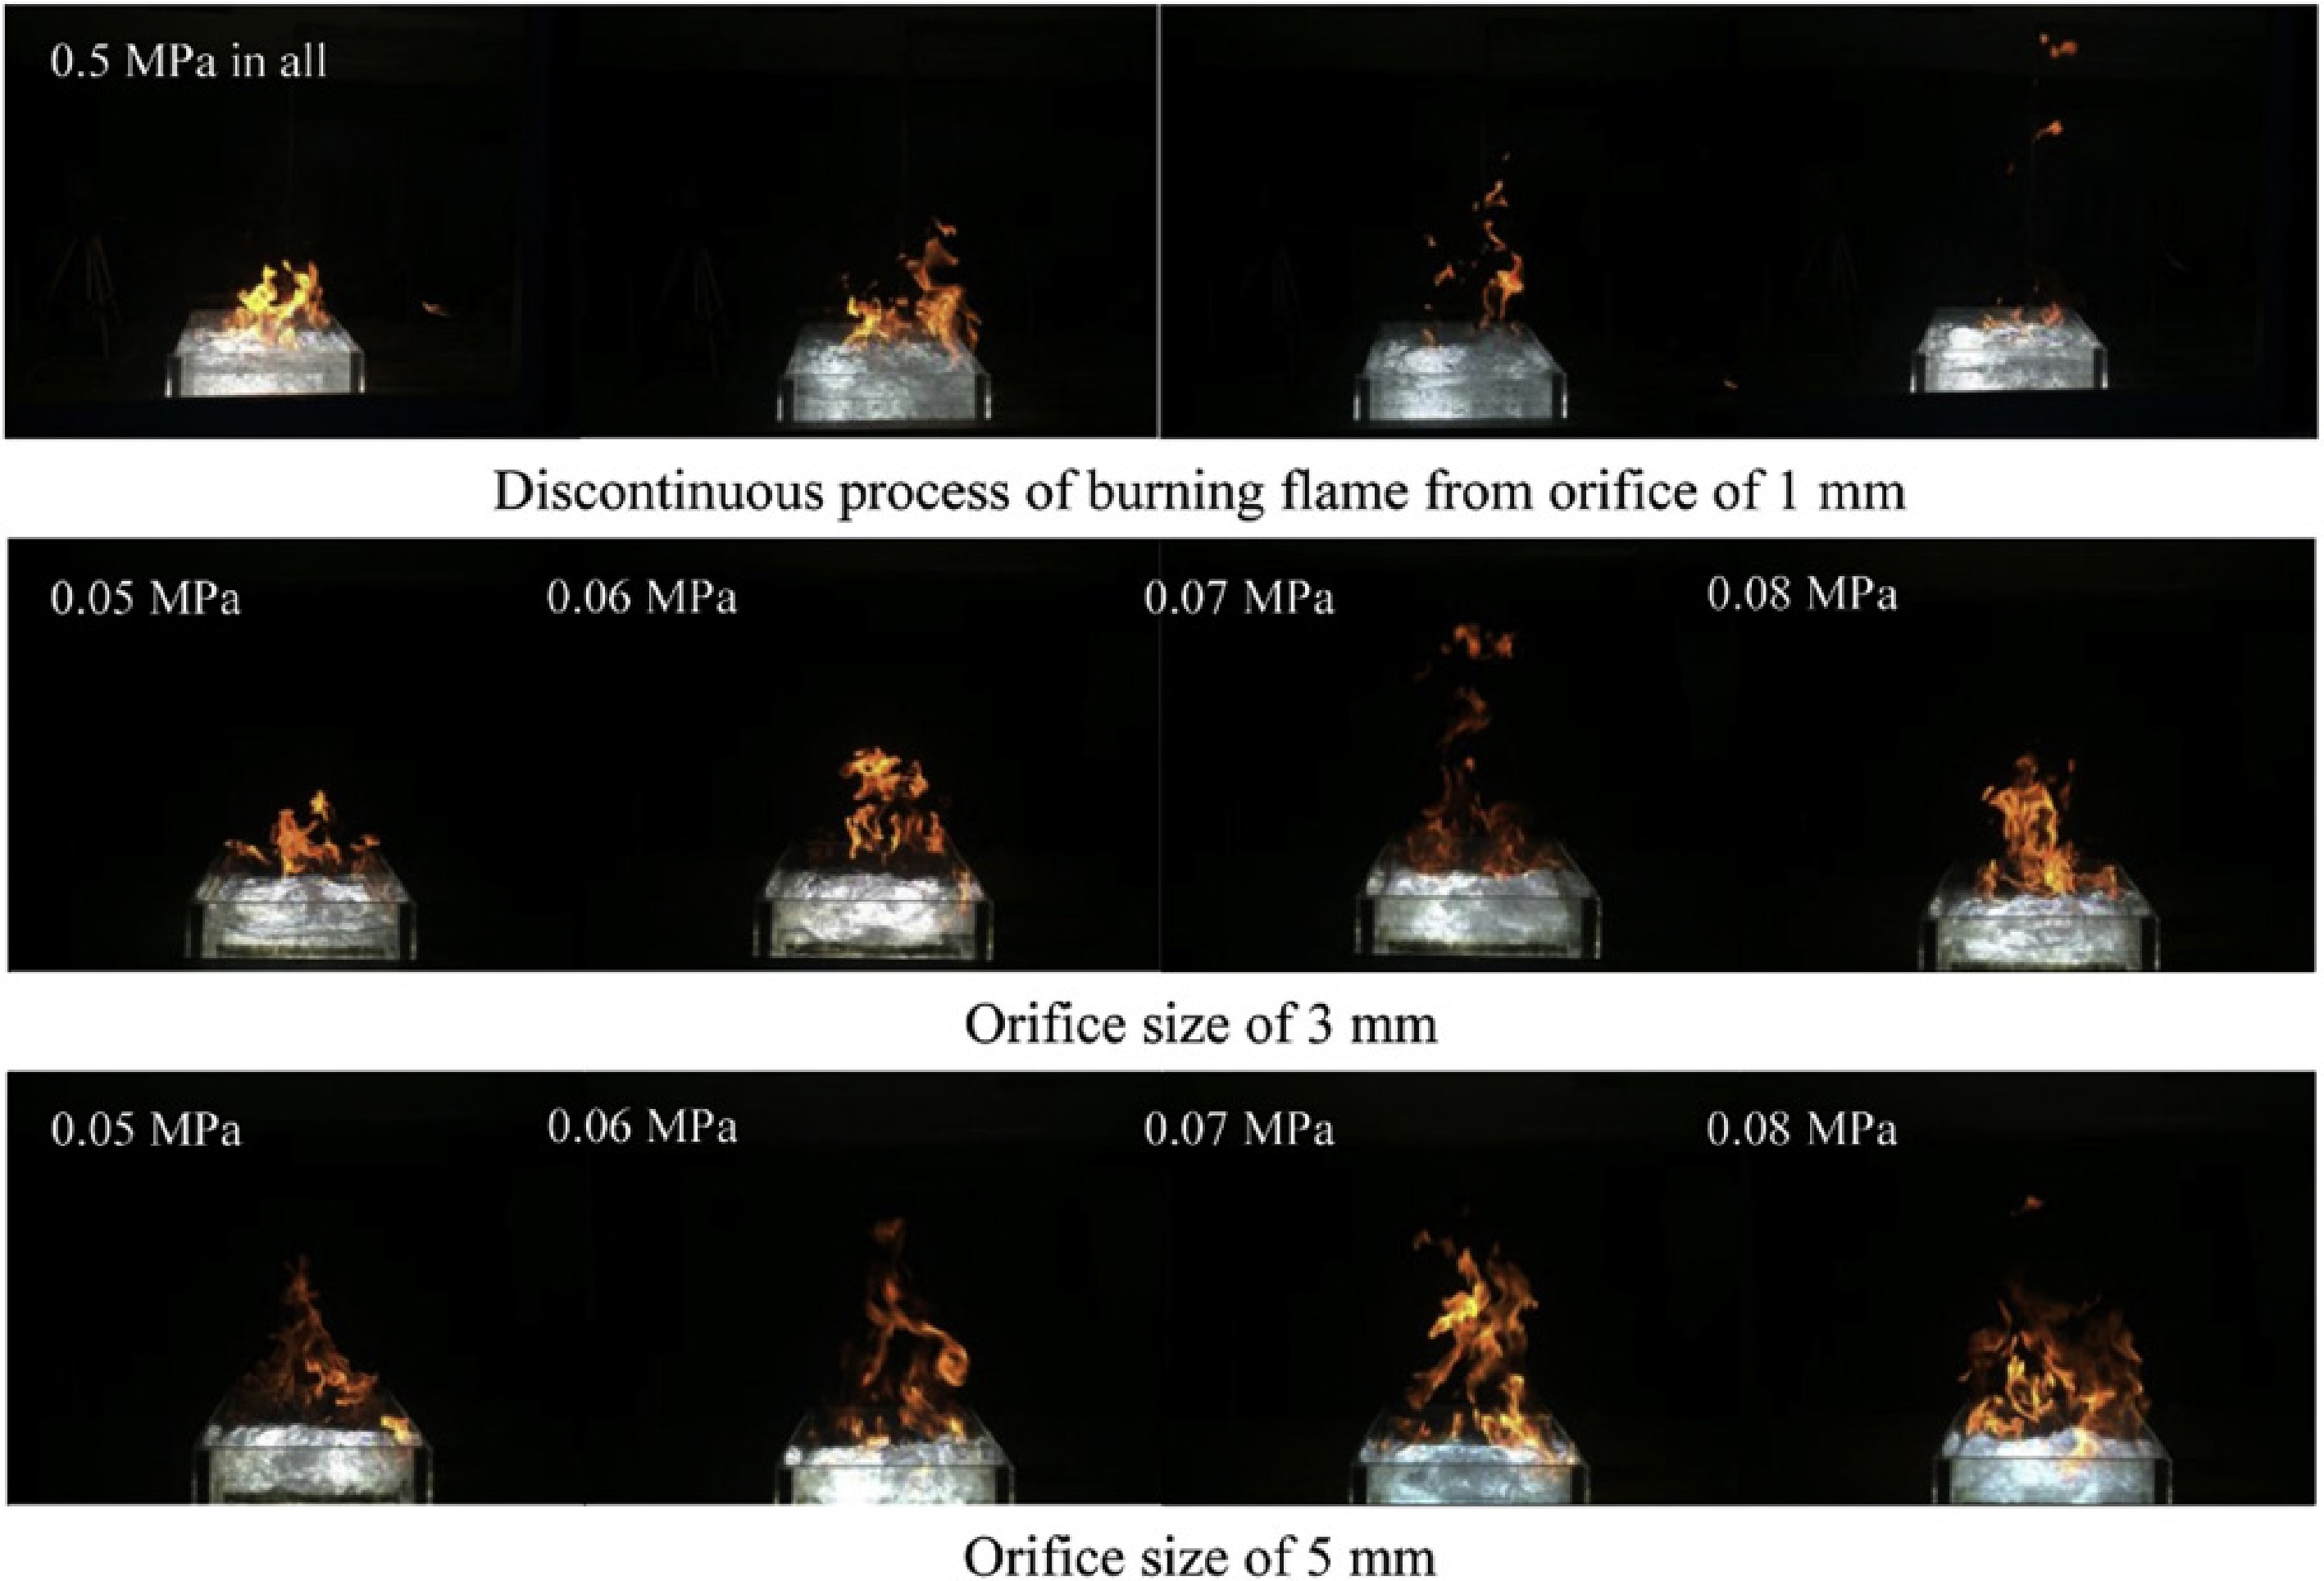
Figure 14.
CH4 burns a flame on the water surface after leaking at different apertures and pressures[22].
Liu et al.[65] used experimental methods to examine the evolution of bubble plumes formed by CH4 leaks underwater. Their results showed that the plume radius increases with higher pressure, deeper water, and larger leak orifice diameters. This occurs because an increase in the leak orifice diameter and leak pressure boosts the initial flow rate and the kinetic energy of the gas leakage. Furthermore, the deeper the leak point, the longer the gas takes to diffuse, all of which lead to an increase in the bubble radius, as illustrated in Fig. 15.
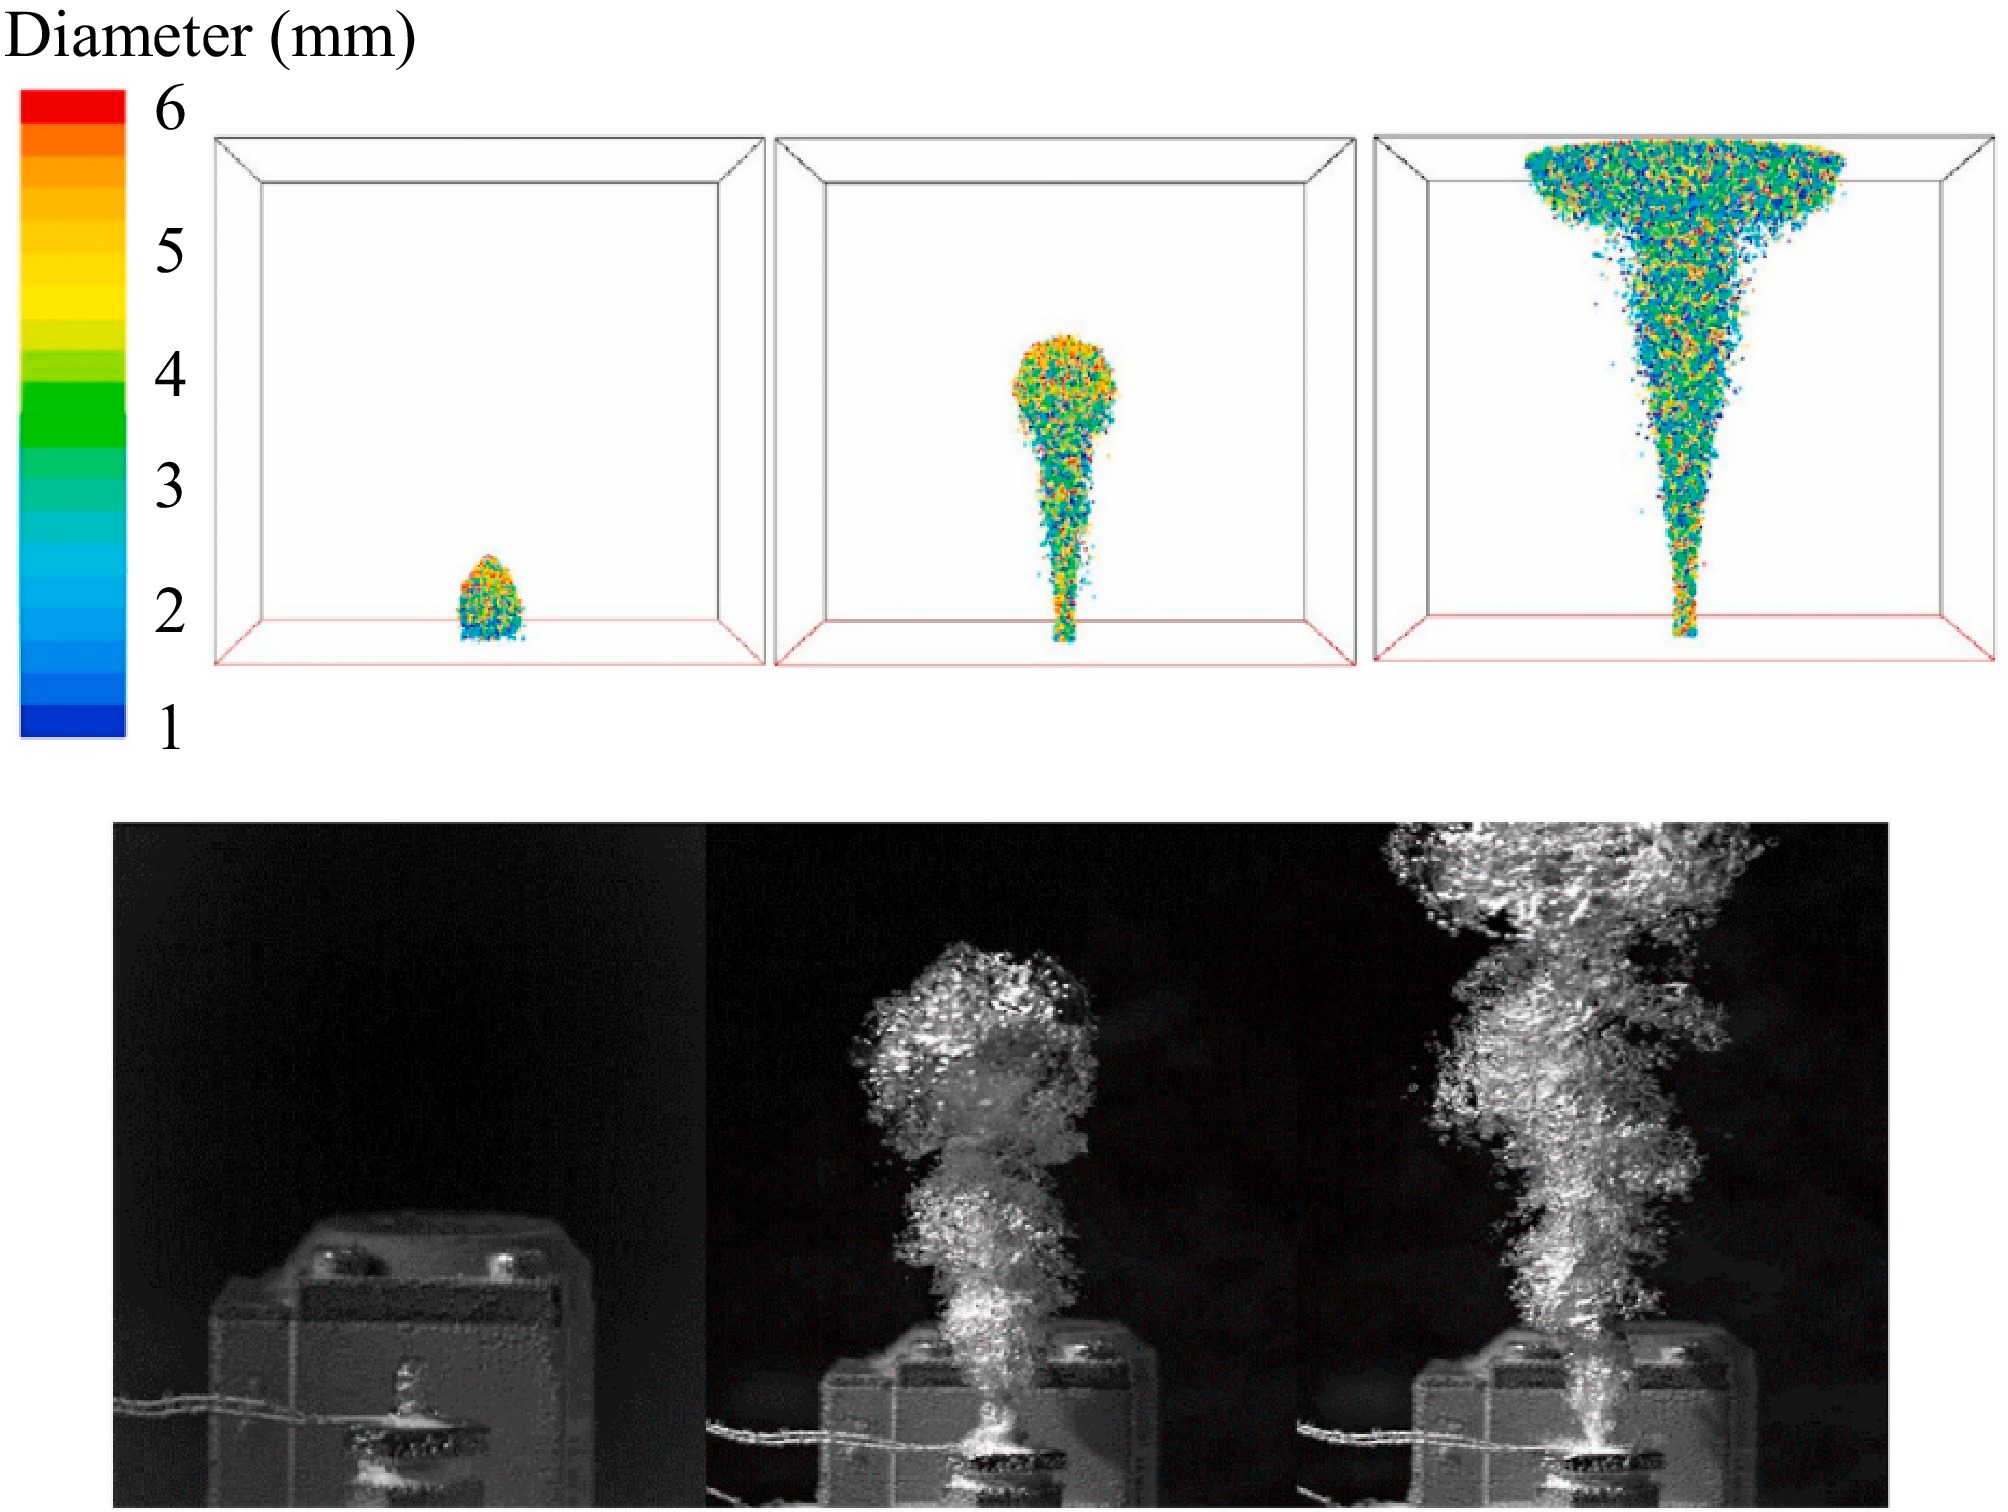
Figure 15.
Evolution of bubble plume after underwater CH4 leakage[65].
Comparative study of leak conditions
-
As shown in Fig. 16, there are both similarities and differences in the common influencing factors of leakage consequences under the two leak scenarios, namely buried and subsea environments. When comparing and analyzing the factors affecting the leakage and diffusion of buried and subsea pipelines, the same factors, such as leakage pressure and hole diameter, show certain differences in the two scenarios. In a buried environment, Bu et al.[17] found that an increase in leakage pressure and hole diameter accelerates the diffusion of gas toward the surface, thus increasing the leakage risk. However, due to soil resistance, the diffusion range is limited. Liu et al.[41] found that the FDT in sandy soil is only 1/15th that in clay. In the subsea environment, Yang et al.[59] discovered that high pressure and large hole diameter shorten the time for gas to rise to the water surface (for instance, when the leakage hole diameter increases from 20 mm to 100 mm, the diffusion range significantly increases), and currents further push the gas horizontally, causing the diffusion area to shift away from the leakage point[21,62]. The larger the leakage rate, the smaller the effect of the current on the lateral diffusion of gas. As the leakage depth increases, both buried and subsea conditions will see an expansion in the gas diffusion range. Additionally, unique factors in the buried scenario, such as soil properties (porosity, viscous resistance), directly influence the hazard radius by altering the gas infiltration path and soil moisture content, while the subsea scenario is dominated by water depth and currents[36,58], and may cause gas mass splitting due to water depth pressure variations, forming small bubbles for diffusion[22]. In summary, whether in buried or subsea scenarios, large leakage hole diameters and high leakage pressures increase the leakage risk. This risk is further amplified or reduced by influencing factors such as soil properties and moisture content in buried environments and currents in subsea environments. Therefore, when laying and operating buried pipelines, it is recommended to prioritize low-porosity, high-viscosity resistance soil areas. Combined with the leakage risk model developed by Bu et al.[17], diffusion can be further suppressed by hardening the surface (e.g., adding cement layers to sandy areas). For hydrogen-blended pipelines, it is necessary to optimize the hydrogen blending ratio monitoring threshold to shorten the alarm response time and improve emergency efficiency. For subsea pipeline laying, the plume width model from Wang et al.[58] can be applied to design layouts that resist current displacement (e.g., reinforcing in the downstream direction) and deploy rapid surface monitoring technologies to capture early leakage signals[37]. Future research should focus on more experiments to further optimize numerical simulation models and continuously improve leakage prediction accuracy and emergency response efficiency, ultimately enhancing the prevention and control of natural gas and H2/CH4 leakage accidents.
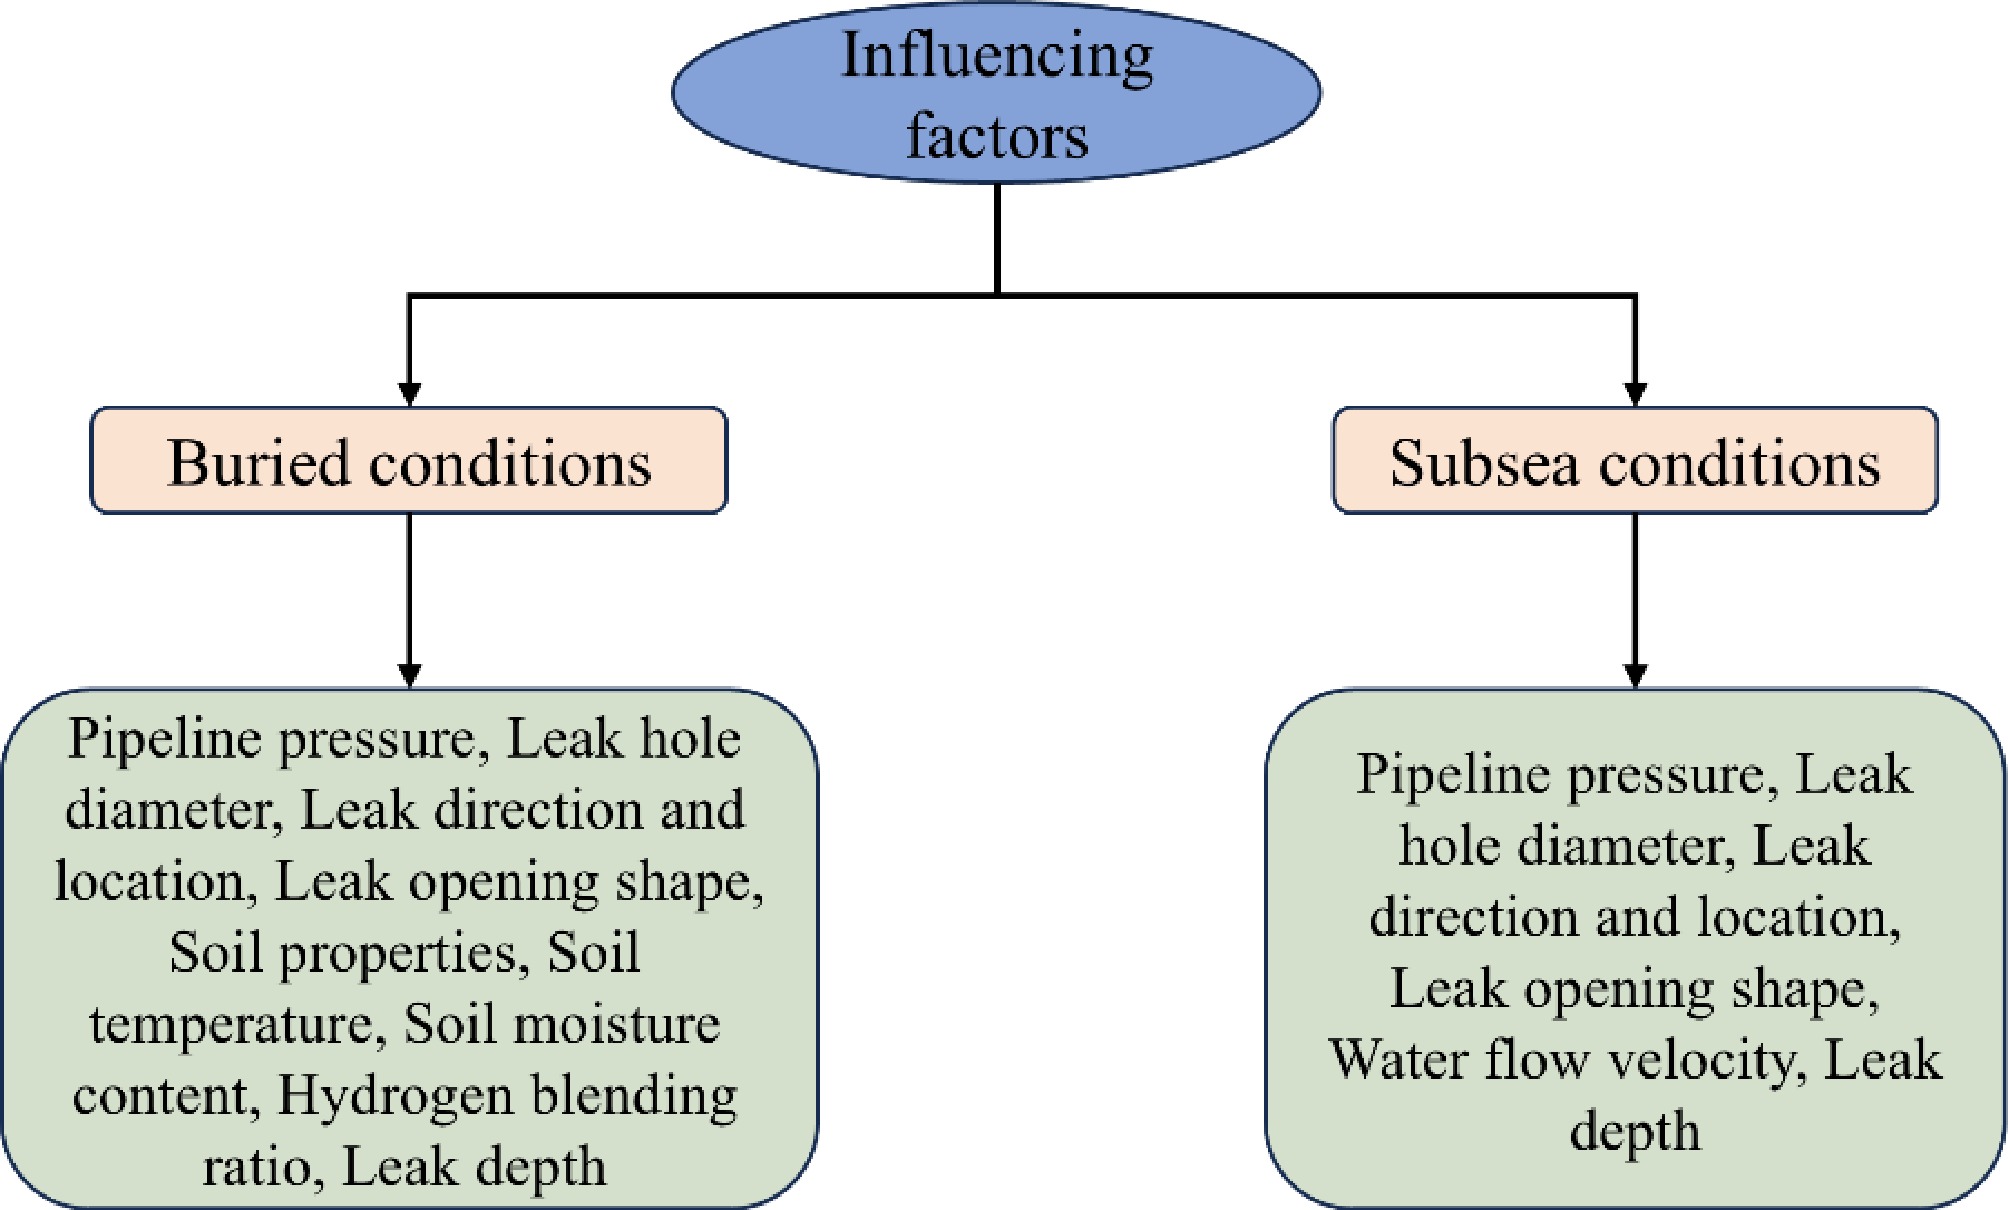
Figure 16.
Influencing factors of natural gas and hydrogen-blended natural gas leaks in buried and subsea environments.
-
This paper reviews the current state of research on the effects of leakage and diffusion of CH4 and H2/CH4 pipelines from two typical scenarios: buried and subsea. While progress has been made in studying the consequences of leakage and diffusion both domestically and internationally, several challenges remain. These include the establishment of gas diffusion models in complex geographical environments, the shortage of high-precision monitoring equipment, and the need for further research on the laws of leakage and diffusion under the interaction of multiple factors. Therefore, additional experimental studies reflecting real-world conditions are necessary to gather more precise data. This will enable better coupling and alignment of experimental data with simulation results, optimizing and refining simulation models. At the same time, it is necessary to continuously improve leakage monitoring accuracy and alarm response efficiency, thereby enhancing the prevention and control capabilities of natural gas and H2/CH4 leakage diffusion accidents in soil and subsea scenarios, ensuring the safety of personnel and property. The following sections outline the impacts of various factors on the consequences of CH4 and H2/CH4 leaks in buried and subsea scenarios:
In buried scenarios, the main factors influencing pipeline leakage and diffusion are the H2 ratio, pipeline operating pressure, soil properties, leak orifice size, and burial depth. Among these, the H2 ratio, pipeline operating pressure, leak orifice diameter, and burial depth impact the time required for the combustible gas to diffuse to the surface after leakage. This diffusion time is inversely related to operating pressure and leak orifice size, while it is positively related to the H2 ratio. Soil properties, which include soil temperature, characteristics, and moisture content, also play a role. Combustible gases diffuse most rapidly in sand due to its lower inertial and viscous resistance. Soil temperature has minimal effect on the diffusion of combustible gases, but higher soil moisture content can impede the gas diffusion process.
In subsea scenarios, critical factors influencing the diffusion of combustible gases include the water depth at the leak point, the size of the leak orifice, the pressure of the leak, and the speed of ocean currents. The larger the orifice size and the higher the leak pressure, the more rapidly the gas will diffuse to the surface, resulting in an expanded diffusion range. The time required for diffusion is directly proportional to the water depth at the leak site. Moreover, both the ascent time and the horizontal spread distance increase with the speed of the ocean currents. However, the size of the diffusion area changes irregularly in response to varying current speeds. Additionally, different leakage conditions can impact the combustion behavior of the gas once it reaches the surface.
This study was supported by the National Natural Science Foundation of China (Grant No. 52274211), the Natural Science Foundation of Jiangsu Province (Grant No. BK20230318), and the Natural Science Foundation of the Jiangsu Higher Education Institutions of China (Grant No. 22KJB620005)
-
The authors confirm contribution to the paper as follows: study conception and design: Liu J, Pan Y, Zhang X; data collection: Liu J, Huang D, Cui L; analysis and interpretation of results: Wang Z, Tsai C; draft manuscript preparation: Liu J, Huang D. All authors reviewed the results and approved the final version of the manuscript.
-
All data generated or analyzed during this study are included in this published article.
-
The authors declare that they have no conflict of interest.
- Copyright: © 2025 by the author(s). Published by Maximum Academic Press on behalf of Nanjing Tech University. This article is an open access article distributed under Creative Commons Attribution License (CC BY 4.0), visit https://creativecommons.org/licenses/by/4.0/.
-
About this article
Cite this article
Liu J, Huang D, Cui L, Zhang X, Wang Z, et al. 2025. Research progress on leakage and diffusion of CH4 and H2/CH4 in buried and submarine pipeline transportation processes. Emergency Management Science and Technology 5: e008 doi: 10.48130/emst-0025-0007 

Research progress on leakage and diffusion of CH4 and H2/CH4 in buried and submarine pipeline transportation processes
- Received: 13 March 2025
- Revised: 27 April 2025
- Accepted: 06 May 2025
- Published online: 26 May 2025
Abstract: Most countries globally are actively advancing efforts towards achieving carbon peak and carbon neutrality goals. CH4 and H2 serve as vital clean energy carriers in support of these objectives. Pipeline transportation is an essential method for the large-scale, efficient, low-cost, and safe delivery of CH4 and H2. However, it also presents safety risks that may lead to leaks, fires, and other accidents. This paper reviews research conducted by scholars worldwide on the impact of various factors on the consequences of H2/CH4 leakage and diffusion in buried and subsea pipeline scenarios. The core focus of research under these conditions is to study how factors such as the depth of the leak orifice, soil properties, underwater leak depth, and current speed affect the diffusion time and range of the gas, thereby analyzing their impact on the severity of the accidents. Despite progress, challenges remain. On the theoretical front, there is a need to further deepen the quantitative study of diffusion mechanisms and their impact on their consequences. On the technical front, efforts are needed to develop efficient and accurate monitoring and prediction systems for real-time detection and risk early warning. To improve efficiency and accuracy, future work will require larger-scale and more diverse experimental studies to obtain relevant data and fully leverage cutting-edge technologies such as big data and artificial intelligence to optimize leak prediction and monitoring systems.
-
Key words:
- CH4 /
- H2 /
- Submarine pipeline /
- Buried pipeline /
- Leakage diffusion