


-
E-fuels, synthesized from water and carbon dioxide using renewable electricity, achieve carbon neutrality over their production and consumption lifecycles[1]. Among them, oxymethylene ethers (OMEs), with the chemical formula CH3-O-(CH2O)n-CH3, where n denotes the number of oxymethylene, are of extremely high interest for the application in various combustion devices, evidenced by their high cetane numbers, elevated oxygen content, and absence of C-C bonds. They can provide a reduction of greenhouse gas emissions by 90% compared to conventional diesel fuels over the entire production-to-use phase[2].
To apply OMEs in various devices, a deep understanding of their combustion kinetics is indispensable. Recently, various studies were performed to explore the combustion kinetics of OMEs. Beyond experimental efforts[3−13], a number of chemical kinetic models were developed for the oxidation and combustion of OMEs. Earlier models were proposed by Daly et al.[14], Dias et al.[15], and Marrodán et al.[16] for OME1 based on analogy with structurally similar ethers, such as dimethyl ether (DME) and diethyl ether (DEE). Further model development was then advanced by newly reported theoretical and experimental data. For instance, in 2018, Vermeire et al.[17] developed an updated kinetic model of OME1 based on the results of theoretical calculations and jet stirred reactor (JSR) experiments. Jacobs et al.[18] also proposed a reaction mechanism for the oxidation of OME1. This model incorporates newly calculated rate parameters for low-temperature chemistry and was validated primarily against ignition delay times (IDTs) measured in a shock tube and a rapid compression machine (RCM) at engine-relevant pressures. Following these efforts, Li et al.[19] proposed a new model of OME1 by incorporating theoretically calculated rate constants of fuel decomposition reactions[20] and the methyl formate sub-mechanism from Minwegen et al.[21]. The model was validated against high-temperature IDTs measured in a shock tube[19], species concentrations (CONCs) measured in JSRs[5,17], and laminar burning velocities (LBVs) measured in a heat flux burner[22].
Subsequently, research expanded to larger OMEn (n > 1), Sun et al.[23] established the first high-temperature chemical mechanism of OME3, validated against LBVs in a spherical combustion vessel and species profiles in a low-pressure premixed flame. Based on theoretical calculations and the concept of reaction classes and rate rules[24], He et al.[25] proposed a detailed kinetic model of OME1–3, which reasonably reproduced IDTs of OME3 measured in an RCM. Although both models[23,25] include reaction pathways of OME1 and OME2, they are not validated against the combustion targets of these smaller OMEs. Based on the OME1 model proposed by Jacobs et al.[18], Cai et al.[26] developed a model of OME2–4 by using an automatic mechanism generator and optimization technique. The model was validated successfully against their own experimental IDTs of OME2–4. De Ras et al.[27] proposed a kinetic model for the pyrolysis and oxidation of OME2, which shows good agreement with CONCs in a flow reactor. Based on new results of quantum chemistry calculations, De Ras et al.[28] refined this model for a more detailed description of the low-temperature chemistry of OME2, and validated the updated model with experimental data taken from stabilized cool flames. However, the performance of these two theoretically-derived models[27,28] for the prediction of IDTs and LBVs remains largely unexplored. Very recently, Shrestha et al.[29] developed a kinetic model of OME1–3 based on the work of He et al.[25], and conducted new experimental measurements of IDTs and LBVs for the model validation.
As the high complexity of the aforementioned detailed models increases the computational costs of computational fluid dynamics (CFD) significantly, reduced or semi-detailed models of OMEs were proposed as well. Niu et al.[30] constructed a reduced OME1–6 based on the decoupling methodology and reaction class-based sensitivity analysis. The model was optimized by using a genetic algorithm to match experimental data selected from the literature. A semi-detailed kinetic model of OME2–5 was proposed by Dinelli et al.[31], whose prediction accuracy for IDTs, LBVs, and CONCs was improved by using a data-driven approach.
The aforementioned models were developed based on various concepts. While the models of Vermeire et al.[17] and De Ras et al.[27,28] incorporate theoretically calculated rate parameters of reactions for improved model performance and reliability, and other models, such as those of Cai et al.[26], Niu et al.[30], Dinelli et al.[31], were refined through experimental fitting and optimization. However, most models were primarily validated against particular combustion targets or over a limited range of conditions. Recent studies of De Ras et al.[32,33] highlighted that some models show strong prediction discrepancies at certain conditions, especially at pyrolysis conditions. For instance, De Ras et al.[32] found that several models predict the pyrolysis behaviors of longer-chain OMEs unsatisfactorily due to the absence of direct decomposition pathways.
Therefore, a comprehensive assessment of the overall performance of these models is of high importance and interest, especially for their application in CFD simulations of practical devices. While previous works of Cai et al.[26] and Shrestha et al.[29] compared model performance and provided valuable insights, this study distinguishes itself by evaluating comprehensively ten recent OMEs against various experimental data over a wide range of conditions. For this, an extensive experimental database is compiled, which is composed of 43 datasets from 23 publications, covering critical combustion targets including IDTs, LBVs, and CONCs in reactors for OMEs. In addition, in-depth insights are provided by kinetic analyses into the underlying chemistry, which leads to accurate or unsatisfactory model predictions for different OMEs and combustion targets.
-
The point-wise difference measure has been widely applied in the literature studies for the development[34,35], assessment[36−38], and optimization[24,39,40] of chemical kinetic models of various fuels, such as hydrogen[38,41], ammonia[37], methane[36,42], n-pentane[24], and gasoline surrogate[40]. For a given kinetic model, the point-wise difference between the model and the
$ i $ $ {{ \varepsilon }}_{{i}}=\sqrt{\dfrac{{1}}{{{n}}_{{i}}}\sum _{{j=}{1}}^{{{n}}_{{i}}}{\left[\dfrac{{{Y}}_{{ij}}^{{}{sim}}-{}{{Y}}_{{ij}}^{{}{exp}}}{{\sigma}\left({{Y}}_{{ij}}^{{}{exp}}\right)}\right]}^{{2}}} $ (1) Here,
$ {{Y}}_{{ij}}^{{}{exp}} $ $ {{Y}}_{{ij}}^{{}{sim}} $ $ {\sigma}\left({{Y}}_{{ij}}^{{}{exp}}\right) $ The experimental uncertainties are taken into account if they are available in the original literature. For configurations whose experimental uncertainties were not reported, their uncertainties were assigned according to analogous reactors. For instance, uncertainties of 20%, 3%, and 5% were assigned for shock tubes and RCMs, combustion vessels, and Bunsen burners.
For all considered datasets, the overall difference measure ε is
$ { \varepsilon }=\dfrac{{1}}{{N}}\sum _{{i}{= 1}}^{{N}}{{ \varepsilon }}_{{i}} $ (2) where, N is the number of considered datasets.
Experimental database
-
For model evaluation, a comprehensive experimental database of IDTs, LBVs, and CONCs of OMEs was established as part of this study. Table 1 provides an overview of experimental studies on OME1–4, which are considered in the study. These 23 studies reported 18, 12, ten, and three datasets for OME1–4, respectively. IDTs measured in shock tubes, rapid compression machines, and flow reactors, LBVs determined in heat flux burners, combustion vessels, and Bunsen burners, as well as CONCs obtained in flow reactors and jet stirred reactors, are taken into account. It is seen that current experimental investigations focus mostly on short-chain OMEs. Limited datasets are available for the long-chain OME4.
Table 1. Summary of experimental studies on OME1−4 combustion.
Properties Facilities Conditions Ref. OME1 IDTs Shock tube OME1/O2/Ar, 1–10 atm, 1,000–1,500 K, φ = 0.5–2.0 [19] Shock tube OME1/air, 20–40 bar, 691–1213 K, φ = 1.0 [18] Rapid compression machine OME1/air, 10–40 bar, 590–688 K, φ = 1.0 [18] Flow reactor OME1/O2/N2, 1 atm, 651–697 K, φ = 1.0 [18] Shock tube OME1/air, 30 bar, 600–1,350 K, φ = 0.5–2.0 [7] Shock tube OME1/O2/Ar, 2–10 atm, 1,100–1,500 K, φ = 0.5–2.0 [4] Shock tube OME1/O2/N2, 1–16 bar, 1,100–1,750 K, φ = 1.0 [43] LBVs Combustion vessel OME1/air, 1–3 bar, 443 K, φ = 0.8–1.4 [29] Heat flux burner and combustion vessel OME1/air, 1–5 bar, 298–373 K, φ = 0.6–1.85 [22] Heat flux burner OME1/air, 1 bar, 393 K, φ = 0.6–1.9 [8] Bunsen burner OME1/air, 1–6 bar, 473 K, φ = 0.6–1.8 [43] CONCs Jet stirred reactor OME1/O2/Ar, 750 torr, 487–867 K, φ = 0.5 [44] Jet stirred reactor OME1/O2/N2, 10 atm, 450–1,200 K, φ = 0.2–1.5 [5] Jet stirred reactor OME1/He, 1.07 bar, 800–1,100 K (pyrolysis);
OME1/O2/He, 1.07 bar, 500–1,100 K, φ = 0.25–2.0[17] Flow reactor OME1/O2/Ar, 1 atm, 750–1,250 K, φ = 0.8–2.0 [11] Jet stirred reactor OME1/O2/Ar, 1.0 atm, 500–1,100 K [45] Jet stirred reactor OME1/Ar, 1.03 atm, 450–1,080 K (pyrolysis) [10] Jet stirred reactor OME1/O2/He, 1.05 atm, 500–1,000 K, φ = 0.5–2.0 [13] OME2 IDTs Shock tube OME2/air, 10–20 bar, 663–1,112 K, φ = 0.5–2.0 [26] Shock tube OME2/O2/N2, 1–16 bar, 850–1,700 K, φ = 1.0 [12] Rapid compression machine OME2/air, 10–15 bar, 550–680 K, φ = 0.5–2.0 [29] Rapid compression machine OME2/air, 3–10 bar, 570–690 K, φ = 1.0 [6] Rapid compression machine OME2/air, 0.5–1 MPa, 600–715 K, φ = 0.5 [27] LBVs Combustion vessel OME2/air, 1–5 bar, 393–443 K, φ = 0. 6–1.9 [29] Heat flux burner OME2/air, 1 bar, 380–401 K, φ = 0. 6–1.9 [8] Bunsen burner OME2/air, 1–6 bar, 473 K, φ = 0.5–2.0 [12] CONCs Flow reactor OME2/He, 3.4 bar, 373–1,073 K (pyrolysis) [27] Flow reactor OME2/O2/Ar, 1 atm, 750–1,250 K, φ = 0.8–2.0 [11] Jet stirred reactor OME2/Ar, 1.03 atm, 450–1080 K (pyrolysis) [10] Jet stirred reactor OME2/O2/He, 1.05 atm, 500–1,000 K, φ = 0.5–2.0 [13] OME3 IDTs Shock tube OME3/air, 10–20 bar, 684–1,137 K, φ = 0.5–2.0 [26] Rapid compression machine OME3/air, 15 bar, 550–680 K, φ = 2.0; OME3/O2/CO2, 15 bar, 550–680 K, φ = 0.5 [29] Rapid compression machine OME3/air, 3–10 bar, 570–690 K, φ = 1.0 [6] LBVs Combustion vessel OME3/air, 1–3 bar, 393–443 K, φ = 0. 8–1.6 [29] Combustion vessel OME3/air, 1 atm, 408 K, φ = 0. 7–1.6 [23] Combustion vessel OME3/air, 1 atm, 363–423 K, φ = 0. 7–1.8 [9] CONCs Flow reactor OME3/O2/Ar, 1 atm, 750–1,250 K, φ = 0.8–2.0 [11] Jet stirred reactor OME3/O2/N2, 1 atm, 500–950 K, φ = 0.5–2.0 [46] Jet stirred reactor OME3/Ar, 1.03 atm, 450–1,080 K (pyrolysis) [10] Jet stirred reactor OME3/O2/He, 1.05 atm, 500–1,000 K, φ = 0.5–2.0 [13] OME4 IDTs Shock tube OME4/air, 10–20 bar, 684–1,137 K, φ = 1.0 [26] LBVs Bunsen burner OME4/air, 1–6 bar, 473 K, φ = 0.5–2.0 [47] CONCs Flow reactor OME4/O2/Ar, 1 atm, 750–1,250 K, φ = 0.8–2.0 [11] Kinetic models
-
The performance of ten recently developed kinetic models of OMEs is evaluated in this study. Their information is summarized in Table 2. Specifically, detailed kinetic models of OME1 were proposed by Li et al.[19], Jacobs et al.[18], and Vermeire et al.[17]. De Ras et al.[27,28] reported two mechanisms, which include the chemistry of OME1 and OME2. For larger OMEs, He et al.[25] and Shrestha et al.[29] developed the kinetic models of OME1–3, while the model of Cai et al.[26] incorporates the combustion chemistry of OME1–4. In addition to the aforementioned detailed models, two reduced mechanisms of Dinelli et al.[31] and Niu et al.[30] are taken into account in this study as well, which can be used to describe the oxidation and combustion behaviors of OME1–5.
Table 2. Summary of OMEs kinetic models.
Model Fuels No. of species No. of reactions Ref. Dinelli_2024 OME1−5 183 2,532 [31] De Ras_2023 OME1−2 376 3,988 [28] Shrestha_2022 OME1−3 259 1,678 [29] De Ras_2022 OME1−2 301 2,251 [27] Niu_2021 OME1−6 92 389 [30] Li_2021 OME1 121 646 [19] Cai_2020 OME1−4 322 1,612 [26] Jacobs_2019 OME1 530 2,901 [18] He_2018 OME1−3 225 1,082 [25] Vermeire_2018 OME1 351 2,904 [17] -
The prediction accuracy of models was quantified in terms of the point-wise difference measure. Numerical simulations were performed using the FlameMaster code[48], which automatically estimates missing transport properties for incomplete models[17,25,27]. Specific effects of experimental facilities were taken into account in the simulation. Radiative heat losses were included in the calculation as well.
Comparison between model and data
-
Comparisons between calculated and measured results for IDTs, LBVs, and CONCs are presented in Figs. 1−3, respectively. As shown in Fig. 1a, the models of De Ras_2023[28], De Ras_2022[27], He_2018[25], and Vermeire_2018[17] overpredict the IDTs of OME1, especially at intermediate and low temperatures. Although models of Li_2021[19] and Cai_2020[26] show relatively small point-wise differences for OME1 IDTs, it is worth mentioning that they do not fully capture the trend of experimental data at low temperatures. This highlights a limitation of the point-wise difference metric in fully assessing the model fidelity. Better agreements between model and data are observed for the IDTs of OME2–4, as illustrated in Fig. 1b–d. However, as shown in Fig. 1d, for OME4, the experimental data are limited to a small temperature range of 1,000/T = 0.97–1.22. This inhibits a comprehensive assessment of model performance.
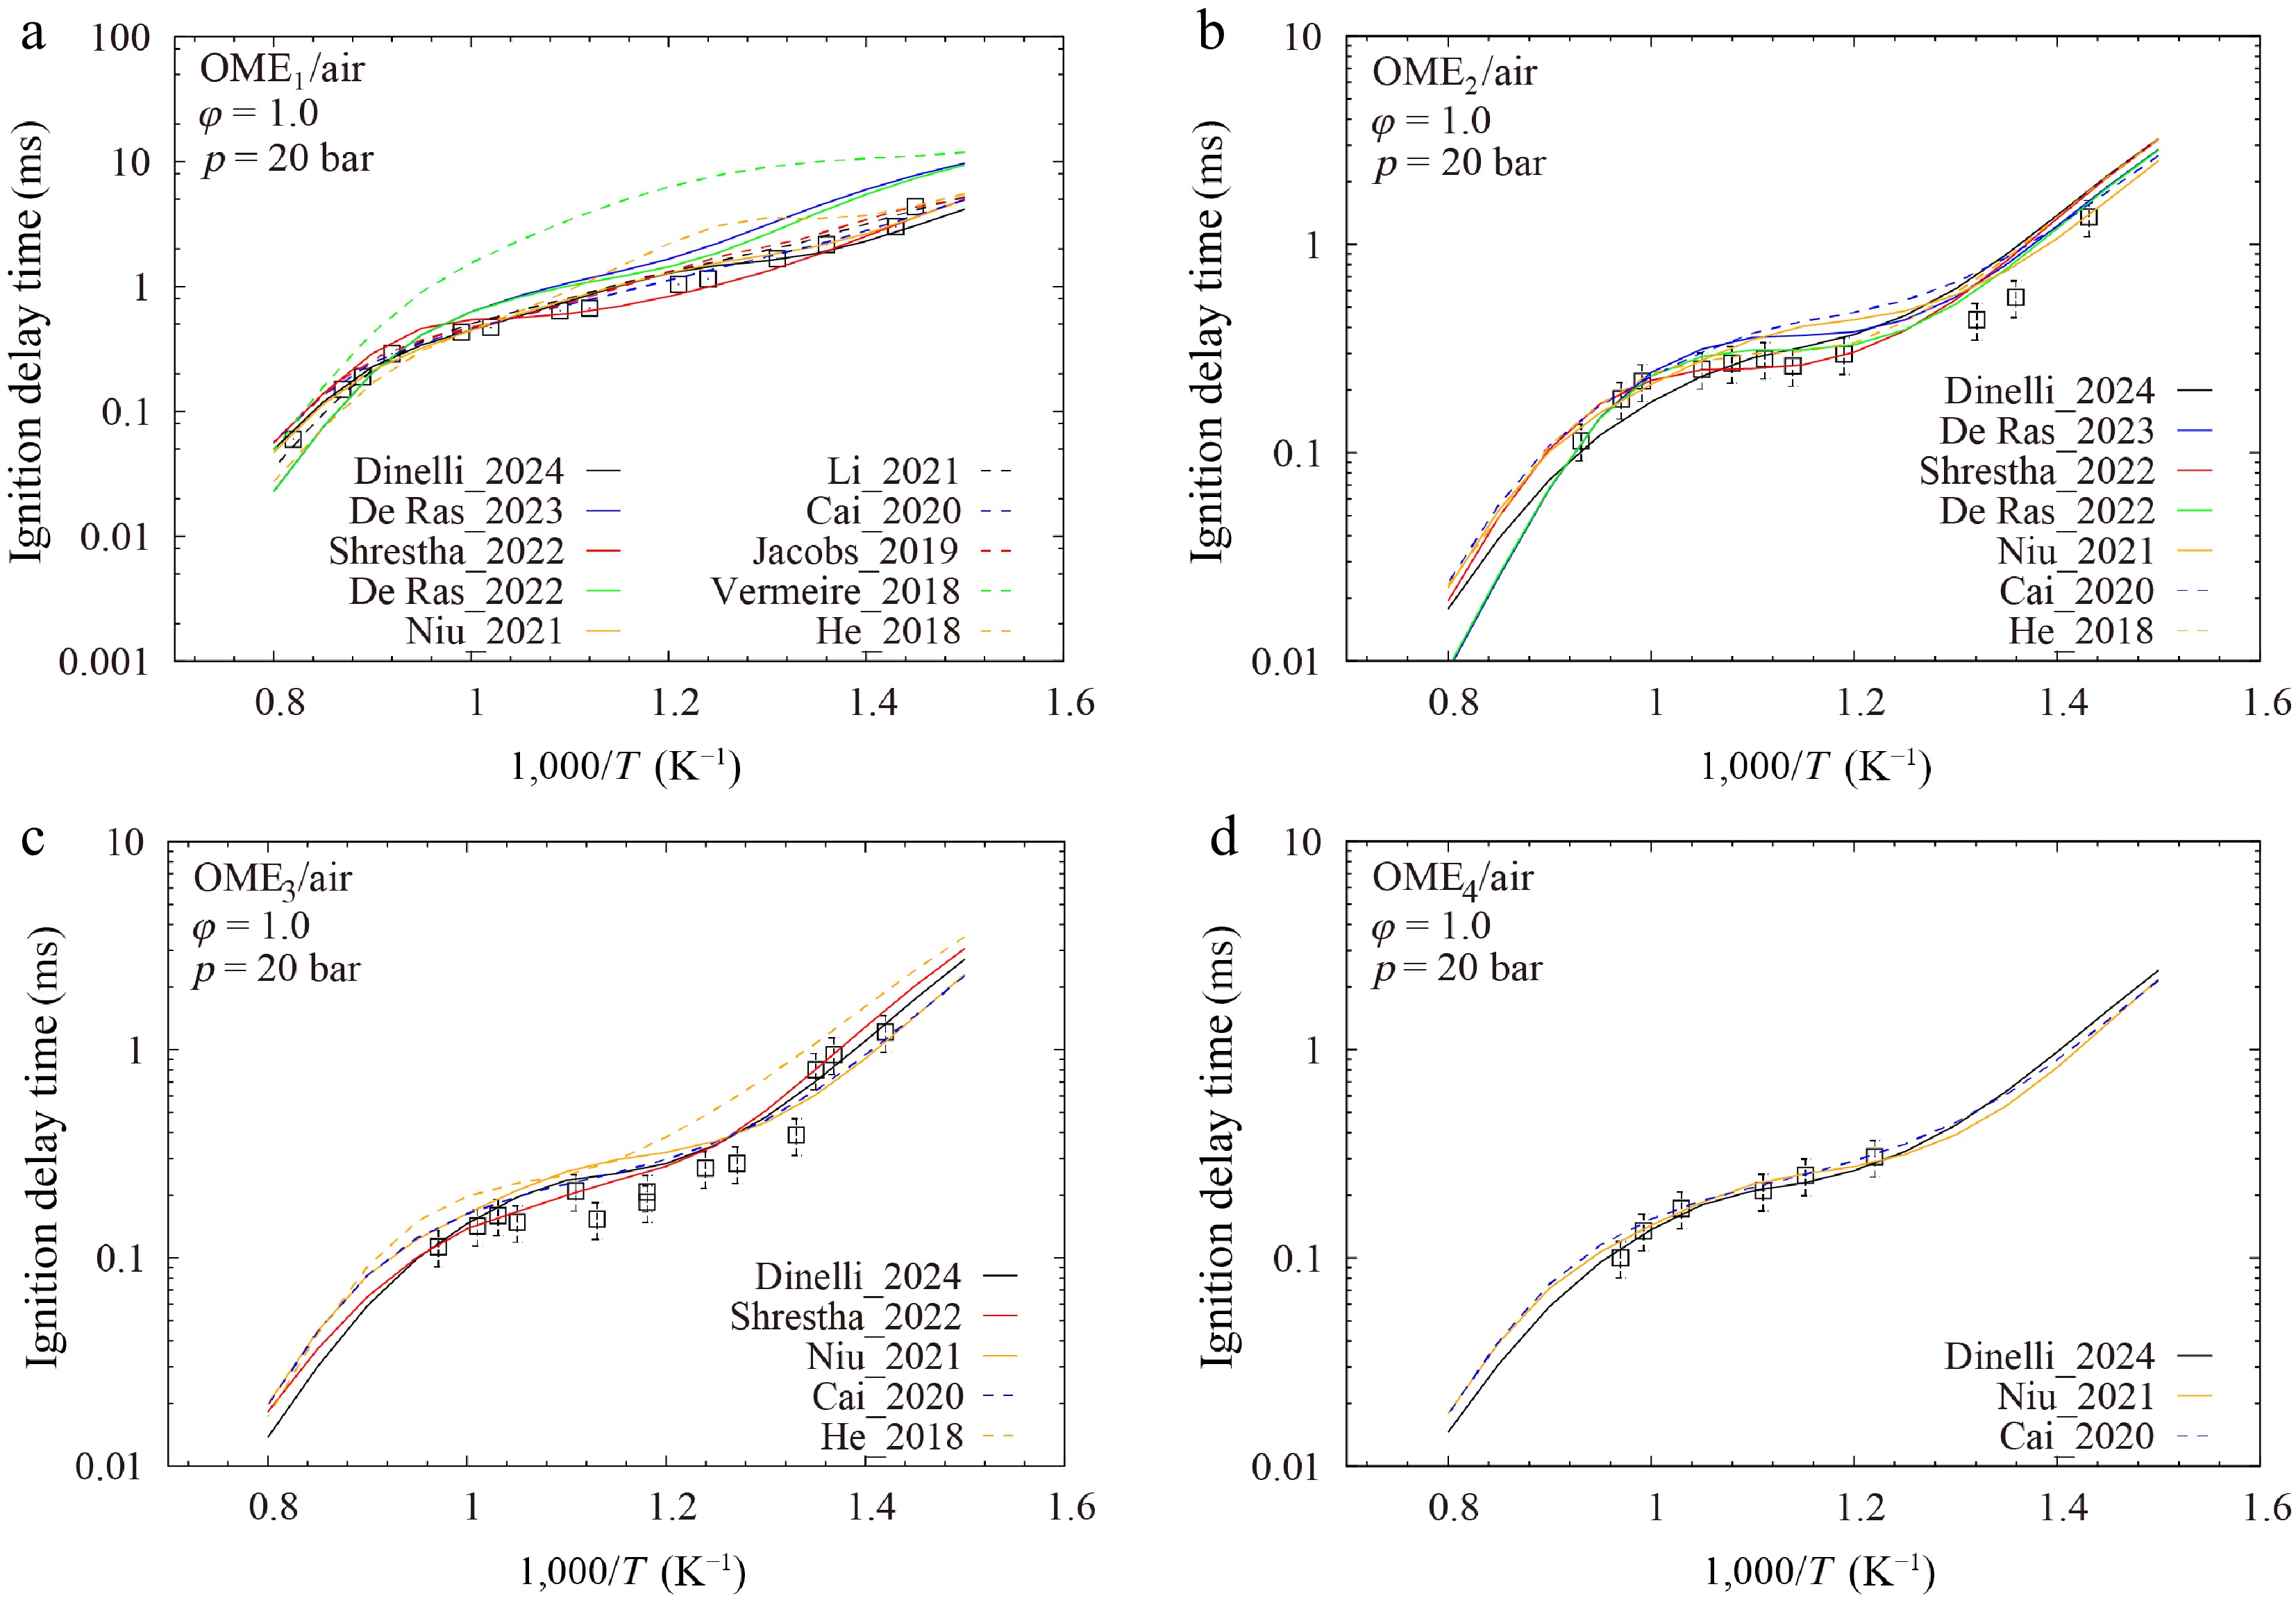
Figure 2 compares the predicted LBVs with the experimental data reported by Shrestha et al.[29], Sun et al.[23], and Richter et al.[47]. It is seen that the He_2018[25] model overestimates the LBVs of OME1–3 significantly. Note that this model[25] was only validated for IDTs in its study[25]. Very surprisingly, none of the existing models reproduces the experimental LBVs of OME4 accurately, as the model prediction of LBVs of hydrocarbon fuels is highly sensitive to the reactions of small molecules[49,50], and the investigated models with their reactions of small molecules can predict the LBVs of OME1–3 with reasonable accuracy. As the dataset of Richter et al.[47] is the only dataset available in the literature for the LBVs of OME4, additional measurements are thus of very high interest for further investigation.
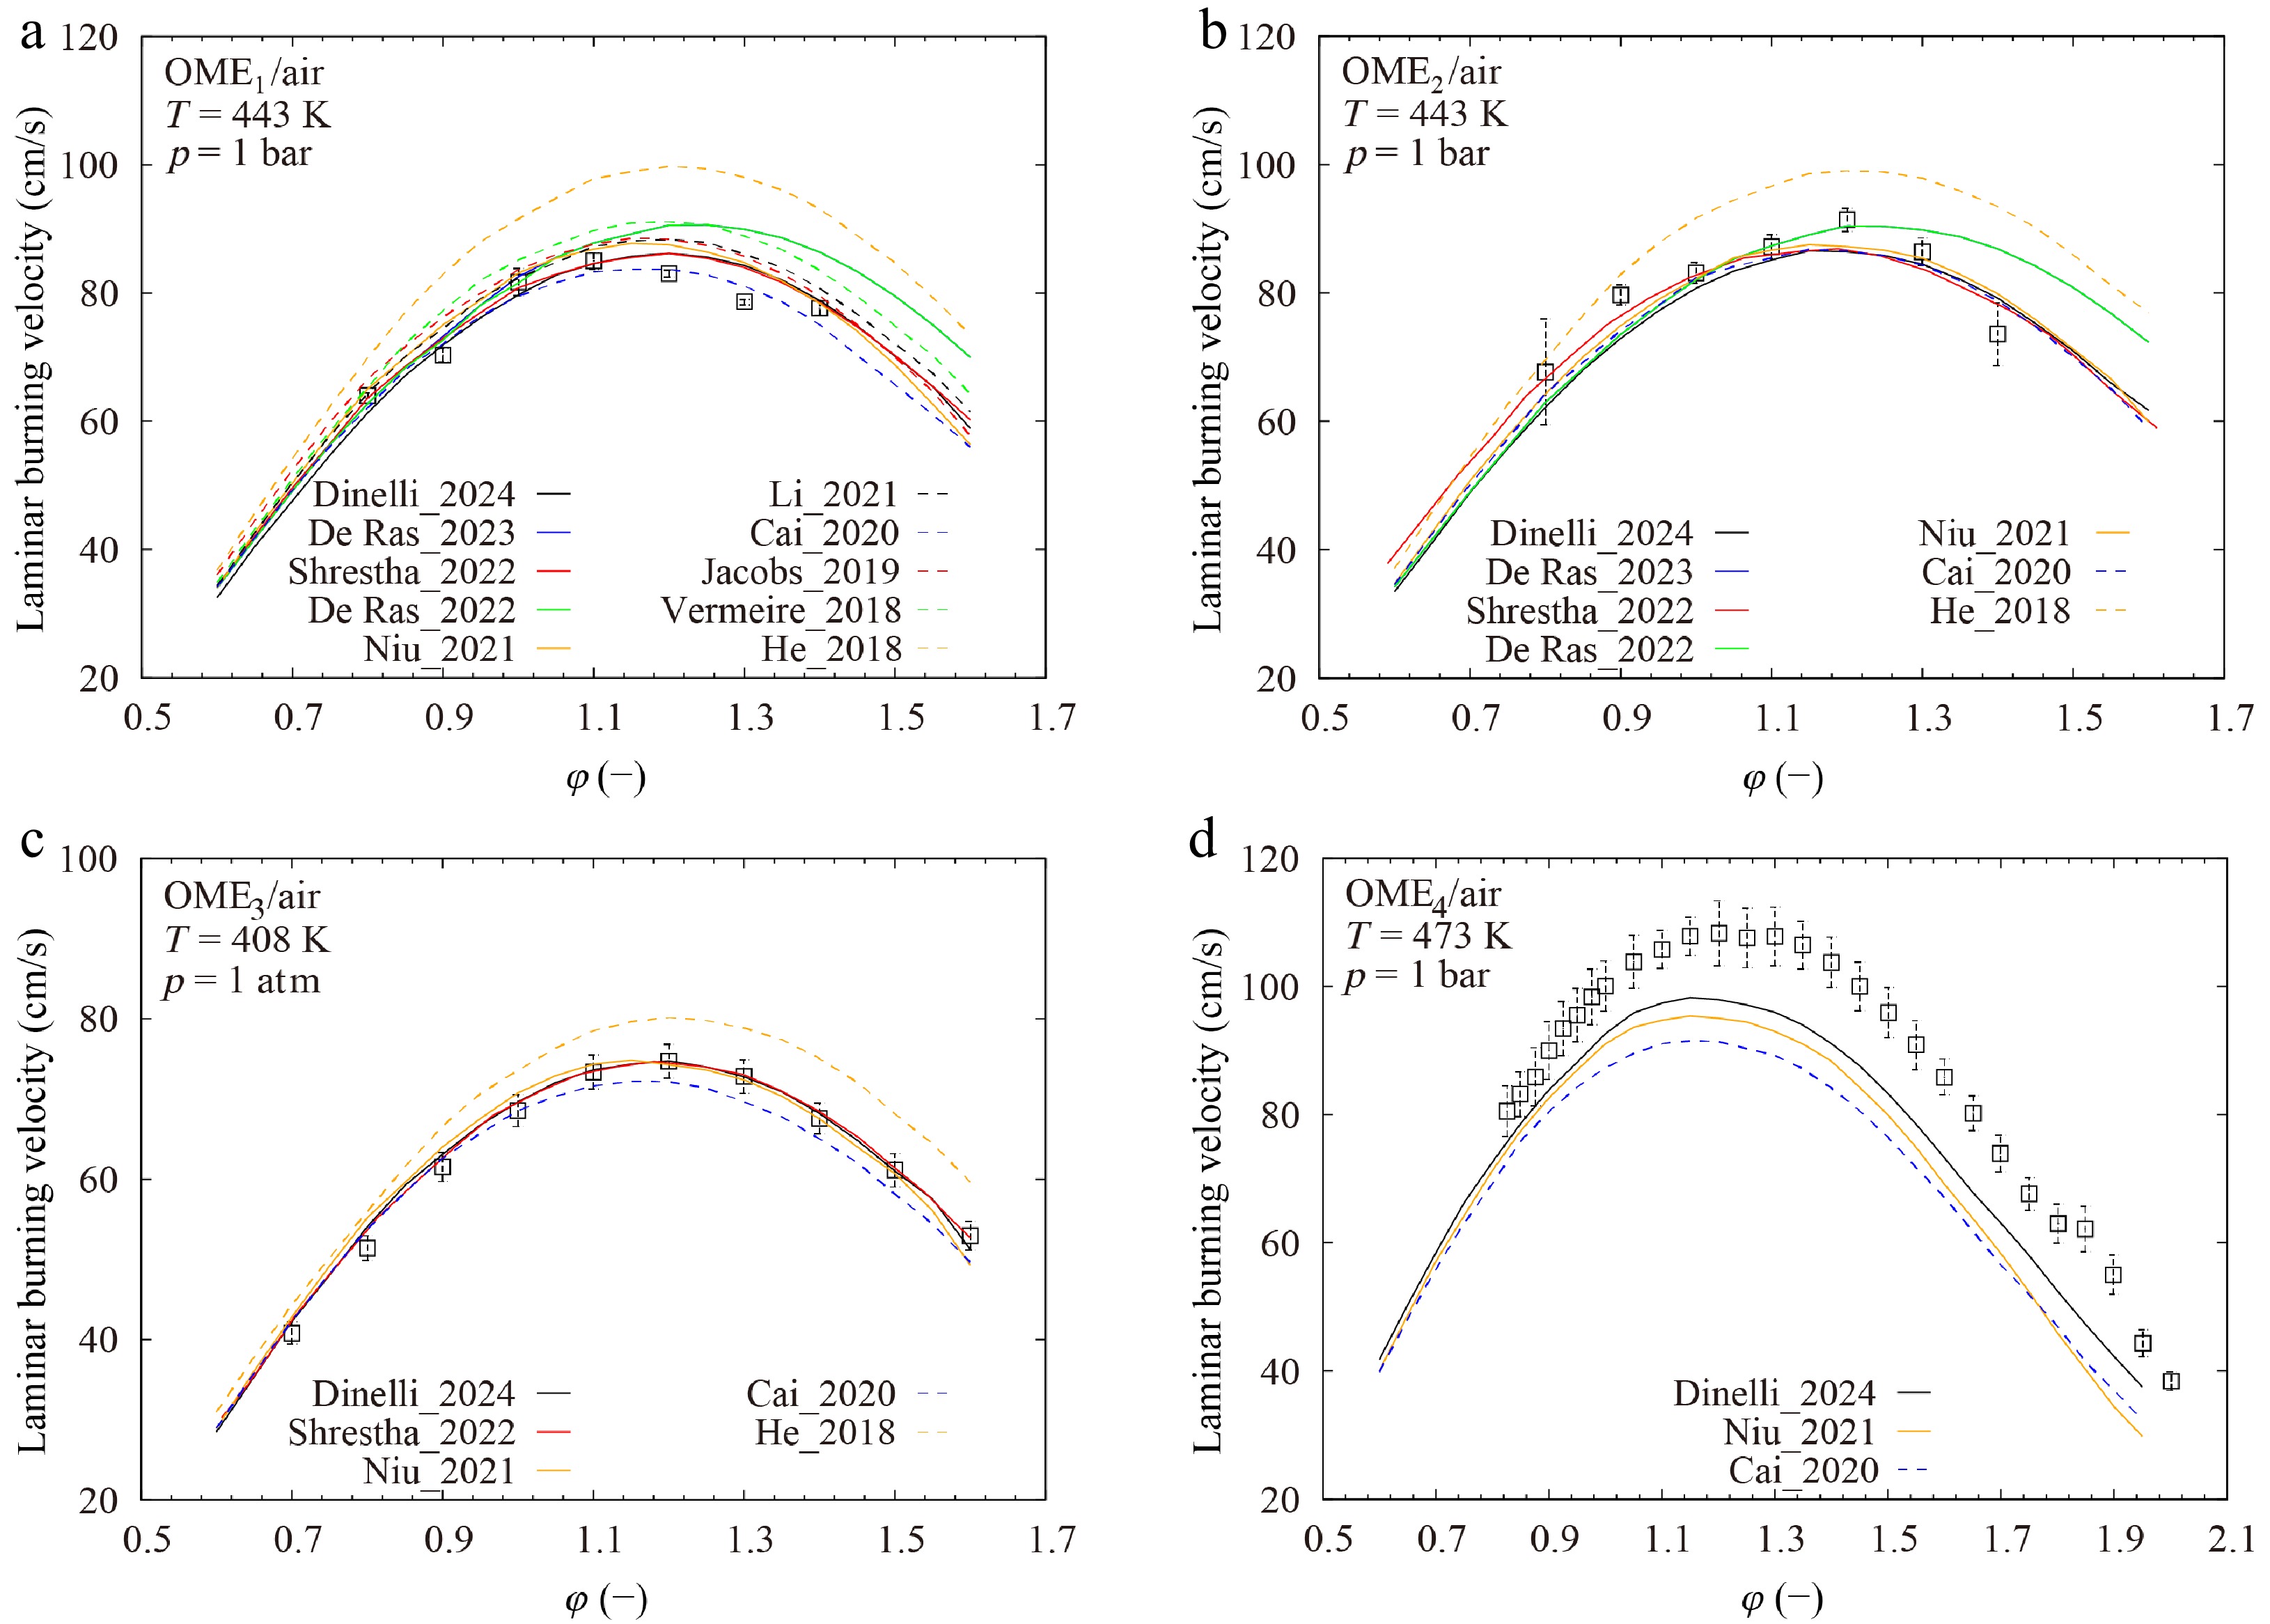
Figure 3 presents the comparisons of the computed and measured CONCs in different reactors and at various conditions. Experimental data were obtained by Sun et al.[5], Wang et al.[13], and Qiu et al.[46] in jet stirred reactors, as well as by Gaiser et al.[11] in a flow reactor. Major discrepancies between model and data are observed for CONCs.
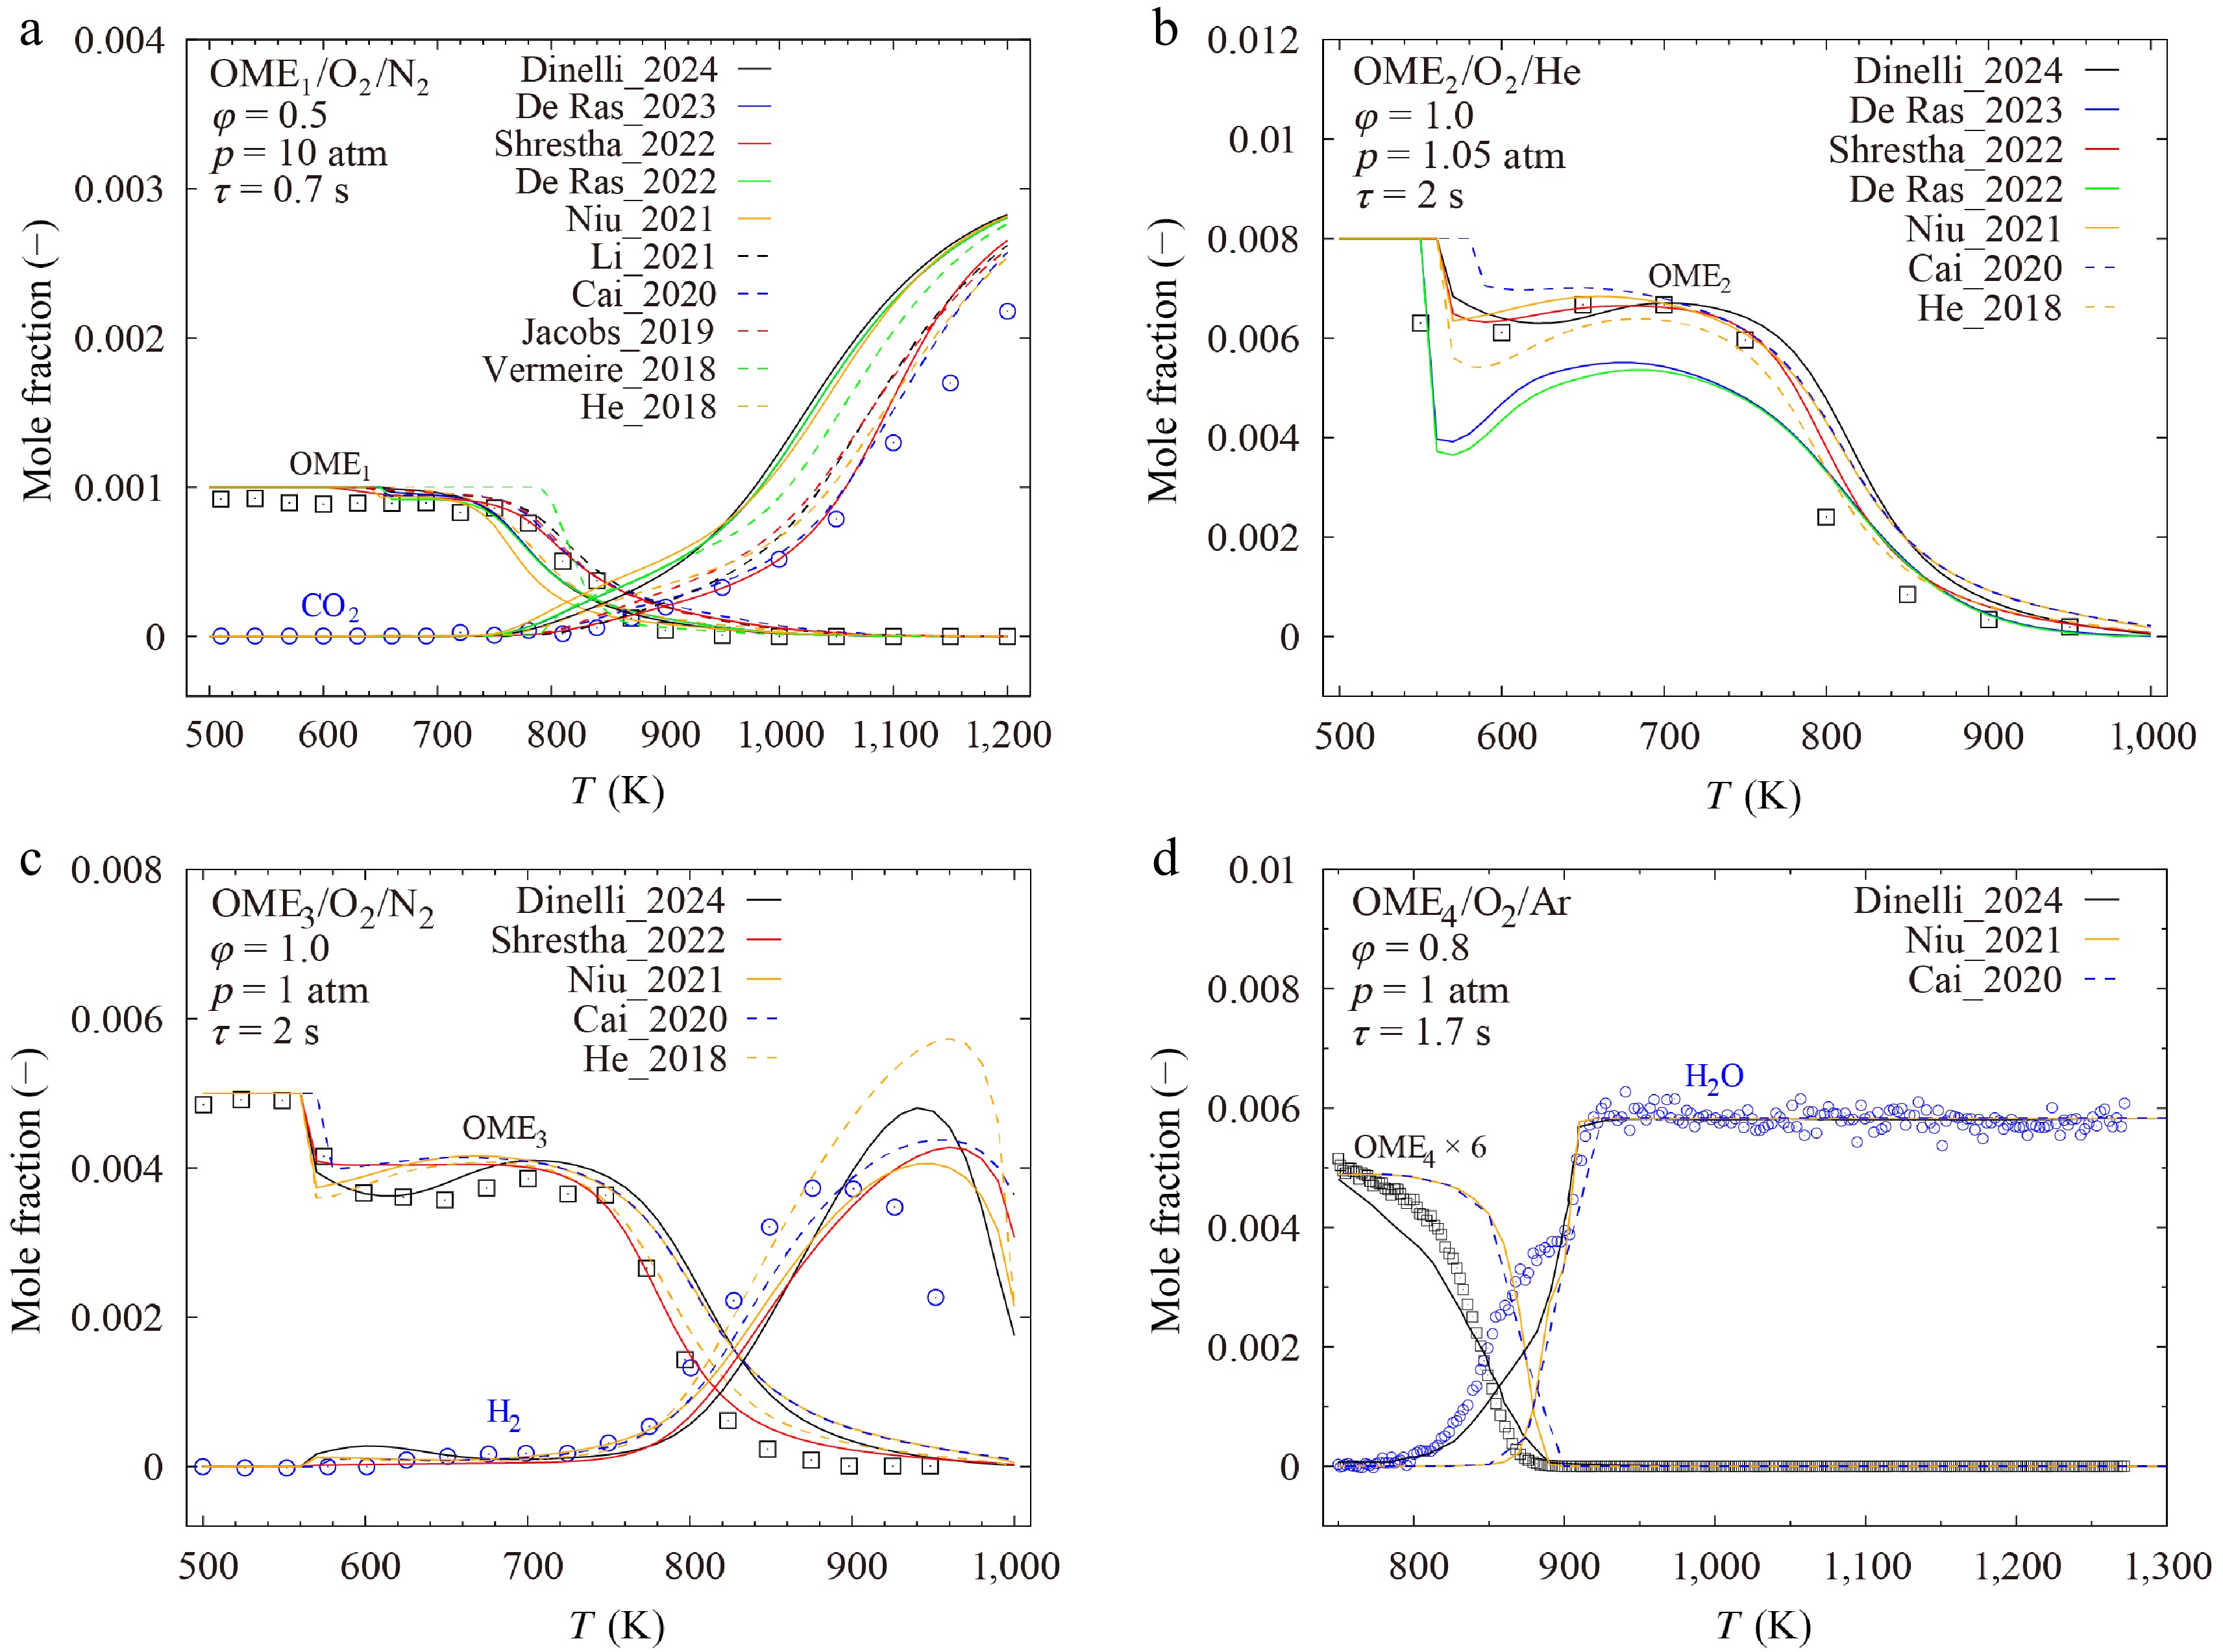
Figure 3.
Species concentrations during the oxidation of OME1–4. Symbols are experimental data of OME1 from Sun et al.[5], of OME2 from Wang et al.[13], and of OME3 from Qiu et al.[46] measured in jet stirred reactors, as well as experimental data of OME4 from Gaiser et al.[11] measured in a flow reactor. Lines denote results calculated with kinetic models.
Model evaluation
-
In this study, the point-wise difference between model and data was employed as a quantitative assessment of the model performance. It was determined for the three kinds of combustion targets and for all OMEs considered in this study. The results are presented in Fig. 4.
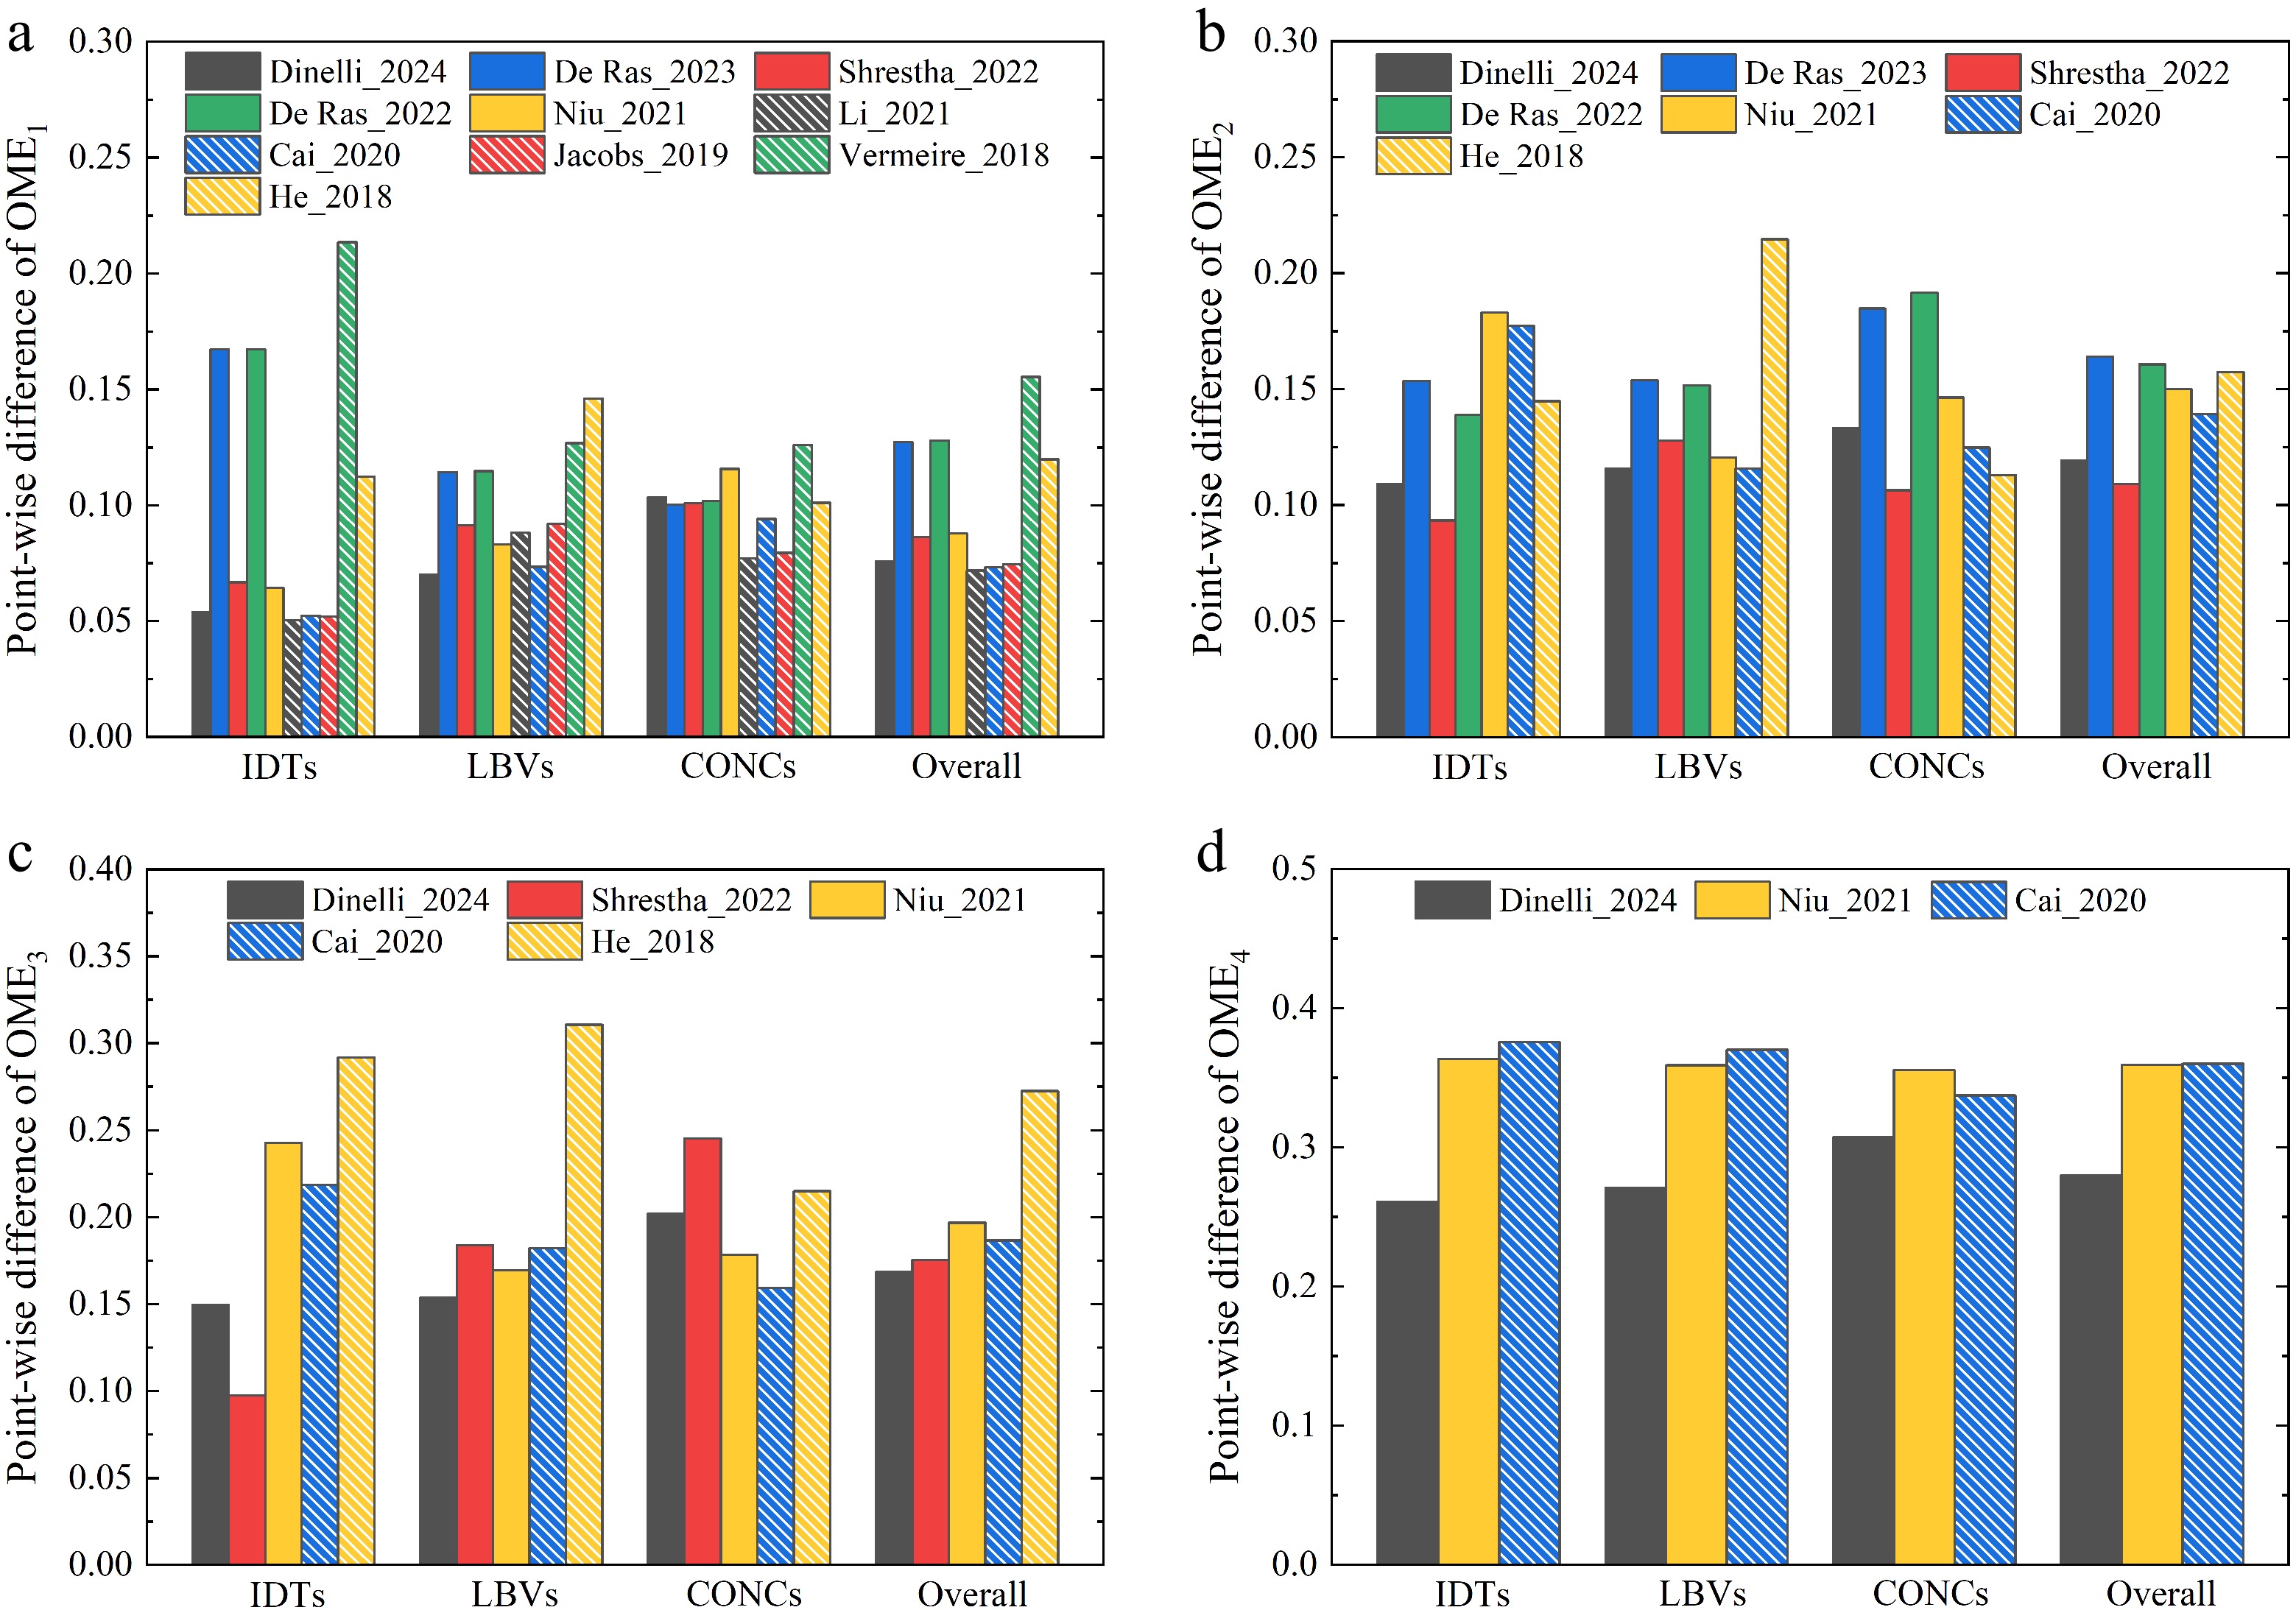
Figure 4.
Point-wise difference between model and data for the various combustion targets of OME1–4.
As shown in Fig. 4a, for OME1, the Li_2021[19] model gives the best performance for IDTs, CONCs, and all targets, based on the normalized point-wise difference (ε) between model and data, while its performance is slightly worse than those of the Dinelli_2024[31] and Cai_2020[26] models for LBVs. Specifically, for IDTs of OME1, the model of Li_2021[19] achieves an ε value of 0.0504, while the second-best model of Cai_2020 has an ε value of 0.0522. For OME2, where seven models were compared; the Shrestha_2022[29] model is the most accurate by achieving the lowest point-wise difference of 0.0934 and 0.1064 for IDTs and CONCs, respectively. For OME3 and OME4, for which five and three models are available, respectively, the best overall agreement for all targets is provided by the Dinelli_2024[31] model. It achieves an overall ε of 0.1685 and 0.2797 for OME3 and OME4, respectively. Nevertheless, its prediction accuracy for IDTs and CONCs of OME3 is not the highest.
To identify the most accurate model for the combustion of various OMEs, the overall prediction accuracy of three combustion targets for OME1–3 were compared. As shown in Fig. 5, the reduced model Dinelli_2024[31] matches the data best, while good agreement with experimental observation is also achieved by the detailed models of Cai_2020[26] and Shrestha_2022[29].
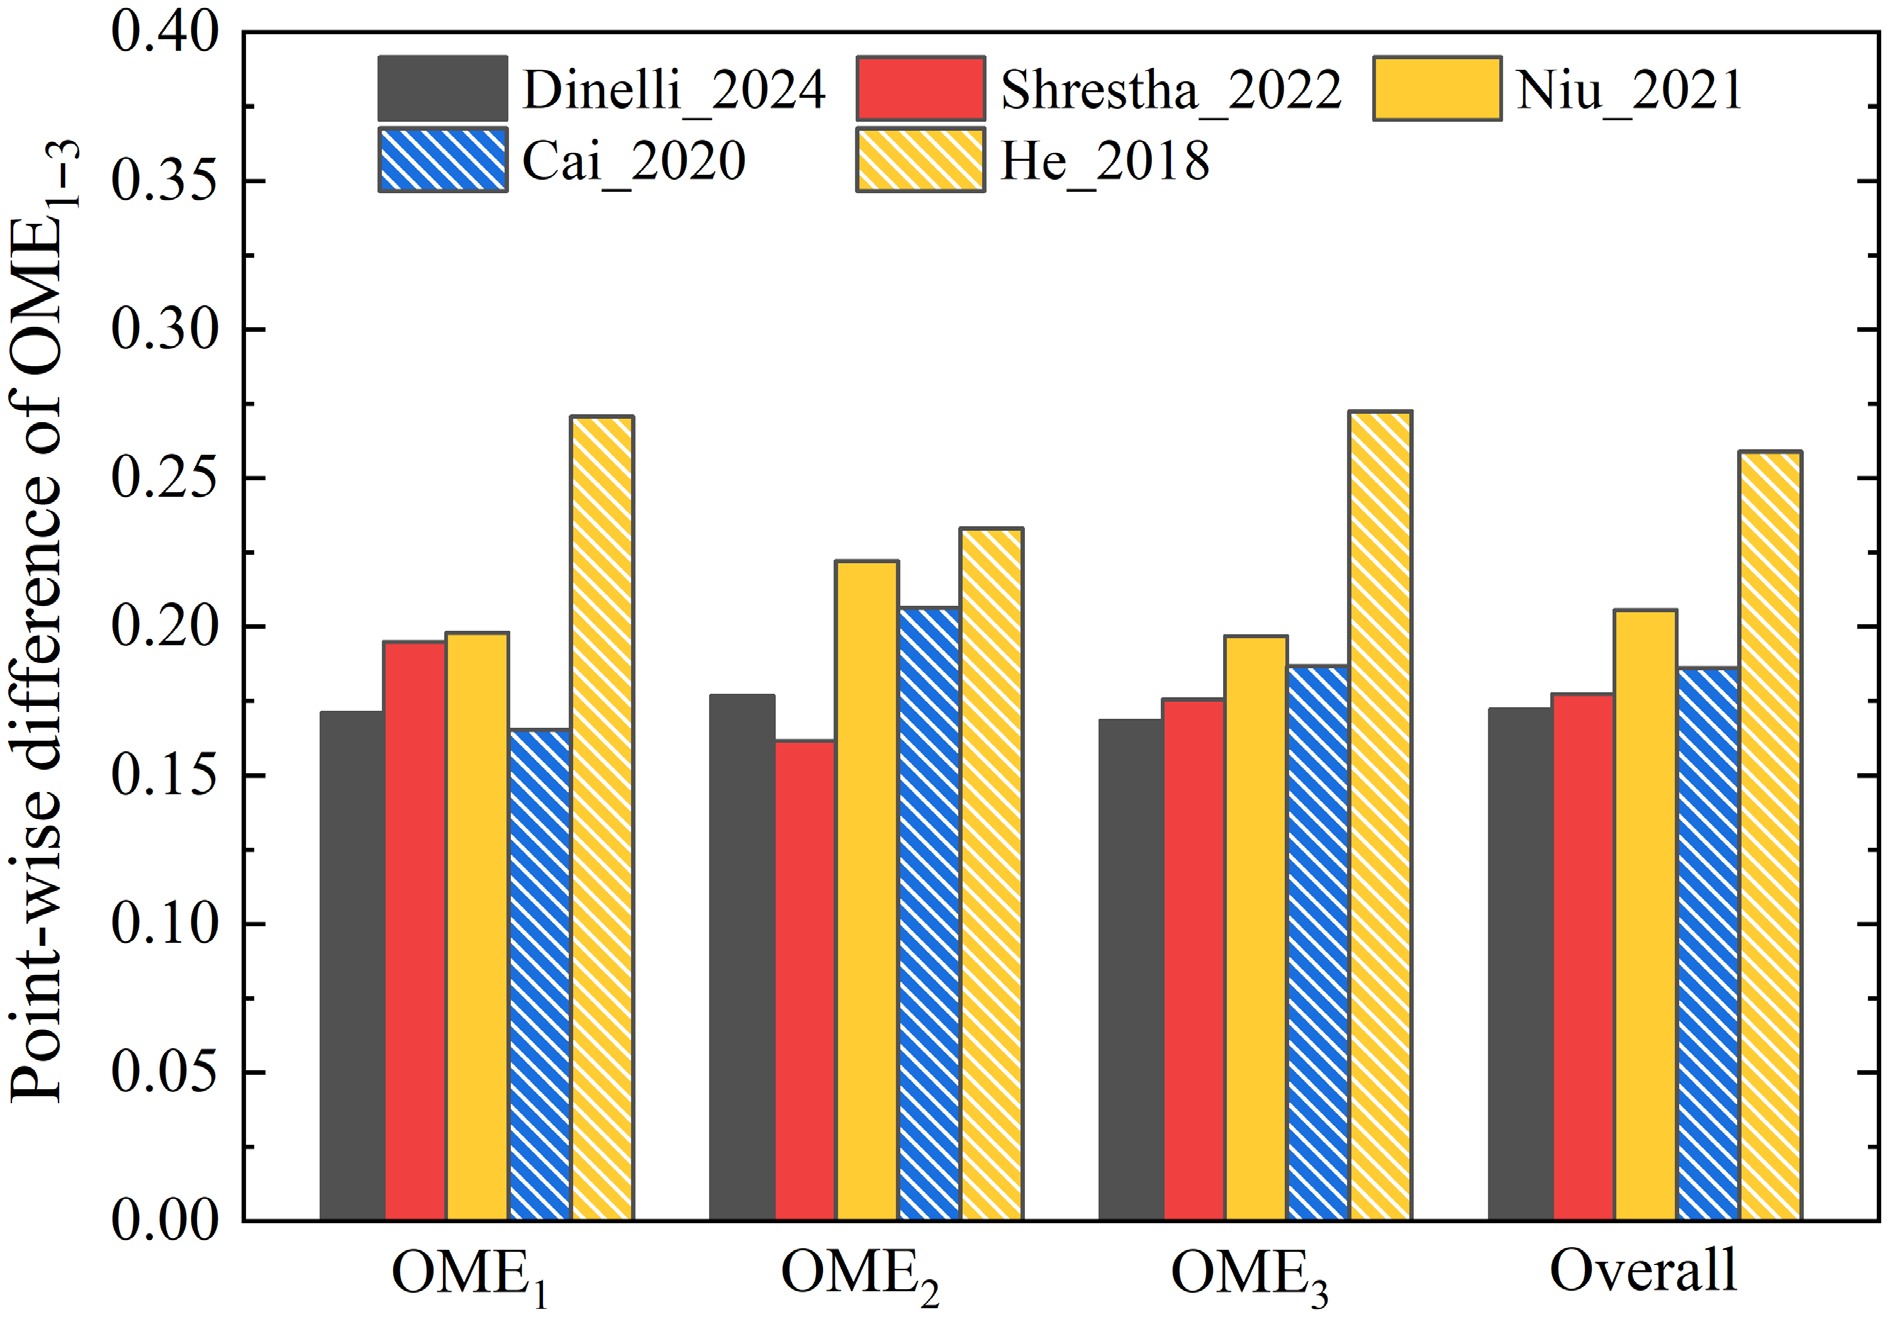
Figure 5.
Point-wise difference between model and data for the combustion of OME1–3.
Overall, it was found that, while several models predict specific datasets with very high accuracy, none of the models provides very satisfactory results for all targets over a wide range of conditions and for different OMEs. For instance, the model of Shrestha_2022[29] achieves higher prediction accuracy for IDTs of OME2 and OME3, while the model of Cai_2020[26] yields better performance for LBVs of OME1–3. Notably, the model of Dinelli_2024[31] demonstrates the best overall performance for OME1–3. However, the performance of detailed models, such as Li_2021[19] for OME1 and Shrestha_2022[29], is superior for OME2. This variance in prediction accuracy can be attributed to the underlying combustion chemistry of models and, more significantly, to the associated kinetic parameters. As mentioned earlier, a number of models[17,27,28] incorporate theoretically calculated results for improved chemical nature and prediction accuracy of models. However, as demonstrated here, the models[26,30,31], which were optimized numerically against data, provide, in general, more satisfactory performance. This highlights the challenges of model development for the prediction of different combustion behaviors of various OMEs.
Kinetic analysis
-
The evaluation of the ten kinetic models reveals significant variations in their numerical performance for different combustion targets and OMEs. These discrepancies are mainly attributed to the elementary reactions and their rate coefficients adopted in each model[18,19,25,26,29]. Thus, sensitivity and flux analyses are performed with selected models for different combustion targets. And their results are presented in the following to identify the controlling reactions and their parameters, which should be further investigated numerically or experimentally. In this study, the sensitivity coefficient Si of the reaction i to the combustion target Y is defined as Eq. (3):
$ {{S}}_{{i}}=\dfrac{{{A}}_{{i}}}{{Y}}\cdot\dfrac{{\partial Y}}{{{\partial A}}_{{i}}}$ (3) where, Ai is the pre-exponential factor of the reaction i. A positive sensitivity coefficient characterizes reactions that increase the value of the target.
Auto-ignition
-
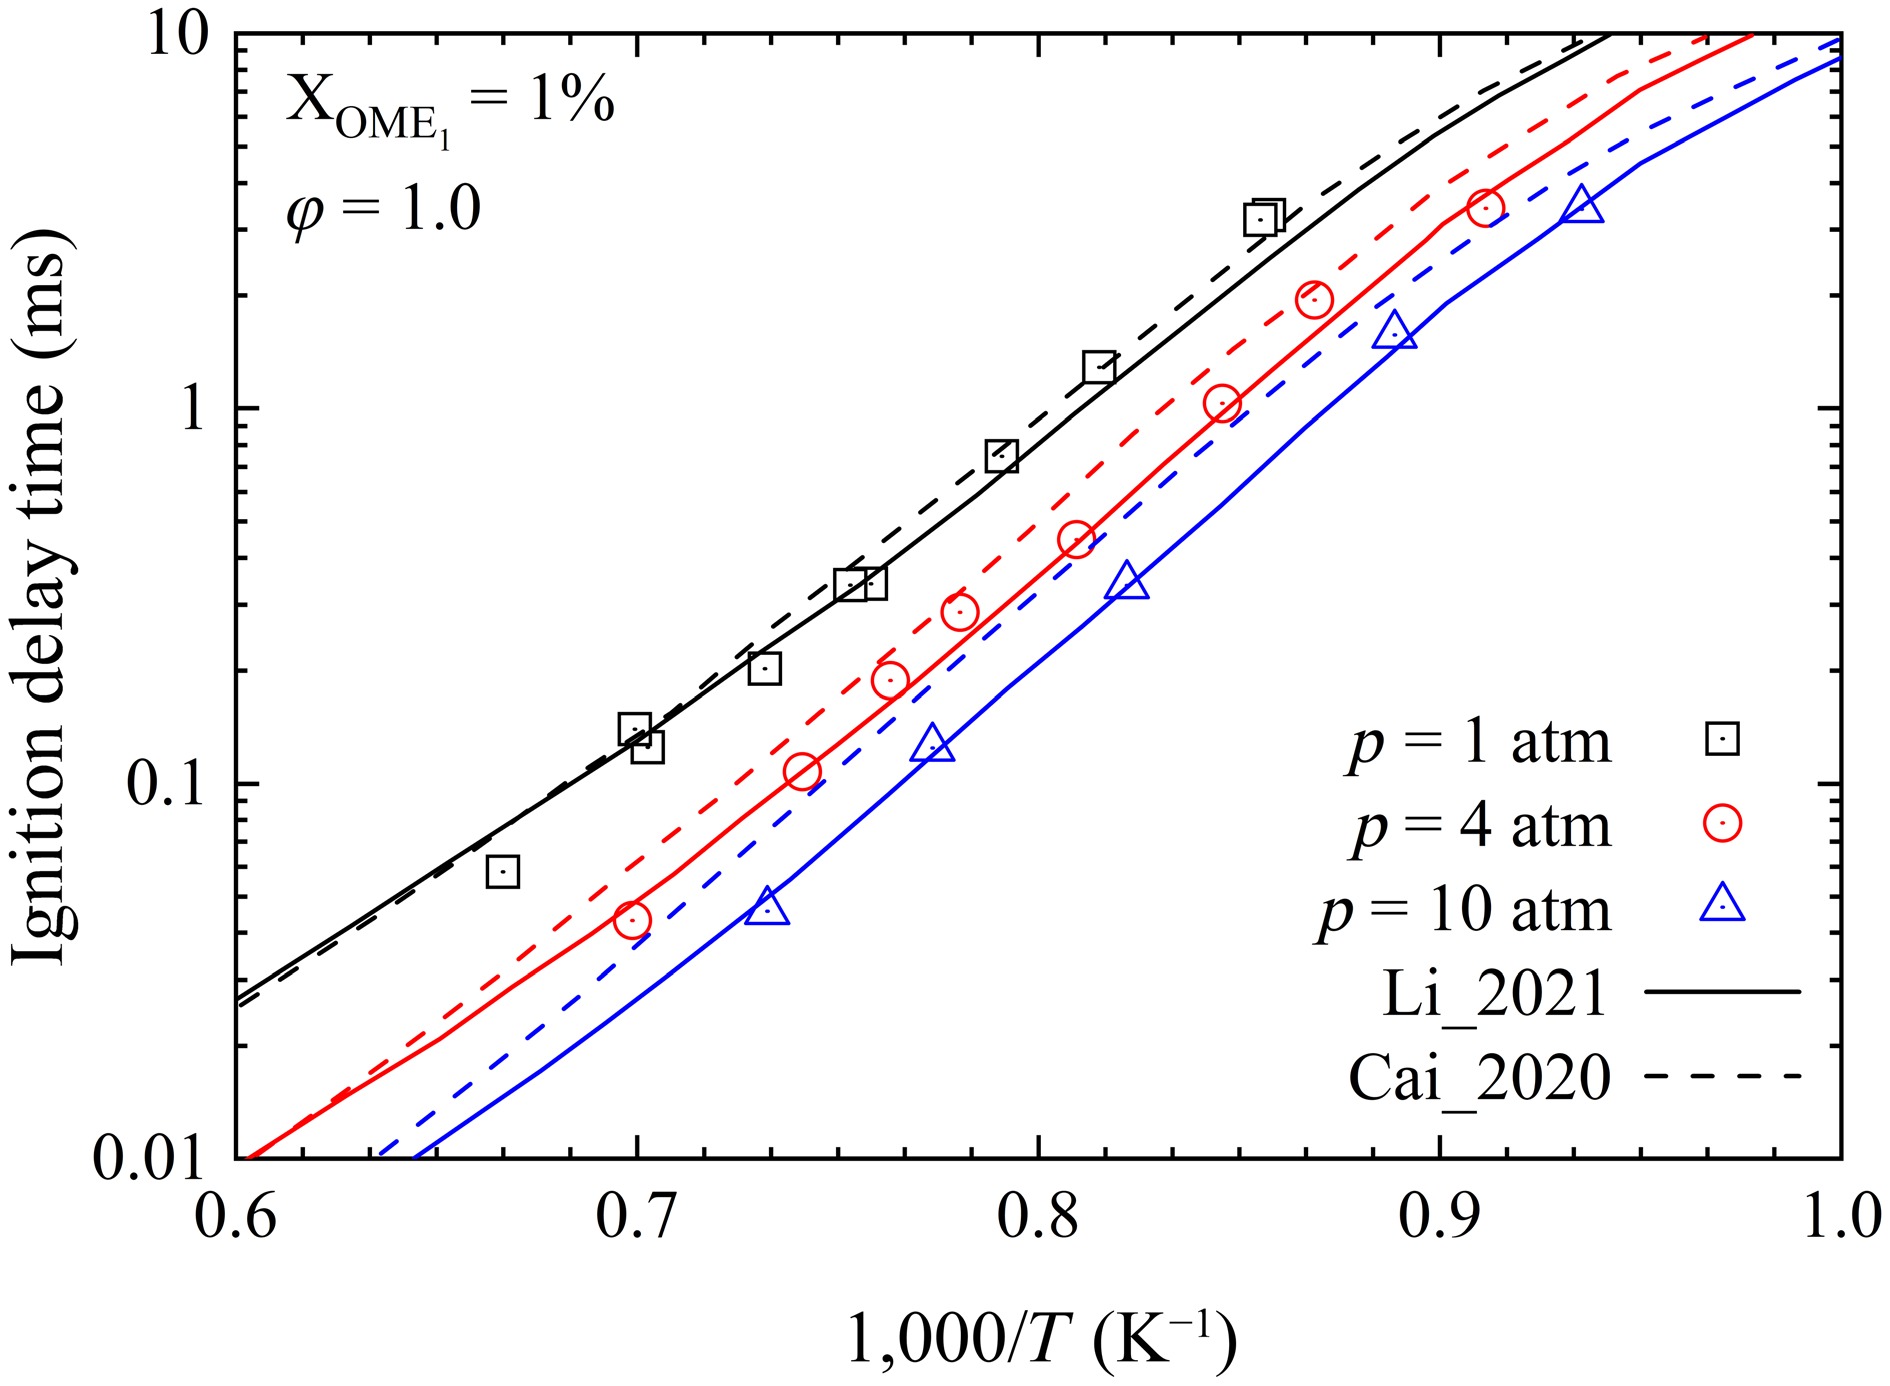
While the Li_2021[19] and Cai_2020[26] models both exhibit very low point-wise differences for the prediction of the IDTs of OME1, their predictions are significantly different at high temperatures. As shown in Fig. 6, the Li_2021[19] model matches the data at the three investigated pressures, while the Cai_2020[26] model overestimates the IDTs, particularly at higher pressure.
To investigate these discrepancies in model predictions, sensitivity analyses of IDTs of OME1 were performed by using the Li_2021[19] and Cai_2020[26] models at conditions of 1, 4, and 10 atm, 1,250 K, and φ = 1.0. As depicted in Fig. 7a, b, the reaction
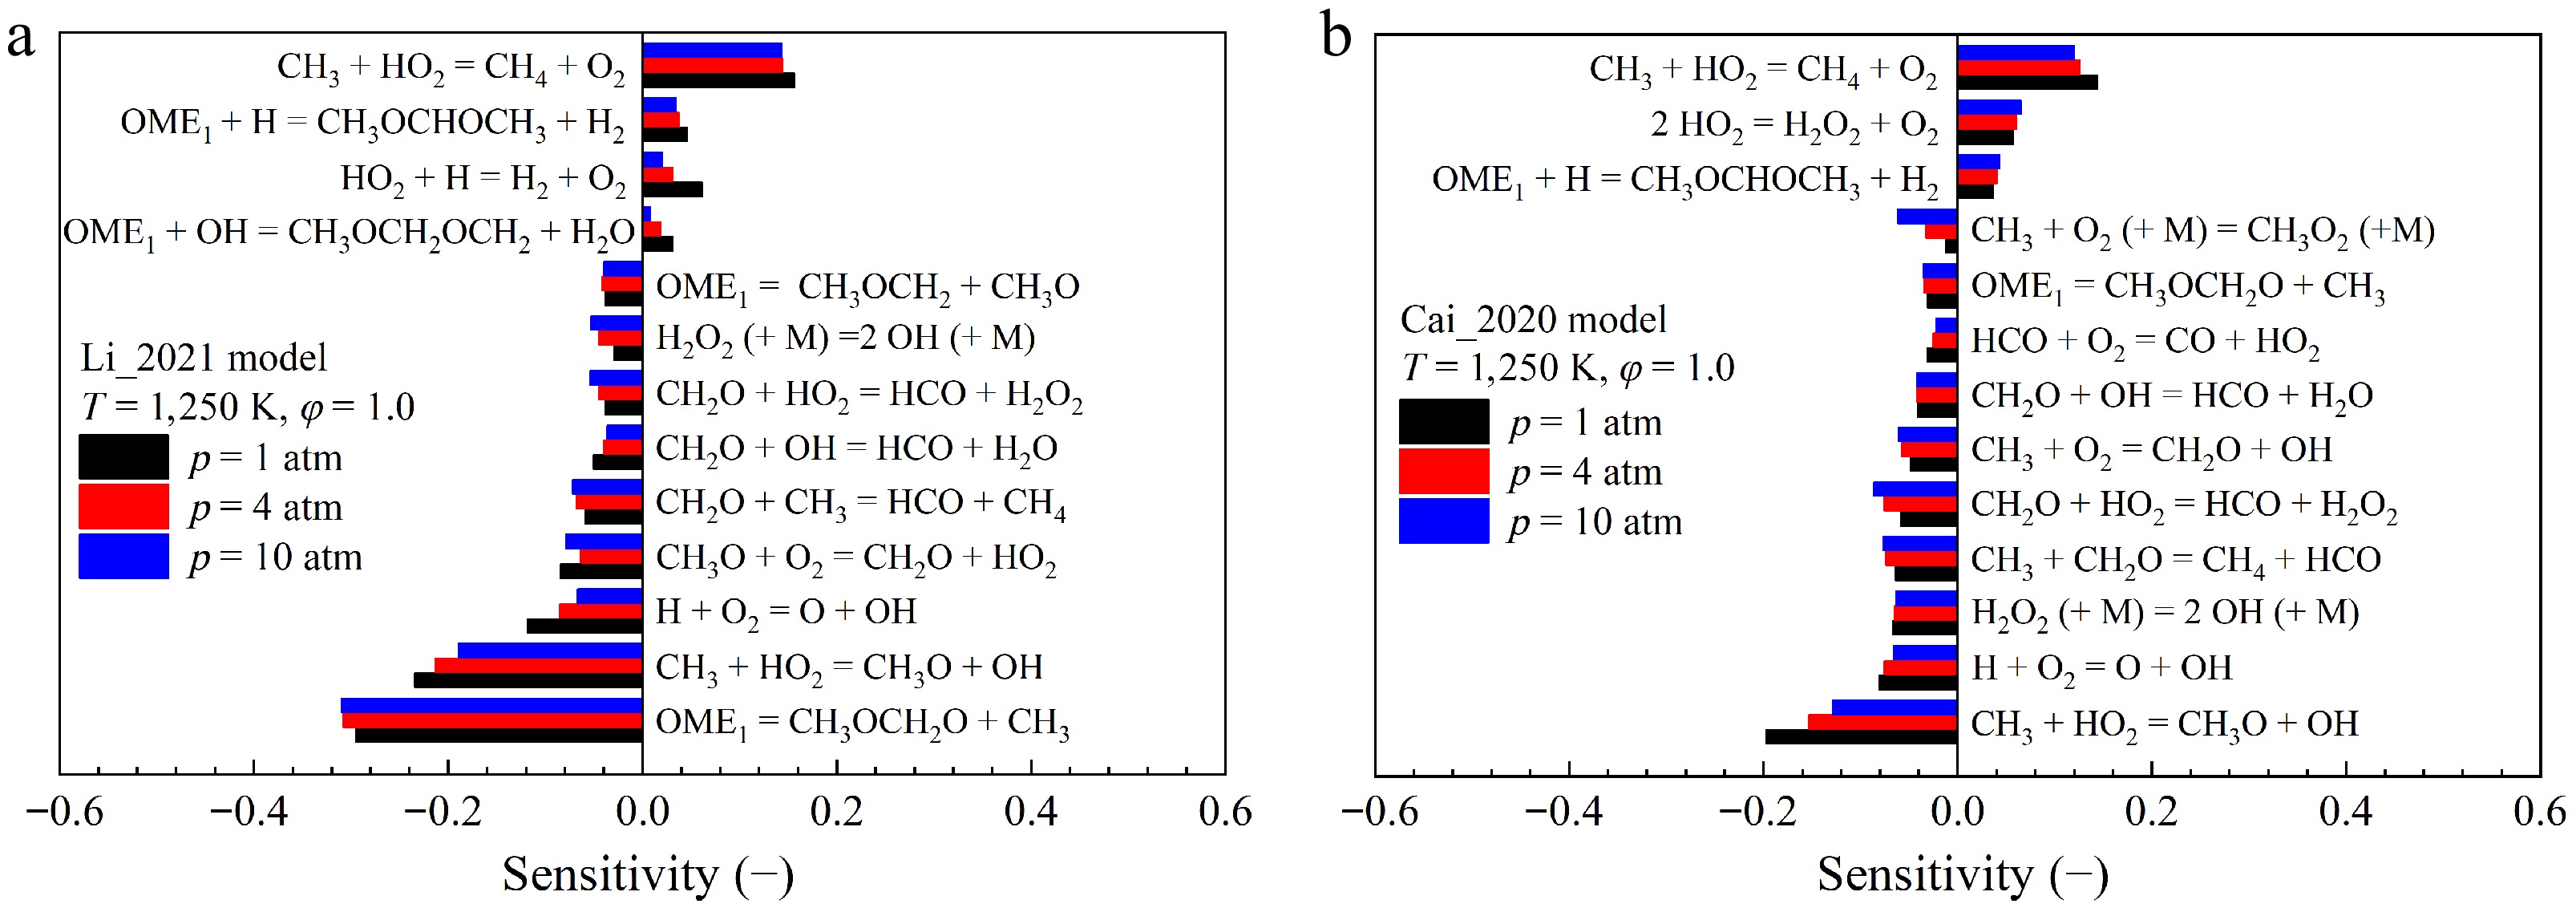
$ \rm OME_1 = CH_3OCH_2+CH_3$ (R1) in the Li_2021[19] model exhibits the largest negative sensitivity and promotes the auto-ignition propensity significantly. However, this reaction shows much smaller sensitivity in the Cai_2020[26] model. This notable discrepancy is further observed in reaction flux analysis, whose results are shown in Fig. 8. The reaction fluxes at 20% OME1 consumption at 1,250 K, 10 atm, and φ = 1.0 are estimated and presented. While both models predict similar contributions from the H-atom abstraction pathways, remarkable discrepancies in reaction fluxes are observed for different fuel decomposition reactions. Specifically, while the direct fuel decomposition reactions are crucial in the Li_2021[19] model, with a total contribution of 23%, they consume only 7% of OME1 in the Cai_2020[26]. As shown in Fig. 8, the fuel decomposition reactions via unimolecular H-atom transfer
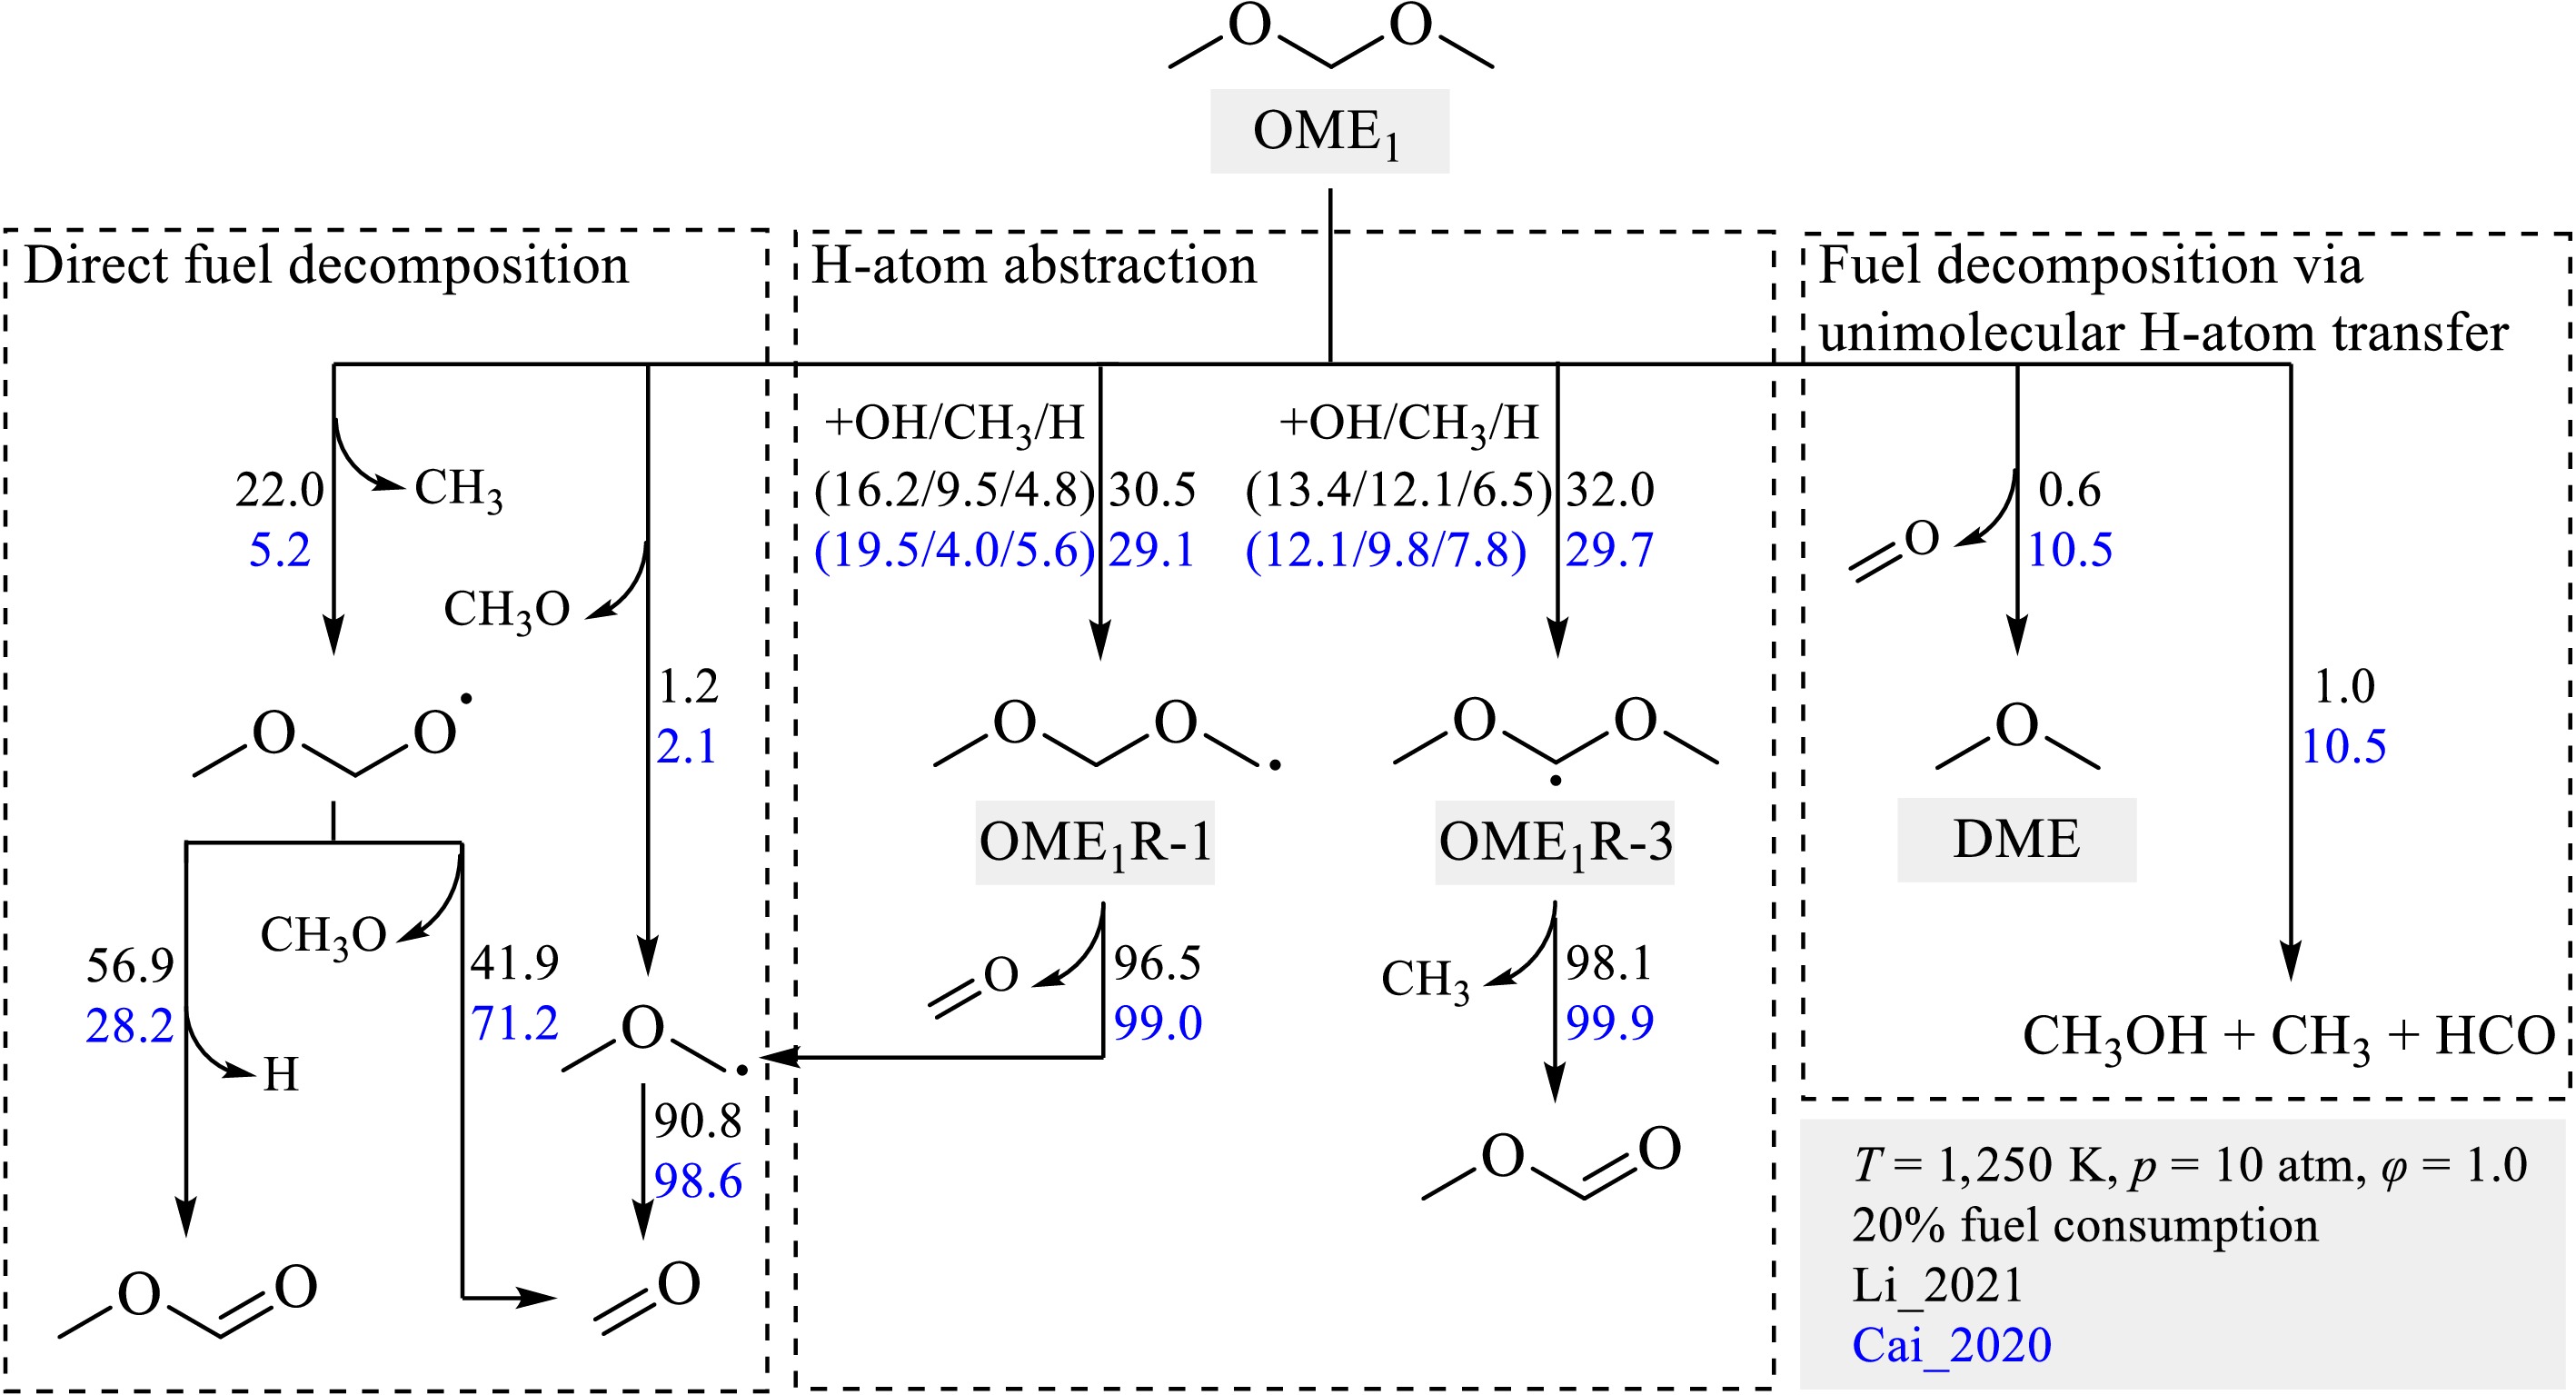
${\text{OME}}_{\text{1}}={\text{CH}}_{\text{3}}\text{O}\text{H}+{\text{CH}}_{\text{3}}+\text{H}\text{C}\text{O} $ (R2) and
$ {\text{OME}}_{\text{1}}={\text{}\text{CH}}_{\text{3}}{\text{OCH}}_{\text{3}}+{\text{CH}}_{\text{2}}\text{O}$ (R3) become important in the Cai_2020[26] model by consuming 21% of fuel.
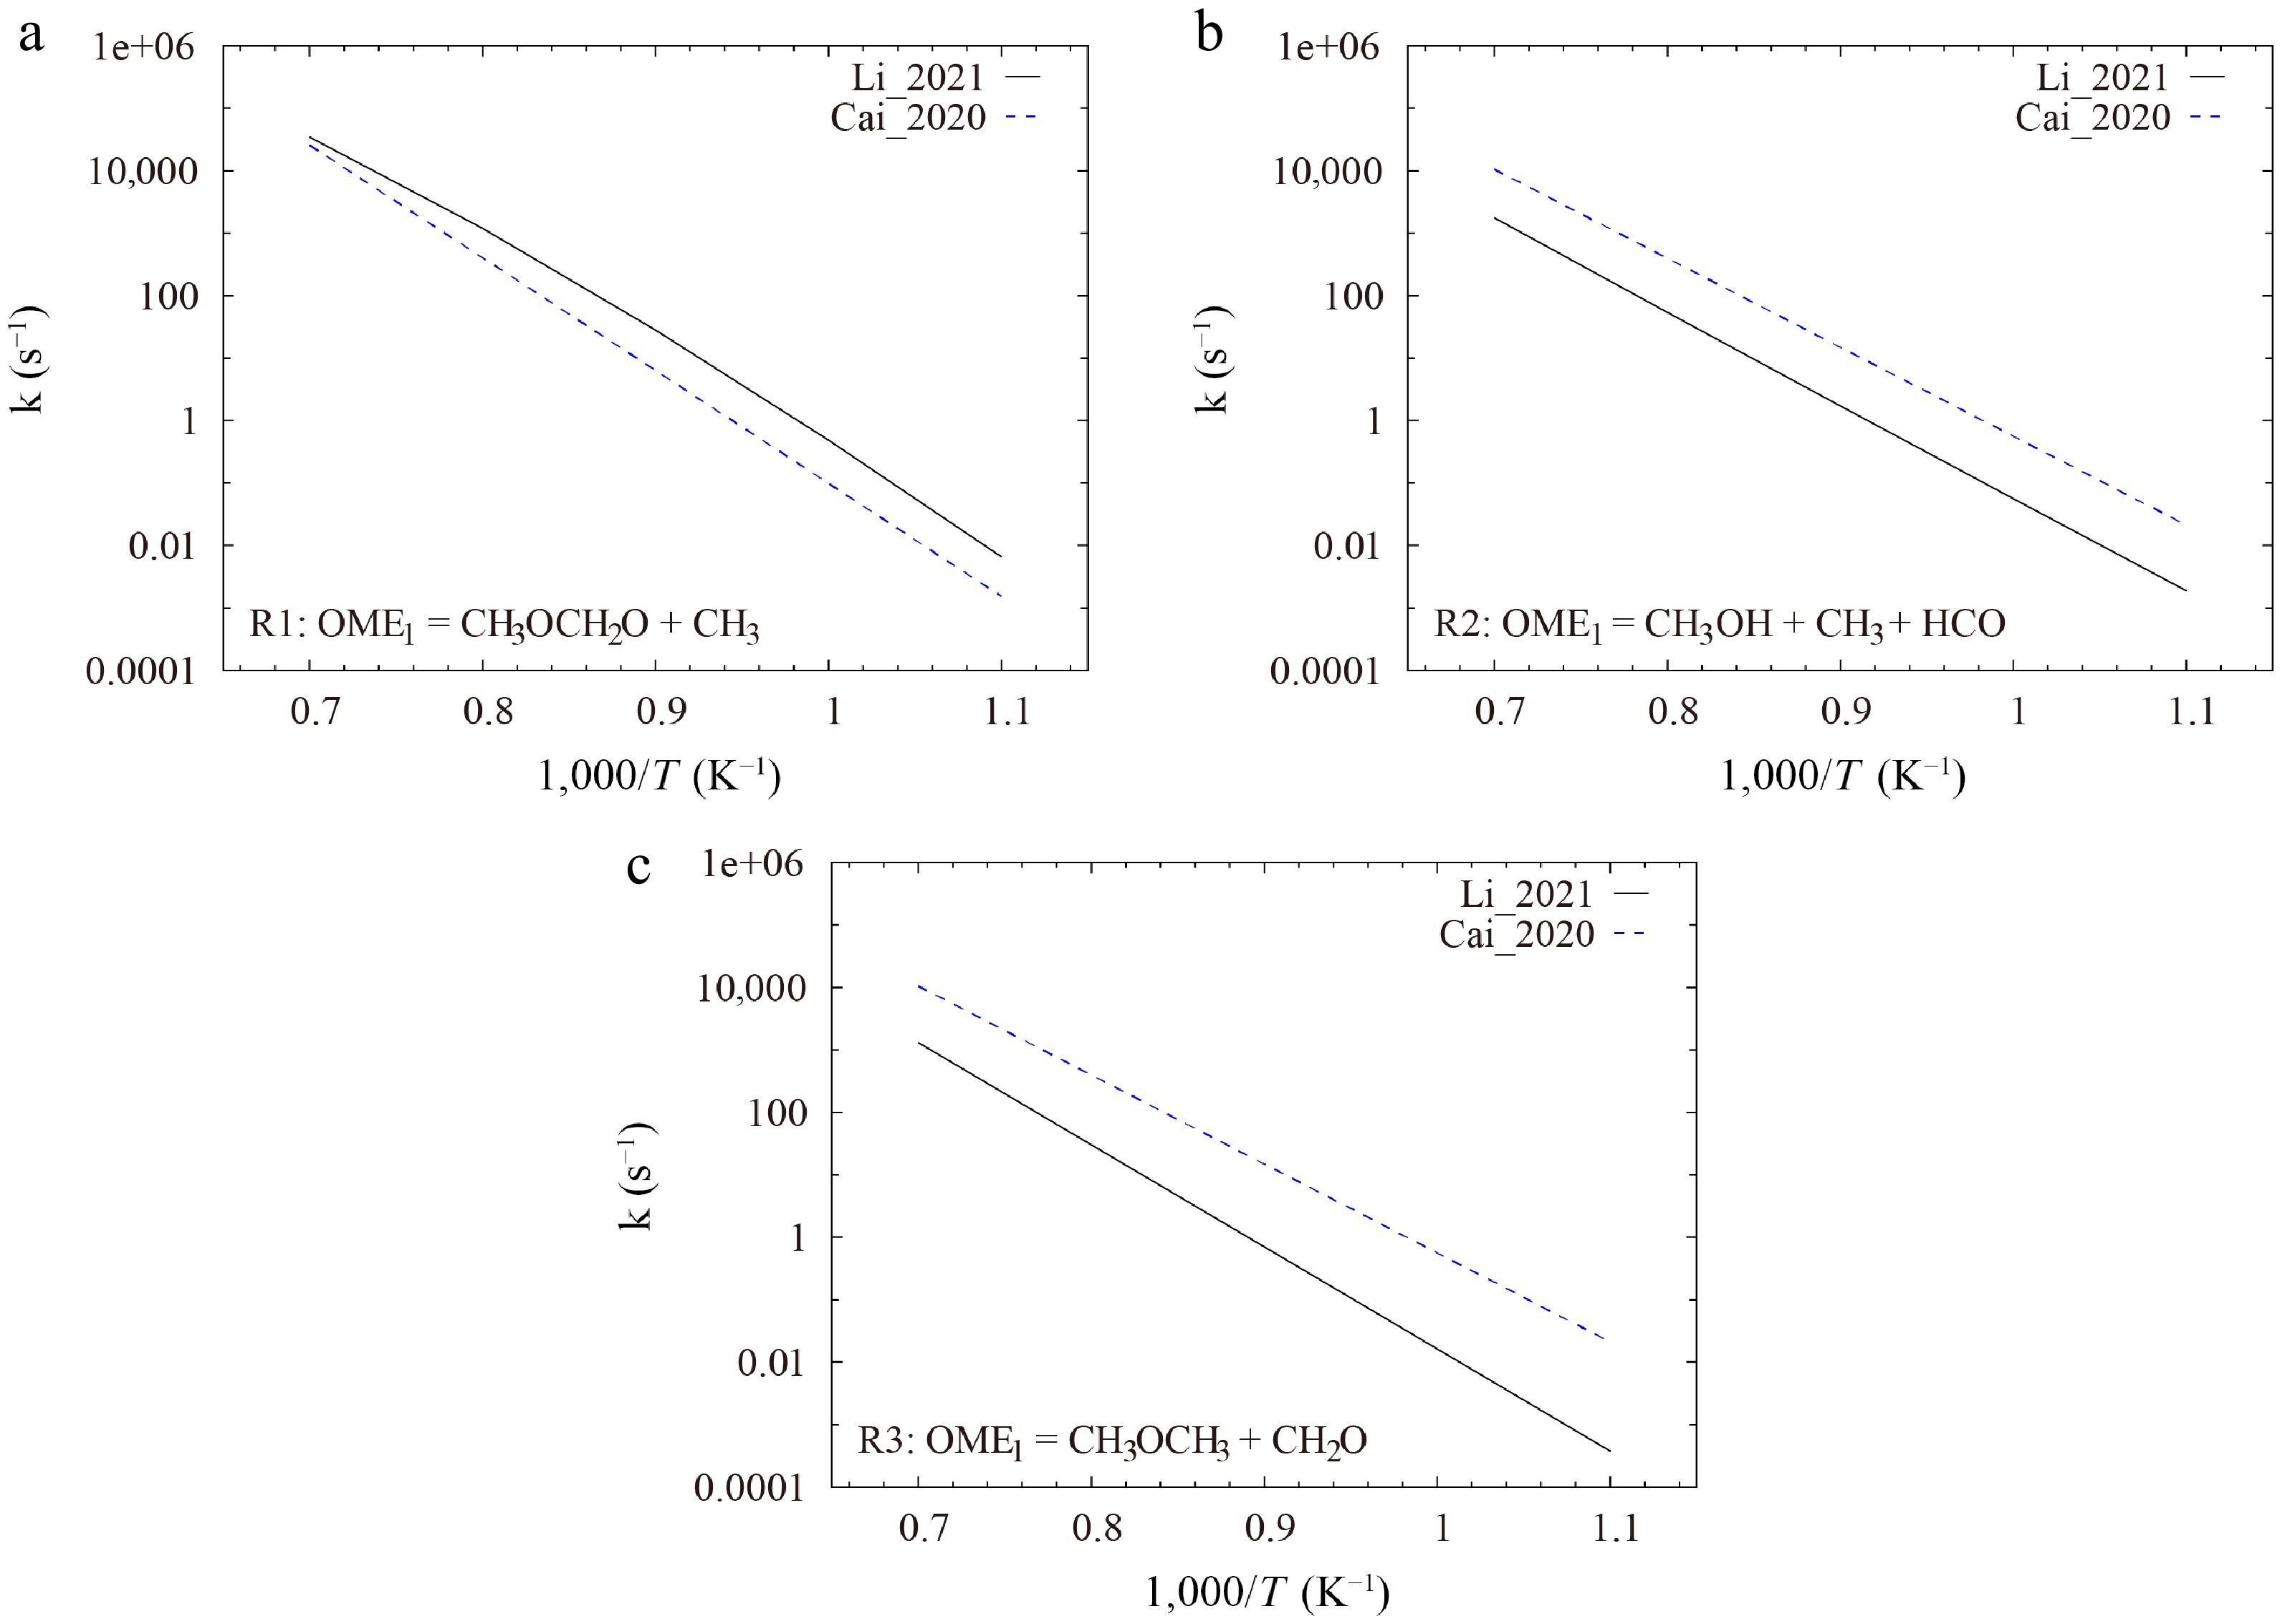
It is found that, for the direct decomposition reactions of OME1, the Li_2021[19] model adopts rate coefficients from the recent quantum chemistry calculations by Golka et al.[20], while the Cai_2020[26] model estimates the parameters based on analogy with corresponding reactions of DME and DEE. As shown in Fig. 9a, the rate coefficient of R1 used by the Li_2021[19] model is roughly three times larger than that of the Cai_2020[26] model. For the fuel decomposition reactions via unimolecular H-atom transfer, the discrepancies between the rate constants of the two models are even more pronounced. In the Li_2021[19] model, the rate rule for alcohol elimination in acyclic ether, as reported by Lizardo-Huerta et al.[51], was used to estimate the rate parameter of the reaction R2, and the rate coefficients of the reaction R3 were taken from the theoretical study by Al-Otaibi et al.[52]. Conversely, the Cai_2020[26] model specifies the rate constants of 1 × 10¹⁴ × exp(−62,500/RT) for both R2 and R3, based on an analogy with the reaction of DEE = C2H5OH + C2H4 from Yasunaga et al.[53]. These rate constants of R2 and R3 are approximately an order of magnitude larger than those used in the Li_2021[19] model, as illustrated in Fig. 9b, c. For instance, at a low temperature of 909 K, the rate constants of the Cai_2020[26] model is 56 times larger. These differences contribute to the significant differences in the reaction fluxes and IDT predictions. Notably, direct experimental or theoretical rate coefficient data are currently lacking for the reaction R2 and are highly appreciated. Potential energy search by using tools, such as Kinbot[54], coupled with high-level quantum chemical calculations and master equation analyses, is strongly recommended to estimate the rate coefficients of R2, R3, and similar unimolecular H-atom transfer reactions.
Sensitivity analyses were also performed for the auto-ignition of stoichiometric OME3/air mixtures at 20 bar and temperatures of 600, 850, and 1,200 K to investigate the underlying reaction kinetics of larger OMEs. The Shrestha_2022[29] model was selected for the analyses due to its highest prediction accuracy for the IDTs of OME3. The results, as shown in Fig. 10, reveal that the sensitivities of reactions vary significantly at different temperatures. Similar to OME1, at high temperatures, the IDTs of OME3 are highly sensitive to the reactions of small molecules. The decomposition of hydrogen peroxide exhibits the highest sensitivity, while its importance vanishes at low temperatures. In the low-temperature range, the auto-ignition of OME3 is primarily governed by the conventional low-temperature reaction pathways, which include the first addition of O2 to fuel radicals, peroxy (ROO) radical isomerization, the second O2 addition to hydroperoxide (QOOH), isomerization of peroxy hydroperoxide (O2QOOH), and the decomposition of carbonyl hydroperoxide, as reported by various studies[17−19,26,29]. The sensitivity of IDTs in the intermediate-temperature range is more complex. Both OME-specific reactions and reactions of small molecules are of high importance.
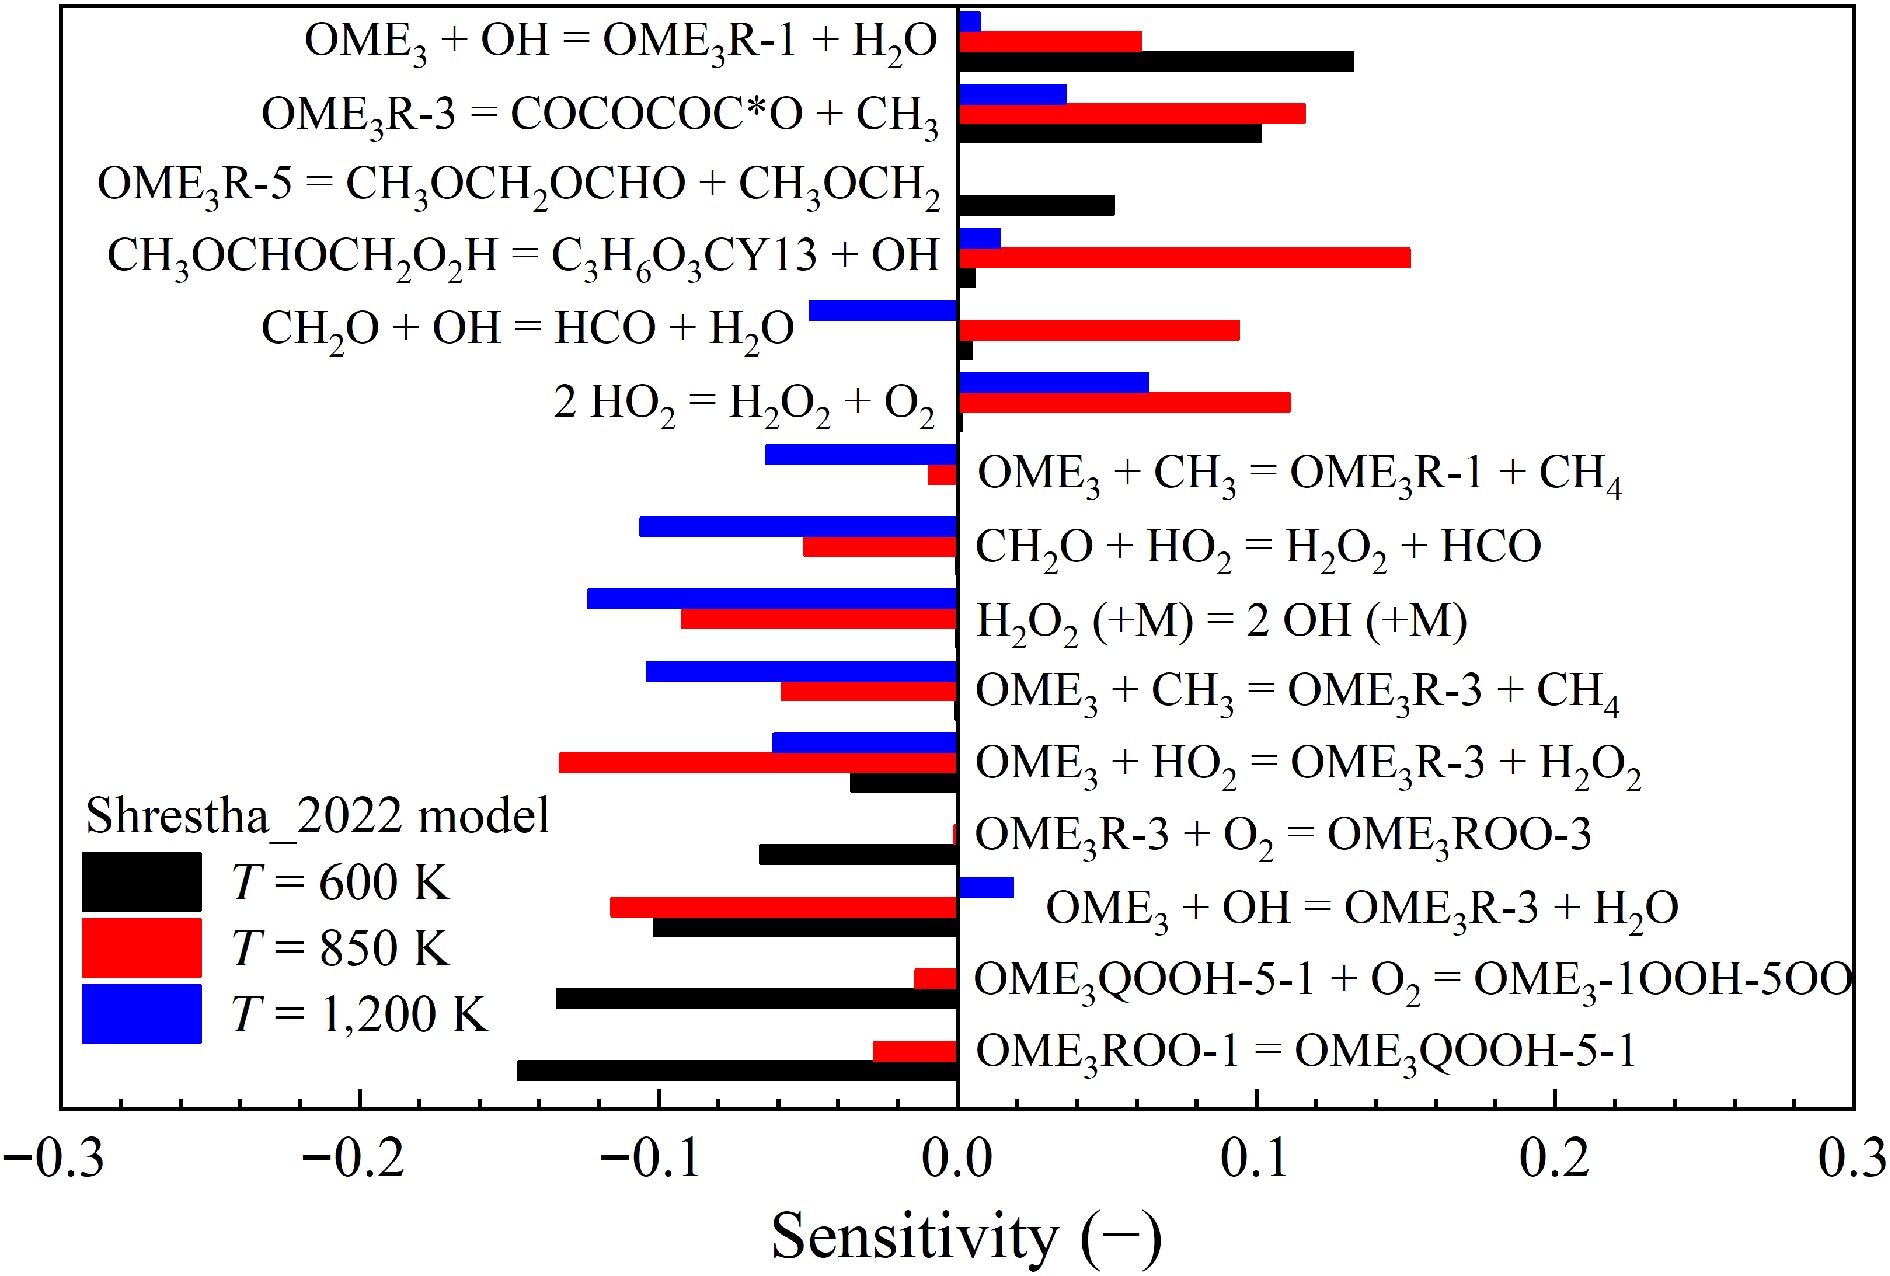
Figure 10.
Sensitivities of IDTs on elementary reactions for OME3/air mixtures at 20 bar, φ = 1.0, and T = 600, 850, and 1,200 K, calculated by using the Shrestha_2022[29] model.
For further insights into the reaction kinetics of larger OMEs, the reaction flux analysis for the auto-ignition of OME3 was conducted at the identical conditions of the sensitivity analyses. The results are shown in Fig. 11. OME3 is primarily consumed through H-atom abstraction by OH radicals, yielding three fuel radicals OME3R-1, OME3R-3, and OME3R-5. As predicted by the Shrestha_2022[29] model, the formation of OME3R-3 is the dominant pathway. These fuel radicals are further consumed via the reaction with O2 to form ROO radicals or β-scission. The O2 addition to fuel radicals is important only at lower temperatures. The product of O2 addition ROO radical isomerizes primarily to form QOOH. Similar to the first O2 addition, the secondary addition of O2 to QOOH radicals remains significant only at lower temperatures. As the temperature increases, the β-scission reactions become increasingly dominant. Notably, the β-scission of OME3R-1 and OME3R-3 radicals generates OME2R-1 and OME1R-1, respectively. This observation that fuel radicals of longer-chain OMEs yield primary fuel radicals of shorter-chain OMEs is evidenced by recent experimental[11] and theoretical[27,55] studies. It highlights the importance of the reaction mechanisms of smaller OMEs for the accurate description of the combustion behaviors of long-chain OMEs.
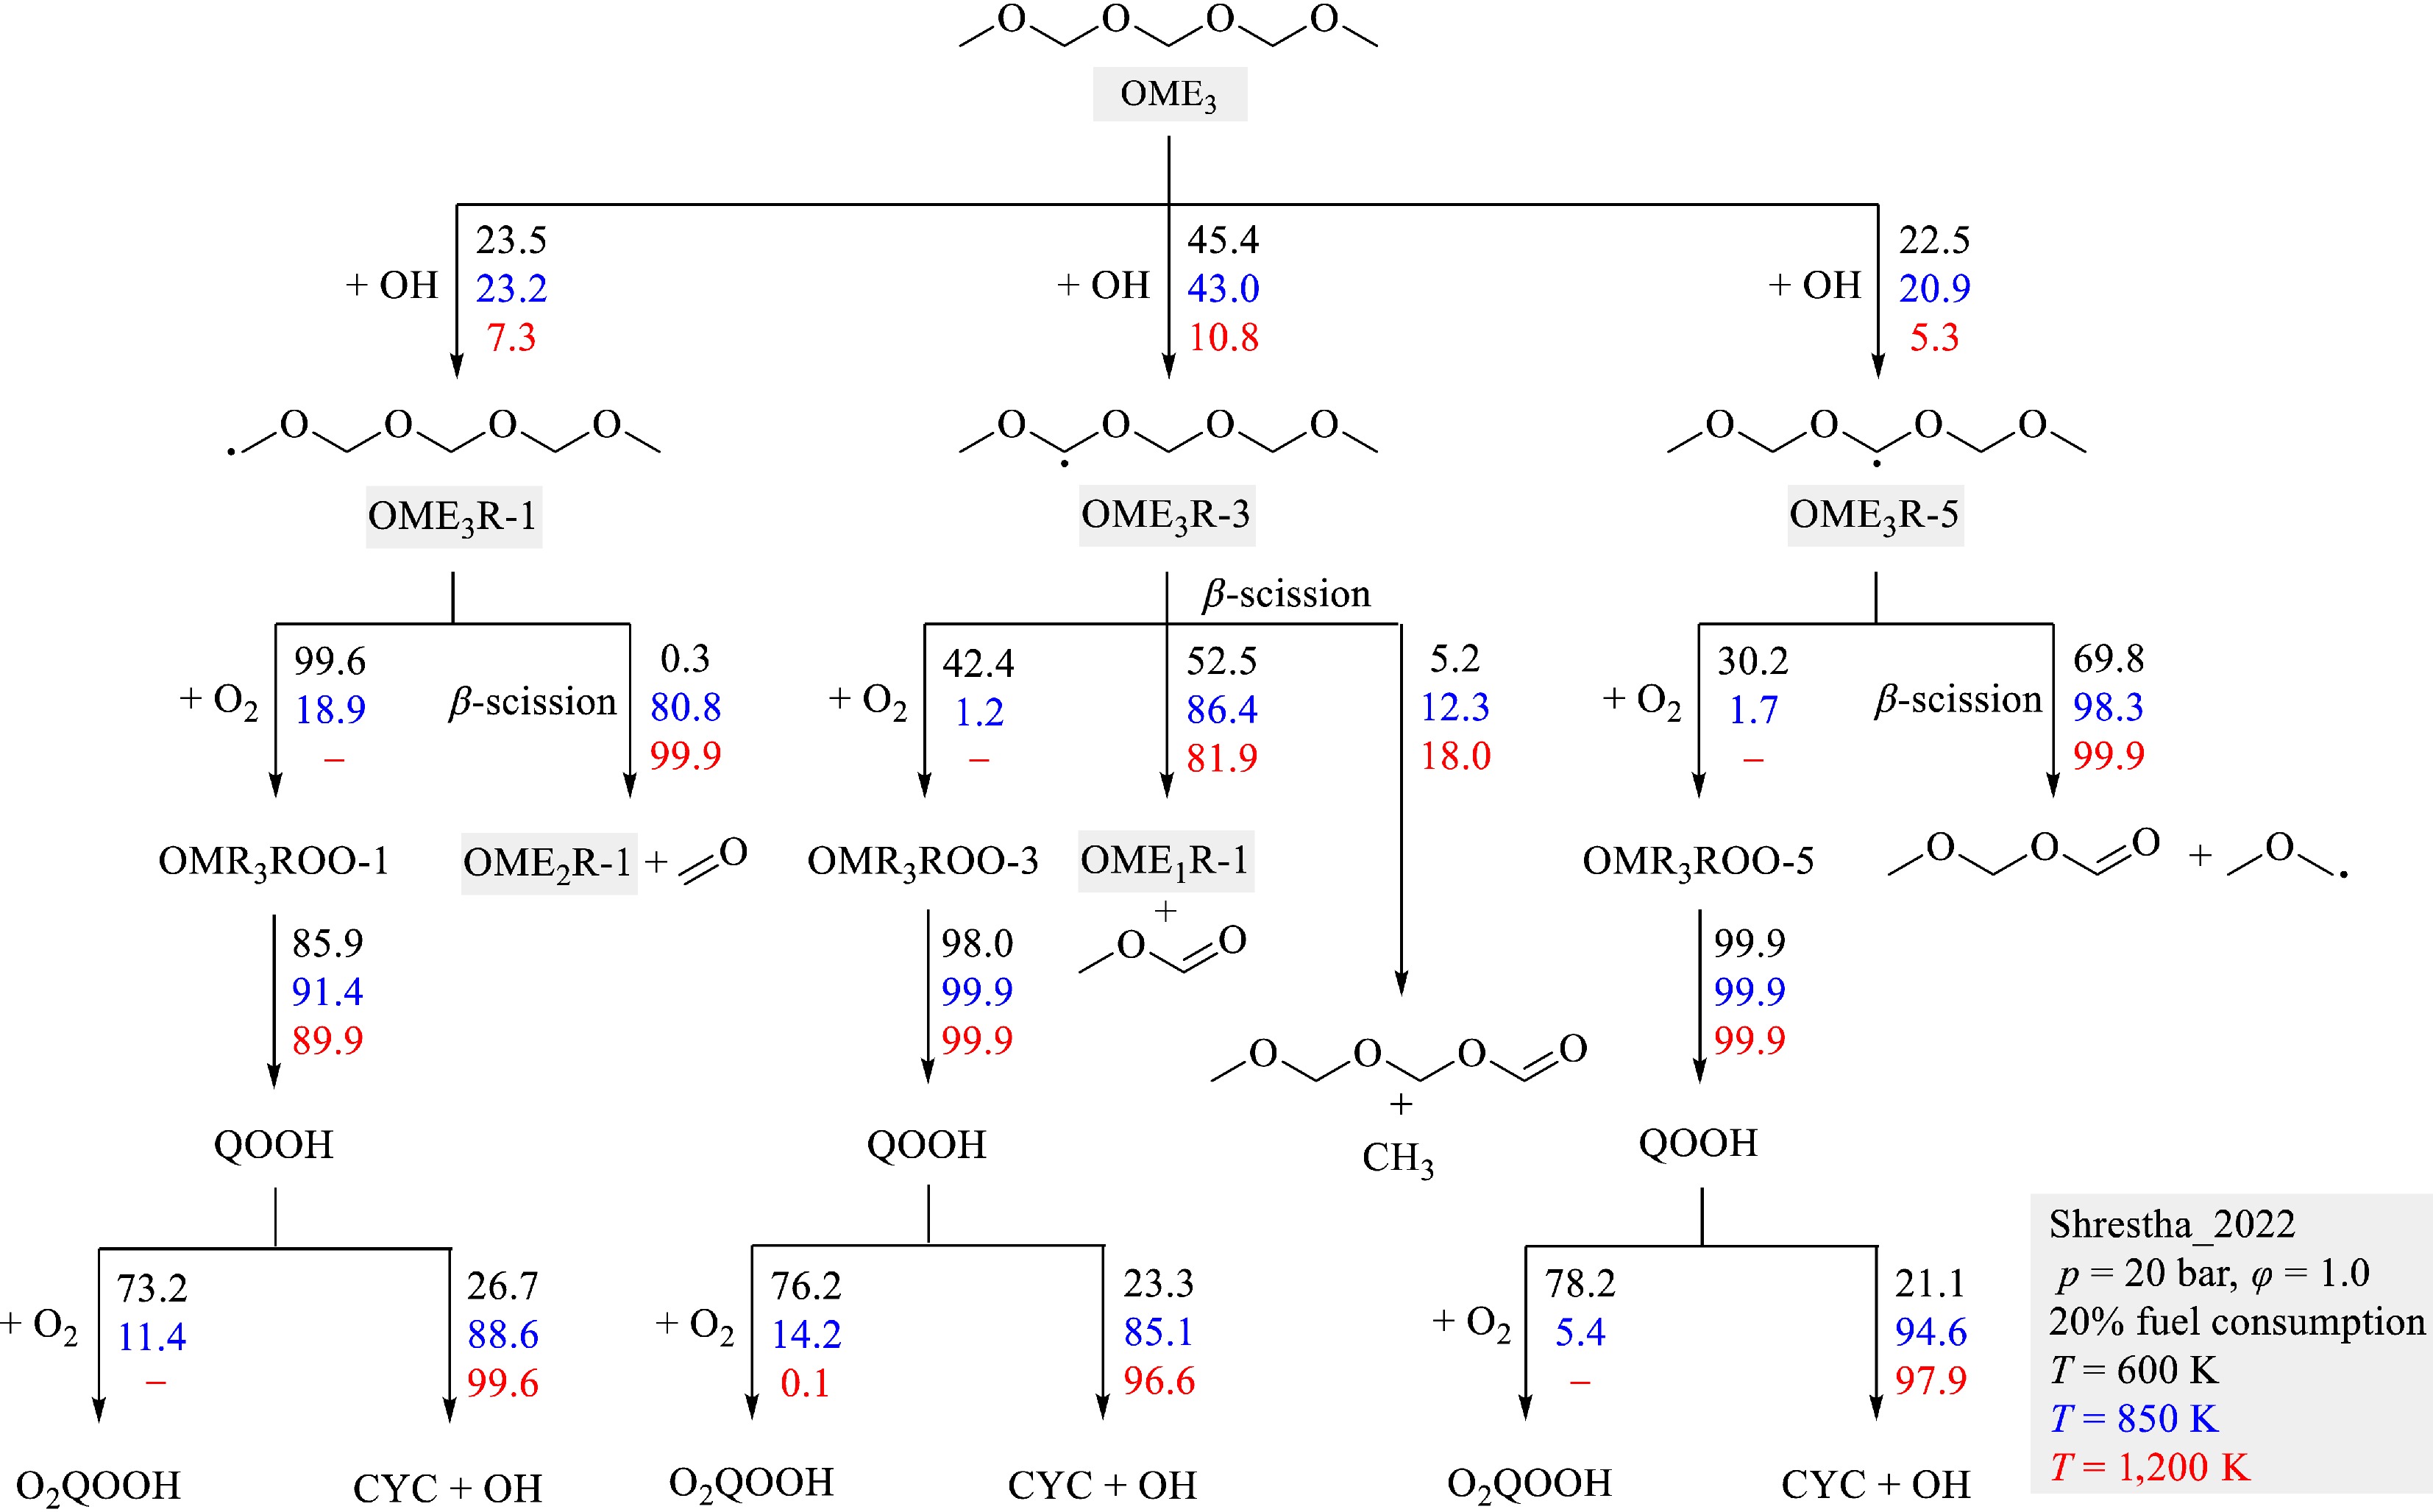
Figure 11.
Reaction fluxes during the auto-ignition of OME3/air mixtures at 20 bar, φ = 1.0, T = 600, 850, and 1,200 K, and 20% fuel consumption calculated by using the Shrestha_2022[29] model.
Laminar burning velocity
-
LBVs are fundamental properties of premixed flames[56]. To explore the kinetics governing the premixed flames of OMEs, sensitivity analyses were performed here. The Cai_2020 model[26], which shows the best performance for LBVs of OME1−3 among available detailed models, was applied in sensitivity analyses for deeper insights into the underlying kinetics of premixed flames of OMEs.
The results of sensitivity analyses for LBVs of OME1−4 on elementary reactions at atmospheric pressure, T = 400 K, and φ = 0.6, 1.0, and 1.4 are shown in Fig. 12. As demonstrated, the LBVs of OME1−4 are predominantly governed by reactions involving small molecules, as reported by various literature studies[57−59] on hydrocarbon fuels. The fuel-specific reactions, such as fuel decomposition and H-atom abstraction, have very minor impacts by showing considerably lower sensitivities compared to those of C0-C1 chemistry.
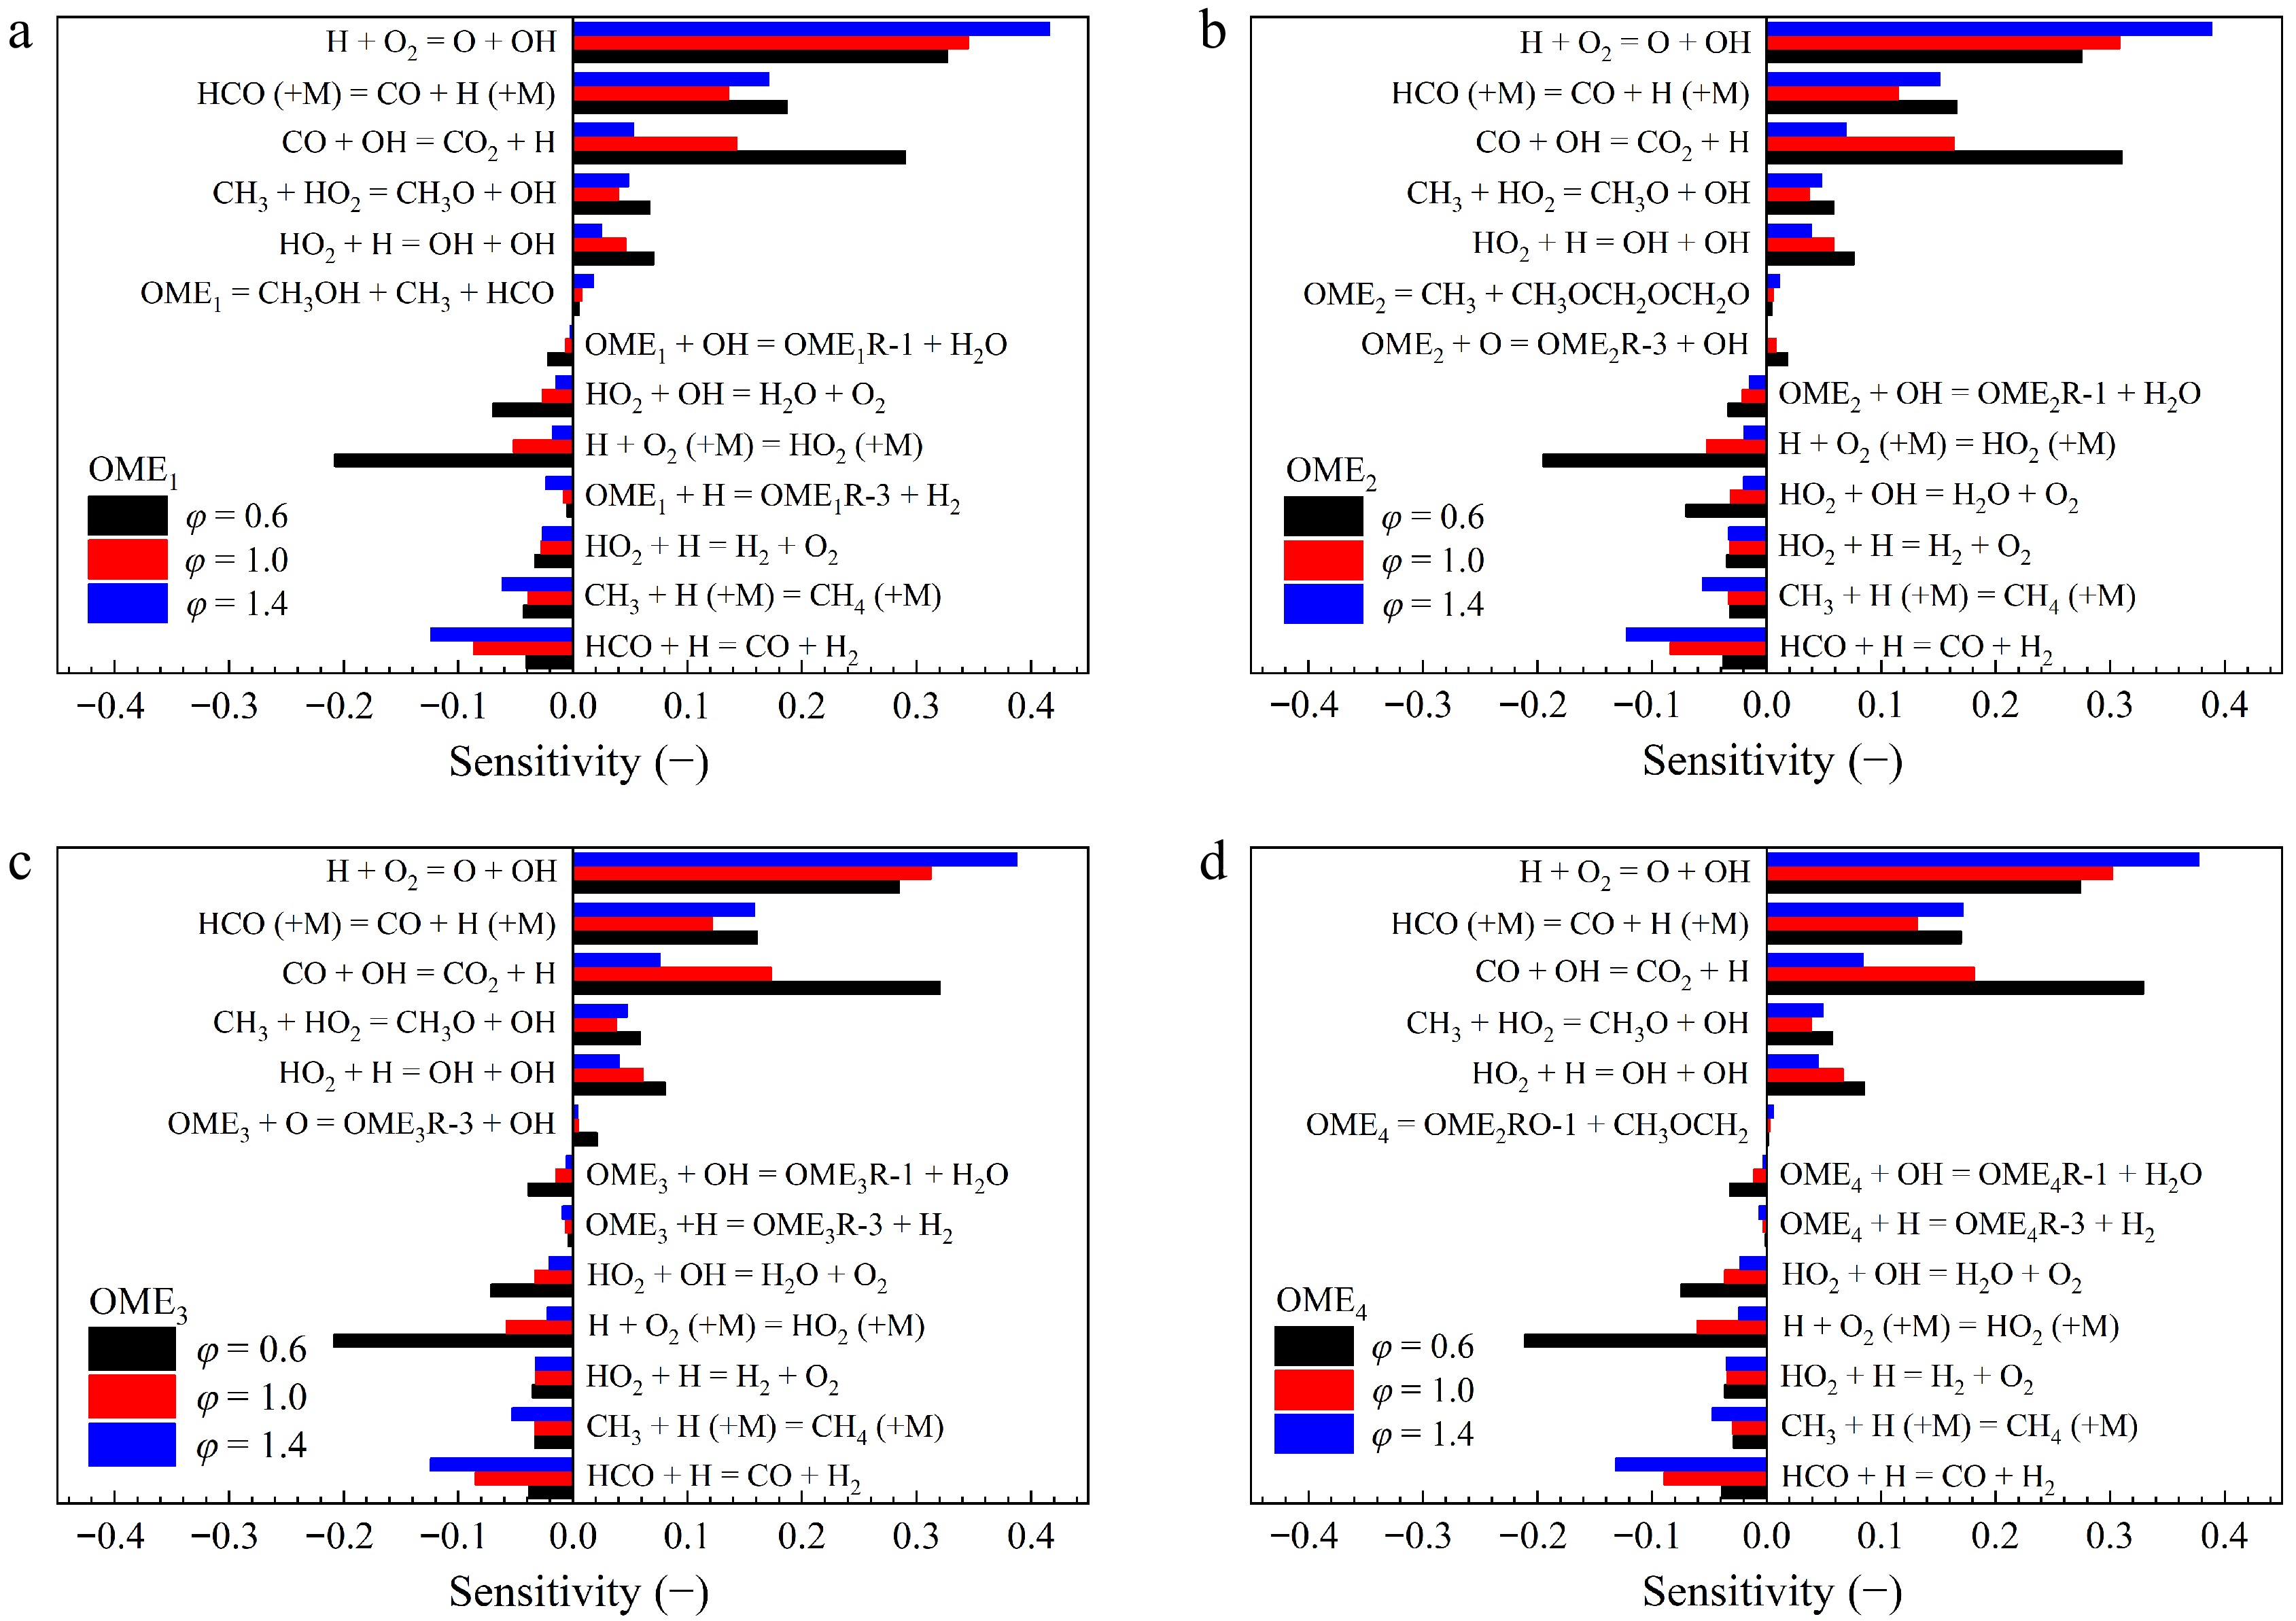
Figure 12.
Sensitivities of LBVs on elementary reactions of OME1−4/air mixtures at 400 K, 1 atm, and φ = 0.6, 1.0, and 1.4 calculated by using the Cai_2020[26] model.
It is important to acknowledge that the traditional sensitivity analyses, which focus solely on the impacts of Ai, have inherent limitations, as the influence of Ea can sometimes be dominant[60]. Moreover, reactions at partial equilibrium conditions may exhibit negligible Ai sensitivities due to the compensation of forward and reverse rates[61], even though they carry significant reaction fluxes. Also, sensitivities are supposed to vary considerably for conditions within a propagating flame, which cannot be captured by global sensitivity analysis[62].
Species concentration
Pyrolysis
-
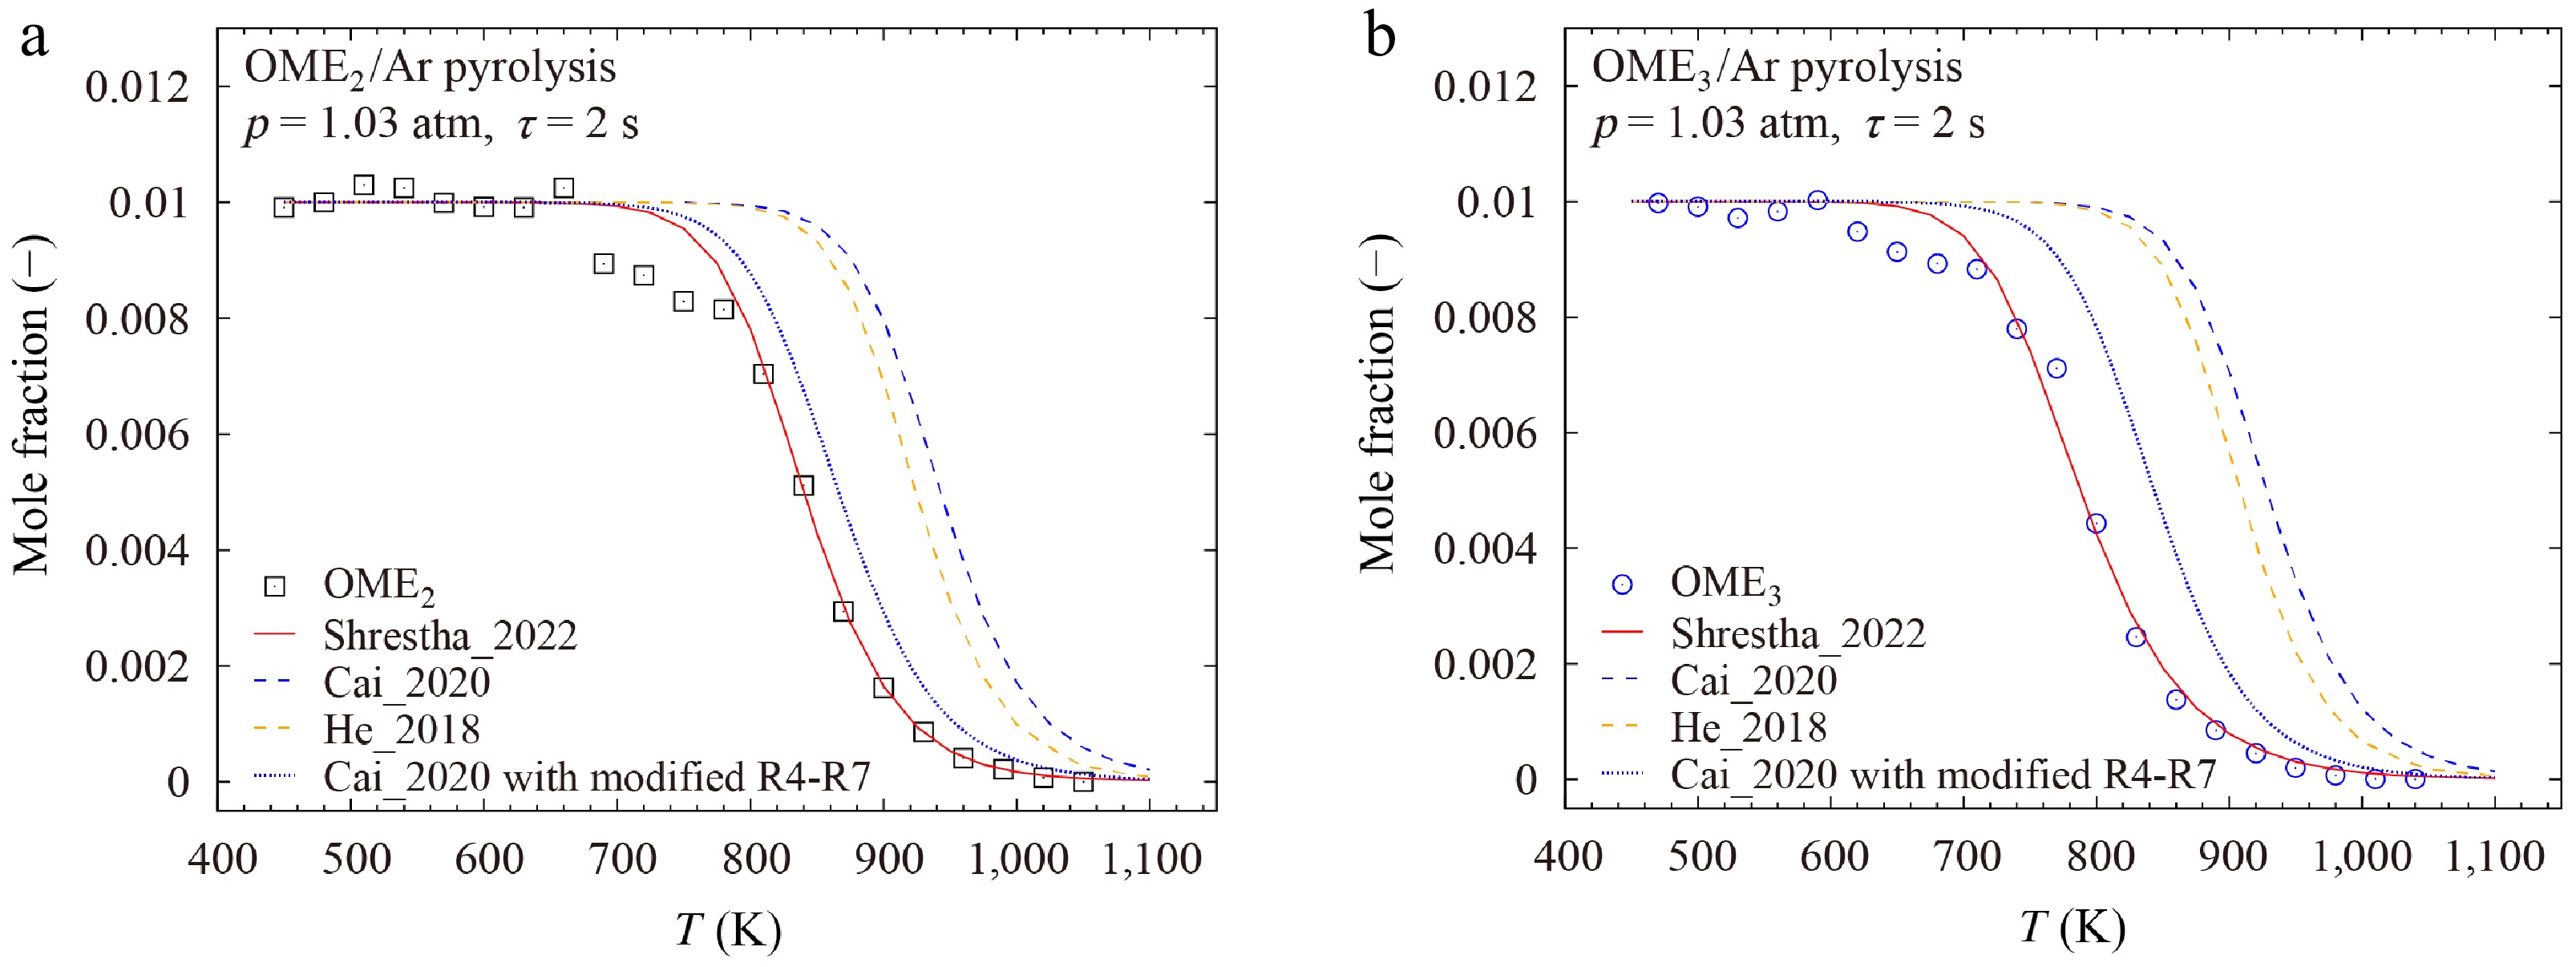
Zhong et al.[10] investigated the pyrolysis of OME1−3 in a jet stirred reactor at 1.03 atm and temperatures from 450 to 1,080 K. As illustrated in Fig. 13a, b, the Cai_2020[26] and He_2018[25] models fail to capture the experimental decomposition profiles of OME2 and OME3. In contrast, the Shrestha_2022[29] model shows good agreement with these pyrolysis data.
To identify key reactions of pyrolysis, sensitivity analyses were performed using the Shrestha_2022[29] model for the mole fractions of OME2 and OME3 at 800 K and 1 atm. The results are shown in Fig. 14 and indicate that the H-atom abstraction reaction of fuel by CH3 radical plays a crucial role in the prediction of the mole fractions of OME2 and OME3. Notably, the rate parameters of these reactions in the Shrestha_2022[29] model was adopted initially from the Cai_2020[26] model, but was increased subsequently by a factor of two by Shrestha et al.[29] to enhance the fuel reactivity. Furthermore, the unimolecular decomposition reactions via H-atom transfer,
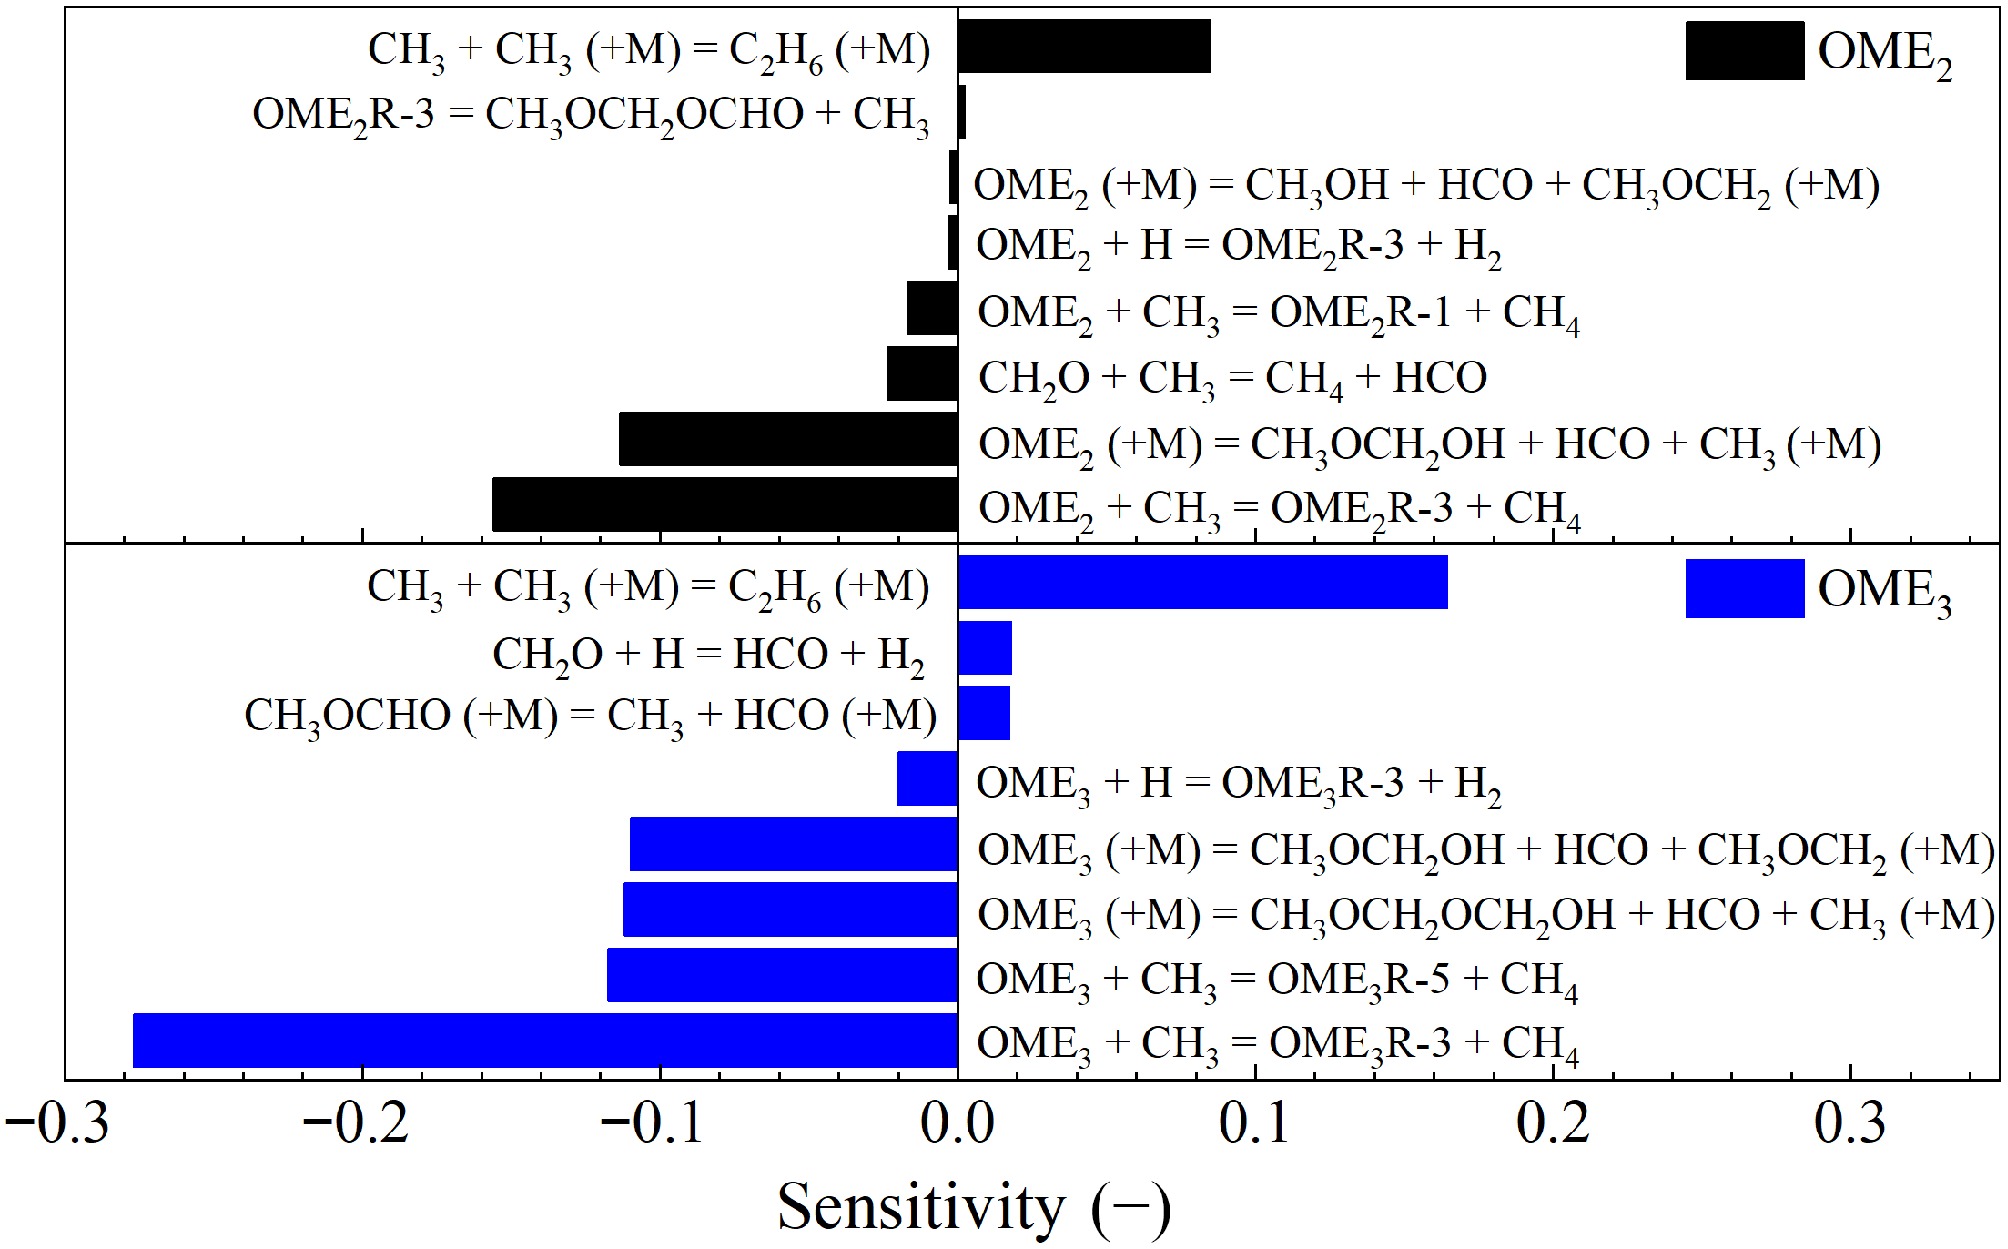
Figure 14.
Sensitivities of the mole fractions of OME2 and OME3 on elementary reactions during their pyrolysis at 1 atm, τ = 2 s, and 800 K calculated by using the Shrestha_2022[29] model.
$ {\text{OME}}_{\text{2}}\left(\text{+M}\right)={\text{CH}}_{\text{3}}\text{O}{\text{CH}}_{\text{2}}\text{O}\text{H}+\text{H}\text{C}\text{O}+{\text{CH}}_{\text{3}}\left(\text{+M}\right) $ (R4) $ {\text{OME}}_{\text{2}}\left(\text{+M}\right)={\text{CH}}_{\text{3}}\text{O}\text{H}+\text{H}\text{C}\text{O}+{\text{CH}}_{\text{3}}{\text{OCH}}_{\text{2}}\left(\text{+M}\right) $ (R5) ${\text{OME}}_{\text{3}}\left(\text{+M}\right)={\text{CH}}_{\text{3}}{\text{OCH}}_{\text{2}}{\text{OCH}}_{\text{2}}\text{O}\text{H}+\text{H}\text{C}\text{O}+{\text{CH}}_{\text{3}}\left(\text{+M}\right)$ (R6) and
$ {\text{OME}}_{\text{3}}\left(\text{+M}\right)={\text{CH}}_{\text{3}}\text{O}{\text{CH}}_{\text{2}}\text{O}\text{H}+\text{H}\text{C}\text{O}+{\text{CH}}_{\text{3}}\text{O}{\text{CH}}_{\text{2}}\left(\text{+M}\right)$ (R7) exhibit pronounced sensitivities as well.
However, neither the Cai_2020[26] nor the He_2018[25] models incorporates these specific unimolecular H-atom transfer pathways, which may lead to their prediction uncertainties.
To further explore the impacts, the reactions R4-R7 of the Shrestha_2022[29] model were incorporated into the Cai_2020[26] model. As shown in Fig. 13, this modification improved the prediction accuracy of the Cai_2020[26] model significantly, highlighting the importance of these decomposition reactions via unimolecular H-atom transfer. Nevertheless, experimental and theoretical investigations on these fuel decomposition pathways are missing and thus of high interest.
Recent work by De Ras et al.[32] found that existing kinetic models, such as those of Cai et al.[26] and Dinelli et al.[31], which perform well for ignition delay times and laminar burning velocities, underpredict significantly the fuel decomposition during the pyrolysis of OMEs, particularly of longer-chain OMEs. This discrepancy is primarily attributed to the lack of direct decomposition reactions, such as OMEx = OMEx−n + n CH2O. Further investigations of this study revealed that the model prediction of species concentrations is improved significantly and is close to that of the model of De Ras et al.[32], as shown in Supplementary Fig. S1, after incorporating these decomposition pathways into the mechanism of Cai et al.[26]. However, as shown in Supplementary Fig. S2, the inclusion of these pathways leads to a substantial deterioration in the prediction of ignition delay times.
In addition to these decomposition channels, significant model discrepancies are also observed in the consumption mechanisms of fuel radicals. For instance, the reaction fluxes for the auto-ignition of OME1−4 at 850 K, 20 bar, and φ = 1.0 are explored by using different kinetic models. As shown in Supplementary Fig. S3, disagreements were observed among the consumption pathways of fuel radicals and their predicted reaction fluxes. Taking the fuel radicals of OME2 as an example, the Cai_2020[26] model predicts that OME2R-1 is primarily consumed via O2 addition, while the Shrestha_2022[29] model identifies β-scission as the dominant pathway for OME2R-1. Disagreements also exist in the consumption channels of OME2R-3. Notably, in the De Ras_2023[28] model, over 50% of OME2R-1 is converted to OME2R-3 via isomerization, while other models predict negligible flux for this pathway. These significant discrepancies highlight the lack of chemical consistency in current kinetic models regarding the chemistry of OME radicals.
Oxidation
-
Vermeire et al.[17] conducted jet stirred reactor experiments for OME1/O2/He mixtures at 1.07 bar, φ = 1.0, and temperatures ranging from 500 to 1,100 K. For kinetic analyses, the Li_2021[19] and Jacobs_2019[18] models were selected due to their small point-wise difference for these experiments.
As shown in Fig. 15, both models predict the concentrations of most species accurately. The model results are very similar, except for CH3OH. Li et al.[19] noted in their study that the mole fraction of CH3OH during the OME1 oxidation reported by Vermeire et al.[17] were underpredicted by several literature models. In addition, Shrestha et al.[29] found that existing models fail to predict the mole fraction of CH3OH during the oxidation of OME3[46] with high accuracy as well.
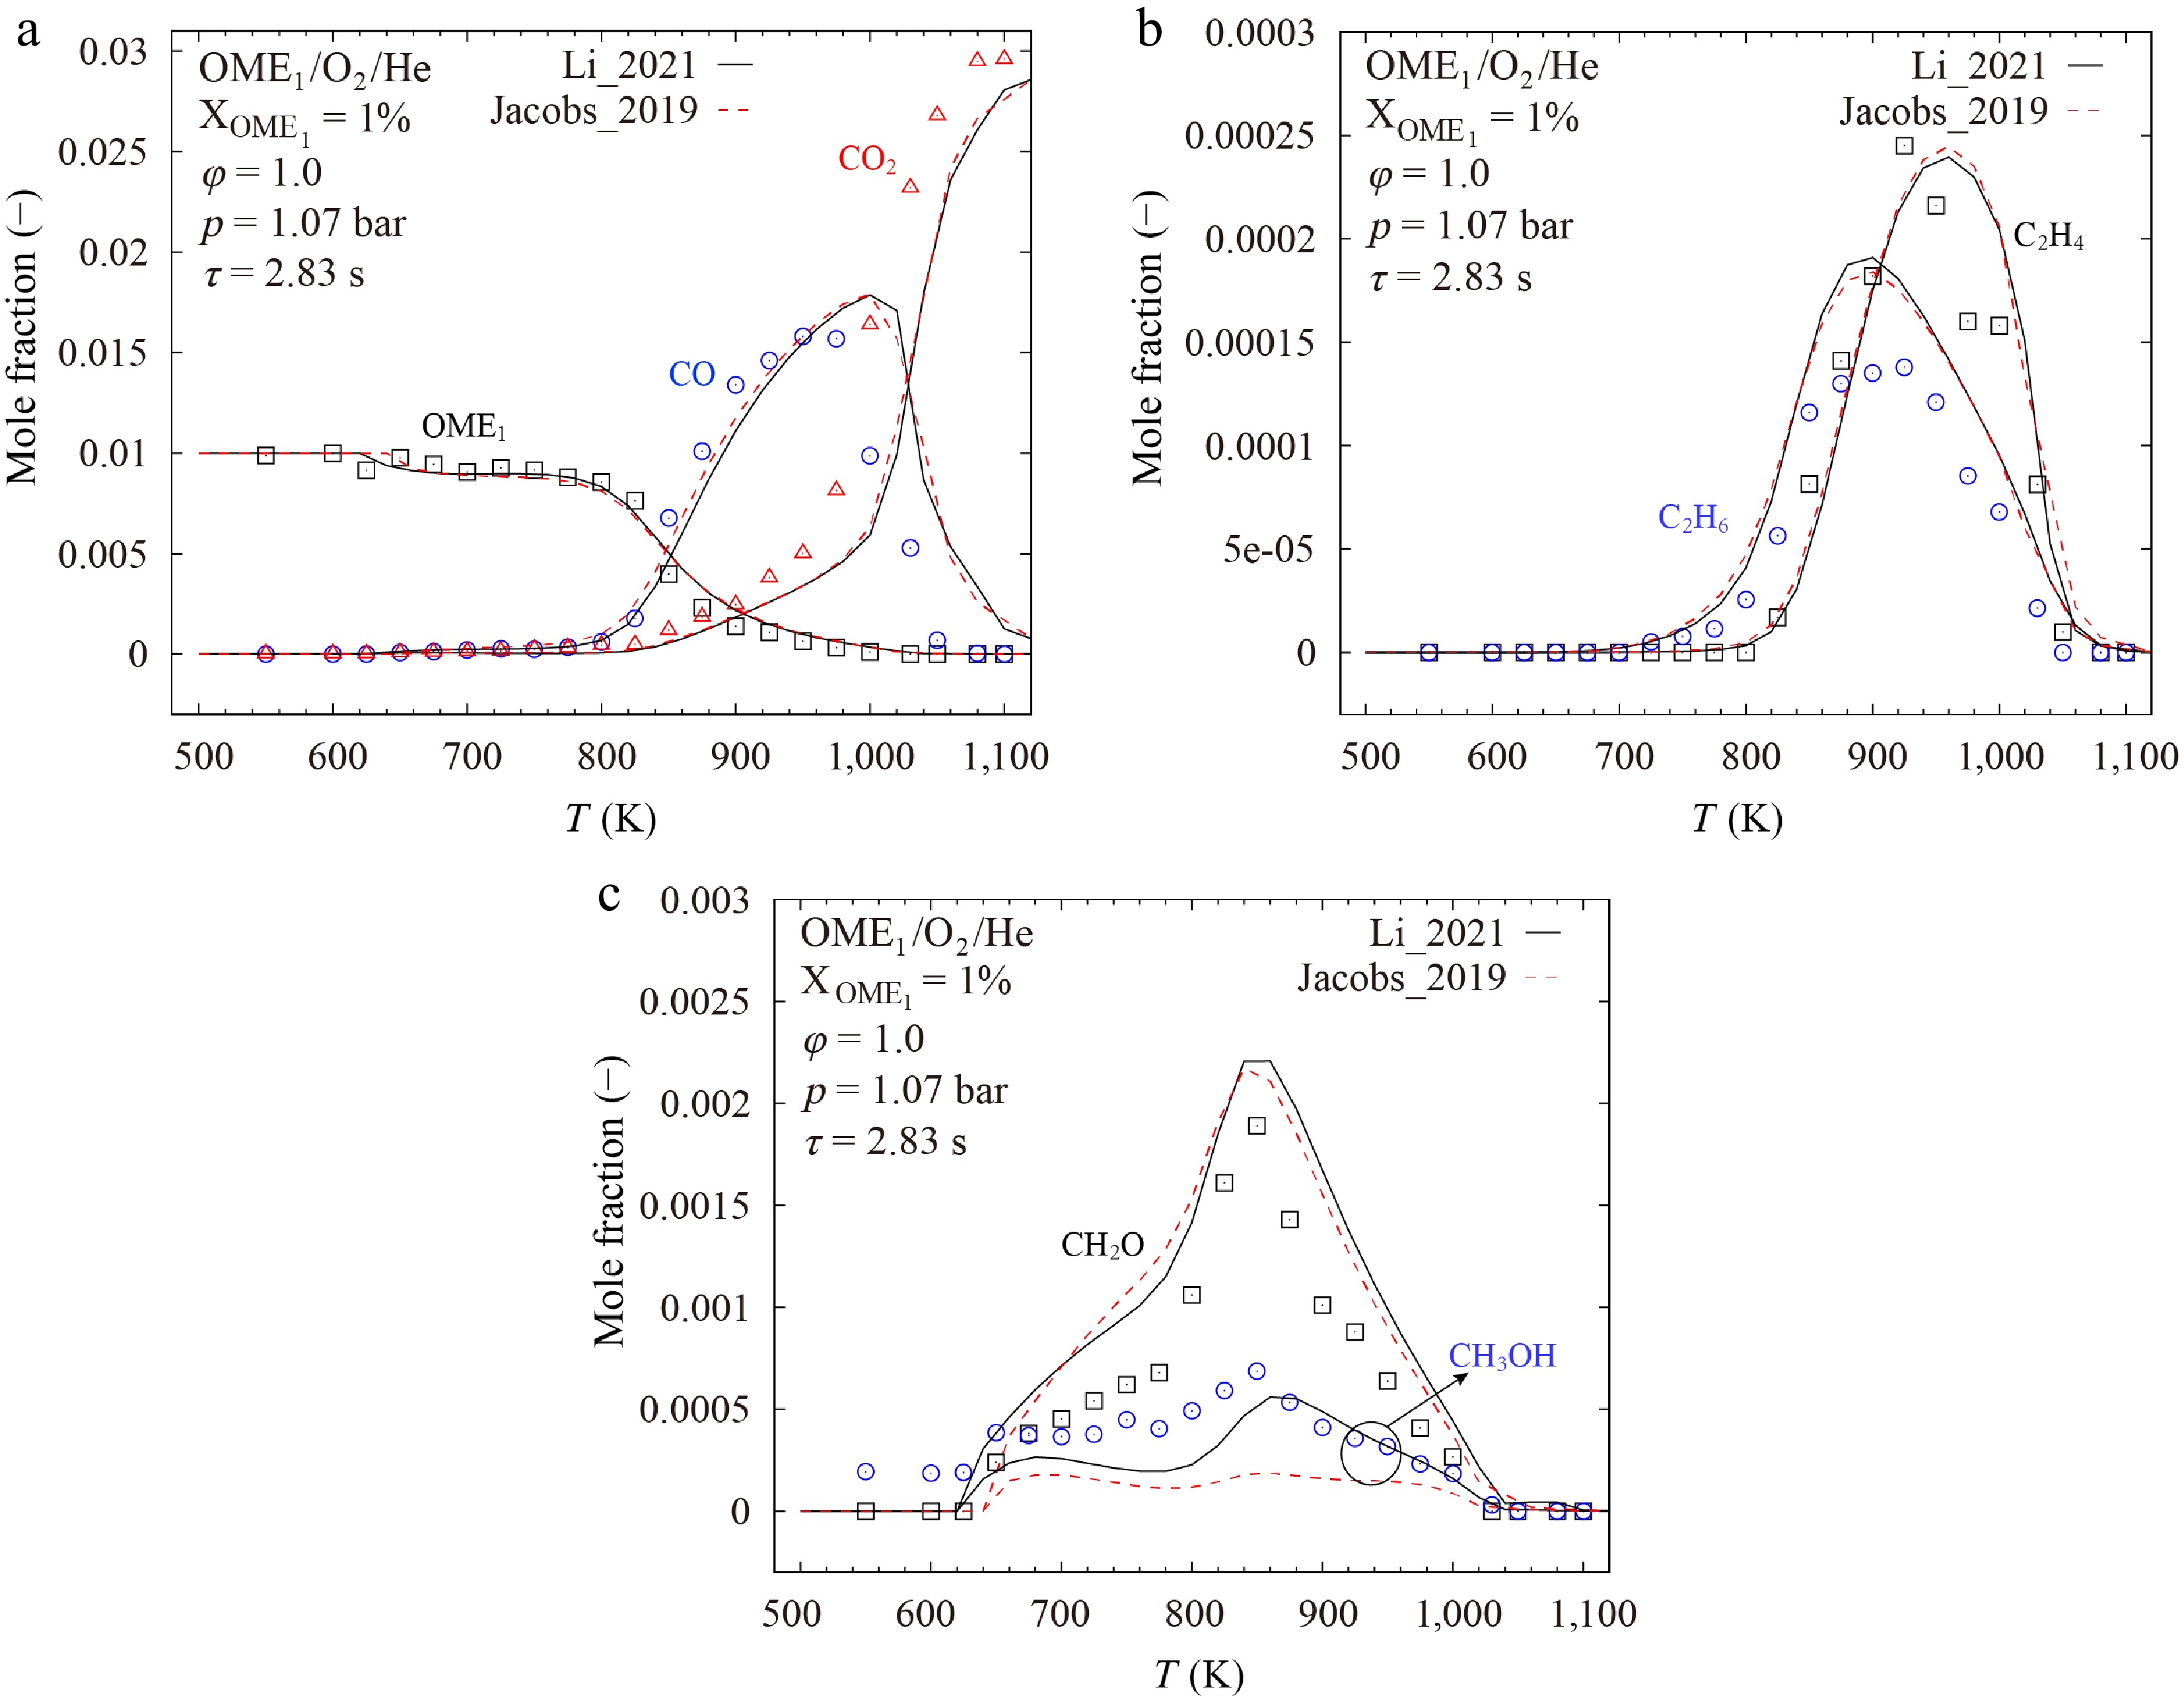
To better understand the controlling kinetics, sensitivity analyses were performed for the mole fraction of CH3OH during the oxidation of OME1 at stoichiometric conditions and two temperatures of 650 and 880 K by using the Li_2021[19] model. The two temperatures were chosen, as peaks of CH3OH mole fractions were observed at these temperatures, as shown in Fig. 15c. As presented in Fig. 16, the results indicate that, at lower temperatures, the formation of CH3OH is primarily governed by H-atom abstraction reactions of fuel. And at higher temperatures, the reactions of small molecules become dominant.
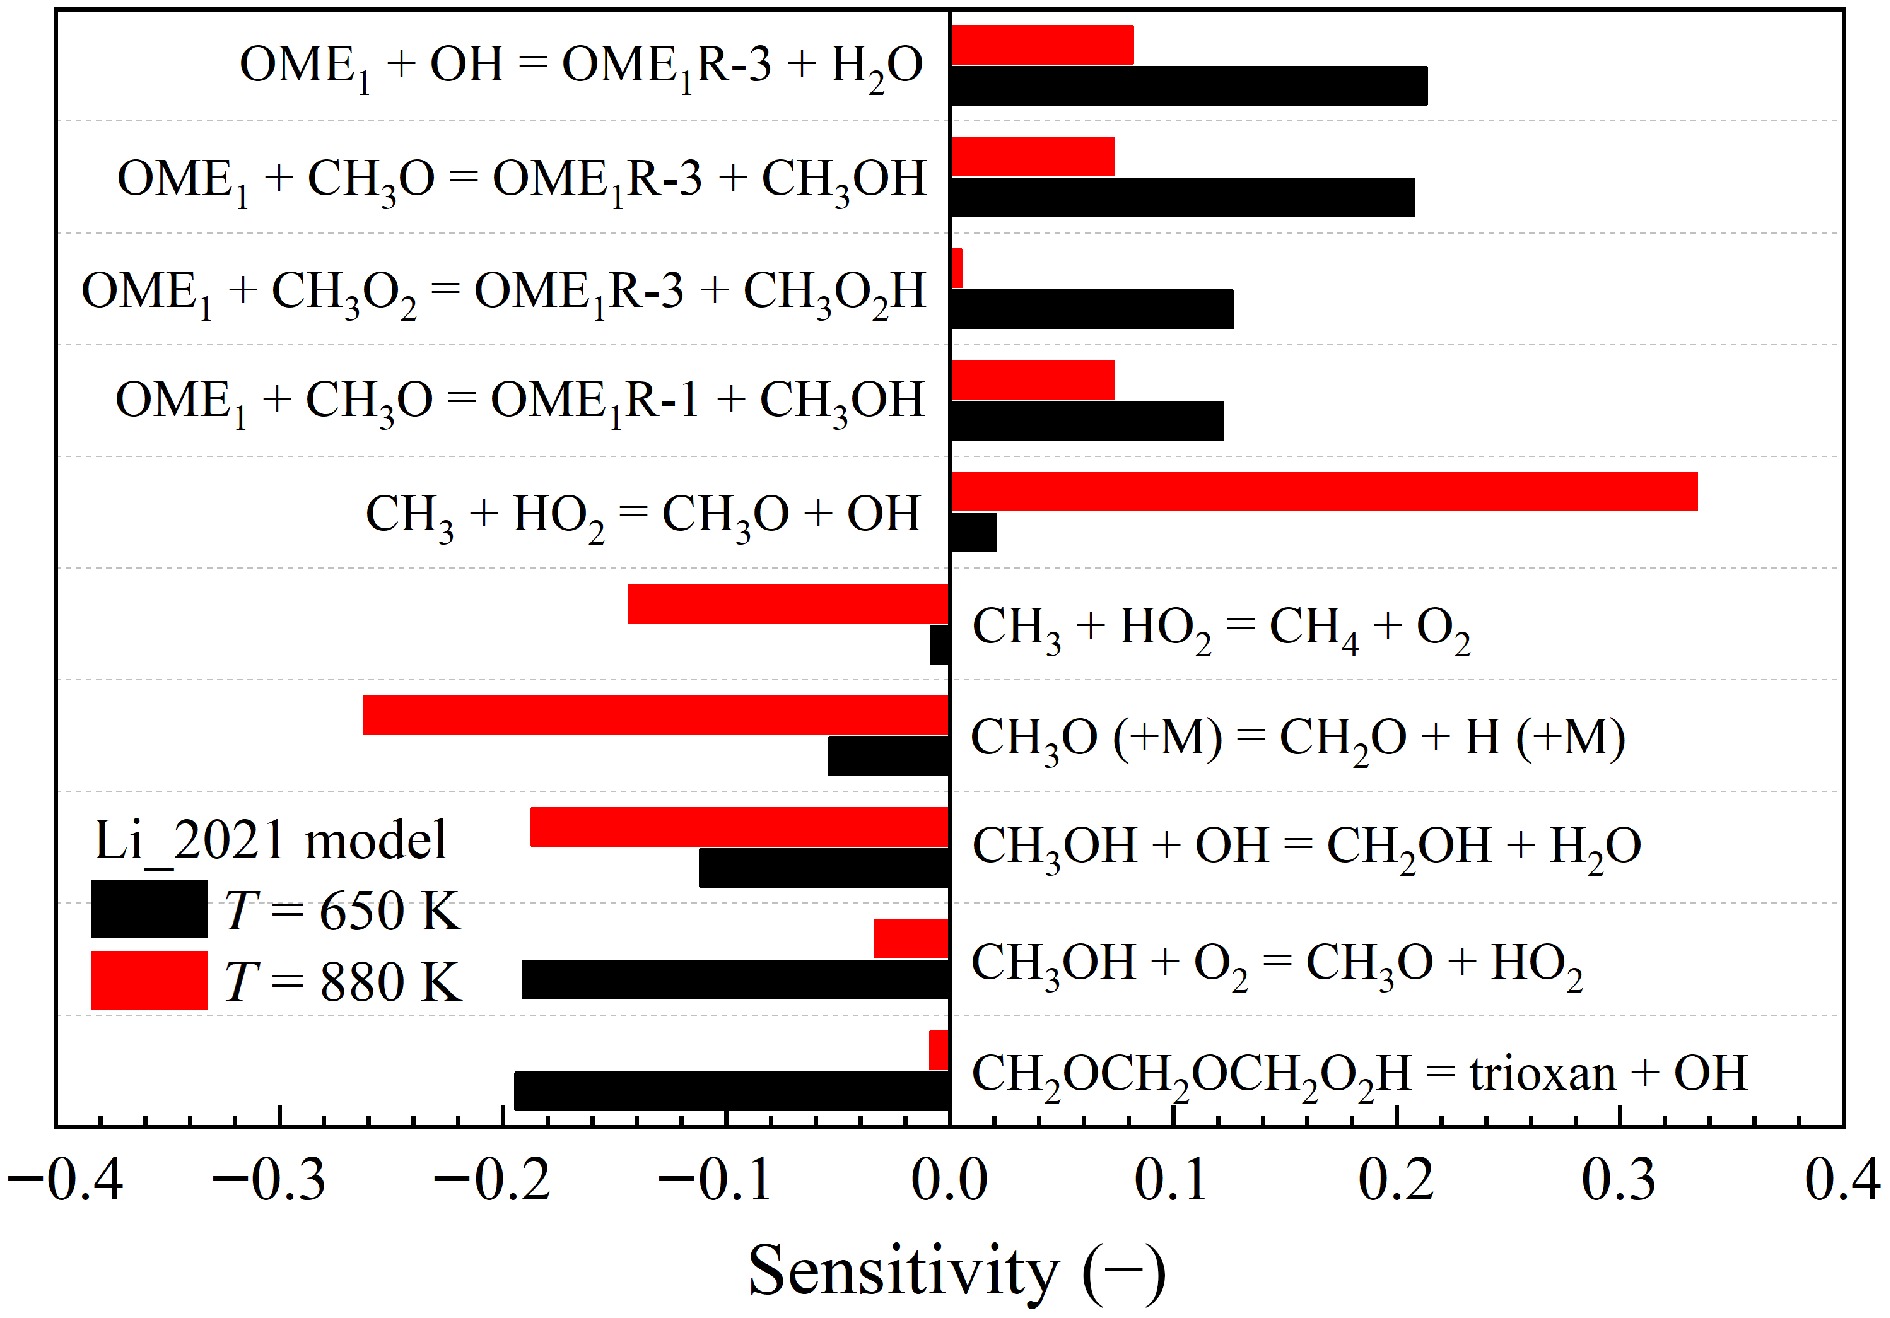
Figure 16.
Sensitivities of the mole fractions of CH3OH on elementary reactions during the oxidation of OME1/O2/He mixture at p = 1.07 bar, φ = 1.0, and T = 650 and 880 K calculated by using the Li_2021[19] model.
As reported by Li et al.[19], the improved performance of their model can be attributed to the inclusion of the reaction
$ {\text{CH}}_{\text{3}}\text{O}\text{C}\text{H}\text{O}={\text{CH}}_{\text{3}}\text{O}\text{H}+\text{C}\text{O} $ (R8) which is lacking in other models. Here, this reaction was added into the Jacobs_2019[18] model. However, as shown in Fig. 17, this modification leads only to a minor improvement in the prediction accuracy of the Jacobs_2019[18] model.
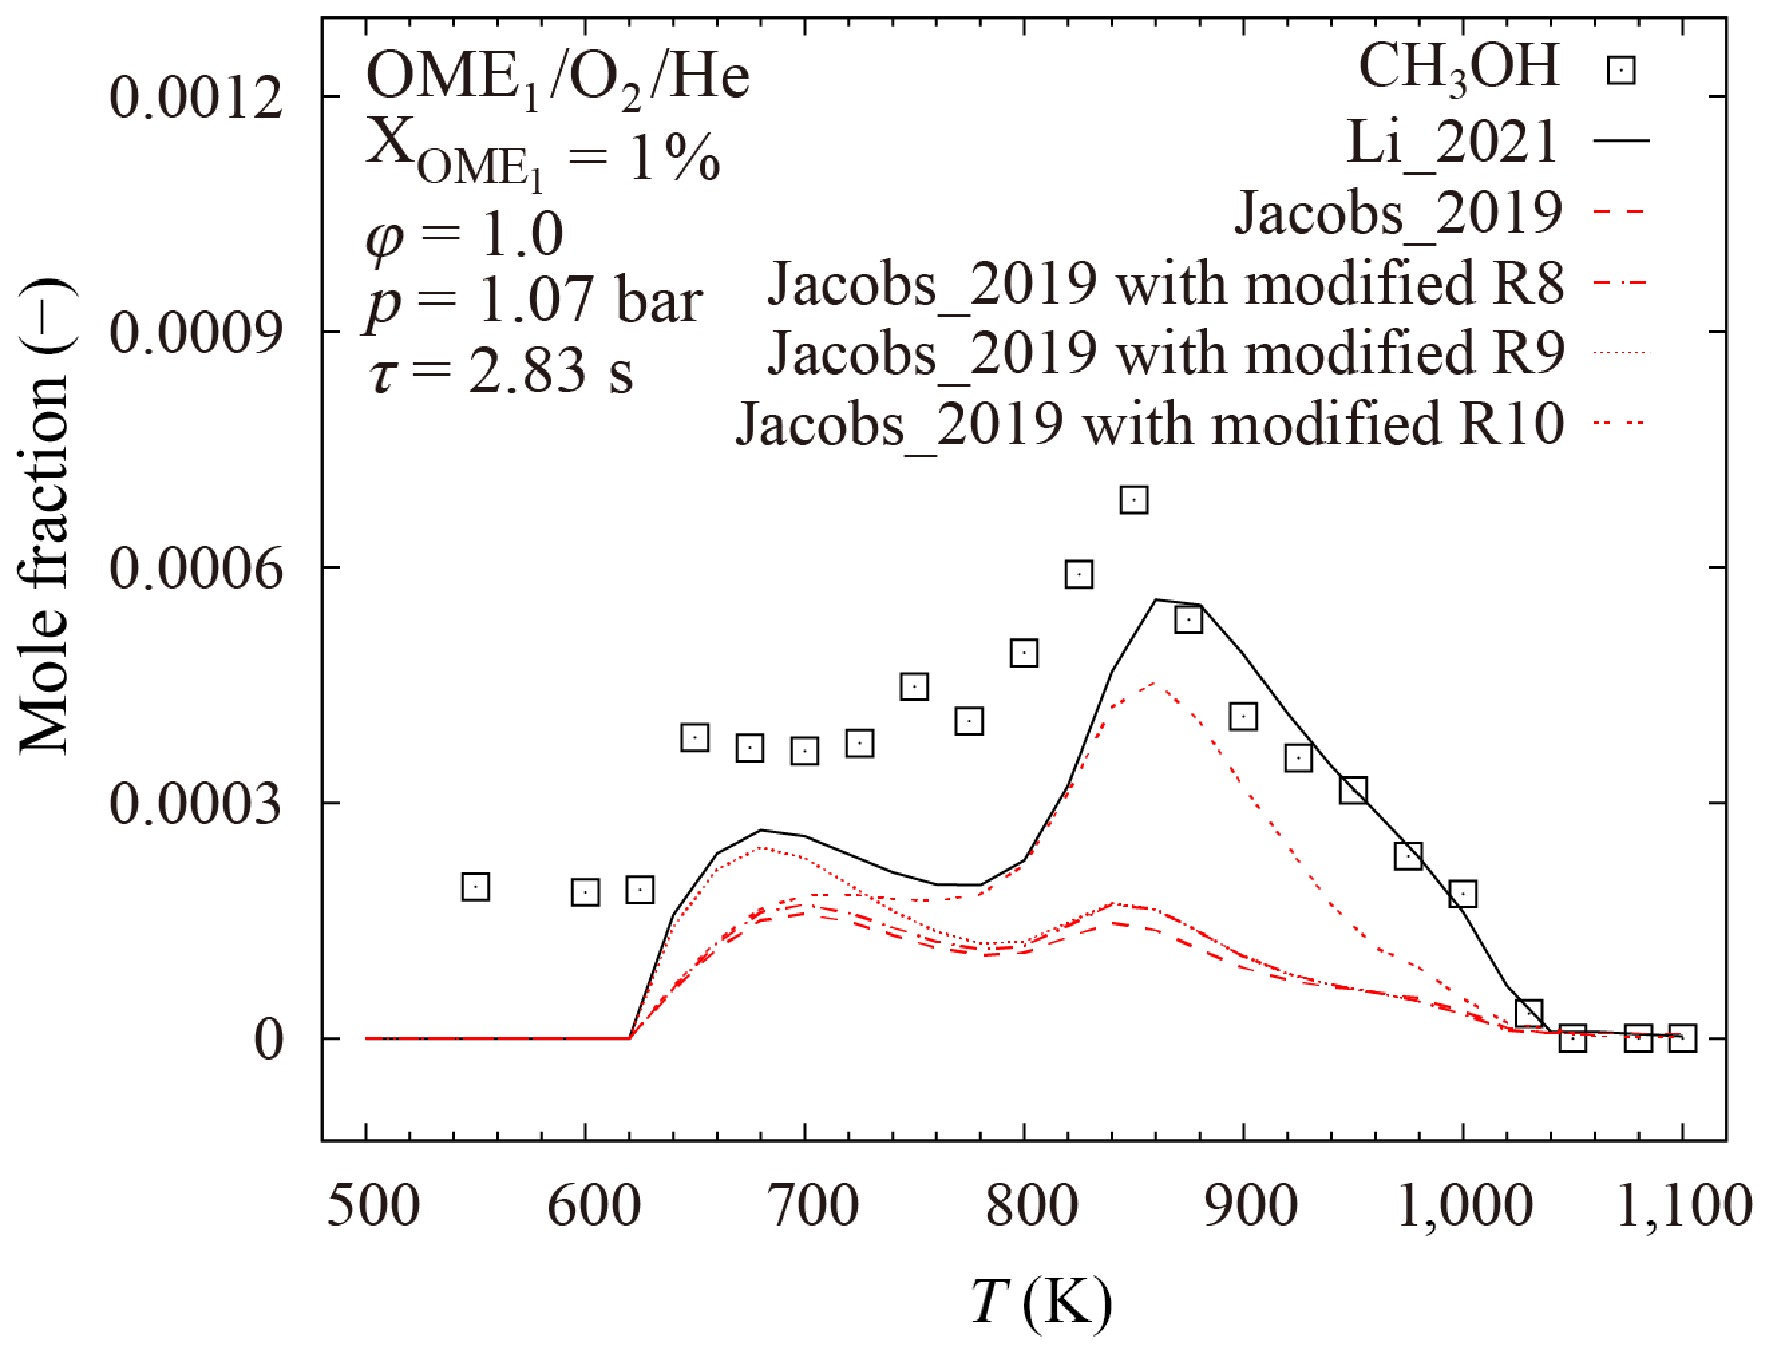
Figure 17.
Comparison of calculated and measured mole fractions of CH3OH in the oxidation of OME1/O2/He mixture at p = 1.07 bar, φ = 1.0, and τ = 2.83 s. Lines represent results calculated with the Li_2021[19], Jacobs_2019[18], and modified Jacobs_2019[18] models. Symbols denote experimental data from Vermeire et al.[17].
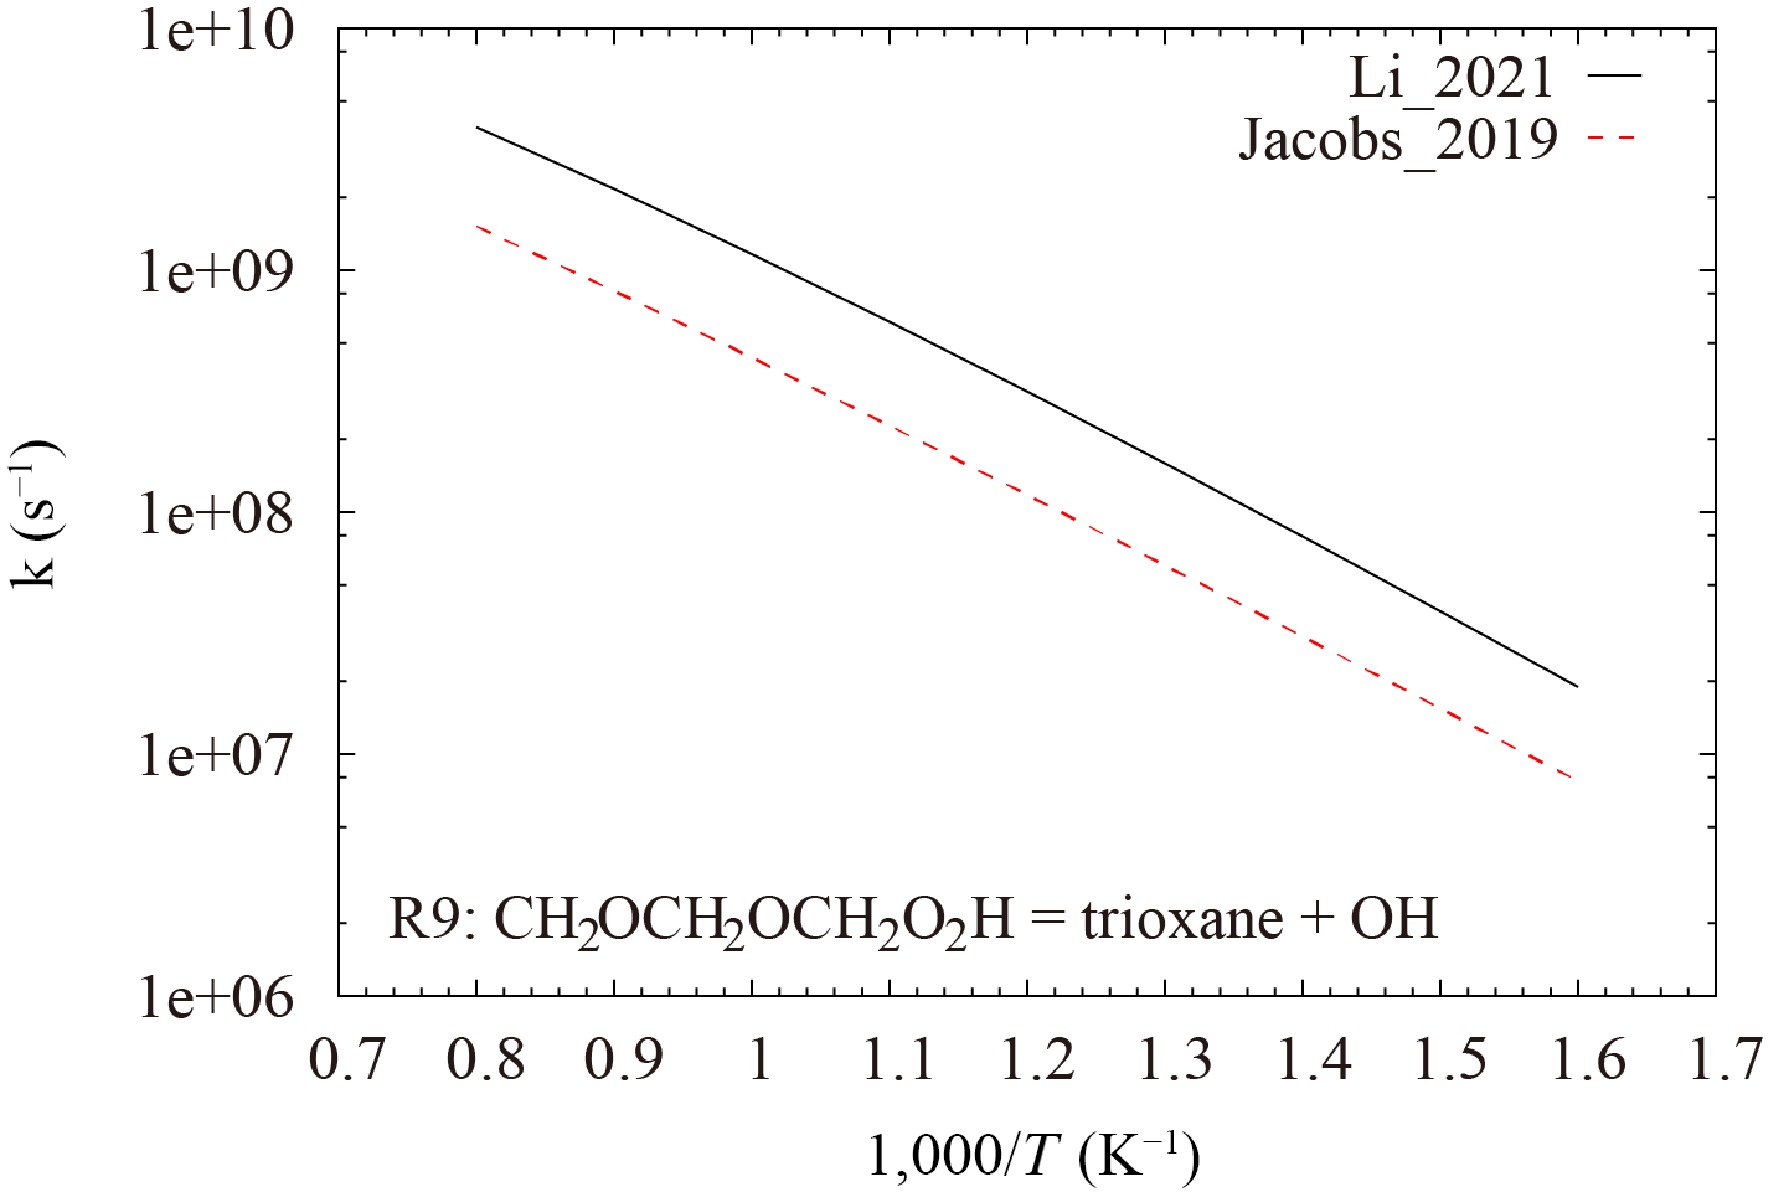
The sensitivity analyses reveal the importance of the cyclic ether formation reaction
$ {\text{CH}}_{\text{2}}\text{O}{\text{CH}}_{\text{2}}\text{O}{\text{CH}}_{\text{2}}{\text{O}}_{\text{2}}\text{H}=\text{t}\text{r}\text{i}\text{o}\text{x}\text{a}\text{n}\text{e}+\text{ }\text{O}\text{H} $ (R9) which exhibits the largest negative sensitivity for the CH3OH mole fraction during OME1 oxidation at 650 K. The rate parameters of this reaction in the Li_2021[19] and Jacobs_2019[18] models were derived from He et al.[25] and Vermeire et al.[17], respectively. Their values are different by more than a factor of two, as shown in Fig. 18. By replacing the rate constant of R9 in the Jacobs_2019[18] model by that of the Li_2021[19] model, the prediction accuracy of the Jacobs_2019[18] model for the first peak is improved, as demonstrated in Fig. 17.
The reaction
$ {\text{CH}}_{\text{3}}\text{O}\left(\text{+M}\right)={\text{CH}}_{\text{2}}\text{O}+\text{H}\left(\text{+M}\right) $ (R10) shows large negative sensitivity for CH3OH mole fraction during OME1 oxidation at 880 K. Although the rate parameters of this reaction in both Li_2021[19] and Jacobs_2019[18] models were taken from the AramcoMech2.0[63] model, the pre-exponential factor in the Li_2021[19] model was reduced by an order of magnitude. When the same modification is applied to the Jacobs_2019 model[18], significantly improved model performance is observed for the second peak. However, this modification lacks theoretical or experimental evidence, suggesting further investigation. This discrepancy highlights the need for dedicated theoretical calculations or experimental measurements for a more accurate rate constant of R10.
-
In this study, the performance of ten recent kinetic models of OMEs was evaluated by using the point-wise difference measure based on 43 experimental datasets of various combustion targets of OME1−4. For OME1, the Li_2021[19], Cai_2020[26], and Jacobs_2019[18] models match the data well. In terms of larger OMEs, the Shrestha_2022[29] model provides the highest prediction accuracy for OME2, and the reduced Dinelli_2024[31] model shows good performance for OME3 and OME4. However, no model gives satisfactory results for all combustion targets and for all OMEs. This can be attributed to the deficiencies in their underlying elementary chemistry, including inaccurate descriptions of critical unimolecular decomposition and radical consumption pathways, and their unreliable kinetic parameters, often estimated based on analogy.
Sensitivity and reaction flux analyses were performed for various combustion targets to explore the underlying reaction pathways. It is found that, in conjunction with the direct fuel decomposition, the fuel decomposition reactions via unimolecular H-atom transfer are important for the auto-ignition at high temperatures and pyrolysis of OMEs. The reaction mechanisms of smaller OMEs are of high importance for the accurate description of the auto-ignition behaviors of long-chain OMEs over a wide temperature range, as β-scission of fuel radicals of longer-chain OMEs produces a large amount of primary fuel radicals of shorter-chain OMEs. Moreover, the chemistry of small molecules plays a crucial role in the accurate prediction of the laminar burning velocities and the species profiles of oxidation of OMEs in reactors. These findings highlight the challenge of developing accurate combustion models of OMEs. To address these challenges and improve OME reaction models, future experimental and numerical investigations are in high demand, especially for the unimolecular decomposition pathways via H-atom transfer and the direct decomposition of longer OMEs into shorter OMEs.
The work was supported by the National Natural Science Foundation of China (Grant No. 52276133).
-
The authors confirm their contributions to the paper as follows: data analysis: Yuan J; draft manuscript preparation: Yang J, Xiong X; writing−review and editing: Yang J, Xiong X, Cai L; supervision: Zhang J, Cai L. All authors reviewed the results and approved the final version of the manuscript.
-
All data generated or analyzed during this study are included in this published article.
-
The authors declare that they have no conflict of interest.
- Supplementary Fig. S1 Concentrations of OME4 during its pyrolysis at 1.07 MPa and τ = 2 s. Lines represent results calculated with the De Ras_2025 [1] model, Cai_2020 [2] model, and modified Cai_2020 [2] model. Symbols denote experimental data from De Ras et al. [1].
- Supplementary Fig. S2 Ignition delay times of OME4/air mixtures at φ = 1.0. Lines represent results calculated with the De Ras_2025 [1] model, Cai_2020 [2] model, and modified Cai_2020 [2] model. Symbols denote experimental data from Cai et al. [2].
- Supplementary Fig. S3 Reaction fluxes during the auto-ignition of OME1-4/air mixtures at 20 bar, φ = 1.0, T = 850 K, and 20% fuel consumption calculated by using the Cai_2020 [2] model, Shrestha_2022 [3] model, De Ras_2023 [4] model, and Li_2021 [5] model.
- Copyright: © 2026 by the author(s). Published by Maximum Academic Press, Fayetteville, GA. This article is an open access article distributed under Creative Commons Attribution License (CC BY 4.0), visit https://creativecommons.org/licenses/by/4.0/.
-
About this article
Cite this article
Yang J, Xiong X, Yuan J, Zhang J, Cai L. 2026. Comparative evaluation and kinetic analysis of chemical models for the combustion of oxymethylene ethers. Progress in Reaction Kinetics and Mechanism 51: e006 doi: 10.48130/prkm-0025-0031 

Comparative evaluation and kinetic analysis of chemical models for the combustion of oxymethylene ethers
- Received: 24 June 2025
- Revised: 07 November 2025
- Accepted: 01 December 2025
- Published online: 02 March 2026
Abstract: Oxymethylene ethers (OMEs) are promising alternative fuels. A comprehensive evaluation of the prediction accuracy of their chemical kinetic models is essential for their computational fluid dynamics simulations. Thus, this study evaluates comprehensively the performance of ten recently proposed kinetic models of OME1–4 against 43 experimental datasets, including ignition delay times, laminar burning velocities, and species concentrations. The investigated models are different in terms of their development methods and chemical natures. While all ten models include the chemistry of OME1, seven, five, and three models of them can describe the combustion of OME2, OME3, and OME4, respectively. For OME1, the models of Li et al. (2021), Cai et al. (2020), and Jacobs et al. (2019) demonstrate prediction advantages over other models. The model of Shrestha et al. (2022) provides the lowest prediction uncertainties for the combustion of OME2, while the reduced model of Dinelli et al. (2024) matches the data of OME3 and OME4 best. However, none of these models achieves very high prediction accuracy for all considered targets and, more importantly, for all interested OMEs. The results of sensitivity and reaction flux analyses reveal that, for all OMEs, the fuel decomposition reactions via unimolecular H-transfer influence their auto-ignition at high temperatures and pyrolysis behaviors significantly. The auto-ignition behavior of long-chain OMEs over a wide temperature range is highly sensitive to the reactions of smaller OMEs, as their primary fuel radicals are produced via the β-scission of radicals of longer OMEs. These findings provide insights into improved chemical models of OMEs.
-
Key words:
- Oxymethylene ether /
- Chemical mechanisms /
- Model evaluation /
- Kinetic analysis