


-
Denitrification converts nitrate (NO3−) to dinitrogen (N2) via intermediate nitrogen oxides such as nitrite (NO2−), nitric oxide (NO), and nitrous oxide (N2O), representing a major pathway for N2O production in anaerobic or redox-dynamic environments[1]. Denitrification in soils was once believed to be predominantly carried out by heterotrophic bacteria, but recent studies showed that fungi also play a significant role[2,3]. Bacterial denitrifiers utilize a suite of enzymes encoded by genes such as nirK, nirS, and nosZ, which determine the completeness of denitrification, and the N2O/N2 product ratio[4,5]. Notably, the distinction between nirK and nirS has revealed functional and ecological differences among denitrifying bacteria. For instance, nirK is often associated with more efficient nitrate-to-N2O conversion under fluctuating oxygen conditions, while nirS may dominate in stable anaerobic environments[6]. Furthermore, the nosZ gene is critical for the final step of N2O reduction to N2, and its absence or low abundance in certain bacterial communities can lead to elevated N2O emissions[7]. Recent metagenomic and transcriptomic studies have also identified novel bacterial lineages, such as Thauera and Pseudomonas, as key players in denitrification across diverse soil ecosystems[8]. Additionally, environmental factors like soil moisture, temperature, and nitrate availability have been shown to regulate the expression and activity of these genes, highlighting the dynamic nature of bacterial denitrification[9,10]. Unlike bacteria, fungal denitrifiers often lack the nosZ gene equivalent, which limits their ability to complete the reduction of N2O to N2, and results in higher N2O yields as a terminal product[11]. Studies have identified several fungal genera, including Trichoderma, Aspergillus, and Penicillium as active denitrifiers under anaerobic conditions[12]. The role of fungi is particularly pronounced in acidic soils or those with high organic matter content, where they may outcompete bacteria due to their tolerance to low pH, and their ability to utilize complex organic substrates[2,3]. Recent research also suggests that fungal denitrification is driving N2O emissions, especially in environments dominated by acidic, organic-rich soils[13,14]. Moreover, the interplay between fungal and bacterial denitrifiers under fluctuating redox conditions, such as paddy soil, remains an active area of investigation, with some studies indicating potential synergistic or competitive interactions that modulate overall N2O production[15].
Future climate projections indicate an increase of approximately 1.5 to 4°C in global mean temperature by the end of the century, with cascading effects on soil biogeochemical cycles[16]. Elevated temperatures can accelerate microbial metabolism, enzyme kinetics, and substrate diffusion, potentially enhancing denitrification rates and N2O emissions[17,18]. Previous studies have shown inconsistent effects of warming on denitrification potential, while the drivers behind such variations remain unclear[19−21]. The different responses of denitrification rate to warming might be explained by the fundamentally different thermal tolerances and physiological responses of bacterial and fungal denitrifier communities[22]. Bacterial denitrifiers typically exhibit optimal activity within a moderate range (20–30 °C), with rates often doubling or tripling for every 10 °C increase within this window, but their growth and activity can be strongly inhibited as temperatures approach 40 °C[23]. In contrast, fungal denitrifiers, particularly those with nirK-type genes, demonstrate greater thermal tolerance, maintaining growth and contributing to N2O production even at elevated temperatures (e.g., 40 °C) where bacterial activity declines[23]. While bacteria may respond positively to warming through upregulated gene expression (e.g., nirK and nosZ), fungi may exhibit contrasting patterns due to their broader temperature optima or sensitivity to pH shifts[24]. Warming has been shown to increase fungal α-diversity, while decreasing bacterial richness, potentially shifting community structure and N2O emissions through changes in soil pH, moisture, and plant interactions[25]. It has been found that warming suppresses abundant fungal taxa and increases bacterial relative dominance, which could reduce overall soil multifunctionality, including nitrogen cycling[26].
Distinguishing the respective roles of bacterial and fungal denitrification is essential for reliably estimating soil N2O emissions. One commonly used approach for separating these microbial contributions is substrate-induced respiration with selective inhibition (SIRIN)[27]. The SIRIN method has been used to quantify bacterial and fungal denitrification due to its simplicity, low cost, and rapid assessment capabilities in many studies[28]. However, the method faces significant limitations, including inefficient inhibition across different soil types[29]. These non-specific inhibitor effects may affect non-target microbial groups or be metabolized by resistant organisms, leading to inaccurate partitioning of bacterial and fungal contributions[30].
Recent methodological developments in isotope-ratio mass spectrometry and quantum-cascade laser absorption spectroscopy have enabled highly precise determination of intramolecular 15N positioning within the asymmetric N2O molecule. A key parameter, the 15N site preference (SP), calculated as the difference between δ15N of the central alpha (α) position, and the terminal beta (β) position (δ15Nα–δ15Nβ), has emerged as an effective tracer for differentiating bacterial- and fungal-derived denitrification. N2O originating from fungal denitrification exhibits consistently high SP values (around 33‰–37‰), while bacterial denitrification yields lower SP values (typically –7.5‰ to +3.5‰, or 0–10‰ depending on the process)[31,32]. This clear isotopic separation makes the SP framework a robust tool for estimating fungal contributions to N2O emissions across varying environmental conditions[33].
Paddy soils serve as hotspots for N2O production due to frequent flooding, which create anaerobic conditions conducive to denitrification[34]. Rice paddies contribute an estimated 10%–20% of agricultural N2O emissions, with denitrification accounting for up to 80% of these under waterlogged regimes[35,36]. The alternating wet-dry cycles in paddy management further enhance N2O fluxes by promoting coupled nitrification-denitrification, where ammonium oxidation supplies nitrate for subsequent reduction[37]. Warming may exacerbate N2O production by altering redox potentials, increasing organic carbon mineralization, and shifting microbial community structures in paddy ecosystems[38,39]. However, some studies report increased denitrification under short-term warming due to enhanced microbial activity, while others note declines in long-term scenarios from substrate depletion or community adaptation[40]. Furthermore, most research has focused on overall denitrification-derived N2O emissions, with limited attention to the differential temperature sensitivities of bacterial vs fungal denitrifiers[41,42].
Using paddy soils collected from multiple locations, this study explored the response of potential denitrification-derived N2O emissions to warming, and applied the N2O SP approach to partition fungal and bacterial sources. We hypothesize that bacterial and fungal denitrification will respond differently to warming, driven by interactions between soil nutrients and functional gene abundances. Our findings are expected to advance understanding of microbial controls on N2O production.
-
Soil samples (0–20 cm) were collected from 18 rice paddies distributed across six provinces in China, extending along a latitudinal gradient from 19°53′ N to 45°31′ N (Supplementary Fig. S1). The selected sites span temperate, subtropical, and tropical monsoon climates, covering a wide variety of agricultural environments. Within each province, three replicate samples were collected from a single representative paddy field. The exact geographical coordinates, mean annual temperature and precipitation, and soil texture of each site are provided in Supplementary Table S1. Additional physicochemical properties (pH, TN, SOC, NH4+-N, NO3−-N) are shown in Supplementary Table S2. Visible plant materials were removed from the collected soils, which were then sieved to 2 mm. Depending on the analysis type, soil was stored at 4 °C (for slurry assays), −20 °C (DNA work), or air-dried (for chemical analysis).
Soil physicochemical properties were characterized using standard analytical procedures. Particle-size distribution was determined by the hydrometer method[43]. Inorganic nitrogen fractions, including NO3−-N, and NH4+-N were analyzed with a continuous-flow autoanalyzer. Soil pH was measured potentiometrically in a 1:2.5 (w/v) soil–water suspension using a calibrated glass electrode (PHS-3C mv/pH meter, Shanghai, China). Dissolved organic carbon (DOC) and dissolved organic nitrogen (DON) were quantified by ultraviolet persulfate oxidation with a total organic carbon analyzer (Phoenix 8000, Teledyne-Tekmar, USA). Available phosphorus concentrations were determined by inductively coupled plasma optical emission spectrometry (ICP-OES; Thermo Fisher, USA). For elemental analysis, soil samples were first finely ground with a ball mill, after which total carbon (TC) and total nitrogen (TN) were measured using an elemental analyzer (Elementar, Germany). Denitrification potential rate (DPR) was assessed using the acetylene inhibition technique[44].
Microcosm construction
-
Two incubation temperatures were applied in the microcosm experiment: the local average annual temperature of each sampling site (AT), and a warming treatment of +4 °C relative to AT, (ET) (Supplementary Table S3). A +4 °C warming treatment relative to the local mean annual temperature was implemented to represent end-of-century high-emission projections (RCP 8.5, ~3–5 °C regional increase)[45]. In the initial phase, 10 g (oven-dry weight equivalent) of fresh soil was transferred into 50 mL glass incubation vials. Samples were incubated in darkness under two thermal regimes: ambient temperature (AT), and elevated temperature (ET). Throughout the 28-d incubation period, soil moisture was adjusted and maintained at 100% water-filled pore space (WFPS). This process was conducted to eliminate the disturbances to microbial activity caused by sampling and rewetting, and to re-establish a stable background activity level suitable for subsequent denitrification measurements. During the 28-d aerobic preincubation under flooded conditions (100% WFPS), jars were sealed with punctured Parafilm to allow gas exchange with the atmosphere while minimizing evaporative water loss, thereby preventing the buildup of respiratory gases in the headspace.
The second phase, soils were maintained at 100% WFPS and incubated for 48 h following the addition of NaNO3 (0.2 mg) and glucose (1 mg C g−1) as N and C sources. Acetylene (C2H2) (final concentration 10% v/v) was applied to the headspace at incubation initiation to block N2O reduction to N2. Although the acetylene inhibition technique has known limitations, these were minimized here by anaerobic conditions, a short-term incubation, and continuous slurry shaking. Anaerobic conditions in the incubation bottles were established by flushing with helium gas, and the incubation was conducted at 25 °C. This design enabled comparisons of N2O production and reduction processes among soils from different regions, particularly along latitudinal gradients. Soil samples were obtained at 0 and 48 h for inorganic N analysis (NO3−-N and NH4+-N). Following 48 h incubation, N2O concentrations were determined by gas chromatography, and isotopic analyses were performed to derive SP values and assess N2O formation pathways[31]. Additional subsamples were collected for DNA extraction, functional gene quantification, and microbial community analysis.
Nucleic acid extraction and qPCR
-
Genomic DNA was extracted from 0.5 g of soil using a spin column-based kit (MP Biomedicals). DNA integrity was assessed by agarose gel electrophoresis, and concentrations and purity were quantified with a Nanodrop® ND-2000 UV–vis spectrophotometer. Quantitative PCR targeting denitrification-associated genes (nirS, nirK, FnirK, nosZ I, and nosZ II) was conducted on a LightCycler® 480II (Roche, Germany). Primer sequences and cycling conditions are detailed in Supplementary Table S4. All assays showed acceptable amplification efficiencies (92%–104%), and high R2 values (0.991–0.999).
SP approach
-
Following incubation, 12 mL headspace samples were collected into evacuated exetainers (Labco) and analyzed for N2O isotopocules by IRMS (Delta V Plus, Thermo Fisher Scientific). Molecular N2O+ (m/z: 44/45/46) and the fragment NO+ (m/z: 30/31) ion signals were used to derive isotopic ratios. A laboratory-characterized high-purity N2O standard (99.995%; Thünen Institute of Climate-Smart Agriculture) was applied as the internal reference, and SP values were obtained via two-point calibration using certified standards[46].
$ {\delta }^{15}{\mathrm{N}}^{\mathrm{i}}\left({\text‰ }\right)=\left(\dfrac{{}_{}^{15}\mathrm{N}_{\text{sample}}^{\mathrm{i}}}{{{}_{}^{15}\mathrm{N}}_{\text{standard}}}-1\right)\left(\mathrm{i}=\text{bulk},\alpha ,\text{or}\;\beta \right) $ (1) $ {\delta }^{18}{\rm O}\left({\text‰} \right)=\dfrac{{{}_{}^{18}{\rm O}}_{\text{sample}}}{{{}_{}^{18}{\rm O}}_{\text{standard}}}-1$ (2) $ {\delta }^{15}{\mathrm{N}}^{\text{bulk}}\left({\text‰ }\right)=\dfrac{{\delta }^{15}{\mathrm{N}}^{\alpha }+{\delta }^{15}{\mathrm{N}}^{\beta }}{2} $ (3) where, 15Ni and 18O, respectively, denote the isotope ratios of 15N/14N and 18O/16O. 15Nα and 15Nβ are the ratios of 15N/14N at the center (14N-15N-16O), and the edge (15N-14N-16O) sites in the N2O molecule, respectively. Isotopic compositions were expressed in ‰ relative to the Vienna Standard Mean Ocean Water for 18O and atmospheric N2 for 15N. The SP value of N2O was defined as:
$ {\mathrm{N}}_{2}\mathrm{OSP}\left({\text‰}\right)={\delta }^{15}{\mathrm{N}}^{\alpha }-{\delta }^{15}{\mathrm{N}}^{\beta }$ (4) Analytical precision was approximately 0.3‰, 0.9‰, 0.9‰, and 0.6‰ for δ15Nbulk, δ15Nα, δ15Nβ, and δ18O, respectively.
Fungal contributions to N2O production (fFD) were quantified using a two-end-member isotope mixing model[47], assuming bacterial (BD) and fungal (FD) denitrification as the only N2O sources. The observed 15N site preference (SP0) of N2O was used to partition relative pathway contributions, following the mixing balance equation:
$ \mathrm{SP}_{ \mathrm{0}} =\mathrm{f}_{ \mathrm{FD}}\times \mathrm{ SP}_{ \mathrm{FD}}+ \mathrm{f}_{ \mathrm{BD}} \times\mathrm{ SP}_{ \mathrm{BD}} $ (5) where, fFD and fBD represent the fractional contributions of fungal and bacterial denitrification, with SPFD and SPBD denoting their respective SP end-member signatures. A two-source mass balance assumption (fFD + fBD = 1) was applied. End-member SP values were set at 37‰ (fungal) and −5‰ (bacterial)[48].
Calculations and statistical analysis
-
Warming effects on the measured variables were quantified using the response ratio (RR), defined as the natural logarithm (ln) of the mean value under the warming treatment (
$ \overline{{X}_{t}} $ $ \overline{{X}_{c}} $ $ \mathrm{RR}=\ln\left(\dfrac{\overline{{X}_{t}}}{\overline{{X}_{c}}}\right)=\ln\left(\overline{{X}_{t}}\right)-\ln\left(\overline{{X}_{c}}\right)$ (6) Differences among treatments were analyzed using one-way ANOVA with Tukey's post hoc test, with significance defined at p < 0.05. Linear fitting analyses were conducted in OriginPro 2021b. Linear fitting analyses were performed using OriginPro 2021b. Pearson correlation analyses were performed to examine relationships between variations in N2O emissions, and abiotic as well as biological variables. Structural equation modeling (SEM) was used to quantify direct and indirect effects of key predictors on the N2O warming RR. Model fit was evaluated using p (> 0.05), CFI (> 0.9), and RMSEA (< 0.008). Statistical analyses were performed in R software (version 4.5.1).
-
The impact of a +4°C warming treatment on denitrification processes was assessed across six Chinese provinces: Heilongjiang (Hj), Shandong (Sd), Jiangsu (Js), Zhejiang (Zj), Guangdong (Gd), and Hainan (Hn). Potential denitrification rates (Fig. 1a) under warming conditions (eT) increased relative to ambient conditions (aT), with mean values of 173.40 μg kg−1 h−1 (+4%) for Hj, 336.73 μg kg−1 h−1 (+9%) for Sd, 268.59 μg kg−1 h−1 (+7%) for Js, 106.32 μg kg−1 h−1 (+12%) for Zj, 323.24 μg kg−1 h−1 (+7%) for Gd, and 277.77 μg kg−1 h−1 (+23%) for Hn. Significant differences between warming and ambient conditions were noted for Sd, Js, Zj, Gd, and Hn (p < 0.01). Bacterial denitrification rates (Fig. 1b) under warming conditions were 66.25 μg kg−1 h−1 (–12%) for Hj, 190.87 μg kg−1 h−1 (+21%) for Sd, 174.08 μg kg−1 h−1 (+26%) for Js, 60.91 μg kg−1 h−1 (+39%) for Zj, 233.29 μg kg−1 h−1 (+16%) for Gd, and 182.84 μg kg−1 h−1 (+47%) for Hn, with significant differences for Sd, Js, Gd, and Hn (p < 0.05). Fungal denitrification rates (Fig. 1c) under warming conditions were 107.15 μg kg−1 h−1 for Hj, 145.87 μg kg−1 h−1 for Sd, 94.513 μg kg−1 h−1 for Js, 45.416 μg kg−1 h−1 for Zj, 89.95 μg kg−1 h−1 for Gd, and 94.93 μg kg−1 h−1 for Hn, with no significant differences across provinces (p > 0.01).
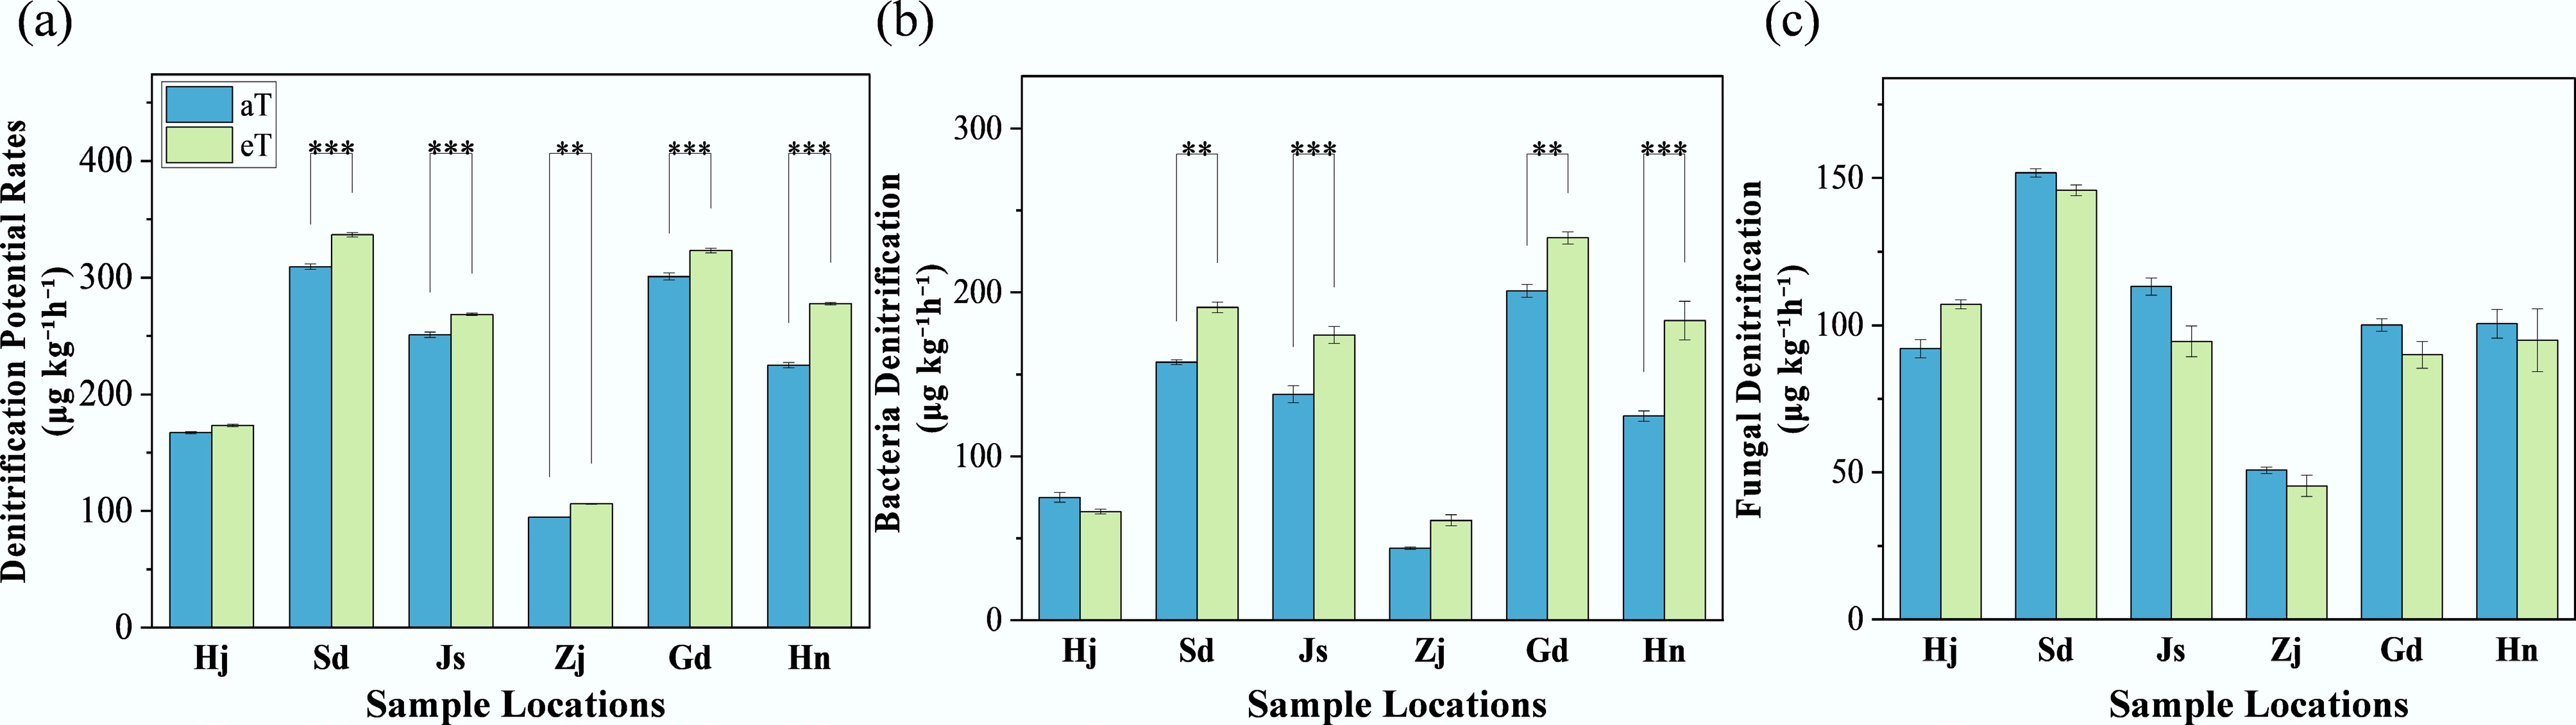
Figure 1.
Response of local denitrification potential rates to warming. Three replicates of one soil sample were used for warming incubations. 'aT' represents the local average annual temperature, and 'eT' represents the elevated temperature (+4 °C), based on the average annual temperature. Sample locations: Heilongjiang (Hj), Shandong (Sd), Jiangsu (Js), Zhejiang (Zj), Guangdong (Gd), and Hainan (Hn). The level of significance is determined by a two-sided t-test; * p < 0.05, ** p < 0.01, and *** p < 0.001.
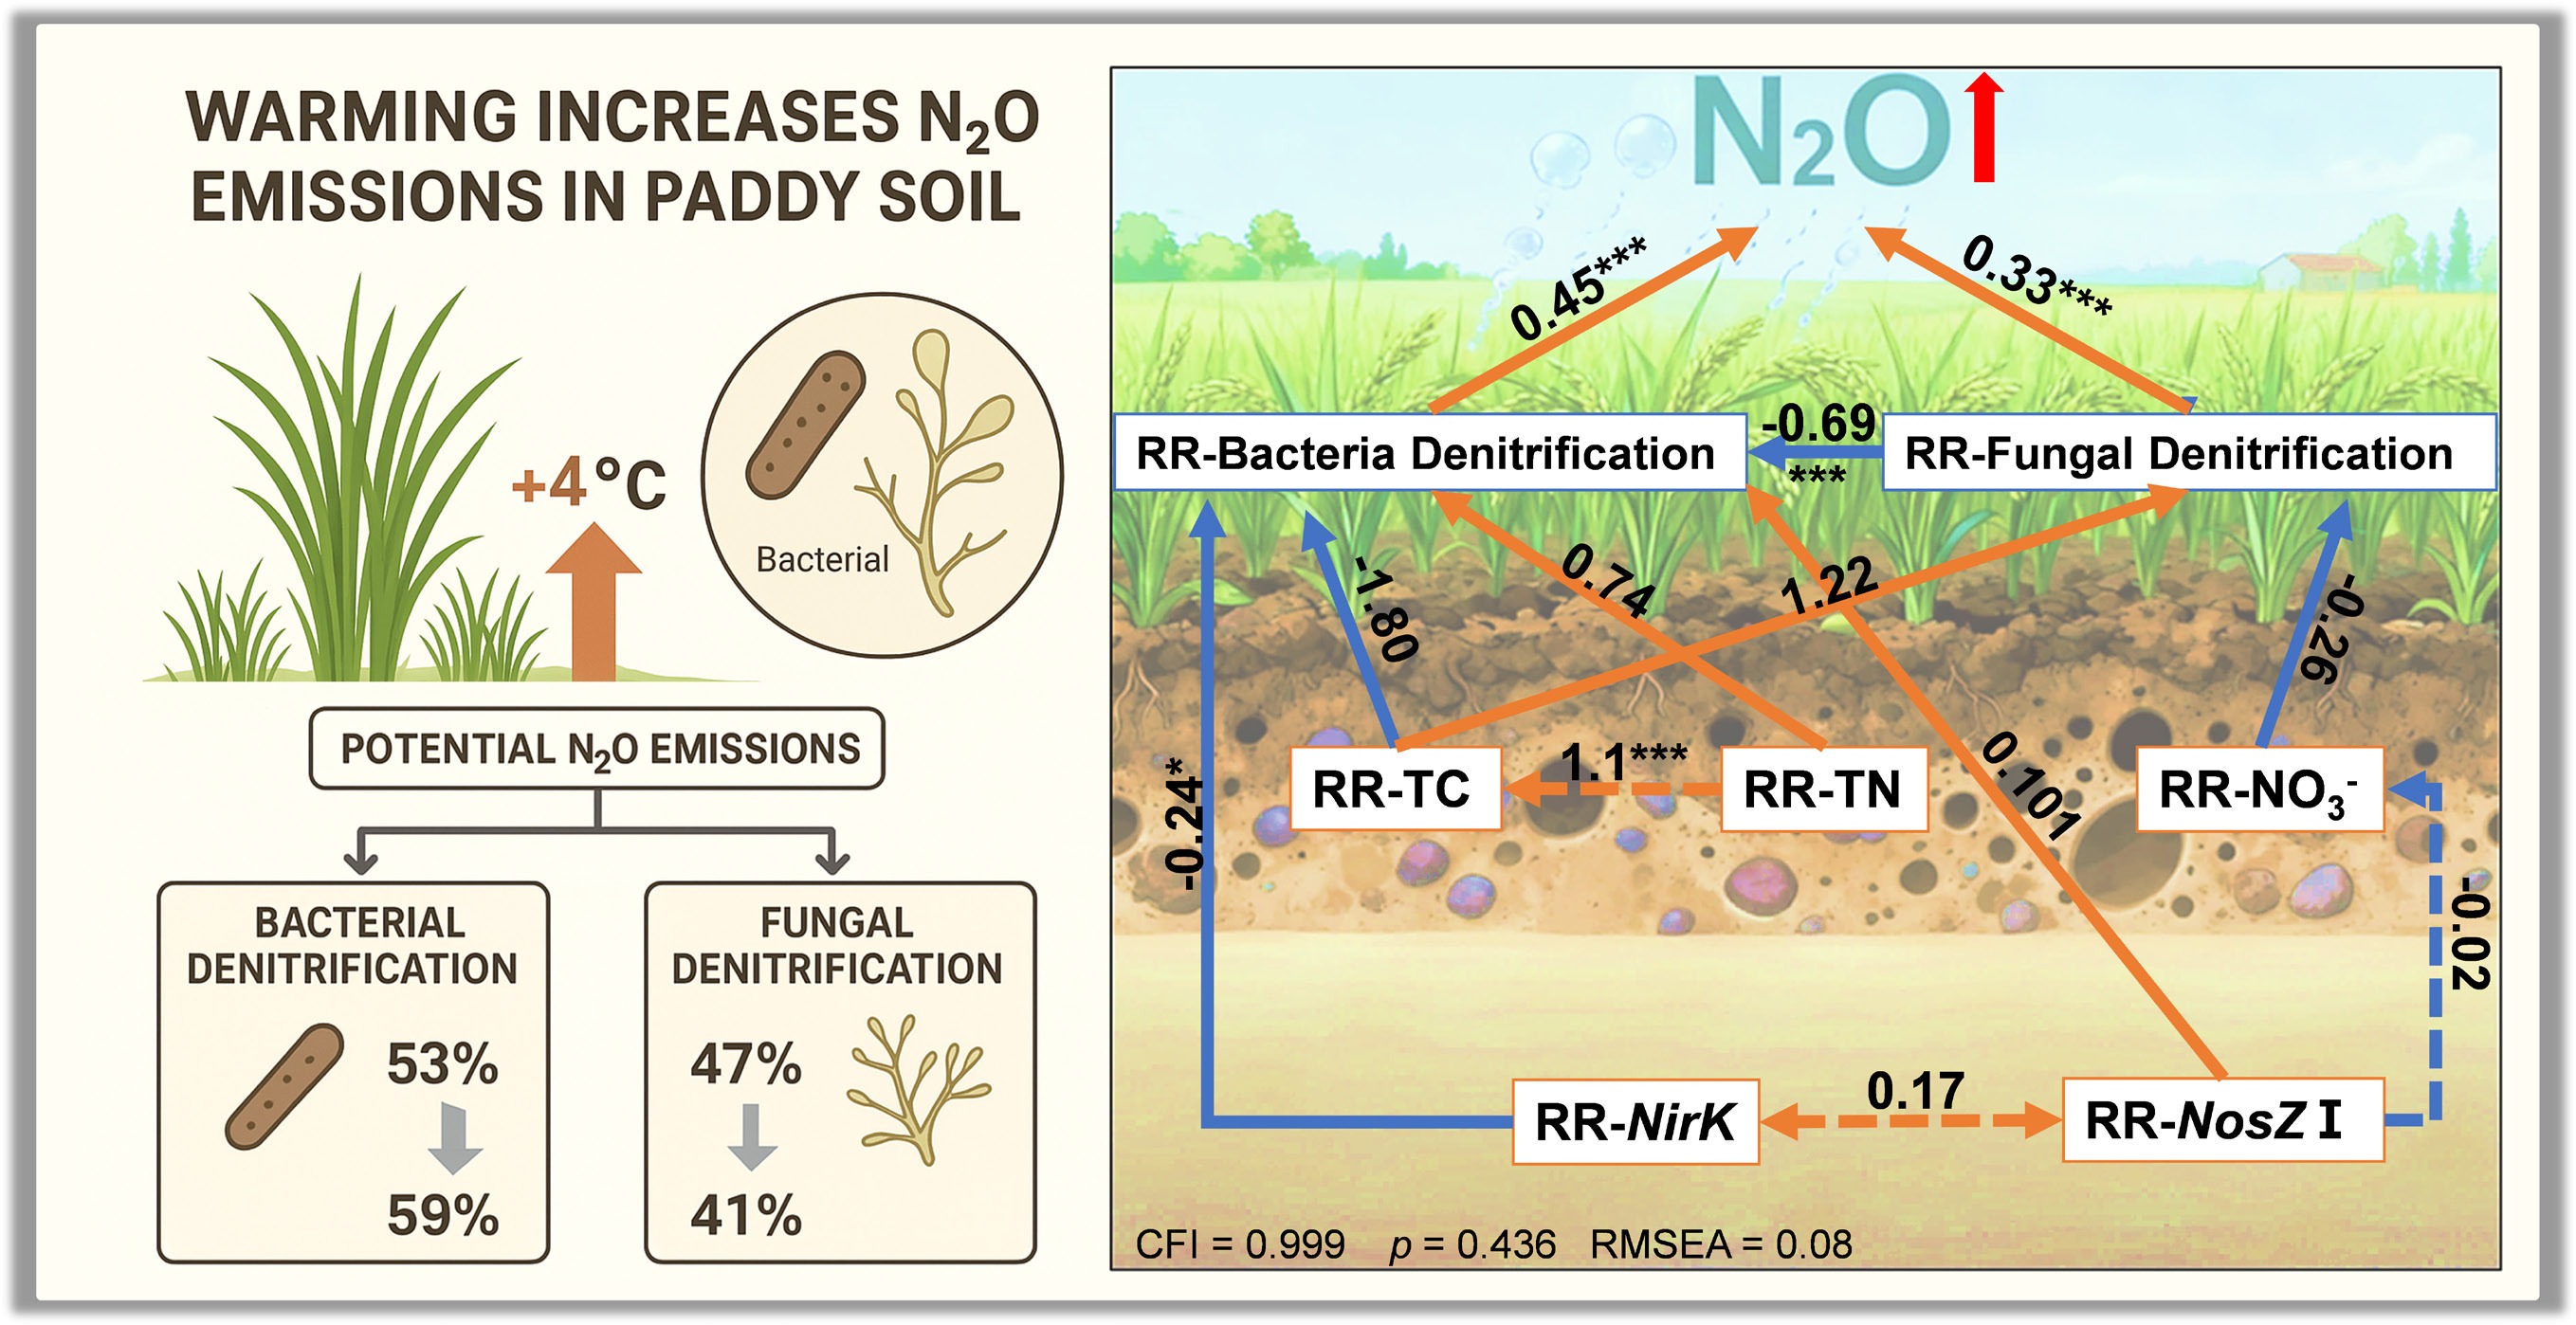
N2O SP reflects the isotopic composition at specific molecular sites and is used to estimate the relative contributions of bacterial and fungal denitrification[48]. Under ambient conditions (aT), SP values (Fig. 2a) were 18.39‰ for Hj, 14.50‰ for Sd, 16.03‰ for Js, 19.84‰ for Zj, 16.98‰ for Gd, and 16.52‰ for Hn, decreasing by 10%, 15%, 27%, 29%, 39%, and 23%, respectively, under warming conditions (eT). Significant reductions in SP were observed for Js, Zj, and Gd (p < 0.05). The relative contributions of denitrification processes (Fig. 2b) under ambient conditions (aT) showed bacterial denitrification at 53.2% and fungal denitrification at 46.8%, with a 6% increase in bacterial contribution under warming conditions (eT).
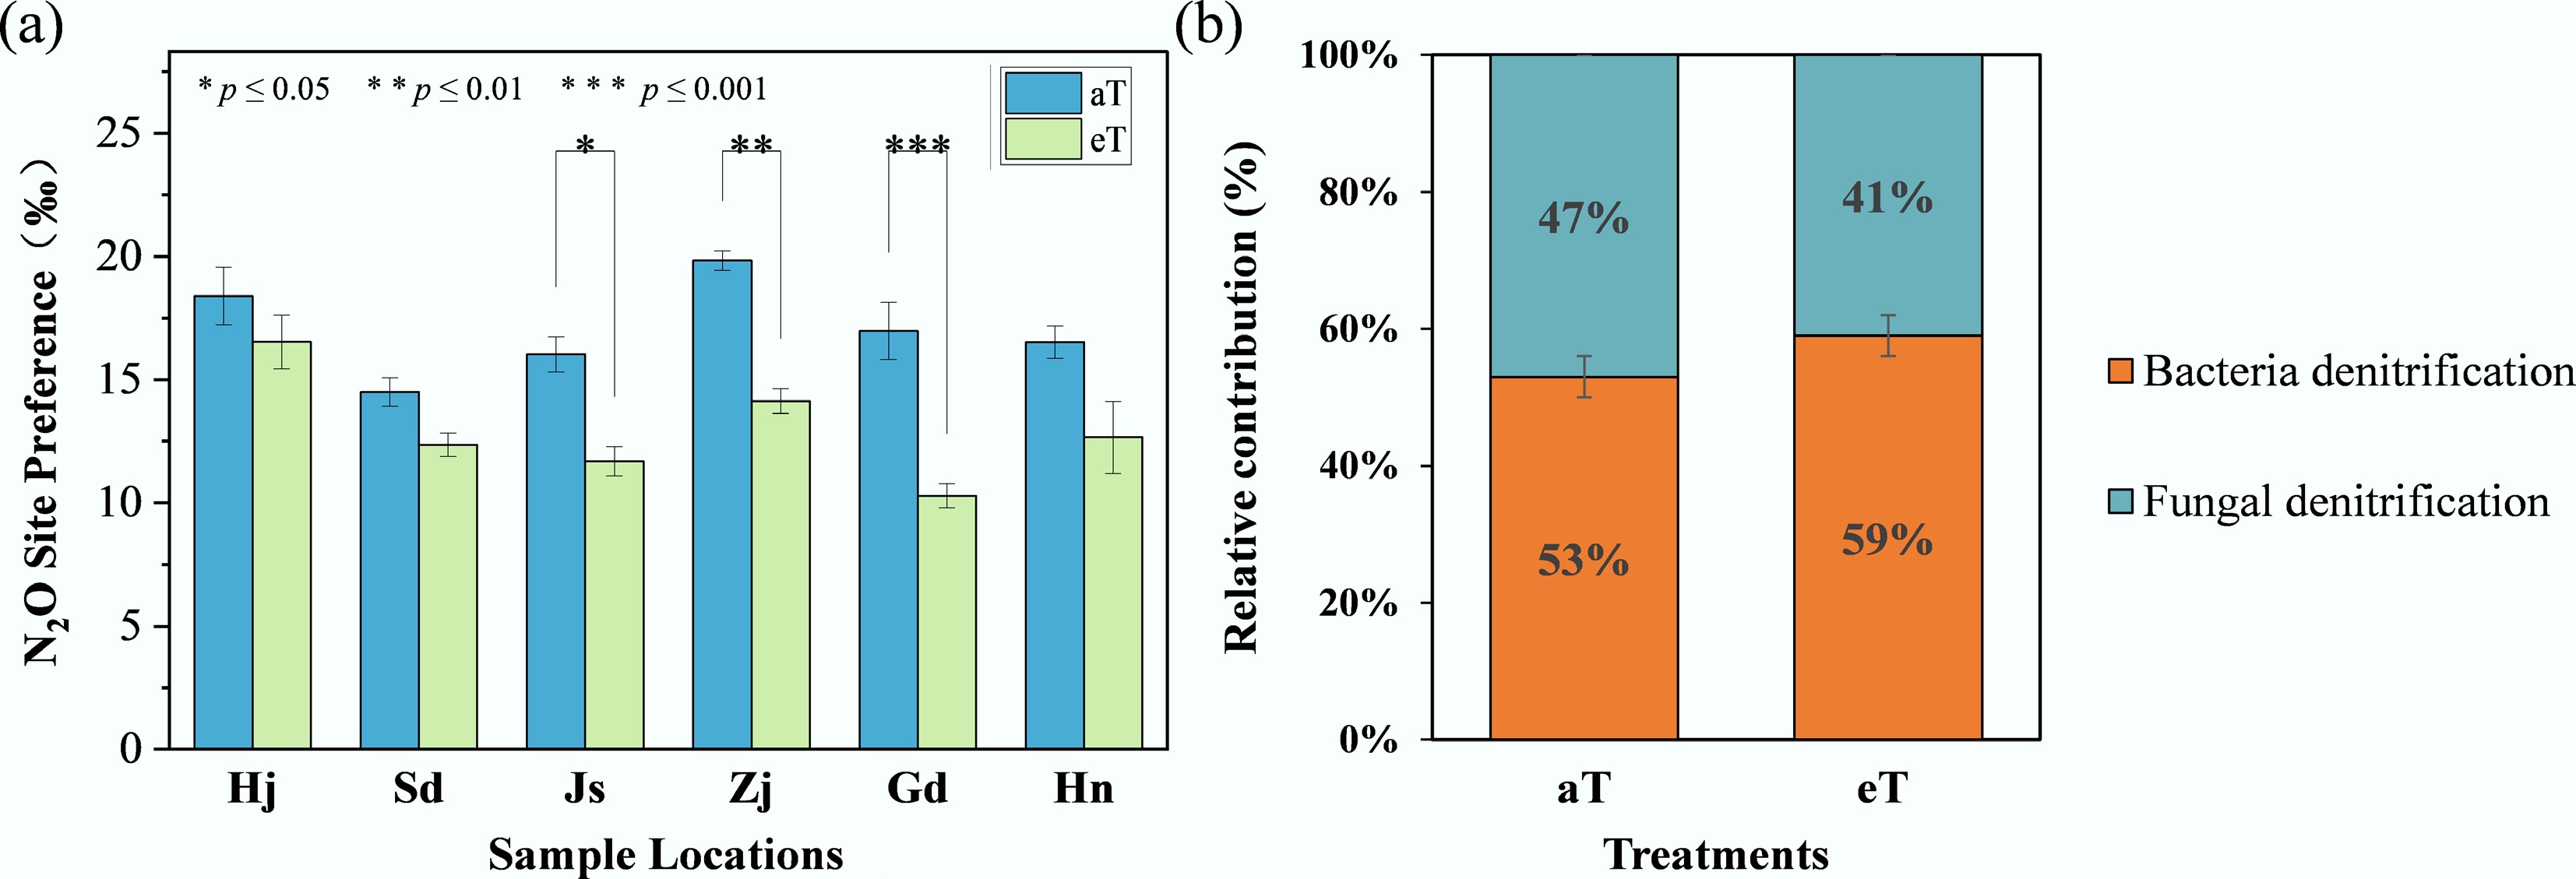
Figure 2.
(a) Response of local SP value to warming. (b) Relative contributions of bacterial and fungal denitrification. Three replicates of one soil sample were used for warming incubations. The level of significance is determined by two-sided t-test; * p < 0.05, ** p < 0.01, and *** p < 0.001.
Response ratios of denitrification-derived N2O to warming
-
The RR for potential N2O denitrification rates to warming was 0.1 (Fig. 3a), while bacterial denitrification exhibited a higher RR of 0.19, and fungal denitrification showed a negative RR of –0.06. The temperature response ratios for fungal denitrification (RR-FD) across all locations (Fig. 3b) displayed no significant differences (p > 0.05). In contrast, the bacterial denitrification response ratio (RR-BD) for Hj was significantly lower than that of other locations (p < 0.05). These RRs were used to quantify the sensitivity of denitrification processes to warming.
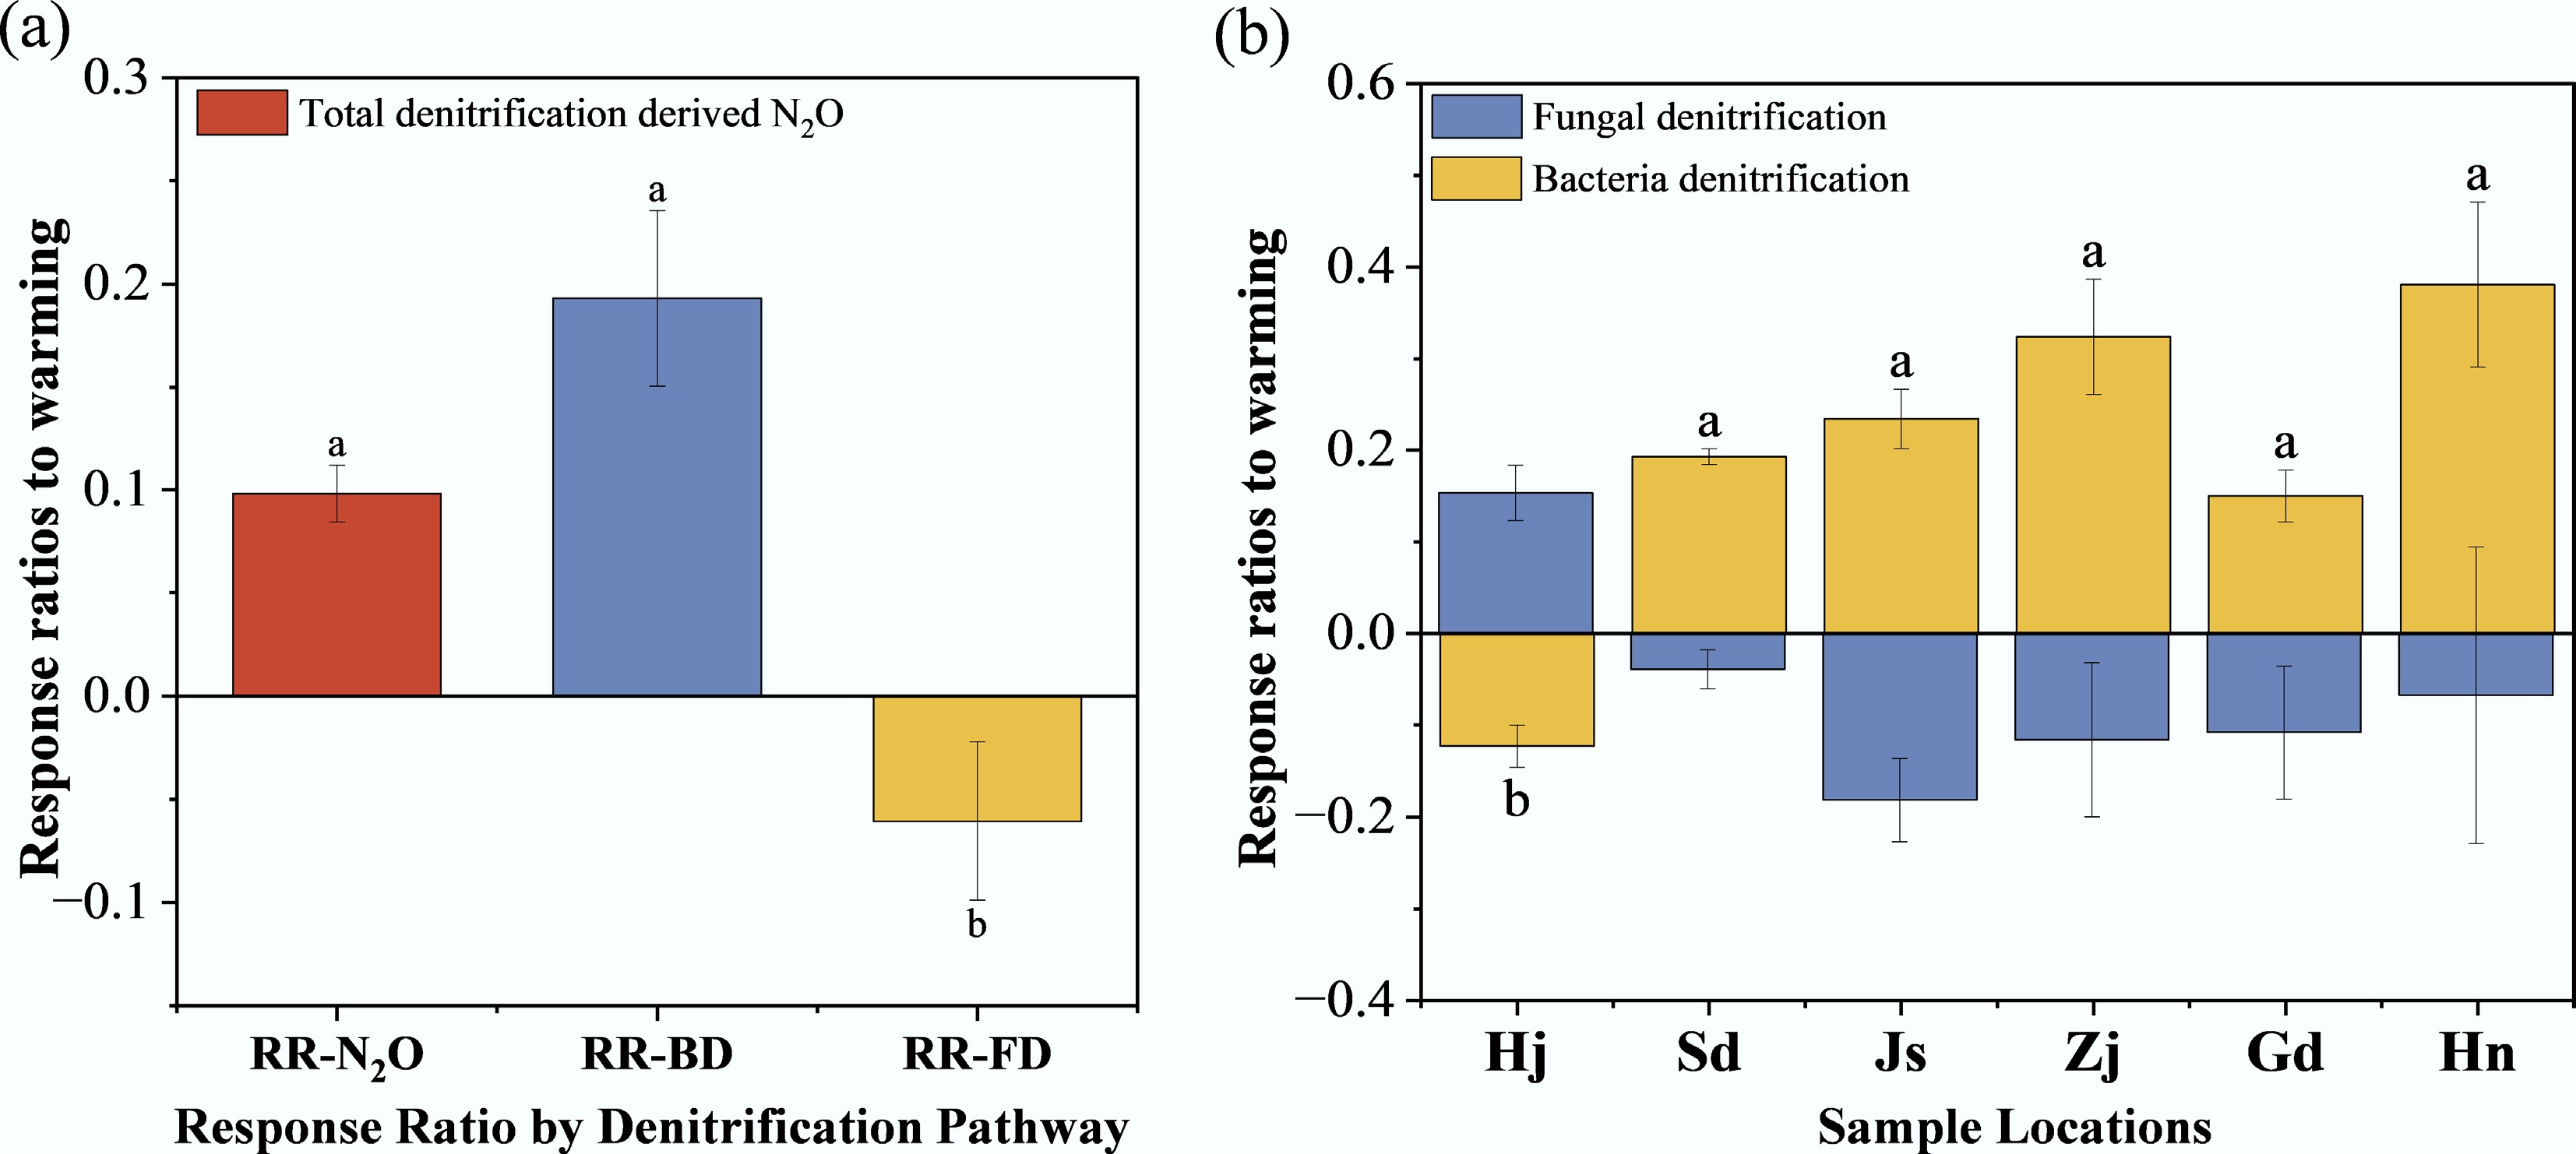
Figure 3.
(a), (b) Response ratios to warming. Different lowercase letters denote statistically significant differences (p < 0.05, Tukey's HSD test).
A +4 °C warming treatment elicited varied responses in soil abiotic and biotic factors across six Chinese provinces, with most properties remaining stable but select nutrients and denitrifying genes showing province-specific shifts (p < 0.05). Among soil properties, total carbon (TC: 0.89%–3.43%), total nitrogen (TN: 0.09%–0.17%), dissolved organic nitrogen (DON: 14.65–52.62 mg kg−1), nitrate nitrogen (NO3–-N: 4.38–8.34 mg kg−1), and pH (4.40–7.65) exhibited no consistent warming-induced changes (p > 0.05). Dissolved organic carbon (DOC: 25.78–184.97 mg kg−1) decreased significantly only in Hainan, while ammonium nitrogen (NH4+-N: 0.20–5.52 mg kg−1) increased significantly only in Shandong (Supplementary Fig. S2).
Denitrifying gene abundances spanned several orders of magnitude and displayed gene- and province-specific responses to warming. Bacterial nirK (6.68–18.40 × 10⁸ copies g−1) increased by 24% in Heilongjiang, but decreased by 26%–57% in Shandong and Hainan (p < 0.05); nirS (16.43–55.23 × 10⁶ copies g−1) surged 88% in Shandong (p < 0.001). Fungal fnirK (2.01–54.60 × 10³ copies g−1), and N2O-reductase nosZ I (0.39–1.35 × 10⁸ copies g−1) showed no systematic warming effects (p > 0.05), whereas nosZ II (0.48–2.63 × 10⁸ copies g−1) declined 27.5% in Shandong (p < 0.05) (Fig. 4). These selective shifts highlight localized microbial and substrate feedback to warming that likely modulate denitrification-derived N2O emissions.
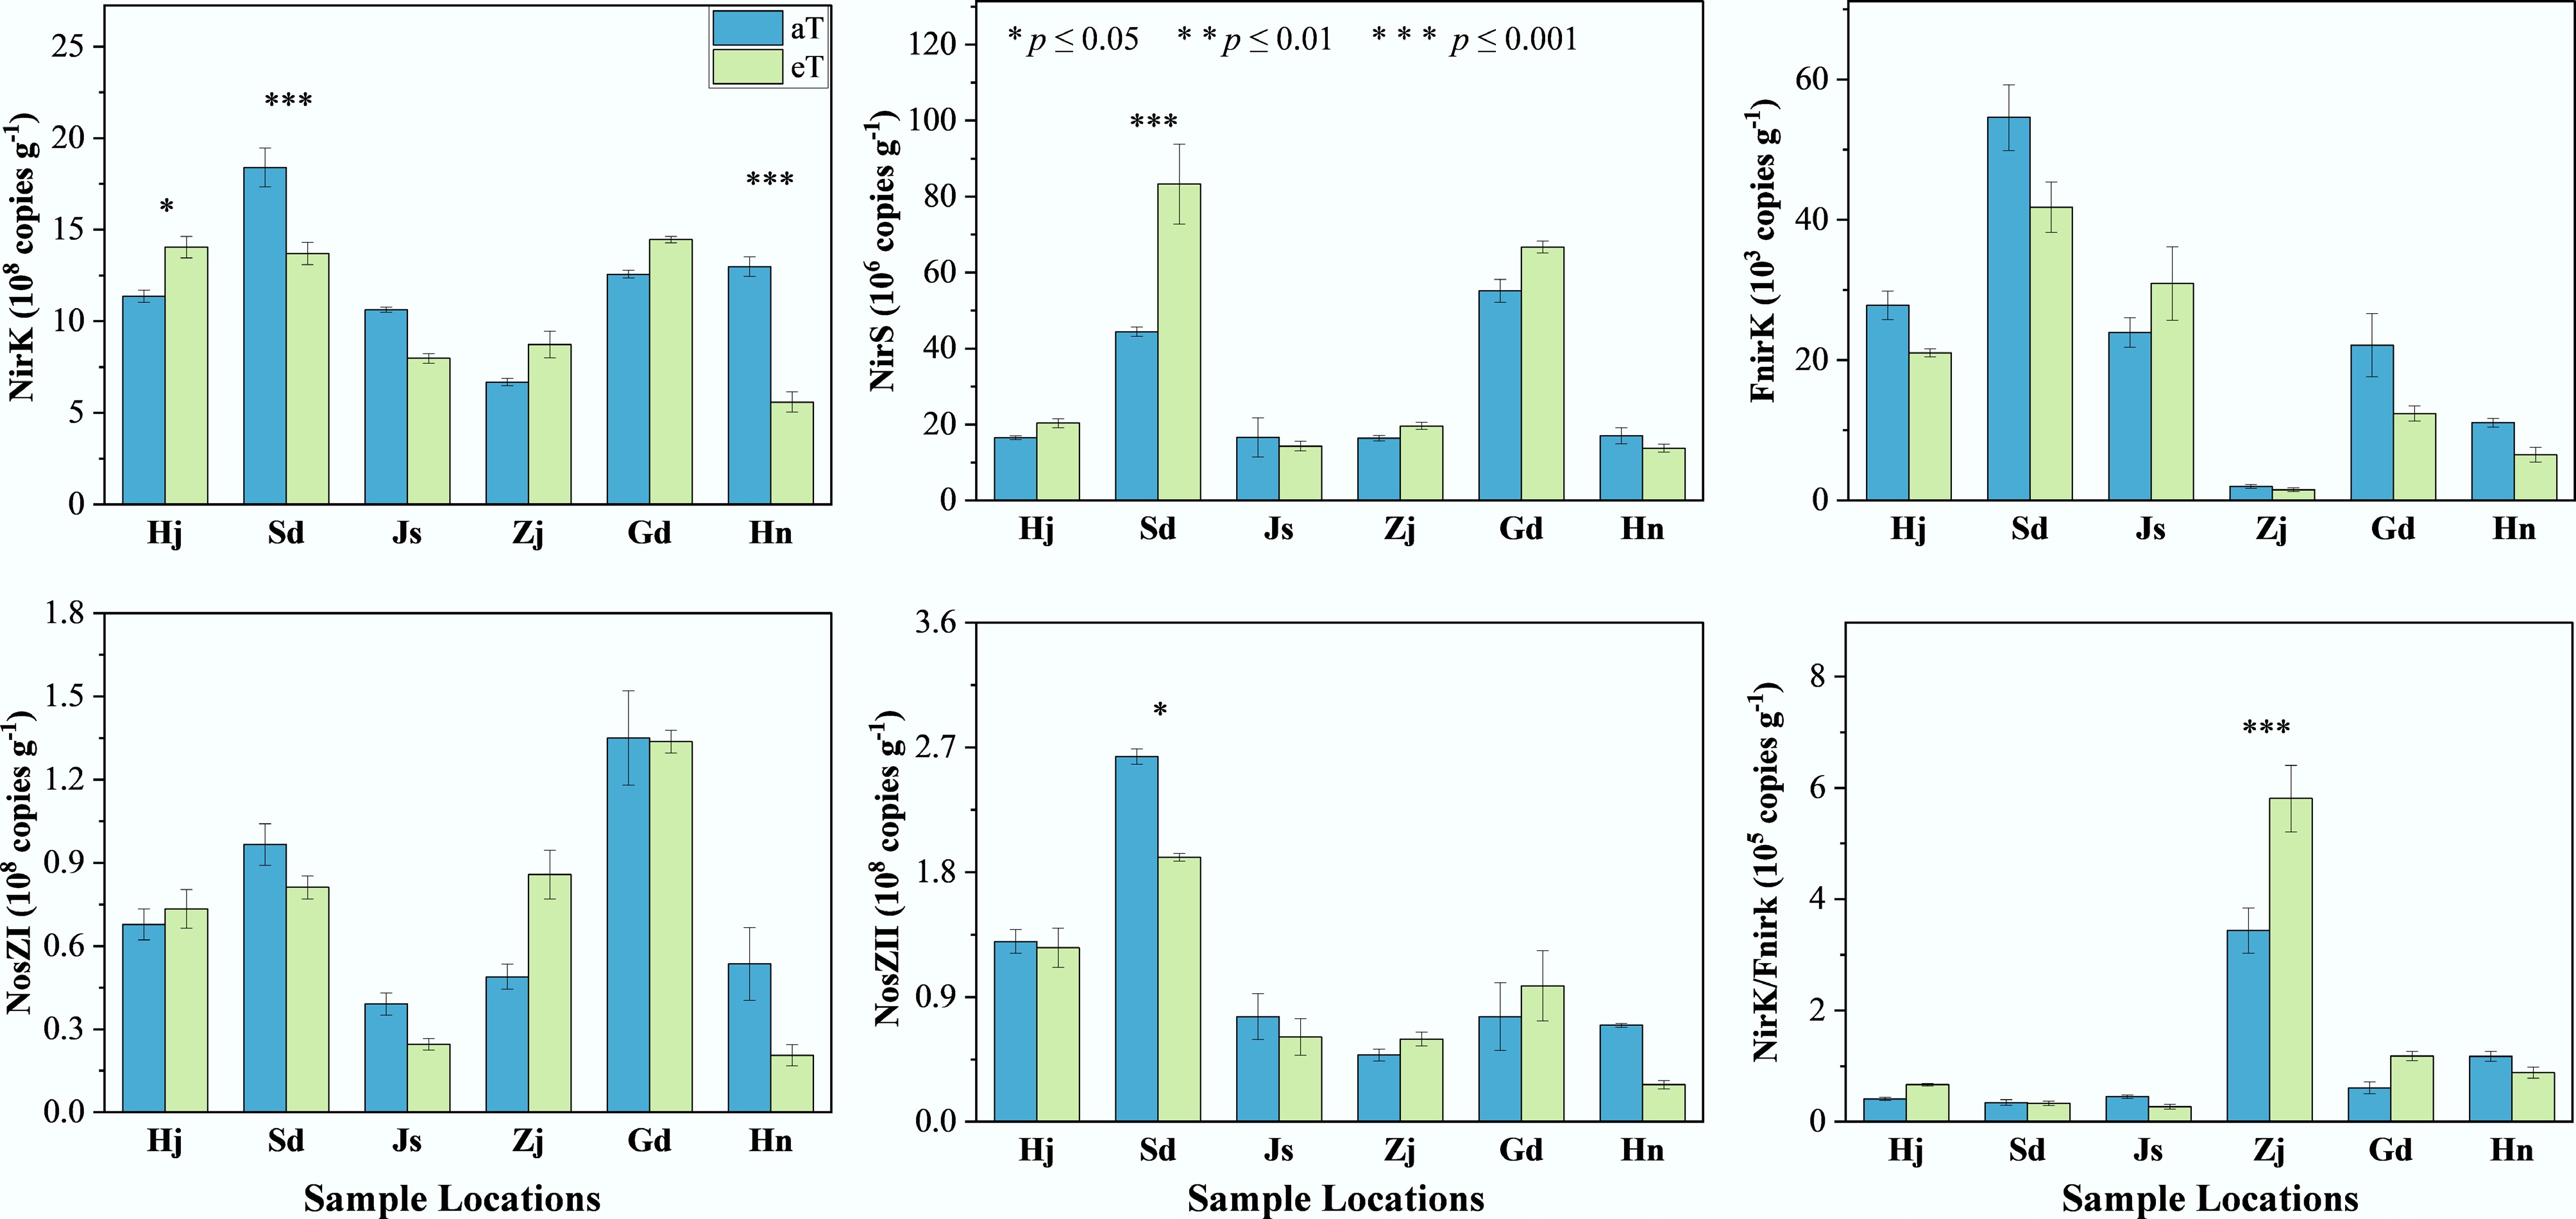
Figure 4.
Effects of warming on the abundance of denitrification function genes at different sampling sites. Three replicates of one soil sample were used for warming incubations. The level of significance is determined by two-sided t-test; * p < 0.05, ** p < 0.01, and *** p < 0.001.
Factors driving increased denitrification-derived N2O under warming
-
Pearson correlation analysis revealed distinct regulatory patterns for bacterial vs fungal denitrification under warming (Supplementary Fig. S3). RR-N2O was negatively correlated with NH4+-N (p < 0.05), FnirK (p < 0.05), nirK (p < 0.001), and nosZII (p < 0.05). RR-BD was strongly negatively correlated with DOC (p < 0.05), DON (p < 0.05), NH4+-N (p < 0.001), nirK (p < 0.001), and nosZII (p < 0.05). In contrast, RR-FD was positively correlated with DON (p < 0.05) and NH4+-N (p < 0.05). Potential denitrification rate (N2O) was strongly positively correlated with RR-BD (p < 0.001), RR-FD (p < 0.001), pH (p < 0.05), nirS (p < 0.01), and FnirK (p < 0.05), but strongly negatively correlated with DOC (p < 0.001) and DON (p < 0.001). Bacterial denitrification rate was negatively correlated with DOC (p < 0.001), DON (p < 0.001), and NH4+-N (p < 0.05), and positively correlated with nirS (p < 0.05). Fungal denitrification rate was positively correlated with clay content (p < 0.05), pH (p < 0.001), TC (p < 0.05), nirS (p < 0.05), FnirK (p < 0.001), and nosZII (p < 0.001).
The relationships between the response ratios of potential N2O denitrification rates (RR-N2O) and RR of various factors were explored using a correlation heatmap (Fig. 5). RR-N2O exhibited a significant positive correlation with RR-BD and the response ratio of ammonium nitrogen (RR-NH4+) (p < 0.05), while showing significant negative correlations with the response ratios of dissolved organic carbon (RR-DOC) and the nirK gene (RR-nirK) (p < 0.05). Additionally, RR-BD was significantly negatively correlated with RR-nirK and the response ratio of total carbon (RR-TC) (p < 0.05). Regression analysis revealed that RR-N2O increased significantly with rising RR-BD (r2 = 0.47, p < 0.001) (Fig. 6a). In contrast, no significant influence was observed from changes in the RR-FD (Fig. 6b). Additionally, regression analysis revealed a significant negative effect of RR-BD on RR-FD (r2 = 0.566, p < 0.001) (Fig. 6c).
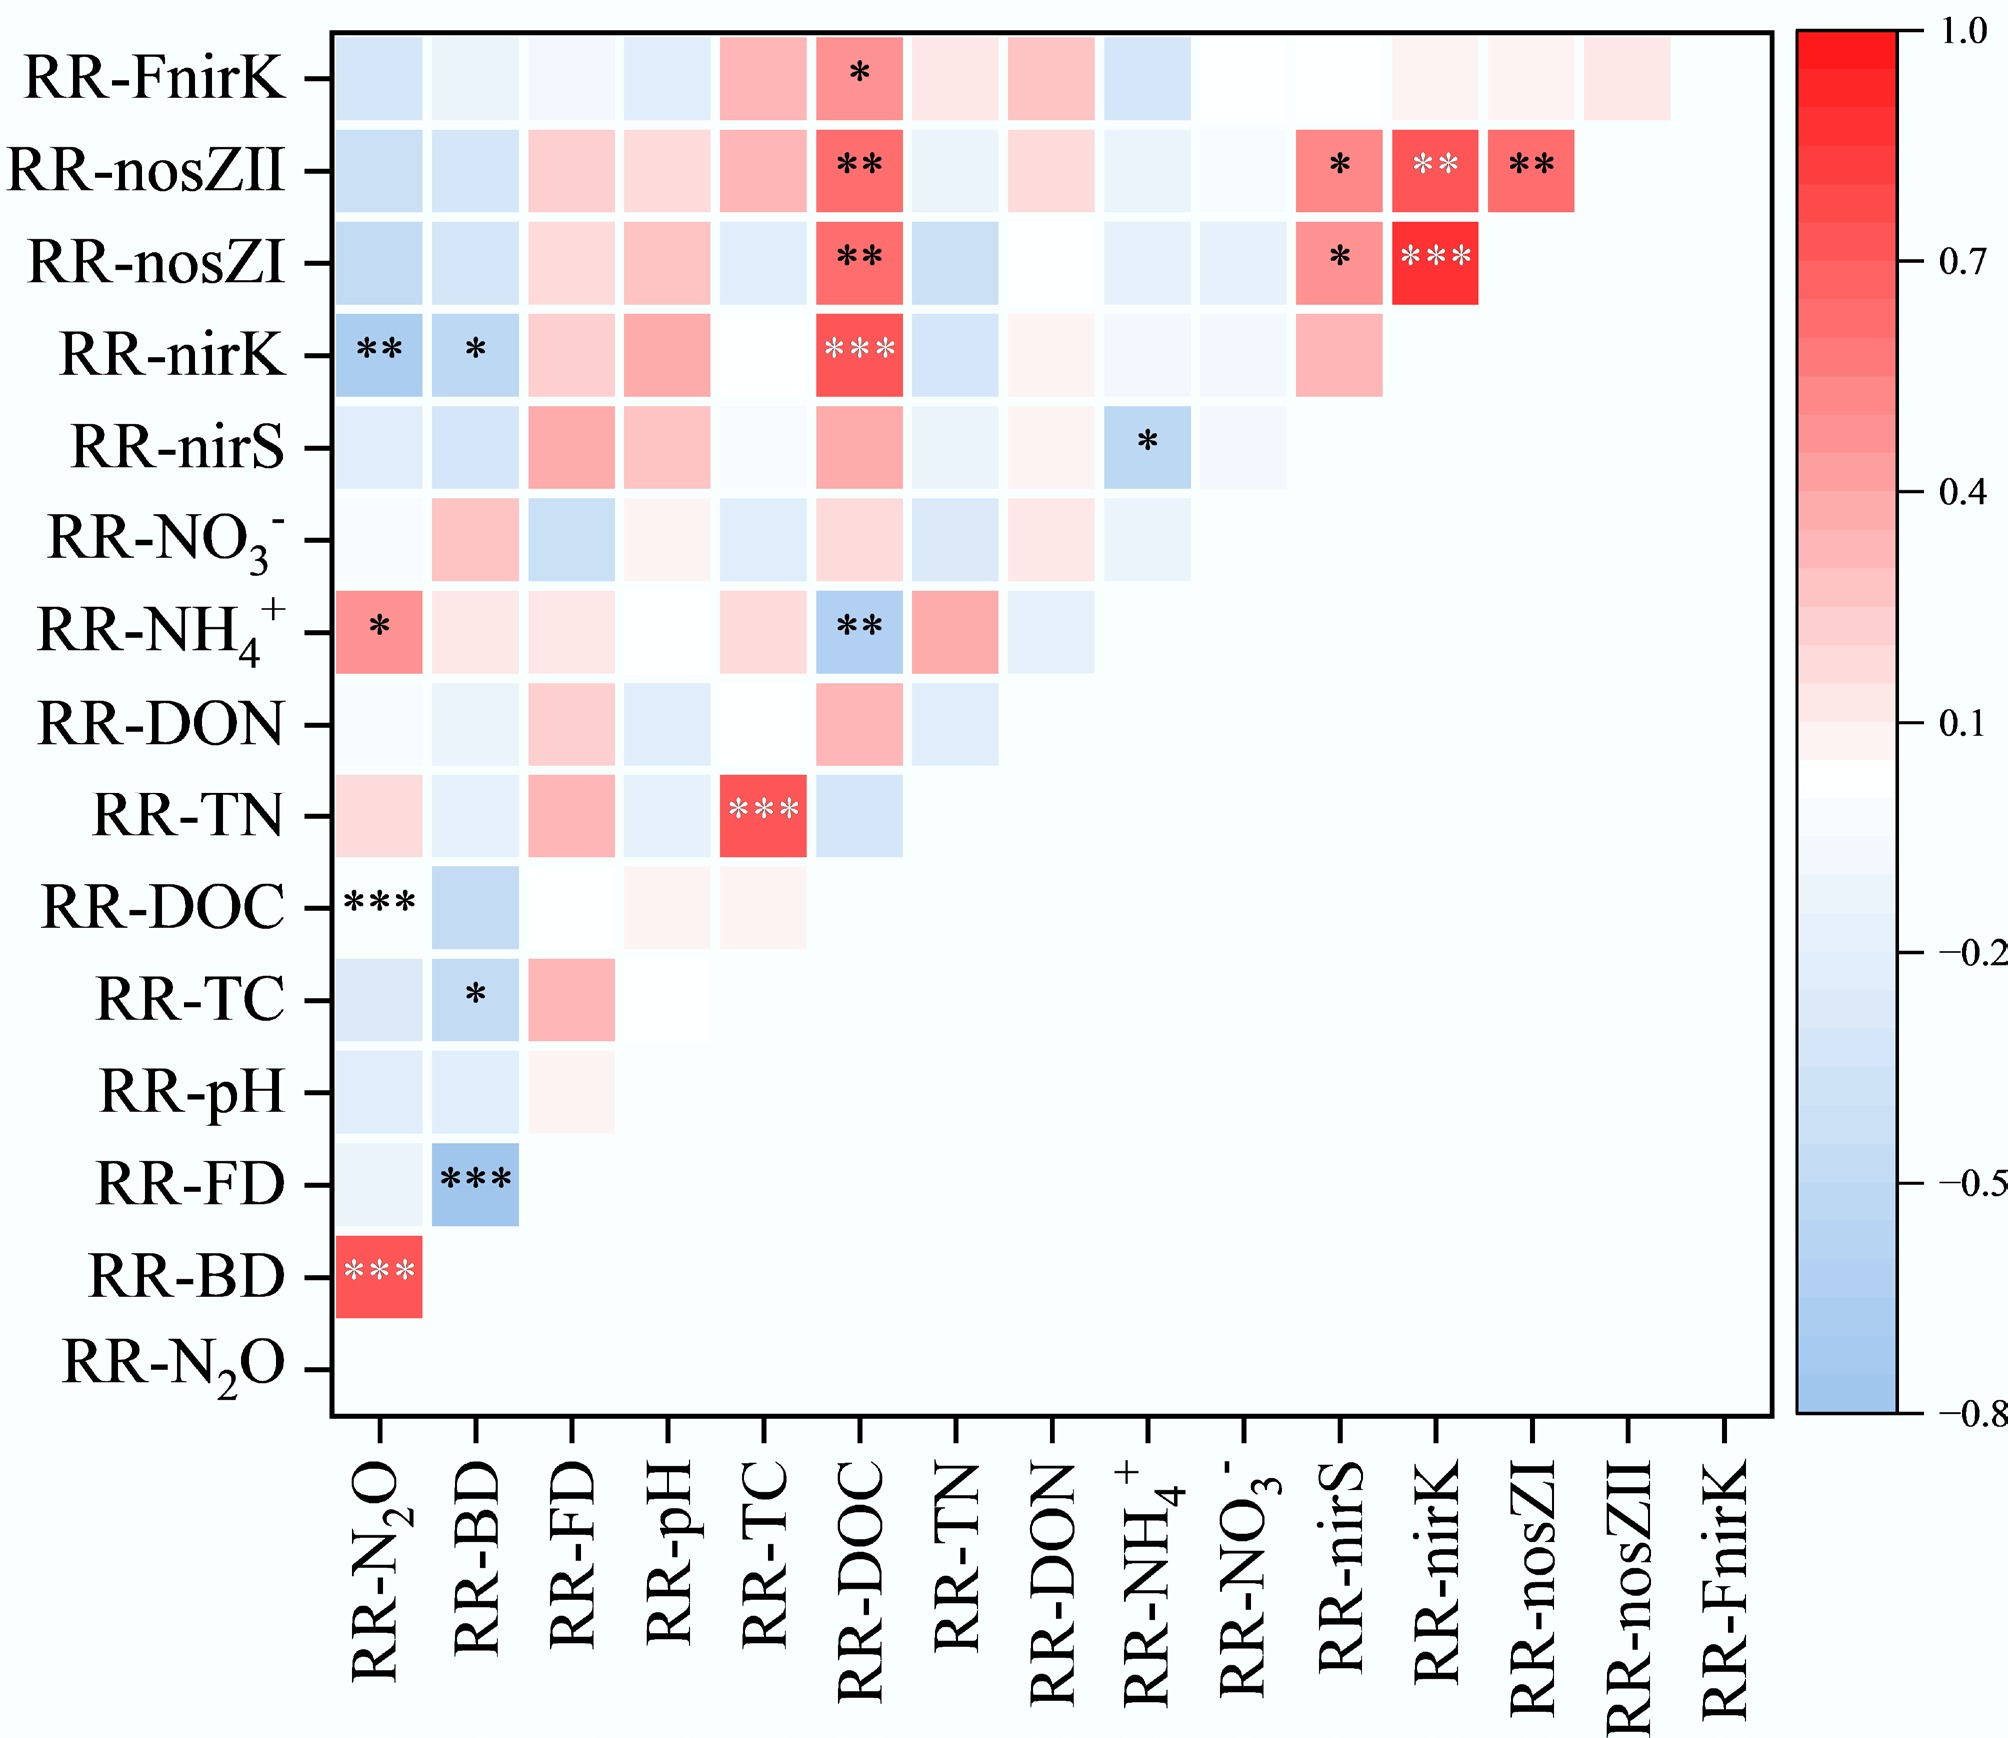
Figure 5.
Pearson correlation analysis between climate factors, soil properties, functional gene abundance, N2O production rates, and their response ratios. The correlation coefficients ranging from negative to positive are indicated by colour gradient from red to blue. The level of significance is determined by two-sided t-test; * p < 0.05, ** p < 0.01, and *** p < 0.001.
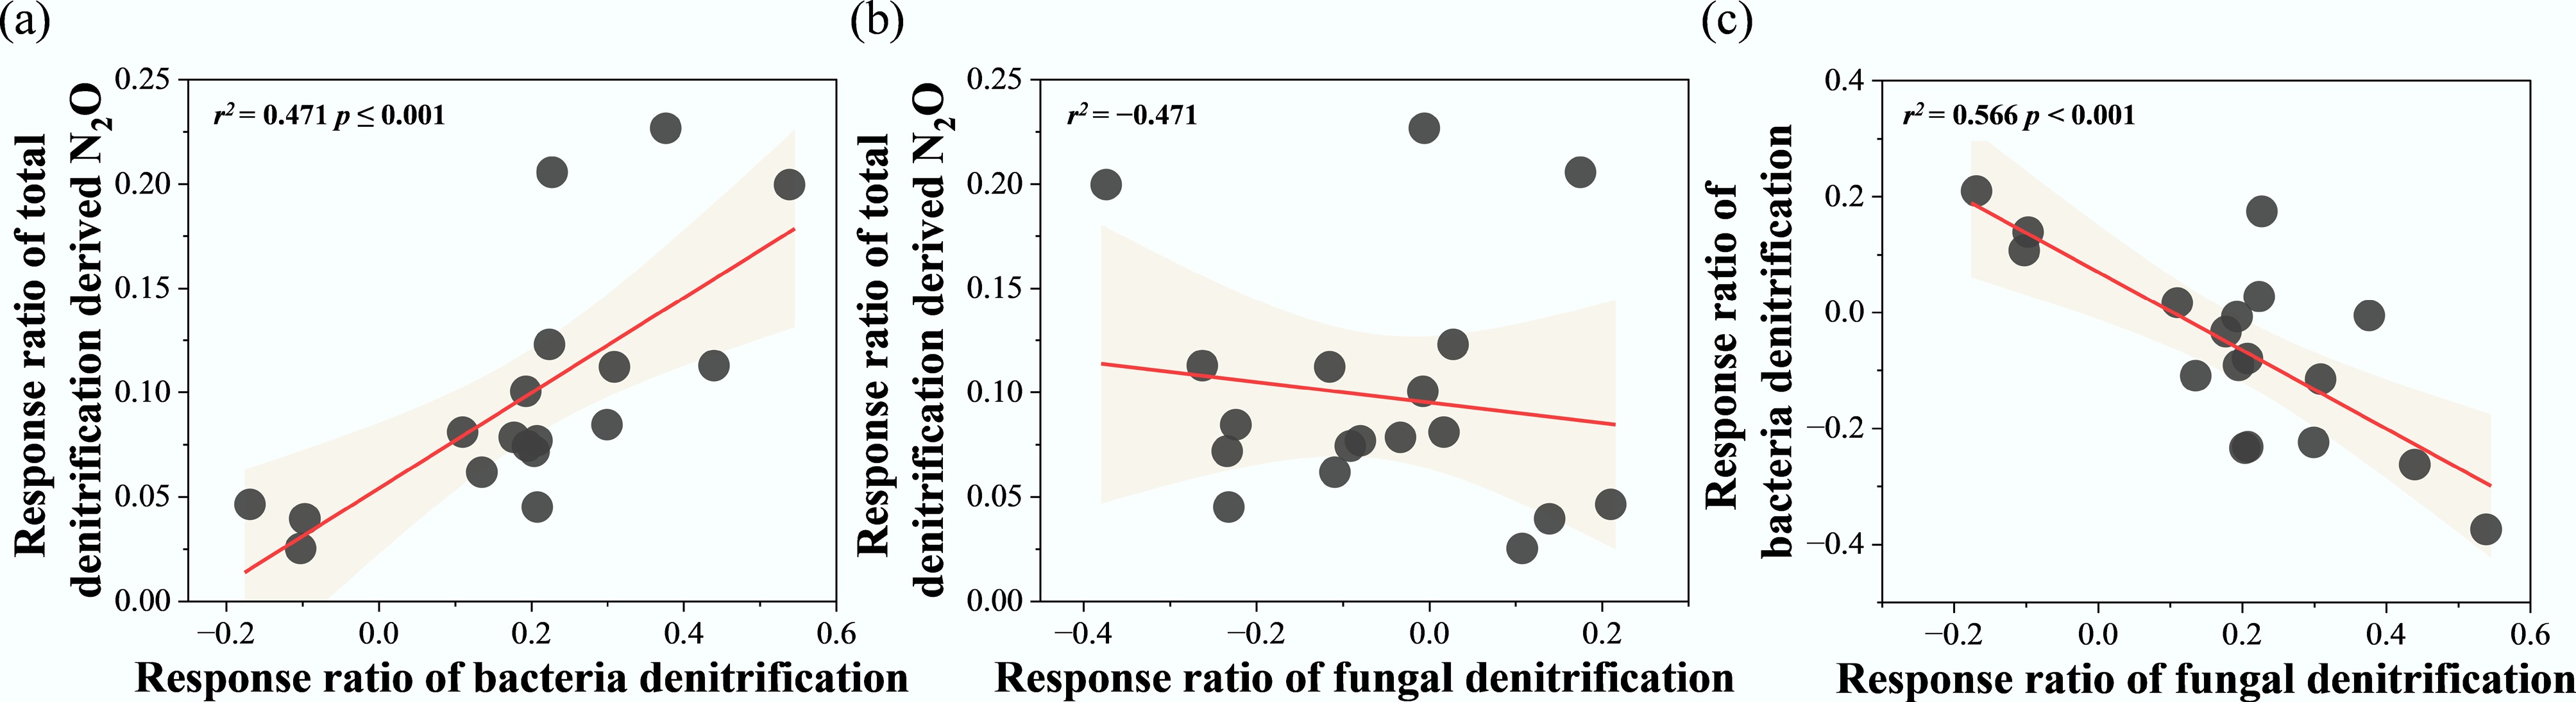
Figure 6.
Regression analysis between response ratio of total denitrification derived N2O (RR-N2O), response ratio of bacterial denitrification (RR-BD), and response ratio of fungal denitrification (RR-FD). * p < 0.05, ** p < 0.01, and *** p < 0.001.
The SEM analysis (Fig. 7) elucidated the direct and indirect effects of a +4°C warming treatment on N2O emissions, integrating RR of biotic and abiotic factors. The model demonstrated a good fit, with a Comparative Fit Index (CFI) of 0.999, a root mean square error of approximation (RMSEA) of 0.008, and a standardized root mean square residual (SRMR) of 0.071, indicating robust explanatory power (p = 0.436). The increase in N2O emissions induced by warming was positively regulated by the RR-BD (path coefficient = 0.45, p < 0.001) and RR-FD (path coefficient = 0.33, p < 0.001). RR-BD was significantly influenced by RR-nirK (path coefficient = −0.242) and RR-total nitrogen (RR-TN) (path coefficient = 0.740), though only the negative relationship with RR-nirK was significant (p < 0.05). Additionally, RR-BD and RR-FD exhibited a significant negative correlation (path coefficient = −0.69, p < 0.001), reflecting a trade-off between bacterial and fungal denitrification under warming. RR-N2O was indirectly negatively influenced by RR-nirK through RR-BD (path coefficient = −0.242, p < 0.05). These findings highlight the complex interplay of soil properties and microbial processes in driving warming-induced N2O emissions.
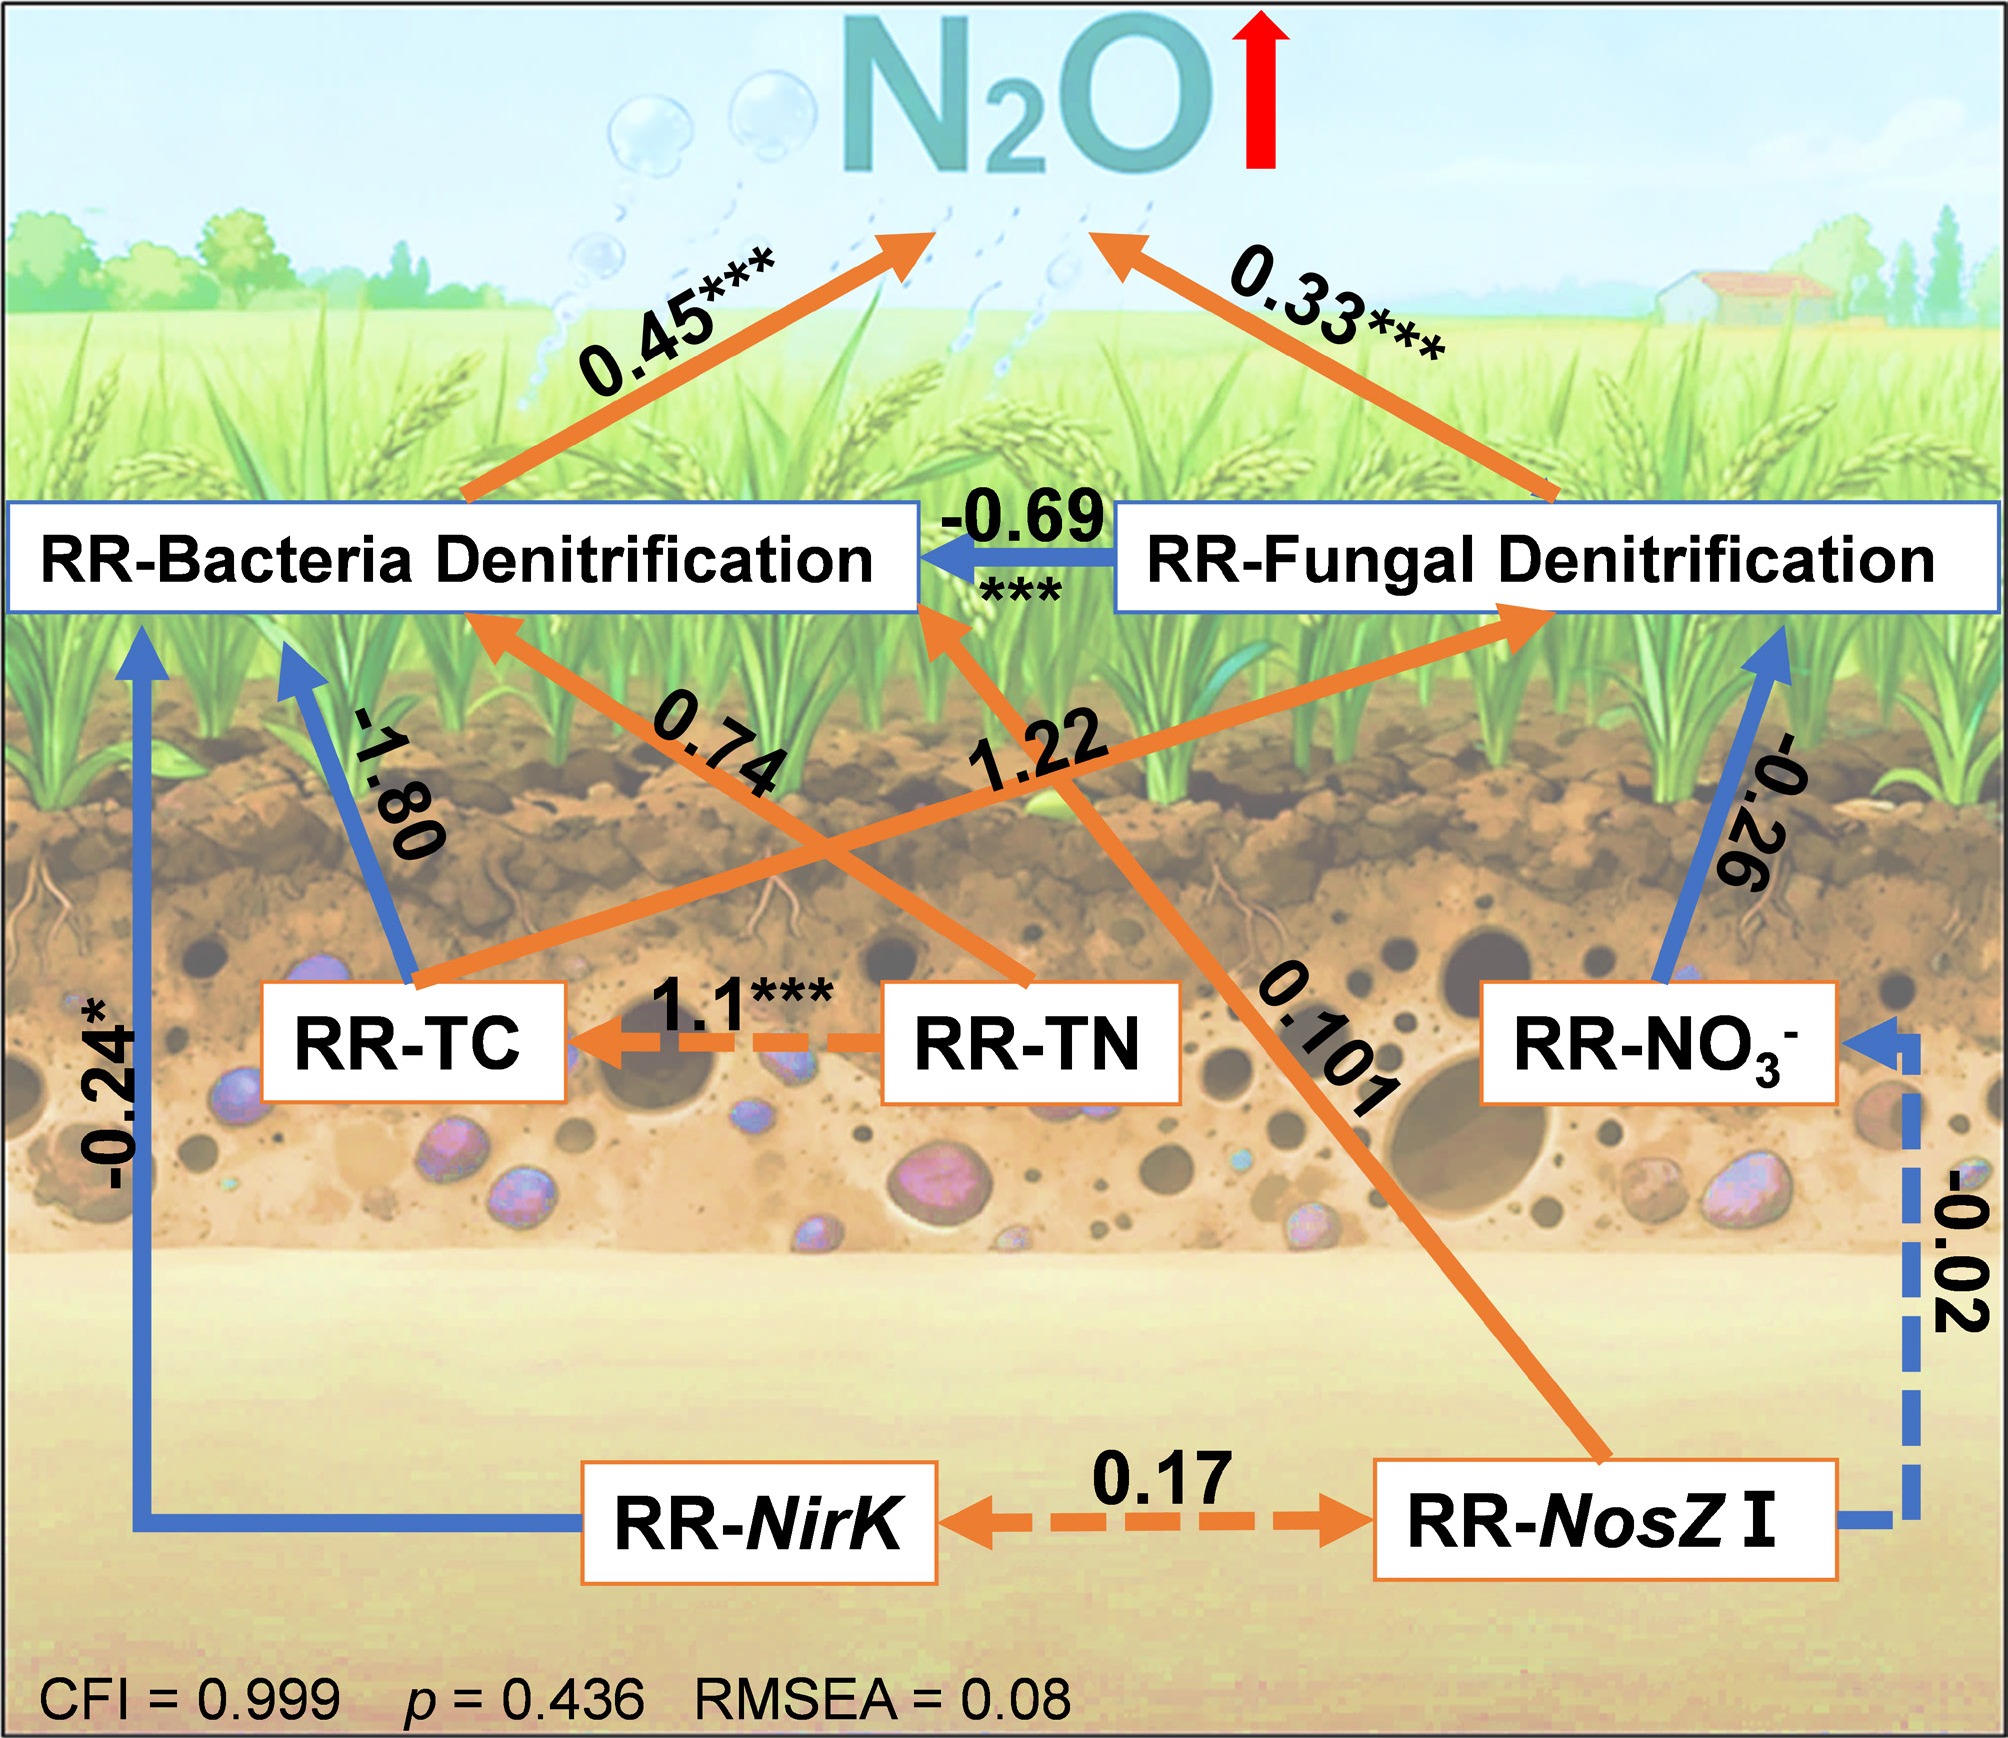
Figure 7.
Structural equation models illustrating the direct and indirect effects of selected variables on response ratios of RR-N2O. Red and blue arrows indicate positive and negative effects, respectively. Solid and dashed lines represent significant and nonsignificant paths, respectively. Numbers next to the arrows are standardized path coefficients (* p < 0.05, ** p < 0.01, and *** p < 0.001).
-
Our findings showed that a +4 °C warming treatment generally enhanced potential denitrification rates in paddy soils, with increases varying from 4% to 23% across different soil types. This aligns with previous meta-analyses showing that warming increased global terrestrial N2O emissions by an average of 33% across all biomes, with particularly strong responses in warmer cropland regions, primarily due to accelerated microbial activity and enhanced substrate availability under elevated temperatures[51,52]. In our study, soil collected in the tropical climate province (Hainan) exhibited the highest increase in total denitrification (+23%). In contrast, soil collected in Heilongjiang, a northern province characterized by colder ambient conditions, showed a relatively modest increase (+4%). This is likely because bacterial communities in colder regions tend to be less responsive to temperature changes, exhibiting lower temperature sensitivity than those in warmer climates[53]. This regional disparity highlights the need for latitude-specific models to predict N2O responses, as southern provinces (e.g., Hainan, with a 23% potential rate increase) may experience amplified emissions due to year-round warm conditions that facilitate continuous denitrification cycles[54].
In our study, the contrasting responses of bacterial and fungal denitrification to warming underscore the functional divergence within microbial guilds. Bacterial denitrification rates increased significantly in four out of six provinces under +4°C warming. This is consistent with findings that bacteria tend to exhibit greater temperature sensitivity in short-term studies, possibly due to their generally higher metabolic rates and faster growth responses to warming[53,55]. In contrast, fungal denitrification showed no significant response to warming (p > 0.01), with RRs averaging −0.06, suggesting that fungi, often more resilient to environmental perturbations through spore formation and broader pH tolerance, are less temperature-sensitive in N2O production[56]. It has been suggested that fungi may not respond as acutely to short-term warming due to their slower growth kinetics and reliance on complex organic substrates[12,57]. The asymmetric sensitivities of bacterial and fungal denitrifiers may stem from bacteria's higher temperature-sensitivity coefficient for denitrification enzymes like nitrite reductase (nirK/nirS) compared to fungal counterparts (fnirK)[1]. This differential response implies a potential shift in microbial community dominance under future climate scenarios, where bacterial pathways could disproportionately contribute to N2O fluxes, exacerbating greenhouse gas emissions in bacterial denitrification-dominant soil conditions.
The significant positive correlation between RR-N2O and RR-BD suggests that the response of potential denitrification rate to warming is predominantly controlled by bacterial denitrification (Fig. 5). Regression models further confirmed that RR-N2O rises linearly with RR-BD (r2 = 0.47, p < 0.001), but not RR-FD, emphasizing bacterial dominance in warming responses. The structural equation model (SEM) further elucidates these dynamics, with a robust fit (CFI = 0.999, RMSEA = 0.008, SRMR = 0.071) revealing positive direct effects of RR-BD (path coefficient = 0.45, p < 0.001) and RR-FD (0.33, p < 0.001) on RR-N2O, but also highlighting trade-offs between bacterial and fungal denitrification (path coefficient = −0.69, p < 0.001). This trade-off may arise from differences in resource allocation, where bacteria invest in rapid, specialized denitrification pathways for higher energy yield under fluctuating conditions, while fungi prioritize metabolic flexibility, leading to niche partitioning in complex soils[58,59]. Additionally, regression analysis revealed a significant negative effect of RR-BD on RR-FD (r2 = 0.566, p < 0.001) (Fig. 6c), indicating a competitive interaction where enhanced bacterial activity under warming may suppress fungal denitrification. This competitive suppression likely stems from resource competition, as bacteria exploit labile carbon and nitrogen substrates more efficiently at elevated temperatures, reducing availability to fungi[15]. These findings imply that warming could amplify N2O emissions more profoundly in subtropical and tropical soils, where bacterial denitrifiers thrive, posing risks to N budgets in rice-paddy-dominated regions. Globally, rice paddies are predominantly located in subtropical and tropical regions, such as South and Southeast Asia, where warm, humid conditions support year-round rice cultivation and continuous denitrification cycles. An indirect negative effect of RR-nirK on RR-N2O via RR-BD (−0.242, p < 0.05) was also found, indicating that warming may suppress nirK-type denitrifiers, potentially reducing N2O production efficiency despite overall rate increases[60,61].
In paddy soils under elevated temperatures, the inter-relationships between bacterial and fungal communities can significantly influence denitrification processes through complex co-occurrence networks that modulate N2O production and consumption pathways[62]. It has been found that fungal denitrifiers dominate N2O emissions in flooded paddy soils with lower organic carbon content, contributing 58%–77% to net emissions, while bacterial denitrifiers account for only 6%–15%, indicating competitive dynamics under anoxic conditions[63]. These interactions are further evidenced by positive and negative associations in microbial networks, with higher connectivity among nirS-, nirK-, and fungal nirK-containing taxa potentially enhancing overall denitrification efficiency and affecting N2O flux in response to soil properties such as pH and organic matter[64]. Warming exacerbates these bacterial-fungal dynamics by shifting denitrifier community structures, particularly sensitizing nirS-type bacterial denitrifiers, which may indirectly amplify fungal contributions to N2O emissions in paddy systems[61]. Overall, these microbial interactions explain a substantial portion of the variance in N2O emissions and their temperature sensitivity in rice paddy fields. While our short-term incubation experiment provides insights into immediate microbial responses to warming, it does not fully replicate the gradual temperature increases projected under climate change scenarios, which may allow microbial community acclimation and shift over longer periods. Future studies should employ gradual, long-term field warming to better mimic natural climate change, which may promote greater functional coordination or compensation between bacterial and fungal denitrifiers.
-
Our findings demonstrate that a +4 °C warming treatment significantly enhances denitrification-derived N2O emissions in paddy soils, primarily through stimulated bacterial denitrification (mean RR of 0.19), while fungal pathways exhibit minimal sensitivity (mean RR of –0.06). Regression and SEM analyses confirm that bacterial dominance drives N2O responses (r2 = 0.47, p < 0.001), alongside a strong competitive trade-off between bacterial and fungal pathways (negative path coefficient: –0.69, p < 0.001). These results highlight that future climate warming may pose a greater risk to the nitrogen budget and greenhouse gas reduction of rice-dominated agricultural ecosystems by enhancing bacterial contributions. However, as a short-term study, our results primarily capture acute physiological responses and may overestimate the warming effects compared to long-term scenarios, in which microbial acclimation, community restructuring, and potential functional compensation or coordination between bacterial and fungal denitrifiers could moderate N2O fluxes. Future long-term field warming experiments with gradual temperature trajectories are essential to validate these short-term insights and better predict ecosystem feedback.
The authors thank Chaobiao Meng, Zhejiang University, for his assistance with the incubation experiment.
-
It accompanies this paper at: https://doi.org/10.48130/nc-0026-0004.
-
Not applicable.
-
The authors confirm their contributions to the paper as follows: Lixin Jia: study conception and design, draft manuscript preparation, data analysis, visualization; Yong Li: original research plan, all site and soil experiments; Roland Bol: review and editing; Di Wu: study conception and design, review and editing. All authors reviewed the results and approved the final version of the manuscript.
-
All data generated or analyzed during this study are included in this published article.
-
This work was supported by the Shandong Provincial Natural Science Foundation (Grant No. ZR2024YQ039), National Natural Science Foundation of China (Grant No. 42377291), LiaoNing Revitalization Talents Program (Grant No. XLYC2403096), and Natural Science Foundation of Zhejiang Province (Grant No. LR23D010002).
-
The authors declare no conflict of interest.
-
Full list of author information is available at the end of the article.
- The supplementary files can be downloaded from here.
- Copyright: © 2026 by the author(s). Published by Maximum Academic Press, Fayetteville, GA. This article is an open access article distributed under Creative Commons Attribution License (CC BY 4.0), visit https://creativecommons.org/licenses/by/4.0/.
-
About this article
Cite this article
Jia L, Li Y, Bol R, Wu D. 2026. Bacterial rather than fungal denitrification as a key driver for increased denitrification rate under warming in paddy soil. Nitrogen Cycling 2: e017 doi: 10.48130/nc-0026-0004 

Bacterial rather than fungal denitrification as a key driver for increased denitrification rate under warming in paddy soil
- Received: 12 November 2025
- Revised: 22 January 2026
- Accepted: 13 March 2026
- Published online: 31 March 2026
Abstract: Biological denitrification, carried out by both bacteria and fungi, is a major pathway contributing to nitrous oxide (N2O) emissions in paddy soil due to active denitrification under fluctuating redox conditions. However, warming-induced shifts in fungal and bacterial contributions to denitrification-derived N2O emissions in paddy soil remain unclear. Using eighteen paddy soils distributed along a latitudinal gradient in China (19°53′ N−45°31′ N), this study examined the response of potential denitrification-derived N2O emissions to experimental warming (+4 °C). Using the N2O site preference approach, we further distinguished the differential responses of bacterial and fungal denitrification to warming. Results showed that the temperature response ratios of denitrification potential varied among sites from 0.04 to 0.21, with the response being closely associated with bacterial denitrification. Under 4 °C warming, the relative contribution of bacterial denitrification increased from 53% to 59%, whereas that of fungal denitrification decreased from 47% to 41%. Bacterial denitrification rate was positively linked to nirS, whereas fungal denitrification rate was tightly coupled to FnirK, nosZII, and nirS abundance. Structural equation modeling revealed soil nutrient dynamics and functional gene expression. These insights lead us to a more nuanced understanding of microbial-driven N2O emissions in paddy soils under warming, emphasizing the need for region-specific, microbe-targeted strategies to predict and mitigate N2O emissions in the context of global warming.