


-
Pitaya (Hylocereus or Selenicereus) is a perennial climbing plant belonging to the family Cactaceae, native to Central America[1]. It was subsequently introduced into China via Southeast Asian countries such as Vietnam and Thailand. Owing to its richness in minerals, vitamins, proteins, dietary fiber, and betacyanins, among other nutrients[2,3], as well as its distinctive appearance and mildly sweet flavor, pitaya has gained increasing popularity among consumers. It has now become one of the most important subtropical fruit crops[4]. At present, China is the world's largest producer of pitaya[5], with major cultivation areas including Guangxi, Fujian, Guizhou, Hainan and Taiwan.
According to differences in peel and pulp color, cultivated pitaya varieties are mainly classified into three major types: red peel with red pulp, red peel with white pulp, and yellow peel with white pulp[6]. In addition, other types such as green peel with white pulp, green peel with red pulp, bicolored, and pink varieties also exist, but have not yet been widely commercialized. These diverse varietal types provide important germplasm resources for the breeding of new pitaya cultivars; however, the mechanisms underlying the formation of peel color differences among different varieties remain to be systematically elucidated.
Plant pigments are the key determinants of coloration in plant tissues, and the diversity of plant colors mainly depends on the types and relative proportions of these pigments[7,8]. Pigment accumulation is usually influenced by differential expression of key structural genes and regulatory factors involved in their biosynthetic and degradation pathways[9,10]. In general, variations in the biosynthesis, degradation, and relative proportions of pigments such as chlorophylls, betalains, carotenoids, and flavonoids directly lead to differences in fruit color.
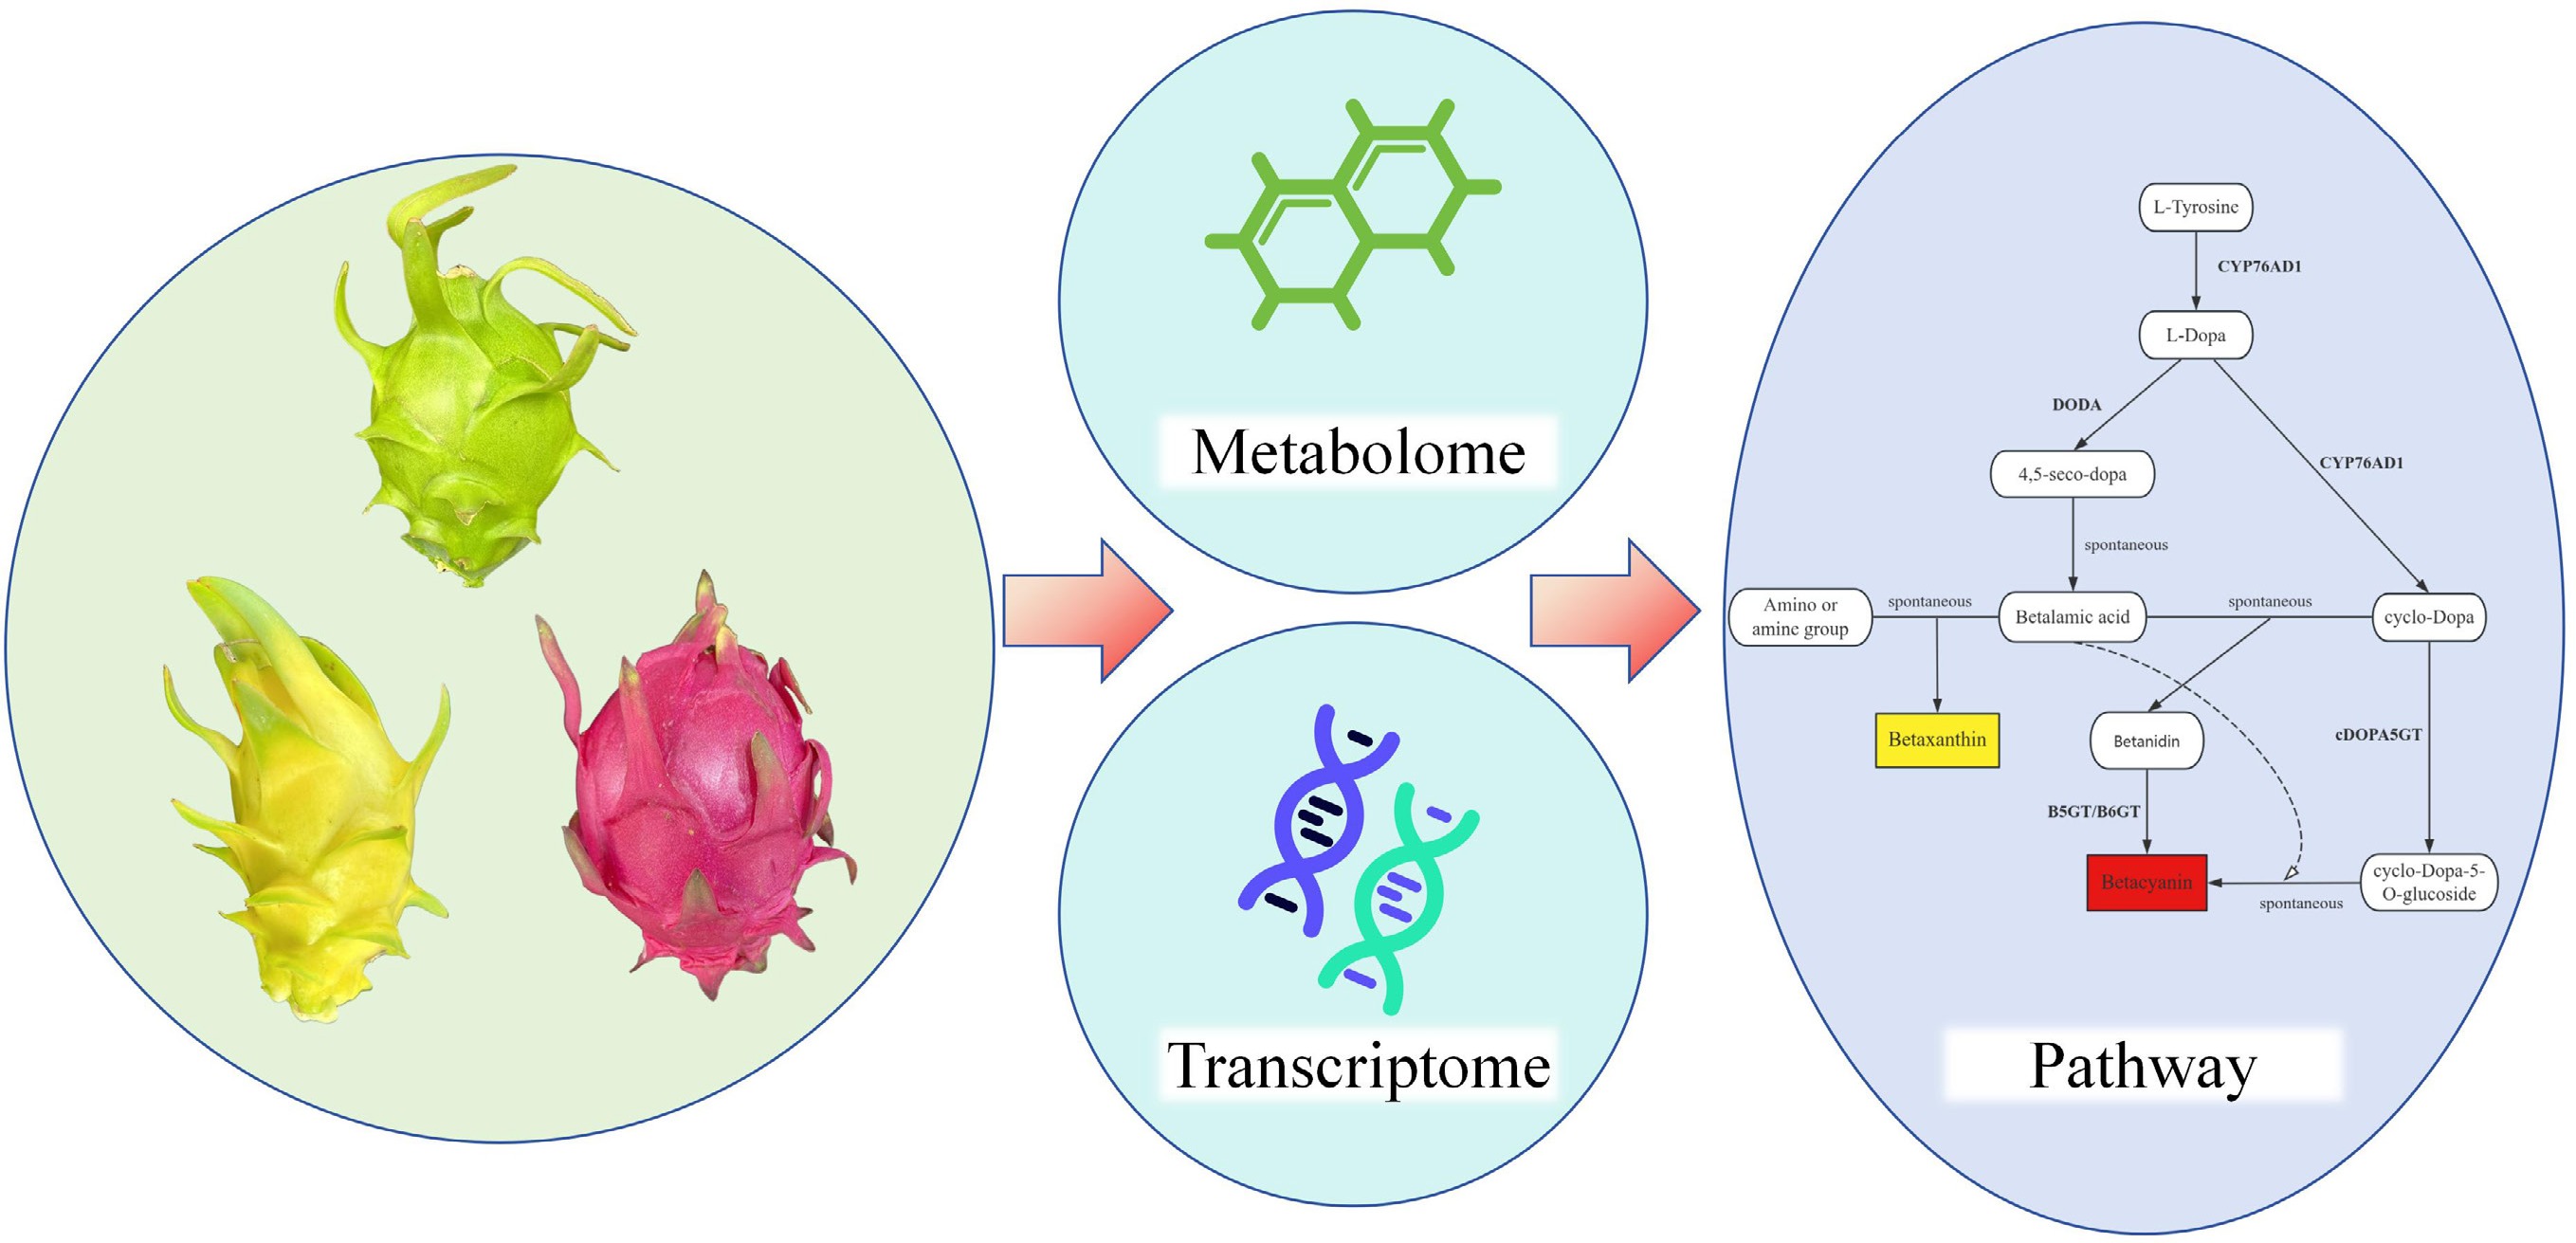
Betalains are a class of water-soluble, nitrogen-containing natural pigments, including betacyanins and betaxanthins[11]. They are mainly found in plants of the order Caryophyllales, and have also been detected in some higher fungi, typically accumulating in organs such as flowers and fruits[12]. Previous studies have shown that betalains and anthocyanins exhibit a mutually exclusive distribution in plants, and to date, no natural plant species has been found to contain both pigment types simultaneously[13]. The biosynthesis of betalains is primarily regulated by key structural genes in their metabolic pathway, which encode enzymes such as cytochrome P450s (CYP450)[14], 4,5-dihydroxyphenylalanine dioxygenase (DODA)[15], and glucosyltransferases (GTs)[16,17]. In addition, transcription factors including MYB[18], WRKY[19], and bHLH[20] have also been demonstrated to participate in the regulation of betalain biosynthesis.
In addition to its central role in photosynthesis, chlorophyll synthesis and degradation are also important factors influencing fruit color. Chlorophyll metabolism is a complex process involving multiple enzymes, encompassing a series of consecutive enzymatic reactions from biosynthesis to degradation[21]. Alterations in key steps may lead to changes in chlorophyll content or composition, thereby affecting fruit coloration. Besides environmental factors such as light, temperature, and nutrient conditions, the regulation of structural genes in the chlorophyll metabolic pathway is likewise critical. These genes encode key enzymes, including glutamyl-tRNA reductase (HEMA), magnesium chelatase (MGCH), and chlorophyll synthase (CHLG), among others[22]. Numerous chlorophyll-deficient or chlorotic mutants have been shown to be closely associated with functional abnormalities of these genes.
Carotenoids are a class of natural pigment widely distributed in plants. They not only impart yellow, orange, and red coloration to plant tissues, but also function as light-harvesting and photoprotective pigments, contributing to plant defense against photooxidative damage[23]. Carotenoid biosynthesis is mainly regulated by genes in the carotenoid metabolic pathway, which encode key enzymes such as phytoene synthase (PSY), phytoene desaturase (PDS), lycopene δ-cyclase (LCYE) and lycopene β-cyclase (LCYB)[24,25].
Flavonoid pigments are widely distributed in plants, and different types of flavonoid compounds confer diverse colors to plant tissues. Among them, anthocyanins give rise to red to blue coloration, whereas flavones, flavonols, flavanones, and chalcones generally exhibit various shades of yellow and are collectively referred to as flavonols or anthoxanthins[26,27]. The composition and accumulation of flavonoids are mainly determined by key enzyme genes in the flavonoid biosynthetic pathway, such as chalcone synthase (CHS), chalcone isomerase (CHI), flavanone 3-hydroxylase (F3H), and flavonol synthase (FLS)[28,29].
The peel color of pitaya is an important indicator for evaluating its external quality and commercial value. In recent years, studies on the mechanism of betalain biosynthesis in pitaya have mainly focused on the functional characterization of individual structural genes or transcription factors. For example, CYP76AD1, DODA[30], as well as HpWRKY44[31] and HubHLH159[20], have been demonstrated to be involved in the regulation of betalain biosynthesis. However, such studies generally emphasize single regulatory factors, making it difficult to explain the formation of peel color differences among different cultivars from a holistic perspective. Moreover, most existing studies have concentrated on the fruit pulp, and systematic investigations into the coordinated action of multiple pigment metabolic pathways in the peel remain limited.
Therefore, this study used four pitaya cultivars with distinct peel and pulp colors as research materials. By integrating transcriptomic and metabolomic analyses of peel tissues at three developmental stages—the green fruit stage, color transition stage, and mature stage—we systematically characterized the accumulation patterns of multiple plant pigments in the peel and the expression profiles of genes involved in their associated metabolic pathways. This study aims to elucidate the molecular mechanisms underlying pitaya peel color formation from the perspective of multi-pigment pathway integration, thereby providing a theoretical basis for peel color improvement and molecular breeding.
-
All pitaya materials used in this study were collected from the plantation of Hainan Enhong Agricultural Technology Co., Ltd. in Banqiao Town, Dongfang City, Hainan Province, China (108.65° E, 19.10° N). Peel samples were obtained from four cultivars: 'Jinduyihao' (Hylocereus; red peel/red pulp, RR), 'Yuenanbairou' (Hylocereus; red peel/white pulp, RW), 'Wucihuanglong' (Hylocereus; yellow peel/white pulp, YWa), and 'Yanwoguo' (Selenicereus; yellow peel/white pulp, YWb) (Fig. 1).
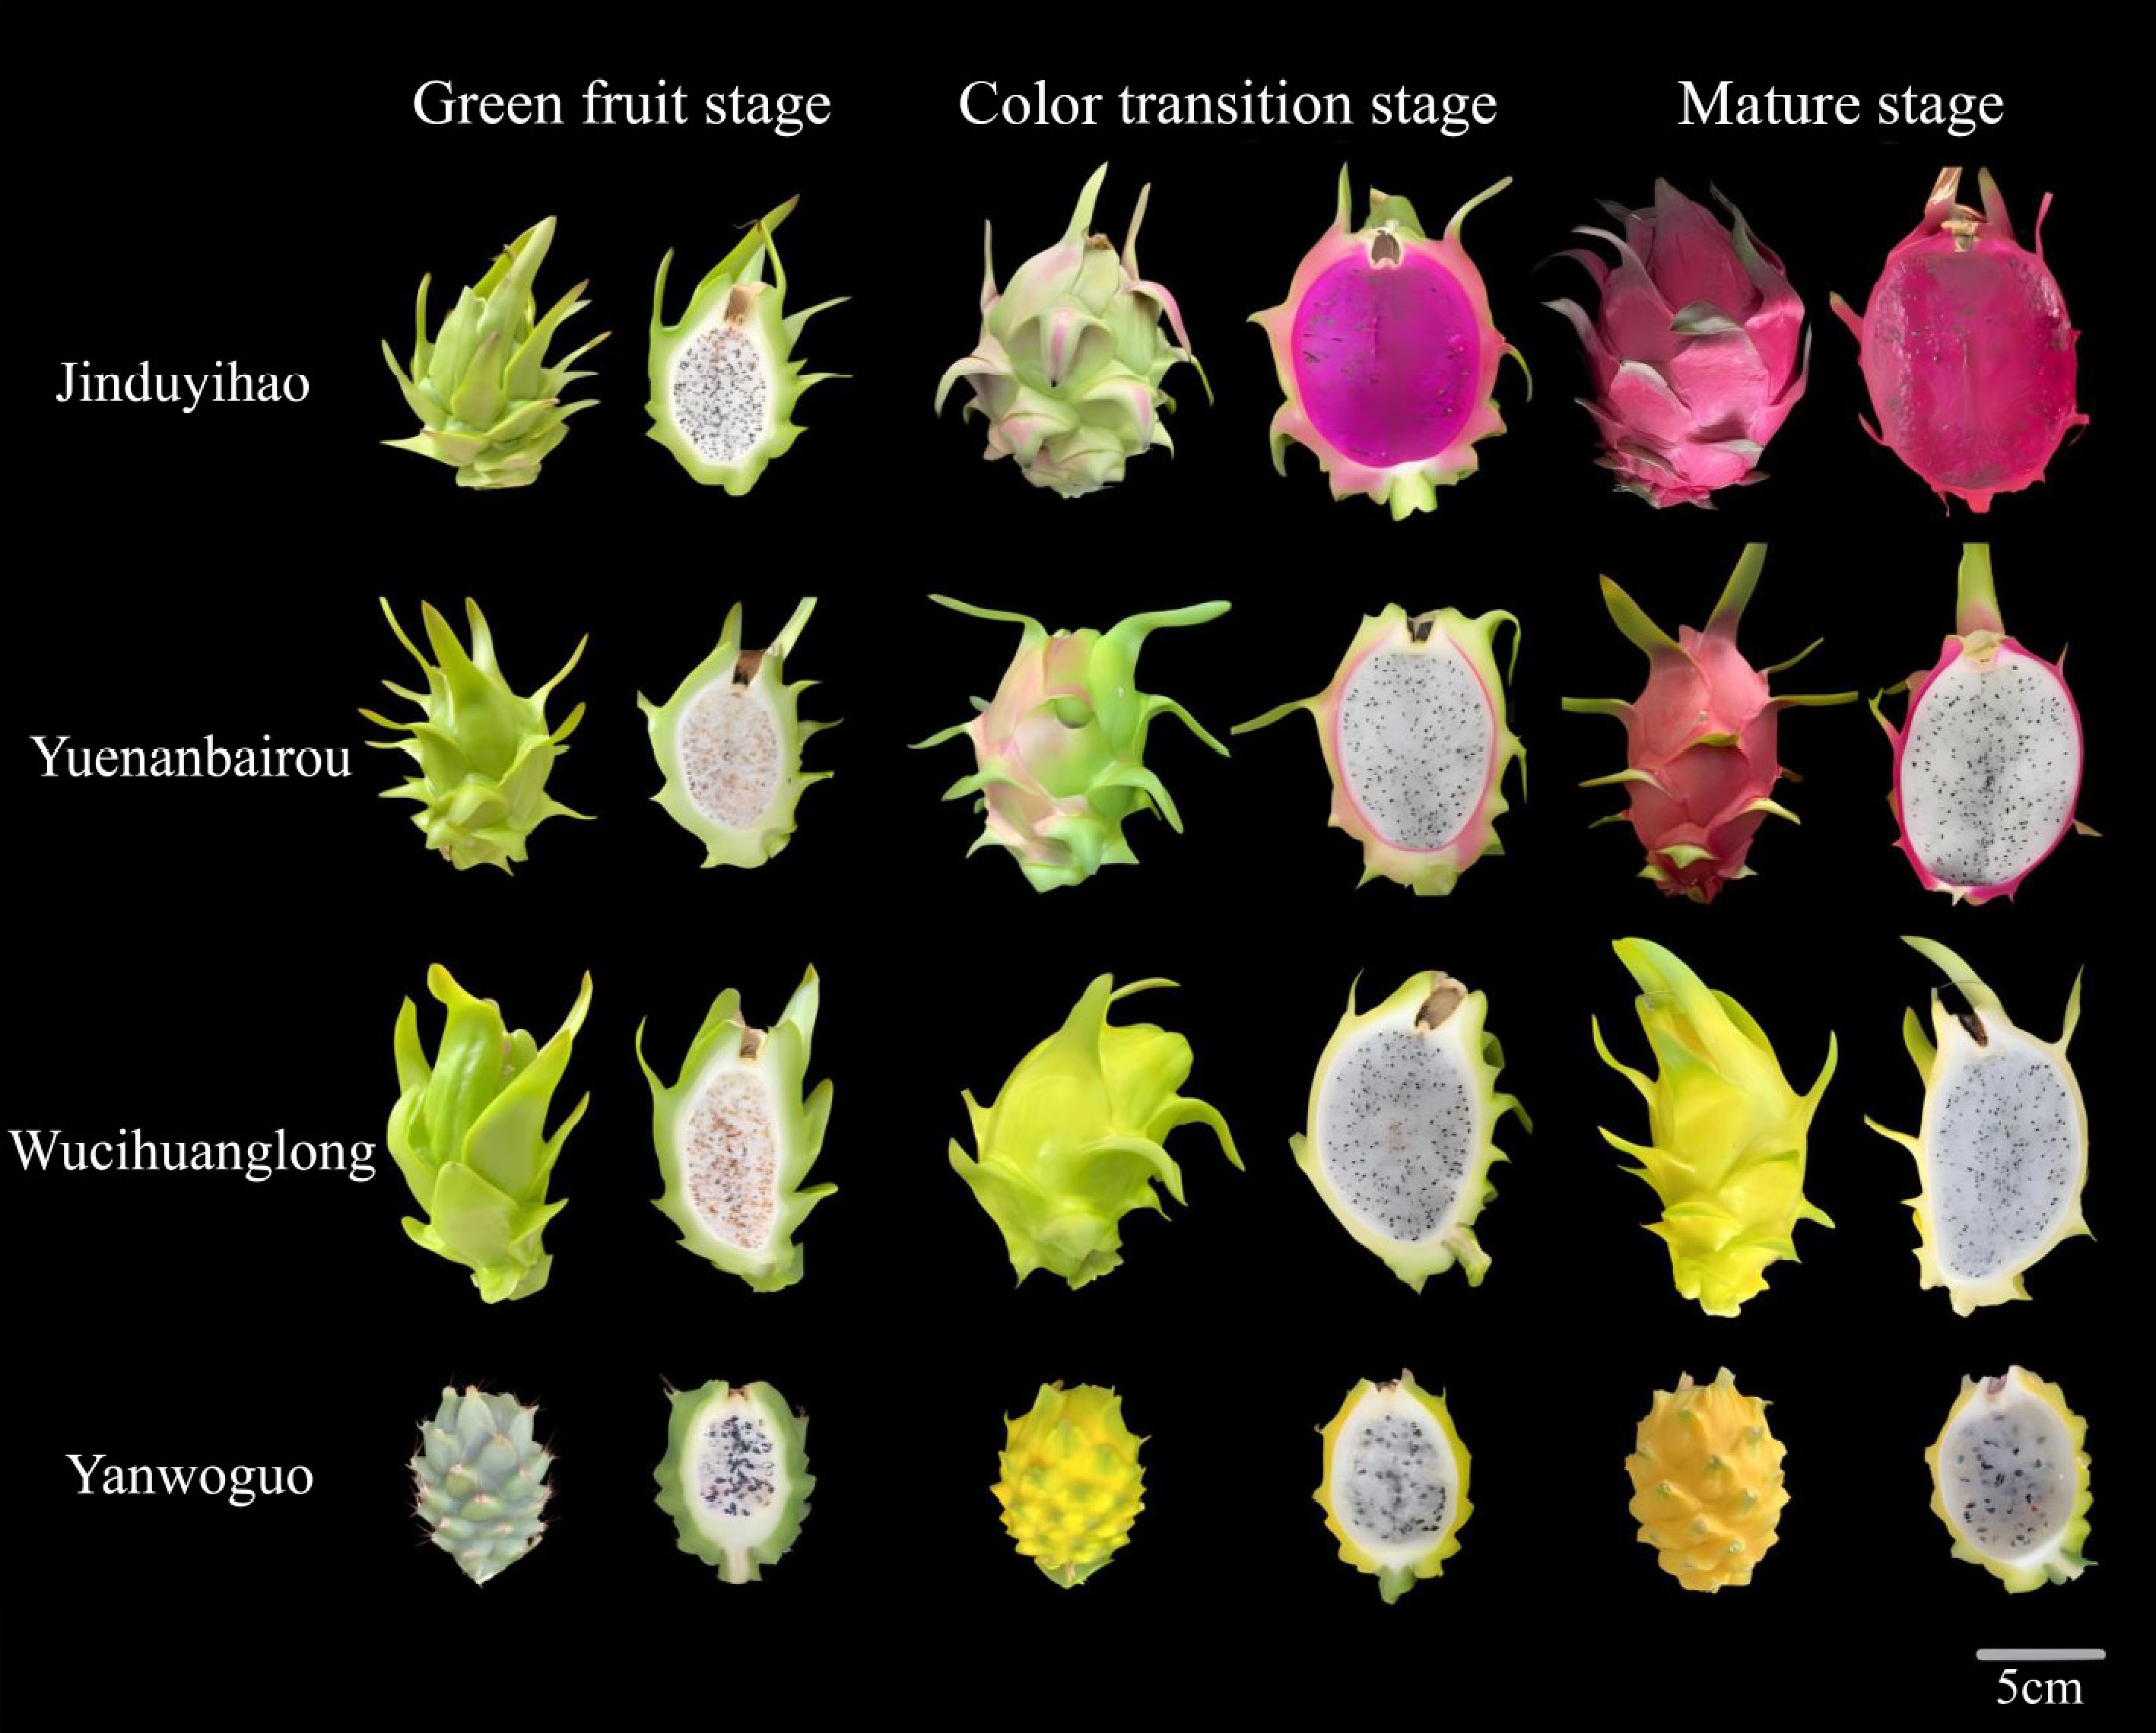
Figure 1.
Three developmental stages of four varieties of pitaya. (For 'Jinduyihao', 'Yuenanbairou', and 'Wucihuanglong', the green fruit stage occurred at 20 DAP, the color transition stage at 25 DAP, and the mature stage at 30 DAP. In contrast, for 'Yanwoguo', the green fruit stage occurred at 90 DAP, the color transition stage at 105 DAP, and the mature stage at 120 DAP).
For each cultivar, three developmental stages were selected based on peel coloration: green fruit stage (S0), color transition stage (S1), and mature stage (S2) (Fig. 1). Samples were named using the format 'peel color–pulp color–developmental stage'.
After harvest, samples were chopped, placed into centrifuge tubes, immediately frozen in liquid nitrogen, and stored at −80 °C for transcriptomic sequencing and metabolomic analysis. Three biological replicates were prepared for each group.
Preparation of samples for metabolomic analysis
-
Fifty milligrams of peel sample were extracted with 1,000 μL of extraction solution containing an internal standard (methanol : acetonitrile : water = 2:2:1; internal standard concentration, 20 mg/L). The mixture was vortexed for 30 s, then supplemented with steel beads and ground at 45 Hz for 10 min. Samples were subsequently sonicated for 10 min in an ice-water bath. After centrifugation, the supernatant was vacuum-dried and stored for further analysis.
Non-targeted metabolome sequencing and analysis
-
Untargeted metabolomic analysis was performed at Beijing Biomarker Biotechnology Co., Ltd (Beijing, China). Metabolomic samples were reconstituted in an appropriate volume of extraction solvent and analyzed using a Waters Acquity I-Class PLUS UPLC system coupled with a Waters Xevo G2-XS QTOF high-resolution mass spectrometer (HRMS) (Waters Corporation, Milford, USA). Data processing, including peak extraction and alignment, was conducted using Progenesis QI software (Waters Corporation, Milford, USA).
After normalization of peak areas to the total ion intensity, downstream analyses were carried out. Principal component analysis (PCA) and Spearman correlation analysis were applied to assess reproducibility among biological replicates and quality control samples. Identified compounds were annotated using the KEGG[32], HMDB[33], and LIPID MAPS[34] databases for classification and pathway analysis. Fold changes (FC) between groups were calculated, and Student's t-test was used to evaluate statistical significance (p-values). OPLS-DA models were constructed with the R package ropls, and 200 permutation tests were performed to validate model reliability. Variable importance in projection (VIP) values were obtained through multiple cross-validation. Differential metabolites were screened by integrating FC, p-value, and VIP value, with thresholds of FC > 1, p-value < 0.05, and VIP > 1. KEGG pathway enrichment analysis was conducted using a hypergeometric distribution test.
Total RNA extraction and cDNA library construction
-
Total RNA was extracted from pitaya peel tissues using a modified CTAB method[35]. Three biological replicates were prepared for each sample. RNA purity and integrity were evaluated by 1% agarose gel electrophoresis using 3 μL of each RNA sample. RNA concentration and purity were further measured with 1 μL of RNA using a microvolume spectrophotometer (NanoPhotometer® N50, Munich, Germany). Only high-quality RNA samples with no detectable contamination were used for subsequent experiments.
After quality assessment, mRNA was enriched from total RNA using Oligo(dT) magnetic beads and then fragmented with Fragmentation Buffer. The fragmented mRNA served as a template for first- and second-strand cDNA synthesis, followed by purification. The purified double-stranded cDNA was subjected to end repair, A-tailing, and adaptor ligation, and fragments of the desired size were selected using AMPure XP beads. Finally, the cDNA library was obtained through PCR enrichment.
Transcriptome sequencing and analysis
-
RNA-Seq was performed by Biomarker Technologies Co., Ltd. (Beijing, China) using the Illumina NovaSeq 6000 platform. Sequencing data was processed with the bioinformatics pipeline provided by BMKCloud (
www.biocloud.net ). Raw reads were filtered to remove adapter sequences and low-quality reads, yielding high-quality clean data, which were then aligned to the reference genome (www.pitayagenomic.com )[36].Gene expression levels were quantified using the Fragments Per Kilobase of transcript per Million mapped reads (FPKM) method[37]. Differentially expressed genes (DEGs) were identified using DESeq2[38], with thresholds of fold change ≥ 2 and FDR < 0.05. Gene functions were annotated based on the COG[39], GO[40], KEGG[41], KOG[42], Pfam[43], Swiss-Prot[44], and NR[45] databases.
Quantitative real-time PCR
-
Ten differentially expressed genes were selected for qRT-PCR to validate the reliability of the transcriptome data. Primers were designed using Primer Premier 5.0, and UBQ was used as the internal reference gene (Table 1). qRT-PCR was performed on an ABI 7500 real-time PCR system using 2× SYBR qPCR Mix (Sparkjade, Shandong, China), following the manufacturer's instructions. Relative gene expression levels were calculated using the 2−ΔΔCᴛ method[46].
Table 1. Primer information of differentiated genes related to skin color of pitaya.
Genetic types Gene ID Forward primer (5'→3') Reverse primer (5'→3') CYP76DA1 NewGene_3232 GGCAACCACCTCACTCAACT CCAAGCAAGATCCTTAAACTCC B6GT HU06G00241 TGGTTGATGCGGACAGGG AAACGGCGACGGTATGAC cDOPA5GT HU05G00159 CTGCCTCATTGGTTTGCG ATGGGCTCATCTGGTTGC CHS HU04G00649 TTTCGCTATCCTTGTCGT CATCTCGTTGGGTGGGTT CHS HU04G00651 CTGAGGTGCCGAGATTGG TTGACAGATGGGCGAAGT CHI HU04G01107 CCACTACACCCGTTCGTT CTGGTCGCAGGTTCTTCT F3H HU06G02461 ACGGTACAAGAGGGCAGAC AGCGGGTAGACTTTAGCATC PSY HU03G00957 TTTGGATAGGTGGGAGGC ACGGCTGAATGTCAATAGGA HEMA HU02G01226 ATCTGTAGGTCCTGAAGTGG ATTGTAAACCCGAGCATT PAO HU02G03416 CCACAATTTCACTCCCTG ATCGGTTGGTCTGGTTAG Reference gene UBQ TGAATCATCCGACACCAT TCCTCTTCTTAGCACCACC Statistical analysis
-
Experimental data were summarized using Microsoft Excel 2010. Statistical significance analysis was performed with SPSS Statistics 27, and differences among groups were evaluated using one-way analysis of variance (ANOVA). Figures and charts were generated using Origin 2021, Microsoft Excel 2010, and Adobe Illustrator.
-
To investigate the potential mechanisms of peel color formation in different varieties of pitaya, high-throughput transcriptome sequencing was used to detect the expression patterns of genes related to metabolic regulation. A total of 36 samples were sequenced using the Illumina NovaSeq 6000 platform, yielding 29.59 Gb of Clean Data was obtained, with the percentage of Q30 bases at or above 87.98%. The Clean Reads of each sample were aligned to the designated reference genome (
www.pitayagenomic.com ) separately, and the mapping efficiency ranged from 93.03% to 98.40%. Based on the alignment results, alternative splicing prediction analysis, gene structure optimization analysis, and new gene discovery was performed, and 5,195 new genes were identified, 1,890 of which were functionally annotated.Reproducibility of experiments and reliability of differentially expressed genes (DEGs) were assessed based on PCA analysis. PCA analysis of the samples in this study showed (Fig. 2a) good reproducibility among samples within each group and significant differences between groups, confirming the reliability of the data for subsequent analysis.
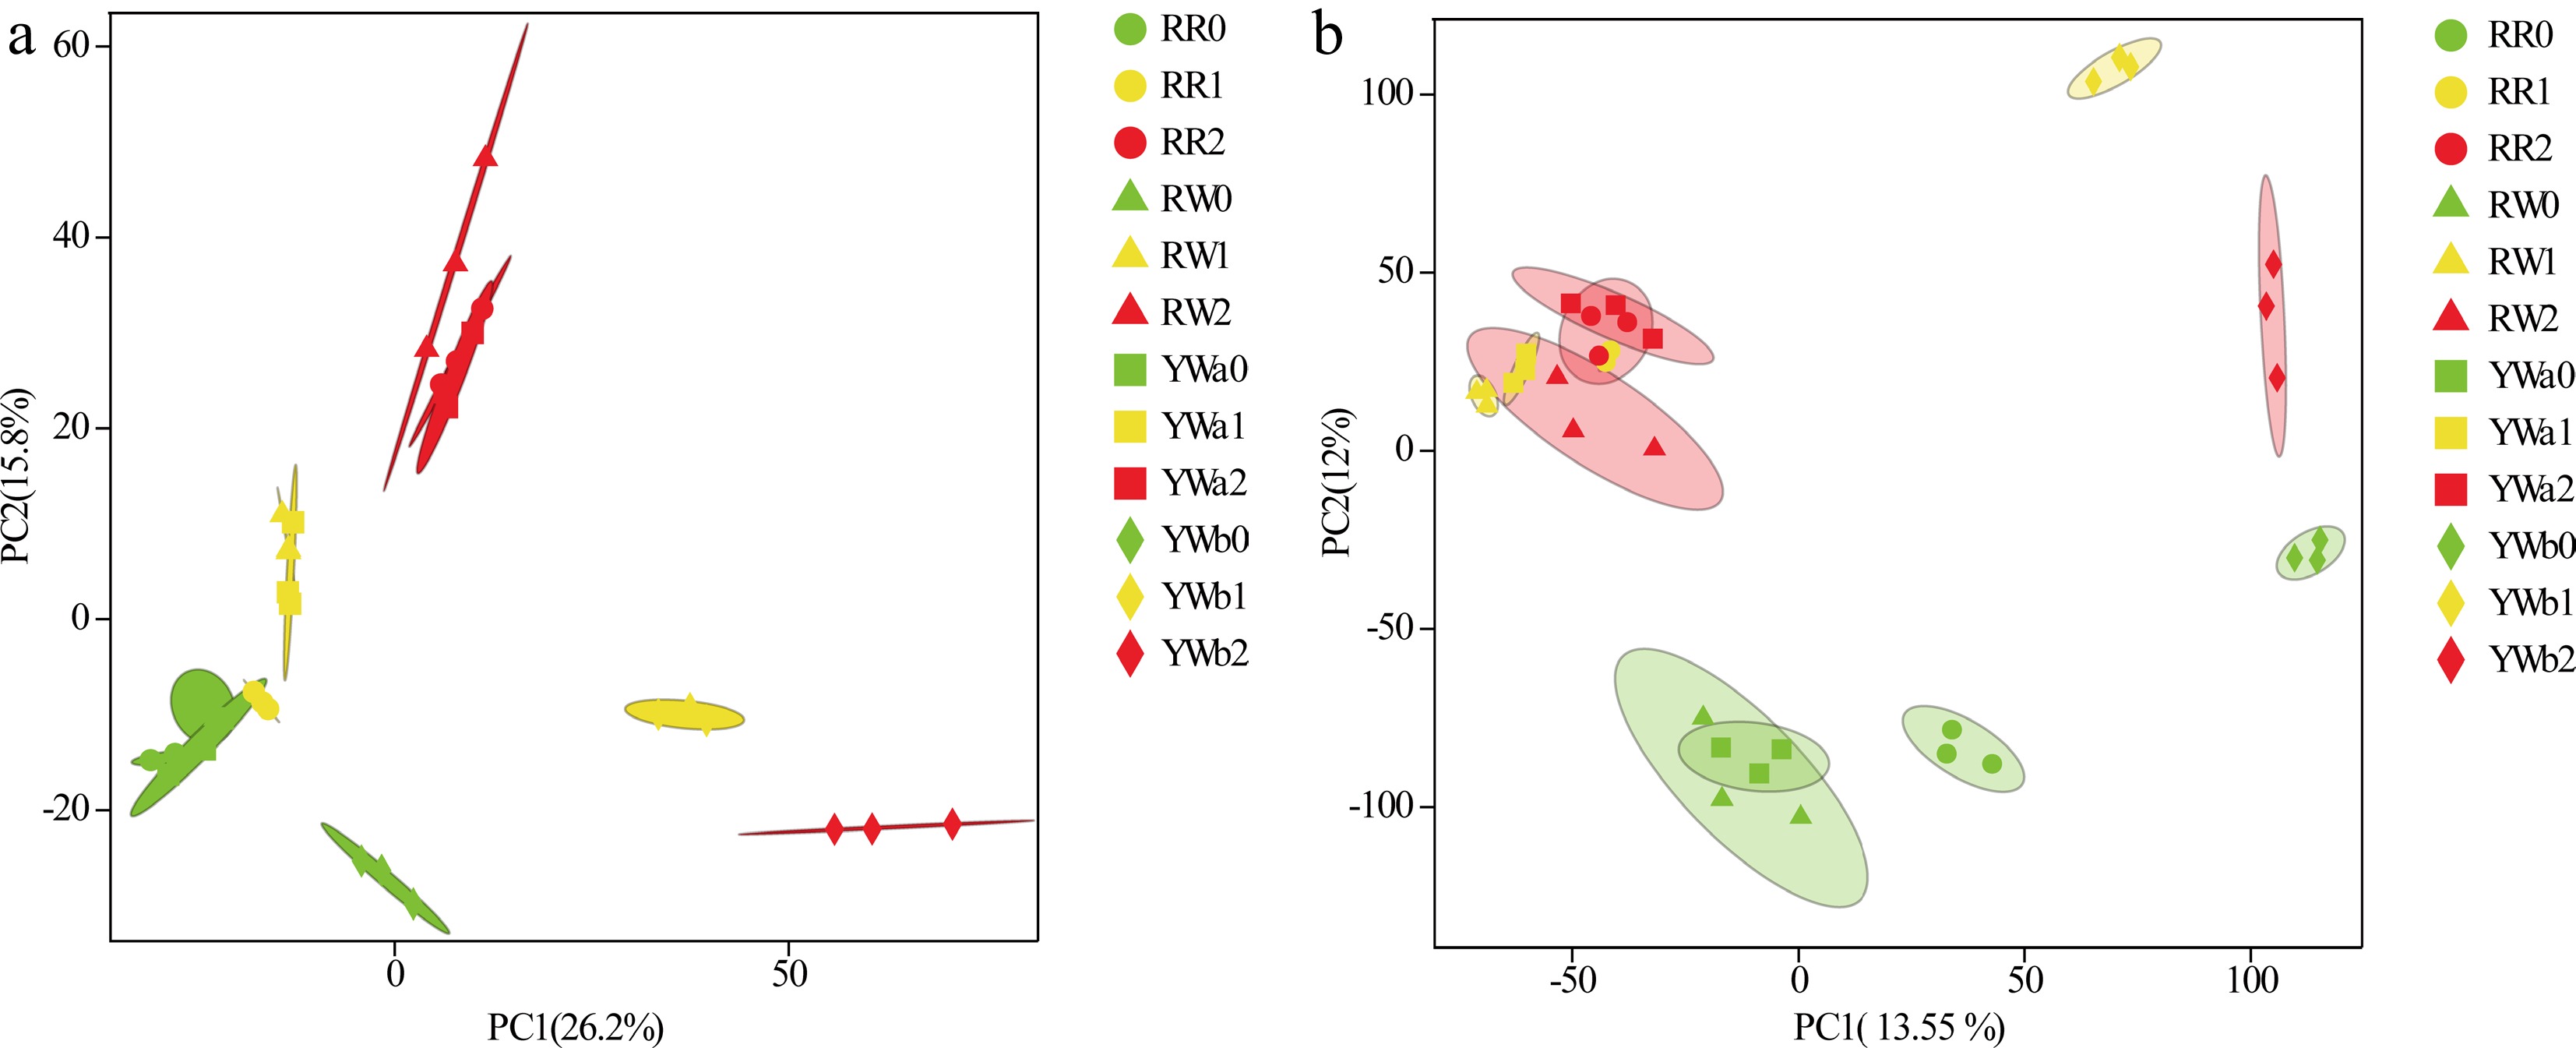
Figure 2.
(a) PCA map of the transcriptome; (b) PCA map of the metabolome.
The criteria for selecting DEGs were Fold Change ≥ 2 and FDR < 0.05, and up or downregulated DEGs were obtained in each of the comparison groups that were set up. To explore the biological functions of the DEGs, they were functionally annotated using the KEGG database, and the KEGG enrichment analysis showed (Fig. 3a) that these DEGs were significantly clustered in various metabolic pathways.
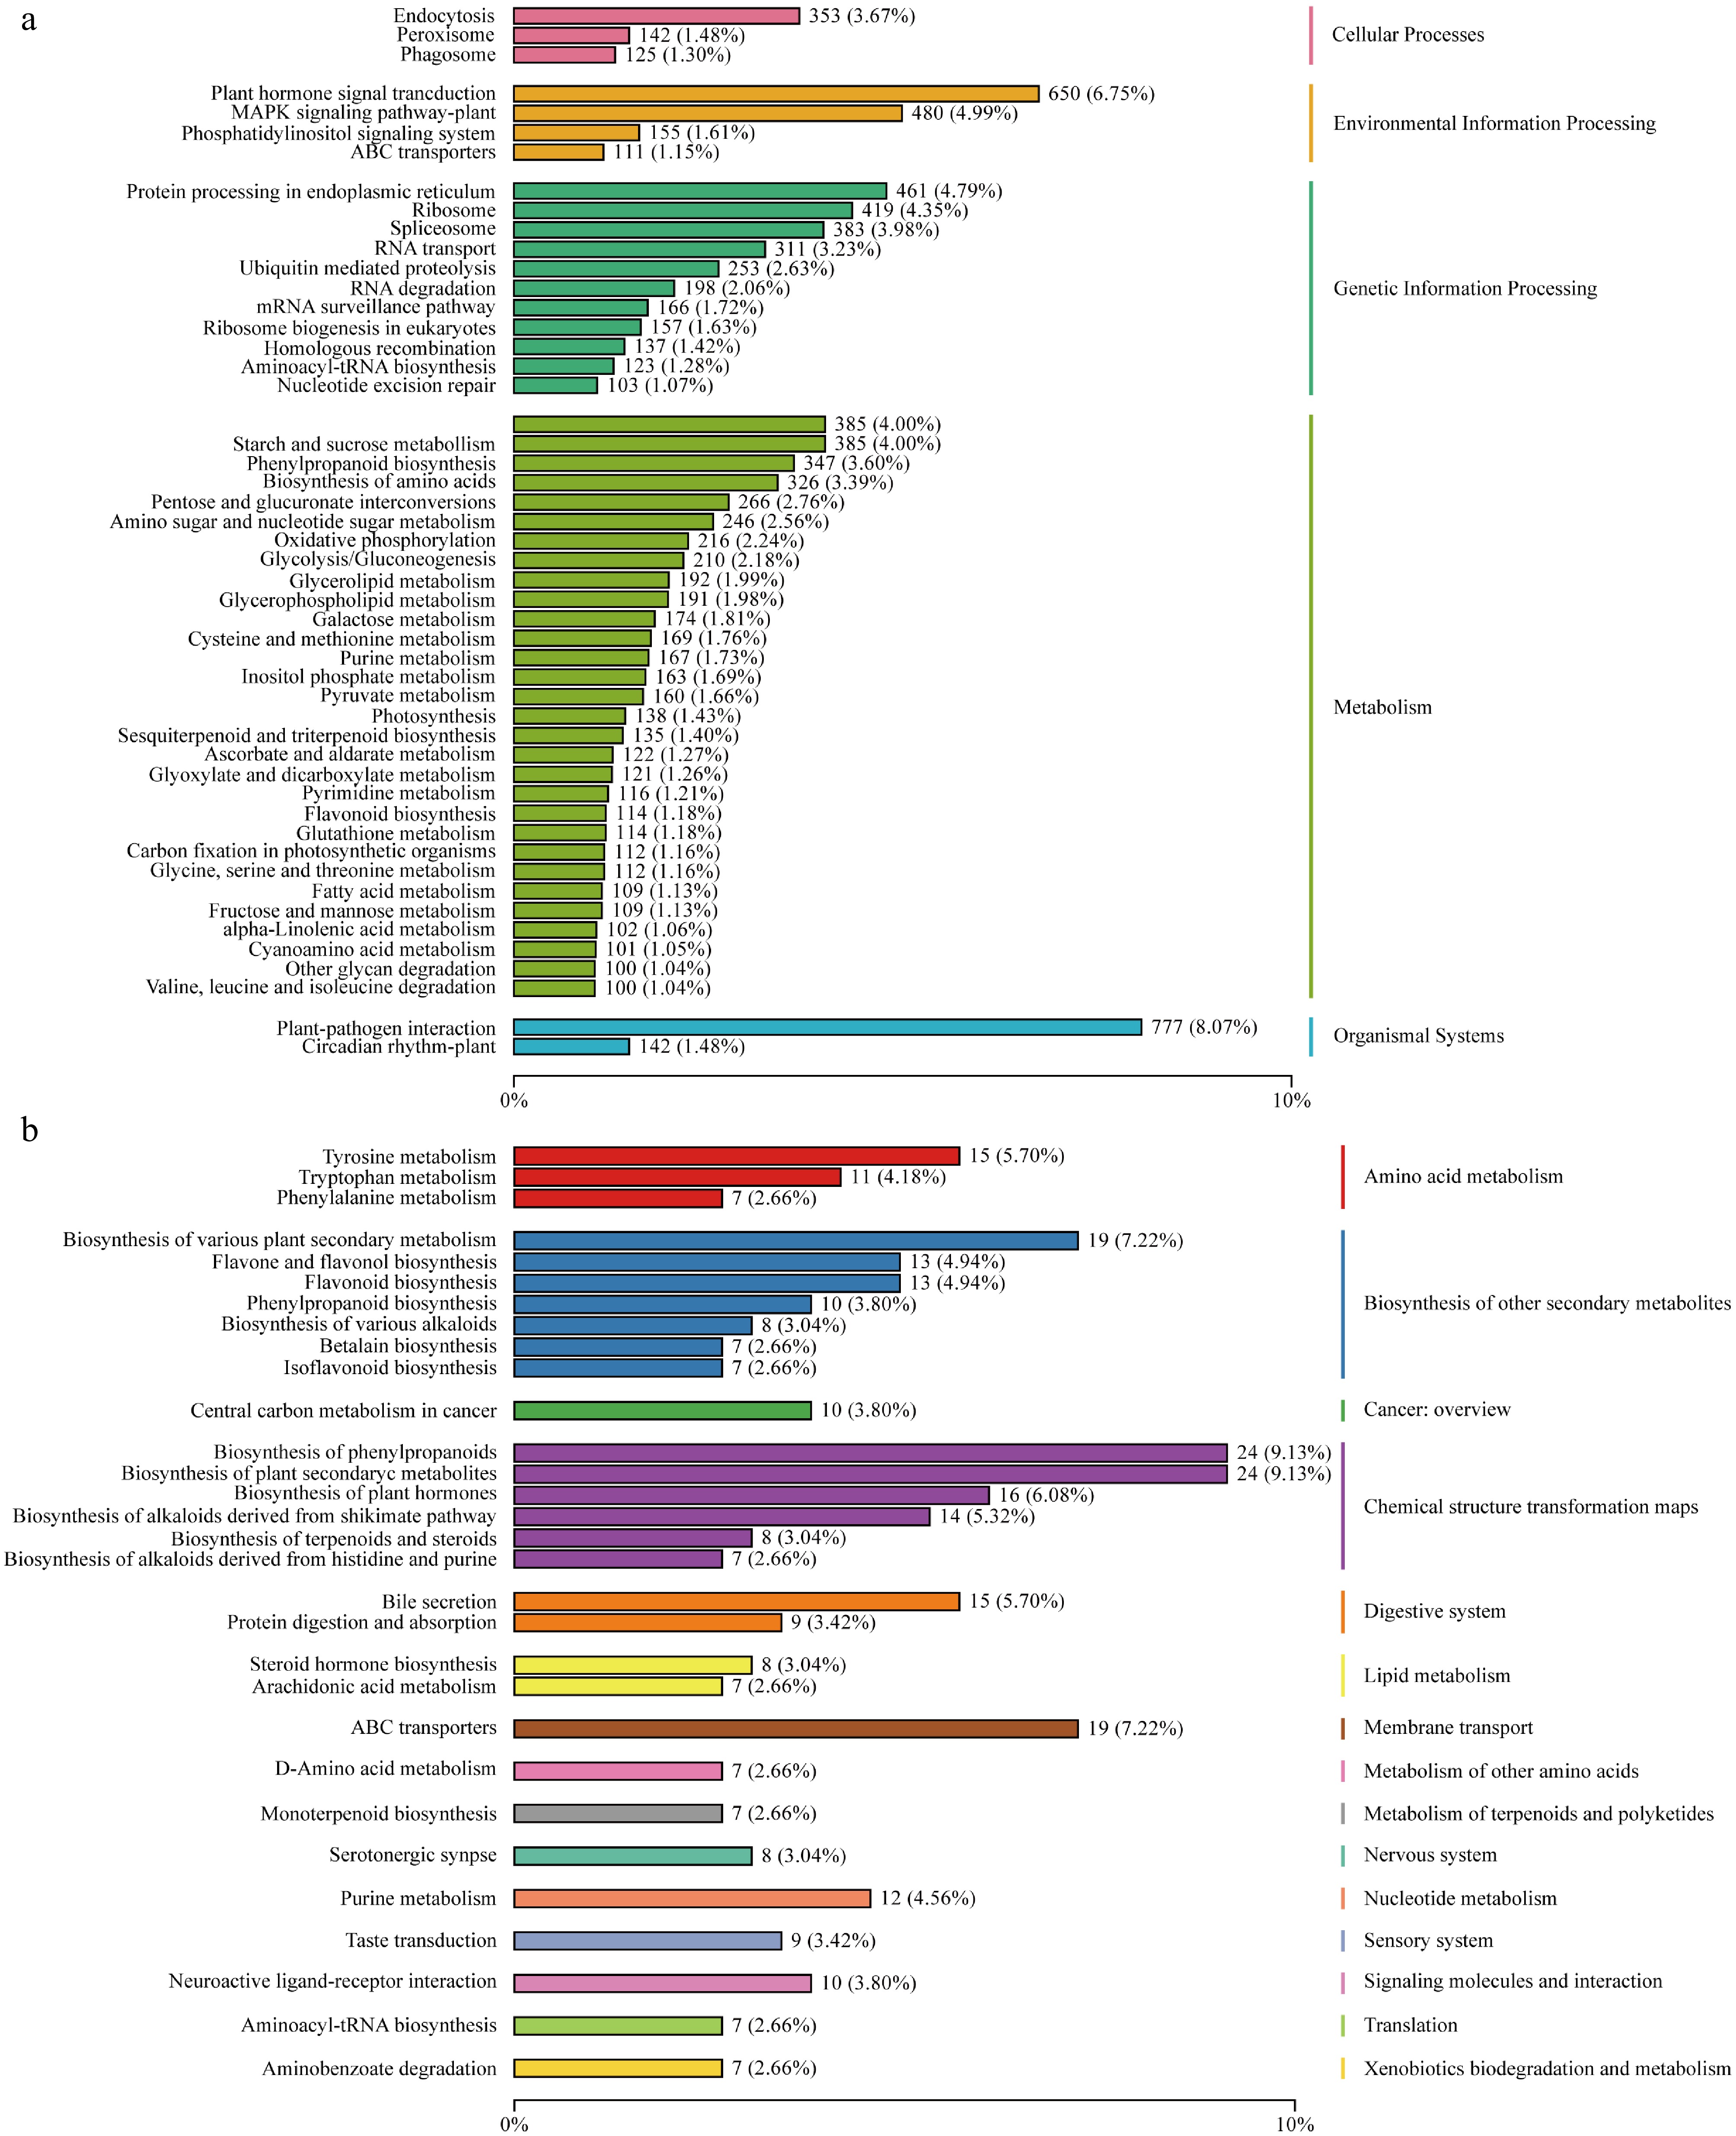
Figure 3.
(a) Transcriptome KEGG enrichment analysis. (b) Metabolome KEGG enrichment analysis.
Metabolome sequencing results
-
In order to investigate the metabolite changes in the peel of different pitaya varieties at different times, 36 samples were analyzed qualitatively and quantitatively using LC-QTOF-based metabolomics, and a total of 2,682 peaks were detected, and 2,670 metabolites were annotated. PCA analysis of the data (Fig. 2b) showed good reproducibility among samples within each group and significant differences between groups, confirming the reliability of the data for subsequent analysis. KEGG enrichment analysis of the annotated metabolites (Fig. 3b) showed that the pitaya peel metabolites were enriched in various metabolic pathways, including the betalain biosynthesis pathway, the flavonoid metabolic pathway, and the plant secondary metabolite pathway.
Analysis of DEGs and differential metabolites associated with the betalain synthesis pathway in pitaya peel
-
We screened and analyzed the key genes and metabolites involved in the betalain biosynthesis pathway based on transcriptomic and metabolomic data. Transcriptome analysis (Fig. 4a) showed that the genes in the betalain biosynthesis pathway were differentially expressed among peel samples from four pitaya varieties at three developmental stages. Based on functional annotation of the transcriptome data, a total of 13 key genes involved in betalain biosynthesis were identified, including five CYP76AD1 genes, one DODA gene, two cDOPA5GT genes, two B5GT genes, and three B6GT genes. The expression of CYP76AD1 genes was upregulated during the color-turning and ripening stages in the peels of RR, RW, and YWa, whereas their expression remained low in YWb across all three stages, with no significant differences between stages. The DODA gene showed upregulated expression during the color-turning and ripening stages in the peels of RR, RW, and YWa, with higher expression in RR and RW than in YWa, while expression in YWb remained low and showed no significant stage-specific differences. The cDOPA5GT genes were also upregulated during the color-turning and ripening stages in the peels of RR, RW, and YWa, whereas their expression in YWb was lower than in other varieties and showed no significant differences among stages. Similarly, the expression of B5GT genes increased during the color-turning and ripening stages in RR, RW, and YWa, but remained low and unchanged across stages in YWb. For the B6GT genes, expression in RW was significantly higher than in the other varieties during the color-turning and ripening stages, whereas expression in YWb was downregulated during the color-turning stage.
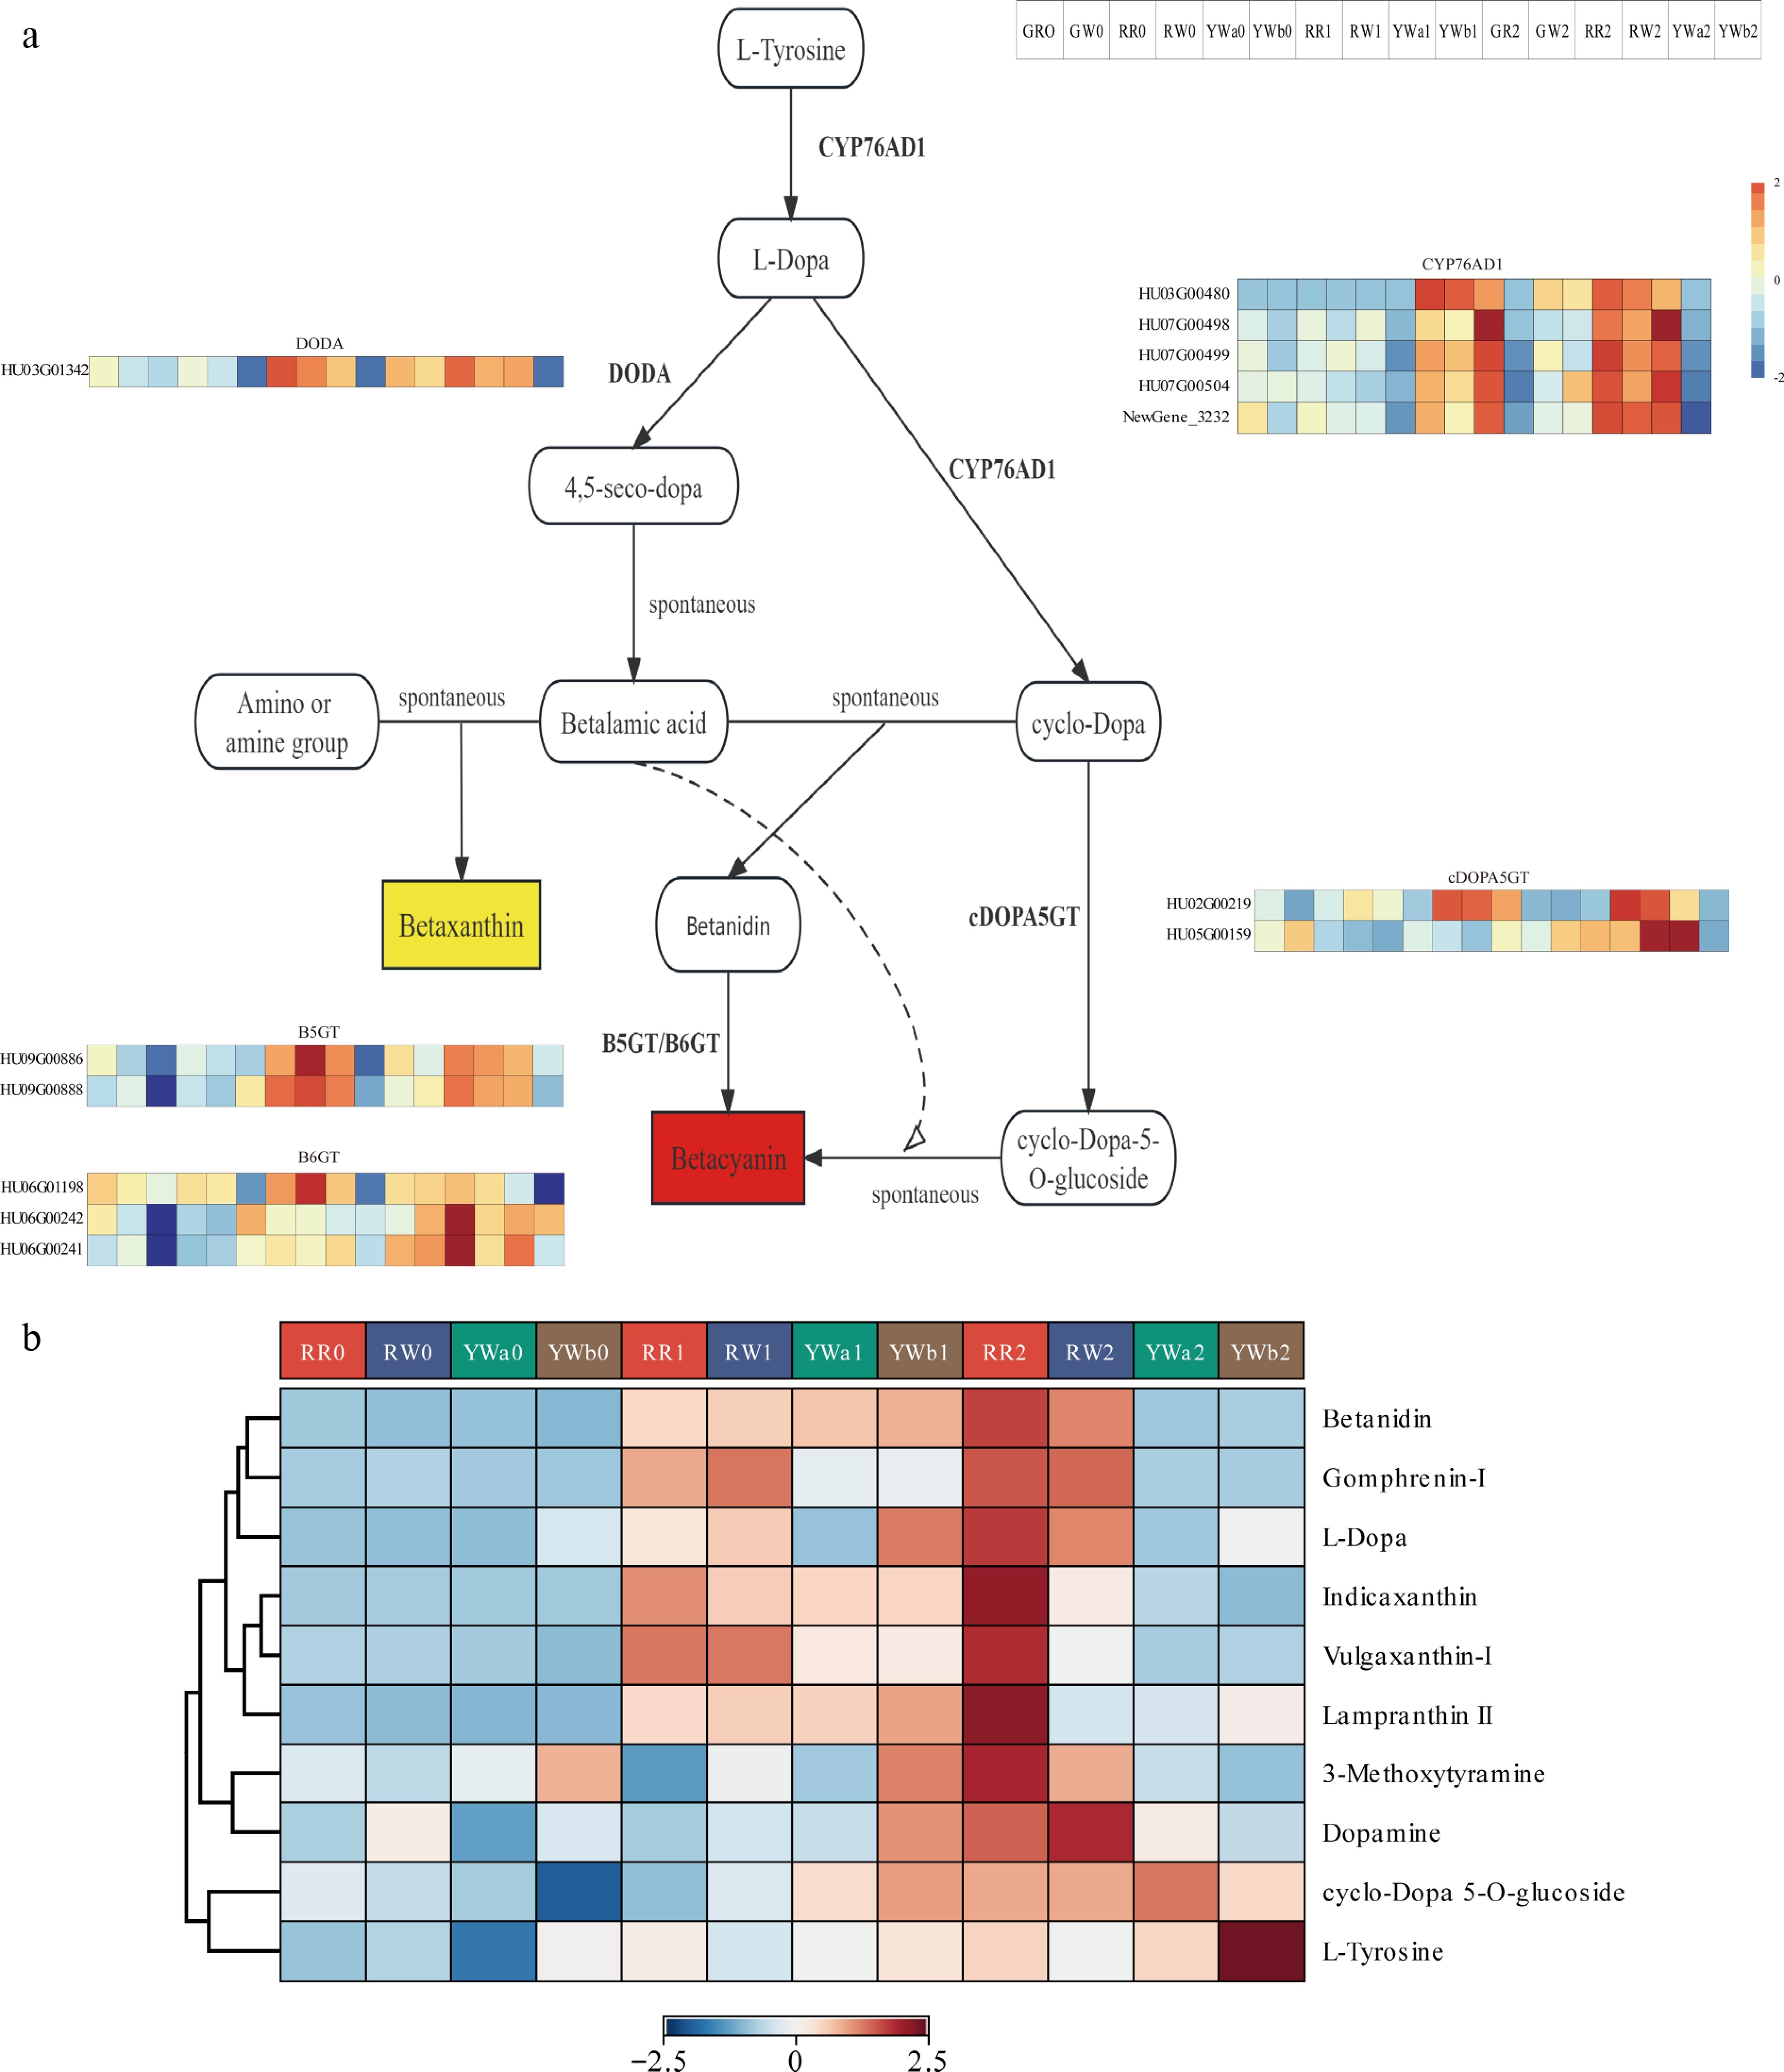
Figure 4.
DAMs and DEGs in the betalain metabolic pathway of pitaya peel. (a) Expression analysis of betalain synthesis pathway genes in four pitaya varieties at three periods of time. (b) Heat map of metabolite content clustering of betalain synthesis pathway.
Metabolomic analysis identified a total of 10 metabolites in the betalain pathway in pitaya peel (Fig. 4b). Among them, three betacyanin metabolites—Betanidin, Gomphrenin-I, and Lampranthin II—and two betaxanthin metabolites—Indicaxanthin and Vulgaxanthin I—were detected. The contents of the three betacyanins increased with fruit maturity in the peel of RR and were significantly higher than those in the other varieties. In RW peel, Betanidin and Gomphrenin-I increased at S1 and S2, whereas Lampranthin II increased in RW1 but decreased in RW2. In YWa and YWb peel, the contents of the three betacyanins increased at S1 but decreased at S2, and their overall levels were lower than those in red-skinned pitaya varieties. The two betaxanthins increased at S1 in the peel of both red- and yellow-skinned pitaya varieties; their levels were higher in RR2 than in RR1, but decreased at S2 compared with S1 in RW, YWa, and YWb peel. In addition, the betalain precursor L-tyrosine was found to increase with fruit maturity in the peel of yellow-skinned pitaya varieties, with the highest level observed in YWb2.
Analysis of DEGs and differential metabolites of flavonoid synthesis pathway in pitaya peel
-
We screened and analyzed the key genes and metabolites involved in the flavonoid biosynthesis pathway based on transcriptomic and metabolomic data. Transcriptome results showed that genes in the flavonoid biosynthesis pathway were differentially expressed among four pitaya varieties across three developmental stages. Based on functional annotation, 28 differentially expressed genes (DEGs) associated with the flavonoid pathway were identified from the transcriptome data (Fig. 5a), including one CYP73A gene, eight CHS genes, four CHI genes, six FLS genes, one CYP75B1 gene, three F3H genes, two DFR genes, one ANS gene, and two ANR genes. The CHS genes were upregulated in YWb1, YWb1, and YWa2, whereas their expression levels were low in peel samples of the red-skinned pitaya varieties across all three stages, with no significant differences among stages. The CHI genes were upregulated in YWb1 and YWb1 and were significantly higher than those in the other varieties. Five FLS genes (NewGene_4692, NewGene_4832, NewGene_4833, NewGene_4834, and NewGene_4691) showed a downregulated-then-upregulated trend during fruit maturation in YWb peel, with the highest expression observed at YWb2. The CYP75B1 gene was upregulated in YWb2. The F3H genes were upregulated in YWb1, and their expression levels at S2 in yellow-skinned pitaya peel were higher than those in red-skinned varieties. The two selected DFR genes exhibited distinct expression patterns: HU08G00012 showed low expression in GW and YWb, whereas HU11G01316 was highly expressed in YWb and was significantly upregulated in YWb2. The ANS gene was upregulated in RW1 and YWb2. The ANR genes were expressed at significantly lower levels in YWb than in the other varieties.
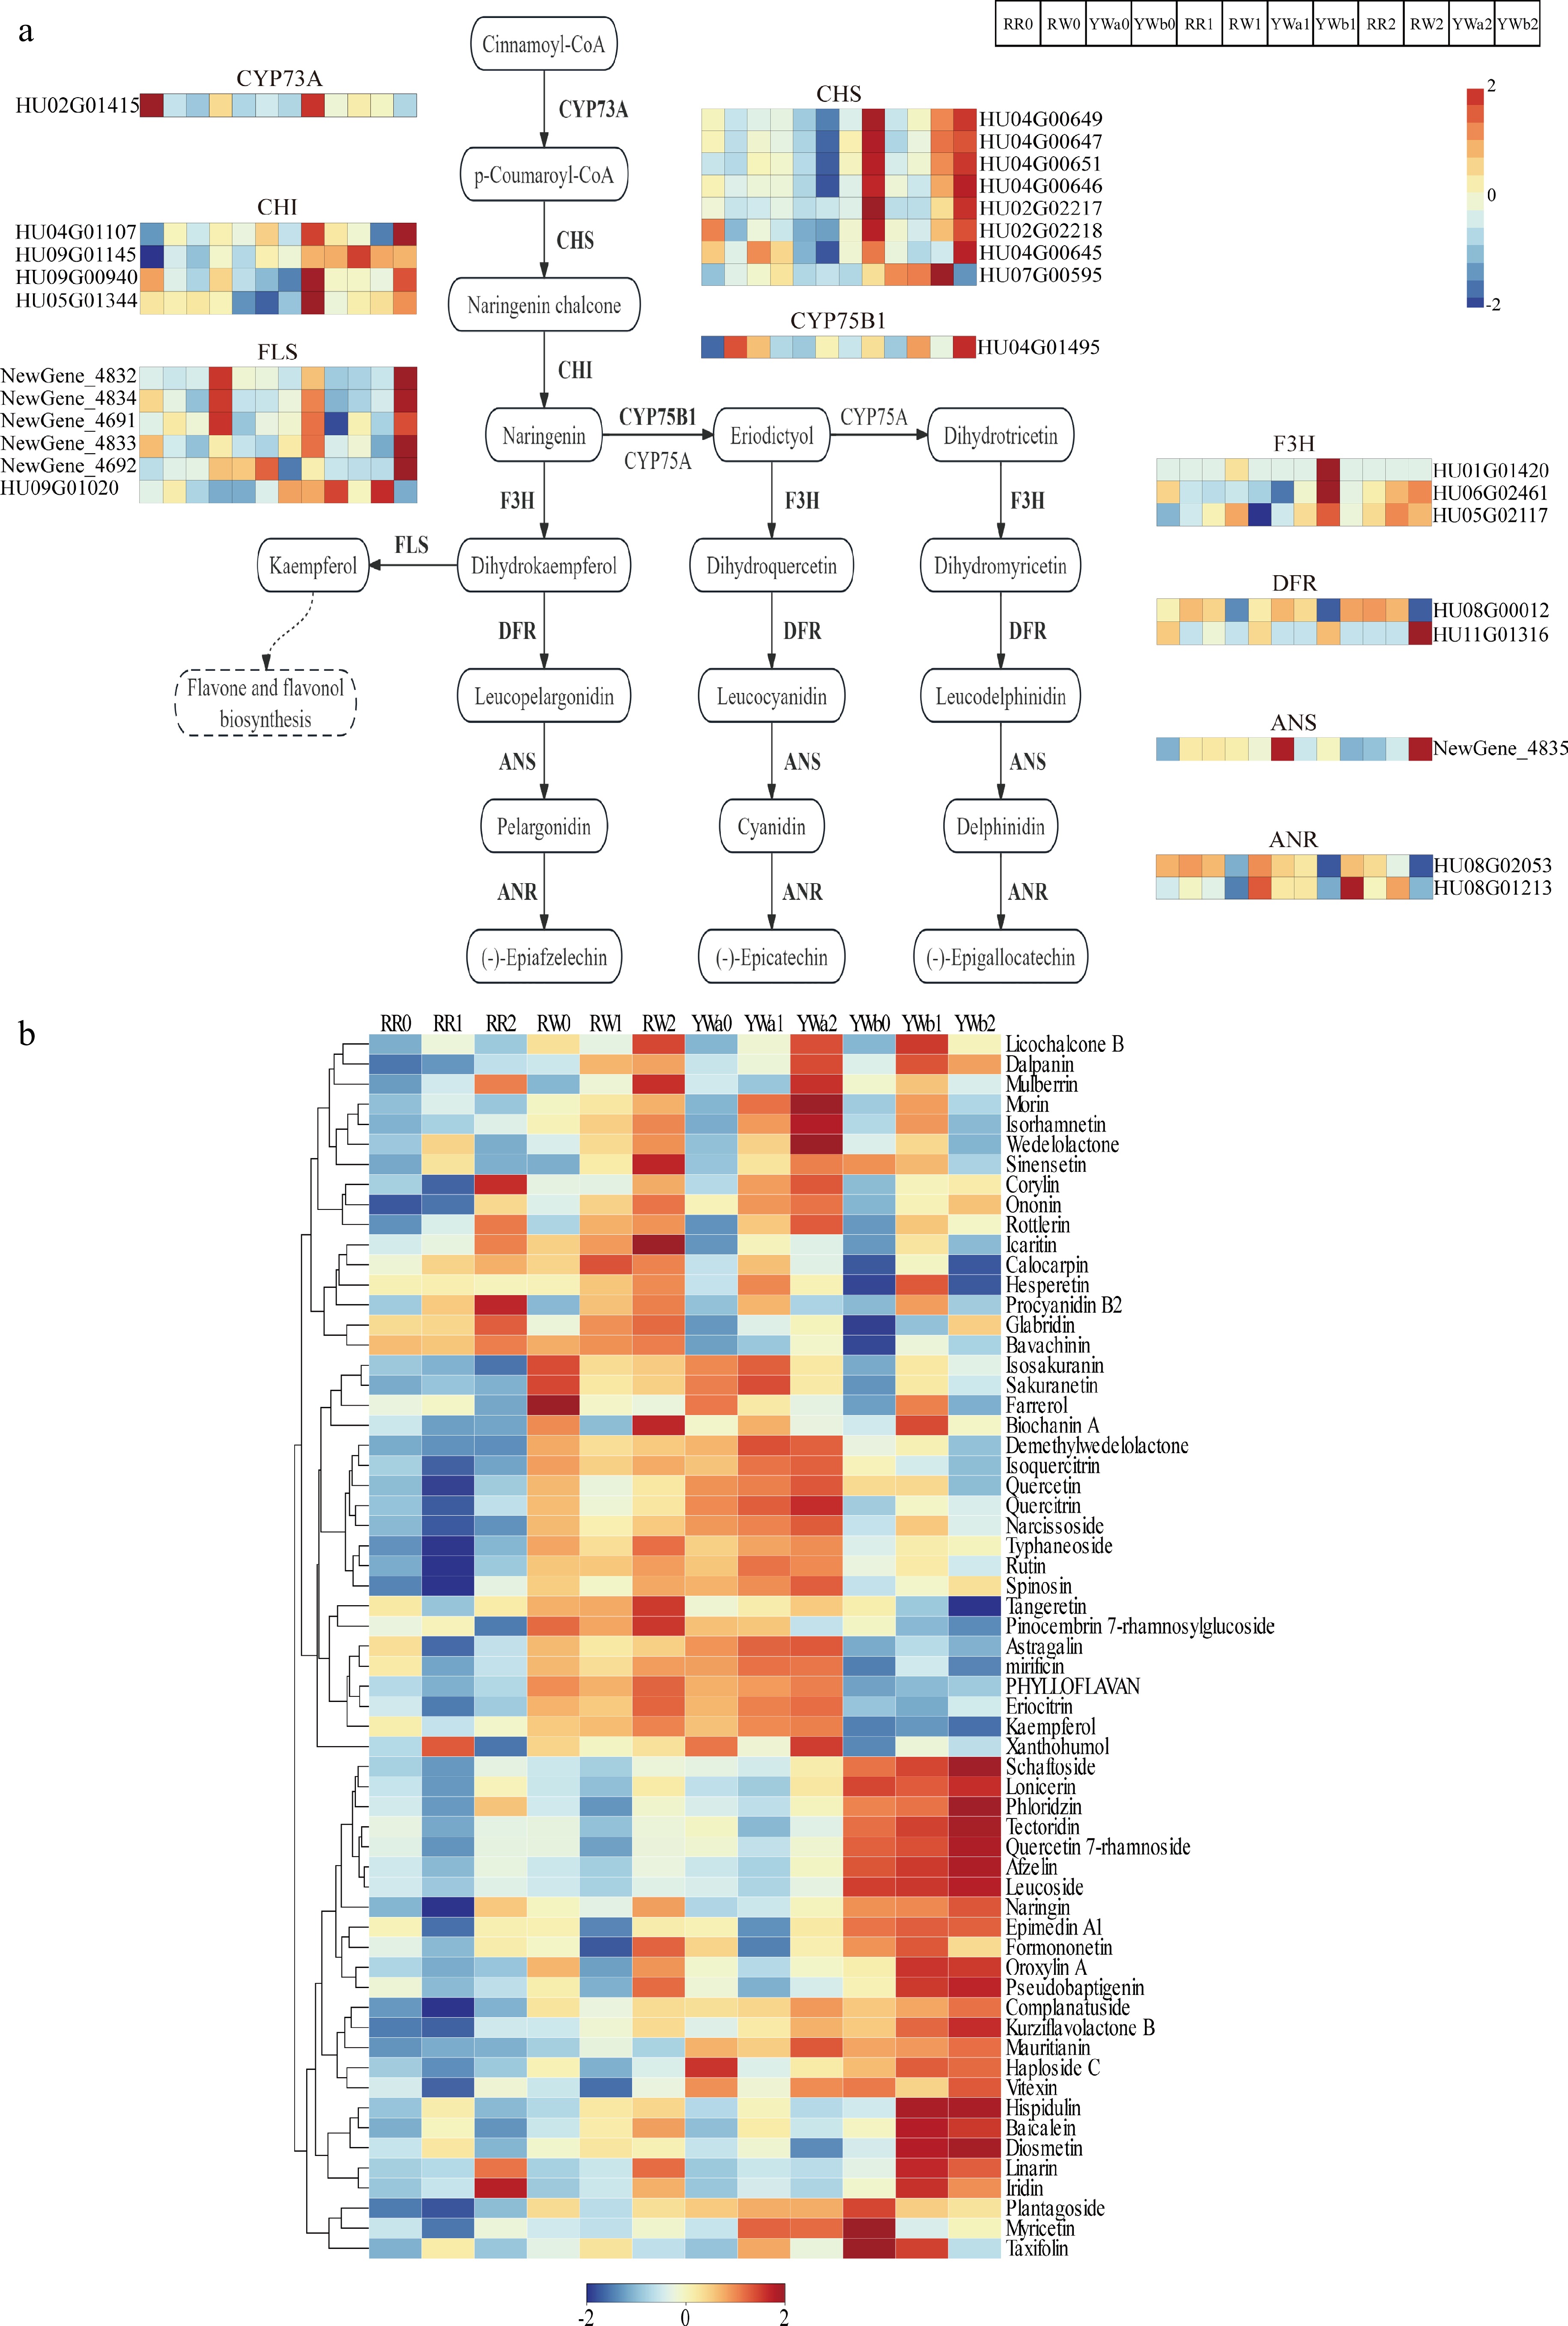
Figure 5.
DAMs and DEGs in the flavonoid synthesis pathway of pitaya peel. (a) Expression analysis of flavonoid synthesis pathway genes in four pitaya varieties at three periods of time. (b) Clustered heat map of metabolite content of flavonoid synthesis pathway.
A total of 61 flavonoid metabolites were identified from the metabolomic analysis. According to the clustering heatmap (Fig. 5b), flavonoid metabolites were present at relatively low levels in RR. Sixteen flavonoid metabolites showed increased accumulation in RW2, YWa1, and YWb1. Twenty flavonoid metabolites exhibited higher levels in the peels of RW and YWa; moreover, their contents increased with fruit maturity in YWa peel and were higher in YWa than in RW. Twenty-five flavonoid metabolites were present at significantly higher levels in YWb than in the other varieties, among which 22 flavonoid metabolites were upregulated in both YWb1 and YWb2.
Analysis of DEGs and differential metabolites of carotenoid synthesis pathway in pitaya peel
-
We screened and analyzed the key genes and metabolites involved in the betalain biosynthesis pathway based on transcriptomic and metabolomic data. Transcriptome analysis showed that genes in the carotenoid biosynthesis pathway were differentially expressed among four pitaya varieties across three developmental stages. Based on gene functional annotation, a total of 30 differentially expressed genes (DEGs) related to the carotenoid metabolic pathway were identified from the transcriptome data (Fig. 6a). The two PSY genes showed higher expression levels in the peels of yellow-skinned pitaya varieties than in those of red-skinned varieties. The PDS, ZDS, and Z-ISO genes exhibited the highest expression levels in RR1, among which PDS was upregulated at both the S1 and S2 stages in the peels of all four pitaya varieties. Five CRTISO genes were identified: three (HU06G00038, HU04G00871, and HU05G02339) were upregulated at S1 in the peels of red-skinned pitaya varieties and showed higher expression than in yellow-skinned varieties, whereas the other two (HU06G00037 and HU09G01266) were more highly expressed in the peels of yellow-skinned pitaya varieties. The LCYE and LCYB genes exhibited higher expression levels in YWb than in the other varieties. The LUT5 gene showed the highest expression in the peels of yellow-skinned pitaya varieties. LUT1 was upregulated in red-skinned pitaya varieties and in YWb2, while VDE was upregulated in YWb2. Four NCED genes were identified, three of which (HU05G02329, HU05G00255, and HU08G01783) were upregulated in RR1, RW1, and YWa1. In addition, nine ZEP genes were identified, among which three (HU03G00412, HU03G00422, and HU04G00404) were upregulated in YWb1 and showed significantly higher expression levels than in the other varieties.
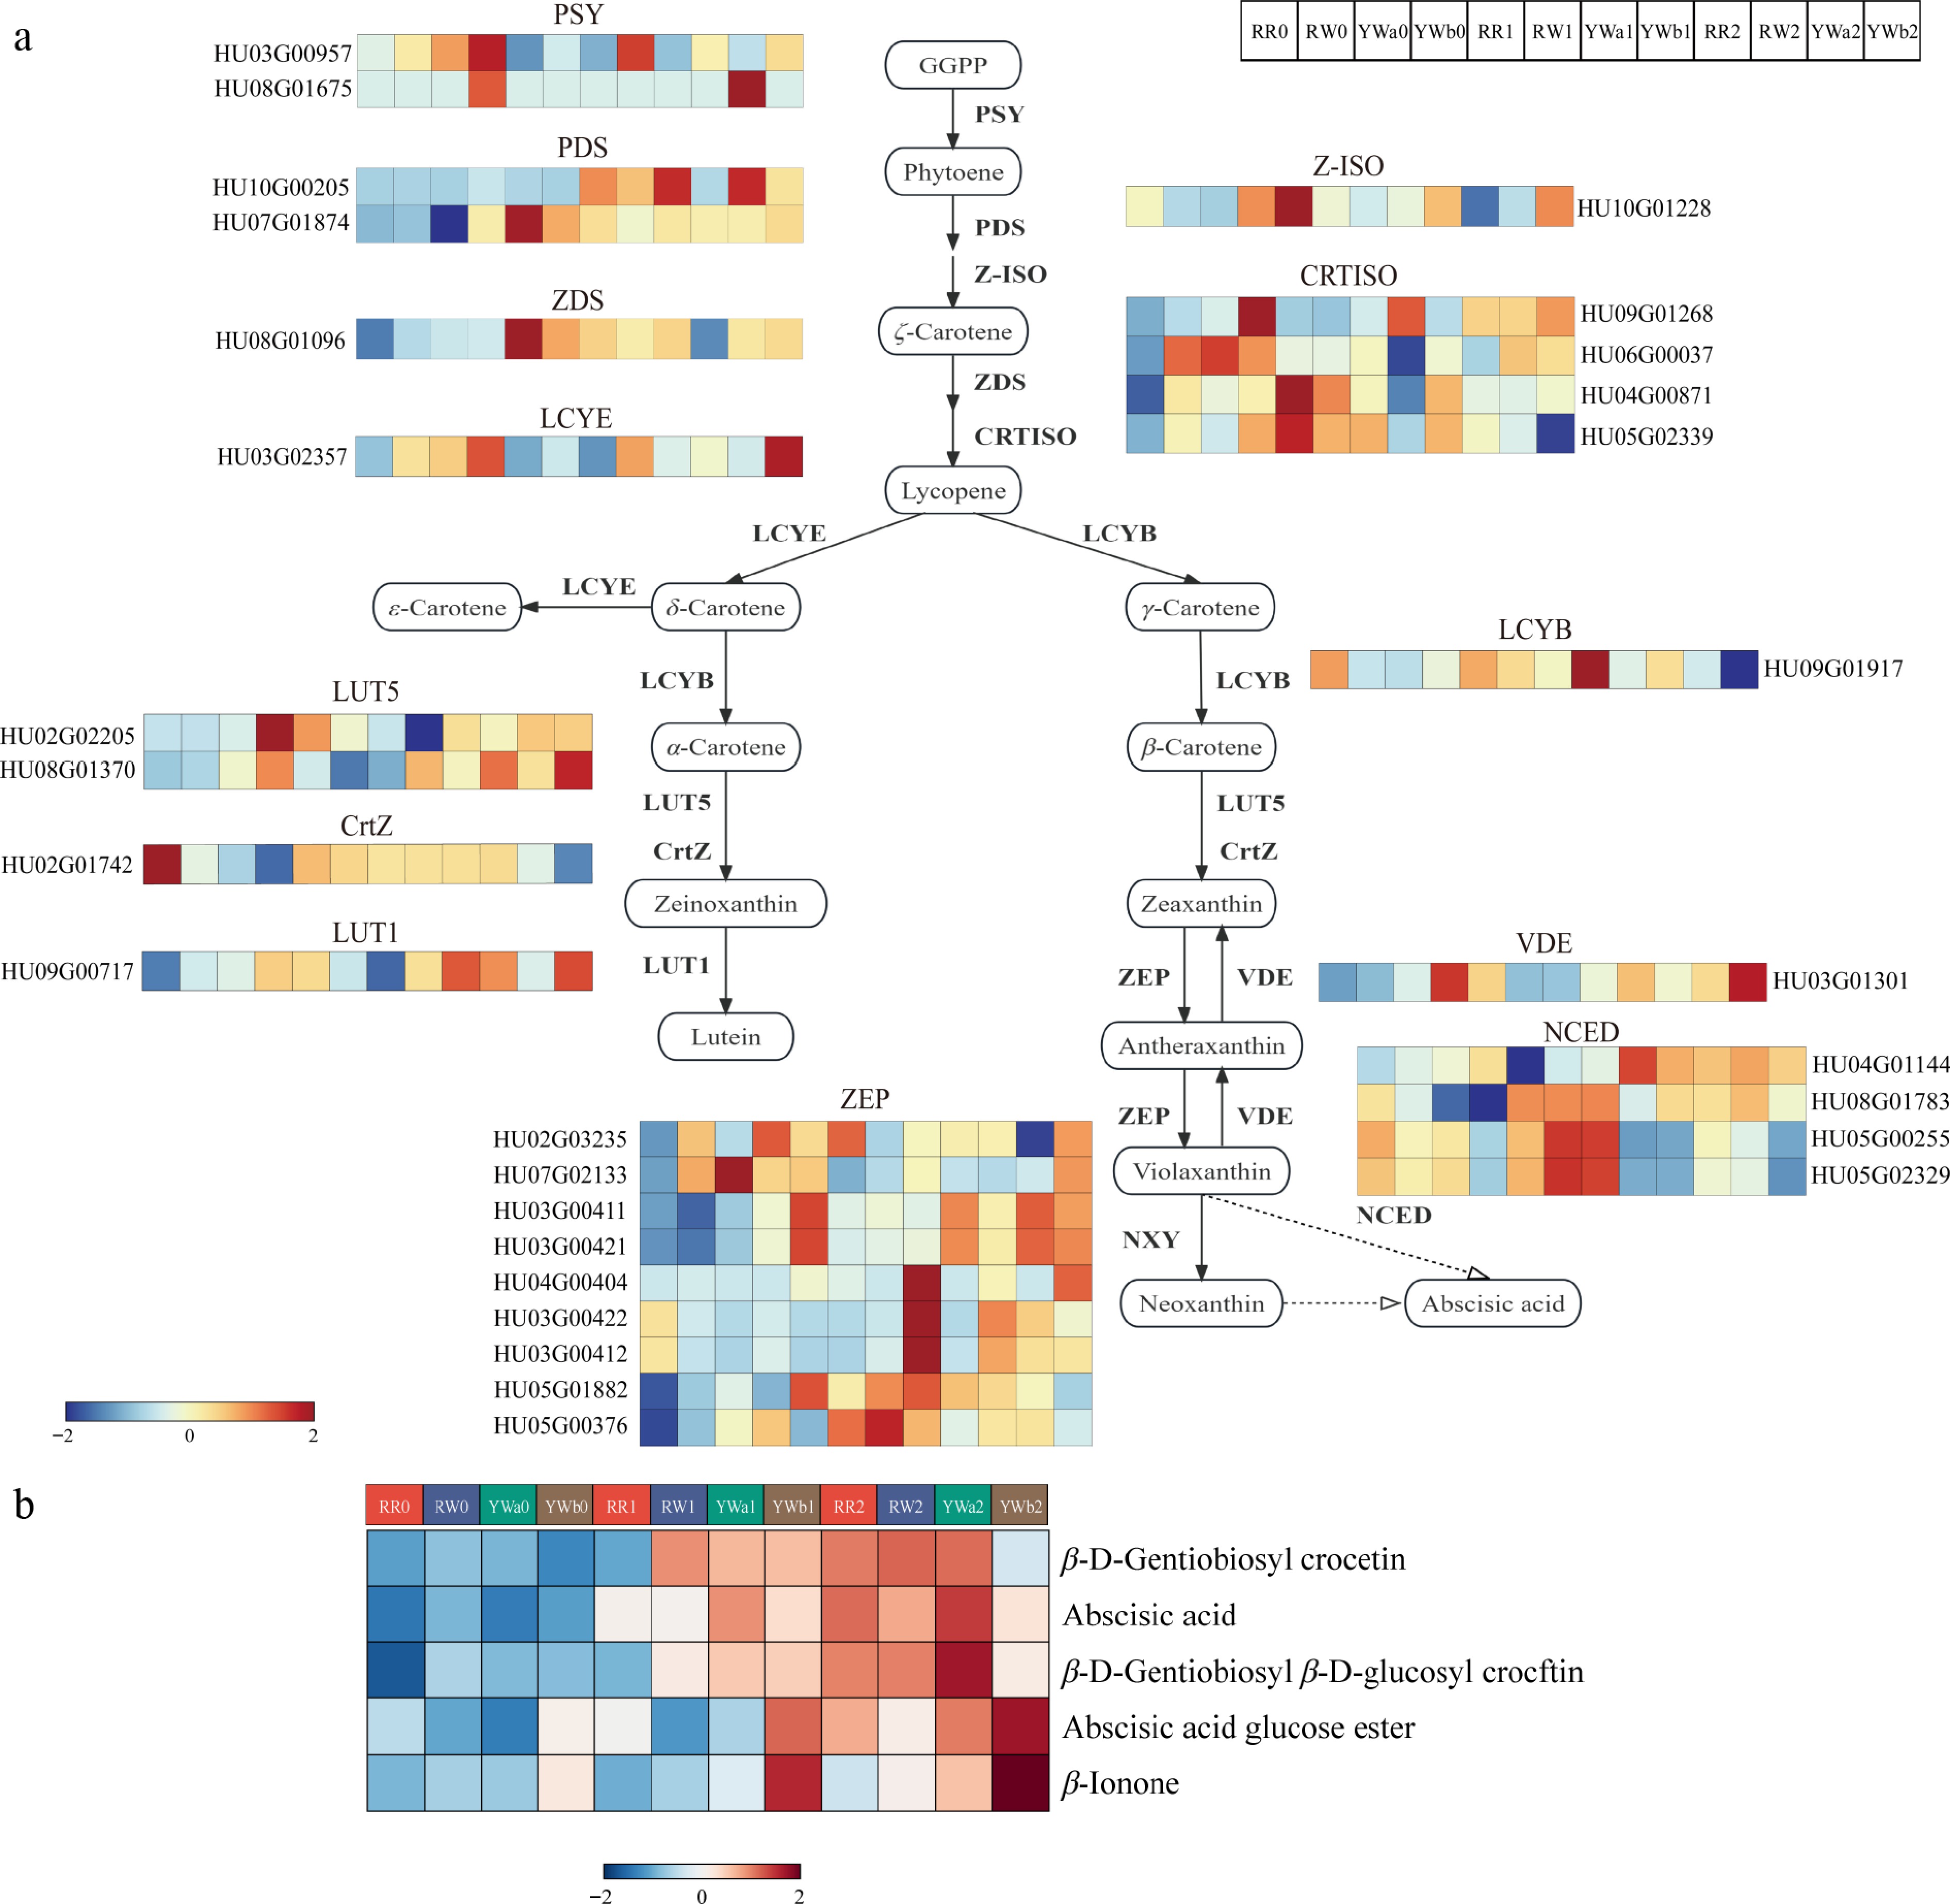
Figure 6.
DAMs and DEGs in the carotenoid synthesis pathway of pitaya peel. (a) Expression analysis of carotenoid synthesis pathway genes in four pitaya varieties at three time periods. (b) Clustered heat map of metabolite content of carotenoid synthesis pathway.
A total of five metabolites involved in the carotenoid metabolic pathway were identified in the metabolomic analysis (Fig. 6b). Overall, these metabolites showed upregulated accumulation during the color-turning and ripening stages in pitaya peel. Among them, two carotenoid-related metabolites, β-D-gentiobiosyl β-D-glucosyl crocetin and β-ionone were identified. The content of β-ionone was increased in YWb1 and YWb2, and was higher in YWb peel than in the other varieties; its level was also upregulated in YWa2. β-D-gentiobiosyl β-D-glucosyl crocetin showed increasing accumulation with fruit maturation in the peels of both red- and yellow-skinned pitaya varieties, with the highest content observed in YWa2.
Analysis of DEGs and differential metabolites of chlorophyll metabolic pathway in pitaya peel
-
We screened and analyzed the key genes and metabolites involved in the chlorophyll biosynthesis pathway based on transcriptomic and metabolomic data. A total of 33 differentially expressed genes (DEGs) involved in chlorophyll biosynthesis and degradation were identified from the transcriptome data (Fig. 7a). Most genes associated with chlorophyll biosynthesis were downregulated during the ripening stage in the peels of both yellow- and red-skinned pitaya varieties. HEMA is a key rate-limiting enzyme in tetrapyrrole biosynthesis and also plays a crucial role in chlorophyll biosynthesis. In this study, one HEMA gene was identified, and its expression in pitaya peel decreased with fruit maturation; moreover, its expression level in YWb peel was higher than in the other varieties. MGCH, another key enzyme in chlorophyll biosynthesis, is composed of the H (CHLH), I (CHLI), and D (CHLD) subunits. Three MGCH genes were identified in this study; their expression was downregulated at S1 and S2 in the peels of RR, RW, and YWa, but upregulated in YWb2. DVR is a key enzyme required for the synthesis of normal MV-Chl in plants. One differentially expressed DVR gene was identified, which was upregulated in the peels of both red- and yellow-skinned pitaya varieties at the S0 stage. These results indicate that the reduced expression of chlorophyll biosynthesis-related genes during the ripening stage leads to decreased chlorophyll biosynthesis, thereby contributing to changes in pitaya peel color.
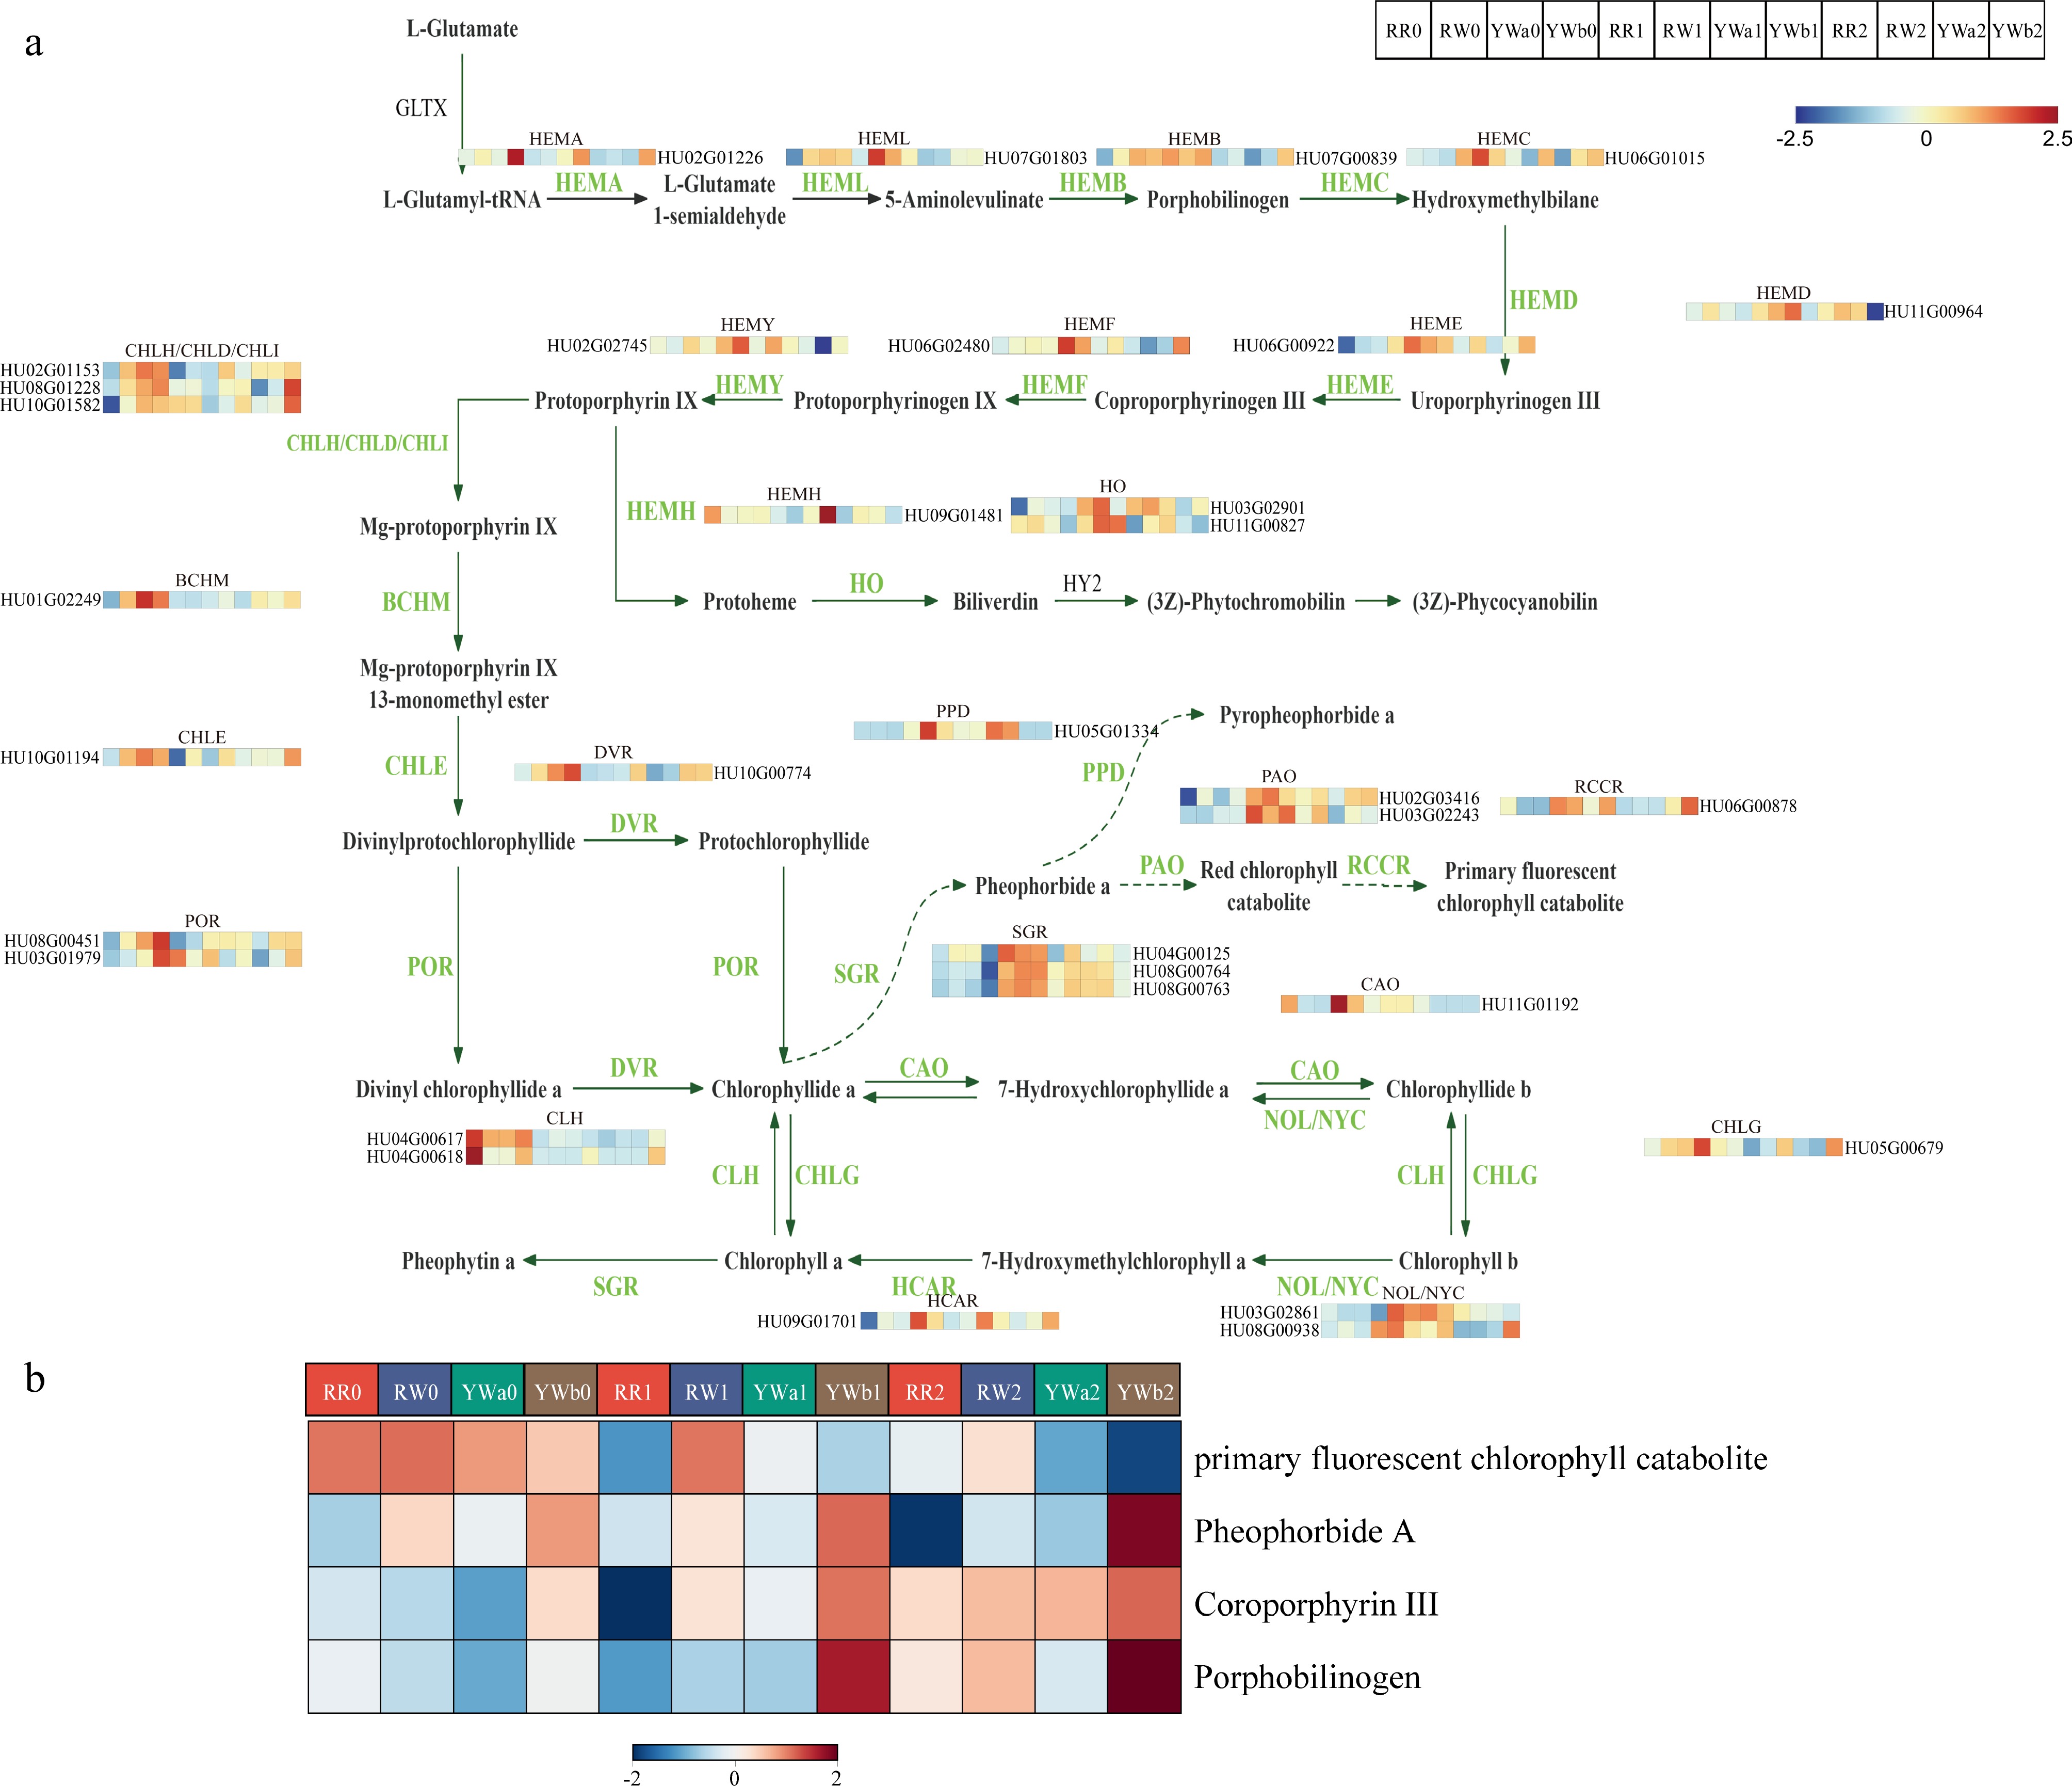
Figure 7.
DAMs and DEGs in the chlorophyll metabolism pathway of pitaya peel. (a) Expression analysis of chlorophyll metabolism pathway genes in four pitaya varieties at three periods of time. (b) Clustered heat map of metabolite content of chlorophyll metabolic pathways.
In addition to chlorophyll biosynthesis, chlorophyll degradation also leads to changes in chlorophyll content and consequently affects plant coloration. NOL and NYC are key enzymes involved in the degradation of the chlorophyll a/b-protein complex. In this study, two differentially expressed NOL/NYC genes were identified, both of which were upregulated in the peels of red- and yellow-skinned pitaya varieties at the S1 stage. CLH is the rate-limiting enzyme in the chlorophyll degradation pathway; two CLH genes were identified, and both were upregulated at the S0 stage in the peels of all four pitaya varieties. The expression of PAO is negatively correlated with chlorophyll content and plays a critical role in chlorophyll degradation. Two differentially expressed PAO genes were identified in this study, both of which were upregulated at the S1 and S2 stages in pitaya peel. In addition, three differentially expressed SGR genes and one differentially expressed RCCR gene were identified; both genes are involved in the chlorophyll degradation process and were upregulated at the S1 and S2 stages in pitaya peel. The upregulated expression of chlorophyll degradation-related genes promotes chlorophyll breakdown, thereby leading to changes in pitaya peel color.
Four metabolites involved in the chlorophyll metabolic pathway were identified in the metabolomic analysis (Fig. 7b). Among them, 'pheophorbide a' and 'primary fluorescent chlorophyll catabolite' are products of chlorophyll a degradation. The accumulation of primary fluorescent chlorophyll catabolite was highest at the S0 stage in the peels of both red- and yellow-skinned pitaya varieties and then gradually decreased with fruit maturation. In contrast, 'pheophorbide a' showed relatively high levels in YWb peel, and exhibited an increasing trend as the fruit matured.
Quantitative analysis by qRT-PCR
-
In order to verify the accuracy of the transcriptome data, we selected 10 DEGs related to pitaya peel color for qRT-PCR validation. The results showed (Fig. 8) that the expression patterns of the selected genes were consistent with those observed in the transcriptome data, thereby confirming the reliability of the transcriptome data.
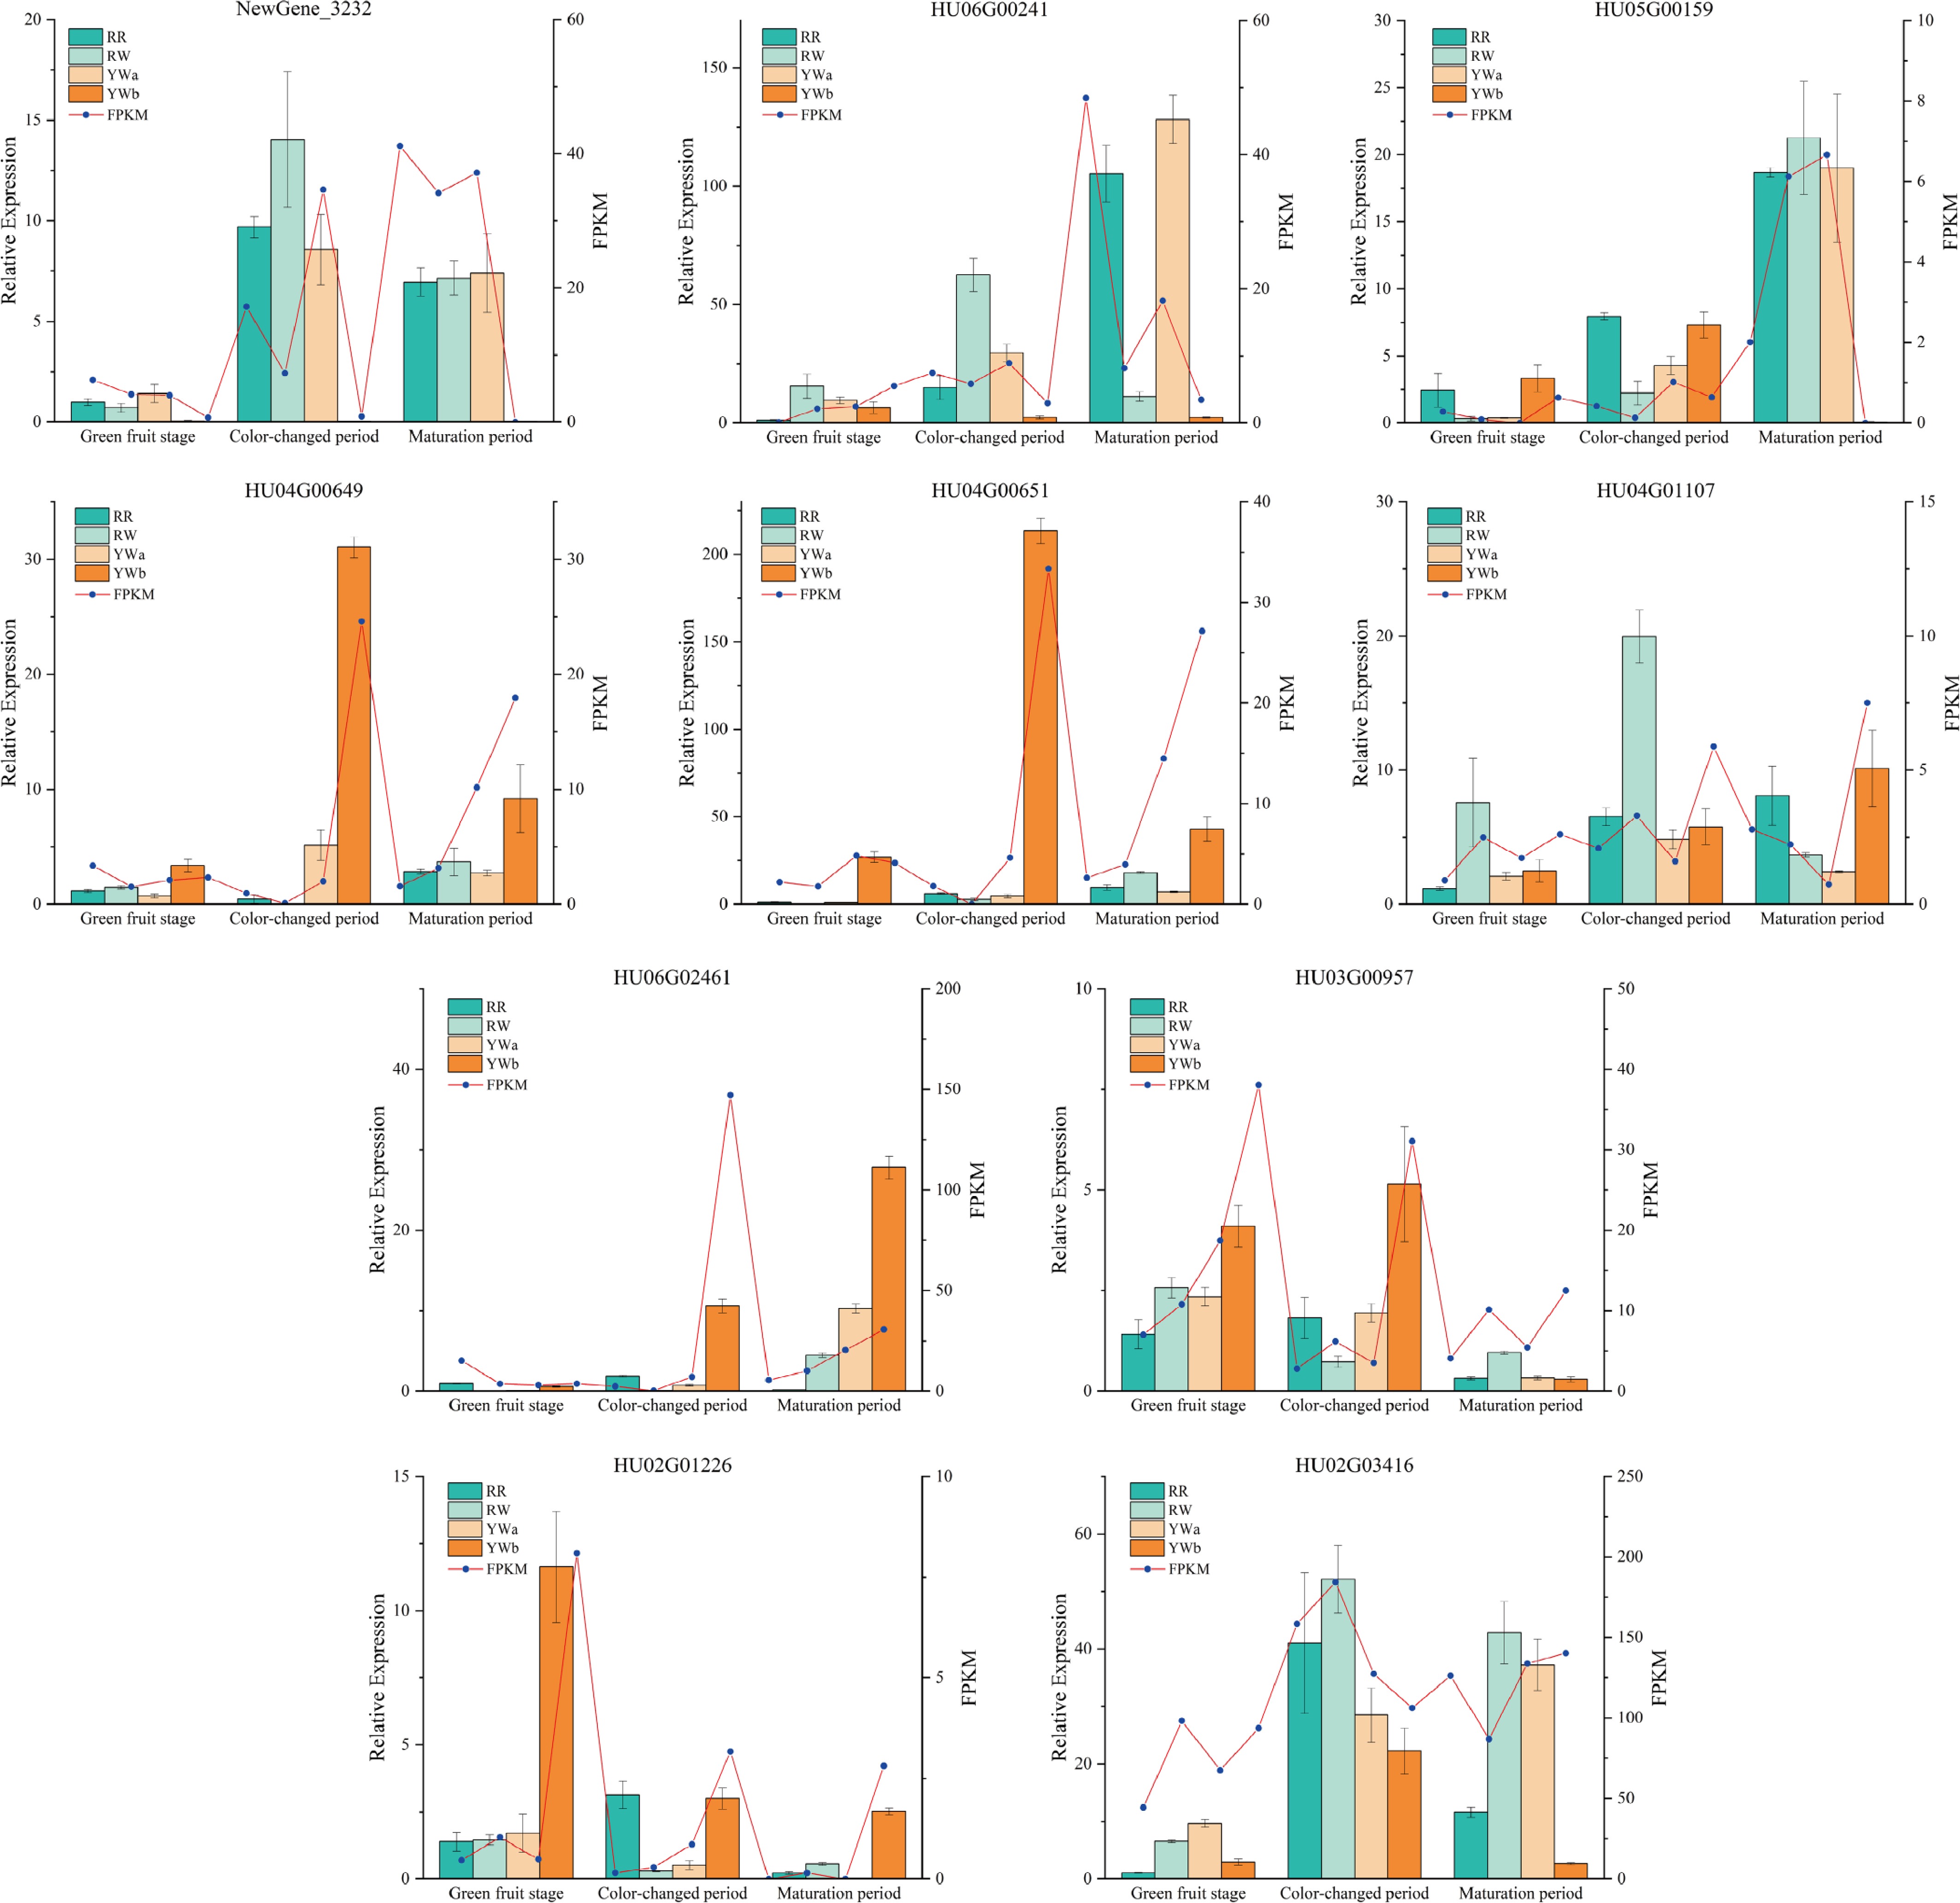
Figure 8.
Pitaya peel color-related DEGs qRT-PCR detection.
-
Betalains are a class of water-soluble natural pigments with various physiological activities, including antioxidant properties, and play important roles in plant coloration and nutritional value formation. As a typical betalain-accumulating fruit, pitaya provides an ideal model for elucidating the biosynthesis and regulatory mechanisms of betalains through changes in peel coloration. Therefore, systematic investigation of betalain biosynthesis and accumulation in pitaya not only contributes to improving the theoretical framework of betalain biosynthesis, but also provides a theoretical basis for pitaya peel color improvement and molecular breeding.
Previous studies have shown that the content and composition of betalains vary significantly among different pitaya varieties and among different organs and tissues[47], suggesting that betalain accumulation may be jointly regulated by genetic background and tissue-specific regulatory mechanisms. In this study, comparative analysis of betalain metabolites in the peels of four pitaya varieties revealed that the contents of betacyanins and betaxanthins in red-skinned pitaya varieties were significantly higher than those in yellow-skinned varieties, with betacyanin levels being markedly higher than betaxanthin levels. In contrast, no significant difference in the contents of the two betalain classes was observed in yellow-skinned pitaya varieties. These results indicate that differences among varieties may exist at key metabolic nodes or in the regulatory strength of the betalain biosynthesis pathway, thereby influencing the final accumulation of specific pigment types.
Wang et al. reported that red beet can efficiently convert tyrosine into betacyanins, whereas this conversion efficiency is significantly reduced in yellow beet[48], indicating that the efficiency of converting tyrosine into key betalain intermediates is a major limiting factor for betalain accumulation. In the present study, higher tyrosine levels were detected in the peels of yellow-skinned pitaya varieties at the ripening stage, while betalain contents remained relatively low. This suggests that the limitation of betalain biosynthesis in yellow-skinned pitaya is not due to insufficient precursor availability, but is more likely associated with a reduced conversion efficiency from tyrosine to betalain biosynthetic intermediates, a process that may be constrained by the activity of key enzymes or their transcriptional regulation.
At the level of key structural genes involved in betalain biosynthesis, CYP76AD1 has been confirmed in beet and Mirabilis jalapa to be upregulated in parallel with betalain accumulation[49]. In this study, the identified CYP76AD1 genes in pitaya were significantly upregulated in the peels of red-skinned pitaya varieties and in 'Wucihuanglong' during the color transition and mature stages, and their expression patterns were consistent with the trends of betalain accumulation. The DODA gene has been reported in various betalain-producing plants to exhibit increased expression concomitant with betalain accumulation[50,51]; in the present study, this gene was upregulated during the color transition or mature stages in the peels of three pitaya varieties, with the exception of 'Yanwoguo'. Glycosyltransferase (GT) genes, which encode key enzymes responsible for the formation of stable betacyanins, are generally closely associated with betacyanin accumulation[16, 52]. Multiple classes of GT genes identified in this study were significantly upregulated in the peels of red-skinned pitaya varieties, with expression levels markedly higher than those in yellow-skinned varieties. Collectively, these results suggest that the coordinated upregulation of multiple key structural genes in the betalain biosynthesis pathway may jointly promote the efficient accumulation of betacyanins in the peels of red-skinned pitaya.
The important role of carotenoid accumulation in yellow peel formation of yellow-skinned pitaya
-
Although the carotenoid metabolic pathway has been systematically characterized in model plants such as Arabidopsis thaliana and tomato, its role in pitaya peel color formation remains poorly understood. Carotenoids are typically negatively correlated with chlorophyll content, and during the transition of many fruits from green to yellow or orange, enhanced carotenoid biosynthesis is often accompanied by chlorophyll degradation[53].
In this study, carotenoids gradually accumulated in the peels of both red- and yellow-skinned pitaya varieties as the fruit matured; however, their levels were higher in yellow-skinned varieties. Concomitant with the increase in carotenoid content, peel color gradually transitioned from green to yellow. This observation suggests that carotenoids may play an important role in yellow peel coloration in pitaya by increasing the relative abundance of yellow-associated pigments.
Further transcriptomic analysis identified 30 differentially expressed genes associated with carotenoid metabolism. PSY, as the rate-limiting enzyme in the carotenoid biosynthesis pathway, generally determines the capacity for carotenoid production[54]. In this study, the two PSY genes exhibited distinct expression patterns among different varieties, suggesting that carotenoid biosynthesis may be influenced by functional divergence of these genes or by variety-specific regulatory mechanisms. In addition, multiple carotenoid biosynthesis–related genes, including PDS, ZDS, Z-ISO, and CRTISO were broadly upregulated during the color-turning and ripening stages, indicating that this pathway is globally activated during fruit maturation. LCYB and LCYE[55], which are key enzymes determining carotenoid composition, showed high expression levels in the peel of 'Yanwoguo', potentially promoting the accumulation of specific carotenoid types and thereby influencing peel color phenotypes.
Contribution of the flavonoid metabolic pathway to peel color formation in yellow-skinned pitaya
-
The flavonoid biosynthesis pathway is an important secondary metabolic pathway in plants, capable of producing a wide range of compounds with pigmentation functions. Previous studies have shown that betalains and anthocyanins exhibit a mutually exclusive distribution in plants; as a betalain-type plant, pitaya does not accumulate anthocyanins in its peel, but instead contains various chalcones, flavones, and flavonols.
In this study, a total of 61 flavonoid metabolites were identified, and their overall levels were higher in the peels of yellow-skinned pitaya varieties than in those of red-skinned varieties, with particularly pronounced accumulation in 'Yanwoguo'. These findings suggest that flavonoid compounds may enhance the visual appearance of yellow peel coloration, either through their intrinsic pigmentation effects or via synergistic interactions with carotenoids.
At the transcriptional level, key genes involved in the flavonoid biosynthesis pathway, such as CHS and CHI, were significantly upregulated in the peels of yellow-skinned pitaya varieties. CHS is considered the rate-limiting enzyme in flavonoid biosynthesis, and changes in its expression can markedly influence the accumulation of downstream flavonoid products[56]. CHI, which catalyzes the conversion of chalcones to flavanones represents a critical regulatory node controlling metabolic flux through the flavonoid pathway[57,58]. In addition, differential expression of genes such as FLS, F3H, DFR, and ANS may further affect the structural composition of flavonoids. Collectively, these results indicate that the flavonoid biosynthesis pathway is strongly activated in the peel of 'Yanwoguo', and enhanced flavonoid metabolism may partially compensate for the unfavorable effects of lower betalain content on peel coloration.
The relationship between pitaya peel color formation and the chlorophyll metabolic pathway
-
Changes in chlorophyll content directly affect the background color of plant tissues. During fruit ripening, chlorophyll is typically progressively degraded, thereby reducing the green background and exerting an 'unmasking effect' on the coloration of other pigments[59]. In this study, the chlorophyll degradation product pheophorbide a was significantly upregulated during the color transition and mature stages in 'Yanwoguo', suggesting that chlorophyll degradation may play an important role in peel color transition.
At the gene level, chlorophyll biosynthesis–related genes, including HEMA and MGCH, were downregulated with fruit maturation in most varieties[60,61], whereas chlorophyll degradation–related genes such as SGR, NOL, and NYC were generally upregulated during the color transition and mature stages[62,63]. This combination of reduced chlorophyll biosynthesis and enhanced chlorophyll degradation may accelerate the disappearance of the green background in the peel, thereby enhancing the contributions of betalain, carotenoids and flavonoids to peel coloration.
An integrated mechanistic model of pitaya peel color formation
-
Unlike previous studies that mainly focused on individual betalain biosynthetic genes or transcription factors, this study employed an integrated metabolomic and transcriptomic analysis to systematically compare the dynamic changes of multiple pigment metabolic pathways in the peels of different pitaya (dragon fruit) cultivars. The results indicate that the formation of different peel color types may involve coordinated changes in multiple pigment metabolic pathways at different developmental stages, and to varying extents (Fig. 9).
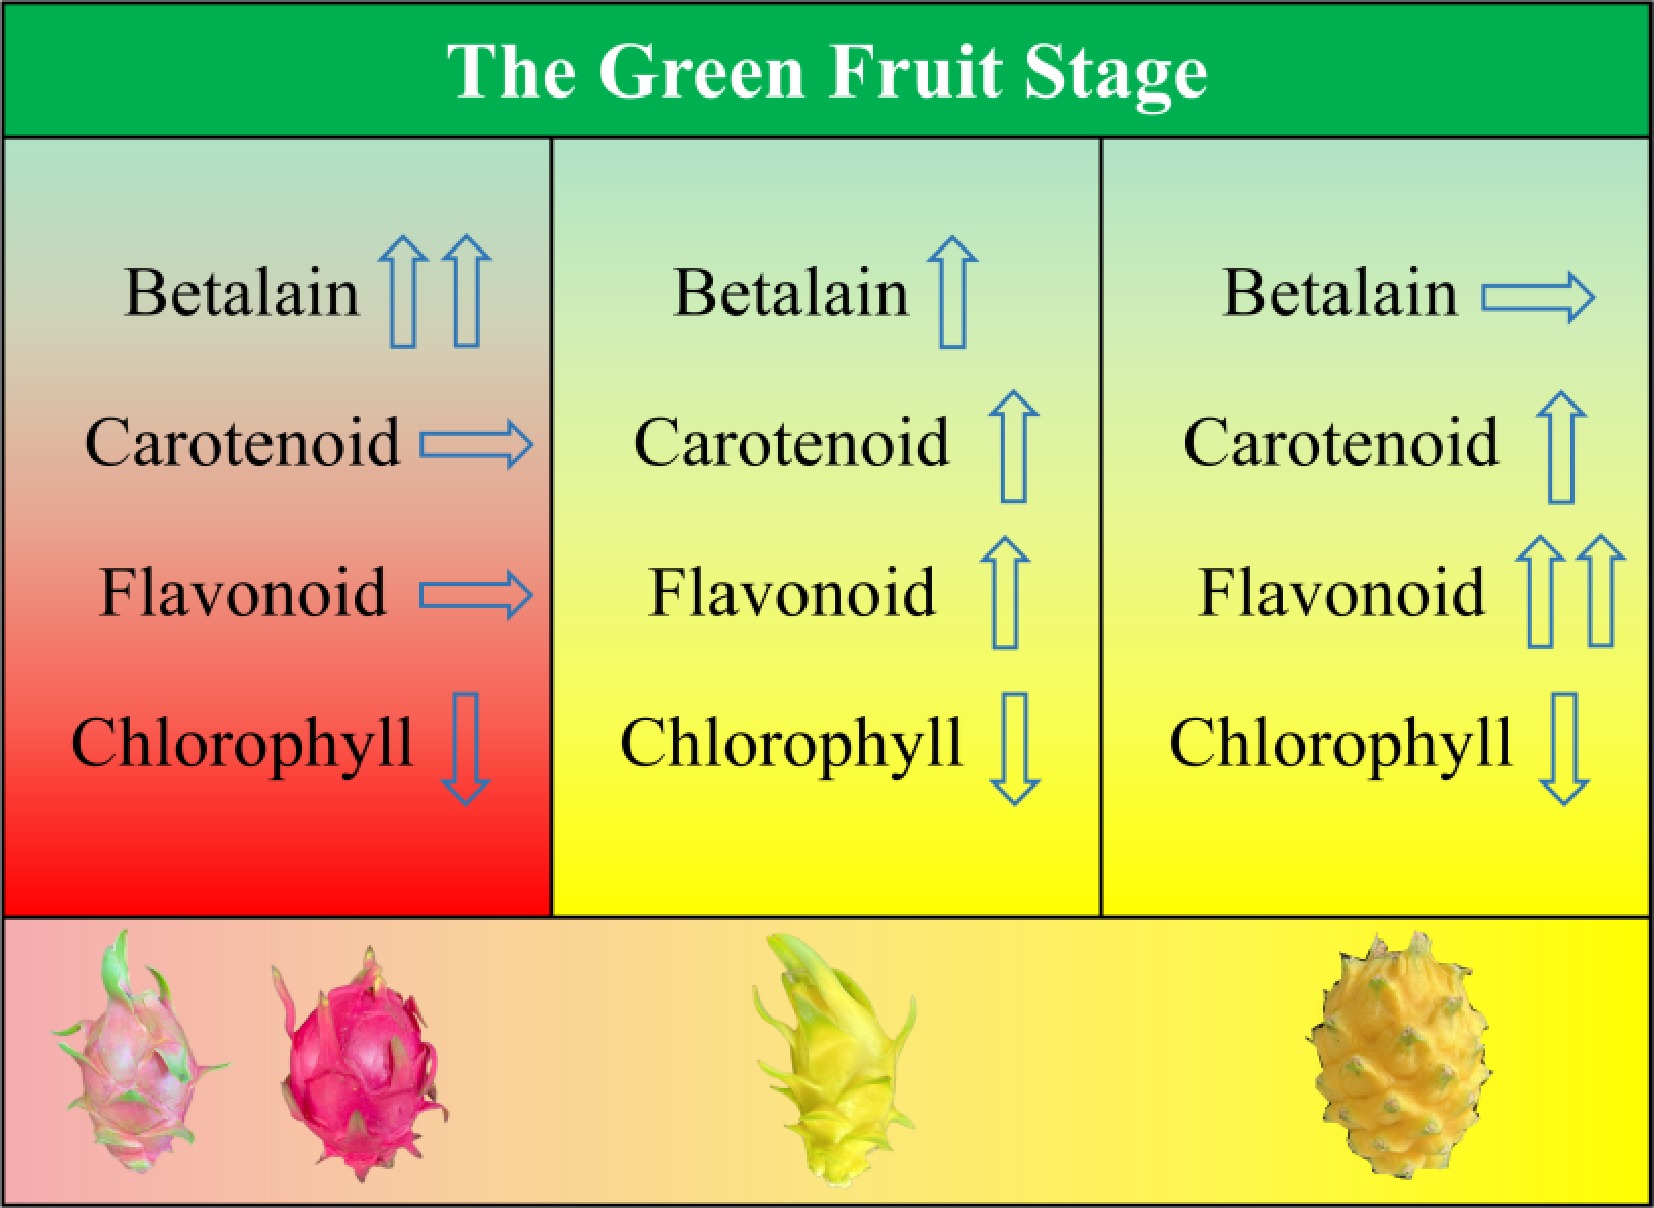
Figure 9.
Proposed regulatory model of pigment metabolic pathways underlying peel color differentiation in pitaya.
In red-skinned pitaya cultivars, key genes in the betalain biosynthetic pathway, including CYP76AD1, DODA, and GT, are coordinately upregulated during the peel color transition and mature stages. Their expression patterns show strong consistency with the accumulation trend of betacyanins, suggesting that betalain metabolism may play a dominant role in peel coloration in red-skinned pitaya.
In contrast, in the peel of 'Yanwoguo', genes related to the betalain biosynthetic pathway exhibit generally low expression levels, whereas carotenoid and flavonoid metabolites show relatively higher abundance. At the same time, genes involved in multiple carotenoid and flavonoid biosynthetic pathways are significantly upregulated during the color transition and mature stages. In addition, changes in chlorophyll degradation-related metabolites and gene expression may further influence the final color characteristics of the peel. These results suggest that the formation of the yellow peel color in 'Yanwoguo' may be associated with the combined effects of enhanced carotenoid and flavonoid metabolism and the chlorophyll degradation process.
It should be noted that this study is primarily based on transcript expression patterns and the relative abundance of metabolites, which cannot directly reflect the absolute contents of different pigments in the peel or their quantitative contributions to color phenotypes. Future studies integrating targeted quantitative analyses of major pigments are still required to further verify the specific roles of different metabolic pathways in pitaya peel color formation.
-
This study systematically compared the changes in major pigment metabolic pathways in the peels of different pitaya cultivars through integrated metabolomic and transcriptomic analyses. The results indicate that betalains are likely the primary pigments responsible for coloration in the peel of red-skinned pitaya, and their accumulation shows a strong correlation with the coordinated upregulation of CYP76AD1, DODA, and GT genes involved in the betalain biosynthetic pathway.
For yellow-skinned pitaya cultivars, the mechanisms underlying peel coloration may differ among materials. In 'Wucihuanglong', the upregulated expression of genes involved in the betalain biosynthetic pathway during the peel color transition and mature stages may be associated with changes in peel color. In contrast, in 'Yanwoguo', both the expression levels of betalain biosynthetic genes and the contents of betalain metabolites are relatively low. Instead, carotenoid and flavonoid metabolites show relatively higher abundance in the peel, and the genes involved in their biosynthetic pathways are significantly upregulated during the color transition and mature stages. These results suggest that carotenoid and flavonoid metabolism may play important roles in the formation of the yellow peel in 'Yanwoguo'.
-
The authors confirm their contributions to the paper as follows: methodology: Kang S, Jiang S; investigation: Kang S, Ding Y, Wang Z, Yang Z; formal analysis: Wang M; software: Kang S; data curation: Kang S; data analysis: Kang S, Jiang S; validation: Wang M; visualization: Kang S; draft manuscript preparation: Kang S; writing—review and editing: Tang H; supervision: Tang H, Wei S; funding acquisition: Tang H. All authors reviewed the results and approved the final version of the manuscript.
-
All data generated or analyzed during this study are included in this published article.
-
This work was supported by the Hainan Provincial Natural Science Foundation high-level Talents Project (320RC487), the Hainan Major Science and Technology project (ZDKJ2021014), the Natural Science Fund of Hainan Province (311025), the Hainan Province Science and Technology Special Fund (ZDYF2022XDNY199), and the earmarked fund for Tropical High-efficiency Agricultural Industry Technology System of Hainan University (Project No. THAITS-5).
-
The authors declare that they have no conflict of interest.
-
Received 12 October 2025; Accepted 12 February 2026; Published online 28 May 2026
- Copyright: © 2026 by the author(s). Published by Maximum Academic Press on behalf of Hainan University. This article is an open access article distributed under Creative Commons Attribution License (CC BY 4.0), visit https://creativecommons.org/licenses/by/4.0/.
-
About this article
Cite this article
Kang S, Jiang S, Wang M, Wang Z, Ding Y, et al. 2026. Molecular mechanism of pitaya peel color formation based on combined transcriptome and metabolome analysis. Tropical Plants 5: e016 doi: 10.48130/tp-0026-0013 

Molecular mechanism of pitaya peel color formation based on combined transcriptome and metabolome analysis
- Received: 12 October 2025
- Revised: 07 February 2026
- Accepted: 12 February 2026
- Published online: 28 May 2026
Abstract: Peel color is an important indicator of pitaya appearance, quality, and commercial value, yet its formation mechanism remains unclear. In this study, four pitaya cultivars were selected, and peel samples were collected at the green, color-transition, and mature stages. Integrated metabolomic and transcriptomic analyses were performed to elucidate the molecular basis of peel color formation. The results revealed significant differences in metabolite composition and gene expression among cultivars. Red-peel cultivars exhibited higher betalain contents, with key biosynthetic genes (CYP76AD1, DODA, and GT) significantly upregulated during fruit maturation, closely associated with red coloration. In 'Wucihuanglong', betalains and related genes were also upregulated but at lower levels than in red cultivars, while carotenoids and flavonoids accumulated at relatively higher levels, likely jointly influencing peel color. In contrast, 'Yanwoguo' showed substantial accumulation of carotenoids and flavonoids, whereas betalain contents and biosynthetic gene expression were low, indicating that carotenoids and flavonoids are the main pigments responsible for yellow peel formation. Additionally, genes involved in chlorophyll biosynthesis (HEMA, POR, and DVR) were downregulated, while chlorophyll degradation genes (SGR and PAO) were upregulated during fruit maturation, further promoting peel color changes. Overall, this study identified key metabolites and candidate genes associated with pitaya peel color through integrated multi-omics analysis, providing a theoretical basis for elucidating coloration mechanisms and supporting breeding research.
-
Key words:
- Pitaya /
- Transcriptome /
- Metabolome /
- Betalains /
- Carotenoids /
- Flavonoids /
- Chlorophyll