


-
Grassland vegetation functioning reflects the collective capacity of plant communities to regulate carbon uptake, water flux, and energy exchange at the Earth's surface[1]. In addition to providing essential nutrients for herbivores and ruminants, grasslands contribute to livestock health and offer various environmental benefits[2]. However, balancing the multiple functions of grasslands—such as supplying forage for livestock while conserving wildlife and plant species—presents a challenge[3]. Moreover, climate change, along with anthropogenic activities, has led to severe degradation and desertification in some grasslands, particularly in arid and semi-arid regions[4]. The Central Asian grasslands, including the steppes of Mongolia and Inner Mongolia, represent one of the largest continuous grassland biomes in the world[5]. Owing to its inland location, Mongolia experiences the residual influence of monsoonal systems originating from both the Pacific and Arctic Oceans. Over the past decade, the region has been increasingly exposed to climate extremes, including severe winters, dust storms, elevated daytime temperatures, cooler nights, strong winds, and prolonged droughts[6]. These interacting stressors are likely to influence vegetation productivity and alter species composition across Mongolian steppes.
Climate variability can disrupt competitive dynamics among plant species, favoring some species over others and thereby altering community composition[7]. Evidence from multiple regions highlights the sensitivity of plant communities to changing climatic conditions. For example, shifts in moisture availability have driven a westward expansion of angiosperm species, and a poleward migration of gymnosperm trees across the eastern United States over the past three decades[8]. Comparable climate-driven responses have been observed in China, where grassland Normalized Difference Vegetation Index (NDVI) increased within the subtropical broadleaf evergreen forest region despite declines in precipitation and accumulated temperature above 10 °C (AT10). In contrast, NDVI in temperate steppes and desert grasslands showed positive correlations with both precipitation and AT10, underscoring regional climatic controls on vegetation dynamics[9]. Long-term observations combined with manipulative experiments further demonstrate that climate change can reorganize plant communities even when ecosystem productivity remains relatively stable. A 32-year study on the Tibetan Plateau revealed that warming reshaped species dominance, whereas drought reorganized community composition, collectively promoting a shift toward grass-dominated systems[10]. Similarly, experimental imposition of extreme drought and a mid-summer heat wave in the central US grassland showed that, although the ecosystem was resistant to heat stress, it was highly vulnerable to drought. Extreme drought reduced aboveground net primary productivity (ANPP) to its lowest level in nearly three decades and altered species abundances, indicating that water limitation can exceed the adaptive capacity of grassland communities[11]. Such climate-driven shifts in plant community structure may destabilize grassland ecosystems by reducing their health, resilience, and long-term sustainability[12]. These vegetation changes can also trigger cascading ecological effects, particularly for species that depend on grasslands for habitat and forage resources[13].
Nevertheless, disentangling the relative contributions of climatic variability and local disturbances in shaping plant community structure remains a fundamental challenge, particularly in semi-arid regions such as the Mediterranean, Northern China, and Inner Mongolia, where these drivers frequently interact. Among local disturbances, grazing is widely recognized as one of the most powerful forces influencing grassland ecosystems. Excessive grazing reduces plant cover, diminishes biodiversity, and accelerates soil degradation[14]. Grassland degradation typically begins with a decline in community productivity, reflected in reduced plant height, cover, and density, followed by shifts in species composition. Long-term overgrazing has been shown to decrease the abundance of dominant palatable species such as Leymus chinensis, Stipa krylovii, and Cleistogenes squarrosa, while promoting the expansion of unpalatable species such as Artemisia frigida[15]. Beyond altering vegetation structure, overgrazing also modifies soil chemical properties,[16] often leading to reduced nutrient availability[17]. As a result, productivity in degraded grasslands becomes increasingly constrained by nitrogen and phosphorus limitation[18], which can further influence the uptake of trace elements by plants[19]. Grazing may additionally suppress vegetation regeneration; for instance, it was found that herbivory by red deer and Przewalski's horses further inhibits forest regeneration in the low-productivity forests, characterized by a low growth stock (25.3 ± 9.5 m3·ha−1)[20]. Collectively, these processes can generate a self-reinforcing feedback loop in which vegetation loss accelerates soil degradation, further constraining plant recovery and increasing ecosystem vulnerability to continued disturbance.
Climate change and grazing jointly shaped plant communities, yet their relative influences remain difficult to disentangle in semi-arid ecosystems. This challenge is particularly relevant in Hustai National Park (HNP), where grazing pressure is expected to increase following the reintroduction of the protected Przewalski's horse (Equus ferus przewalskii). To distinguish the impacts of grazing from those of climate variability, we compared two national parks in Mongolia of similar size and climatic conditions. Bogd Khan Uul National Park (BKU), characterized by limited large-herbivore pressure, served as a reference site for assessing climate-driven vegetation patterns. Paired fenced and unfenced plots within HNP further enabled direct evaluation of grazing impacts on vegetation structure and ecosystem functioning. We hypothesized that chronic grazing would shift vegetation productivity and composition, accompanied by changes in plant nutrient dynamics. We focused on two dominant grassland species with contrasting susceptibility to herbivory—the palatable grass Stipa krylovii and the unpalatable shrub Artemisia frigida. The objectives of this study were to (1) quantify vegetation dynamics using NDVI to distinguish the relative influences of climate and grazing, (2) assess whether grazing alters biomass allocation and productivity under fenced and unfenced conditions, and (3) determine how grazing-driven shifts in species dominance influence plant nutrient uptake between palatable and unpalatable species.
-
This study employed a multi-scale, quasi-experimental design integrating satellite-derived vegetation data with field measurements of biomass allocation and plant nutrient status to evaluate grazing impacts in HNP (Supplementary Table S1). Grazing impacts were assessed using paired fenced and unfenced plots established across three subsites (sites 2, 3, and 4) within the park, enabling direct comparison between grazed and ungrazed conditions. For each site, the area inside the fence (subject to animal disturbances) was labeled as '−2', and the area outside the fence (not disturbed by grazing) was labeled as '−1'. For example, site 2-1 denotes site 2 outside the fence, while 2-2 denotes site 2 within the fence. A map of sampling locations is presented in Fig. 1. Because soil and plant sampling was conducted within a single year and focused on two representative species, soil–plant elemental patterns are interpreted as preliminary evidence of potential nutrient-cycling responses rather than definitive mechanistic conclusions.
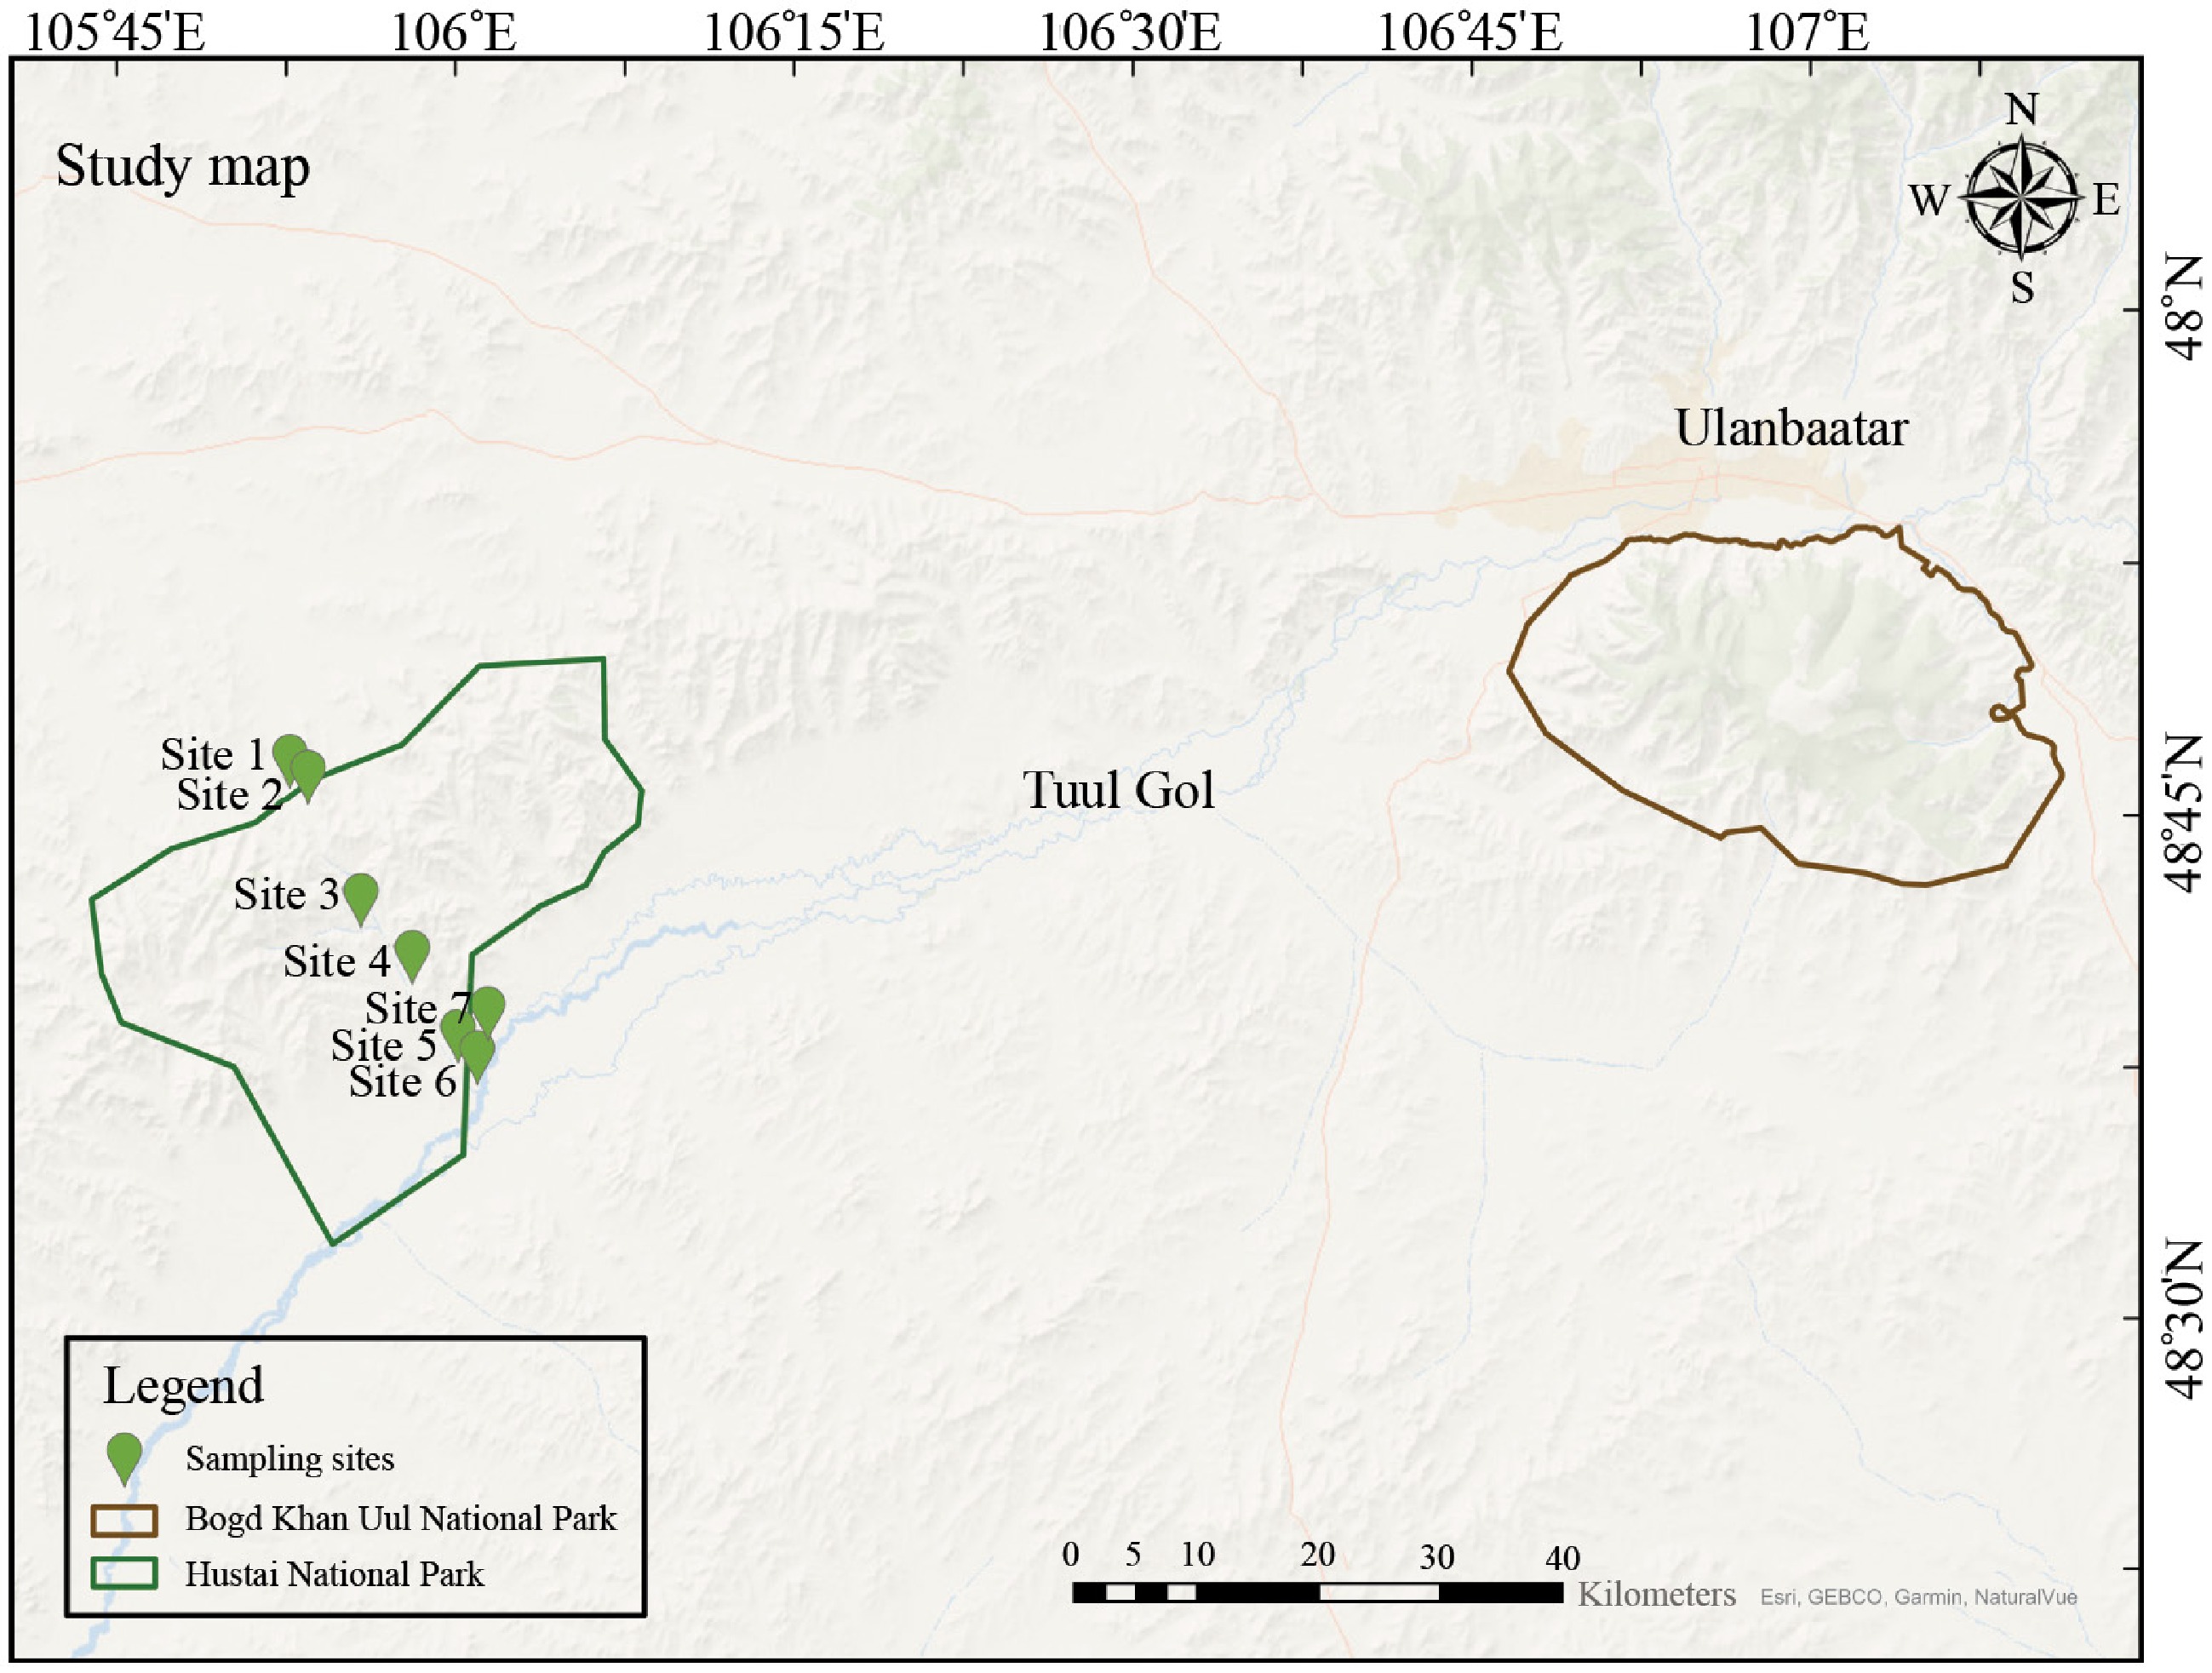
Figure 1.
Sampling map of Hustai National Park (HNP), and its surrounding areas. Bogd Khan Uul National Park (BKU) is included as the control site for Normalized Difference Vegetation Index (NDVI) analysis. Soil and plant samples were collected exclusively from HNP. The study includes a total of 10 sampling sites (S1 to S7), with additional sub-sampling locations at sites S2, S3, and S4. These sub-sampling sites are categorized based on their position relative to the fence (see Supplementary Table S2).
Study area
-
Spatial–temporal vegetation dynamics were investigated in Hustai National Park (HNP), and Bogd Khan Uul National Park (BKU), Mongolia. The contrasting herbivore regimes, combined with broadly similar climatic conditions between these parks, create a natural experiment for distinguishing vegetation responses associated with climate variability from those driven by grazing disturbance. A summary of the ecological characteristics of each national park is provided in Table 1. The BKU (47°43′–47°54′ N, 106°46′–107°10′ E) is located approximately 110 km southeast of HNP (47°35′–47°52′ N, 105°23′–105°37′ E). The two parks are comparable in spatial extent and experience broadly similar climatic conditions, supporting the use of BKU as a reference site for evaluating climate-driven vegetation dynamics.
Table 1. Summary of environmental characteristics of the Hustai National Park and Bogd Khan Uul National Park highlighting their climatic similarity and contrasting grazing regimes.
Characteristic Hustai National Park (HNP) Bogd Khan Uul National Park (BKU) Distance apart 100 km southwest of Ulaanbaatar, Mongolia 30−40 km south part of Ulanbaatar, Mongolia Area 506.2 km2 422.7 km2 Elevation 1,400−1,843 m[21] 2,268 m above sea level[22] Mean annual temperature 0.2 °C −0.5 °C Annual precipitation 222.5 mm (1996−2010)[23] 268.5 mm (1999−2018)[24] Dominant ecosystem Area consists primarily of grassland and shrubland (88%), with 5% forest cover, and includes mountain and forest steppes Typical mountainous forest-steppe with the 53.2% of the area covered by forest steppes[22] Protection status Protected zone to conserve the endangered Przewalski's horse (Equus ferus przewalskii) since 1993 Strictly protected area since 1778 Historical land use Former agriculture, including crop and livestock production[25] Minimal Protection zoning Protected area established for conservation of Przewalski's horses Divided into restricted (12,216 ha), protected (13,433 ha), and pristine (16,000 ha)
*Remaining area is covered by pastureland (20,278 ha) and 1,754 ha for the citizens and businesses[26]Dominant vegetation types 208 species of nonvascular plants and 451 species of vascular plants[27]
Note: The formerly cultivated land was dominated by plant species such as Artemisia macrocephala, A. scoparia, A. commutata, and A. pectinata; original mountain steppe vegetation consisted primarily of Agropyron repens, Agropyron cristatum, Stipa krylovii, Carex duriuscula, and Kochia prostrata[25]746 species of vascular plants and predominant of larch and birch trees, rich pine foests, and spruce forests[24] Herbivore populations 1,300 red deer, 500 Mongolian gazelles, and 330 Przewalski's horses[20] Musk deer and sable[24] Grazing pressure High Low Fenced Installed 2018 (UNU Land Restoration Training Programme) None Despite these similarities, the parks differ notably in management objectives and disturbance regimes. HNP was established primarily to support the conservation and reintroduction of the endangered Przewalski's horse, and is characterized by extensive grassland–shrub steppe with approximately 5% forest cover. The park sustains large herbivore populations, resulting in substantial grazing pressure. Fenced exclosures were established in 2018 enabling direct comparisons between grazed and ungrazed areas. In contrast, BKU is managed under a zonation framework that includes restricted, protected, and pristine areas. Vegetation is predominantly forest–steppe, dominated by larch and birch, although certain zones permit limited human activities. The park provides habitat for wildlife such as musk deer and sable[24]. Owing to its stricter protection and lower large-herbivore density, grazing intensity in BKU is considerably lower than in HNP. Together, the contrasting herbivore pressures alongside broadly similar climatic settings provide a useful natural framework for disentangling the relative influences of grazing and climate on grassland dynamics.
Climate data
-
The spatial and temporal vegetation dynamics were assessed using Terra Moderate Resolution Imaging Spectroradiometer (MODIS) product H25V04. MODIS data was obtained in HDF-EOS format, with a sinusoidal projection. The MODIS Reprojection Tool was employed for image mosaic conversion, resampling, and projection transformation. The original HDF file was converted to GeoTIFF format, and the projection was transformed from sinusoidal to Albers Conical Equal Area, using the WGS 1984 datum. The nearest neighbor method was used for resampling. The vector boundary of the study area was used to clip the NDVI data in ArcMap 10.8.2. The vegetation changes were calculated using the Raster Calculator tool. Vegetation conditions were characterized using NDVI thresholds in grassland classification ranges for Northern Tibet between 2000 and 2013[28]. In that framework, NDVI values of 0.15–0.20 are typically associated with alpine steppe dominated by grasses and short sedges, whereas values of 0.40–0.50 correspond to alpine meadow vegetation characterized by shrubs, sedges, and medium-height grasses. NDVI values near 0.20 have also been linked to forb-dominated communities. These NDVI thresholds were applied as a relative indicator of vegetation density, as the alpine and semi-arid grasslands of Northern Tibet share broadly similar climatic conditions and vegetation characteristics with the Mongolian steppe[29]. However, no local validation data is available for the study area; therefore, these thresholds should be considered a first-order, coarse approximation, and may introduce uncertainty. In this study, NDVI values < 0.20 were interpreted as sparse or early-stage vegetation, 0.30–0.40 as grass- and forb-dominated cover, 0.40–0.50 as subshrub or shrub vegetation, and > 0.60 as areas with dense vegetation typically associated with forest cover. Notably, the classification was intended to provide a broad indicator of vegetation structure rather than a definitive separation of plant functional types.
Meteorological data focusing on vegetation growth months (May–August) were analyzed. Global precipitation measurement data from 2000 to 2021 was sourced from NASA's GES DISC (Goddard Space Flight Center). The NDVI, land surface temperature (LST), and net primary production (NPP) data was obtained from NASA's LP DAAC at the USGS EROS Center. NDVI data was derived from the MODIS MOD13Q1 V6.1 product, with a temporal resolution of 16 d and a spatial resolution of 250 m, covering the period from 2000 to 2023, with a focus on vegetation growth months (May–August). The daily LST data were obtained from the MOD11A1.061 product, with a spatial resolution of 1 km, covering the period from 2000 to 2023. Monthly NPP data, extracted from the MODIS MOD17A3HGF V6.1 product had a spatial resolution of 500 m and covered the period from 2001 to 2022.
Due to differences in satellite data availability and temporal coverage, climate anomalies were calculated as the deviation of annual values in 2019 from the long-term mean (2001–2021). Standard deviations and Z-scores were subsequently used to determine whether climatic conditions in 2019 fell within the range of historical variability (Supplementary Table S2).
Field sampling
-
The research followed the geobotanical basic observation method, which involves percentage-based evaluation within a 1 m2 frame[30]. Plant cover was visually estimated as a percentage within each quadrat (1 m × 1 m net). Aboveground biomass was collected by clipping all plant material from the ground surface at the same level and subsequently separated into new (green) biomass and old grass/litter components. Samples were air-dried for 2–3 weeks until constant weight and then weighed to determine dry biomass, expressed as g·m−2. Vegetation height, cover, and biomass measurements were repeated three to four times per season to capture seasonal variability.
Artemisia frigida, a C3 perennial semishrub, is one of the most common dicotyledonous species on the Eurasian steppes[31]. Stipa krylovii, a C3 type monocotyledon perennial bunchgrass, is another dominant species on the Inner Mongolian Plateau steppes[32]. The dominant plant species, i.e., S. krylovii and A. frigida, were collected from each plot during the winter and spring (Supplementary Table S1). The identification process began with standard taxonomic classification in the field, followed by DNA sequencing of the rbcL and matK regions (Macrogen Inc., Seoul, South Korea) to confirm species identity (Supplementary Tables S3, S4). Sequencing results, including species identity, are provided in Supplementary Table S5. Notably, the DNA sequencing results were matched to species in the BLAST database[33]. If an exact species match was unavailable, then the results indicated the closest matching genus instead.
Soil and plant samples were collected according to the season in 2019, as listed in Supplementary Table S1. Topsoil samples were oven-dried at 105 °C for 1 d and sieved using a 200-mesh sieve for chemical, physicochemical, and elemental analysis (Supplementary Tables S6−S8). Soil pH and electrical conductivity were measured in a soil-to-water suspension at a 1:2.5 ratio using a pH meter (S47; Mettler Toledo), and an electrical conductivity meter (B-173; HORIBA). Soil humus and organic C concentrations were determined using the I.V. Turin method and the loss-on-ignition method[34], respectively.
Field sample digestion and analysis
-
Selective grazing can modify species dominance, potentially reshaping nutrient pathways within grassland ecosystems. To better understand these soil–plant nutrient linkages, concentrations of major elements (Na, Mg, Al, P, K, Ca, Mn, and Fe) in both soil and plant samples were investigated. Soil samples (200 mg) were subjected to aqua regia digestion according to the USEPA 3050B method[35]. Plant samples were freeze-dried for 3 d at 70 °C, then ground and sieved using a 0.84-mm mesh sieve[36]. All the samples were filtered through a 0.45-µm filter membrane before measurements.
Liquid samples were measured using an inductively coupled plasma–optical emission spectrometer (iCAP7400DUO; Thermo Scientific). The accuracy of the extraction process was validated by analyzing standard reference materials (BAM U110, SRM 1515, and SRM 1570a), with recoveries ranging from 80.51% to 103.78% (Supplementary Table S9). The accumulation factor was used to evaluate the transfer of elements from soil (Supplementary Table S8) to plant leaves. It was calculated as the ratio of elemental concentrations in the harvested aboveground plant biomass to those in the topsoil[37]. Elemental concentrations of C, N, and H were measured using a UNICUBE elemental analyzer (Elementar, Germany) equipped with a thermal conductivity detector. Approximately ≤ 1 g of dried, homogenized material was combusted at 1,150 °C, and the resulting gases were separated chromatographically prior to detection. The analyzer operates over a range of ~50 μg/g to 100% with a precision better than 0.1%.
Statistical analyses
-
All statistical analyses were performed using IBM SPSS Statistics v20 for Windows. The Kruskal–Wallis test was applied to determine whether seasonal fluctuations in elemental concentrations in soils and plants were significant at the 95% confidence level (p < 0.05). To explore the relationship between soil properties, climate conditions, and elemental accumulation in plants, Spearman's rank correlation analysis was conducted on both A. frigida (n = 11) and S. krylovii (n = 12).
-
Figure 2 illustrates a shift in vegetation types in HNP, with a transition from subshrubs/shrubs to grasses/forbs, accompanied by the northward expansion of the forest steppe. In contrast, BKU exhibited forest expansion toward the east from 2001 to 2023. To quantify these changes, the raster calculator was used to assess the extent of vegetation expansion (positive raster values, shown in green in Fig. 2) and decline (negative raster values, shown in red in Fig. 2) across each park between 2001 and 2023. Spatial distribution analysis using landscape vegetation classification revealed a marginal increase in vegetation in BKU. Specifically, vegetation growth in HNP was 21.3%, while BKU showed a 41.7% increase, indicating more pronounced growth in BKU. However, both parks also experienced a reduction in vegetation area from 2001 to 2023. HNP experienced a 40.7% decrease, while BKU saw a relatively smaller reduction of 22.7%. Notably, the subtraction in change detection highlighted finer differences in NDVI values, with areas having NDVI > 0.6 shaded in blue. These areas, although significant in the raster analysis, were less visible in the image.
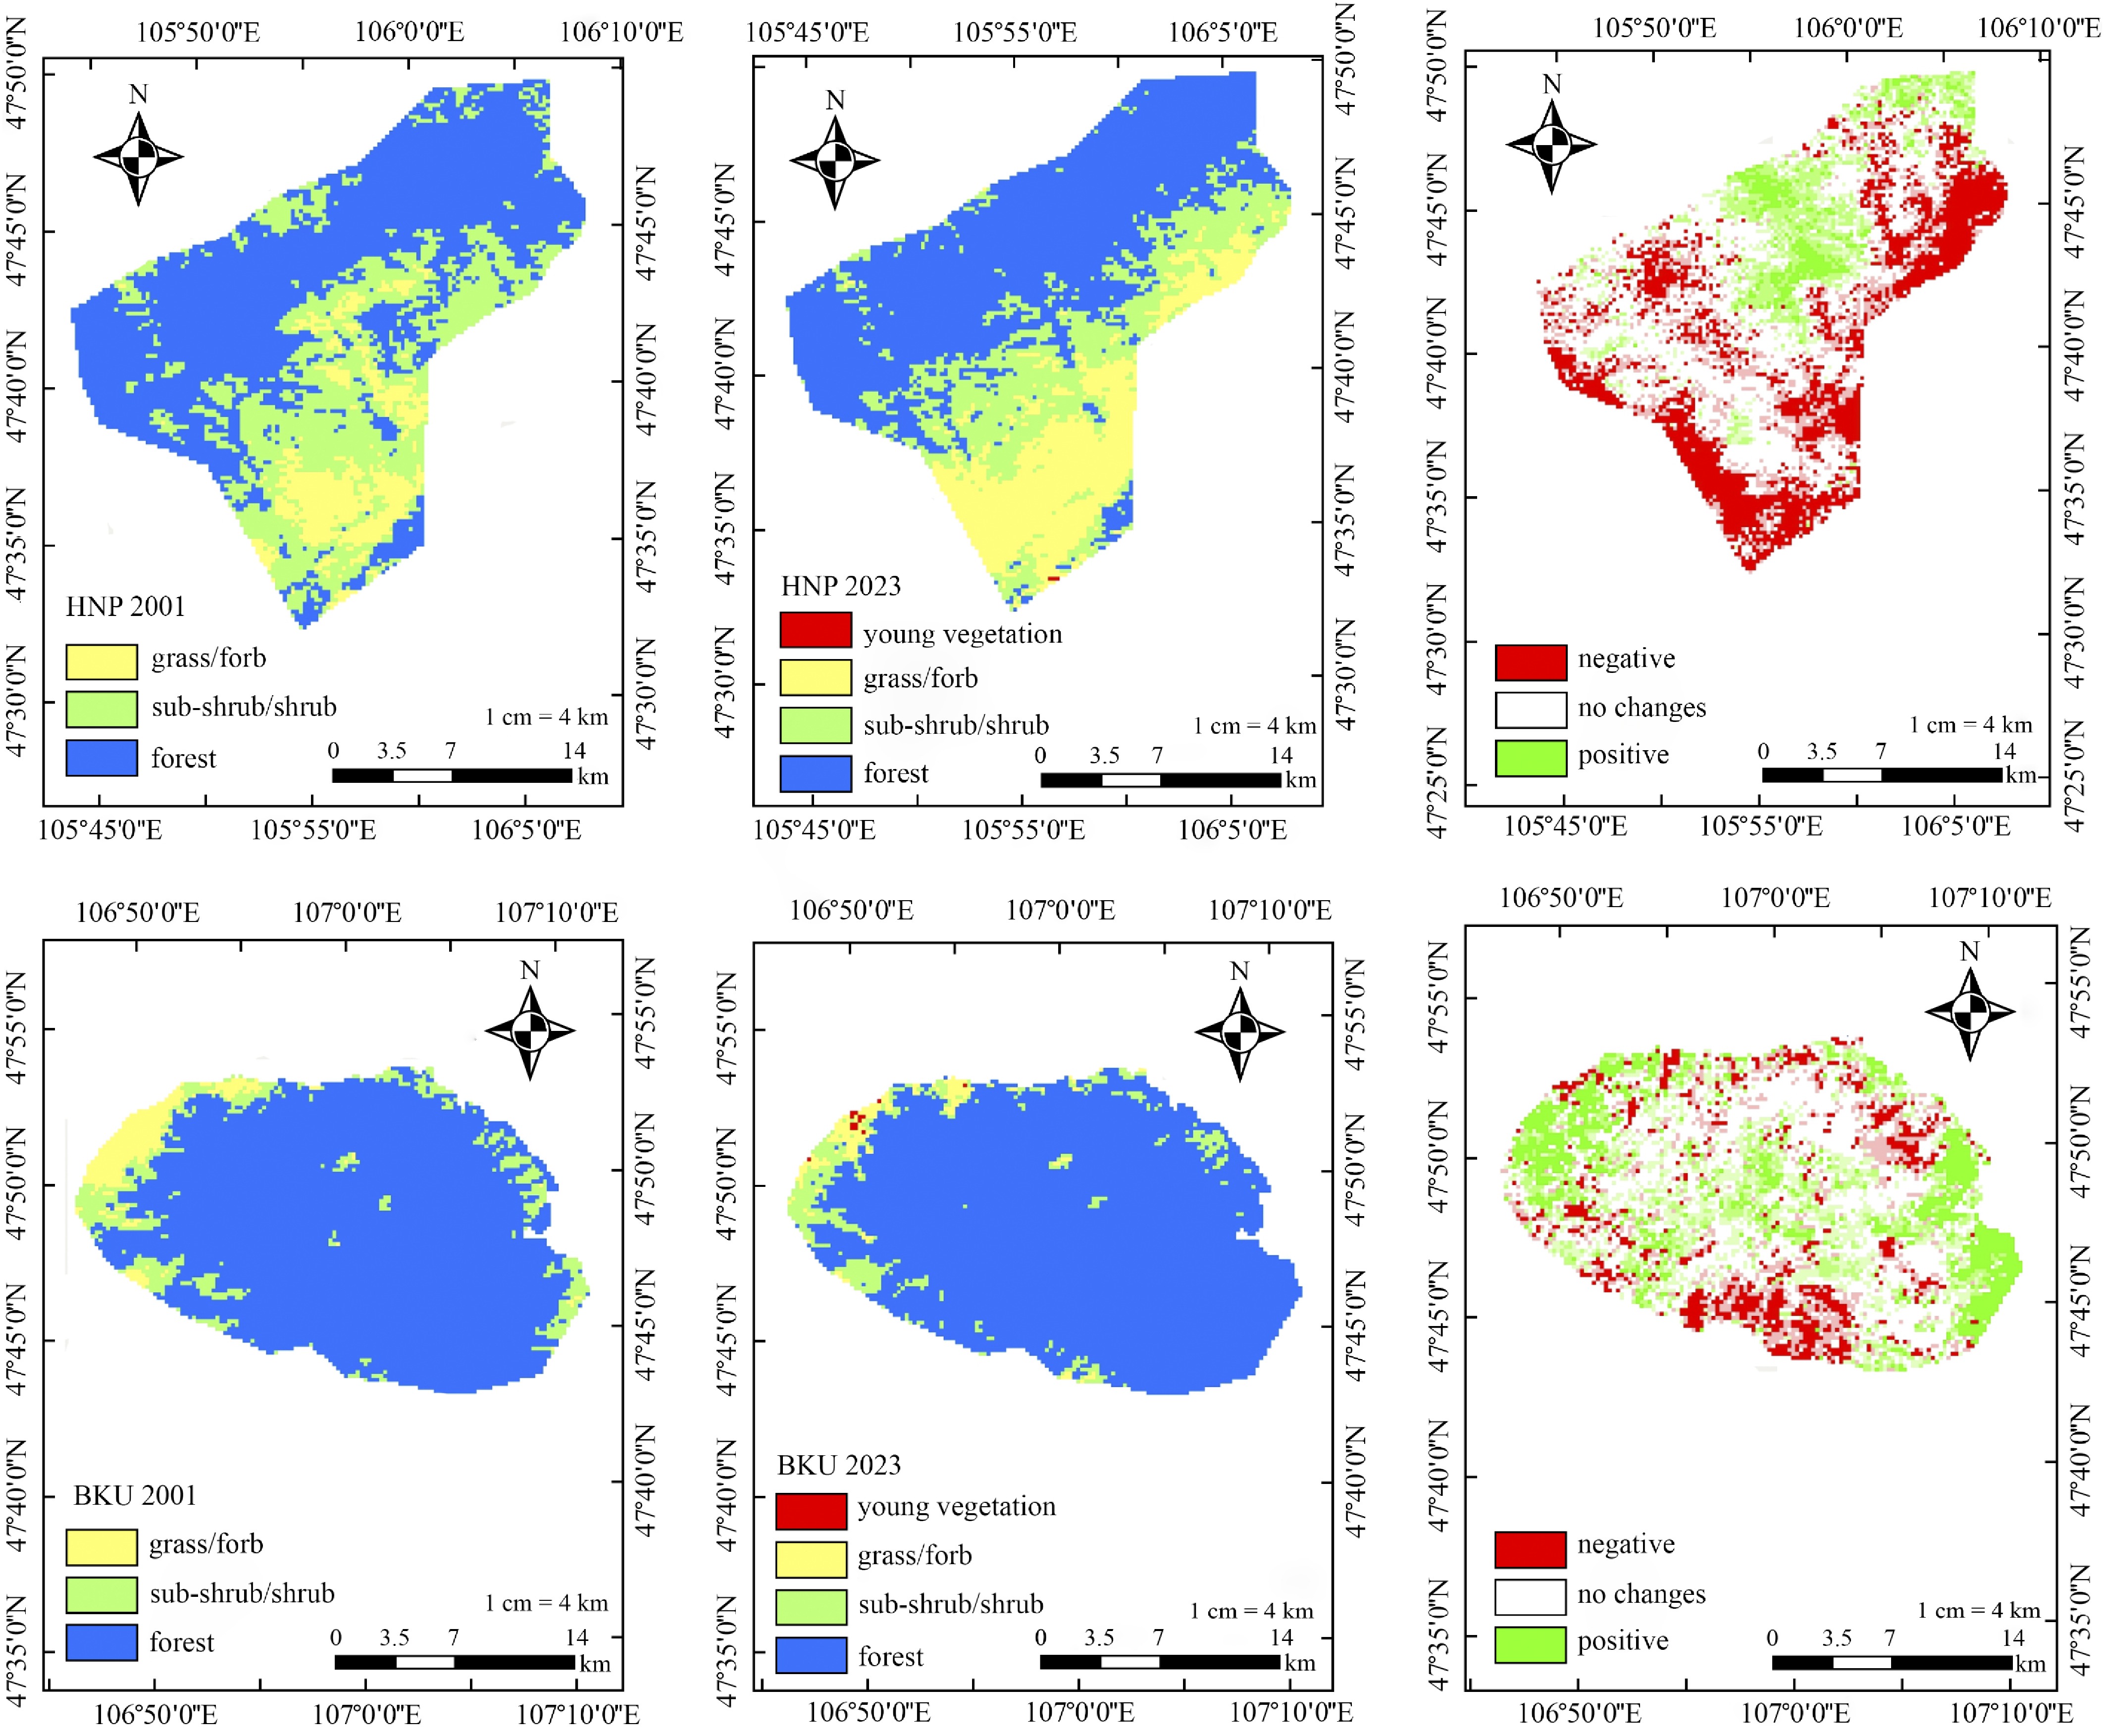
Figure 2.
Spatial distribution of Normalized Difference Vegetation Index (NDVI) in Hustai National Park (HNP) and Bogd Khan Uul National Park (BKU) for July 2000 (left) and July 2023 (middle). NDVI values are categorized as follows: > 0.6 for forest, 0.4–0.5 for subshrubs/shrubs, 0.3–0.4 for grass/forbs, and > 0.2 for young vegetation. The corresponding changes in NDVI between 2001 and 2023 are shown on the right, where negative values indicate vegetation loss, a value of 0 represents no change, and positive values indicate vegetation expansion.
Annual NDVI during the growing months (May to August) exhibited distinct patterns between the two parks. In BKU, average NDVI values during these months typically ranged from 0.5 to 0.6, showing a slight growth trend. In contrast, HNP displayed a more monotonous NDVI, ranging from 0.3 to 0.4 (Supplementary Fig. S1d). From 2000 to 2023, precipitation and LST followed opposite trends (Supplementary Fig. S1a, S1c). Although both parks received similar amounts of precipitation, daytime LST in BKU was approximately 10 °C lower than in HNP. Over this period, daytime LST in both parks showed an overall downward trend, although HNP recorded peak temperatures of 38.1 °C in 2007 and 38.6 °C in 2017. Conversely, precipitation increased from 2000 to 2021, with the lowest level recorded in 2015.
To further investigate the relationship between NDVI, temperature, and precipitation, changes in LST and precipitation between consecutive years were analyzed (Fig. 3). The results showed that changes in NDVI and NPP were positively correlated with precipitation, with a stronger correlation in HNP than in BKU. However, the correlation between precipitation changes and NDVI was relatively weak (R2 = 0.08) in BKU, suggesting limited influence of precipitation on vegetation distribution in that park. In contrast, changes in temperature exhibited a stronger correlation with NDVI and NPP in both parks. Specifically, a positive change in LST (indicating rising temperatures) was associated with a decrease in NDVI, suggesting that rising temperatures contribute to vegetation stress and a decline in vegetation cover.
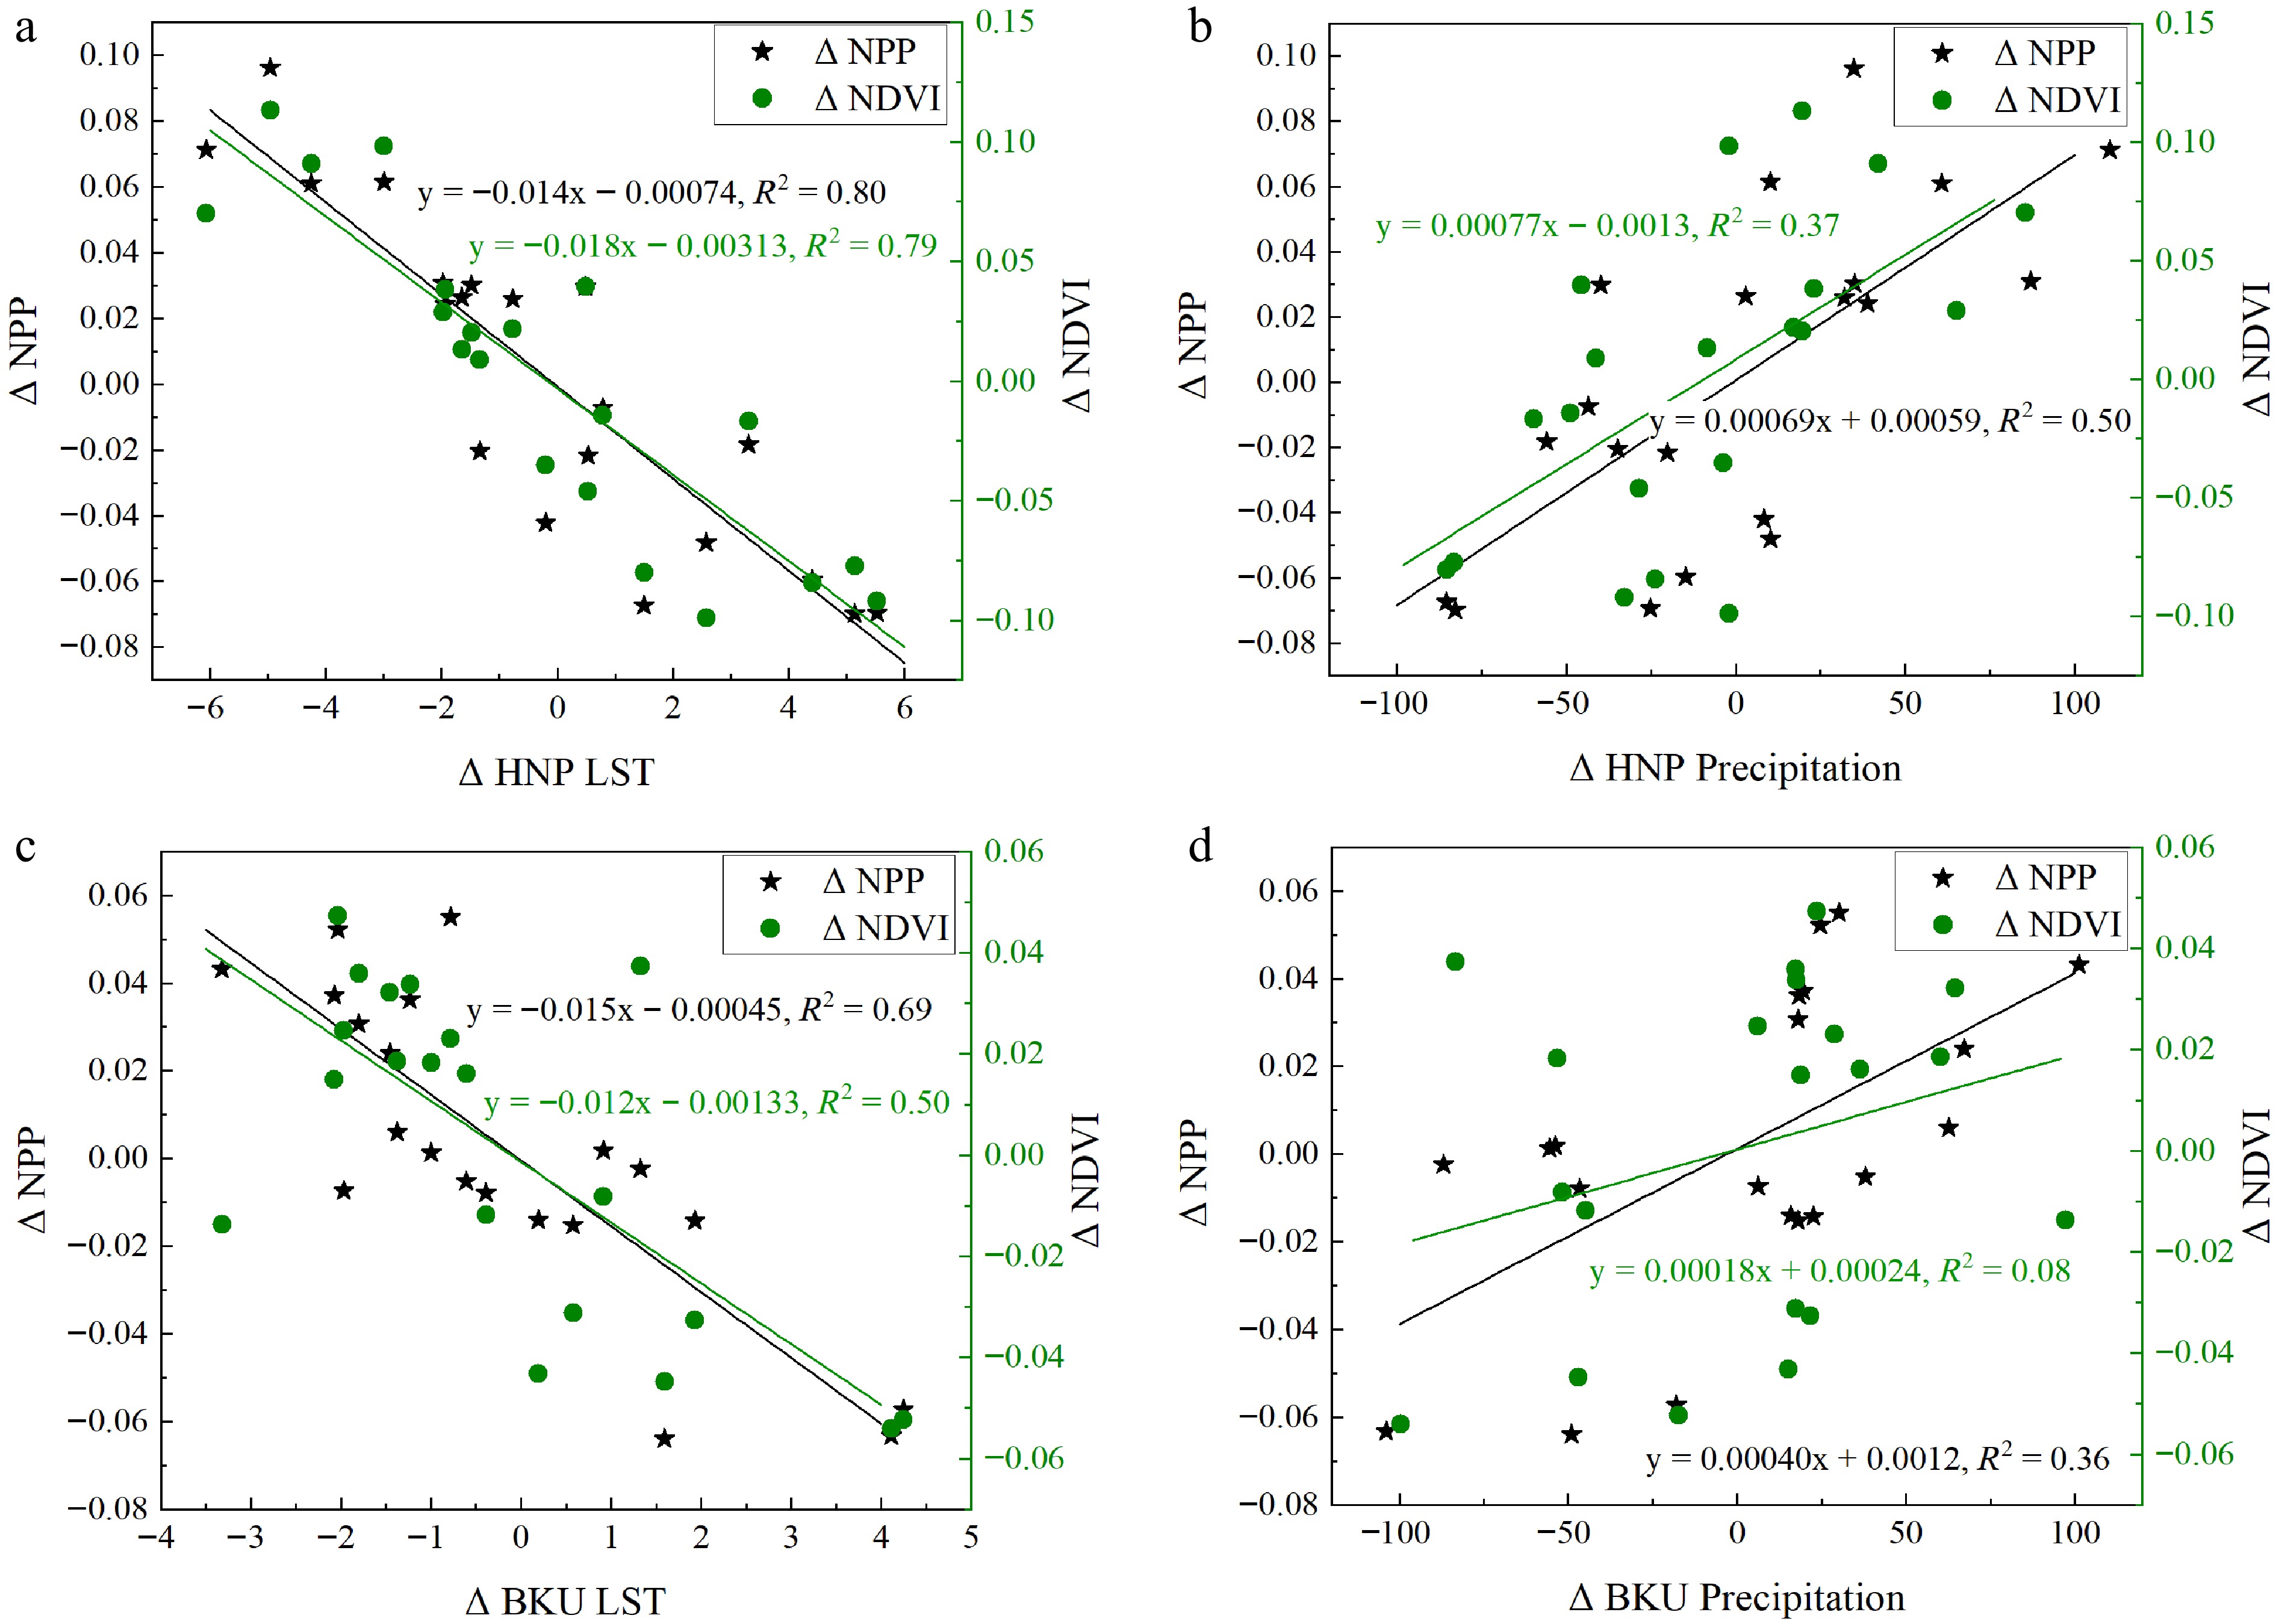
Figure 3.
Interannual variation in LST and precipitation and their effects on net primary productivity (NPP) and Normalized Difference Vegetation Index (NDVI) in Hustai National Park (HNP) and Bogd Khan Uul National Park (BKU) during the growing season (May to August) from 2001 to 2021. (a) LST in HNP, (b) precipitation in HNP, (c) LST in BKU, and (d) precipitation in BKU.
Overall, both precipitation and temperature influenced NDVI and NPP, with temperature emerging as the primary climatic factor affecting vegetation cover in both HNP and BKU (Fig. 3, Table 2). The marginal increase in vegetation in BKU was supported by a downward trend in LST. Annually, HNP produced 220 g C m−2 of NPP, while BKU produced 320 g C m−2 during the summer. From 2001 to 2022, the relationship between LST and NPP indicated that a 1 °C increase in LST resulted in a reduction of 14.07 g C m−2 in HNP and 15.45 g C m−2 in BKU.
Table 2. Correlation coefficients of Normalized Difference Vegetation Index (NDVI) and Net Primary Productivity (NPP) during the growing season in response to daytime Land Surface Temperature (LST) and precipitation in Hustai National Park (HNP) and Bogd Khan Uul National Park (BKU).
Correlativity HNP NDVI BKU NDVI HNP NPP BKU NPP Day time LST −0.89 −0.72 −0.89 −0.84 Precipitation 0.61 0.29 0.70 0.60 Biomass responses to grazing
-
Dung cover was generally higher in grazed (site ended with '−2') plots compared to ungrazed (fenced) plots during spring, indicating increased herbivore activity in the growing season. This pattern was consistent across most sites, with the exception of site 3-2, where dung cover did not follow the overall trend (Fig. 4a). Dried plant cover was consistently greater in ungrazed plots relative to grazed plots across both seasons (Fig. 4b), suggesting accumulation of standing dead vegetation under grazing exclusion. Seasonal differences in dried plant cover were less pronounced and did not exhibit a consistent pattern across sites. Net primary production (NPP) of new biomass was negligible during winter across all sites but increased substantially in spring (Fig. 4c). In most sites, spring NPP values were comparable between grazed and ungrazed plots; however, site 2 exhibited higher NPP under grazing, whereas site 3 showed the opposite pattern. Litter/old biomass was consistently higher in ungrazed plots compared to grazed plots (Fig. 4d). Seasonal variation in litter biomass was less systematic, with site-specific differences observed between winter and spring.
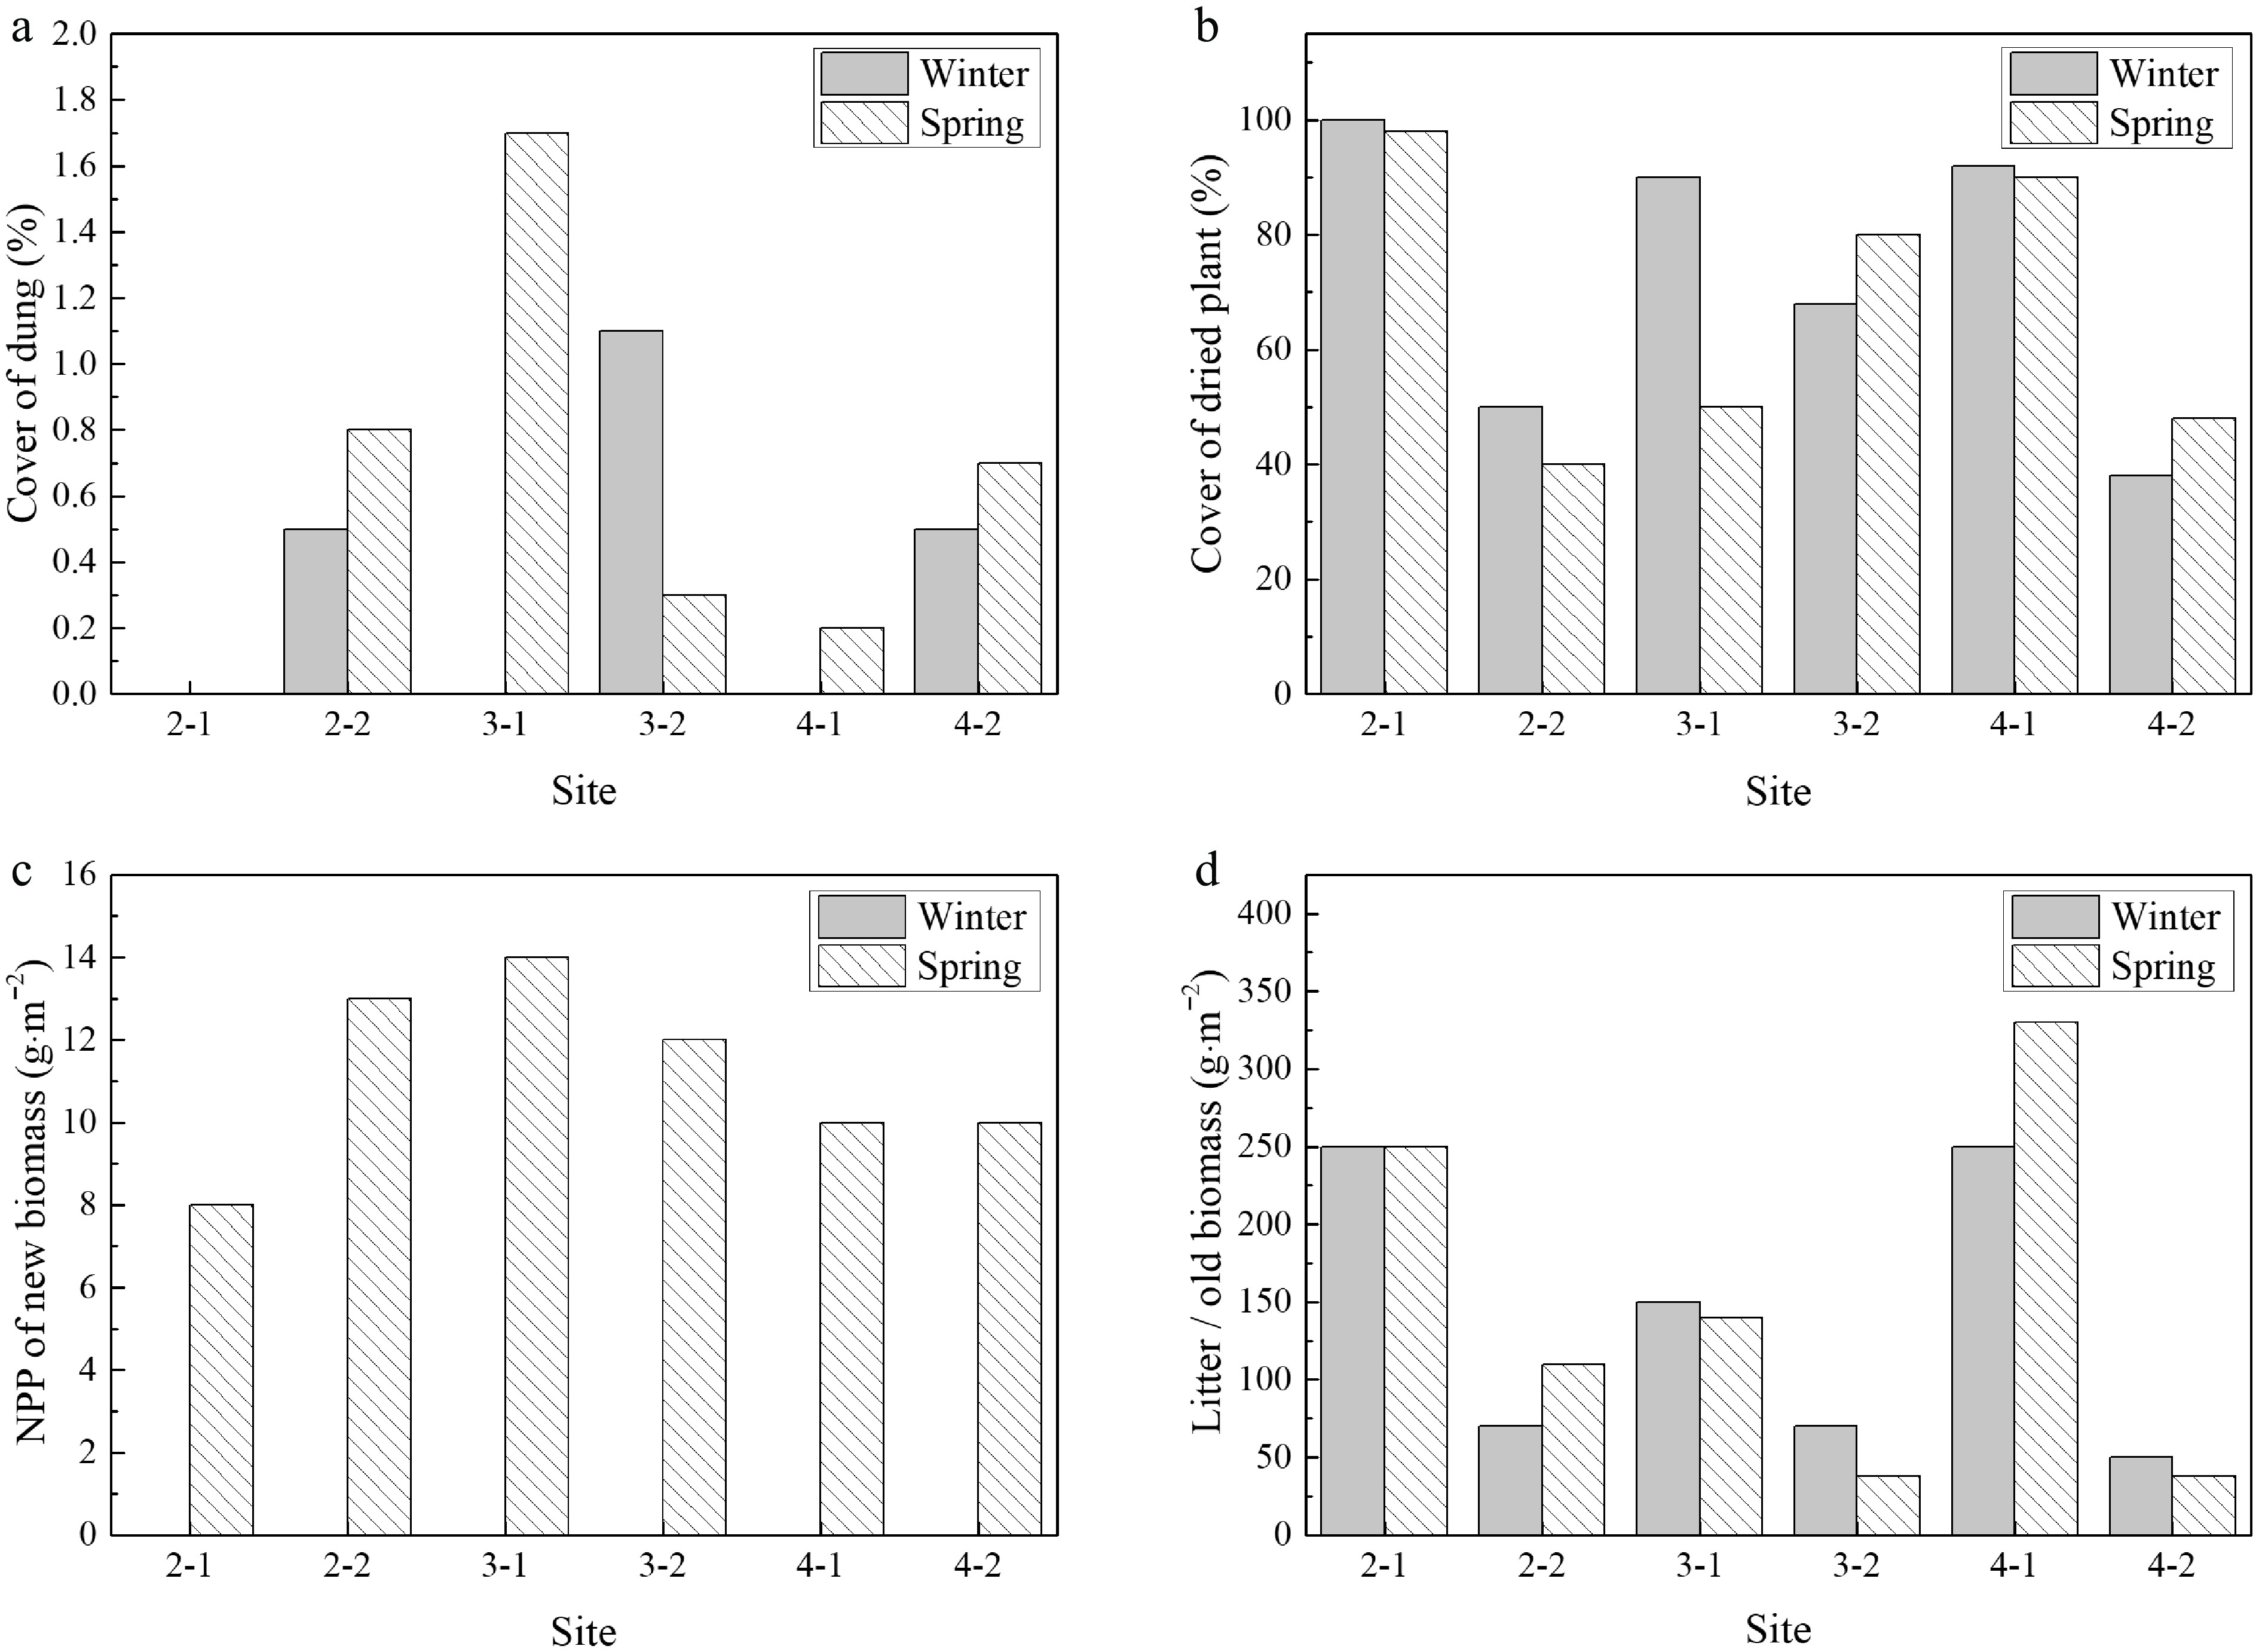
Figure 4.
Seasonal effects of grazing on vegetation structure and biomass. Comparisons between fenced (ungrazed) and unfenced (grazed) plots during winter and spring for (a) dung cover (%), (b) dried plant cover (%), (c) net primary production (g·m−2), and (d) litter/old biomass (g·m−2). The site ending with '−2' indicates a grazing site.
Variation in plant nutrient concentrations
-
Two major plant species—S. krylovii (palatable) and A. frigida (unpalatable)—were selected based on a previous plant species distribution report[38]. Elemental composition analysis revealed that total N and C concentrations were higher in the spring than in the winter, ranging from 0.40% to 2.91% for N and from 41.66% to 45.29% for C. Both plant species exhibited similar total amounts of C, N, H, and P. Although there was no variation in total C between the two species (Table 3), A. frigida showed higher N concentrations than S. krylovii in the winter, whereas the opposite trend was observed in spring.
Table 3. The average content of elements (%) in plants of Hustai National Park (HNP), Mongolia.
Site Winter Spring N (%) C (%) H (%) P (%) C : N ratio N (%) C (%) H (%) P (%) C : N ratio A. frigida 2-1 0.55 43.57 6.42 0.08 78.79 − − − − − 2-2 0.88 45.69 6.48 0.21 51.74 0.41 45.66 6.41 0.04 110.47 3-1 1.02 42.47 6.28 0.21 41.64 1.11 42.58 6.35 0.20 38.47 3-2 0.76 45.68 6.27 0.14 60.11 0.41 46.34 6.54 0.06 113.95 4-1 − − − − − 0.67 43.07 6.20 0.16 63.97 4-2 0.63 44.16 6.30 0.11 69.76 1.23 43.63 6.43 0.30 35.47 7 − − − − − 1.92 42.25 6.33 0.35 22.04 S. krylovii 2-1 0.47 41.66 6.00 0.03 89.20 − − − − − 2-2 0.40 44.32 6.14 0.04 111.63 0.49 43.81 6.49 0.03 88.81 3-1 0.60 42.36 6.13 0.04 70.95 0.85 43.92 6.39 0.08 51.88 3-2 0.82 42.25 5.97 0.07 51.71 1.27 43.92 6.47 0.13 34.67 4-1 0.54 42.18 5.86 0.05 77.69 − − − − − 4-2 0.46 43.84 5.96 0.03 95.31 2.35 44.79 6.46 0.33 19.09 7 0.42 42.49 6.13 0.10 100.46 2.91 45.29 6.76 0.33 15.55 N, nitrogen; C, carbon; H, hydrogen; P, phosphorus. Seasonal variations influenced the uptake of major mineral elements, but these trends were not consistent across all sites. Overall, A. frigida showed higher concentrations of most elements compared with S. krylovii, except for Na, P, and Ca. Notably, Ca content was 1.5 times higher in S. krylovii than in A. frigida. Among the elements, Fe was four times more concentrated in A. frigida than in S. krylovii (Fig. 5). There were no significant seasonal differences in the major elements of S. krylovii (n = 12) and A. frigida (n = 11) between winter and spring, as determined by the Kruskal–Wallis test. The seasonal distribution of elements and significant differences between the two species are summarized in Supplementary Table S10.
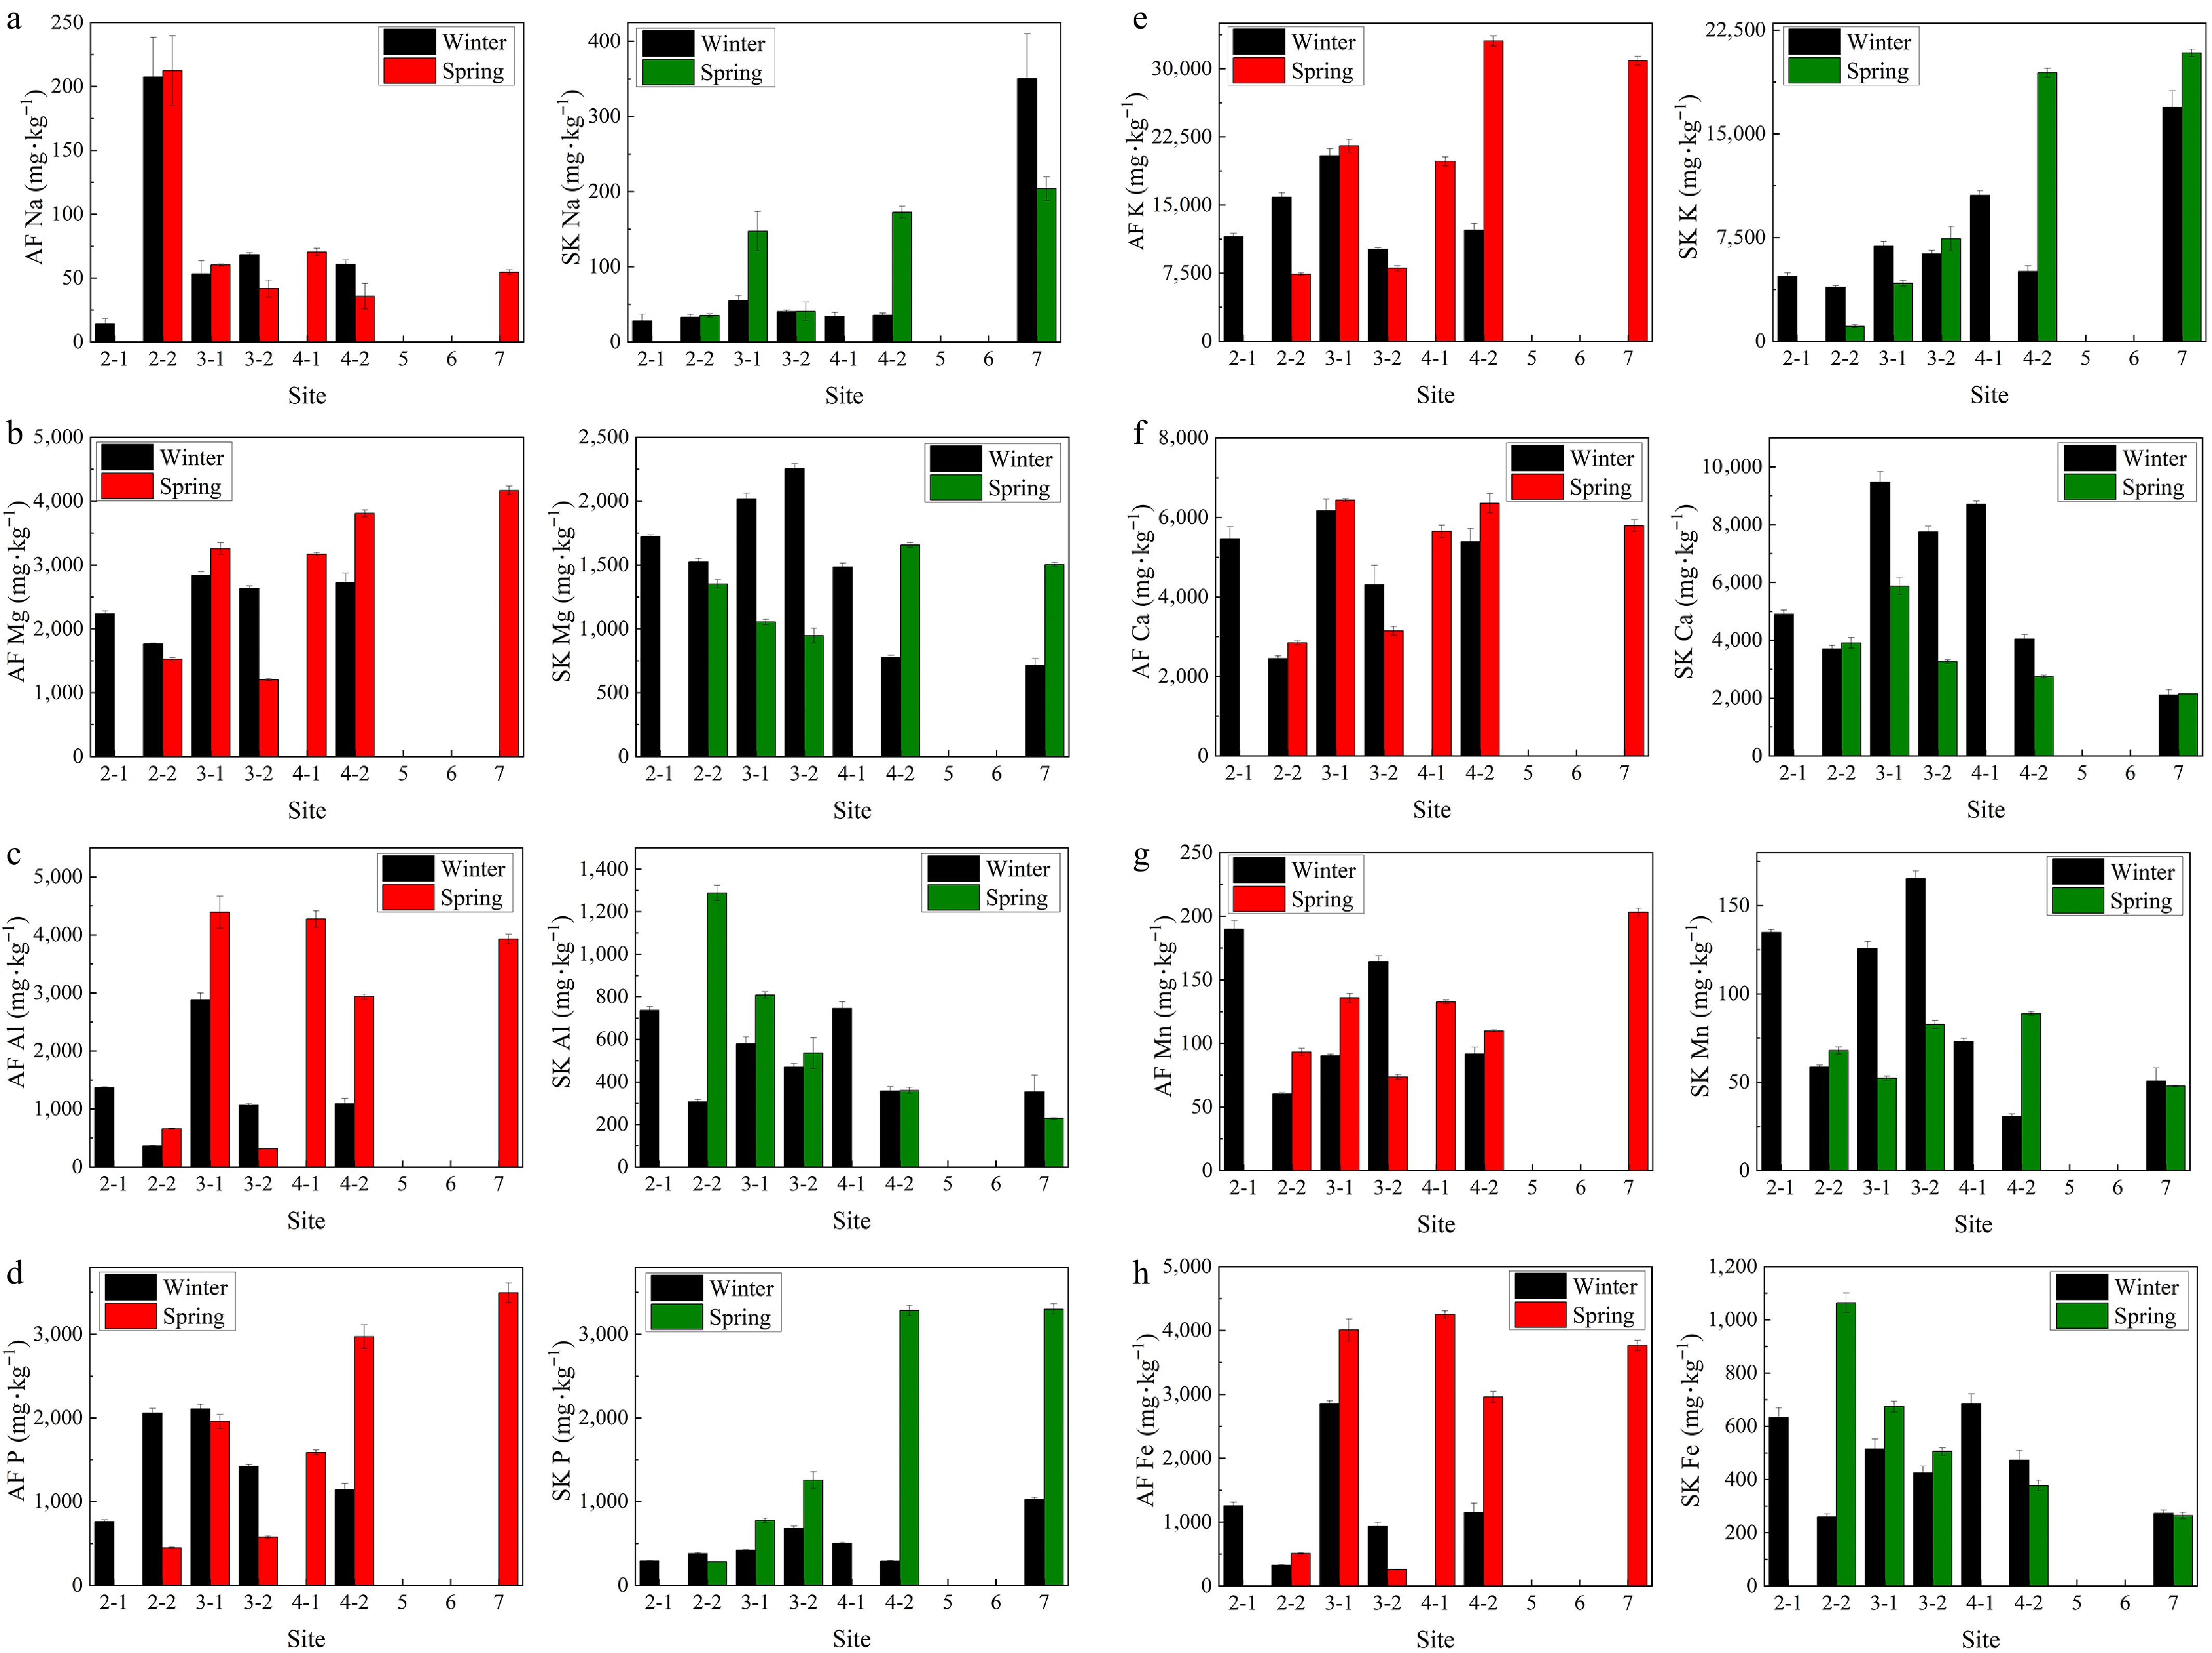
Figure 5.
Concentration of major elements (in mg·kg−1) in Artemisia frigida (red) and Stipa krylovii (green) in Hustai National Park (HNP), Mongolia, during winter and spring for (a) sodium Na, (b) magnesium Mg, (c) aluminium Al, (d) phosphorus P, (e) potassium, K (f) calcium Ca, (g) manganese Mn, and (h) iron Fe.
The fenced site indicated significant animal disturbance, and site 3 (Figs 4, 5) was selected to specifically investigate the impact of animal disturbance on nutrient uptake in both plant species during spring. Among the eight elements examined, the animal disturbance zone (sites ending in '−2') in the spring promoted the uptake of P, Mn, and K in S. krylovii, a palatable species, while higher concentrations of Na, Al, Fe, Mg, and Ca were observed in the area with limited animal disturbance (site 3-1). Similar trends were observed in winter for S. krylovii, with higher concentrations of P, Mn, and Mg at site 3-2 compared to site 3-1. In contrast, A. frigida, an unpalatable species, showed higher concentrations of Na, P, Al, Mn, Fe, K, Mg, and Ca at site 3-1 (area without animal disturbance) compared to site 3-2 in the spring. This trend was consistent with the concentrations of Al, Fe, Mg, and Ca found in winter samples. Other elements showed opposite trends between sites, suggesting random variability in the results, which were therefore not considered.
To examine how elemental accumulation in plants relates to climatic variables, biomass, and soil properties, Spearman's rank correlation analyses were conducted for A. frigida (Supplementary Table S11) and S. krylovii (Supplementary Table S12), with key relationships illustrated in a network diagram (Fig. 6). A complex soil–plant interaction, particularly interspecific relationships, was observed in relation to climate variables, soil properties, and elemental concentrations. For example, A. frigida exhibited a stronger correlation between P accumulation and N content (rs[20] = 0.955, p < 0.001) than S. krylovii (rs[20] = 0.645, p < 0.005). A positive correlation between soil N and Mg accumulation in A. frigida (rs[20] = 0.630, p < 0.005) was observed, while a negative correlation between soil N and Ca accumulation in A. frigida (rs[20] = −0.700, p < 0.005) was noted. In contrast, a positive correlation between soil N and Fe accumulation in S. krylovii (rs[20] = 0.669, p < 0.005) was observed. Overall, S. krylovii showed significant positive correlations between soil loss-on-ignition (LOI) and the accumulation of Mg, K, and Ca. In contrast, A. frigida elemental composition was correlated with nutrient accumulation only. Soil elemental composition was significantly associated with dried plant cover and old biomass in both species. Notably, plant elemental composition in S. krylovii was correlated with climatic variables, new biomass, and soil humus, whereas no comparable relationships were observed for A. frigida. Humus content in the soil was positively correlated with precipitation, temperature, and new biomass.
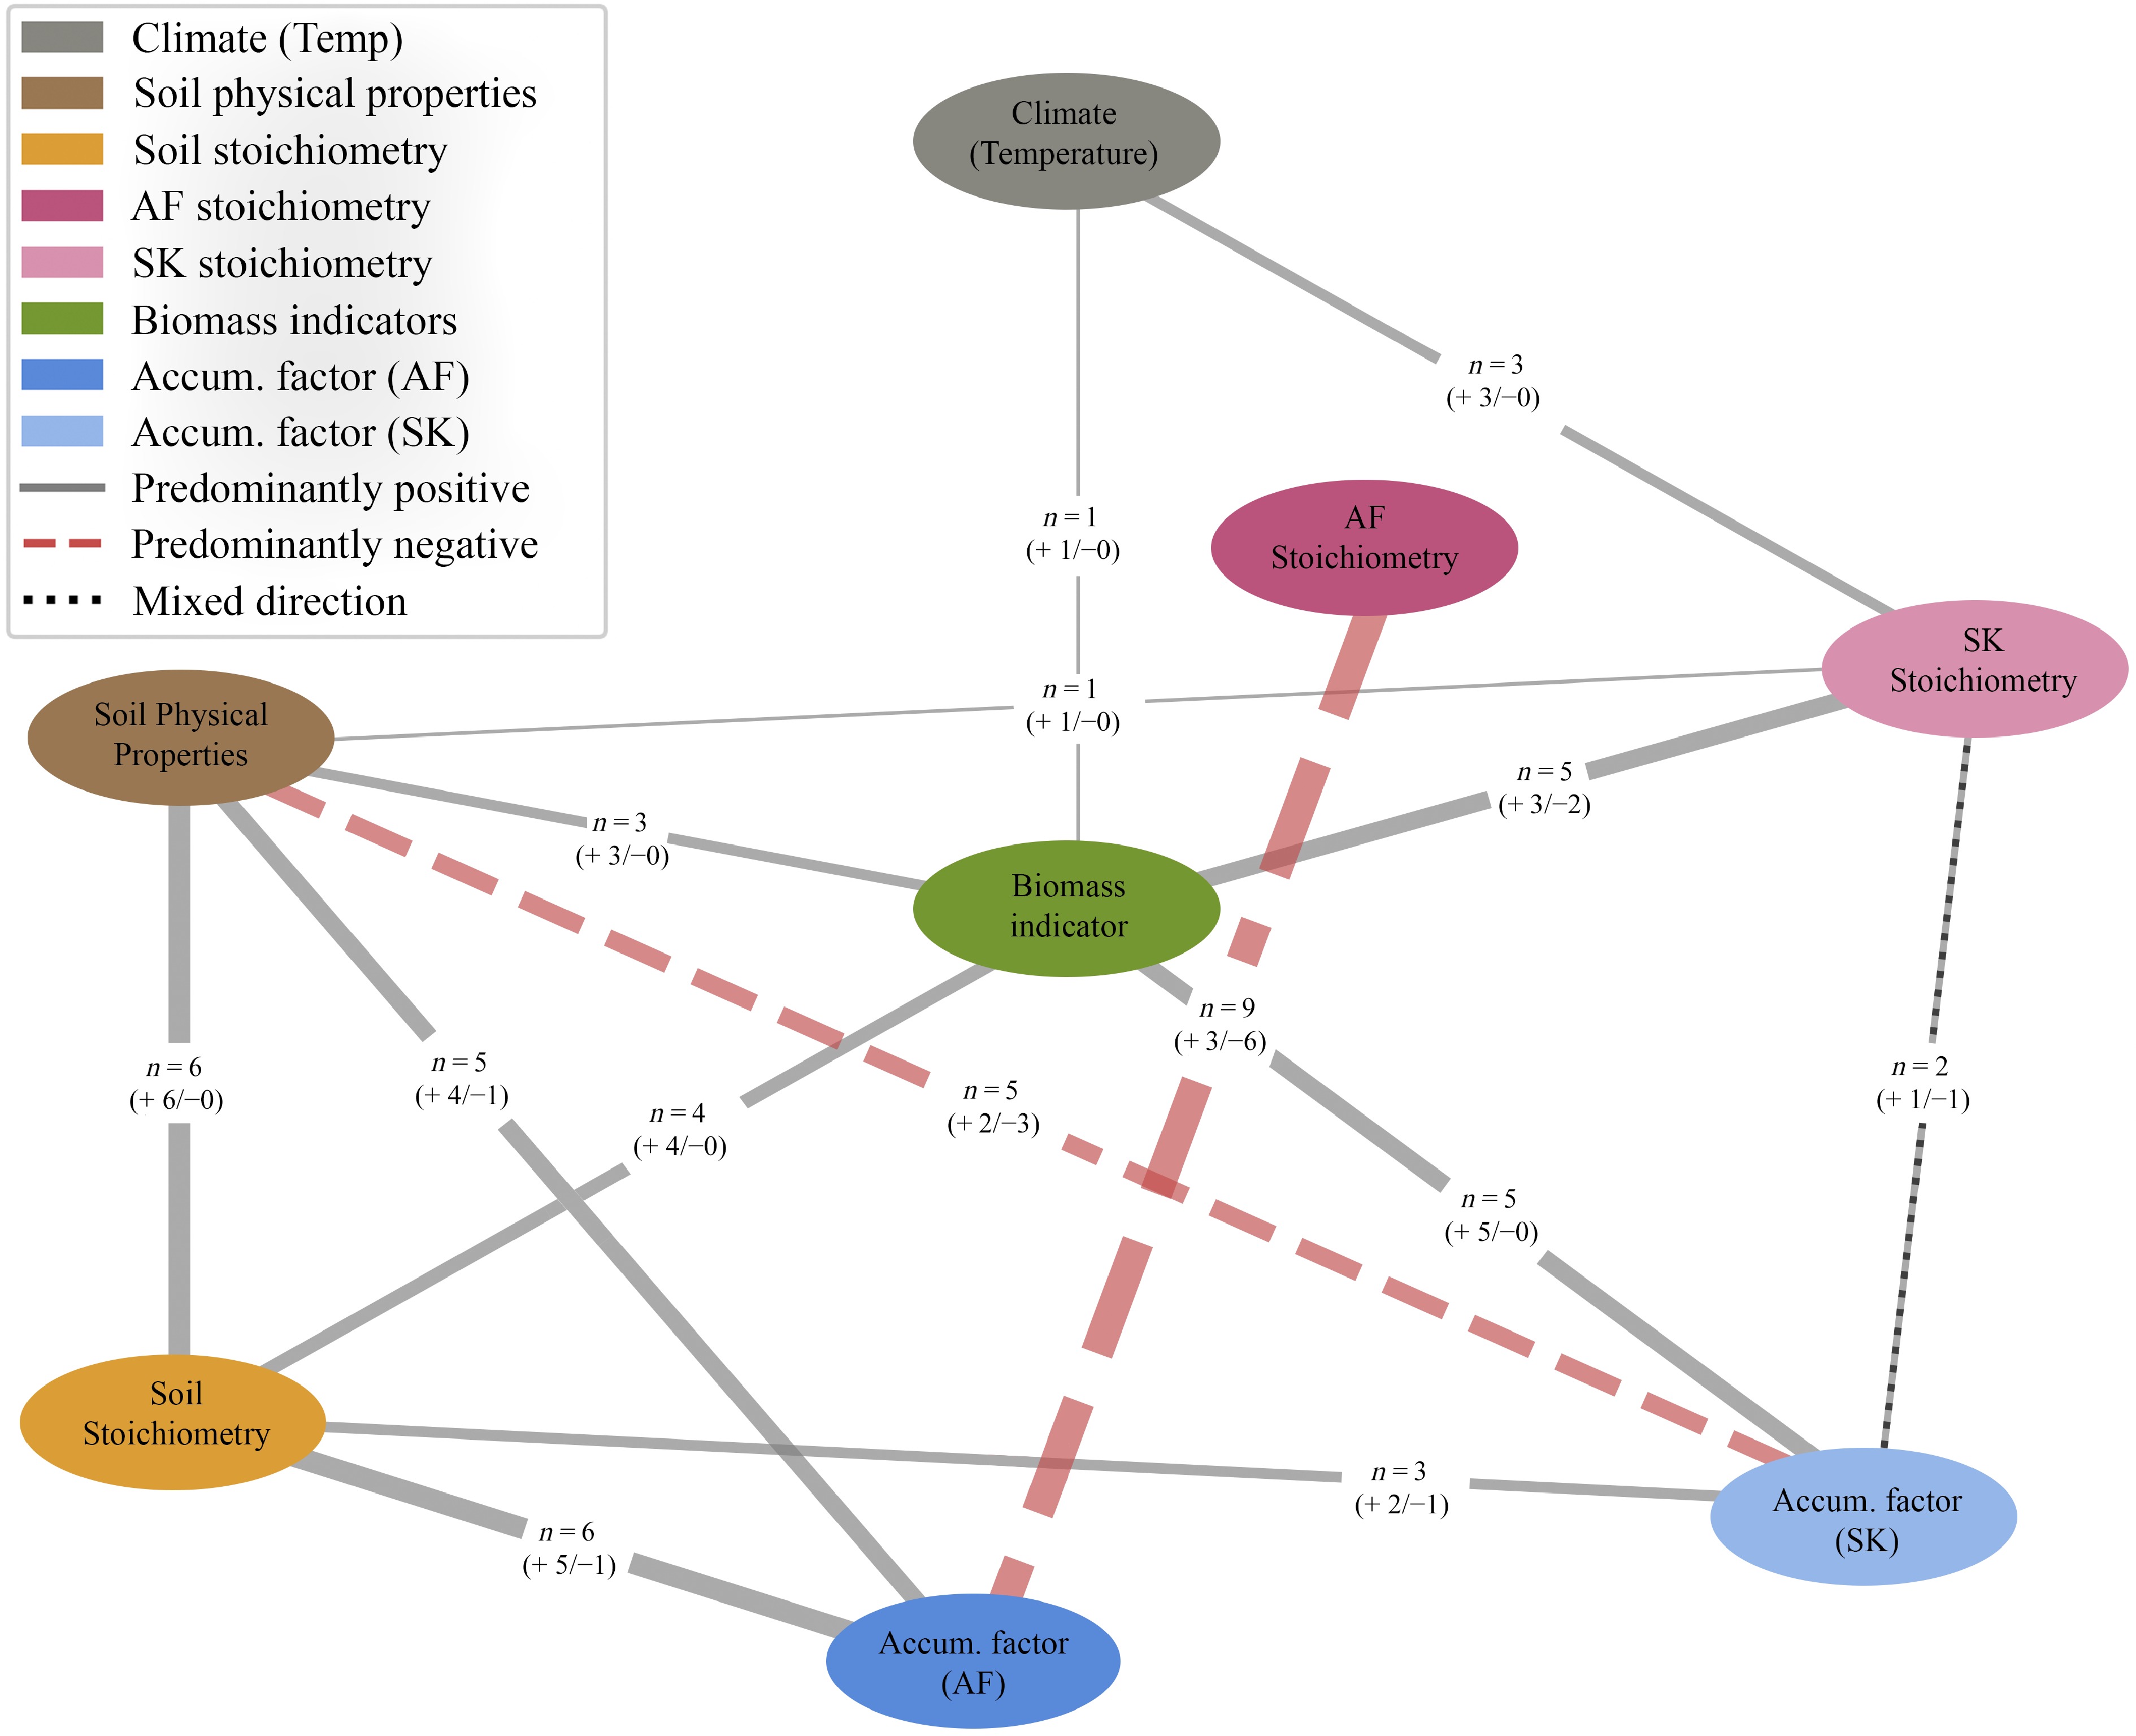
Figure 6.
Simplified soil-plant-climate network diagram derived from significant Spearman's rank correlation coefficients for Artemisia frigida (AF) and Stipa krylovii (SK). Each node represents a variable group whose components are detailed in Supplementary Tables S11, S12. Precipitation was excluded due to its perfect inverse correlation with temperature (ρ = −1.00). Only correlations with |ρ| ≥ 0.5 and p < 0.05 are shown. Edge width is proportional to the number of significant variable pairs (n) between node groups, with solid and dashed lines indicating predominantly positive and negative correlations, respectively.
-
Grasslands, shrublands, and forests represent some of the most widespread terrestrial vegetation types, each characterized by distinct structural dominance. Grasslands are primarily composed of herbaceous species, whereas shrublands and forests are dominated by woody vegetation such as shrubs and trees. Long-standing ecological theory suggests that climate is a primary determinant of their spatial distribution, often resulting in predictable transitions along environmental gradients[39]. The NDVI-based analysis of vegetation dynamics and shifts in this study aligns with similar findings in Inner Mongolia[40] and Tibet[28], where comparable vegetation distributions have been observed. A study from Northern Mongolia reported a trend of forest sites being replaced by steppe vegetation, suggesting potential land degradation[20]. Additionally, our observation of a shift from subshrubs and shrubs to grasses (e.g., S. krylovii) and forbs (e.g., A. frigida) in HNP further underscores ongoing ecological change. A nationwide study of vegetation cover in Mongolia, from 1982 to 2015, noted a decrease in forested areas in the Gobi Desert, alongside an increase in meadows, alpine steppes, and typical steppes[41]. In HNP, the loss of forested areas has been particularly notable, with birch forests covering only 0.8% of the park. A significant 12% reduction in the forest area of HNP between 1994 and 2000 was reported[25]. Key drivers of these vegetation shifts include climate change, land-use alterations, increased fire frequency, and pest outbreaks, particularly Lymantria dispar. Additionally, recruitment of birch has been severely constrained as most young individuals have either died or are growing under significant stress due to red deer browsing. Furthermore, comparative analysis with vegetation mapping confirms a transition from forest to shrubland[38]. The contrasting vegetation responses between HNP and BKU likely reflects differences in ecosystem structure and disturbance regimes. HNP is primarily characterized by a grassland–shrub steppe subjected to substantial grazing pressure; conditions that can heighten vegetation sensitivity to climatic variability. Herbaceous systems typically respond more rapidly to temperature fluctuations due to their shallow rooting depth and shorter growth cycles. In contrast, BKU supports forest–steppe vegetation dominated by woody species such as larch and birch[22] which possess deeper root systems and greater physiological capacity to buffer short-term climatic stress. This structural complexity may dampen NDVI responses to temperature, resulting in weaker climate–vegetation correlations. Together, these findings suggest that ecosystem composition plays a critical role in mediating climate sensitivity across semi-arid landscapes.
Vegetation and climate interactions
-
The NDVI values obtained in this study are consistent with those reported for HNP[42]. Higher NDVI values observed in BKU indicate distinct plant community differences between HNP and BKU[24], with forest areas exhibiting higher NDVI values. Although both regions share similar climatic conditions, the distinct plant species in each area exhibit varying recovery and growth patterns, resulting in the varied NDVI observed. In particular, BKU's forest steppe ecosystem, characterized by litter accumulation, facilitates soil moisture retention, contrasting with the more temperature- and precipitation-sensitive grasslands of HNP[43]. As a result, the correlation between NDVI changes and precipitation/temperature in BKU is weaker than in HNP. These ecosystem-driven differences in vegetation structure and soil moisture dynamics are further supported by the ~10 °C daytime LST contrast. Based on the normal lapse rate (~6.5 °C per 1,000 m), the elevation difference between the two parks would explain only ~2.7–5.6 °C of the LST variation. The forest steppe in BKU, with higher litter inputs and improved soil moisture retention, may buffer surface heating, whereas the more open and precipitation-sensitive grasslands in HNP are more prone to rapid warming under dry conditions[44]. Additionally, differences in grazing intensity and vegetation density between the two parks may further influence surface energy balance and heat retention, contributing to the observed LST contrast. Water availability is a crucial factor influencing the growth of white birch in Northern Mongolia[45], consistent with our finding that interannual differences in NDVI and precipitation in HNP show a stronger correlation compared to BKU (Fig. 3). Precipitation is critical not only for plants, but also for animals, and this study found a slight reduction in horse numbers, underscoring their heightened sensitivity to precipitation (Supplementary Fig. S2).
A study reported that vegetation loss in forests contributes to significant surface temperature warming[46]. In line with this observation, the negative correlation between interannual differences in LST and NDVI in HNP was more pronounced than the positive correlation between interannual differences in precipitation and NDVI, despite a general decreasing trend in LST. The impact of temperature on annual NPP is significantly stronger in grazed grasslands than in ungrazed grasslands[47]. The negative impact of temperature on NPP was spatially variable, with the northern and southwestern areas of the Loess Plateau experiencing sporadic effects. Meanwhile, precipitation positively contributed to NPP, ranging from 0 to 4 g C m−2·a−1[48]. The negative correlation of NPP with temperature suggests a midsummer drought effect on gross primary production and increasing summer temperatures accelerate the respiration of alpine vegetation, resulting in lower overall productivity[49]. The combination of these factors, along with increased ecosystem respiration, likely explains the observed NPP reductions in our study area, which is situated in an arid zone. The reduction in NPP with rising temperatures can be attributed to the loss of soil moisture, reduced microbial activity, and limited nutrient uptake by alpine vegetation[50].
Primary production, the process by which autotrophs generate new organic matter, is strongly regulated by nutrient availability, particularly N and P[51]. Species-specific biomass responses observed in this study provides additional insight into vegetation dynamics under climatic variability. Notably, new biomass, C, H, and N content of S. krylovii was positively correlated with temperature, suggesting that this palatable grass may respond favorably to warmer growing conditions (Fig. 6). In contrast, new biomass of both species was negatively correlated with precipitation, indicating that factors beyond moisture alone may constrain productivity in this semi-arid ecosystem. Although direct statistical linkage between plot-scale biomass responses and NDVI patterns was beyond the scope of this study, these trends are broadly consistent with the vegetation shifts observed in Fig. 2, and may reflect increasing temperature sensitivity in grass-dominated communities. Climate responses can vary substantially even within similar vegetation types, depending on local environmental conditions[52]. For instance, short grasses in alpine ecosystems are vulnerable to warming and changes in precipitation, potentially altering grassland extent[53]. Similarly, productivity in Inner Mongolian grasslands is highly responsive to temperature, while precipitation and nutrient availability—particularly N and P—remain important regulators[54]. Because forage production is closely tied to climatic conditions, shifts in temperature and precipitation may ultimately influence grazing dynamics through their effects on plant productivity[55].
Biogeochemical interactions and adaptive strategies in fenced and unfenced plots
-
The higher accumulation of metals in A. frigida compared to S. krylovii indicates that A. frigida is more efficient in nutrient uptake, driven by its specialized biochemical pathways. Although both foliar species, S. krylovii (grass) and A. frigida (forb), utilize the C3 photosynthetic pathway[56], they have evolved distinct mechanisms for adapting to local edaphic conditions. These differences can be attributed to variations in biochemical pathways related to nutrient acquisition between dicots (forbs) and monocots (grasses). It was demonstrated that dicots uptake Fe2+ through ferric chelate reductase, while monocots exude phytosiderophores to form Fe3+–phytosiderophore complexes[57]. In a short-term N enrichment study, variations in the P, Ca, and Mn contents of the leaves of forbs (A. frigida and Phacelia tanacetifolia) and grasses (S. krylovii and L. chinensis) was observed. They also found that, although both forbs and grasses exuded carboxylates (such as malate and oxalate), forb roots released significantly more total carboxylates than grass roots[58]. The stronger correlation between P accumulation and N content in A. frigida compared to S. krylovii in this study may be linked to differences in carboxylate exudation (Supplementary Tables S11, S12). Future research could explore how grazing influences the release of total carboxylates in greater detail. Notably, S. krylovii exhibited lower total metal concentration than A. frigida, except for Ca. Spearman's rank correlation analysis further revealed that soil N content was positively and significantly correlated with nutrient accumulation in both species, though in a species-specific manner—Mg and Ca accumulation in A. frigida, and Fe accumulation in S. krylovii—suggesting that differences in metabolic pathways may mediate how each species responds to soil N availability[59]. These varying responses highlight the diversity in soil–plant nutrient interactions, which may depend on vegetation types, soil heterogeneity, climate conditions, and altitude[60].
Grazing is known to modify spatial heterogeneity in soil nutrients by altering plant diversity and community structure[14], which can subsequently influence litter quality and soil chemical properties[61]. The ungrazed site consistently exhibited greater litter accumulation and dried biomass, suggesting enhanced organic matter inputs that may support higher retention of key elements such as C, H, N, and P in both plant species. Other than that, grazing seems to increase the uptake of certain minerals (such as K, P, and Mn) by S. krylovii. Interestingly, total N and P storage was higher at grazed sites (site 3-2), potentially due to higher primary production in grazed areas[47,62]. Previous studies have identified strong associations between the unpalatable A. frigida and grazing activities, whereas grazing abandonment and wetter conditions favor palatable perennials such as S. krylovii, A. cristatum, and C. squarrosa[43]. This indicates that animal activity may indirectly influence nutrient uptake, consistent with the findings that fencing increases competition for soil nutrients[63]. In contrast, sites without animal disturbance (site 3-1) consistently show higher retention of Fe, Ca, and Mg in both plant species, accompanied by higher C : N ratios in S. krylovii, and greater proportions of both old and new biomass in ungrazed areas. These patterns may reflect enhanced biomass persistence and litter accumulation, potentially promoting nutrient retention within the soil–plant system[64]. This accumulation-driven pathway may increase soil nutrient availability over time; however, it may also alter ecosystem responsiveness to environmental variability. Systems with tighter nutrient cycling may exhibit greater resistance to short-term disturbances, but could become less adaptable to rapid climatic fluctuations if nutrient turnover is constrained[65]. While these interpretations are consistent with the observed patterns, they should be considered cautiously, given the absence of direct measurements of nutrient fluxes and turnover rates. Although A. frigida is considered unpalatable, its higher concentrations of major mineral elements and lower C : N ratio in undisturbed areas (site 3-1) suggests comparatively faster nutrient turnover compared to S. krylovii. These differences in mineral retention and nutrient turnover between S. krylovii and A. frigida likely reflect distinct biogeochemical strategies. S. krylovii appears to favor nutrient immobilization under grazing exclusion, as indicated by its higher C : N ratio, whereas A. frigida exhibits comparatively faster nutrient turnover, suggesting a species-specific and context-dependent response to the absence of grazing pressure. These patterns highlight the importance of biomass-mediated pathways in regulating soil–plant nutrient dynamics and point to the need for controlled, multi-year fencing experiments to better constrain the underlying mechanisms.
Limitations and future research projections
-
Several limitations should be acknowledged when interpreting the findings of this study. First, although NDVI responses suggested potential temperature-related stress on vegetation, short-term extreme weather events may exert stronger ecological effects than long-term averages of land surface temperature (LST) and precipitation. Because such episodic events were not explicitly quantified, their influence on vegetation dynamics cannot be fully excluded.
In addition, biotic disturbances may have contributed to vegetation change. For example, a gypsy moth outbreak reported in 1999 resulted in severe defoliation (31%) across the affected forest areas (550 ha) in HNP[25]. Although this event occurred outside the primary study period, the potential legacy effects of pest disturbances were not evaluated and therefore remain a source of uncertainty.
The assessment of grazing impacts on soil nutrients was based on comparisons between palatable species (S. krylovii) and unpalatable species (A. frigida). While this approach reflects natural field conditions, species-specific influences on soil nutrient availability cannot be fully disentangled from grazing effects. Consequently, the observed soil–plant nutrient patterns should be interpreted cautiously as indicative rather than mechanistic. Future multi-year studies integrating field measurements with high-resolution remote sensing would help further refine these findings.
Additionally, vegetation change analysis was restricted to the years 2001 to 2023 due to the availability of MODIS data, excluding earlier periods, such as 1994, when horses were introduced into the national park. This constraint may have led to an underestimation of the impact of the increasing horse and livestock populations. Future research should prioritize controlled grazing experiments to better quantify grazing effects by exploring potential changes in plant molecular compounds.
Finally, the study relies partly on remote sensing indices such as NDVI and NPP, which are subject to inherent limitations, including saturation in densely vegetated areas, and sensitivity to background soil conditions. Consequently, these indices should be interpreted as proxies for vegetation conditions rather than direct measures of ecosystem processes. These constraints may affect the precision of vegetation estimates, although the integration of field observations helps reduce this uncertainty.
-
Our study highlights a potential risk of grassland degradation in HNP, reflected in shifts in vegetation associated with marginal decrease in total NDVI vegetation compared to BKU, suggesting an increasing grazing pressure. Both HNP and BKU exhibited sensitivity to climate conditions, particularly temperature, with NDVI values showing a consistent inverse relationship with LST.
Grazing-related indicators, including higher dung cover and reduced dried plant cover and old biomass in grazed site compared to ungrazed site, suggest a potential influence of herbivore pressure on vegetation change in HNP, though direct evidence of grazing-induced vegetation change remains to be established. The trends in soil EC and new biomass of these species were predominantly linked to climate variables, namely precipitation and temperature in both species. The interaction of biomass, soil humus, and plant nutrient acquisition with temperature is more evident in the S. krylovii. Species-specific responses highlight the importance of plant functional differences in mediating nutrient dynamics under combined climatic and grazing influences.
Our findings indicate that semi-arid grasslands such as HNP may be increasingly vulnerable to the combined pressures of climate warming and grazing. Together, these findings underscore the need to consider the interactive effects of climate variability and grazing when developing sustainable grassland management strategies. As this study represents an initial assessment, future multi-year investigations integrating field observations with high-resolution environmental data are recommended to better resolve the mechanisms linking climate stress, herbivory, and ecosystem resilience.
-
The authors confirm their contributions to the paper as follows: study conception and design: Seah KY, Son R, Yoon J. Oyunsetseg B; data collection: Oyunsetseg B, Tsogbadrakh O, Sukhbaatar G; analysis and interpretation of results: Seah KY, Yoon J, Son R, Tsogbadrakh O, Sukhbaatar G; draft manuscript preparation: Seah KY, Yoon J, Son R, Oyunsetseg B; manuscript revision and review: Seah KY, Yoon J, Sukhbaatar G, Oyunsetseg B; funding acquisition: Seah KY, Son R, Yoon J. Oyunsetseg B. All authors reviewed the results and approved the final version of the manuscript.
-
All data generated or analyzed during this study are included in this published article and its supplementary information files.
-
This work was supported by Post-doc Value up Research Scientist Project (IERI, GKH 0450) and the Global Joint Research Program funded by the Pukyong National University (Grant No. 202412170001). We dedicate this work to the memory of Prof. Kyoung-Woong Kim, whose invaluable contributions and guidance greatly enriched this study.
-
The authors declare that they have no conflict of interest.
-
accompanies this paper online at: https://doi.org/10.48130/grares-0026-0011.
- Supplementary Table S1 Sampling Scheme for soil and plant samples across sites and seasons with filled circles (●) indicate collected samples while emptied circles (○) indicate uncollected samples.
- Supplementary Table S2 Comparison of climatic conditions in 2019 with the 2001–2021 long-term mean at Hustai National Park (HNP) and Bogd Khan Uul (BKU).
- Supplementary Table S3 The primer sequences for plant DNA analysis.
- Supplementary Table S4 gDNA quality and PCR amplification results for plant samples.
- Supplementary Table S5 BLAST results for primer sequence identity and subject information for plant samples, namely S. krylovii (SK) and A. frigida (AF).
- Supplementary Table S6 Recovery of the standard reference materials.
- Supplementary Table S7 Soil physiochemical properties in the Hustai National Park (HNP), Mongolia.
- Supplementary Table S8 The average content of elements (%) in the soil of Hustai National Park (HNP), Mongolia during Winter, Spring, and Summer.
- Supplementary Table S9 The average concentration of major elements in the soil of Hustai National Park (HNP), Mongolia.
- Supplementary Table S10 Seasonal and species variations in major elements uptake by both plant species, namely A. frigida (AF, n = 11) and S. krylovii (SK, n = 12) as determined by the Kruskal-Wallis test.
- Supplementary Table S11 Spearman’s rank correlation of soil properties, climate conditions, and elemental accumulation in A. frigida.
- Supplementary Table S12 Spearman's rank correlation of soil properties, climate conditions, and elemental accumulation in S. krylovii.
- Supplementary Fig. S1 Interannual variation characteristics of the growing season in HNP and BKU.
- Supplementary Fig. S2 The relationship between the interannual population changes of Przewalski’s horses with LST, Precipitation, and NDVI for the period from 2001 to 2022.
- Copyright: © 2026 by the author(s). Published by Maximum Academic Press, Fayetteville, GA. This article is an open access article distributed under Creative Commons Attribution License (CC BY 4.0), visit https://creativecommons.org/licenses/by/4.0/.
-
About this article
Cite this article
Seah KY, Yoon JH, Son R, Tsogbadrakh O, Sukhbaatar G, et al. 2026. Monitoring grassland degradation under grazing and climate stress in Hustai National Park using NDVI analysis. Grass Research 6: e016 doi: 10.48130/grares-0026-0011 

Monitoring grassland degradation under grazing and climate stress in Hustai National Park using NDVI analysis
- Received: 10 November 2025
- Revised: 03 April 2026
- Accepted: 09 April 2026
- Published online: 02 June 2026
Abstract: Grasslands cover nearly one-third of Earth's terrestrial surface and play a critical role in global carbon and nutrient cycling; however, those in semi-arid regions are particularly vulnerable to climate variability and local disturbances. Disentangling the relative influences of climatic drivers and local disturbances remains a major ecological challenge. This study investigated relative influences of climate drivers and local disturbances on grassland dynamics in Hustai National Park (HNP), which serves as a critical habitat for the Przewalski's horse, through an integrated approach combining satellite-derived normalized difference vegetation index (NDVI), field-based biomass measurements, and soil–plant nutrient analyses. The park exhibited sensitivity to climate variability, particularly rising temperatures. A negative correlation between land surface temperature and NDVI indicated increasing climate stress across the region. Results showed that a 1 °C increase in temperature reduced net primary production by 14.07 g C m−2, while a 1 mm increase in precipitation increased net primary production by 1.28 g C m−2 during summer. Vegetation analysis further revealed a shift from subshrubs/shrubs to grasses/forbs in HNP, suggesting potential land degradation associated with elevated herbivore activity, supported by higher dung cover and standing dead biomass. Soil–plant nutrient relationships demonstrated species-specific responses, with Stipa krylovii showing greater temperature sensitivity, while Artemisia frigida exhibited higher uptake of major mineral elements. These differences may arise from herbivore preference for palatable species or intrinsic differences in nutrient acquisition strategies between monocots and dicots. These findings provide important baseline insights into climate–grazing interactions and offer guidance for sustainable grassland management and conservation in semi-arid ecosystems.