


-
Industrialisation and infrastructure development require extensive extraction and use of heavy metals, generating large volumes of waste that often enter the environment. Heavy metal pollution remains a pressing concern due to its severe effects on human health and the lack of sustainable remediation solutions. Among these, chromium is one of the most carcinogenic metals, widely used in tanneries, steel/electroplating industries, and the textile industry[1,2]. Over the past 30 years, nearly 30,000 tons has been released into the environment globally[3]. In its hexavalent form, chromium mimics the sulphate oxyanion, allowing easy transmembrane transport into prokaryotic and eukaryotic cells. Once inside, it is reduced to the trivalent form, generating reactive oxygen species (ROS) that induce lipid peroxidation, DNA damage, and protein degradation[2,4,5]. Despite extensive documentation of chromium contamination in industrial effluents, the persistent toxicity of hexavalent chromium (Cr+6) remains a major unresolved environmental and public health challenge. While conventional physical and chemical methods can partially mitigate heavy metal contamination, these technologies fail to remove residual Cr+6, especially in saline wastewaters. This gap underscores the urgent need for eco-friendly biological strategies that can function under high ionic stress.
Marine-derived fungi have emerged as promising candidates for bioremediation in saline and metal-polluted environments. Unlike many terrestrial microbes, they exhibit inherent halotolerance, osmotic adjustment via compatible solutes (e.g., glycerol and trehalose), halophilic enzymes, and robust ion-transport systems[6,7]. These adaptations allow survival in hypersaline and alkaline habitats where conventional remediation agents fail. Several genera, including Aspergillus, Penicillium, and Fusarium, have demonstrated the ability to take up heavy metals, biosorb them, and enzymatically detoxify them under saline conditions[6,8]. Their ability to couple extracellular mechanisms (biosorption, bioleaching, precipitation) with intracellular strategies (enzymatic Cr+6 reduction, vacuolar sequestration, metallothionein production) makes them ideal candidates for sustainable wastewater treatment[7−9].
Salinity levels in contaminated habitats can vary widely, and hypersaline conditions (> 100 PSU) are encountered in evaporation ponds, tannery discharge sites, and industrial brines[9,10]. In this study, a salinity of 100 PSU was used to represent such extreme ionic environments, thereby enabling assessment of fungal performance in scenarios where conventional bioremediation agents would be ineffective. Cr+6 was chosen as the test metal because of its toxicity challenge posed for detoxification studies. The isolate Aspergillus terreus (NCBI accession no. KT956259) was selected based on preliminary screening that revealed exceptional Cr+6 tolerance (up to 750 mg/L) and removal efficiency (13 mg Cr g−1 biomass at 300 mg/L). Its marine origin suggests inherent halotolerance, and prior scanning electron microscopy (SEM) imaging and diphenylcarbazide assays indicated that both biosorption and enzymatic reduction are primary survival strategies. These features make it an ideal candidate for exploring molecular adaptations under simultaneous salt and metal stresses. Aspergillus niger and Aspergillus terreus have been reported to have potential mycoremediative capabilities for Cd2+ removal[11]. ESI-LCMS analysis of the crude extract of A. terreus revealed the expression of two new lumazine-containing peptides with pharmacological activities, thereby promoting this species for multiple applications[12]. These studies collectively strengthen the ecological and biotechnological significance of A. terreus and support it as a candidate organism for remediation-driven research. At the cellular level, tolerance to heavy metals and salinity is mediated by a suite of stress-responsive proteins. Transporter families such as ATP-binding cassette (ABC) transporters, cation diffusion facilitators (CDF), and P-type ATPases play central roles in metal efflux and compartmentation[13,14]. Redox regulators, including thioredoxin and glutathione reductase, along with antioxidant enzymes such as catalases and peroxidases mitigate ROS toxicity[15,16]. Heat shock proteins and T-complex proteins further assist in protein folding and stabilization under stress[17].
Despite increasing recognition of fungal tolerance to heavy metals and salinity, most studies have examined these stressors in isolation, primarily using physiological assays or targeted biochemical measurements[15−18]. In contrast, saline industrial effluents typically impose concurrent ionic and metal stress, creating synergistic cellular pressures that cannot be predicted from single-factor experiments[9,10]. Although proteomic analyses have been conducted in selected terrestrial or clinical fungi[19,20], the integrated molecular responses of marine-derived filamentous fungi under combined stress remain poorly understood. In particular, Aspergillus terreus, a species noted for environmental resilience and biotechnological potential[21−23], has not been systematically investigated at the global proteome level under simultaneous salinity and chromium exposure. To address this gap, we employed LC-MS/MS-based peptide mass fingerprinting to profile whole-cell protein expression across nine salt-metal regimes. This systems-level strategy reveals coordinated stress-response pathways, metabolic prioritisation, and adaptive survival mechanisms that cannot be inferred from conventional growth or enzymatic assays, thereby providing a new mechanistic insight into fungal adaptation to complex environmental stressors. Accordingly, this study aimed to: (1) characterise the proteomic response of A. terreus under individual and combined Cr+6 and salinity stresses, (2) identify key tolerance pathways involving ROS detoxification, ion homeostasis, and metal reduction, and (3) evaluate the expression of housekeeping proteins under multi-stress exposure to gain insights into metabolic prioritisation.
-
Aspergillus terreus, #NIOSN-SK56-S52, is a previously isolated culture from Arabian Sea sediments, identified using molecular techniques (NCBI accession no. KT956259), and has been previously reported for chromium tolerance[8].
Extraction of proteins
-
Non-sporulated crushed mycelia of previously grown culture #NIOSN-SK56-S52 were inoculated in Czapek Dox Broth (CDB) with varying concentrations of Cr+6 (0, 100, and 500 mg/L), each prepared with salt solutions of 0, 35, and 100 PSU, in triplicate. The nine different metal-salt combinations were incubated at 80 rpm at 28 °C for 1 week, following which the contents were filtered, lyophilised, weighed, and processed for protein extraction. A previously standardised 3-buffer extraction method[24] was used to extract proteins from a fixed biomass quantity (30 mg). Briefly, the biomass was subjected to buffer I (Tris–MgCl2, pH 8.3, 0.5 M Tris–HCl, 2% CHAPS, 20 mM MgCl2, 2% DTT); buffer II (9 M urea, 4% CHAPS, 100 mM DTT—prepared in 40 mM Tris–HCl, pH 8.0); and buffer 3 (6 M urea, 3 M thiourea, 4% CHAPS, 100 mM DTT—prepared in 40 mM Tris–HCl, pH 8.0). The samples were homogenised at 6.5 m/s for 45 s after each buffer addition and centrifuged to separate the fractions. All three fractions were mixed, and the extracted proteins were quantified using the standard Folin's method and analyzed by SDS-PAGE to assess quality before proceeding with MS analysis.
Tryptic digestion and LC-MS separation
-
Prior to MS analysis, the protein extracts were processed for In-solution digestion using trypsin (protocol modified from Kinter & Sherman[25]). The extract was initially precipitated with HPLC-grade methanol, vacuum-dried, and suspended in urea to facilitate dissolution. Subsequently, the protein samples were reduced using dithiothreitol (DTT) and further alkylated with Iodoacetamide (IAA). The samples were digested using trypsin and analysed using the LC-MS QToF facility (6538 UHD Accurate Mass QTOF LC/MS, Agilent Technologies, USA). Digested protein samples (8 µL, four replicates) were injected in a 150 × 300 A C18 150 mm column protein chip via an autosampler. A gradient of 3%–97% across HPLC-grade acetonitrile as an organic phase, and 0.22 µm filtered and autoclaved deionised water as an aqueous phase was used to carry out LC separations over a time period of 100 min. Formic acid (0.1%) was added as an additive in both phases. An accuracy rate of 2 mg/L was maintained for the separated ions in positive mode over the range of 50–2,000 m/z. The spectral data were acquired using Mass Hunter software v5.0 (Agilent Technologies, USA) after MS/MS, and were searched in NCBI using Spectrum Mill MS Proteomics Workbench vB.04.01.141 (Agilent Technologies, USA) at 50–100 mg/L accuracy against the organism-specific database (NCBI txid 33178). Protein sequences corresponding to the differentially expressed proteins (DEPs) were retrieved from the NCBI Aspergillus terreus genome. The MS searches were auto-validated (false discovery rate of 1.2%), and protein summary and MPP files were generated. These files were processed in Mass Profiler Professional v14.09 (MPP13, Agilent Technologies, USA) for further analysis. Mapping and annotation steps were carried out to assign GO terms under the three ontologies: Biological Process (BP), Molecular Function (MF), and Cellular Component (CC). Differential protein abundance was calculated from MS intensity values using log 2-transformed fold changes. Multivariate differences among treatment groups were examined using Principal Component Analysis based on Euclidean distances. Statistical significance was set at p < 0.05.
-
Protein profiling of A. terreus, #NIOSN-SK56-S52, identified 659 proteins expressed across the nine different metal-salt combinations. Based on their functional role as elucidated from KEGG pathways and metabolic processes, they were divided into 17 different categories (Fig. 1). Amino acid metabolism (41), biosynthesis of secondary metabolites (6), carbohydrate metabolism (63), cellular processes (30), energy metabolism (30), environmental information processing (38), genetic information processing (146), glycan biosynthesis and metabolism (3), lipid metabolism (12), metabolism of cofactors and vitamins (10), metabolism of other amino acids (5), metabolism of terpenoids and polyketides (4), nucleotide metabolism (16), stress response (32), xenobiotics biodegradation and metabolism (4), hypothetical proteins (213), and uncharacterised proteins (6). To further understand the contribution of proteins under each functional process under salinity stress, proteins expressed only under 0, 35, and 100 PSU were analysed (Fig. 2). Most proteins expressed at 100 PSU belonged to carbohydrate metabolism, genetic information processing, and hypothetical proteins.
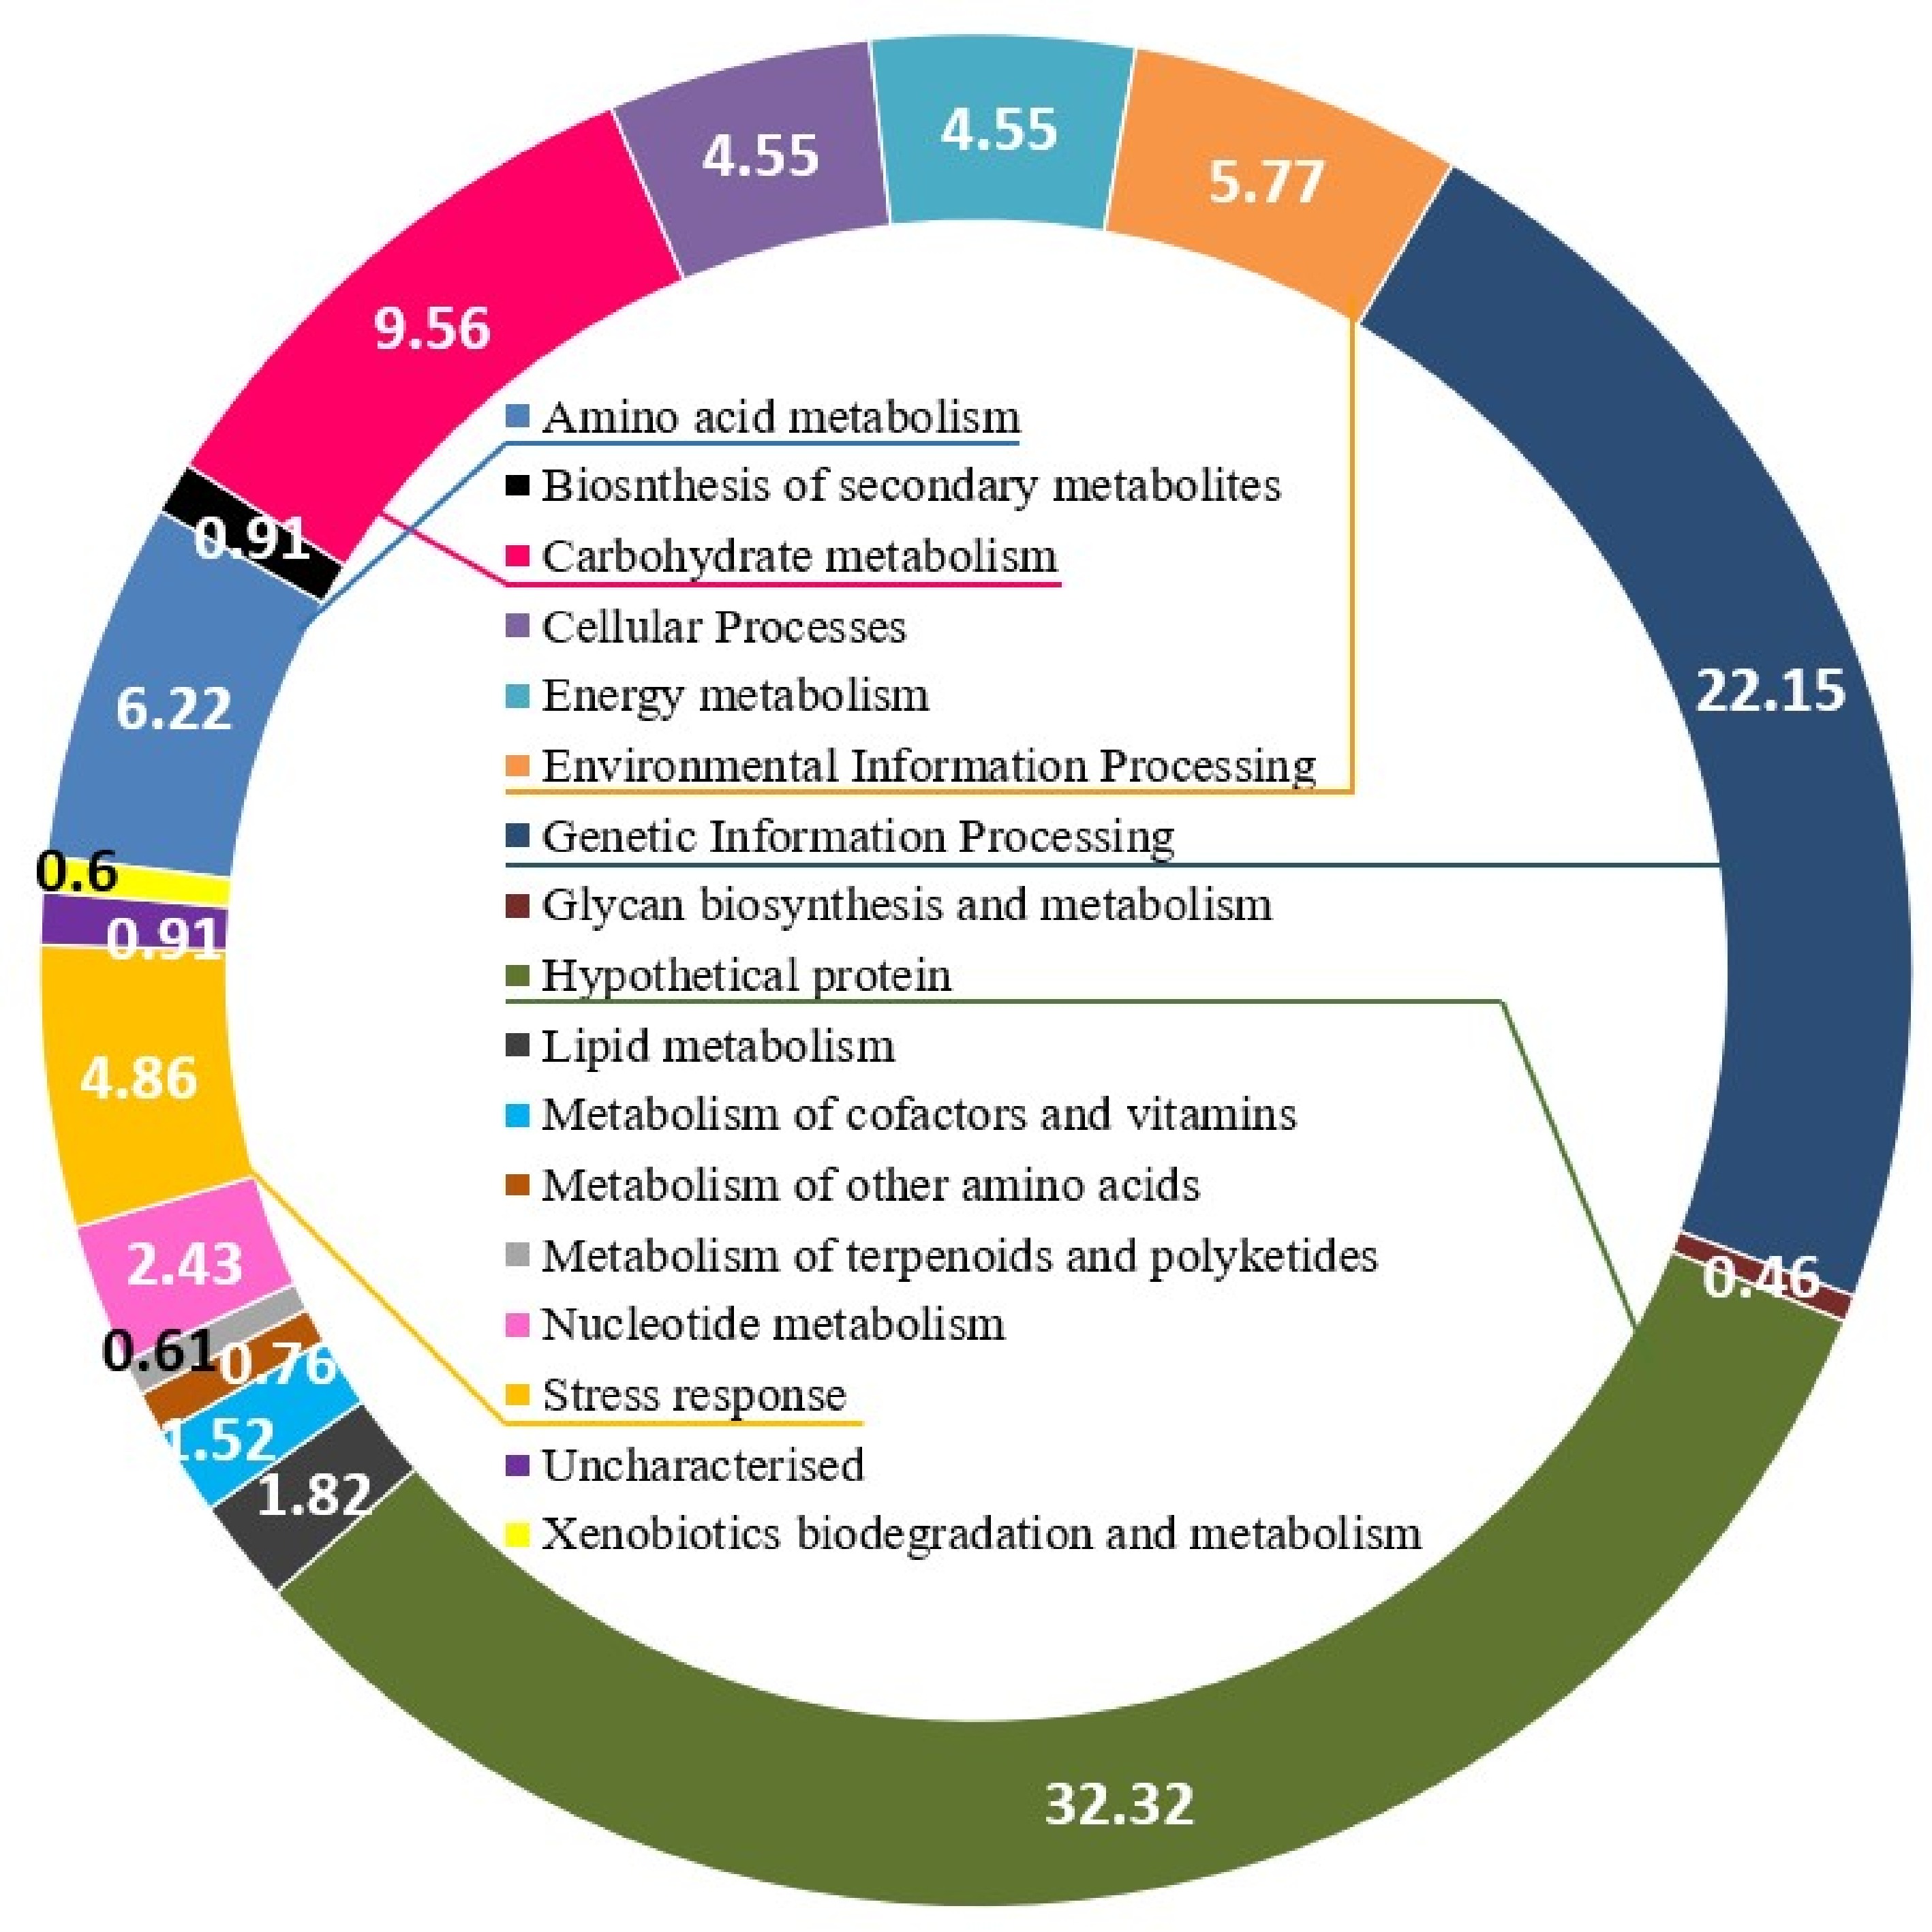
Figure 1.
Graphical representation of all proteins expressed by A. terreus (#NIOSN-SK56-S52) %.
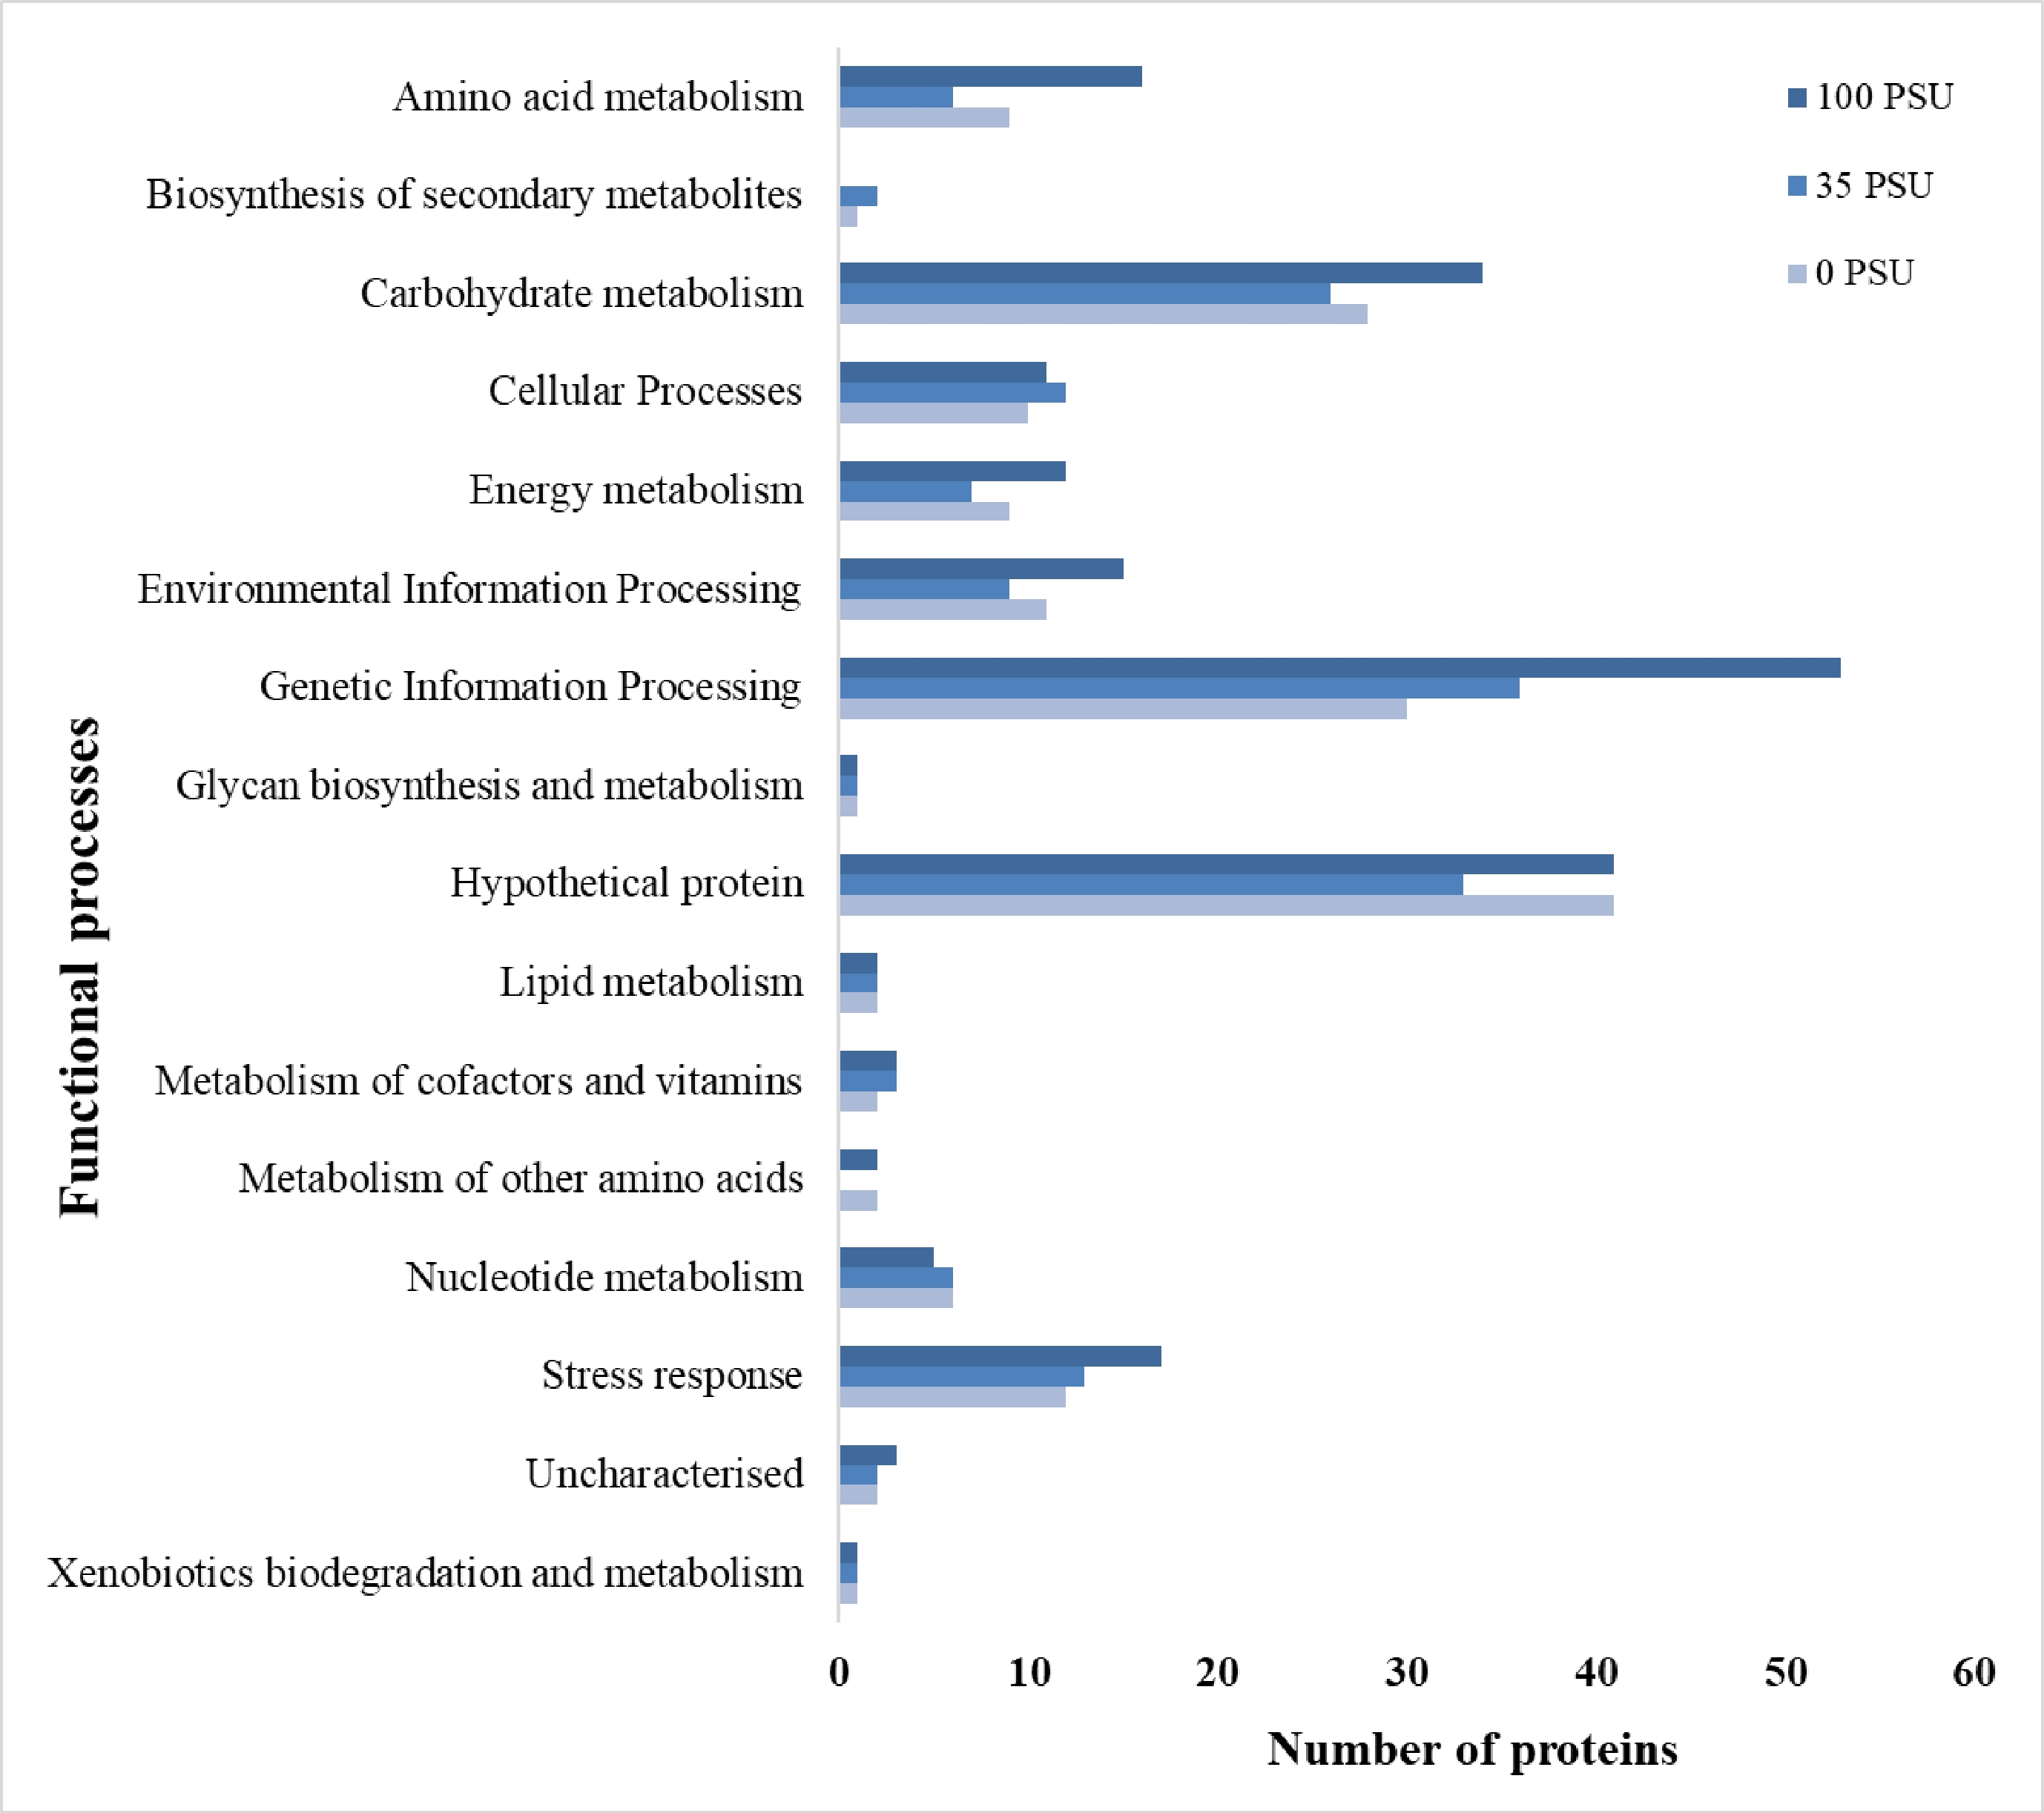
Figure 2.
Distribution of proteins expressed by A. terreus (#NIOSN-SK56-S52) under 0, 35, and 100 PSU salinity.
Amongst the expressed proteins, 53 were commonly expressed across all nine conditions, suggesting they are involved in housekeeping metabolic activities (Table 1). Amongst these, 16 proteins (cytochrome c oxidase polypeptide IV (NCBI gi–114188084), cytochrome c oxidase polypeptide VI (NCBI gi−114188679), enolase (NCBI gi–114194476), eukaryotic initiation factor 4A (NCBI gi–114196711), Glucose-6-phosphate isomerase (NCBI gi–114193156), glyceraldehyde-3-phosphate dehydrogenase (NCBI gi–540849772), heat shock 70 kDa protein (NCBI gi–114187927), histone H2A (NCBI gi–114189434), histone H2B (NCBI gi–114189435), malate dehydrogenase (NCBI gi–114191202), phosphoglycerate kinase (NCBI gi–114197170), pyruvate kinase (NCBI gi–114193787), thioredoxin (NCBI gi–114190288), transaldolase (NCBI gi–114191388), transketolase 1 (NCBI gi–114197498), and tubulin beta chain (NCBI gi–114197233) have been previously reported as housekeeping genes in humans. In a separate study, reference genes in filamentous fungi suitable for RT-qPCR were studied and revealed nine such novel genes, namely, the β-actin, 18S rRNA, cyclophilin, histone H3, glyceraldehyde-3-phosphate dehydrogenase, α, β1, β2-tubulin, and ubiquitin.
Table 1. Commonly expressed proteins across all salinities and Cr (VI) concentrations by A. terreus.
Protein name NCBI gi Function Protein name NCBI gi Function 40S ribosomal protein S0 114194180 Translation Hexokinase 114191625 Glycolysis/gluconeogenesis 6-phosphogluconate dehydrogenase 114191912 Pentose phosphate pathway Histone H2A 114189434 Pyrimidine metabolism Adenosylhomocysteinase 114197109 Cysteine and methionine metabolism Histone H2B 114189435 Pyrimidine metabolism ADP, ATP carrier protein 114194661 Mitochondrial biogenesis Inorganic pyrophosphatase 114196689 Oxidative phosphorylation Alcohol dehydrogenase I 114188844 Glycolysis/gluconeogenesis Ketol-acid reductoisomerase, mp 114195083 Valine, leucine and isoleucine biosynthesis Aldehyde dehydrogenase 114192389 Ascorbate and aldarate metabolism L-xylulose reductase 114195667 Pentose and glucuronate interconversions ATP synthase alpha chain, mp 114193514 Oxidative phosphorylation Malate dehydrogenase, mp 114191202 Carbohydrate metabolism ATP synthase beta chain, mitochondrial precursor 114190171 Oxidative phosphorylation Mitochondrial peroxiredoxin PRX1 114192711 Glutathione metabolism/
stress responseATP-citrate synthase subunit 1 114195637 Citrate cycle (TCA cycle) Mitochondrial phosphate carrier protein 114197783 Pantothenate and CoA biosynthesis Bacterial hemoglobin 114195409 Uncharacterised Mitochondrial processing peptidase beta subunit 114197569 Folding, sorting and degradation Cell division cycle protein 48 114187782 Meiosis Nucleoside diphosphate kinase 114189539 Purine metabolism Cerevisin precursor 114191390 Autophagy Outer mitochondrial membrane protein porin 114192911 Mitochondrial biogenesis Citrate synthase, mp 114189463 Citrate cycle (TCA cycle) Phosphoglycerate kinase 114197170 Glycolysis/gluconeogenesis Cytochrome c oxidase polypeptide IV, mp 114188084 Oxidative phosphorylation Pyruvate decarboxylase 114193380 Glycolysis/gluconeogenesis Cytochrome c oxidase polypeptide VI, mp 114188679 Oxidative phosphorylation Pyruvate kinase 114193787 Glycolysis/gluconeogenesis DNA damage checkpoint protein rad24 114188055 Stress/ DNA repair S-adenosylmethionine synthetase 114197201 Cysteine and methionine metabolism Elongation factor 1-beta 114197267 Translation Superoxide dismutase, mp 114191387 Response to oxidative stress Elongation factor 2 114196384 Translation Thioredoxin 114190288 Response to oxidative stress Enolase 114194476 Glycolysis / Gluconeogenesis Transaldolase 114191388 Carbohydrate metabolism Eukaryotic initiation factor 4A 114196711 Translation Transketolase 1 114197498 Carbohydrate metabolism Eukaryotic translation initiation factor 5A 114193909 Translation Triosephosphate isomerase 114192224 Carbohydrate metabolism Glucose-6-phosphate isomerase 114193156 Carbohydrate metabolic process Tubulin alpha-1 chain 114193585 Transport and catabolism Glyceraldehyde-3-phosphate dehydrogenase 540849772 Carbohydrate metabolic process Tubulin beta chain 114197233 Transport and catabolism GTP-binding nuclear protein GSP1/Ran 114194939 Signal transduction UDP-glucose 4-epimerase 114190193 Carbohydrate metabolism Heat shock 70 kDa protein 114187927 Stress response Vacuolar protease A precursor 114193423 Fungal-type cell wall organization Heat shock protein 82 114189469 Stress response Woronin body major protein 114191425 Translation Heat shock protein SSC1, mp 114193179 Stress response mp = mitochondrial precursor. A group of unique proteins expressed under specific conditions was also studied (Table 2). At 0 PSU, expression of proteins involved in biosynthetic pathways and genetic information processing was dominant, indicating a relatively stress-free physiological state consistent with the facultative marine nature of the isolate. In the presence of 500 mg/L of Cr+6, proteins such as WD-repeat protein mip1 (NCBI gi–114191519), involved in cell senescence, and nonhistone chromosomal protein 6A (NCBI gi–114193442), which is involved in replication and repair were expressed. In addition to Cr+6 stress in the presence of 35 PSU, magnesium transporter MRS2 (NCBI gi–114190882) and T-Complex protein one subunit delta (NCBI gi–114193665) were also expressed.
Table 2. Unique proteins expressed at varying salinities and Cr (VI) concentrations and combinations by A. terreus.
Condition Protein name NCBI gi Function 0 PSU, 0 mg/L ATP-dependent RNA helicase DOB1 114192864 Spliceosome Cystathionine beta-lyase 114195508 Cysteine and methionine metabolism Glycolipid-anchored surface protein 5 precursor 114189622 Glycan biosynthesis and metabolism Guanine nucleotide-binding protein beta subunit 114195314 Transport and catabolism Methylcrotonoyl-CoA carboxylase beta chain, mitochondrial precursor 114191417 Valine, leucine, and isoleucine degradation Molybdenum cofactor biosynthesis protein 1 B 114192533 Folding, sorting, and degradation Vacuolar ATP synthase subunit B 114196357 Autophagy 0 PSU, 100 mg/L Allergen Asp f 7 114192930 TNF signaling pathway Alternative oxidase, mitochondrial precursor 114190002 Oxidative phosphorylation Arabinan endo-1,5-alpha-L-arabinosidase A precursor 114193790 carbohydrate metabolic process ATP-dependent protease La 114196169 Cell growth and death DNA-directed RNA polymerase II 45 kDa polypeptide 114196335 Transcription Quinate permease 114190347 Quinate metabolism 0 PSU, 500 mg/L Anthranilate synthase component II 114197450 Phenylalanine, tyrosine, and tryptophan biosynthesis Endochitinase 1 precursor 114194948 Starch and sucrose metabolism Glycerol-3-phosphate dehydrogenase, mitochondrial precursor 114193625 carbohydrate metabolic process Nonhistone chromosomal protein 6A 114193442 Replication and repair Orotate phosphoribosyltransferase 114196505 Pyrimidine metabolism Proliferating cell nuclear antigen 114195863 DNA replication Serine/threonine-protein phosphatase 2A 56 kDa regulatory subunit delta 1 isoform 114188660 Cell cycle Signal recognition particle 54 kDa protein 114189491 Folding, sorting, and degradation Transcriptional repressor rco-1 114191721 Transcription Vacuolar ATP synthase subunit E 114190926 Oxidative phosphorylation WD-repeat protein mip1 114190613 cellular senescence 35 PSU, 0 mg/L 26S proteasome regulatory subunit rpn-1 114195360 Proteosome 3-methyl-2-oxobutanoate hydroxymethyltransferase 114191519 Pantothenate and CoA biosynthesis Alpha,alpha-trehalose-phosphate synthase 1 114194901 Starch and sucrose metabolism Catalase 114196544 Stress response cell differentiation protein rcd1 114194699 Meiosis Chromosome segregation protein sudA 114196456 Meiosis CURS1 443610053 Biosynthesis of secondary metabolites Nonsense-mediated mRNA decay protein 3 114194516 Translation Nonspecific lipid-transfer protein, mitochondrial precursor 114192954 Lipid metabolism Protein kinase lkh1 114192486 MAPK signaling pathway 35 PSU, 100 mg/L 1,4-alpha-glucan branching enzyme 114190170 Starch and sucrose metabolism Coatomer beta subunit 114197239 Oxidative phosphorylation Inner membrane magnesium transporter MRS2, mitochondrial precursor 114190882 Metal ion transmembrane transporter activity Inositol-3-phosphate synthase 114189610 phosphatidylinositol signaling system NADH-ubiquinone oxidoreductase 21 kDa subunit 114196031 Oxidative phosphorylation Pre-mRNA splicing factor CLF1 114197157 Transcription Zinc-regulated transporter 1 114193659 Transcription factors 35 PSU, 500 mg/L 26S protease regulatory subunit 8 114196020 Proteosome Activator 1 subunit 3 114188298 Folding, sorting, and degradation Alanyl-tRNA synthetase 114196954 Aminoacyl-tRNA biosynthesis C-1-tetrahydrofolate synthase, mitochondrial precursor 114196661 Folate biosynthesis Cholinesterase 114195928 Glycerophospholipid metabolism Iron sulfur assembly protein 1 114194102 Biotin metabolism Lactoylglutathione lyase 114191927 Pyruvate metabolism Methionine aminopeptidase 2B 114192909 Fructose and mannose metabolism NAD-dependent histone deacetylase SIR2 114193955 Metabolism of cofactors and vitamins Nucleolar GTP-binding protein 2 114192691 Translation Splicing factor 3B subunit 3 114194961 Spliceosome T-complex protein 1 subunit delta 114193665 Chaperones and folding catalysts Transcription initiation factor TFIID subunit 12 114189293 Transcription 100 PSU, 0 mg/L 3-hydroxy-3-methylglutaryl-coenzyme A reductase 114188011 Melavonate pathway/terpenoid synthesis Ankyrin repeat protein nuc-2 114191665 Toll and Imd signaling pathway Argininosuccinate lyase 114196749 Arginine biosynthesis Aryl-alcohol dehydrogenase 114196508 Tyrosine metabolism Casein kinase I isoform epsilon 114190610 Ribosome biogenesis in eukaryotes Chitin synthase 6 114196376 Amino sugar and nucleotide sugar metabolism Dual specificity tyrosine-phosphorylation regulated kinase 2 114189670 MAPK signaling pathway 100 PSU, 0 mg/L Mannose-6-phosphate isomerase 114197475 Fructose and mannose metabolism Peroxisomal biogenesis factor 6 114196745 Transport and catabolism Proteasome subunit alpha type 1 114190652 Folding, sorting, and degradation Serine/threonine-protein kinase CLA4 114188881 Cell cycle Two-component signaling kinase TcsC 421994880 Signal transduction Vacuolar ATP synthase 98 kDa subunit 114194052 Oxidative phosphorylation 100 PSU, 100 mg/L Aldo-keto reductase yakc 114195515 Arachidonic acid metabolism Calcium-transporting ATPase 1 114191621 Calcium signaling pathway Cytochrome c oxidase polypeptide V, mitochondrial precursor 114190172 Oxidative phosphorylation DNA repair and recombination protein RAD54 114188055 Stress/ DNA repair Enoyl-CoA hydratase, mitochondrial precursor 114196542 Fatty acid elongation G2/mitotic-specific cyclin cdc13 114195591 Cell cycle Glutaryl-CoA dehydrogenase, mitochondrial precursor 114189298 Lipid metabolism GTP-binding protein 1 114195273 Signal transduction Maleylacetate reductase 114193824 Chlorocyclohexane and chlorobenzene degradation Peroxidase/catalase 2 114189895 Stress response Phosphoribosylglycinamide formyltransferase 114196550 Purine metabolism T-complex protein 1 subunit alpha 114195604 Chaperones and folding catalysts Threonine synthase 114191253 Glycine, serine, and threonine metabolism Thymidylate synthase 114187858 Pyrimidine metabolism 100 PSU, 500 mg/L 26S proteasome non-ATPase regulatory subunit 3 114189291 Proteosome 3-isopropylmalate dehydrogenase B 114194981 Valine, leucine, and isoleucine biosynthesis Aconitate hydratase, mitochondrial precursor 114194899 Citrate cycle (TCA cycle) Branched-chain-amino-acid aminotransferase 114191652 Cysteine and methionine metabolism Bystin 114193014 Ribosome biogenesis DNA replication licensing factor mcm7 114193195 DNA replication Elongation factor G 114188759 Translation Elongation factor G 1, mitochondrial precursor 114192760 Translation Eukaryotic peptide chain release factor subunit 1 114188901 Translation Eukaryotic translation initiation factor 2 gamma subunit 114192814 Translation Eukaryotic translation initiation factor 5B 114193915 Translation Eukaryotic translation initiation factor 6 114188867 Translation Exoglucanase 1 precursor 114192372 Starch and sucrose metabolism Glycine cleavage system H protein 114197351 Glycine, serine, and threonine metabolism HIRA-interacting protein 5 114193863 Oxidative phosphorylation Isovaleryl-CoA dehydrogenase, mitochondrial precursor 114191418 Amino acid metabolism Mitochondrial import receptor subunit tom-20 114192401 Transporters Multidrug resistance protein 1 114188861 Drug resistance Myosin-1 114190321 Cellular processes NADH-ubiquinone oxidoreductase 19.3 kDa subunit, mitochondrial precursor 114191677 Oxidative phosphorylation NADH-ubiquinone oxidoreductase 51 kDa subunit, mitochondrial precursor 114194075 Oxidative phosphorylation Nucleolar essential protein 1 114189301 Translation Nucleolar protein NOP58 114194165 Translation Phenylacrylic acid decarboxylase 114187643 Phenylpropanoid biosynthesis Phospho-2-dehydro-3-deoxyheptonate aldolase 114193629 Phenylalanine, tyrosine, and tryptophan biosynthesis Prohibitin-2 114188359 Mitochondrial biogenesis Queuine tRNA-ribosyltransferase 114187859 queuosine biosynthesis Sec14 cytosolic factor 114193260 Transporters Small nuclear ribonucleoprotein Sm D1 114192048 Spliceosome Thioredoxin reductase 114194755 Response to oxidative stress Tyrosyl-tRNA synthetase 114195131 Aminoacyl-tRNA biosynthesis Valyl-tRNA synthetase, mitochondrial precursor 114189806 Aminoacyl-tRNA biosynthesis The protein regulation of A. terreus subjected to salinity and chromium stresses was analysed using MPP software (v14.09), and the up-/downregulated proteins are shown in Table 3. It was observed that proteins commonly expressed across all conditions were generally downregulated under metal stress at all salinities, except for a few, suggesting that stress affects the expression of housekeeping genes. The priority of organisms is survival, rather than growth and reproduction, leading to downregulation of these proteins. Oxidoreductive proteins, such as cytochrome c oxidase (NCBI gi–114188084), were found to be upregulated at both 35 and 100 PSU in the presence of Cr+6, along with heat shock protein 82 (NCBI gi–114187927). The DNA damage checkpoint protein Rad24 (NCBI gi–114188055), involved in checkpoint response and DNA double-strand break repair was also found to be upregulated. Thioredoxin (NCBI gi–114190288), which is known to scavenge ROS actively, was upregulated at all salinities with chromium stress, with a fold change value of 5.011 and 5.532 at 100 and 500 mg/L Cr+6 under 35 PSU salinity, respectively. The catalase B precursor (NCBI gi–114190039) was downregulated at 35 PSU under Cr+6 stress. Antioxidant enzymes can be affected by free radical regeneration, and the expression of common housekeeping genes may also be altered. The downregulation of carbohydrate metabolism proteins indicated this: pyruvate kinase (NCBI gi−114193787) and transketolase 1 (NCBI gi–114197498) at 0 and 100 PSU, respectively, when subjected to Cr+6.
Table 3. Protein regulation by A. terreus under chromium stress.
Protein name NCBI gi FCa FCb Protein name NCBI gi FCa FCb Commonly upregulated proteins at 0 PSU (17 nos.) 40S ribosomal protein S5 114197792 2.766 0.738 Hypothetical protein ATEG_07937 114190499 1.383 0.298 ADP, ATP carrier protein 114194661 1.045 0.756 Hypothetical protein ATEG_08274 114189747 3.400 2.199 ATP synthase gamma chain, mp 114195813 2.271 3.245 Ketol-acid reductoisomerase, mp 114195083 1.382 0.463 Bacterial hemoglobin 114195409 0.313 1.337 Mitochondrial phosphate carrier protein 114197783 1.587 2.695 Dihydrolipoyllysine-residue acetyltransferase component of pyruvate dehydrogenase complex, mp 114191205 2.716 1.100 Mitochondrial processing peptidase β subunit 114197569 0.663 1.044 Hypothetical protein ATEG_04611 114193358 2.318 3.437 S-adenosylmethionine synthetase 114197201 2.128 3.614 Hypothetical protein ATEG_04814 114193561 0.792 3.772 Sulfate adenylyltransferase 114189197 2.245 1.548 Hypothetical protein ATEG_06597 114191441 2.031 1.491 Thioredoxin 114190288 1.054 1.366 Hypothetical protein ATEG_07125 114190809 3.702 4.735 Commonly downregulated proteins at 0 PSU (28 nos.) 30 kDa heat shock protein 114195087 −1.489 −3.989 Hypothetical protein ATEG_03766 114193868 −3.495 −4.500 40S ribosomal protein S7 114193349 −0.400 −1.867 Hypothetical protein ATEG_04029 114194131 −0.329 −5.081 Adenosylhomocysteinase 114197109 −2.504 −1.255 Hypothetical protein ATEG_07892 114190454 −2.436 −3.554 Alcohol dehydrogenase I 114188844 −1.262 −2.186 Nucleoside diphosphate kinase 114189539 −0.270 −1.198 Allergen Asp f 15 precursor 114196299 −1.670 −1.123 Peptidyl-prolyl cis-trans isomerase, mp 114188009 −1.079 −1.164 ATP-citrate synthase subunit 1 114195637 −0.241 −1.403 Phosphoglycerate kinase 114197170 −0.876 −1.691 Cell division control protein 3 114191267 −0.026 −1.425 Pyruvate decarboxylase 114193380 −1.080 −1.857 Citrate synthase, mp 114189463 −1.648 −1.952 Pyruvate kinase 114193787 −1.254 −2.345 Cytochrome c peroxidase, mp 114194980 −2.517 −2.468 Superoxide dismutase, mp 114197603 −2.990 −5.415 Enolase 114194476 −0.766 −1.167 Transaldolase 114191388 −0.240 −1.012 Eukaryotic translation initiation factor 5A 114193909 −1.433 −2.481 Transketolase 1 114197498 −2.501 −3.119 Fructose-bisphosphate aldolase 114193450 −1.280 −2.084 Triosephosphate isomerase 114192224 −2.191 −2.825 Glyceraldehyde-3-phosphate dehydrogenase 114188308 −0.692 −1.064 Tubulin beta chain 114197233 −0.815 −2.778 Histone H2A 114189434 −0.898 −1.043 UDP-glucose 4-epimerase 114190193 −0.734 −2.722 Commonly upregulated proteins at 35 PSU (63 nos.) 2,3-bisphosphoglycerate-independent phosphoglycerate mutase 114196604 2.324 3.720 Heat shock 70 kDa protein 114187927 1.578 1.973 40S ribosomal protein S0 114194180 2.509 3.045 Heat shock protein 82 114189469 4.514 3.642 40S ribosomal protein S12 114194654 1.124 2.256 Hexokinase 114191625 2.103 1.510 40S ribosomal protein S4-A 114189168 0.829 1.918 Histone H4.2 114196427 0.609 1.157 40S ribosomal protein S5 114197792 0.692 2.155 Hypothetical protein ATEG_01302 114196359 0.892 1.508 40S ribosomal protein S7 114193349 1.349 2.410 Hypothetical protein ATEG_04182 114194284 1.632 2.166 60S ribosomal protein L13 114196001 0.697 2.429 Hypothetical protein ATEG_05472 114192841 1.102 1.171 60S ribosomal protein L14-A 114190763 1.619 1.637 Hypothetical protein ATEG_07125 114190809 0.681 1.325 60S ribosomal protein L17 114197587 0.870 1.694 Hypothetical protein ATEG_07222 114190906 1.819 1.008 60S ribosomal protein L23A 114188904 0.374 1.561 Inorganic pyrophosphatase 114196689 1.807 1.504 60S ribosomal protein L4-2 114188716 1.276 3.004 Ketol-acid reductoisomerase, mp 114195083 2.091 2.069 60S ribosomal protein L43 114187815 1.296 1.853 Malate dehydrogenase, mp 114191202 1.331 0.976 6-phosphogluconate dehydrogenase 114191912 1.563 2.096 Mitochondrial peroxiredoxin PRX1 114192711 2.872 3.131 Actin 114190657 1.288 1.599 Mitochondrial phosphate carrier protein 114197783 2.236 2.705 ADP, ATP carrier protein 114194661 0.997 1.245 Mitochondrial processing peptidase β subunit 114197569 2.160 3.326 ATP synthase alpha chain, mp 114193514 1.267 1.362 Outer mitochondrial membrane protein porin 114192911 1.732 0.165 ATP synthase beta chain, mp 114190171 1.010 1.178 Peptidyl-prolyl cis-trans isomerase cyp8 114192233 0.985 1.330 ATP-citrate synthase subunit 1 114195637 3.057 3.839 Phosphoglycerate kinase 114197170 0.272 1.118 Bacterial hemoglobin 114195409 2.965 5.151 Predicted protein 114191395 0.951 2.529 Cell division cycle protein 48 114187782 2.262 1.642 Protein MMF1, mp 114196923 1.349 0.962 Cerevisin precursor 114191390 1.711 1.105 Rab GDP-dissociation inhibitor 114196519 1.423 1.503 Conserved hypothetical protein 114196475 1.396 2.587 S-adenosylmethionine synthetase 114197201 2.622 3.822 Cytochrome c oxidase polypeptide IV, mp 114188084 3.281 3.780 Thioredoxin 114190288 5.011 5.532 Cytochrome c oxidase polypeptide VI, mp 114188679 1.105 1.648 Transaldolase 114191388 1.929 1.609 DNA damage checkpoint protein rad24 114188055 1.449 1.457 Transketolase 1 114197498 1.548 0.710 Elongation factor 1-alpha 114194584 1.020 1.685 Triosephosphate isomerase 114192224 1.975 2.215 Elongation factor 2 114196384 1.127 1.052 Tubulin beta chain 114197233 1.919 0.493 Eukaryotic initiation factor 4A 114196711 2.100 1.766 UDP-glucose 4-epimerase 114190193 2.064 1.063 Fructose-bisphosphate aldolase 114193450 0.739 1.528 Uricase 114196577 1.110 1.717 Glucose-6-phosphate isomerase 114193156 2.410 3.284 Vacuolar protease A precursor 114193423 1.442 1.539 Glyceraldehyde-3-phosphate dehydrogenase 114188308 0.718 1.222 Woronin body major protein 114191425 1.183 0.351 GTP-binding nuclear protein GSP1/Ran 114194939 2.158 2.763 Commonly downregulated proteins at 35 PSU (02 nos.) Catalase B precursor 114190039 −0.738 −1.267 Hypothetical protein ATEG_04940 114192309 −1.152 −3.181 Hypothetical protein ATEG_02219 114195481 −1.691 −0.240 Hypothetical protein ATEG_07892 114190454 −2.963 −0.709 Commonly upregulated proteins at 100 PSU (60 nos.) 40S ribosomal protein S12 114194654 1.270 0.419 ATP synthase D chain, mp 114190764 1.467 1.799 40S ribosomal protein S14 114196585 1.452 2.090 ATP synthase gamma chain, mp 114195813 1.783 2.225 40S ribosomal protein S18 114194976 1.482 1.444 ATP synthase subunit 4, mp 114193524 1.860 1.327 40S ribosomal protein S2 114189125 1.241 1.859 Bacterial hemoglobin 114195409 1.772 2.860 40S ribosomal protein S22 114192590 2.391 3.118 Cell division cycle protein 48 114187782 0.806 2.239 40S ribosomal protein S3 114194638 2.251 1.819 Cerevisin precursor 114191390 1.431 0.988 40S ribosomal protein S4-A 114189168 1.112 2.637 Citrate synthase, mp 114189463 0.473 1.825 40S ribosomal protein S5 114197792 1.161 1.795 Conserved hypothetical protein 114196475 2.126 2.297 40S ribosomal protein S6 114194091 2.466 4.689 Cytochrome c 114196337 1.893 1.957 40S ribosomal protein S7 114193349 1.105 2.259 Cytochrome c oxidase polypeptide IV, mp 114188084 0.740 1.015 40S ribosomal protein S8-B 114193882 1.527 3.730 D-3-phosphoglycerate dehydrogenase 2 114188915 0.435 2.825 60S acidic ribosomal protein P0 114195838 1.810 2.371 Dihydrolipoyllysine-residue acetyltransferase component of pyruvate dehydrogenase complex, mp 114191205 0.997 2.215 60S ribosomal protein L10-B 114188346 0.697 1.575 Elongation factor 1-alpha 114194584 0.602 1.119 60S ribosomal protein L11 114192799 1.454 3.276 Glucose-6-phosphate 1-dehydrogenase 114196680 4.509 4.948 60S ribosomal protein L12 114195804 0.921 1.374 Heat shock protein 60, mp 114188341 1.130 2.925 60S ribosomal protein L13 114196001 1.628 1.675 Heat shock protein 82 114189469 0.437 1.829 60S ribosomal protein L14-A 114190763 0.583 1.701 Heat shock protein SSC1, mp 114193179 0.308 1.746 60S ribosomal protein L17 114197587 3.057 4.125 Hypothetical protein ATEG_03432 114195006 2.416 2.892 60S ribosomal protein L2 114188833 3.644 3.886 Hypothetical protein ATEG_03766 114193868 0.613 1.904 60S ribosomal protein L20 114193847 0.326 1.473 Hypothetical protein ATEG_04611 114193358 2.060 1.378 60S ribosomal protein L22 114194260 1.264 1.760 Hypothetical protein ATEG_08708 114189140 2.900 2.194 60S ribosomal protein L23 114188046 1.750 2.336 Hypothetical protein ATEG_09084 114188521 0.106 1.874 60S ribosomal protein L23A 114188904 1.337 2.134 Isocitrate dehydrogenase subunit 2, mp 114197413 2.411 3.027 60S ribosomal protein L27a 114189407 1.732 3.080 Mitochondrial phosphate carrier protein 114197783 0.882 2.216 60S ribosomal protein L34-B 114188081 2.250 2.919 Mitochondrial processing peptidase β subunit 114197569 1.436 2.454 60S ribosomal protein L4-2 114188716 1.634 1.888 NADH-ubiquinone oxidoreductase 30.4 kDa subunit, mp 114191474 0.895 1.475 60S ribosomal protein L43 114187815 0.561 1.072 Peptidyl-prolyl cis-trans isomerase cyp8 114192233 1.009 0.636 60S ribosomal protein L7 114195468 1.105 1.453 Pyruvate dehydrogenase E1 component α subunit, mp 114193839 1.026 1.899 ADP, ATP carrier protein 114194661 0.351 1.904 Thioredoxin 114190288 2.358 1.839 Aspartate aminotransferase, mp 114197845 0.859 1.208 Tubulin beta chain 114197233 0.194 1.720 Commonly downregulated proteins at 100 PSU (14 nos.) 2,3-bisphosphoglycerate-independent phosphoglycerate mutase 114196604 −0.221 −1.250 Hypothetical protein ATEG_07892 114190454 −0.894 −3.342 Adenosylhomocysteinase 114197109 −1.786 −0.439 Inorganic pyrophosphatase 114196689 −0.643 −2.344 Aldehyde dehydrogenase 114192389 −1.095 −0.509 Phosphoglycerate kinase 114197170 −0.042 −1.044 Cytochrome c peroxidase, mp 114194980 −1.986 −1.345 Pyruvate kinase 114193787 −1.707 −1.342 Fructose-bisphosphate aldolase 114193450 −0.326 −1.110 Superoxide dismutase, mp 114197603 −2.076 −0.414 Glucose-6-phosphate isomerase 114193156 −1.044 −0.166 Transketolase 1 114197498 −1.322 −0.163 Hypothetical protein ATEG_03892 114193994 −1.528 −0.492 UTP--glucose-1-phosphate uridylyltransferase 114196870 −0.195 −1.299 FCa = fold change values for proteins expressed under chromium stress (100 ppm vs. 0 ppm); FCb = fold change values for proteins expressed under chromium stress (500 ppm vs. 0 ppm); mp = mitochondrial precursor. -
This study provides an in-depth mechanistic insight into how a marine-derived Aspergillus terreus isolate responds to simultaneous hypersaline (100 PSU) and Cr+6 stress—conditions that mimic industrial effluents from tanneries, electroplating, and salt-production sites where heavy metals and high ionic strength co-occur. Cr+6 is recognised for its high mobility, toxicity, and ability to induce oxidative and genotoxic stress, while hypersalinity creates osmotic and ionic stress that impairs many traditional bioremediation microbes.
Metal tolerance in A. terreus has been extensively explored and well cited[26,27]. When subjected to multi-metal stress, Aspergillus fumigatus PD-18, isolated from polluted banks of the Yamuna River, India expressed about 2,190 proteins, of which 387 were exclusively present under stressed conditions[19]. In another study, 2,646 proteins were identified in Aspergillus ochraceus grown on 20 and 70 g/L NaCl substrates, resulting in elevated ergosterol production[9]. In our study, we have shown a synergistic effect of hypersalinity and heavy metal stress on A. terreus.
Survival mechanisms in fungi are broadly categorised as extracellular mechanisms involving biosorption, bioleaching, biotransformation, and bioprecipitation, and intracellular mechanisms where enzymatic transformation, chelation, and multiple signalling pathways play a very important role, along with transporter proteins[27]. The most prominent transporters identified in fungi are reported to be ATP-binding cassette (ABC) transporters, conjugated ABC transporters (CT), cation diffusion transporters (CDF), MIT family (Cor A metal ion transporters), SIT (siderophore ion transport) subfamily under major facilitator superfamily (MFS), mitochondrial carriers, P-type ATPases, and Nramp family transporters[9,28]. Some of these were identified in the present study too (Table 2, Fig. 2). MacDiarmid & Gardner[14] reported aluminium tolerance in Saccharomyces cerevisiae due to overexpression of Mg transporters (ALR1/ALR2). In another study, Mg transporters conferred resistance to Co+2 growth inhibition in Salmonella typhimurium[29].
Fungi in the marine environment initially need to adapt to high osmotic pressure and then devise mechanisms to tolerate any metal stress. Salinity stress alone (100 PSU) caused the expression of some of the very important proteins, such as the 3-hydroxy-3-methylglutaryl-coenzyme A (HMG-CoA) reductase, a key enzyme in the mevalonate pathway and sterol biosynthesis[17], as reported in this study. Aspergillus terreus (NTOU4989) isolated from a Kueishan Island hydrothermal vent showed upregulation of glycerol lipid metabolism, mitogen-activated protein kinase, and pyrroline-5-carboxylate dehydrogenase genes in the presence of salt[21]. Another study reported overexpression of specific alkaloids in A. terreus, an endophyte isolated from Porites pukoensis, Xuwen coral reef, China, in the presence of 10% salt in PDB, known to modulate cell membranes and regulate membrane fluidity[22]. Interestingly, the endophytic fungus A. terreus isolated from the roots of Chenopodium album (wheat) under saline conditions showed low activities of ascorbate, catalase, and peroxidase[23]. Collectively, these three studies demonstrated that diverse A. terreus strains modulate both primary and secondary metabolism under salinity stress, regardless of ecological origin. Transcriptional activation of osmoadaptive pathways and alkaloid biosynthesis demonstrates the multi-faceted influence of salinity on metabolic output and stress physiology in fungi. The synergistic effect of salinity and Cr+6 stress led to four major stress response-related mechanisms in the current study (Fig. 3).
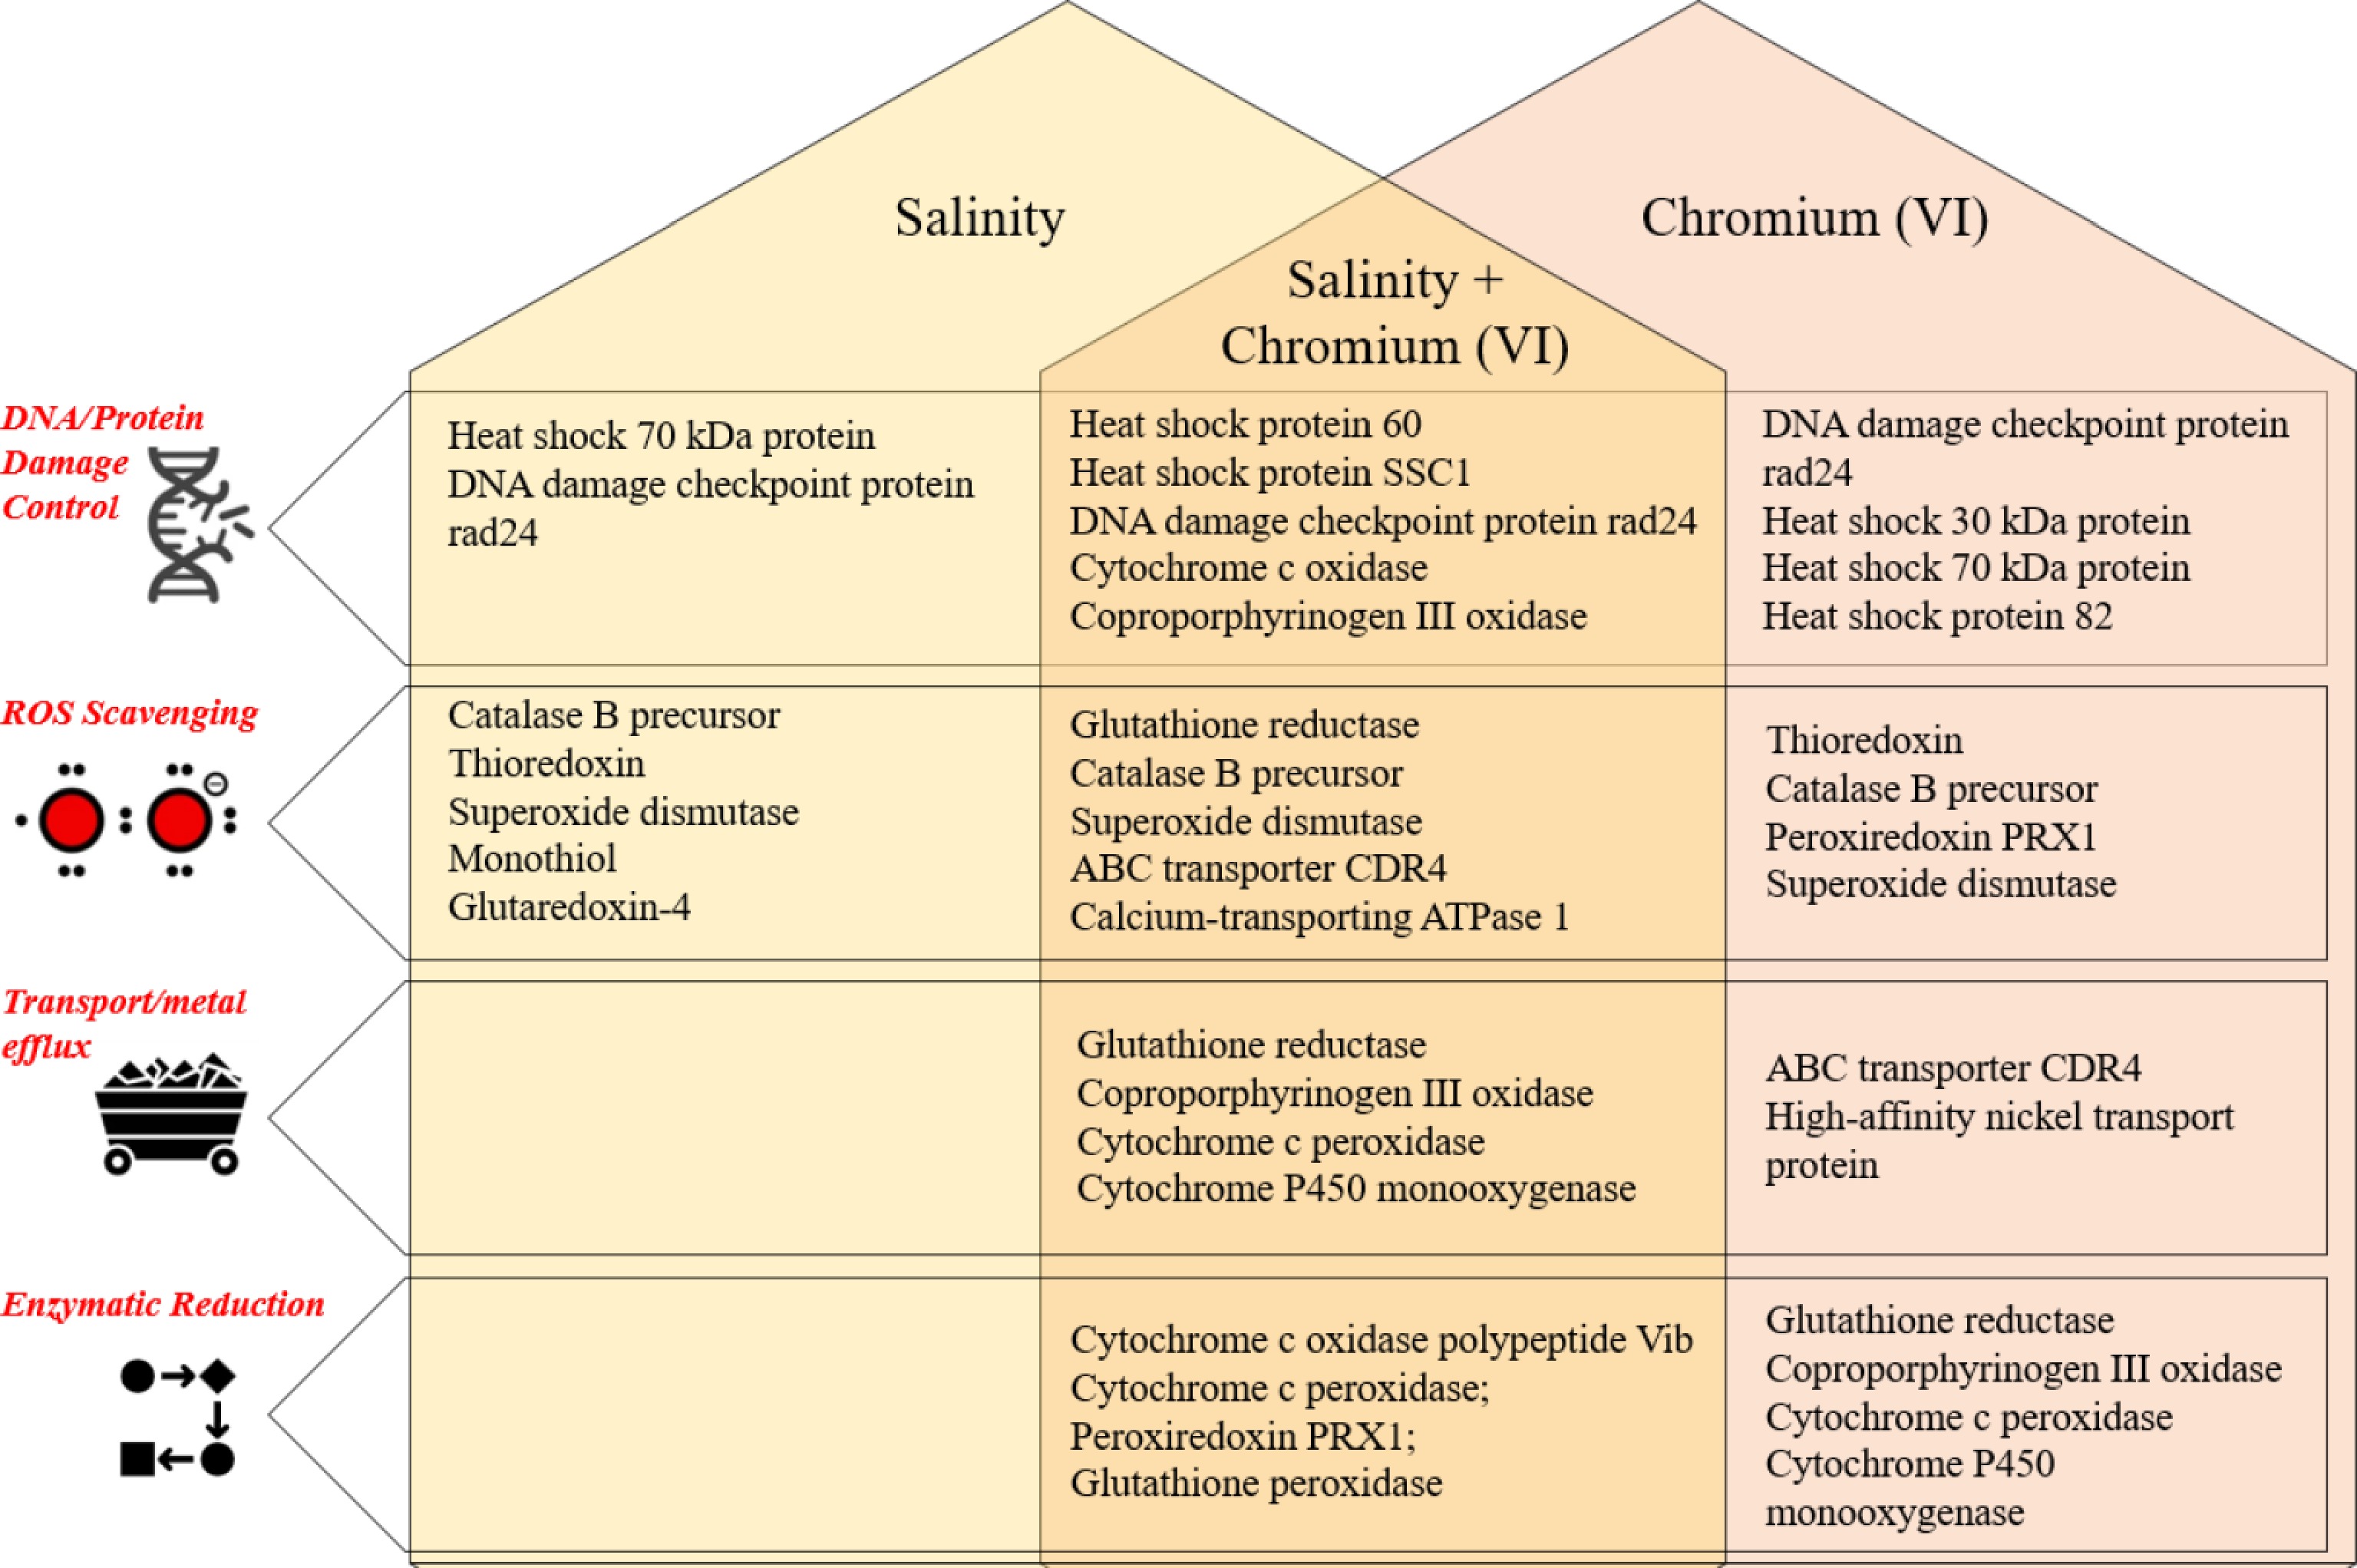
Figure 3.
Mechanism of metal tolerance by A. terreus (#NIOSN-SK56-S52) under salinity and chromium stress.
Sodium ions, which are themselves toxic, act as signalling molecules to open up non-selective cation channels within the cell membrane, causing activation of Ca+2 transporters, MAPK pathways, ROS generation, and activation of subsequent repair mechanisms such as SOS repair and production of NADPH oxidase[30] HMG-CoA, also identified as the biochemical signature of halophily, is reportedly involved in post-translational modification by prenylation in H. werneckii and catering to metabolic demands under hypo-, hypersaline conditions[31]. Protein kinases, a group of silent stress busters, are widely reported and cited in eukaryotic systems for regulatory roles in managing stress response[32]. Expression of proteins involved in signalling, regulation, or the promotion of protein kinase production is indicative of stressful conditions. Almeida-Dalmet et al.[33] reported upregulated expression of the protein kinase gene and phenyl acetyl CoA ligase gene under salinity and temperature stresses in the Haloarcula strain.
ROS-generated stress leads to the production of proteins such as kinases and phosphatases, which may be grouped as salt stress proteins that further enhance the production of proteins involved in cell wall building, nutrient metabolism, carbohydrate metabolism, and cell enlargement and division[34]. Both enzymatic (catalase, superoxide dismutase, peroxidases, glutathione reductases) and non-enzymatic (ascorbic acid, glutathione, phenolics, proline) antioxidants have immense ability to scavenge ROS[18]. Ankyrin repeats have also been reported to participate in ROS under salt stress[35]. Some of these proteins were expressed under salinity stress in the current study (Tables 1, 2). Proteins such as thioredoxin, catalase, superoxide dismutase, and glutathione S-transferase, along with heat shock proteins have been previously reported in the opportunistic pathogen, A. terreus, when subjected to 37 °C for 48 h and exposed to amphotericin B[20]. Toxicity of metal, once within the cell, can be curbed using multiple measures, one of which is organelle compartmentation or vacuolar accumulation after being chelated using glutathione, metallothioneins, or phytochelatins, as in the case of hyperaccumulating plants[36,37]. Expression of these T-complex proteins (TCPs) has been reported to be dominant under salt stress, along with heat shock proteins[38], and was detected under 35 and 100 PSU salt stress in the current study. Elevated salt concentrations may cause physiological changes in subjected organisms and trigger molecular, cellular, and metabolic responses. Expression of stress proteins, proteins involved in oxidative phosphorylation, and transporter proteins was observed under Cr+6 stress and increasing salinity, indicating a synergistic effect of both stresses on the culture.
Housekeeping proteins are vital for survival and are expressed in organisms at all times, irrespective of favourable or stressful conditions[39]. However, their expression may be altered or become irregular under certain conditions[40]. We found changes in the expressions of some housekeeping proteins in response to the stress imparted. Glyceraldehyde-3-phosphate dehydrogenase expression was downregulated at 0 PSU salt concentration in the presence of Cr+6, but was upregulated at 100 PSU (Table 3). Similarly, the expression of the Tubulin beta chain varied under different salt concentrations in the presence of metal. Differential expression of glyceraldehyde-3-phosphate dehydrogenase and beta-actin genes was also reported during the course of hepatitis C virus-induced hepatocellular carcinoma (HCV-HCC)[41]. Further, this differential expression property has previously been used to diagnose lung cancer[42]. Therefore, any drastic variations in the expression levels of such genes may shed light on an organism's adaptive strategies in the presence of stress. On the contrary, relying solely on the expression of housekeeping genes as an internal reference may not always generate dependable results. A study by Irie et al.[43] reported that atorvastatin altered the expression of housekeeping genes, thereby misleading the data obtained for the target gene expression set, and emphasised caution when using internal reference gene expression data, especially in cancer-related studies. Such caution during experimental setup has also been reported previously[44]. Although RT-qPCR analysis of this gene expression in the current study would shed more light on this conclusion, the preliminary experiments also provide reliable proof.
-
This study shows that the marine-derived A. terreus employs a coordinated and multi-layered defense network to survive the combined effects of Cr+6 stress and hypersaline (100 PSU) conditions. Based on proteomics results, the isolate primarily activates DNA damage control and repair systems, in addition to robust ROS detoxification mechanisms, when exposed to salinity alone, thereby protecting cellular components and genomic integrity. The addition of Cr+6 induces further adaptive responses, such as upregulation of membrane transporters to mediate metal and ion flux and the conversion of toxic Cr+6 to the less harmful Cr+3 via enzymatic reduction pathways. Together, these systems lessen the cumulative harm and enable the cell to redistribute resources from growth to essential survival functions. The ecological adaptability of A. terreus and its potential for bioremediation of saline, metal-contaminated wastewaters are highlighted by its ability to continue functioning under extreme ionic and oxidative pressures, where conventional microorganisms are ineffective. Together, these abilities contribute to the strategic application of marine fungi for high-salinity sustainable heavy-metal remediation technologies, and enhance our knowledge of fungal stress adaptation.
-
The authors confirm their contributions to the paper as follows: conceptualised: Lotlikar NP, Damare SR; carried out as part of the doctoral thesis: Lotlikar NP. Both authors reviewed the results and approved the final version of the manuscript.
-
Data will be made available on request.
-
The first author is thankful to the Council of Scientific and Industrial Research (CSIR) for the fellowship 18-12/2011(ii)EU-V and the Director, CSIR-NIO, for providing the facilities. Both authors are thankful to the Council of Scientific and Industrial Research (CSIR), Govt. of India, for funding this work under the project PSC0206. The first author is thankful to the Council of Scientific and Industrial Research (CSIR) for the fellowship 18-12/2011(ii)EU-V. The authors are also thankful to anonymous reviewers for their comments, which improved the manuscript.
-
The authors declare that they have no conflict of interest.
- Copyright: © 2026 by the author(s). Published by Maximum Academic Press, Fayetteville, GA. This article is an open access article distributed under Creative Commons Attribution License (CC BY 4.0), visit https://creativecommons.org/licenses/by/4.0/.
-
About this article
Cite this article
Lotlikar NP, Damare SR. 2026. Adaptive responses of marine-derived Aspergillus terreus to salinity and chromium stress analysed by peptide mass fingerprinting. Studies in Fungi 11: e018 doi: 10.48130/sif-0026-0015 

Adaptive responses of marine-derived Aspergillus terreus to salinity and chromium stress analysed by peptide mass fingerprinting
- Received: 28 May 2025
- Revised: 20 March 2026
- Accepted: 10 April 2026
- Published online: 16 June 2026
Abstract: Fungi inhabiting marine environments often exhibit physiological and biochemical traits that enable survival in saline conditions, distinguishing them from many terrestrial counterparts. The presence of soluble osmolytes, affinity for sodium ions, and streamlined genomes aid marine biota to survive hypertonic environments. With the rise in anthropogenic activities, marine biota face multiple stresses that demand immediate acclimation and adaptation. This study evaluated the cellular responses of a marine-derived fungal isolate to variable salinities and Cr+6 concentrations using peptide mass fingerprinting on an LC-MS-MS QToF. The whole-cell proteins were extracted and digested with trypsin. A total of 659 proteins across nine variable conditions, including salinity (0, 35, 100 PSU) and Cr+6 (0, 100, 500 mg/L), were detected. Fifty-three housekeeping proteins were expressed across all conditions, categorised into carbohydrate metabolism, nucleotide metabolism, genetic information processing, and cellular processes using KEGG pathways. Variation in salinity led to the expression of proteins associated with DNA damage control and Reactive Oxygen Species (ROS) scavenging mechanisms, whereas an increase in Cr+6 concentration triggered the expression of proteins involved in enzymatic reduction and in transport/metal efflux. Thioredoxin expression was upregulated with fold change values of 5.011 and 5.032 at 100, and 500 mg/L Cr+6 at 35 PSU, and 2.358 and 1.839 at the same Cr+6 concentrations at 100 PSU. This indicated that upregulation of ROS-scavenging proteins was the predominant mechanism used by A. terreus under elevated Cr+6 and salt concentrations. This study observed the expression of multiple stress tolerance mechanisms to combat the synergistic effects of salt and Cr+6.
-
Key words:
- Marine-derived fungi /
- Protein expression /
- Reactive oxygen species /
- Stress tolerance /
- LC-MS-MS