


-
Surface water is a critical resource for maintaining ecosystem health and supporting sustainable development. Faced with escalating challenges from global water scarcity and climate change, establishing a scientific and efficient surface water monitoring system has become essential. Such a system serves as the prerequisite for effective water-resource protection and precision management. A robust monitoring system not only provides the data needed to assess water status, identify pollution sources, and issue early warnings, but also supplies the evidence base for formulating management decisions, evaluating governance measures, and enforcing regulatory compliance.
Over recent decades, the European Union (EU) and the United States (US) have developed distinctive and influential monitoring and assessment systems. Centered on the Water Framework Directive (WFD), the EU has established a unified monitoring framework grounded in holistic watershed management that prioritizes ecological and chemical status[1]. By contrast, under the Clean Water Act (CWA), the US has operated through a collaborative federal–state model aimed at protecting designated uses. This approach combines national-scale probabilistic surveys with targeted state-level monitoring, thereby balancing the statistical representativeness required for broad assessment with the flexibility needed for local management[2,3]. Hence, a systematic comparison of the logical frameworks and implementation mechanisms of those two systems can enhance the understanding of monitoring strategies under different governance models.
Based on the above purpose, this review summarizes surface water monitoring architectures in the EU and the US. By comparing their core legislation, management objectives, and network designs, it aims to clarify the underlying logic and key characteristics of the two systems and to provide a comparative reference for the modernization of water-quality monitoring. The analysis may also offer lessons for other countries facing similar challenges in the development or optimization of surface water monitoring systems.
-
The EU surface water monitoring system is founded on the Water Framework Directive (WFD), whose central management objective is to ensure that all surface water bodies achieve and maintain a good status[1]. The classification of monitoring networks, the development of indicator systems, and the spatial distribution of monitoring sites are therefore strictly aligned with that objective[1,4]. The construction of the monitoring system and network architecture under the WFD, organized around its management objectives, is summarized below, and the overall framework and interactions among components are illustrated in Fig. 1.
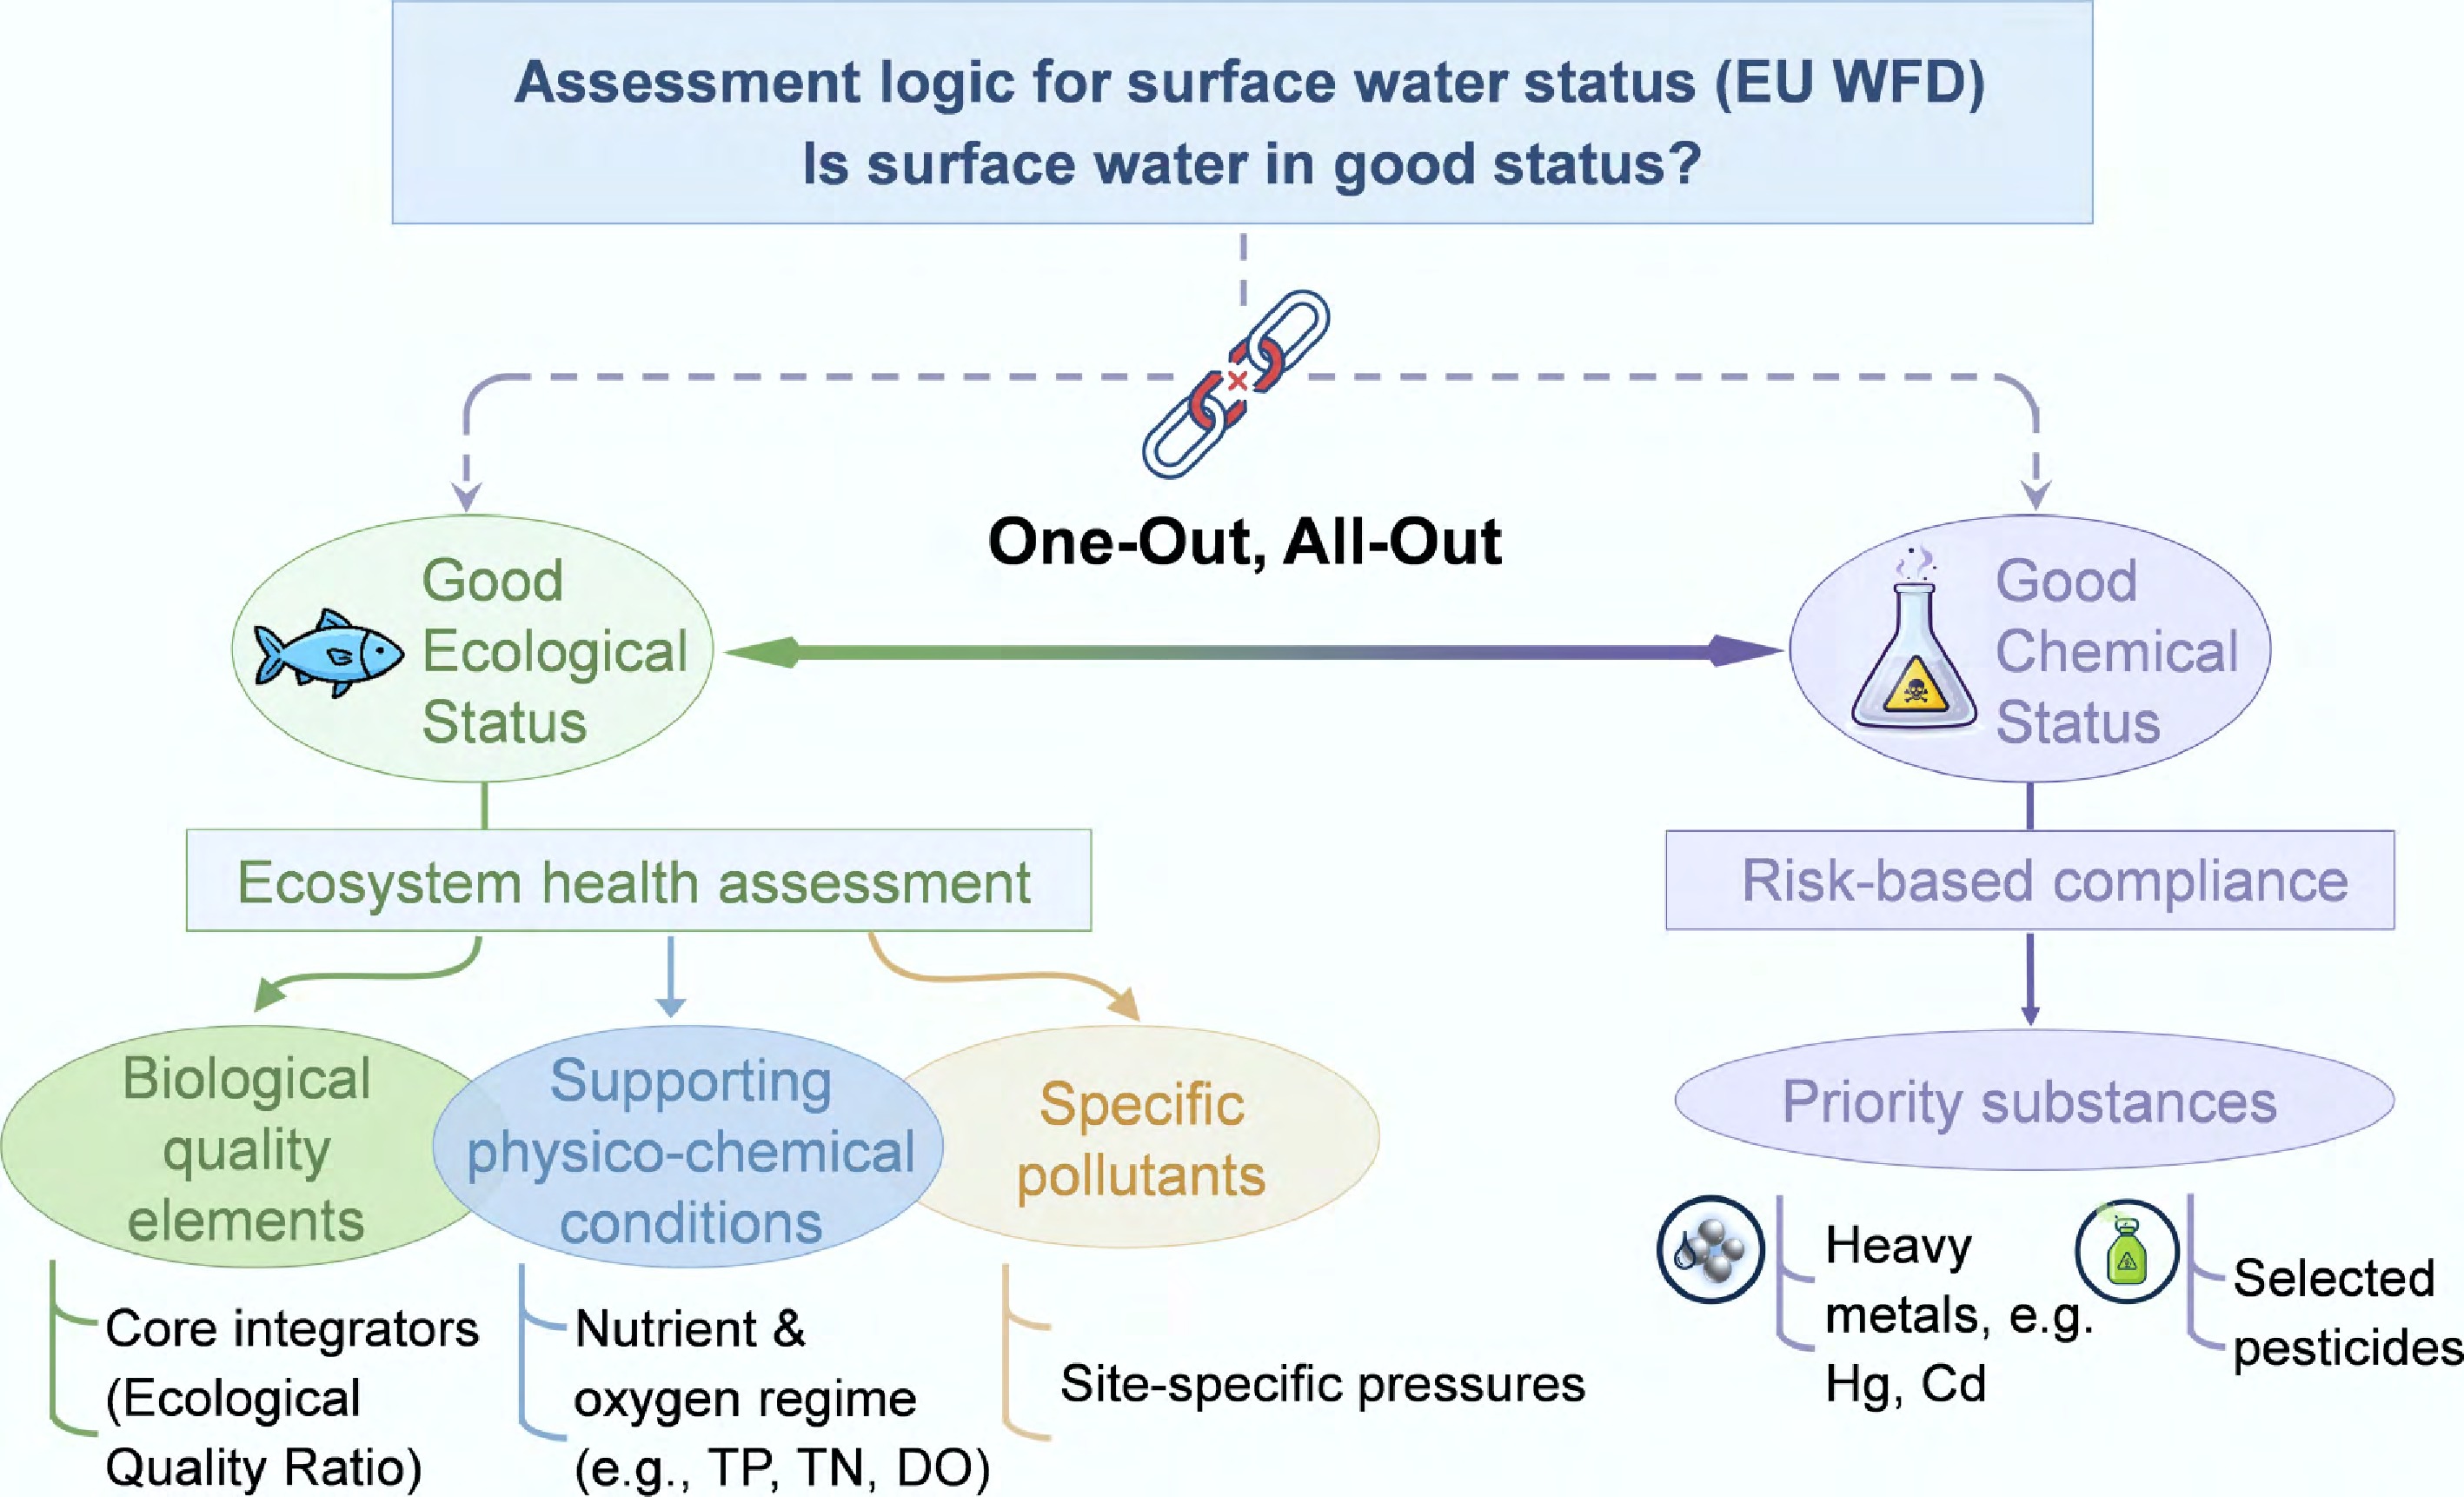
Figure 1.
Assessment logic for surface water status under the WFD.
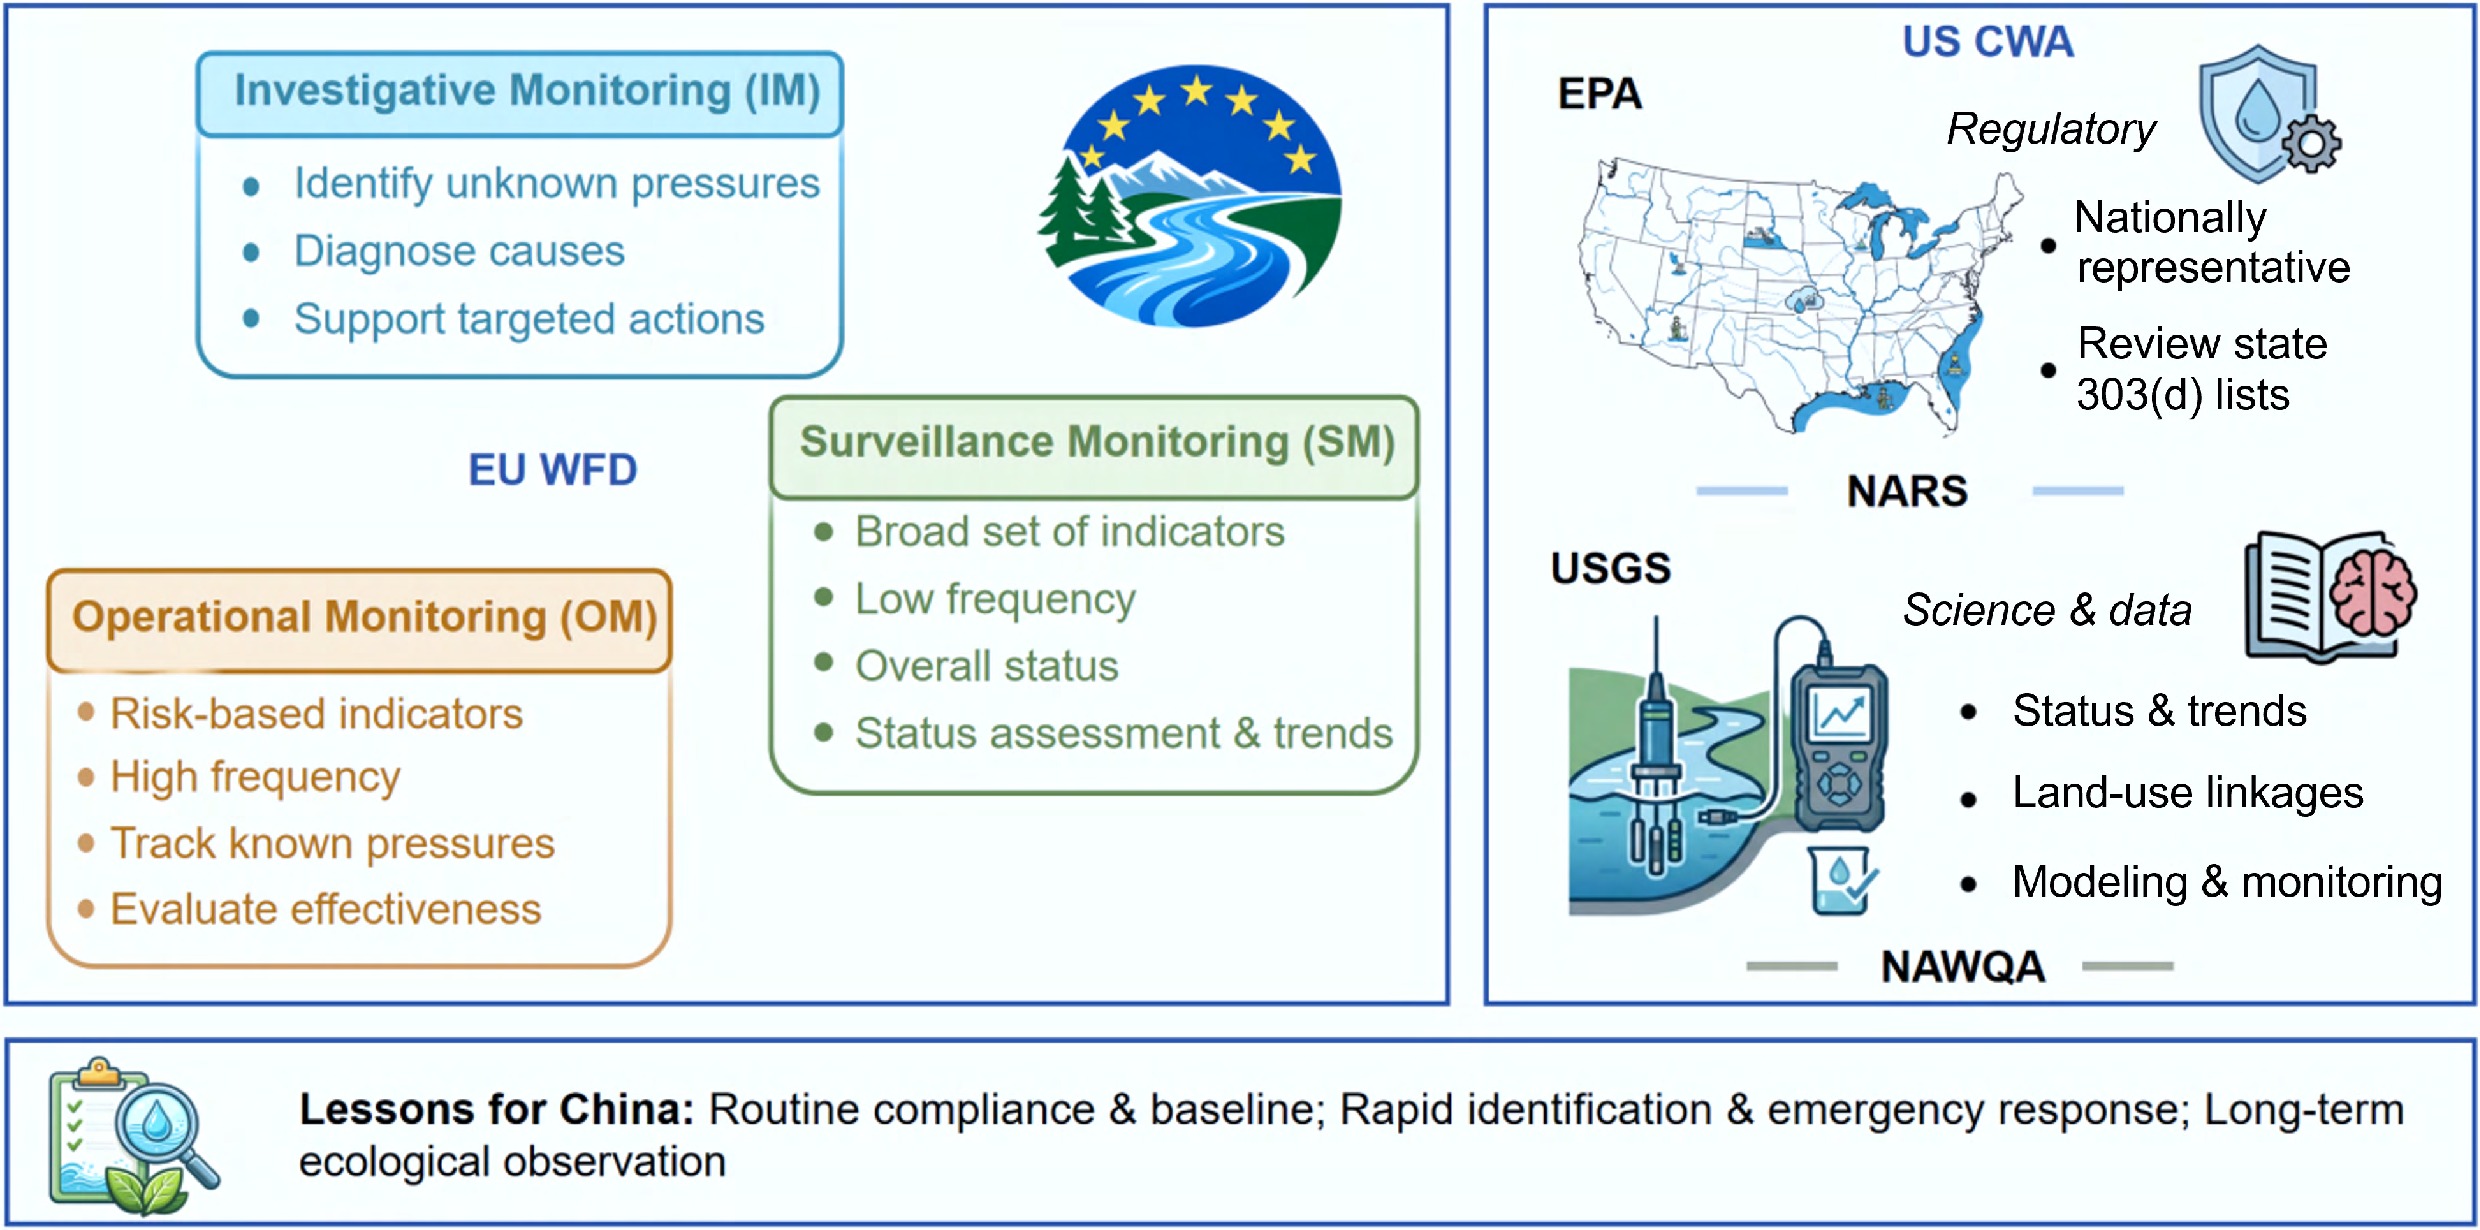
The design logic of the EU system addresses three critical management inquiries, including determining whether a water body is currently in good status, identifying the primary drivers in cases of non-compliance, and determining the necessary adjustments to management interventions[1,4]. Consequently, monitoring serves as the foundation for the continuous cycle of assessment, diagnosis, and management within the watershed framework.
A water body achieves good status only when good ecological status and good chemical status are both met, applying a one-out, all-out decision rule. Ecological status is based on biological quality elements and supported by physicochemical conditions and specific pollutants. Common supporting metrics include total phosphorus (TP), total nitrogen (TN), and dissolved oxygen (DO), and biological assessments are often reported using the Ecological Quality Ratio (EQR). Chemical status is determined via risk-based compliance against priority substances assessed under EQS, including heavy metals such as Hg and Cd, and selected pesticides.
The WFD classifies water body status into two dimensions: ecological status and chemical status. Both must reach good levels, and the final classification follows the one-out, all-out principle[1,5]. Chemical status is evaluated against the EU's Environmental Quality Standards (EQS). This assessment focuses on priority substances that pose high risks to ecology or human health, including selected metals, pesticides, and other persistent toxic substances[6,7]. If any single substance exceeds the EQS, chemical status is classified as failing; this component therefore serves as the safety baseline of the system[6].
Ecological status is assessed mainly through aquatic biological communities, which reflect environmental disturbance through the composition and abundance of key groups such as fish, benthic invertebrates, and phytoplankton[1,4]. Because aquatic organisms function as long-term environmental receptors, they serve as integrative indicators of overall ecosystem health. To assess ecological status, the system considers two dimensions: biological quality elements, which directly reflect community composition and abundance, and supporting elements that may exert pressure on them. The latter include conventional physicochemical indicators, such as total phosphorus and total nitrogen, and watershed-relevant specific pollutants[4,8]. These supporting elements help diagnose potential pressure sources behind biological degradation. During assessment, biological elements, physicochemical elements, and specific pollutants also follow the one-out, all-out principle; if any element fails, ecological status is classified as non-compliant[1,5].
To support this status assessment, the WFD establishes systematic principles for monitoring site selection. First, the monitoring network must cover all hydromorphological types to ensure representation of natural variations and regional differences across water bodies[4,8]. Second, sites must exhibit typicality and comparability; representative sections within the same water body type are selected to facilitate the establishment of reference conditions and long-term trend analysis[8]. Third, to meet the requirements of holistic watershed management, sites should be distributed along main river stems and key tributaries, maintaining continuity from source to downstream to identify longitudinal trends[4]. Finally, site selection must consider the spatial distribution of pressures. For instance, sites capable of capturing pressure changes are deployed downstream of agricultural zones, human settlements, or industrial belts to ensure the monitoring is responsive to management needs[4]. Based on these principles, the WFD establishes three complementary monitoring networks: Surveillance Monitoring (SM), Operational Monitoring (OM), and Investigative Monitoring (IM) (Table 1)[4,9].
Table 1. Comparison of the EU surface water monitoring types
Type Objectives Site selection strategy Key parameters
and elementsFrequency and timing Typical outputs Surveillance monitoring
(SM)Assessment of baseline status and long-term trends; Validation of pressure and impact analyses. Located at the main river stems, key control sections, representative lakes, and estuaries to cover major water body types. EQR; Priority substances and river basin specific pollutants; Multi-media matrices where applicable. Cross-seasonal sampling over multi-year cycles; Integration with automated stations where feasible. Establishment of ecological and chemical baselines; Identification of long-term trends; Risk screening. Operational monitoring
(OM)Compliance diagnosis for at-risk water bodies; Evaluation of the effectiveness of management measures. Targeted deployment at sensitive reaches subject
to dominant pressures; Locations requiring increased temporal resolution.Pressure-specific indicator combinations (e.g., nutrients, dissolved oxygen, salinity, hydromorphology, and specific substances). Frequencies adapted to parameter variability; Intensified sampling during critical periods or for event monitoring. Trajectories of compliance status; Assessment of measure efficacy; Prioritization of management actions. Investigative monitoring
(IM)Diagnosis of causes for status deterioration; Source tracing for anomalies or accidental pollution events. Flexible and intensified deployment; Situated upstream or downstream
of suspected sources, tributaries, or point source perimeters.Expanded screening, including suspended solids, sediments, and biota; Application of source tracing and fingerprinting techniques. Temporary, high-frequency sampling campaigns. Determination of causes; Recommendations for intervention; Evidence base for network optimization. SM is designed to characterize the overall status and long-term trends of water bodies, encompassing adequate parameters relevant to ecological and chemical assessment[4]. For ecological status assessment, this network employs the Ecological Quality Ratio (EQR) as the primary metric. The EQR represents the ratio between observed biological values and type-specific reference conditions indicative of minimal anthropogenic disturbance, which corresponds to high ecological status[5,8]. This ratio quantifies the deviation caused by anthropogenic activities. In cases of heavily modified or artificial water bodies where natural reference conditions are unattainable, the management objective is adjusted to Good Ecological Potential (GEP). GEP defines the optimal ecological condition achievable without significantly compromising specific socio-economic functions, thus serving as the alternative reference baseline[5]. SM is conducted at least once per management cycle; the resulting data support the current status evaluation and provide the baseline for future goal setting and management planning[4].
OM targets water bodies identified as being at risk of failing environmental objectives. Its primary functions are to assess the magnitude of specific pressures and to evaluate the efficacy of remedial measures. Monitoring sites are strategically located in areas subject to significant pressures, such as downstream of urban wastewater discharges, intensive agricultural zones, or industrial complexes. Sampling frequency of OM exceeds that of SM to enable the tracking of pressure dynamics on shorter time scales[4]. Consequently, OM allows management authorities to determine the effectiveness of pollution control actions, rendering it a central tool in practical watershed management[4,9].
IM serves as a responsive diagnostic mechanism. It is triggered when SM or OM detects a deterioration in water status that cannot be explained by known pressures or existing indicators[4,9]. This form of monitoring typically involves intensive sampling, the use of supplementary indicators, or field experiments to identify unknown pollution sources. Upon identification of the cause, the management authority updates the OM program with specific sites and indicators to guide subsequent management phases[4,9].
Example of logic in the EU surface water monitoring network design
-
To elucidate the design logic of the EU surface water monitoring networks and the allocation of network functions under the WFD, the management measures applied to a surface water body downstream of a tributary of River X over a six-year management cycle (Year Y–Y + 5) were used as a demonstration. The complete management cycle is illustrated in Fig. 2.
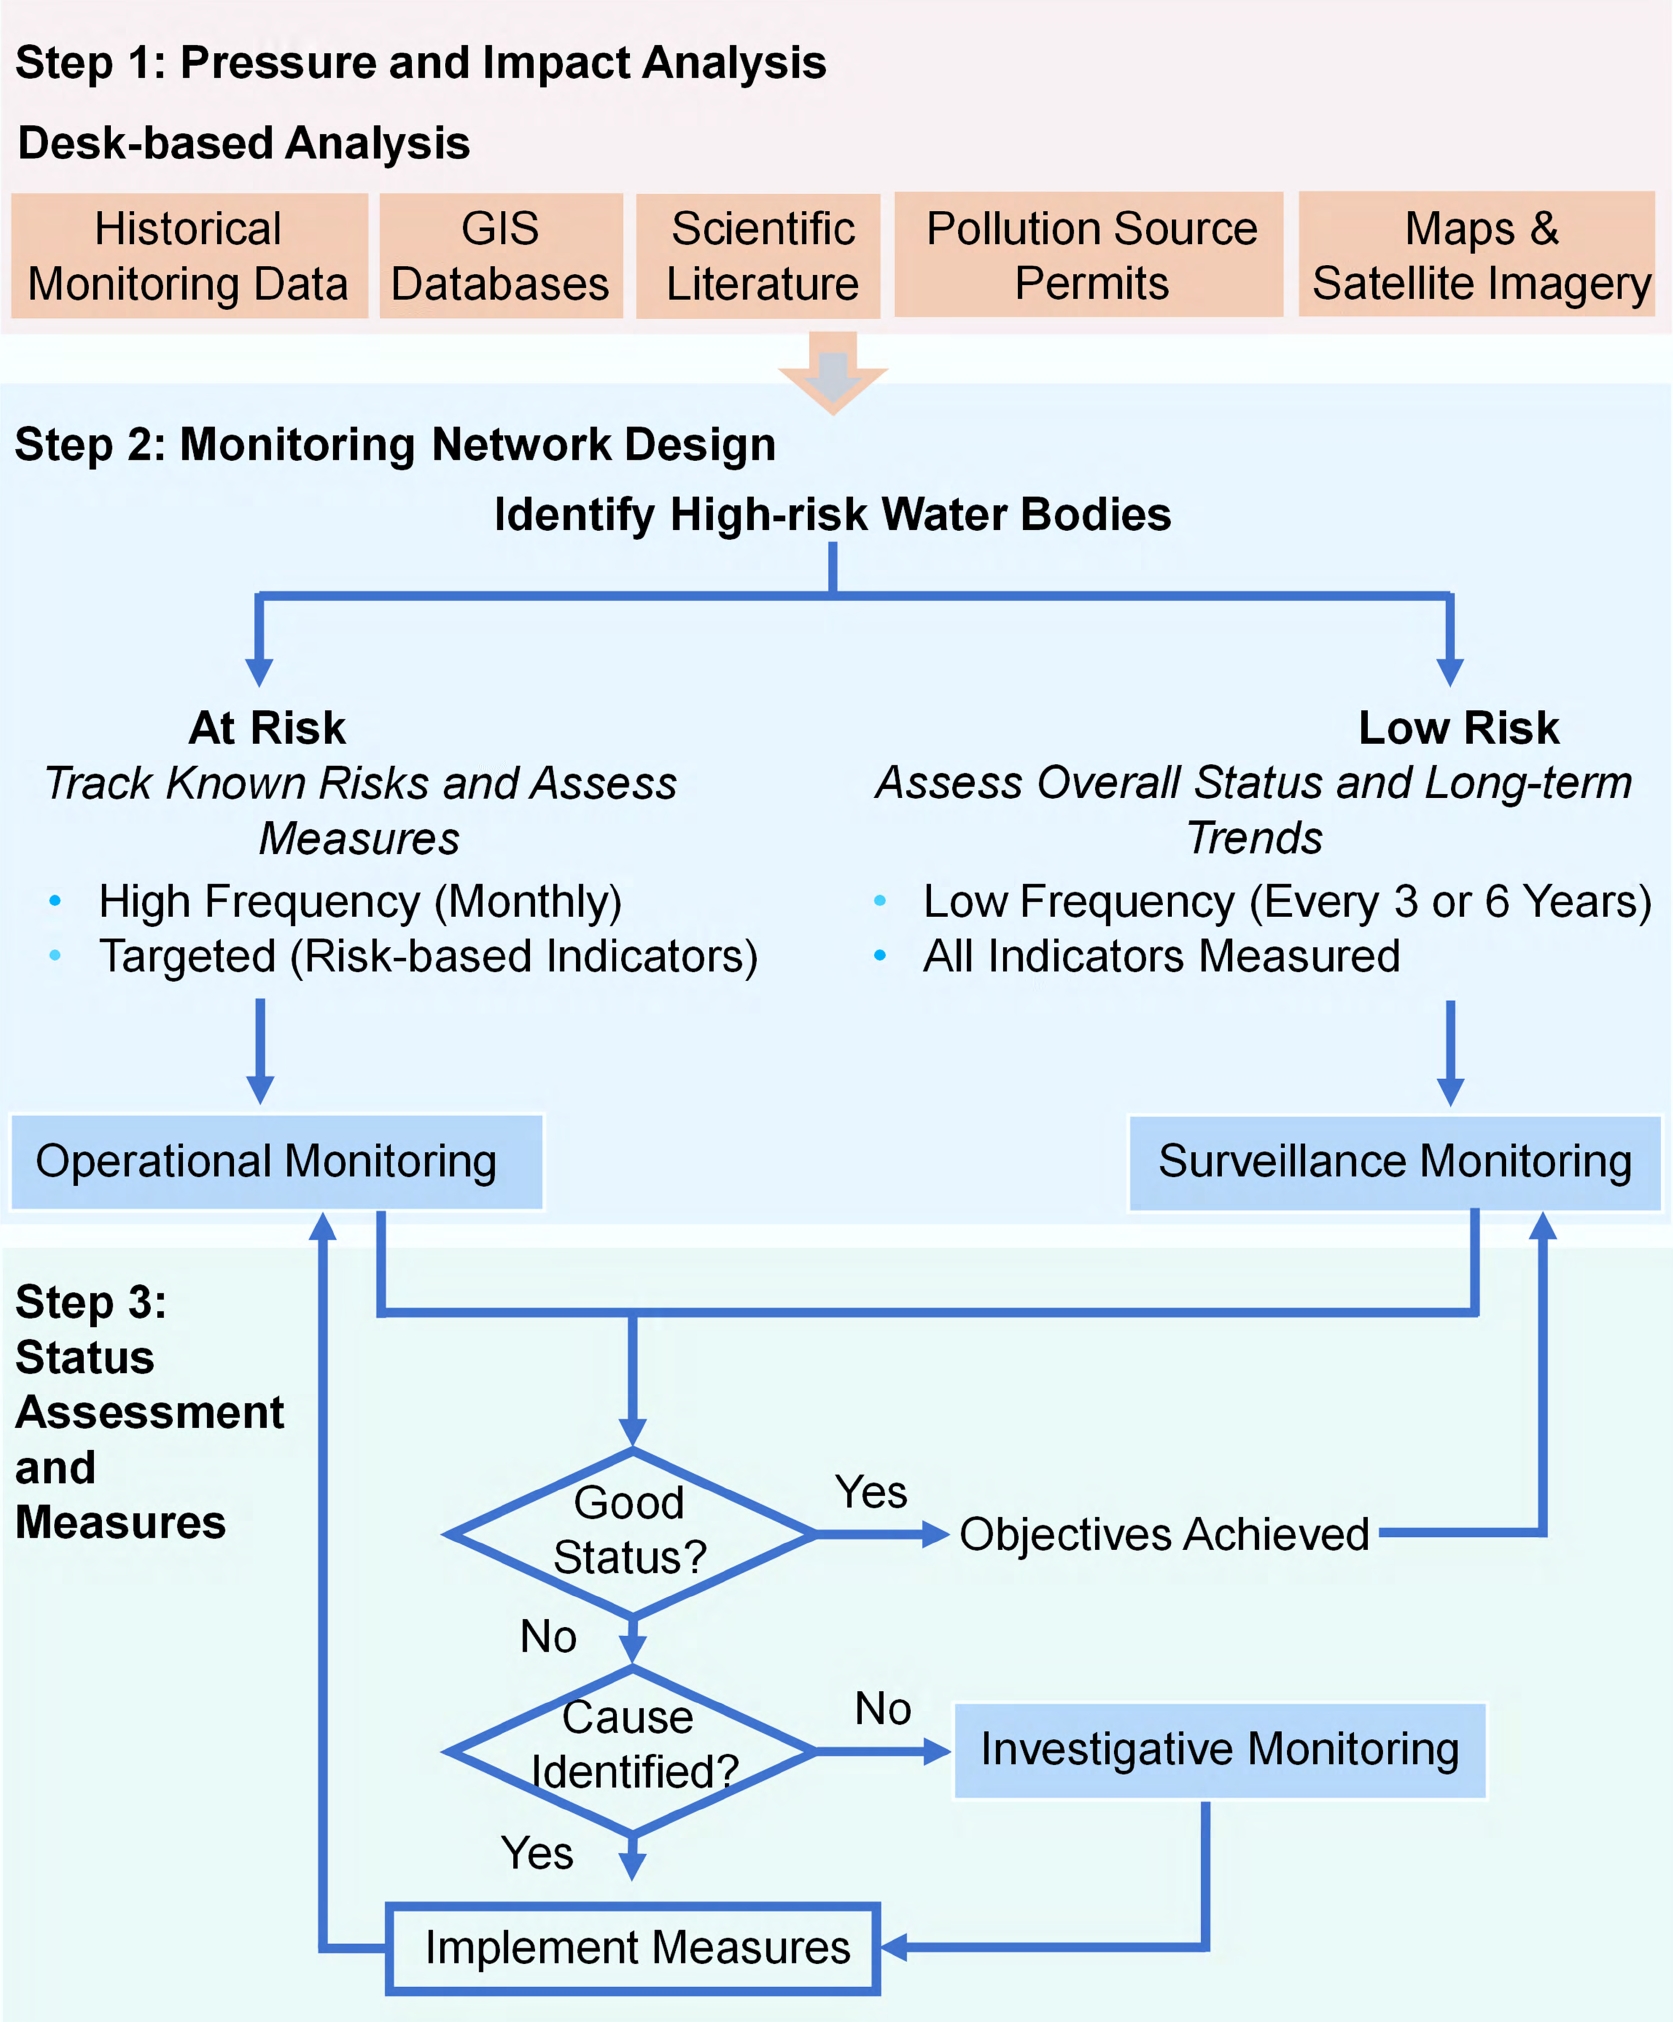
Figure 2.
Execution logic linking surveillance monitoring (SM), operational monitoring (OM), and investigative monitoring (IM) within a six-year management cycle.
Water bodies are periodically screened for the risk of failing management objectives. Low-risk water bodies are placed under SM to provide an overall appraisal of status and long-term trends using a broad suite of indicators at a lower sampling frequency. Water bodies identified as at risk, with known pressures, are assigned to OM, which targets pressure–responsive indicators at a higher sampling frequency to track those pressures and evaluate the effectiveness of implemented measures. When exceedances or deterioration cannot be explained by known pressures or existing evidence, IM is initiated to identify unknown pressures and diagnose causes; once the causal pathway is clarified, monitoring transitions to OM to support targeted actions. When pressures are mitigated and measures are demonstrably effective, monitoring can shift from OM back to SM.
In step 1 of Year Y, the River X basin management authority conducts the statutory analysis of basin pressures and impacts in accordance with Article 5 of the WFD[1]. This analysis relies primarily on desktop studies, integrating geographic information system data, remote sensing imagery, land use databases, historical monitoring records, scientific literature, and discharge permit information. Through a comprehensive assessment of these materials, the authority identifies that the primary pressure originates from Chemical Enterprise Z, located within a chemical industrial park. The discharge permit for Enterprise Z explicitly lists two key substances: mercury (a priority substance subject to EQS) and total phosphorus (TP, a general physicochemical supporting parameter). Due to the presence of a distinct point source with high potential impact, the water body is designated as 'at risk' during the planning phase.
In step 2 from Year Y to Year Y + 1, based on risk identification results, the management authority establishes a targeted monitoring network for this management unit. To address the identified high-intensity point source pollution, OM sites are established downstream of the discharge outlet, excluding the mixing zone. With a relatively high sampling frequency (e.g., monthly), these sites focus on mercury and TP, which correlate strongly with the pressure source, to evaluate the effectiveness of existing measures and determine if the pressure continues to impact water status. Simultaneously, in compliance with the site selection principles stipulated in WFD Annex V[1], the authority selects a river section representative of the overall ecological and physicochemical status to establish SM sites. The principles of Annex V emphasize representativeness, requiring sites to reflect the comprehensive characteristics of the management unit, including hydrology, land use, pollution sources, and biological habitats. SM sites are typically monitored at a lower frequency, for example, once every three years, but maintain broad indicator coverage, including biological quality elements, general physicochemical parameters, specific pollutants, and priority substances. This comprehensive indicator set is designed to capture the baseline status of the water body and to assess long-term temporal trends.
During this management cycle, comprehensive assessments are conducted in the third year (Year Y + 2) and the sixth year (Year Y + 5) based on SM and OM results. Under the one-out, all-out principle, failure of any single quality element results in an overall failure classification. According to WFD Annex V and the Common Implementation Strategy Guidance Document No. 7 (Monitoring under the Water Framework Directive)[1,4], the mid-term assessment falls into one of three scenarios.
In the first scenario, both SM and OM are compliant, with SM data showing that ecological and chemical status, together with general physicochemical parameters, meet regulatory standards and OM confirming consistent compliance of key pressure-related indicators. In that case, the water body is assessed as being in good status, the management authority maintains existing measures, and the monitoring schedule continues unchanged.
In the second scenario, both SM and OM are non-compliant, meaning that concurrent failure indicates the water body remains degraded and existing measures are insufficient to control known pressures. The authority is therefore expected to sustain and, where necessary, intensify management efforts and to reassess whether OM indicator coverage adequately reflects the pressures revealed by SM. If OM already addresses the key pressures, the system is retained; if coverage is insufficient, OM indicators are supplemented or adjusted to track the primary drivers of non-compliance more effectively.
In the third scenario, SM is non-compliant while OM remains compliant, with SM revealing ecological failure (for example, biological quality elements rated poor or bad), despite all targeted OM indicators meeting standards. This pattern implies that identified pressures are insufficient to explain the observed degradation and suggests the presence of unidentified pressures or emerging pollutants. Under these circumstances, WFD Annex V requires the authority to initiate IM to determine causes using diagnostic methods such as non-target chemical screening, biological toxicity testing, and supplementary spatial surveys. If IM, for instance, identifies a new industrial solvent discharged by Chemical Enterprise Z that is not covered by the priority substances list or existing OM/SM protocols, targeted management actions follow, for example, revising Enterprise Z's discharge permit to require end-of-pipe treatment, and the OM plan for the River X basin is updated immediately to include specific monitoring of Enterprise Z's discharges.
At the conclusion of the management cycle (Year Y + 5), the River X basin authority conducts a final status assessment of the water body using all monitoring data collected during the cycle, including OM, SM, and IM results. This assessment serves as the legal basis for determining compliance within the six-year period and directly informs management planning for the subsequent cycle (commencing Year Y + 6).
If the assessment is compliant, by Year Y + 5, all quality elements—including biological EQR and specific indicators such as the new industrial solvent—have stably achieved good status and the cycle is deemed successful. In the pressure and impact analysis for the next cycle, the water body may be reclassified as low risk or no risk, and the monitoring regime shifts to lower-frequency SM. This transition functions as a positive incentive within the WFD's risk-driven management framework.
If the assessment is non-compliant, the water body has failed to meet the standards by Year Y + 5 despite implemented management measures, and the cycle is classified as non-compliant. The Member State may therefore face infringement proceedings and legal accountability initiated by the European Commission. For the subsequent cycle, the water body retains a high-risk designation, requiring continued or intensified OM and a new iteration of management measures until compliance is achieved.
Limitations of the EU monitoring system
-
While the WFD represents a significant advancement in integrated watershed management, its implementation over the past two decades has revealed theoretical and operational challenges. These issues remain central to ongoing academic discourse[1,4].
Variations in methodologies for establishing baseline targets have tended to weaken the logical foundation of the WFD assessment. The WFD ecological status assessment relies on reference conditions, which describe the biological integrity expected under minimal anthropogenic disturbance[5,8]. However, member states employ varying methodologies to determine these conditions, including historical data analysis, modeling extrapolation, and expert judgment. This lack of methodological uniformity leads to inconsistencies in how reference conditions are defined across regions, thereby weakening the logical foundation of the assessment system[5]. Furthermore, for heavily modified water bodies, the management objective shifts from good ecological status to GEP, which is defined as the optimal ecological condition attainable without significantly compromising designated uses such as flood control or navigation[5]. This definition contains inherent interpretative elasticity. In practice, the determination of GEP often reflects a compromise between ecological objectives and engineering requirements rather than adhering strictly to ecosystem principles[5,9].
Information compression within assessment methodologies has tended to narrow the ecological scope of the WFD. To ensure legal consistency across the EU, the WFD requires member states to harmonize EQR class boundaries via an intercalibration procedure[4]. Technically, this procedure often utilizes a limited set of physicochemical pressure indicators (such as total phosphorus, total nitrogen, or hydromorphological metrics) to align the EQR. Although the EQR is designed to synthesize the cumulative effects of multiple pressure types, its calibration against limited pressure indicators effectively constrains its scope. This reductionist approach compromises the ecological comprehensiveness of the EQR[4,9]. While this intercalibration pragmatically facilitates technical autonomy and legal uniformity among member states, it exhibits deficiencies in scientific rigor regarding the representation of complete ecological processes.
Limited capacity for causal diagnosis reduces the WFD's ability to identify specific stressors. The WFD status assessment centers on biological quality elements and the resulting EQR[1,5]. While the EQR effectively reflects the overall ecosystem response to cumulative pressures, it is not designed to quantify the contribution of specific stressors. Consequently, the metric identifies ecological degradation but does not directly indicate the underlying etiology[4]. During the assessment phase, the WFD does not require a distinct decomposition of relative contributions from pressures such as agricultural nonpoint sources, industrial discharges, or hydrological alterations. This comprehensive indicator approach improves operational feasibility but defers causal diagnosis to the subsequent IM phase. As a result, the formulation of governance measures often lacks sufficient causal evidence, increasing uncertainty in management decision-making[4].
Latency in management responses limits the WFD's ability to adapt quickly to new scientific knowledge and rapid environmental change. The six-year management cycle of the WFD facilitates the planning and implementation of large-scale engineering measures but may lag behind rapid scientific advancements and environmental changes[1]. For instance, toxicological research on emerging contaminants, including microplastics and pharmaceuticals, has advanced significantly, continuously revealing new risks. Simultaneously, climate change has increased the frequency and intensity of ecological perturbations, such as extreme droughts and floods, which rapidly alter ecosystem structures and functions[9]. Under these circumstances, the fixed management cycle may preclude the timely adjustment of management goals and measures in response to the latest scientific evidence.
-
The structural framework, core responsibilities, and operational mechanisms of surface water monitoring in the US involve multiple stakeholders—Congress, the Environmental Protection Agency (EPA), the United States Geological Survey (USGS), state environmental agencies, the public, non-governmental organizations (NGOs), and regulated entities—operating within a system of checks and balances covering legislative authorization, budget appropriation, administrative execution, and accountability[2,3,10]. At the federal level, Congress establishes the legal framework through legislation and approves the budget that funds agencies such as the EPA and USGS, while the Clean Water Act (CWA) assigns the EPA the statutory duty to supervise, review, and implement measures to restore and maintain the chemical, physical, and biological integrity of the nation's waters[2,11].
Within that federal framework, two national monitoring networks operate with distinct but complementary functions. The EPA leads the National Aquatic Resource Surveys (NARS), which employ a stratified random sampling design to infer national-scale status from a probabilistically selected set of sites; NARS therefore supplies Congress with macro-level condition reports and exerts political pressure on states to maintain water quality standards[3,12,13]. By contrast, the USGS manages the National Water-Quality Assessment (NAWQA) program, which pursues a science-oriented objective of long-term, high-value monitoring; NAWQA's hydrology and water quality data are openly available to the government and the public and provide scientific reference that supports state actions such as development of Total Maximum Daily Load (TMDL) plans[11,14].
At the state level, the public release of NARS results reinforces social oversight and encourages citizens and NGOs to scrutinize state water-management performance[12]. Under the CWA, the EPA delegates primary enforcement authority to states and provides base grants, enabling states to operate their own regulatory monitoring networks while requiring that state-set water-use designations and water quality standards receive EPA approval to meet federal baseline requirements[2,10,15]. States are required to monitor water bodies for compliance, list impaired waters under Section 303(d), and develop TMDLs for listed systems; once EPA approves a TMDL, the state implements legal management of point sources through the National Pollutant Discharge Elimination System (NPDES) and of nonpoint sources through best management practices (BMPs) to restore affected waters to compliance[15,16].
Execution and supervision are maintained through multiple oversight layers that balance autonomy with accountability. First, public supervision creates direct legal and political pressure because environmental NGOs and citizens may file suits if states fail to list eligible impaired waters or otherwise neglect responsibilities[17]. Second, the public can also challenge the EPA if it is perceived to have failed its supervisory duties, for example, by approving an unsound TMDL or failing to intervene during prolonged state inaction[2,17]. Finally, the EPA retains authority to intervene where state measures prove inadequate; the most severe remedy is federal assumption of authority, in which federal agencies assume management over parts of a state's regulated waters and entities, while the state still bears associated costs, a measure that carries substantial political and financial consequences and thus incentivizes state compliance[2,16,17].
Site selection principles of the three major US surface water monitoring networks
-
The three core US monitoring networks follow distinct site-selection logics that reflect their institutional roles and objectives. At the national scale, the EPA's National Aquatic Resource Surveys (NARS) use a stratified random sampling design to generate unbiased, probabilistic estimates of surface-water condition across the country or within major ecoregions[3,12]. Sites are drawn from a comprehensive statistical frame that covers rivers, lakes, wetlands, and coastal waters, with stratification by ecoregion, water-body type, and size to ensure representative coverage; this probabilistic approach allows relatively few sampling points to support valid national-scale inference and provides macro-level evidence for Congress and federal decision makers[3,12].
Complementing NARS, the USGS-led NAWQA program adopts a mechanism-oriented, fixed-site strategy aimed at long-term process understanding[14,18]. NAWQA locates sentinel stations at outlets of representative watersheds or sub-watersheds that are selected to reflect dominant land-use types (for example, agricultural, urban, and forested reference basins). Continuous, high-resolution monitoring of hydrology, chemistry, and biology at these sites—often sustained for decades—supports attribution of water-quality changes to drivers such as land-use change, management practices, and climate variability and supplies scientific context for policy and restoration efforts[14,18,19].
State regulatory networks employ a deliberately judgmental, targeted sampling approach driven by statutory responsibilities under the Clean Water Act[2,10,15]. Site selection prioritizes locations tied to management needs, including public water supply intakes to protect drinking water; upstream and downstream of major point-source discharges to assess permit compliance and impacts; confluences and runoff hotspots associated with agricultural and urban non-point sources; recreational and ecologically sensitive sites such as swimming beaches and critical habitats; and boundary locations to resolve transboundary issues[20−22]. As illustrated in Fig. 3, the site selection principle for state-level networks is judgmental (or targeted) sampling. This approach is intentionally biased, adhering to a logic of prioritizing areas with known problems or high protection requirements[10,22]. This targeted deployment concentrates monitoring resources where they are most needed for compliance, enforcement, and immediate management action[10,15].
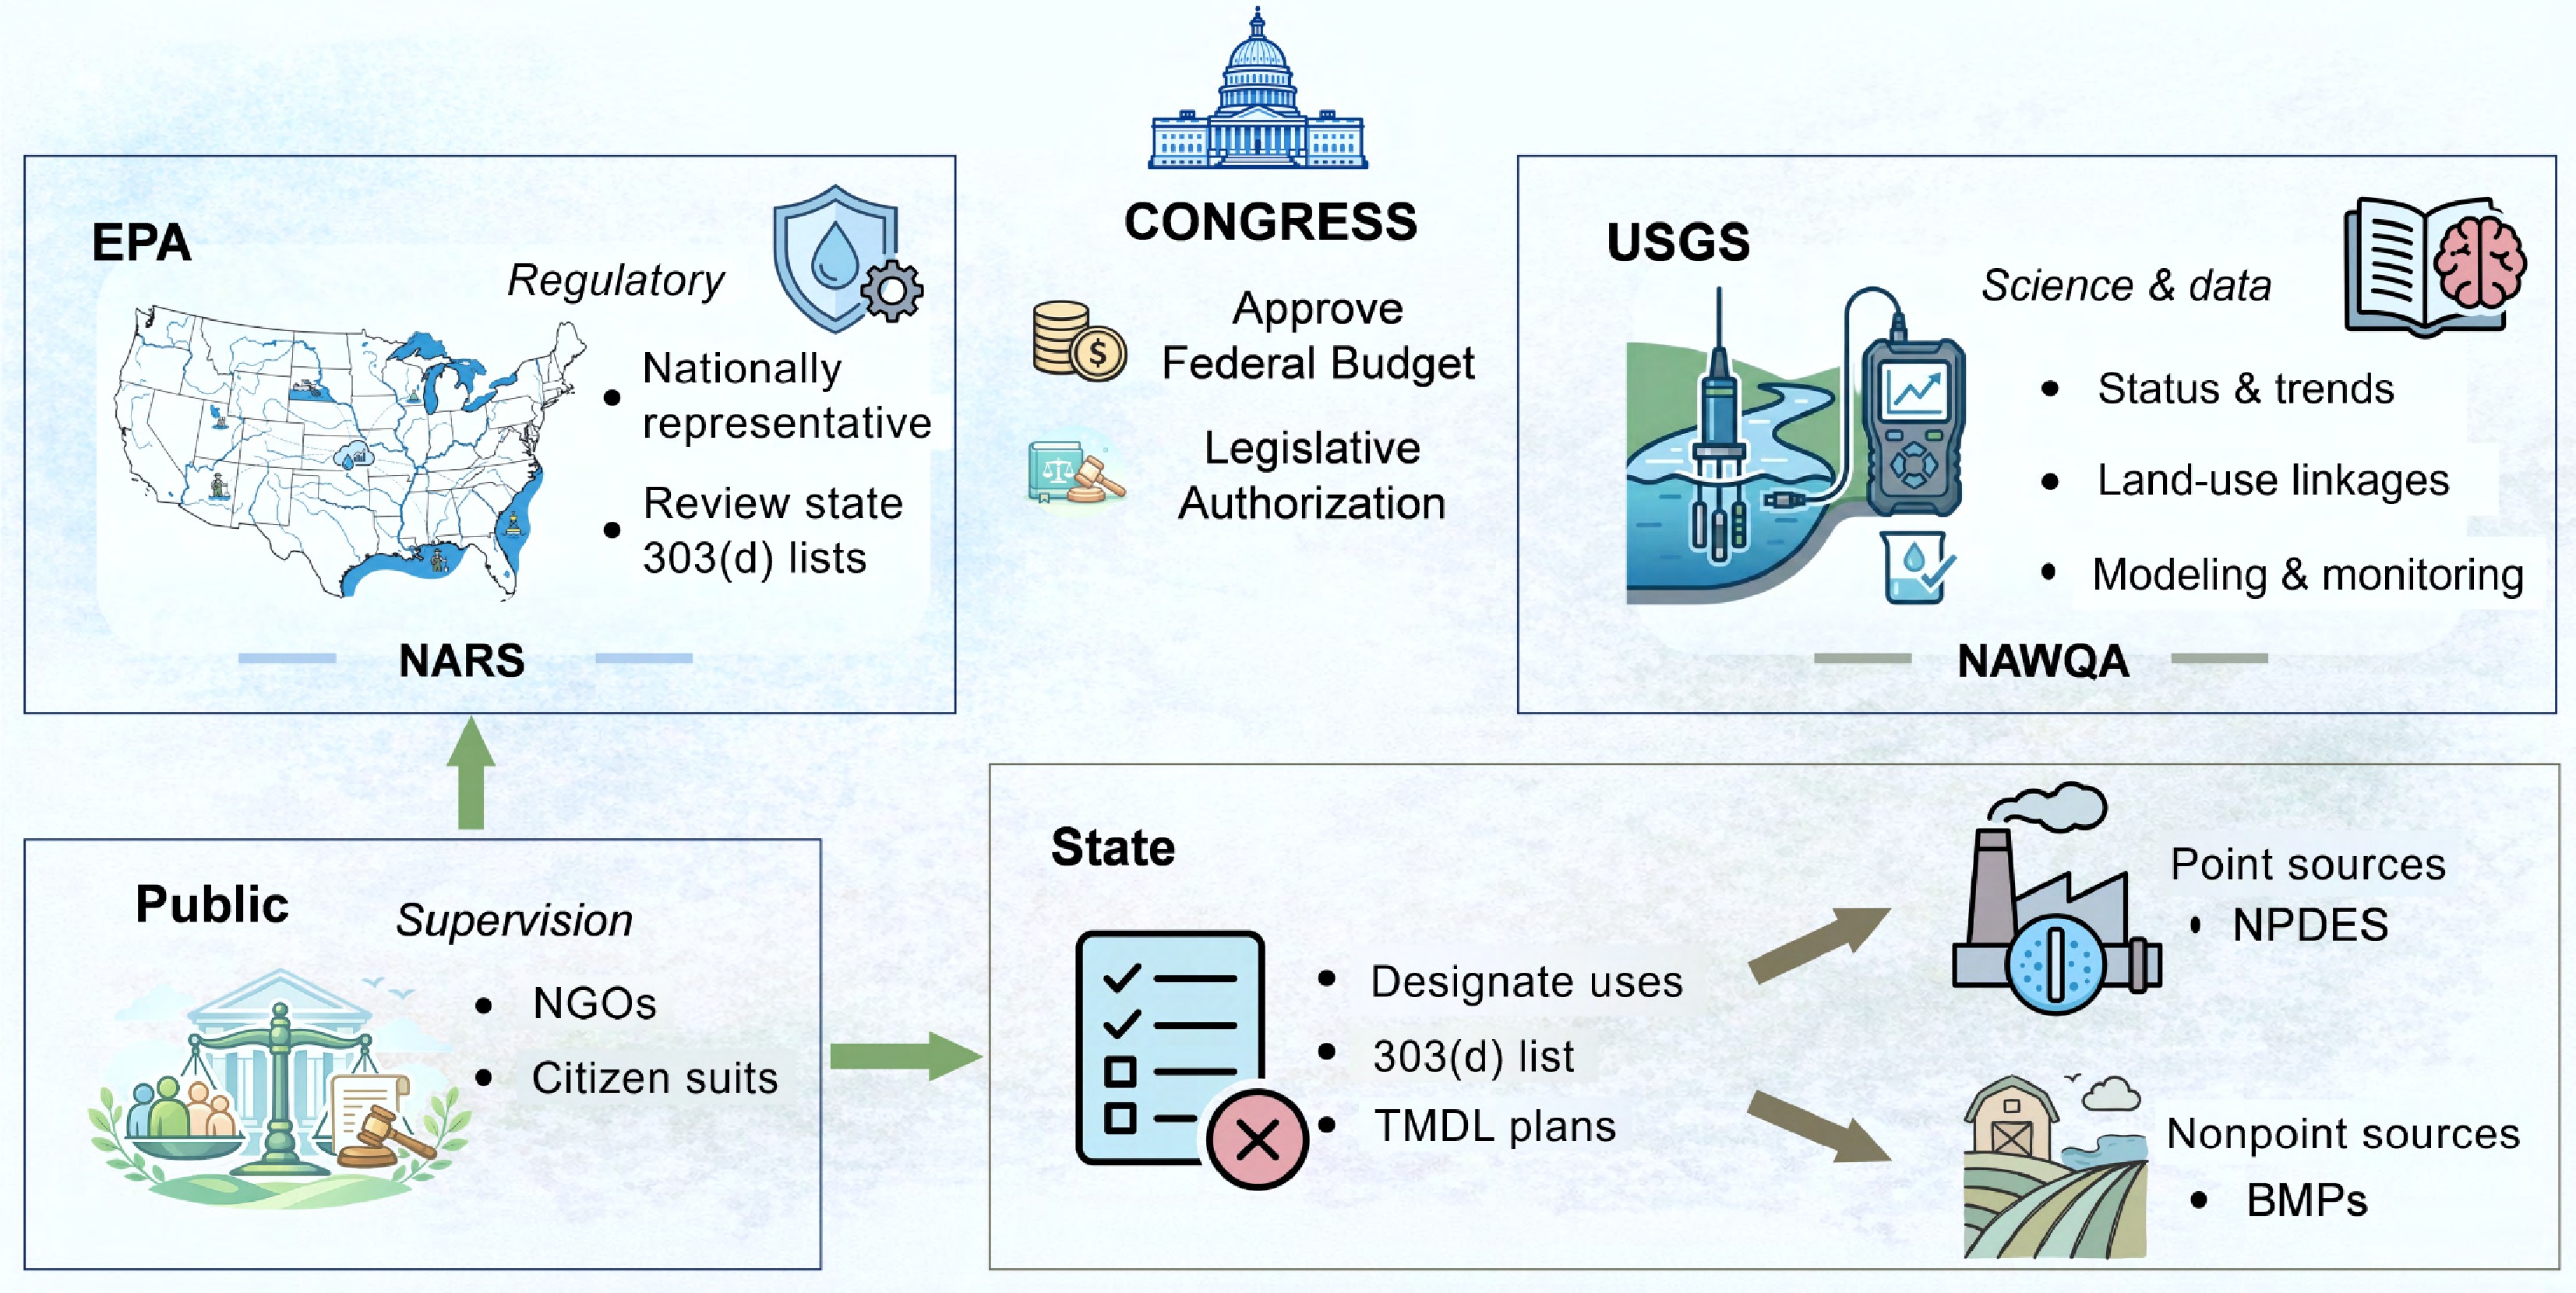
Figure 3.
Institutional architecture of the US water quality governance and monitoring system.
Congress provides legislative authorization and federal budget appropriations. At the federal level, the EPA conducts regulatory oversight and nationally representative assessments through NARS, while the USGS generates scientific information and monitoring data through NAWQA. States designate uses, compile CWA Section 303(d) lists, and develop TMDLs, translating assessment results into controls on point sources via NPDES and on nonpoint sources via BMPs. Public actors provide external supervision and accountability through NGOs and citizen suits.
Together, these three types of networks form a complementary architecture: NARS supports national assessment, NAWQA provides long-term scientific understanding, and state networks support compliance, enforcement, and management action[3,12,14,15].
Limitations of the US monitoring system
-
While the US surface water monitoring and management system seeks to balance federal and state responsibilities through cooperative federalism, its decentralized structure introduces notable limitations and controversies, primarily concerning heterogeneity in state-level standards. Federal law grants states considerable flexibility to designate uses for water bodies and to set water-quality standards for compliance assessment, and although the EPA issues guidance, it does not impose a single national classification system or strictly harmonized criteria[2,10]. As a result, states employ different assessment scales, biological indices, and toxicity thresholds, producing substantial disparities: a transboundary river could be listed as impaired in one state yet judged compliant in an adjacent state despite similar chemical conditions[10,15,23]. This variability hinders data integration and horizontal comparison across regions, complicates the use of independently compiled Section 303(d) lists for national-scale analysis, and reduces the efficiency and applicability of monitoring data for broader scientific and management purposes.
A related constraint affects the effectiveness of federal oversight and reflects persistent information asymmetry between state implementers and federal supervisors. The EPA's review and approval of state-developed TMDLs and grant applications depends largely on documentation submitted by states—data reports, models, and implementation plans—and limited federal resources make exhaustive on-site verification impractical[15]. Consequently, the federal review process faces the risk that submitted materials, while appearing scientifically credible, might not fully reflect field conditions, allowing nominal compliance without substantive change. Although external checks, such as citizen suits and NARS macro-audits, provide important corrective pressure, ensuring the authenticity and accuracy of state-provided information remained a central administrative challenge for TMDL approval and federal funding oversight[2,15].
-
The surface water monitoring systems in the EU and the US have evolved under distinct legal frameworks and management architectures, representing two fundamentally different models[1,2] (Fig. 4). The EU model is highly unified and objective-driven, whereas the US model comprises a composite of complementary networks operating at federal and state levels.
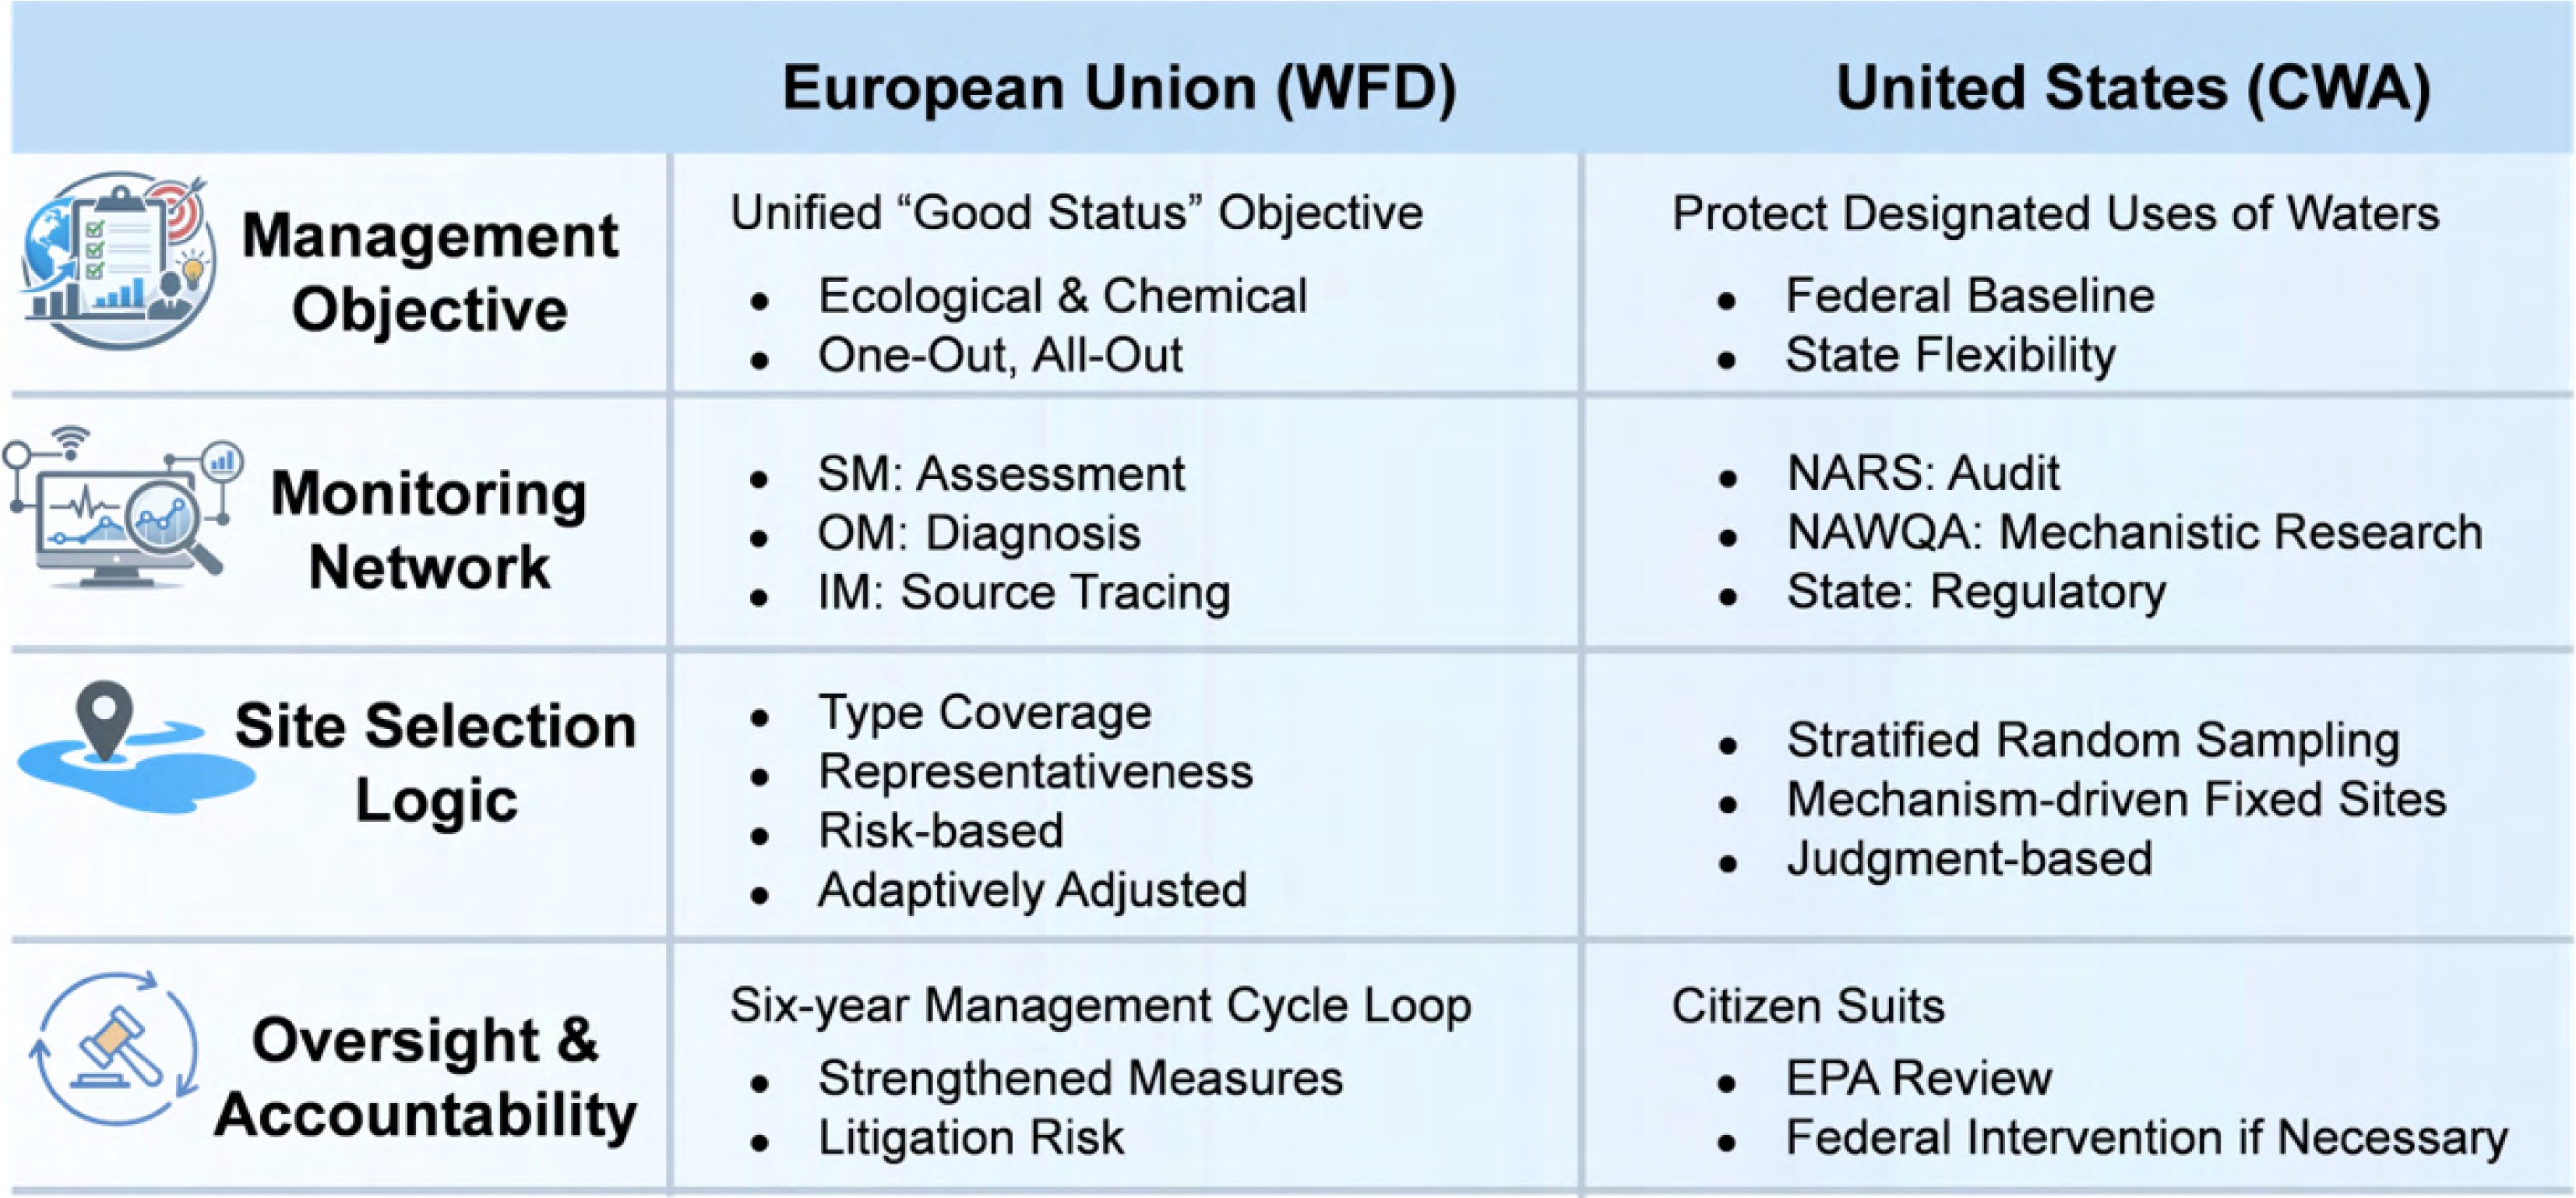
Figure 4.
Comparison of surface water monitoring frameworks under the WFD and the CWA across four dimensions: management objective, monitoring network, site selection, and oversight and accountability.
Under the WFD, a harmonized 'good status' objective is evaluated through coupled ecological and chemical classifications applying the one-out, all-out principle, supported by complementary monitoring types (SM, OM, and IM), risk-based and adaptively updated site selection, and a six-year management cycle linking assessment to measures. Under the CWA, the objective is to protect designated uses under a federal baseline with state flexibility; implementation relies on the complementary roles of NARS, NAWQA, and state programs, using stratified random sampling, mechanism-driven fixed sites, and professional-judgment site selection, and is reinforced through citizen suits and EPA review, with federal intervention when necessary.
In the EU, the WFD establishes a centralized, goal-oriented management approach whose principal aim is to ensure that all surface water bodies achieve and maintain good status, encompassing both ecological and chemical dimensions and applying the one-out, all-out principle where relevant[1]. To implement this objective, the WFD defines three functionally distinct monitoring networks: surveillance monitoring (SM) to characterize baseline conditions and long-term trends, operational monitoring (OM) to identify pressures on at-risk waters and to evaluate the effectiveness of management measures, and investigative monitoring (IM) as a diagnostic tool triggered by unexplained deterioration[1,4]. These networks operate together within a six-year planning cycle to complete a closed-loop process of assessment, diagnosis, management intervention, and reassessment[1,4,5,9].
By contrast, the US system does not revolve around a single overriding monitoring objective but instead comprises three differentiated sub-networks that reflect distinct institutional roles. State-level regulatory networks focus on enforcement and management, using judgmental, targeted site selection to protect designated uses, identify impaired waters under Section 303(d), and support TMDL development and permit compliance[10,15]. The EPA's National Aquatic Resource Surveys (NARS) provide a probabilistic, national-scale macro-audit that reports broad conditions to Congress and creates political incentives for state action through randomized, stratified sampling[3,12]. The USGS's NAWQA contributes long-term, mechanism-oriented science via fixed sentinel sites that enable attribution of trends to drivers such as land use and management practices, and its open data underpins scientific and policy analysis[14,18,19].
A notable crosscutting feature of the US model is its robust system of social and legal oversight. Public disclosure of federal survey results, the availability of open scientific data, and the legal standing of citizens and NGOs to pursue suits against states or the EPA create bottom-up pressure that complements top-down federal authority; together, these mechanisms form a powerful set of checks and balances, including the EPA's ability to assume federal control where state action is persistently inadequate[2,16,17].
Overall, the contrast between the EU and US systems reflects a fundamental trade-off between institutional uniformity and functional flexibility. The EU model provides strong coherence, comparability, and a tightly integrated link between assessment results and management obligations through a unified objective and standardized monitoring logic; however, this high degree of harmonization may reduce adaptive flexibility and can make rapid responses to newly emerging pressures more difficult. By contrast, the US model gains strength from differentiated network functions, state-level discretion, open scientific data, and strong public and legal oversight, which together enhance adaptability and practical responsiveness; however, these advantages are accompanied by greater heterogeneity in standards, weaker cross-jurisdictional comparability, and a less unified assessment framework. In this sense, neither system is inherently superior in all respects: the EU approach prioritizes consistency and regulatory integration, whereas the US approach prioritizes pluralism, adaptability, and distributed accountability.
Lessons for the development of surface water monitoring systems in China
-
At present, China has basically established a national surface water monitoring framework centered on 3,646 state-controlled monitoring sections, of which 1,837 are equipped with automatic water quality monitoring stations. At the national level, the system generally operates through a combination of automatic and manual monitoring. On this basis, how to further improve the surface water monitoring system and enhance its scientific rigor and systematicness remains an important issue[24]. Drawing on the experience of the EU and the US, China's surface water monitoring system could be further strengthened in three complementary directions: routine compliance evaluation and baseline establishment, rapid identification and emergency response in key areas, and long-term ecological observation to clarify causal mechanisms.
The routine compliance and baseline function would focus on determining status and improvement trends while generating reusable baselines and references for management. Drawing on EU experience with water-body typology and dual ecological/chemical assessment, development should emphasize an evaluation system that maps assessment results to management responsibilities, strengthened automatic high-frequency monitoring and quality control at key control sections and sensitive waters to detect short-term fluctuations and borderline compliance, and integration with remote-sensing models to scale point observations to area-wide assessment products that better support macro-level decision-making and cross-regional comparison.
The rapid identification and emergency response function would complement routine auditing by prioritizing fast detection, localization, and urgency assessment of sudden deterioration. Drawing on the investigative monitoring logic of the EU and the problem-oriented site deployment approach widely adopted in the US, its design would be driven by risk grading to allocate resources to high-risk basins, sensitive water bodies, and high-incident periods, enabling rapid activation and dynamic indicator adjustment. Recommended elements include coordinated remote-sensing and field monitoring for near-real-time detection of algal blooms, turbidity spikes, and pollution plumes; algorithmic indicator fusion to improve anomaly detection and localization without excessive manual burden; and clear trigger thresholds and response chains to ensure that early-warning outputs directly support emergency management and remedial action.
The long-term ecological observation function would serve science-oriented needs by maintaining sustained observation and open data accumulation. Drawing on the long-term scientific monitoring orientation represented by the USGS NAWQA Project, China could further strengthen this function to support long-term trend detection. Priorities would include establishing a biological monitoring program linked to ecological health to support status assessment and governance evaluation; incorporating emerging contaminants into long-term and thematic monitoring in key basins to build datasets for risk screening and prioritization; and conducting long-term attribution studies to clarify causal links between water-quality changes and drivers such as land use, discharges, management measures, and climate variability. Data should meet high standards for metadata, methodological consistency, and traceability, and be made accessible to the scientific community to support evidence-based policy adjustments and threshold refinement.
-
A systematic investigation of the surface water monitoring architectures in the EU and the US was conducted from the perspectives of legal framework, management objectives, network design, site selection, and operational mechanisms. The EU system is characterized by a unified, objective-driven framework with strong coherence between assessment and management, whereas the US system is characterized by functionally differentiated networks and multi-level oversight that provide greater flexibility and responsiveness. Both systems provide useful experience for China. Future development of China's surface water monitoring system could further strengthen the integration of routine status assessment, risk-based diagnostic monitoring, and long-term ecological observation, so as to improve scientific rigor, management relevance, and support for refined water governance.
-
The authors confirm their contributions to the paper as follows: Hongqing Wang: conceptualization, investigation, writing − original draft; Zhenmin Fang: conceptualization, resources; Nan Zang: conceptualization, supervision, writing − review and editing; Abdul Ghaffar Memon: writing − review and editing; Miao He: supervision, writing − review and editing; Xiaohong Zhou: conceptualization, funding acquisition, writing − review and editing, supervision. All authors reviewed the results and approved the final version of the manuscript.
-
The datasets generated during and/or analyzed during the current study are available from the corresponding author on reasonable request.
-
Not applicable.
-
The authors declare that they have no known competing financial interests or personal relationships that could have appeared to influence the work reported in this paper.
-
Full list of author information is available at the end of the article.
- Copyright: © 2026 by the author(s). Published by Maximum Academic Press, Fayetteville, GA. This article is an open access article distributed under Creative Commons Attribution License (CC BY 4.0), visit https://creativecommons.org/licenses/by/4.0/.
-
About this article
Cite this article
Wang H, Fang Z, Zang N, Memon AG, He M, et al. 2026. Surface water monitoring architectures in the EU and the US: logical frameworks, operational mechanisms, and lessons for China. Energy & Environment Nexus 2: e017 doi: 10.48130/een-0026-0011 

Surface water monitoring architectures in the EU and the US: logical frameworks, operational mechanisms, and lessons for China
- Received: 06 February 2026
- Revised: 26 March 2026
- Accepted: 01 June 2026
- Published online: 18 June 2026
Abstract: Establishing a scientific, efficient surface water environmental monitoring system is fundamental to protecting water resources and enabling refined governance. This paper systematically reviewed monitoring frameworks in the European Union (EU) and the United States (US), focusing on the EU Water Framework Directive's surveillance, operational, and investigative monitoring, and on the US National Aquatic Resource Surveys, the National Water-Quality Assessment program, and state-level regulatory networks. Their management objectives, network designs, site-deployment logic, and operational mechanisms were compared to identify similarities, differences, and limitations. This review highlighted how tiered objectives, combined with fixed and probabilistic site selection, and coordinated federal–state responsibilities support both compliance and status assessment. Based on that comparative analysis, recommendations were proposed to optimize and modernize China's surface water monitoring system, including integrating routine status and baseline assessment, risk-graded rapid warning and diagnostic monitoring, and long-term ecological observation.
-
Key words:
- Surface water monitoring /
- European Union /
- United States /
- Water Framework Directive /
- Clean Water Act