












-
Paeonia suffruticosa Andrews. is a perennial deciduous subshrub belonging to the family Paeoniaceae, genus Paeonia L., section Moutan DC., and represents a plant resource endemic to China[1]. The flowering period in tree peony is characteristically short and highly synchronized: under natural conditions, the period from bud break to petal senescence spans only 50–60 days; individual flowering typically last 3–5 days, while the population-level flowering window extends for approximately 10–15 days. Moreover, the majority of cultivars are classified as mid-season flowering types, with early- and late-flowering cultivars accounting for only a small proportion of the available germplasm[2]. These phenological traits have a direct influence on both the ornamental appeal and economic value of tree peony[3]. Meanwhile, flowering time represents a critical developmental transition in tree peony. The regulatory mechanism of flowering in this species is complex and highly sensitive to environmental cues such as temperature, photoperiod, and endogenous hormonal balance[4]. Precise regulation of flowering time not only determines the synchronization of blooming and market timing but also influences breeding efficiency and genetic improvement strategies. Therefore, elucidating the molecular mechanisms underlying flowering-time regulation in tree peony is of significant importance for both fundamental research and horticultural applications[5].
Gene expression analysis is a key method for understanding the molecular basis of biological processes and identifying functional genes. The common housekeeping genes used in such studies include Tubulin, Actin, 18S ribosomal RNA (18S rRNA), and glyceraldehyde-3-phosphate dehydrogenase (GAPDH)[6,7]. However, accumulating evidence indicates that many of these traditional housekeeping genes exhibit considerable expression variability across different tissues, developmental stages, and experimental treatments, thereby undermining their reliability as reference genes for normalization. Consequently, the suitability of several widely used housekeeping genes as internal controls has been increasingly questioned[8,9]. Therefore, to minimize the bias in gene expression analyses arising from multiple experimental variables, it is essential to select appropriate reference genes as internal controls for normalization[10]. Real-time quantitative PCR (qRT-PCR) is widely employed for gene expression analysis due to its high sensitivity, specificity, and reproducibility. However, the reliability of qRT-PCR results strongly depends on the use of appropriate reference genes for data normalization[11]. An ideal reference gene should exhibit stable expression across different tissues, developmental stages, and experimental conditions. In tree peony, gene expression patterns are highly dynamic during floral bud differentiation and flower development, and can vary considerably among cultivars. This complexity, combined with environmental influence, poses significant challenges for the identification of stable internal control genes. Furthermore, although RNA-Seq datasets provide a valuable resource for candidate gene selection, the criteria for screening and validating reference genes are insufficiently standardized, particularly in flowering-related studies of perennial ornamental species[12]. When assessing the differential expression of a target gene, factors such as initial template concentration, reverse transcription efficiency, primer specificity, and amplification efficiency should ideally be consistent among samples[13]. However, it is practically difficult to achieve simultaneous consistency in these conditions. Internal reference genes, which exhibit relatively stable expression across tissues within a species, are primarily used to correct unavoidable technical variations—particularly those introduced during sample handling and pipetting—thereby ensuring the reliability and reproducibility of experimental results[14]. Consequently, the careful selection of suitable reference genes is indispensable for accurate normalization and reliable relative quantification of gene expression levels[15]. Ideally, reference genes should maintain stable expression across different treatments, tissues, and even across species[16].
Based on RNA-Seq data from early- and late-flowering tree peony varieties during floral development[17], 23 candidate reference genes (EF1-α-1, UBi-lp, UBQ, UBC, UPL, GAPDH, HIS, CYP, RPL, CSLD2, KOR, AGD, ARP, IWS, GTP, PP2A, eIF2, eIF3, PPR, HDH, and PPC) were selected for evaluation. These candidates, together with two previously identified optimal reference genes (EF1-α and Tubulin-α) from drought-stress RNA-Seq studies in tree peony, were systematically re-assessed[18]. Their expression stability was analyzed across flowering regulation and floral developmental stages using geNorm, NormFinder, BestKeeper, and RefFinder algorithms to identify the most suitable reference genes for normalization.
-
Petals at full bloom were collected from tree peony cultivars with uniform growth, free of pests and diseases. These cultivars represented distinct flowering times, including 21 early-flowering and 21 late-flowering cultivars (Fig. 1). Additionally, floral buds or petals of Paeonia ostii 'FengDan' and Paeonia suffruticosa 'Lian He' were collected at 16 different stages of floral bud differentiation and flower development (Fig. 2). Each developmental stage was sampled in triplicate. All samples were immediately flash-frozen in liquid nitrogen and stored at −80 °C for subsequent analyses.
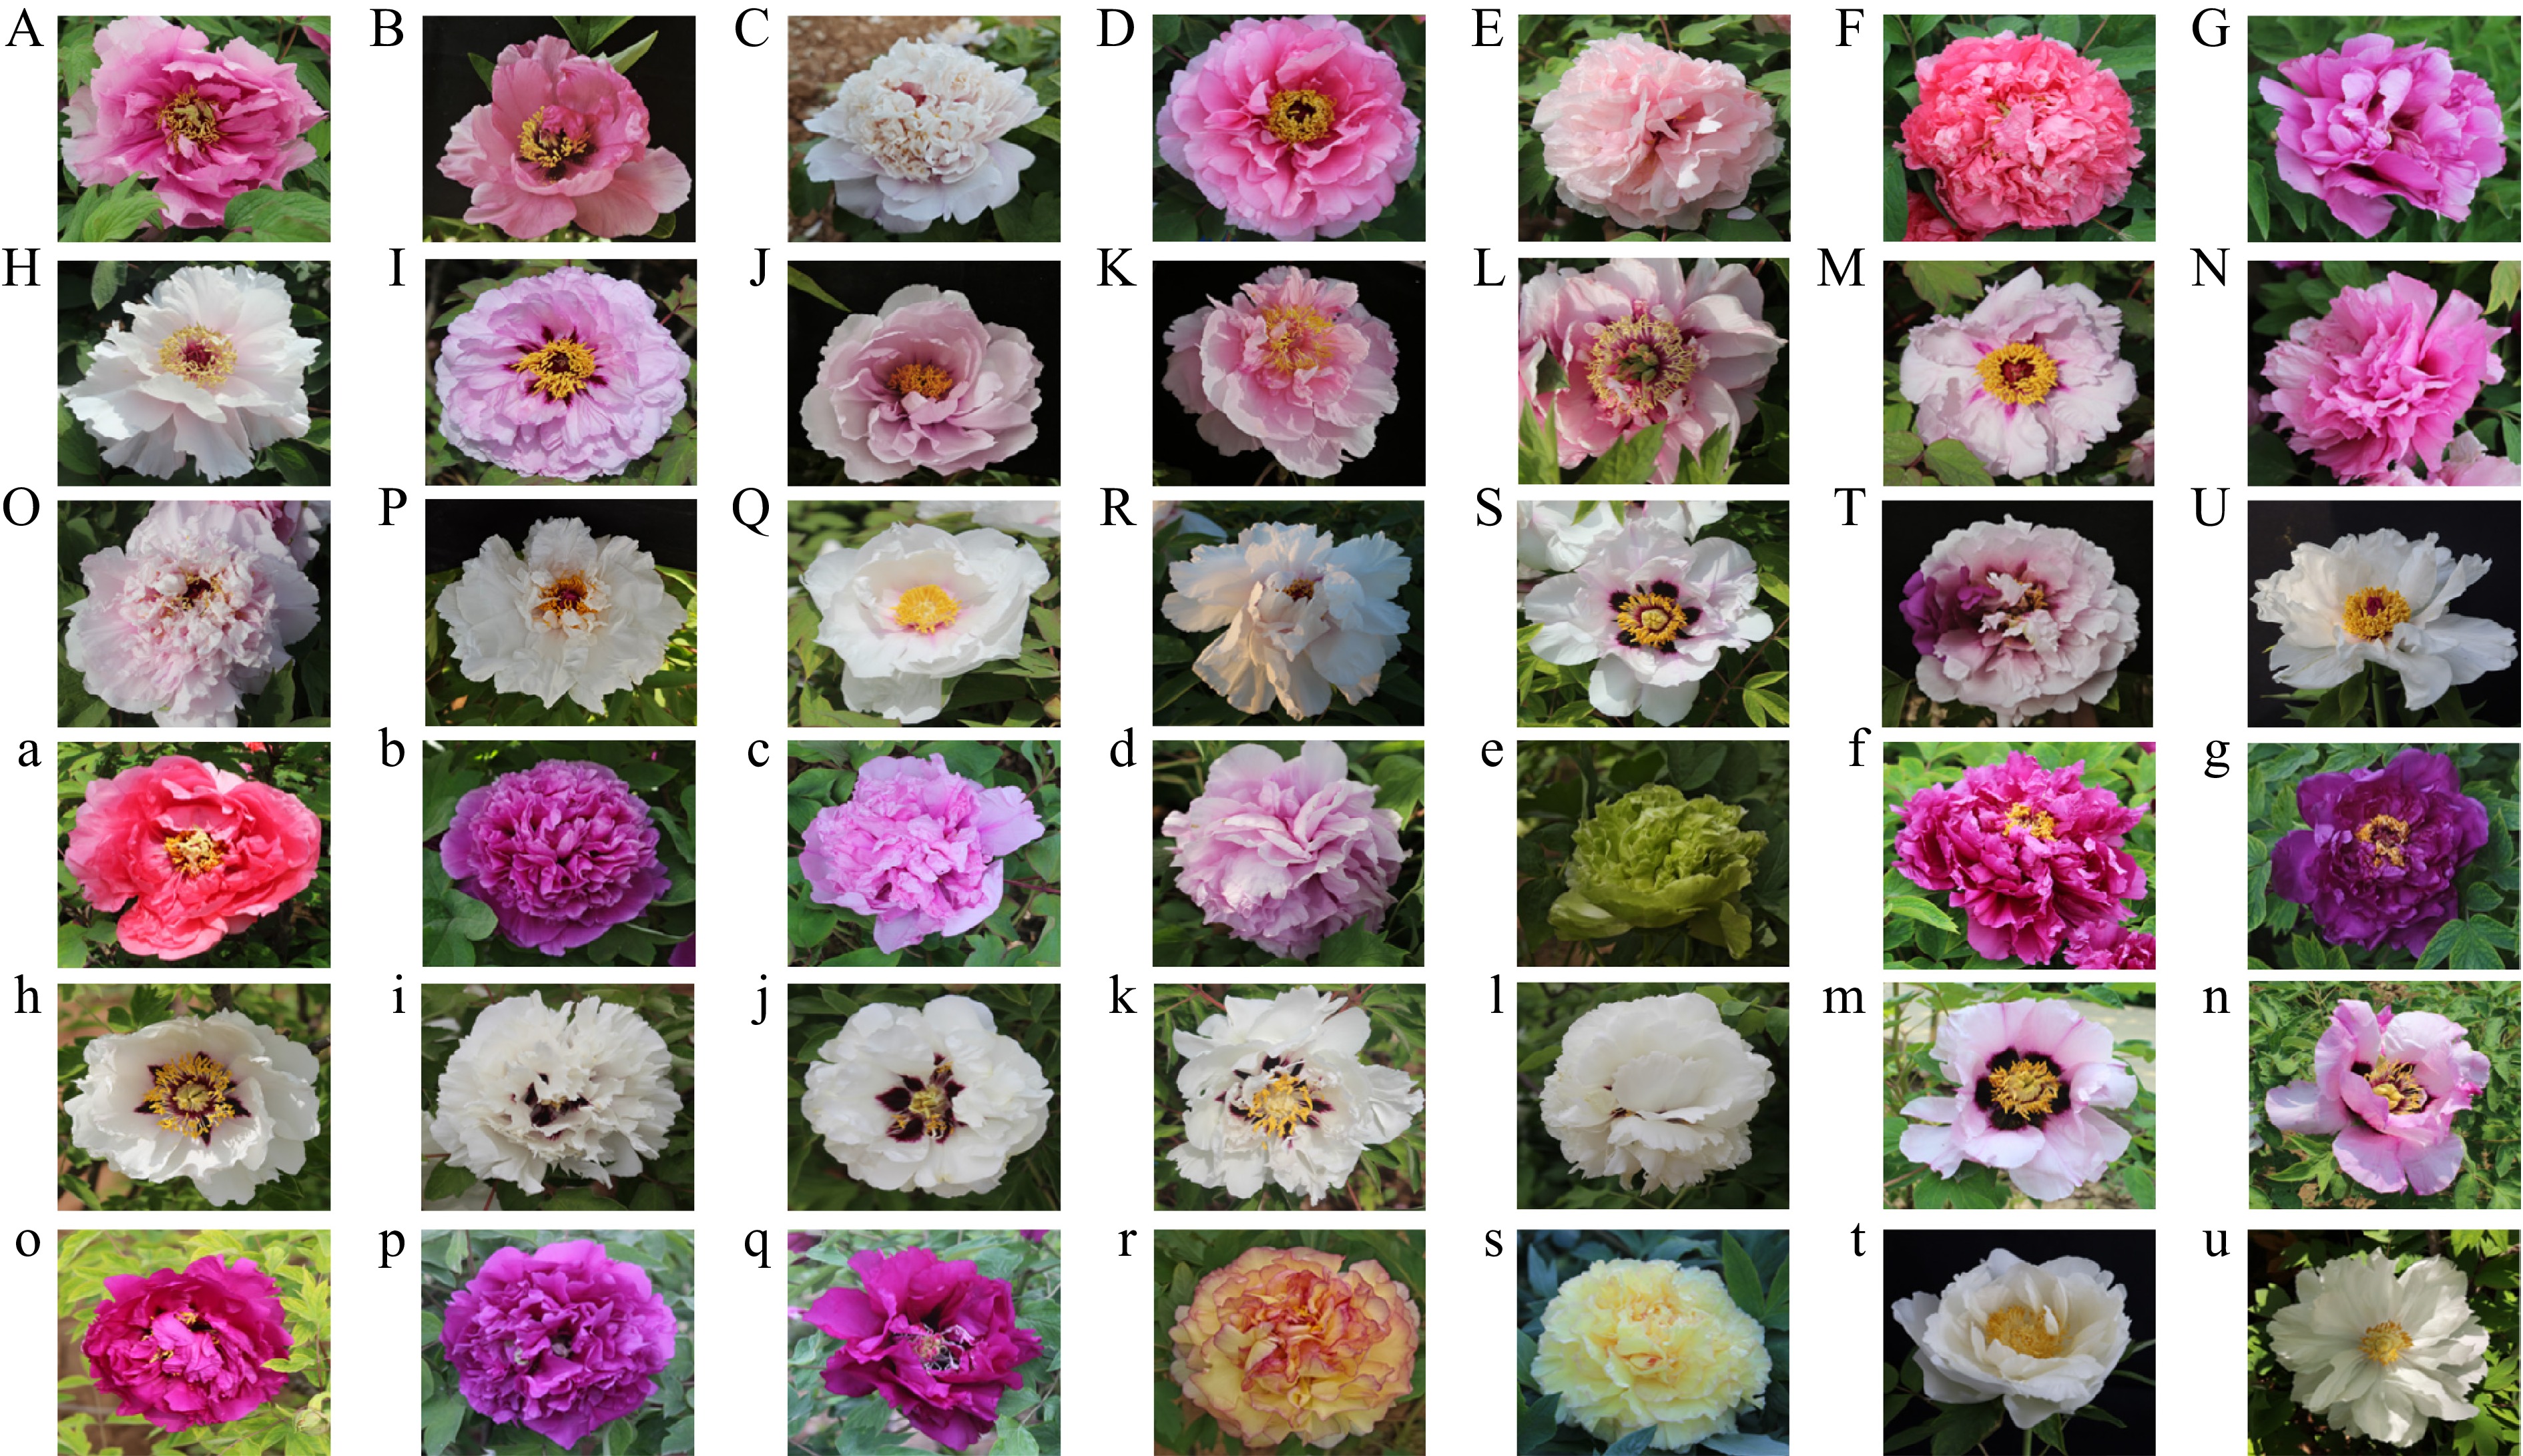
Figure 1.
Floral characteristics of 21 early-flowering and 21 late-flowering peony cultivars at full-bloom stage. A: Paeonia suffruticosa 'Taoyan Hong', B: Paeonia suffruticosa 'Huolian Jindan', C: Paeonia suffruticosa 'Pinghu Qiuyue', D: Paeonia suffruticosa 'JiaoHong', E: Paeonia suffruticosa 'Dapeng Zhanchi', F: Paeonia suffruticosa 'CangJiao', G: Paeonia suffruticosa 'LanJu', H: Paeonia suffruticosa 'HaiBo', I: Paeonia suffruticosa 'Lan Hudie', J: Paeonia suffruticosa 'Lan Yueliang', K: Paeonia suffruticosa 'ZhaoFen', L: Paeonia suffruticosa 'Yucui Caidie', M: Paeonia suffruticosa 'Jianshi Fen', N: Paeonia suffruticosa 'Xishi Fen', O: Paeonia suffruticosa 'Mantian Xing', P: Paeonia suffruticosa 'JingYu', Q: Paeonia suffruticosa 'Suxin Bai', R: Paeonia suffruticosa 'Xueyuan Hongxing', S: Paeonia rockii 'Ziban Bai', T: Paeonia suffruticosa 'ErQiao', U: Paeonia ostii 'FengDan', a: Paeonia suffruticosa 'Feiyan Hongzhuang', b: Paeonia suffruticosa 'Shouan Hong', c: Paeonia suffruticosa 'Haitang Zhengrun', d: Paeonia suffruticosa 'Daduo Lan', e: Paeonia suffruticosa 'Doulv', f: Paeonia suffruticosa 'Shenhei Zi', g: Paeonia suffruticosa 'Zihong Zhengyan', h: Paeonia rockii 'MingMou', i: Paeonia rockii 'Xian Emao', j: Paeonia rockii 'Bai Zhangbing', k: Paeonia rockii 'Bai Yanwei', l: Paeonia rockii 'Yuban Xiuqiu', m: Paeonia rockii 'Bingxin Fenhe', n: Paeonia suffruticosa 'Fen Zhouchou', o: Paeonia suffruticosa 'Xiuqiu Hong', p: Paeonia suffruticosa 'Zilou Xiangcui', q: Paeonia suffruticosa 'ZiYan', r: Paeonia suffruticosa 'JinGe', s: Paeonia suffruticosa 'JinZhi', t: Paeonia suffruticosa 'Baiwang Shizi', u: Paeonia suffruticosa 'Lian He'.
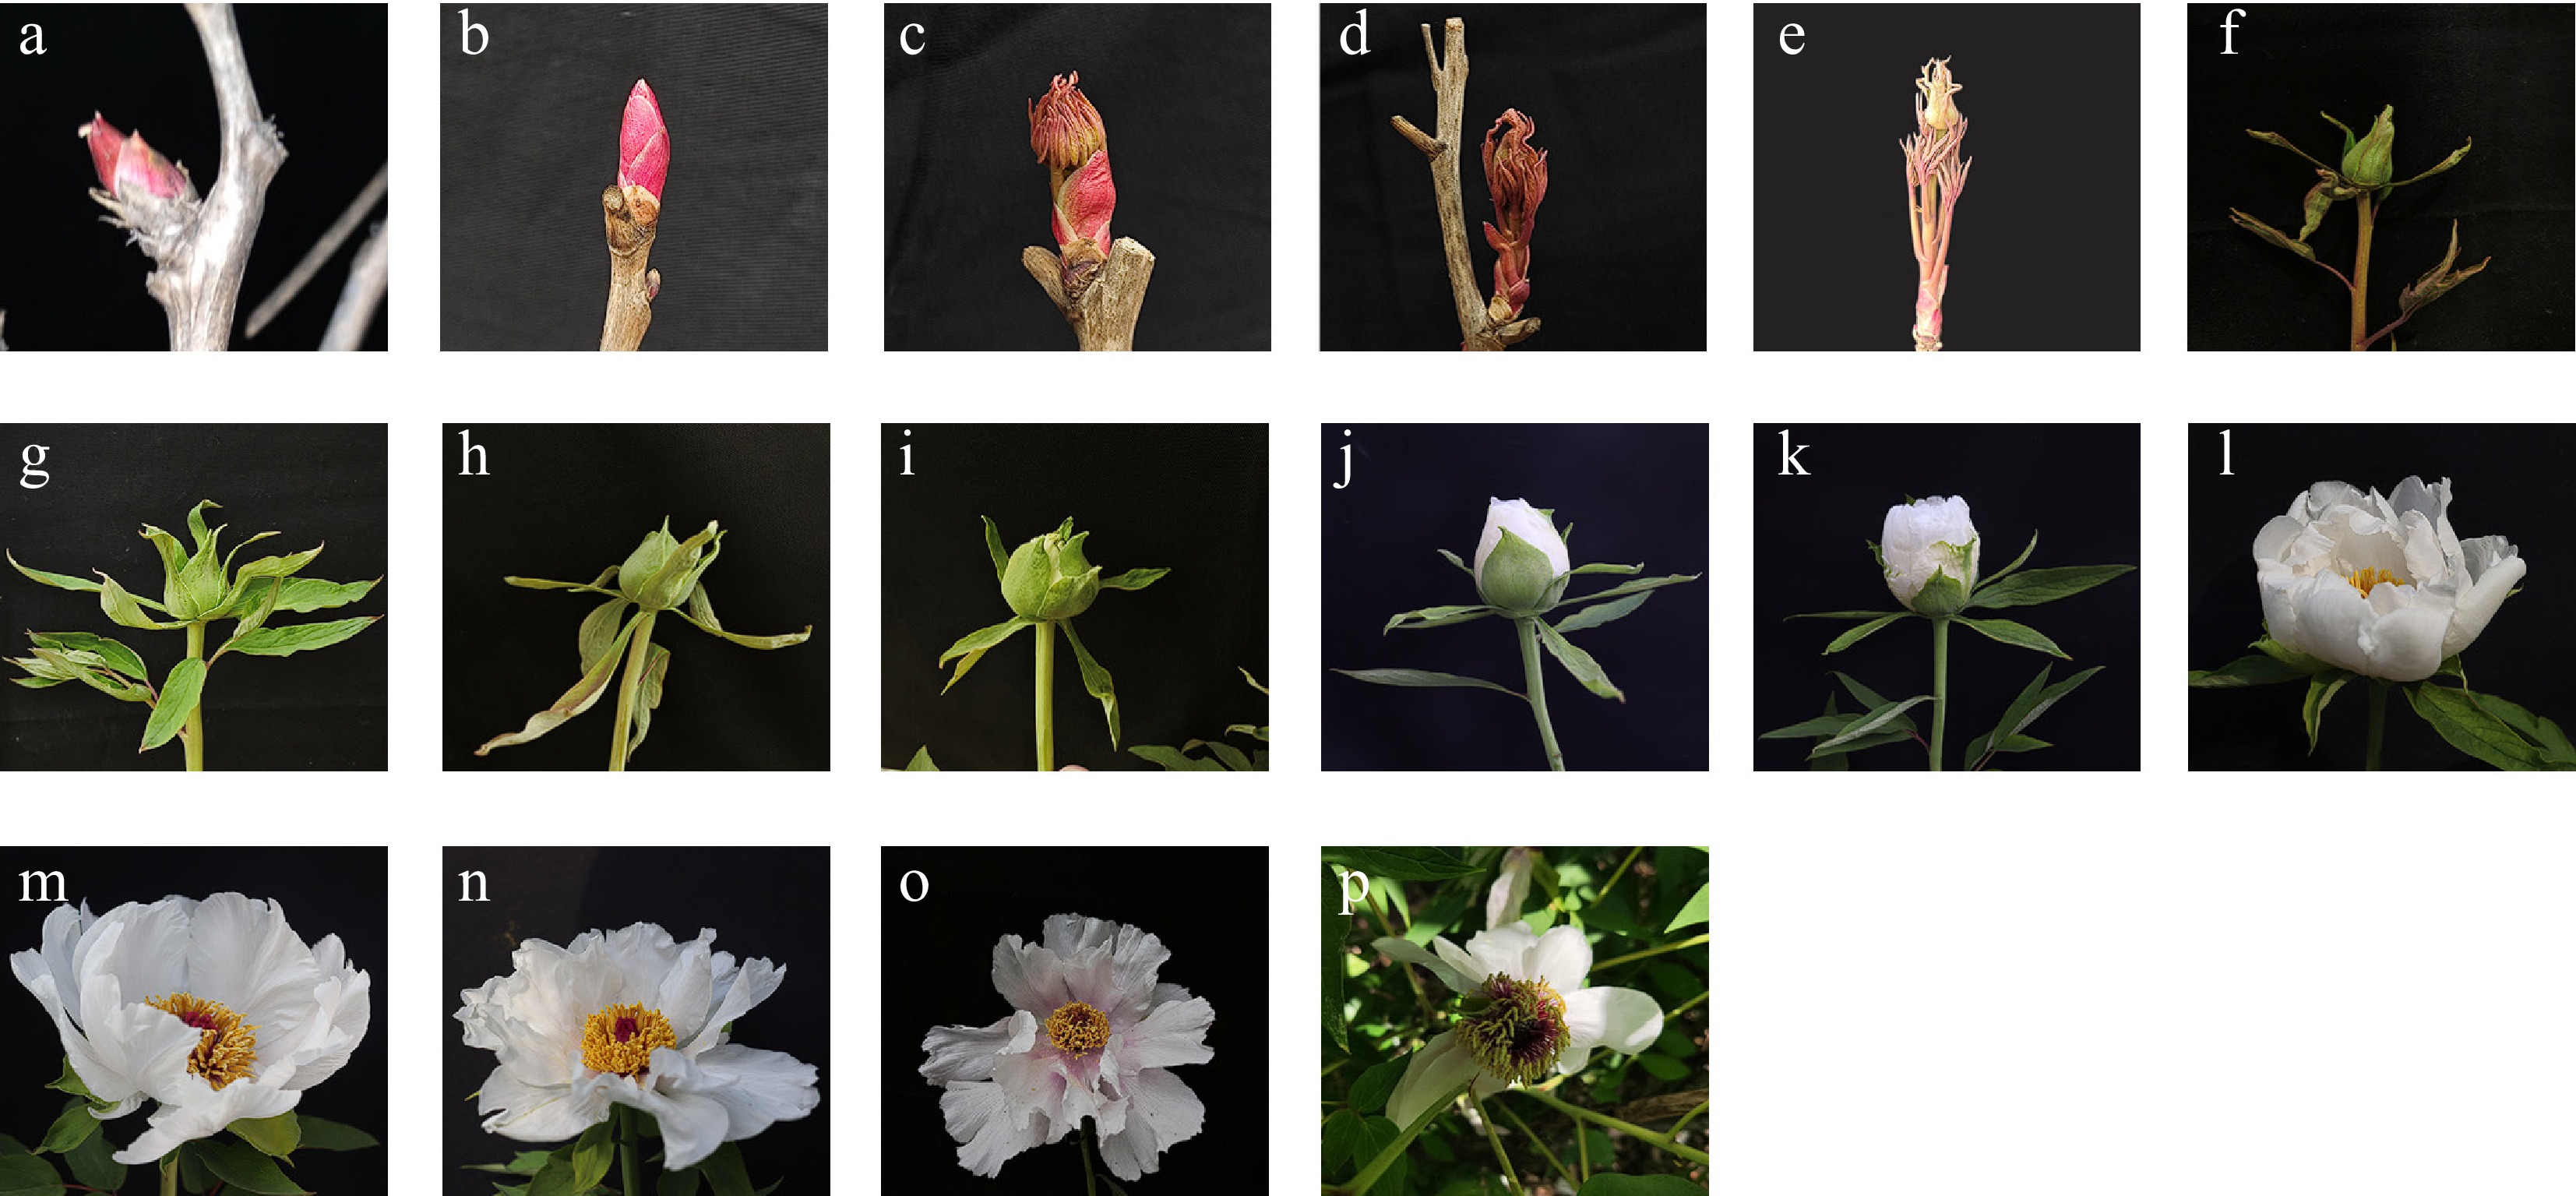
Figure 2.
The flower development of Paeonia ostii 'FengDan' occurred in 16 stages: (a) overwintering dormancy, (b) bud break, (c) bud swelling, (d) bud elongation, (e) erect bud stage, (f) small bell stage, (g) large bell stage, (h) round peach stage, (i) flat peach stage, (j) color exposure, (k) bud cracking, (l) initial flowering, (m) half flowering, (n) full bloom, (o) onset of senescence, (p) full senescence. (a)–(e): bud stage, (f)–(i) flower bud stage, (j)–(p) flowering stage.
Total RNA extraction and cDNA synthesis
-
Total RNA was extracted from tree peony petals using a polysaccharide- and polyphenol-specific plant RNA extraction kit (TIANGEN, Beijing) according to the manufacturer's protocol. The integrity, concentration, and purity of the extracted RNA were assessed by performing 1% agarose gel electrophoresis and quantified using a NanoDrop™ One UV-Vis spectrophotometer. Qualified RNA samples were treated with 2 U of gDNA Eraser at 42 °C for 2 min to eliminate the residual genomic DNA contamination. Subsequently, reverse transcription was performed using the PrimeScript™ RT reagent kit with gDNA Eraser (Perfect Real Time; TaKaRa, Japan) to synthesize sufficient cDNA for downstream gene expression analyses.
Selection of candidate reference genes and primer design
-
Based on existing tree peony RNA-Seq data generated in our laboratory[17], 23 candidate reference genes exhibiting both high expression levels and stable expression patterns were selected. During the screening process, the expression abundance and stability of candidate genes were systematically evaluated. The fragments per kilobase of transcript per million mapped reads (FPKM) value was used as a normalized measure of gene expression level, and genes with a mean FPKM < 1 were excluded. Based on this criterion, a total of 23 candidate reference genes were selected for subsequent validation by qRT-PCR: EF1-α-1, UBi-lp, UBQ, UBC, UPL, GAPDH, HIS, CYP, RPL, CSLD2, KOR, AGD, ARP, IWS, GTP, PP2A, eIF2, eIF3, PPR, HDH, PPC, EF1-α, and Tubulin-α. Specific primers for these genes were designed using Primer Premier 5.0 software (Table 1) and synthesized by Sangon Biotech Co., Ltd. (Shanghai, China).
Table 1. Primer sequences of candidate reference genes.
Primers Sequences 5'-3' EF1-α-1-F CATCGGACAAGCCACTGCGT EF1-α-1-R CGTTATCACCAGGCAGTCCC Ubi-lp-F CCATCCTGGTGAAGTGGCTAA Ubi-lp-R TCAAGTGGGACAAACCGCAT UBQ-F CATCGGACAAGCCACTGCGT UBQ-R CGTTATCACCAGGCAGTCCC UBC-F TCTTAGGGTTTCTGTGCGGG UBC-R GAAGGCTTGCCAATGGAACA UPL-F TGTTGGCGACATTCCTTTCCT UPL-R TCCTACCGTTTGCTCCTACCTC GAPDH-F GGAAAATCCGTTGCCATCAT GAPDH-R CCTCTGTAACGGCATCTTTGG HIS-F CGAAAGTCTGCTCCTACTACGG HIS-R ATCCTTGGGCATAATGGTGAC CYP-F CCTCCAAACCCTAAAAATCCA CYP-R GAACTGGCATCCCTTGTAACC RPL-F GTGGGTTCGCATTCCTGAGA RPL-R AGCCAACCTCAAACCACCCT CSLD-F TCGTCCGCTACCACTTCCG CSLD-R CCTTGCCTCAACTACATCGTCA KOR-F ACACCGAACAATGCGAGAAC KOR-R AAGAAATGCTCCCATCAGGTT AGD-F TGCCATCGTCACCTGTTGC AGD-R CCCCCCAGCCTTTCCAAT ARP-F CGTTTGGTGTTTGGCGTTAT ARP-R AAACATCCCATCCACATCCTT IWS-F CTCTGCCACTCCACCGAAGC IWS-R AACACGGACTGGGTCGGATG GTP-F TCCTCGCATCGCTTGGTCTA GTP-R TGTCGGCTGGTGCTGAACTAA PP2A-F TGTGAGGGACAAAGCAGTGGA PP2A-R CCAGGTTTGACGCAGCAGAC eIF3-F ATCGCAAAAACCCTACCCGTC eIF3-R CGGGAGTTCTGATTGTAGTTGCG eIF2-F AGCCTGGTTATGAGGTTGACG eIF2-R GACCCACCAACCTATCAGCAC PPR-F CTCGTTCAGGTTATTAGCGGTG PPR-R CAGAAACAGAGACAGCCCAATC HDH-F GGCACTCAGTCACAGTTTCAC HDH-R TGTCCCGCTCGCATAATCTC PPC-F CTTGGTATCGGGTCCTATCGT PPC-R GGGACAACTCGTAATGGCTTC EF1-α-F CCGCCAGAGAGGCTGCTAAT EF1-α-R GCAATGTGGGAAGTGTGGCA Tubulin-α-F CCGTCAACTTTTCCACCCTG Tubulin-α-R CCTCACTCGGTCAAGGCAGA Real-time fluorescence quantification PCR
-
qRT-PCR reactions were performed using the TB Green™ Premix Ex Taq™ II (Tli RNaseH Plus) kit (TaKaRa, Japan). Each sample was run in triplicate technical replicates under the following cycling conditions: initial denaturation at 95 °C for 30 s; 45 cycles of denaturation at 95 °C for 5 s and annealing/extension at 60 °C for 30 s. The 20 μL reaction mixture comprised 10 μL of 2×SYBR Green Pro Taq HS Premix, 0.4 μL each of forward and reverse primers (10 μM), 1 μL of cDNA template, and nuclease-free water to volume.
Standard curve and amplification efficiency analysis
-
cDNA samples were serially diluted tenfold across a range of 102 to 106 to construct standard curves. The amplification efficiency (E) for each reference gene was calculated using the formula E = 10−1/slope. Each dilution point was assayed in triplicate technical replicates.
Processing and analysis of test data
-
The expression stability of candidate reference genes was evaluated using three well-known algorithms: geNorm, NormFinder, and BestKeeper. Prior to analysis, raw Ct values were directly imported into each algorithm without any additional data transformation or normalization, as all three algorithms are designed to accept raw Ct values for stability calculations.
geNorm[19] calculates the stability value (M) of each candidate gene based on the relative expression levels derived from Ct values [converted to relative quantities using the formula 2−ΔCt and determines the optimal number of reference genes required by computing the pairwise variation coefficient (V) between genes. NormFinder[20] analyzes raw Ct values directly by considering both intra- and inter-group variances to derive a stability value for each gene, enabling a robust ranking of gene stability. No additional data transformation was applied for the values imported into NormFinder, as it operates on the linear scale of raw Ct values. BestKeeper[21] evaluates each candidate gene individually by calculating the pairwise correlation coefficient (r), coefficient of variation (CV), and standard deviation (SD) directly from raw Ct data. It also performs comparative analyses among candidate genes to assess their expression consistency and suitability as reference controls. Similar to NormFinder, BestKeeper does not require or apply any data transformation prior to analysis. Evaluating the stability of candidate reference genes using multiple analytical algorithms is essential, as their apparent stability can vary substantially depending on the computational approach and underlying assumptions of each program. RefFinder[22] is a comprehensive web-based platform specifically developed to assess and select suitable reference genes from large experimental datasets. It integrates the major currently available algorithms—geNorm, NormFinder, BestKeeper, and the comparative ΔCt method—to systematically compare and rank candidate reference genes. Based on the ranking outcomes generated by each algorithm, RefFinder assigns an appropriate weight to each gene and calculates the geometric mean of these weights to generate a final comprehensive stability ranking. The input data for RefFinder consist of stability rankings produced by the individual algorithms; no direct transformation of raw Ct values was performed by this tool.
Verification of internal reference genes
-
The key flowering regulatory gene PsFRL5 was selected as the target gene to validate the reliability of reference gene stability results. The selection of PsFRL5 was based on its putative involvement in flowering regulation. FRL genes are homologs of the FRI gene family, which are known to play important roles in the regulation of flowering time through modulation of FLC expression in model plants. Previous transcriptome studies on tree peony indicated that PsFRL5 exhibited differential expression patterns during floral bud differentiation and development stages, suggesting its potential role in flowering regulation. Therefore, PsFRL5 was considered an appropriate candidate gene for validating the stability and suitability of the selected reference genes in this study. Moreover, expression patterns of PsFRL5 were analyzed across early- and late-flowering cultivars, as well as during floral bud differentiation and flower development stages. For normalization, two of the most stable reference genes and the least stable reference gene were used to assess the impact of reference gene selection on expression profiling of target genes.
-
Total RNA was extracted from the petals of 21 early-flowering and 21 late-flowering tree peony cultivars at full bloom, as well as from the petals of the early-flowering cultivar 'FengDan' and the late-flowering cultivar 'LianHe' at various stages of floral bud differentiation and flower development. RNA integrity was assessed by performing 1% agarose gel electrophoresis, which showed distinct, intact 28S and 18S rRNA bands. The 28S band was approximately twice as intense as the 18S band (Fig. 3), confirming the high RNA quality. Quantification using Qubit 2.0 Fluorometer showed A260/A280 ratios between 2.0 and 2.1 for all samples, confirming a high RNA purity, which is suitable for downstream experiments.
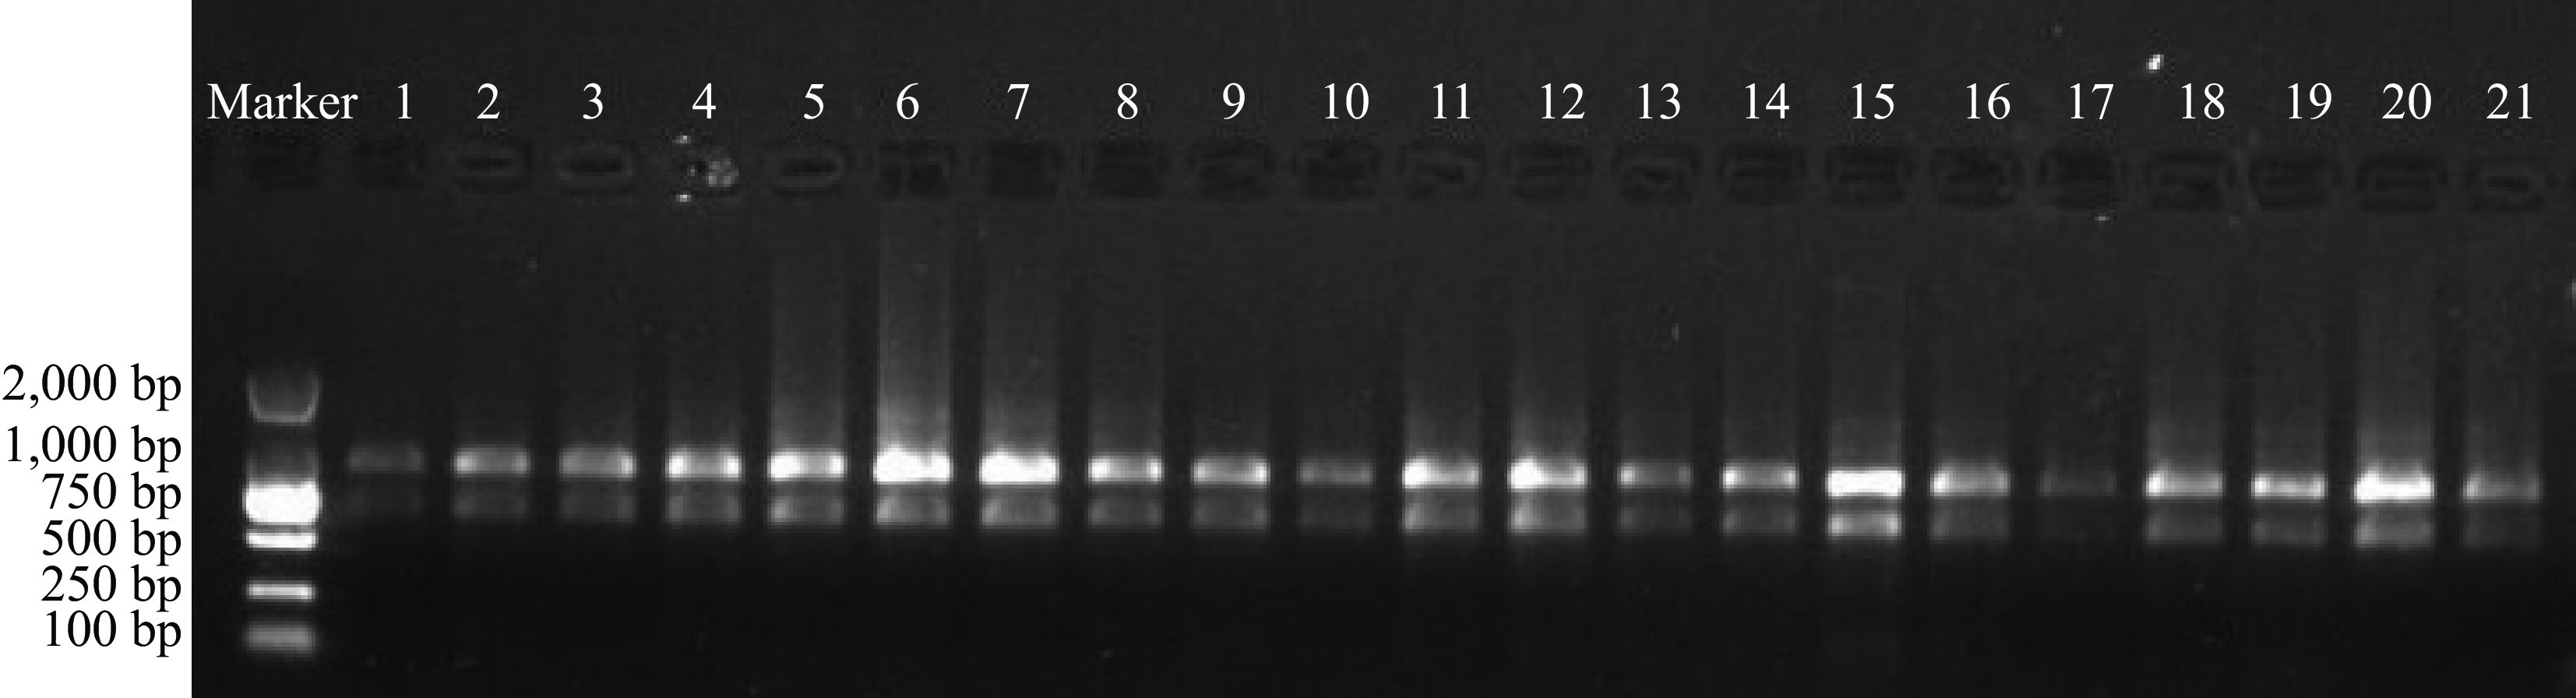
Figure 3.
Electrophoresis detection of total RNA. Marker: DNA marker DL2000; 1–21: flower development period of a tree peony.
Primer specificity test of internal reference genes
-
Primer specificity for the 23 candidate reference genes was first evaluated. Gradient PCR analyses were performed to determine the optimal annealing temperature for each primer pair, and a uniform annealing temperature of 60 °C was selected for all candidates. The resulting PCR products were subsequently examined by electrophoresis on 1% agarose gels. Clear and distinct amplification bands were observed for all 23 genes, with product sizes consistent with the expected lengths, ranging from 140 to 250 bp. No nonspecific amplification, primer–dimer formation, or additional bands were detected (Fig. 4). Furthermore, melting curve analyses revealed a single, sharp peak for each gene, confirming the high specificity of the primer pairs (Fig. 5).

Figure 4.
Amplification results of each primer. Marker: DNA marker DL2000; 1–23: amplification results of the 23 reference genes to be tested.
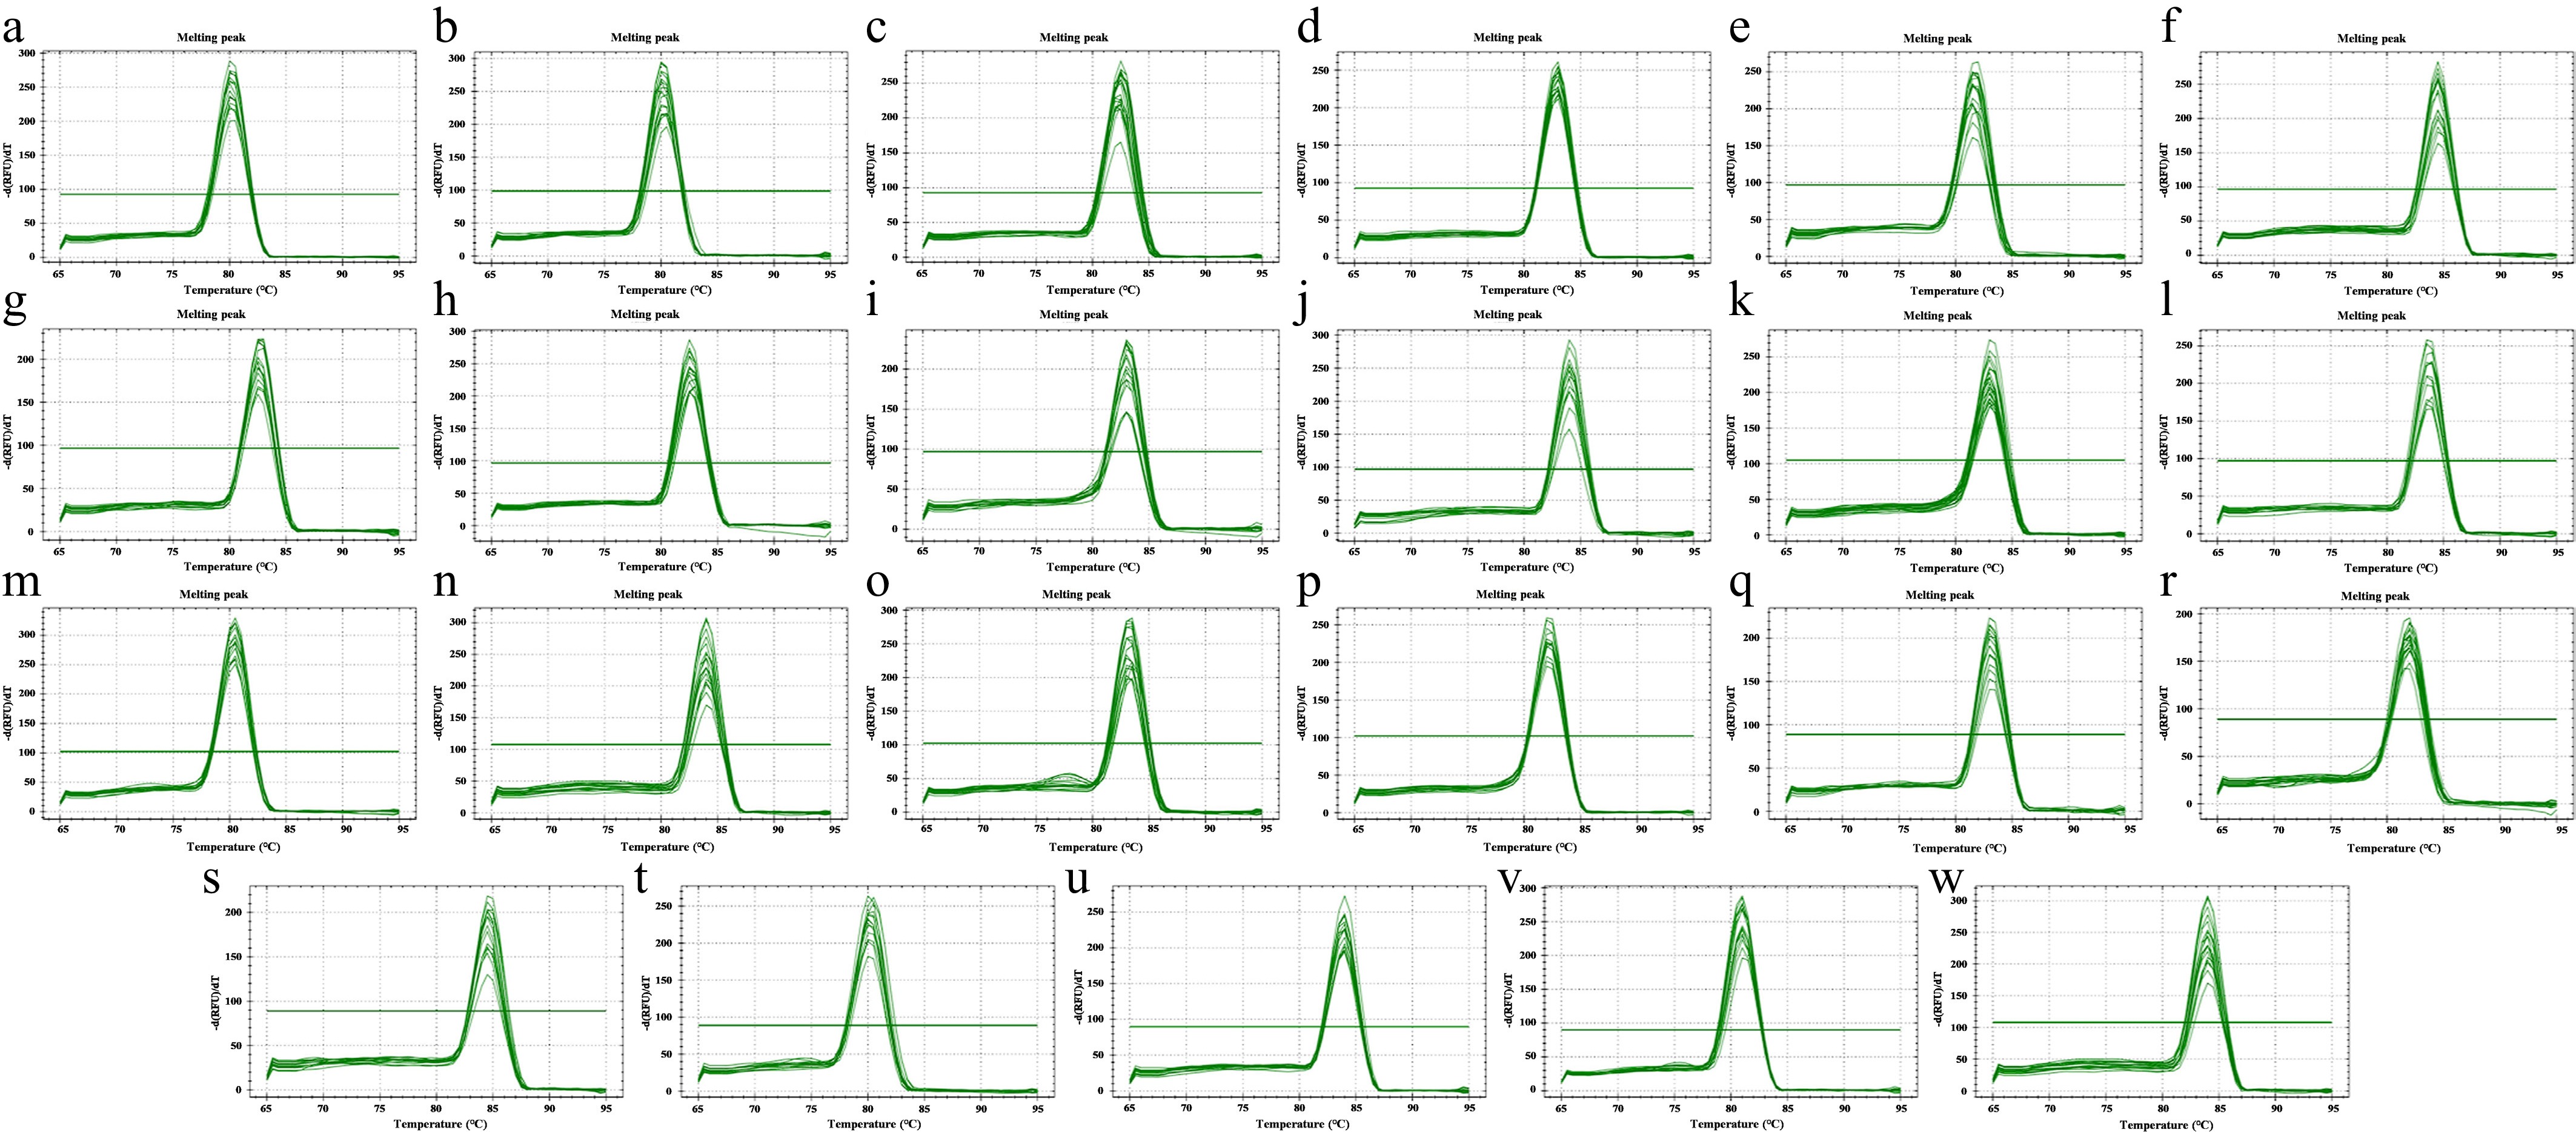
Figure 5.
The melting curve of each primer. a–w: Melting curve plots corresponding to each of the 23 tested candidate reference genes, each showing a single specific amplification peak without non-specific products or primer dimers.
Delta CT method analysis
-
Ct (quantification cycle): the number of amplification cycles at which the fluorescence signal exceeds the background threshold during qRT-PCR detection. A lower Ct value indicates a higher initial transcript abundance of the target gene. The expression levels of 23 candidate reference genes were detected by qRT-PCR, and their expression stability was analyzed using the ΔCt method. The results showed that the Ct values of all candidate reference genes were distributed within a certain range. A lower Ct value indicated a higher transcriptional expression level, and a smaller variation in Ct values among samples indicated more stable expression. In the full-bloom petals of early-and late-flowering tree peony cultivars, EF1-α-1 had the lowest average Ct value and the highest expression level, whereas RPL had the highest average Ct value and the lowest expression level. Tubulin-α exhibited the largest variation in Ct values among different cultivars and the poorest expression stability, while PPC showed the smallest variation in Ct values and the most stable expression (Fig. 6a). During the 16 stages of floral bud differentiation and flower development in Paeonia ostii 'FengDan' and Paeonia suffruticosa 'LianHe', EF1-α-1 had the lowest average Ct value and the highest expression level, while RPL had the highest average Ct value and the lowest expression level. UBi-lp displayed the largest fluctuation in Ct values across developmental stages and the worst stability, whereas GTP showed the smallest fluctuation in Ct values and the most stable expression (Fig. 6b).
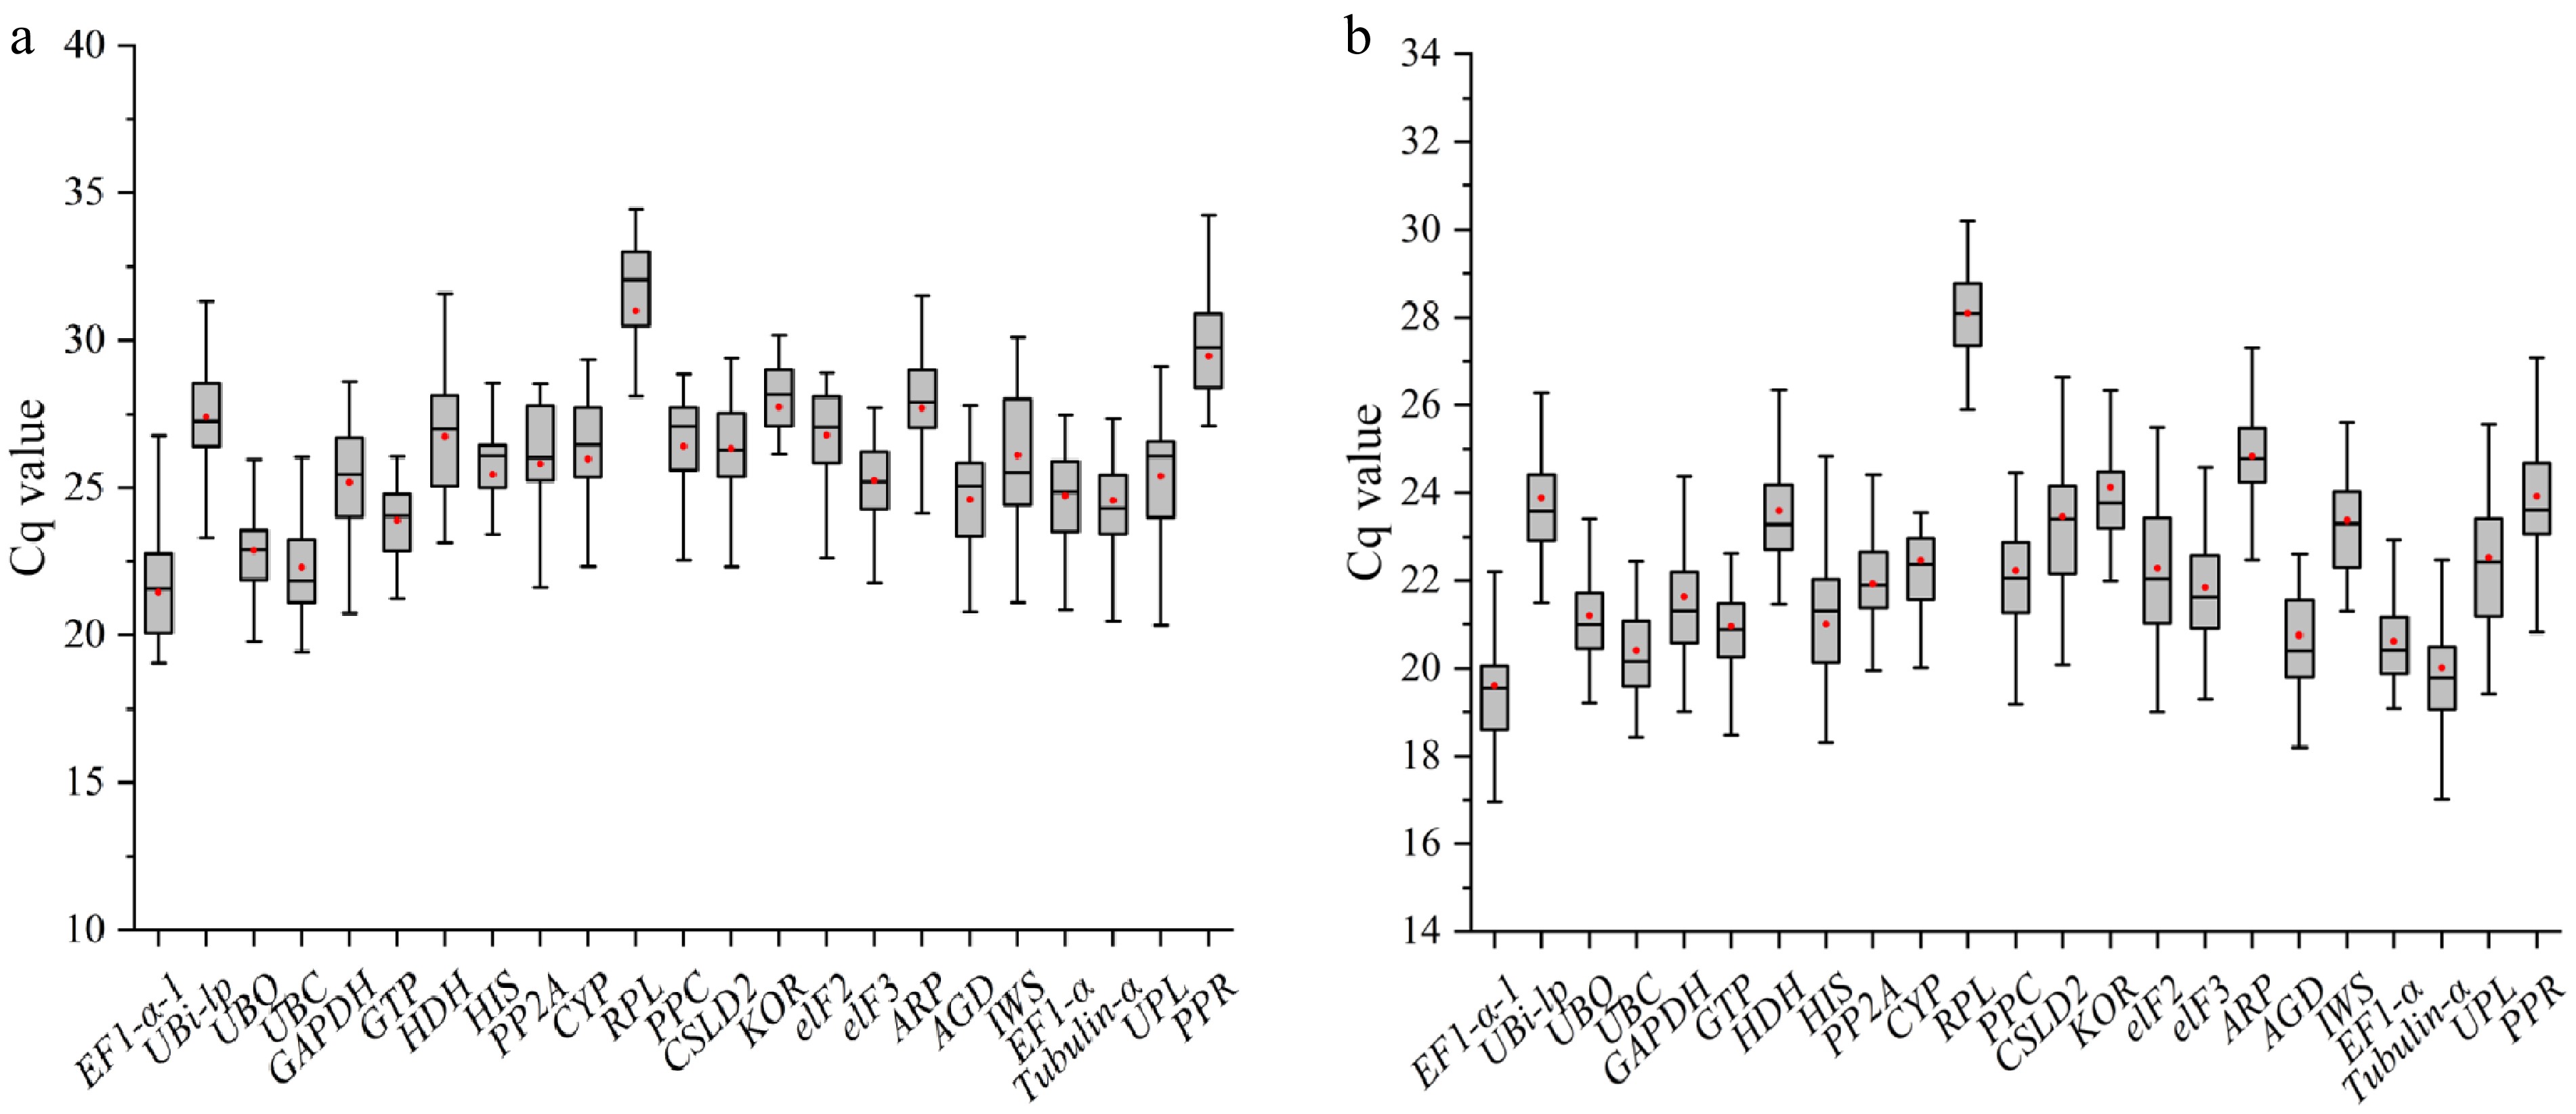
Figure 6.
Expression levels of the 23 candidate reference genes in a tree peony. (a) Expression levels in full-bloom petals of early- and late-flowering cultivars. (b) Expression levels during 16 stages of floral bud differentiation and flower development.
Standard curve and amplification efficiency analysis
-
Amplification efficiencies of all primers were evaluated using standard curves, yielding efficiencies between 92.8% and 110.1%, with correlation coefficients (R2) > 0.97 (Table 2). These results demonstrate that all primers exhibit high specificity and efficient amplification, meeting the essential criteria for qRT-PCR assays, and are thus suitable for subsequent experiments.
Table 2. Amplification characteristics of 23 candidate reference gene primers.
Gene name Tm (°C) Slope R2 Efficiency EF1-α-1 64 −3.508 0.987 92.8% UBi-lp 61 −3.283 0.977 101.7% UBQ 61 −3.238 0.987 101.7% UBC 61 −3.392 0.994 97.1% UPL 62 −3.194 0.981 108.2% GAPDH 58 −3.101 0.971 110.1% HIS 59 −3.162 0.983 98.5% CYP 59 −3.111 0.978 97.3% RPL 61 −3.249 0.990 103.7% CSLD2 62 −3.468 0.970 99.4% KOR 58 −3.445 0.980 95.7% AGD 61 −3.144 0.973 102.8% ARP 59 −3.220 0.970 104.2% IWS 59 −3.306 0.980 98.1% GTP 62 −3.528 0.999 97.2% PP2A 61 −3.165 0.990 106.2% eIF2 59 −3.231 0.991 94.65 eIF3 64 −3.125 0.986 95.9% PPR 62 −3.284 0.993 96.9% HDH 61 −3.5755 0.970 99.5% PPC 59 −3.2020 0.996 97.6% EF1-α 62 −3.2965 0.980 99.8% Tubulin-α 62 −3.1160 0.990 102.6% Screening of optimal internal reference genes for studying the flowering time of tree peony
-
The geNorm algorithm evaluates the stability of candidate reference genes using an internal calculation method, in which a lower M value indicates greater expression stability. We applied geNorm to assess the stability of 23 candidate reference genes across 21 early-flowering and 21 late-flowering cultivars. The stability ranking derived using geNorm had the following order: PPC/CSLD2 > KOR > AGD > eIF2 > GTP > UBi-lp > UPL > PPR > HDH > GAPDH > UBQ > UBC > eIF3 > EF1-α > HIS > IWS > ARP > PP2A > EF1-α-1 > CYP > Tubulin-α > RPL (Fig. 7a). Pairwise variation analysis showed a V2/3 value of 0.265, exceeding the default threshold of 0.15 (Fig. 7b). Similarly, the values for V3/4, V4/5, and V5/6 were 0.272, 0.191, and 0.163, respectively, all above the threshold. However, V6/7 dropped below the threshold at 0.139, indicating that the top six genes—PPC, CSLD2, KOR, AGD, eIF2, and GTP—constitute a stable set of reference genes for this experimental condition.
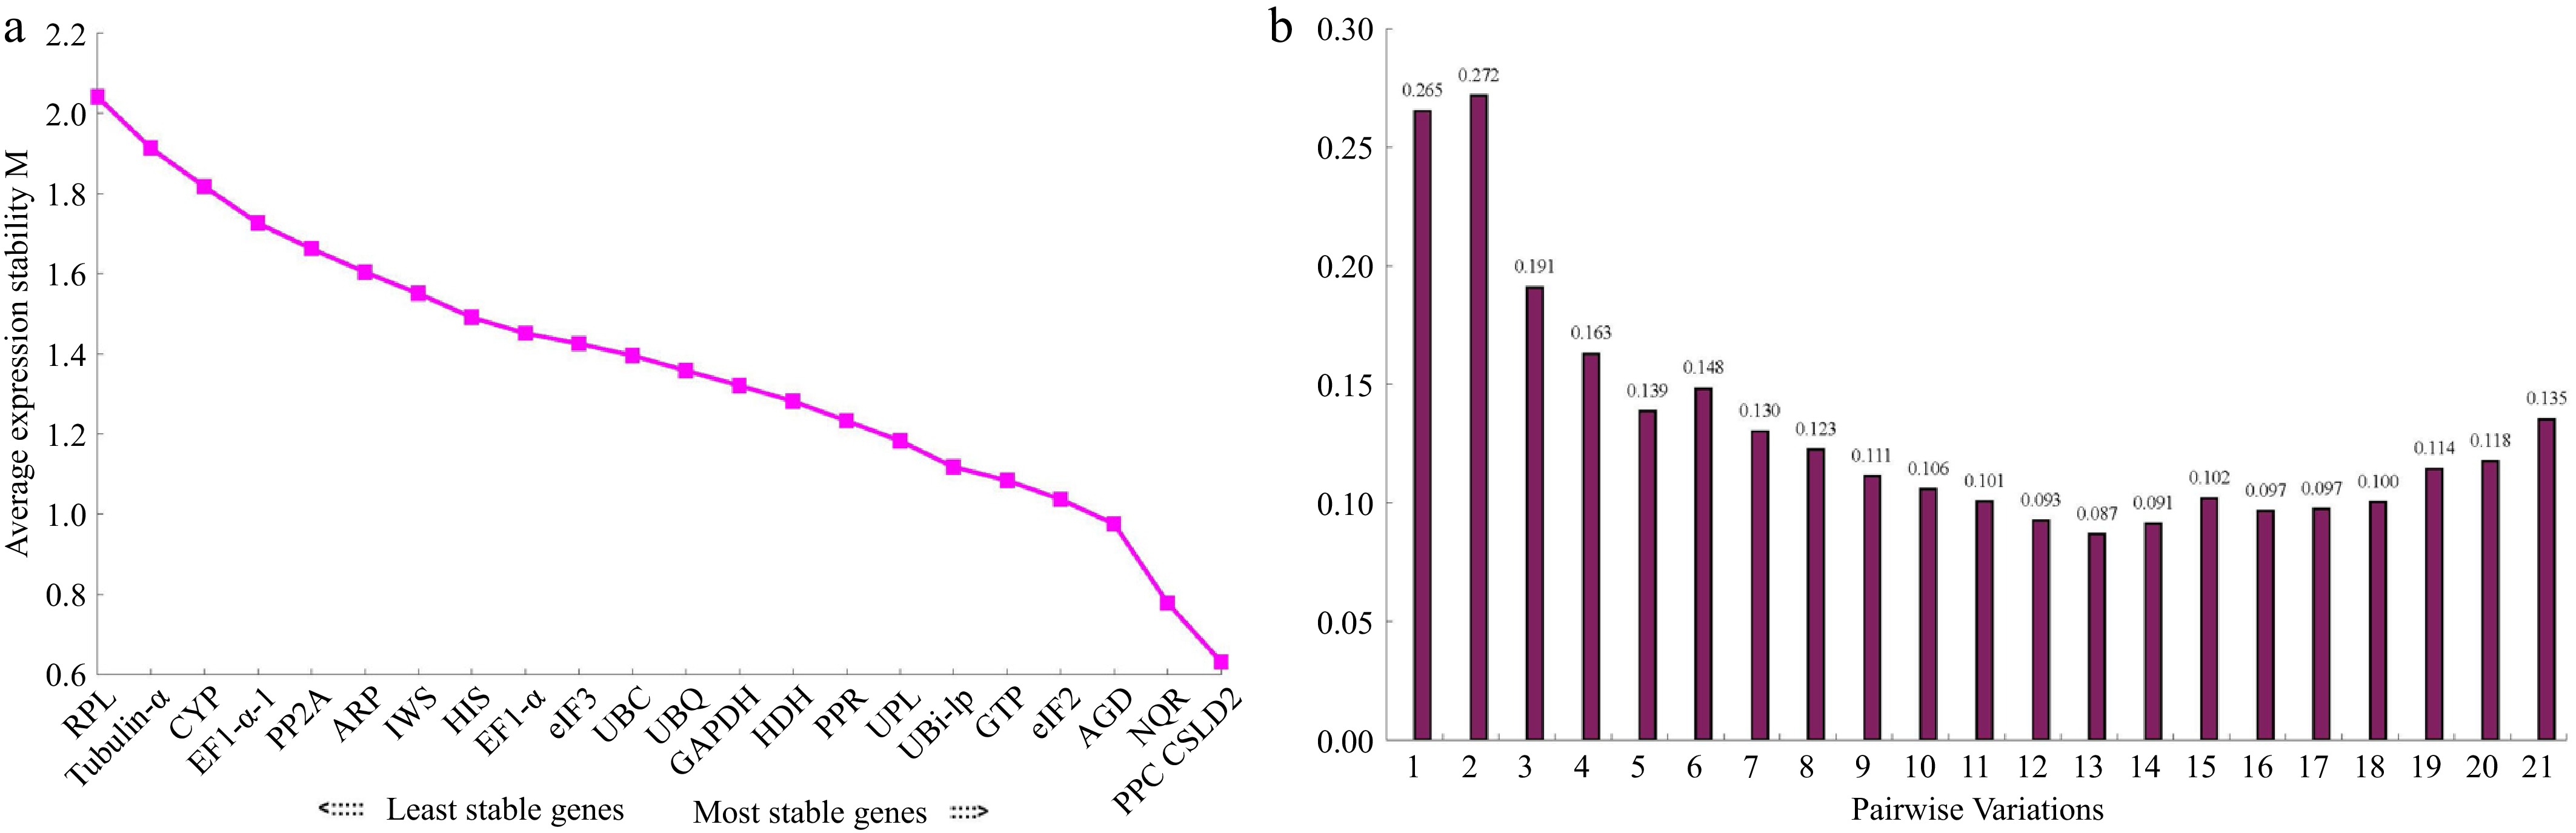
Figure 7.
Results of early- and late-flowering variety experiments using geNorm software. a: Average expression stability value (M) ranking of 23 candidate reference genes (genes arranged from least stable on the left to most stable on the right); b: Pairwise variation (V) analysis to determine the optimal number of reference genes for normalization.
The selection criteria of the NormFinder program align with those of geNorm, both identifying the reference gene with the lowest stability value as the optimal internal control. However, NormFinder uniquely selects a single best reference gene. According to NormFinder analysis, the stability ranking of the 23 candidate genes was AGD > PPC > eIF2 > GTP > KOR > CSLD2 > UBi-lp > UBQ > UPL > HDH > eIF3 > PPR > UBC > GAPDH > EF1-α > HIS > IWS > ARP > PP2A > EF1-α-1 > CYP > Tubulin-α > RPL, as per which AGD was identified as the optimal reference gene (Table 3). Notably, the top-ranked genes by NormFinder largely concurred with those identified by geNorm.
Table 3. Results of early- and late-flowering cultivar experiments using NormFinder software.
Gene name Stability value SD Rank AGD 0.52 0.09 1 PPC 0.53 0.09 2 eIF2 0.54 0.09 3 GTP 0.62 0.10 4 KOR 0.62 0.10 5 CSLD2 0.65 0.11 6 UBi-lp 0.68 0.11 7 UBQ 0.70 0.11 8 UPL 0.79 0.12 9 HDH 0.79 0.12 10 eIF3 0.81 0.13 11 PPR 0.82 0.13 12 UBC 0.85 0.13 13 GAPDH 0.88 0.14 14 EF1-α 0.97 0.15 15 HIS 1.06 0.16 16 IWS 1.15 0.17 17 ARP 1.20 0.18 18 PP2A 1.21 0.18 19 EF1-α-1 1.33 0.20 20 CYP 1.67 0.25 21 Tubulin-α 1.78 0.26 22 RPL 2.15 0.31 23 According to the BestKeeper program, the stability ranking of the 23 candidate reference genes was eIF3 > GTP > UBQ > eIF2 > KOR > UBC > UBi-lp > AGD > PPC > CSLD2 > HIS > ARP > PP2A > HDH > EF1-α-1 > EF1-α > GAPDH > UPL > PPR > Tubulin-α > CYP > IWS > RPL. The optimal reference gene identified by BestKeeper was eIF3 (Table 4), which differed from the results obtained by geNorm and NormFinder, likely due to differences in the underlying algorithms of the software. However, PPC, CSLD2, KOR, AGD, eIF2, and GTP remained highly ranked in the BestKeeper analysis, further confirming their stability across different algorithms.
Table 4. Results of early- and late-flowering cultivar experiments using BestKeeper software.
Gene name Cq Stability
rankGeometric mean Mean Min Max SD CV/% eIF3 25.21 25.24 21.87 27.63 0.97 3.83 1 GTP 23.85 23.89 21.27 25.95 1.08 4.54 2 UBQ 22.82 22.87 20.17 26.28 1.11 4.85 3 eIF2 26.73 26.78 22.81 28.79 1.24 4.63 4 KOR 27.67 27.73 22.42 29.76 1.24 4.46 5 UBC 22.23 22.29 19.52 27.67 1.33 5.96 6 UBi-lp 27.35 27.40 23.40 31.88 1.36 4.95 7 AGD 24.55 24.60 21.03 27.7 1.39 5.64 8 PPC 26.34 26.40 21.46 28.65 1.40 5.32 9 CSLD2 26.25 26.32 21.65 29.23 1.43 5.45 10 HIS 25.36 25.45 19.51 28.07 1.47 5.77 11 ARP 27.84 27.91 22.88 31.23 1.47 5.27 12 PP2A 25.70 25.80 18.69 28.48 1.54 5.96 13 HDH 26.66 26.73 23.36 31.39 1.57 5.87 14 EF1-α-1 21.33 21.44 15.19 26.70 1.58 7.39 15 EF1-α 24.62 24.72 19.29 29.89 1.63 6.61 16 GAPDH 25.10 25.18 20.84 28.29 1.68 6.67 17 UPL 25.30 25.39 20.43 28.95 1.68 6.62 18 PPR 29.37 29.47 23.40 34.24 1.73 5.85 19 Tubulin-α 24.42 24.56 20.06 35.03 1.76 7.18 20 CYP 25.84 25.97 19.02 29.11 1.81 6.97 21 IWS 26.00 26.09 21.48 29.81 1.96 7.52 22 RPL 30.79 30.99 20.94 34.19 2.31 7.46 23 The stability of 23 candidate reference genes was evaluated using the RefFinder program, with the following ranking: PPC > AGD > eIF2 > KOR > GTP > CSLD2 > eIF3 > UBQ > UBi-lp > HDH > UPL > UBC > PPR > GAPDH > HIS > EF1-α > ARP > PP2A > IWS > EF1-α-1 > CYP > Tubulin-α > RPL. Based on these calculations, PPC was identified as the most stable reference gene (Table 5), making it the most suitable reference gene for the study of early and late flowering in tree peony.
Table 5. Results of early- and late-flowering cultivar experiments using RefFinder software.
Gene name Geomean of ranking values Stability rank Gene name Geomean of ranking values Stability rank PPC 2.06 1 PPR 12.26 13 AGD 2.83 2 GAPDH 13.84 14 eIF2 3.87 3 HIS 14.57 15 GTP 3.94 4 EF1-α 15.24 16 KOR 3.94 5 ARP 16.26 17 CSLD2 4.36 6 PP2A 17.28 18 eIF3 6.56 7 IWS 18.13 19 UBQ 6.93 8 EF1-α-1 18.61 20 UBi-lp 7.00 9 CYP 21.00 21 HDH 10.59 10 Tubulin-α 21.48 22 UPL 10.67 11 RPL 23.00 23 UBC 10.72 12 Screening of optimal reference genes in flower bud differentiation and flower development of tree peony
-
The stability ranking of 23 candidate reference genes during floral bud differentiation and flower development in Paeonia obtained using geNorm was as follows: EF1-α-1/UBi-lp > HDH > CYP > Tubulin-α > AGD > PPC > IWS > GTP > EF1-α > GAPDH > PPR > UBQ > eIF3 > UBC > KOR > CSLD2 > UPL > HIS > eIF2 > ARP > RPL > PP2A (Fig. 8a). Pairwise variation analysis yielded a V2/3 value of 0.138, which is below the default threshold of 0.15 (Fig. 8b), indicating that the two most stable reference genes for this experimental condition are EF1-α-1 and UBi-lp.
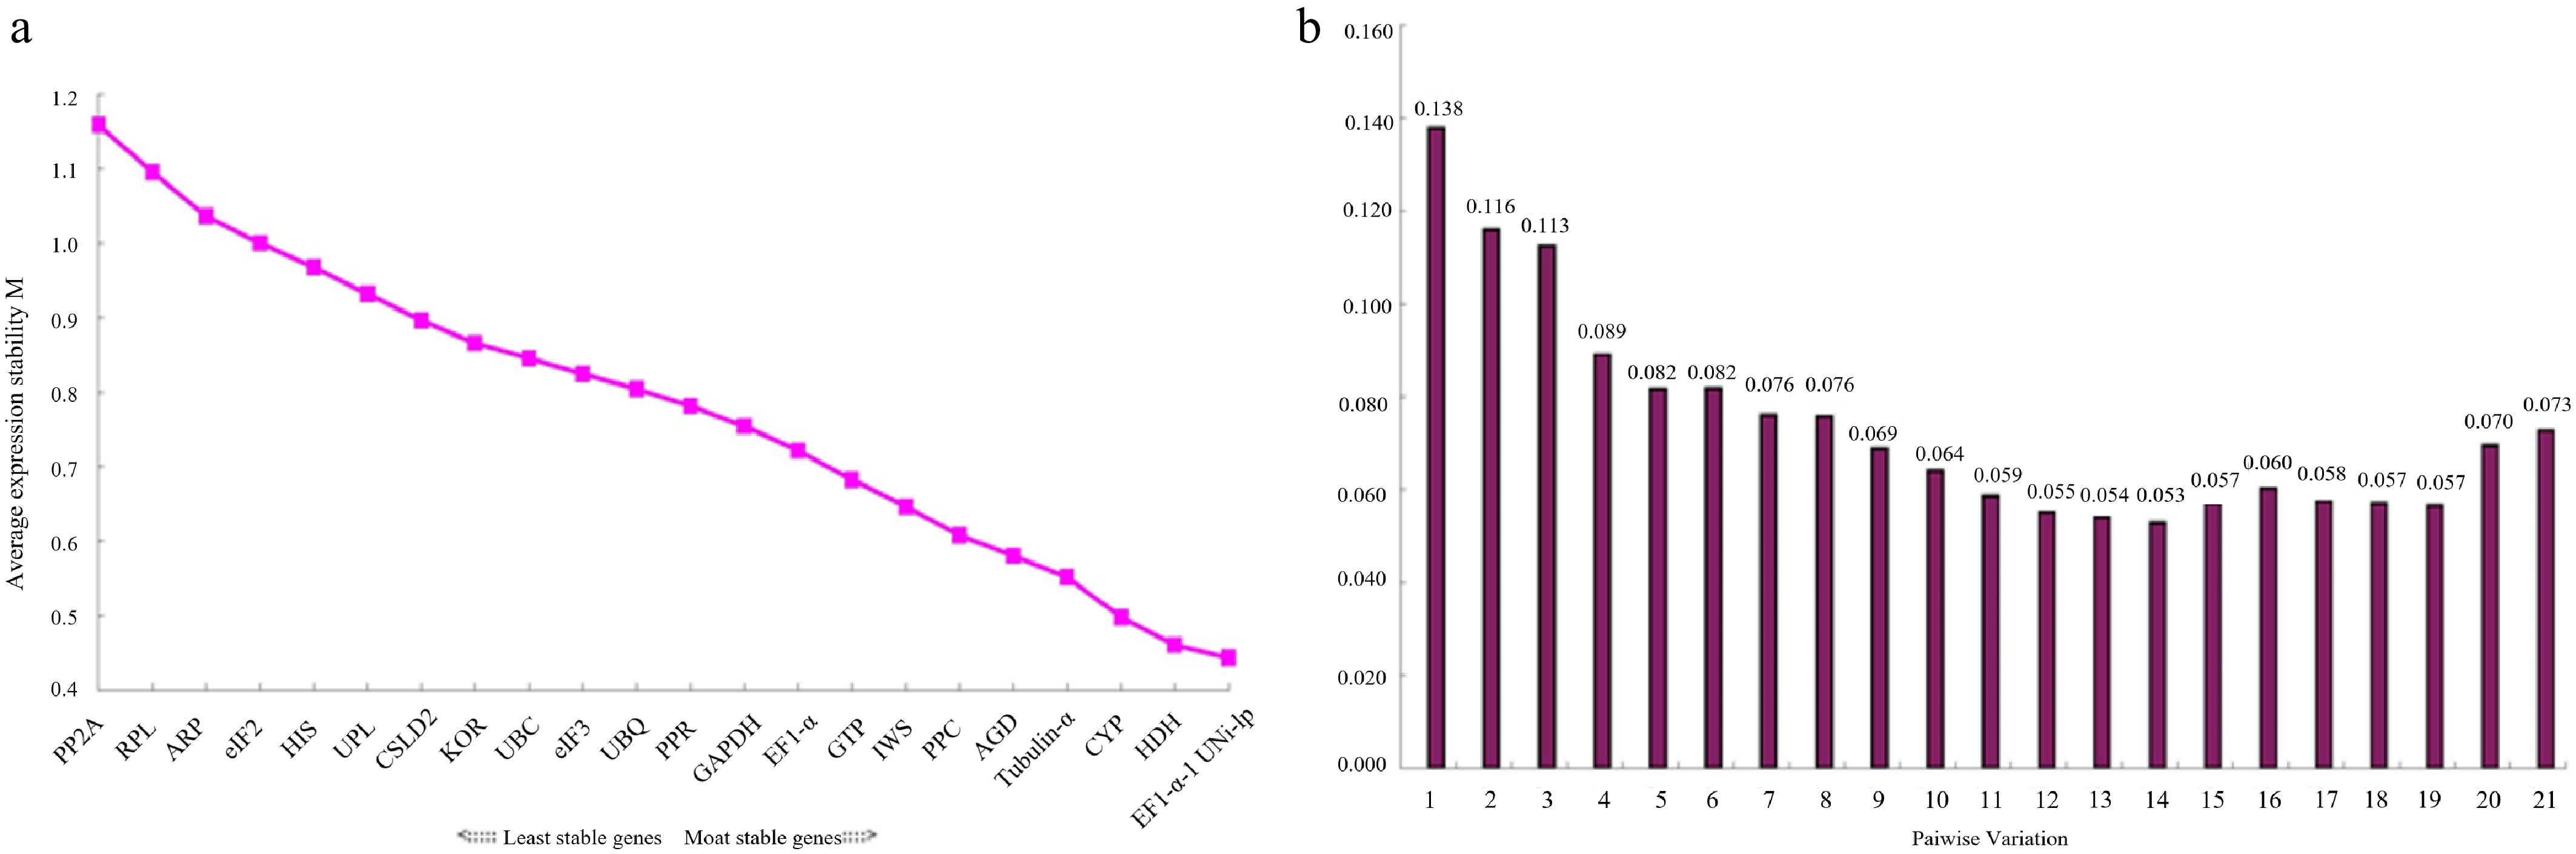
Figure 8.
Results of bud differentiation and flower development experiments using geNorm software. a: Average expression stability value (M) ranking of 23 candidate reference genes; genes arranged from left to right represent the least stable to the most stable. b: Pairwise variation (V) analysis to determine the optimal number of internal reference genes for normalization; the threshold value of V is set as 0.15.
The stability ranking of 23 candidate reference genes during floral bud differentiation and flower development in Paeonia according to the NormFinder analysis was GTP > EF1-α > GAPDH > EF1-α-1 > Tubulin-α > HDH > PPR > UBQ > IWS > PPC > UBi-lp > UBC > CYP > AGD > KOR > eIF3 > CSLD2 > ARP > HIS > UPL > eIF2 > RPL > PP2A, as per which GTP was identified as the optimal reference gene (Table 6).
Table 6. Results of bud differentiation and flower development experiments using NormFinder software.
Gene name Stability value SD Rank GTP 0.27 0.04 1 EF1-α 0.37 0.05 2 GAPDH 0.37 0.05 3 EF1-α-1 0.40 0.06 4 Tubulin-α 0.42 0.06 5 HDH 0.43 0.06 6 PPR 0.44 0.06 7 UBQ 0.45 0.06 8 IWS 0.48 0.07 9 PPC 0.48 0.07 10 UBi-lp 0.48 0.07 11 UBC 0.48 0.07 12 CYP 0.51 0.07 13 AGD 0.51 0.07 14 KOR 0.53 0.07 15 eIF3 0.55 0.07 16 CSLD2 0.66 0.09 17 ARP 0.735 0.096 18 HIS 0.687 0.090 19 UPL 0.757 0.099 20 eIF2 0.810 0.105 21 RPL 1.009 0.130 22 PP2A 1.155 0.148 23 According to the BestKeeper analysis, the stability ranking of 23 candidate reference genes during floral bud differentiation and flower development in Paeonia was RPL > GTP > EF1-α > UBC > PP2A > ARP > IWS > EF1-α-1 > CYP > AGD > HDH > UBQ > Tubulin-α > UBi-lp > KOR > GAPDH > eIF3 > PPC > HIS > PPR > UPL > CSLD2 > eIF2. Although RPL was identified as the optimal reference gene by BestKeeper (Table 7), it showed relatively poor stability in geNorm and NormFinder analyses.
Table 7. Results of bud differentiation and flower development experiments using BestKeeper software.
Gene name Cq Stability
rankGeometric mean Mean Min Max SD CV/% RPL 28.08 28.10 26.07 29.94 0.81 2.88 1 GTP 20.92 20.95 18.60 24.89 0.82 3.89 2 EF1-α 20.60 20.62 19.24 24.59 0.84 4.05 3 UBC 20.38 20.42 18.47 25.02 0.92 4.49 4 PP2A 21.88 21.92 17.85 24.44 0.95 4.32 5 ARP 24.80 24.83 22.48 27.31 0.97 3.89 6 IWS 23.33 23.37 21.32 28.86 0.97 4.16 7 EF1-α-1 19.55 19.61 17.02 26.17 1.00 5.08 8 CYP 22.41 22.47 20.04 29.22 1.00 4.45 9 AGD 20.71 20.75 18.27 26.63 1.03 4.98 10 HDH 23.53 23.58 21.59 30.15 1.04 4.39 11 UBQ 21.14 21.20 18.04 26.09 1.05 4.97 12 Tubulin-α 19.96 20.01 17.39 25.95 1.06 5.30 13 UBi-lp 23.82 23.88 21.51 31.37 1.06 4.45 14 KOR 24.07 24.12 20.81 28.99 1.11 4.61 15 GAPDH 21.58 21.63 19.12 26.98 1.15 5.34 16 eIF3 21.79 21.84 19.51 27.58 1.16 5.30 17 PPC 22.17 22.23 19.20 29.20 1.16 5.22 18 HIS 20.94 20.99 18.38 24.53 1.19 5.68 19 PPR 23.86 23.92 20.69 29.41 1.25 5.23 20 UPL 22.47 22.53 19.46 26.85 1.33 5.91 21 CSLD2 23.38 23.45 20.20 28.78 1.35 5.76 22 eIF2 22.21 22.28 19.07 28.97 1.44 6.48 23 The stability of 23 candidate reference genes was assessed using the RefFinder program, yielding the following ranking: GTP > EF1-α-1 > EF1-α > HDH > UBi-lp > GAPDH > Tubulin-α > CYP > IWS > UBC > RPL > AGD > PPC > UBQ > PPR > ARP > KOR > PP2A > eIF3 > CSLD2 > HIS > UPL > eIF2. Based on these results, GTP was identified as the most stable reference gene (Table 8), making it the most suitable reference gene for studies on flower bud differentiation and development in tree peony.
Table 8. Results of bud differentiation and flower development experiments using RefFinder software.
Gene name Geomean of ranking values Stability rank Gene name Geomean of ranking values Stability rank GTP 2.06 1 PPC 10.32 13 EF1-α-1 2.83 2 UBQ 10.57 14 EF1-α 4.36 3 PPR 10.77 15 HDH 5.30 4 ARP 14.79 16 UBi-lp 5.73 5 KOR 15.24 17 GAPDH 6.31 6 PP2A 15.71 18 Tubulin-α 6.35 7 eIF3 15.71 19 CYP 8.47 8 CSLD2 18.13 20 IWS 8.82 9 HIS 18.49 21 UBC 10.02 10 UPL 19.47 22 RPL 10.16 11 eIF2 21.22 23 AGD 10.22 12 Stability verification of tree peony internal reference gene
-
To further validate the stability of the optimal reference genes, we selected the most important floral development-related gene PsFRL5 for verification during flower development in different tree peony cultivars. The results are shown in Fig. 9a and b. When using the most stable reference genes, PPC and GTP, as internal controls, the expression pattern of the target gene PsFRL5 was consistent across cultivars. However, when the least stable reference gene, PP2A (Fig. 9c), was used, the expression pattern of PsFRL5 differed.
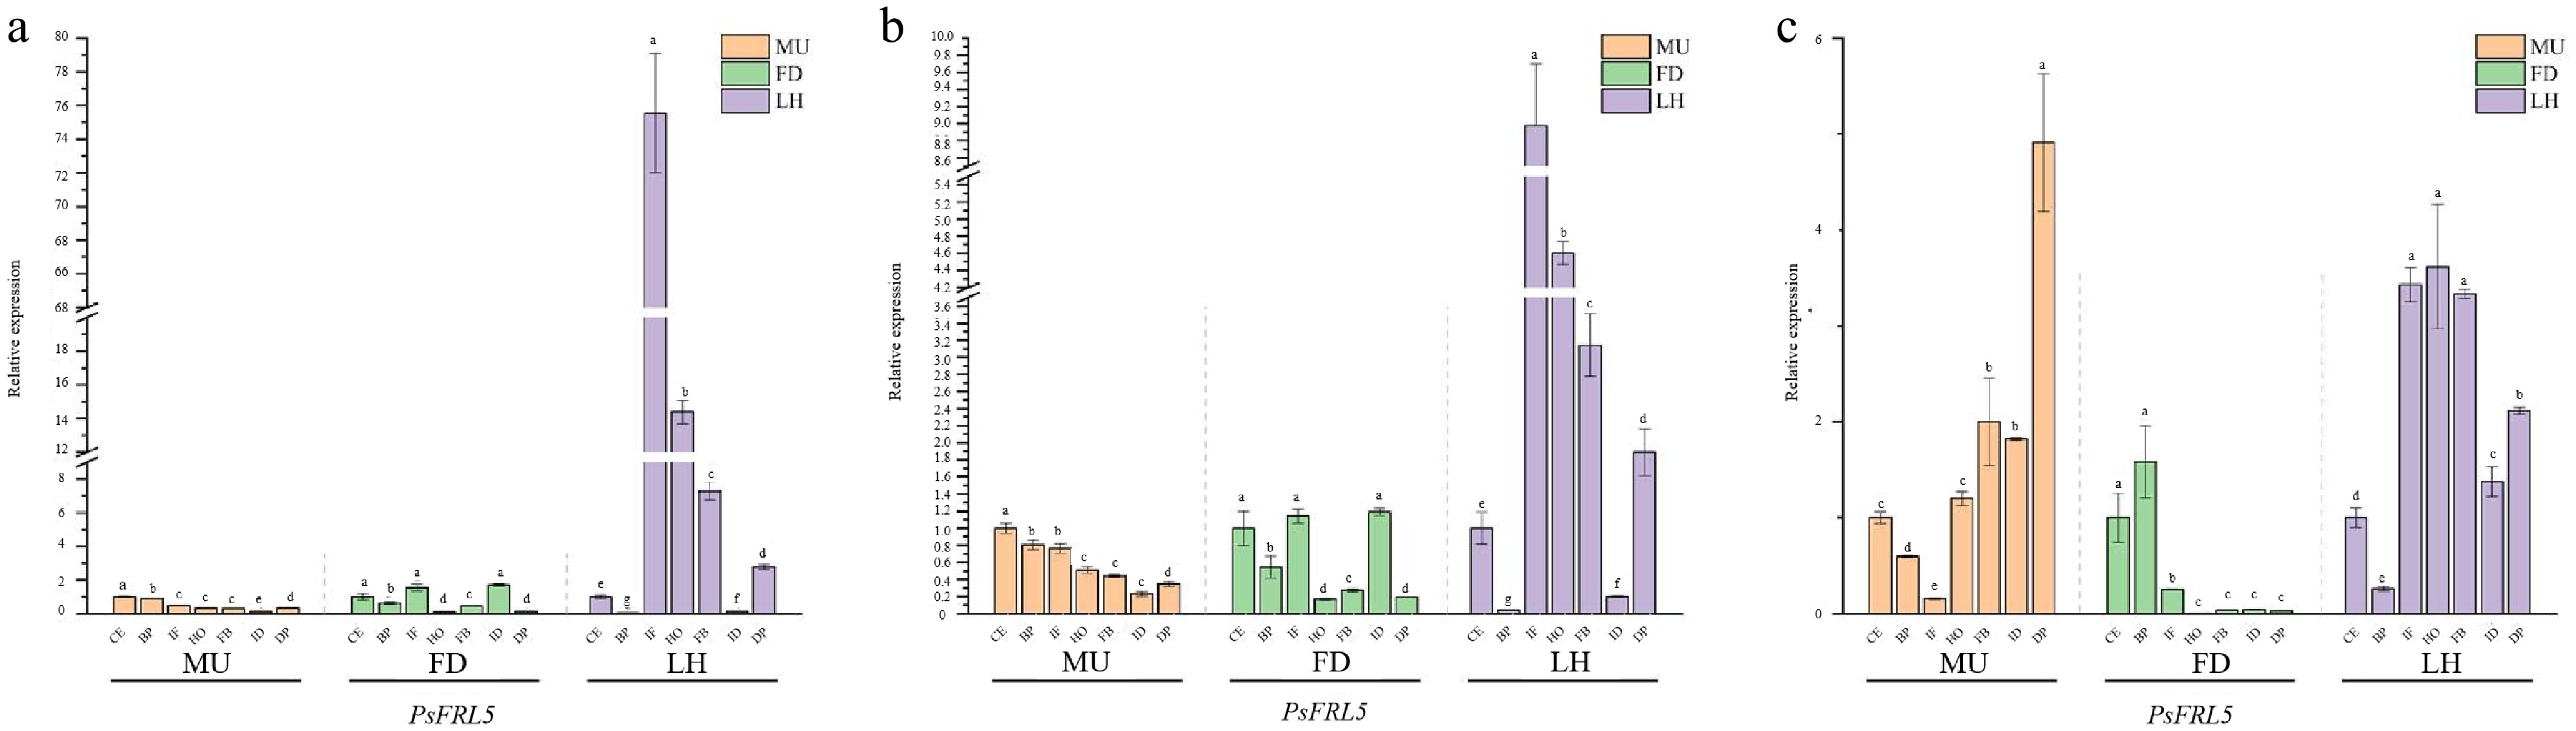
Figure 9.
Results of expression verification analysis of PsFRL5 in different varieties of peony flowers at 7 stages of development. a: PPC; b: GTP; c: PP2A. Notes: MU: mutant of Paeonia ostii 'Fengdan'; FD: Paeonia ostii 'Fengdan'; LH: Paeonia suffruticosa 'Lianhe'.
-
Quantitative reverse transcription polymerase chain reaction (qRT-PCR) is a widely used method for analyzing gene expression patterns due to its sensitivity, specificity, and reproducibility[23,24]. However, the accuracy of qRT-PCR results depends heavily on the selection of appropriate reference genes. No single reference gene is universally stable across all plant species, tissues, developmental stages, or experimental conditions[25,26]. Therefore, it is essential to select the most appropriate reference genes tailored to the specific experimental conditions[27,28]. The commonly used Actin gene has been employed as a reference gene in species such as Arabidopsis thaliana[29], Populus[30], and Oryza sativa[31] to study various functional genes. In Oryza sativa, researchers analyzed public microarray databases and screened 10 candidate reference genes from four widely expressed gene families: GAPDH, ACT, UBI, and CYP (cytochrome P450). After conducting qRT-PCR experiments and rigorous statistical analysis, they found that a ubiquitin isoform gene performed best as a single reference gene, while a combination of another ubiquitin gene and two cyclophilin isoforms provided the most stable expression, offering a reliable basis for monitoring differential expression of drought-related candidate genes[32]. Paeonia is a valuable ornamental and medicinal plant endemic to China, characterized by diverse flowering phenology and a complex floral development process, which poses significant challenges for selecting stable reference genes. In this study, we systematically evaluated the expression stability of 23 candidate reference genes across petals of different flowering cultivars, as well as during floral bud differentiation and development stages, using four widely accepted algorithms: geNorm, NormFinder, BestKeeper, and RefFinder. Our aim was to identify reliable internal controls to support future molecular investigations of flowering regulation in Paeonia.
The screening results indicated that PPC was the most stable reference gene for distinguishing between early- and late-flowering tree peony varieties. This conclusion was consistent across both geNorm and NormFinder analyses. Notably, AGD ranked first in NormFinder and PPC ranked second, both showing high stability. The agreement between the algorithms confirms the reliability of these genes as reference genes for comparative studies of early and late flowering varieties. PPC, involved in carbon metabolism and stress response, shows stable expression across different flowering varieties, potentially reflecting the conserved metabolic balance required for petal development[33]. The PPC gene has been identified as the optimal internal reference gene for comparison between flowering periods, which is supported by solid biological evidence. PPC is also a key enzyme involved in carbon fixation and primary metabolism, playing a critical role in maintaining cellular energy homeostasis during flower development. Its stable expression across early-flowering and late-flowering varieties suggests that, regardless of variation in flowering time, the fundamental metabolic processes are tightly regulated, making it a reliable reference gene for comparative studies. CSLD2, a member of the cellulose synthase gene family, plays a crucial role in cell wall biosynthesis and cell expansion, both of which are essential processes during petal formation[34]. The stable expression of these functional genes across varieties suggests their potential as species-specific reference genes for tree peony.
For the dynamic process of flower bud differentiation and development, geNorm identified EF1-α-1 and UBi-lp as the most stable reference genes, while both NormFinder and BestKeeper confirmed GTP as one of the optimal candidate genes. EF1-α-1 is a widely recognized reference gene across various plant species due to its conserved role in protein synthesis and its stable expression throughout different developmental stages[35]. UBi-lp is involved in the ubiquitination pathway, which regulates protein turnover and is crucial for developmental transitions, explaining its stable expression during the development of tree peony flowers[36]. GTP plays a role in signal transduction and energy metabolism, making it a reliable reference gene for tracking gene expression dynamics throughout the flowering process[37]. Furthermore, GTP is involved in signal transduction and energy metabolism. Its stability during the dynamic process of flower bud differentiation reflects the conserved demand for cellular signal transduction and energy supply throughout the developmental transition. The stable expression of these functional genes across different varieties suggests their potential as species-specific reference genes for peony.
Our findings align with recent studies on reference gene selection in other ornamental and perennial species, highlighting both commonalities and species-specific patterns that underscore the novelty of this work. In tree peony, Zhou et al.[38] evaluated nine reference genes in Paeonia suffruticosa 'Doulv' and identified GAPDH and ACT as the most stable in petaloid stamens, while UBC and MBF1A performed best across tissues. Notably, these genes were not top-ranked in our study, reflecting the condition-dependent nature of reference gene stability. Similarly, in Clematis lanuginosa, Li et al.[39] found PP2A-2 and UBC34 stable in vegetative tissues, whereas PP2A ranked 19th in our study on early- and late-flowering cultivars. Collectively, these comparisons demonstrate the following: (i) no universal reference gene exists across perennial species or experimental conditions; (ii) PPC and GTP are novel reference genes for tree peony; (iii) the condition-specific reference genes validated here provide essential tools for future functional genomics research on flowering regulation in Paeonia species.
Although this study is relatively comprehensive, several limitations should be addressed. First, our evaluation was focused solely on petal tissue, as petals are the primary target organs for studies on flowering time and flower development. However, the stability of reference genes may vary across different tissues (such as leaves, roots, stems, and reproductive organs), and future studies should expand validation to include a broader range of tissue types to support more extensive applications. Second, while this study covered two key experimental contexts—varietal comparison of flowering time and flower bud differentiation/flower development—we did not assess the stability of reference genes under abiotic stress conditions (such as drought, low temperature, and salt stress) or hormone treatments. Therefore, future research should validate the identified reference genes (PPC and GTP) across a wider array of tissues and experimental conditions, including abiotic stress treatments and plant hormone treatments.
In conclusion, this study, through transcriptomic data mining of tree peony, identified suitable reference genes for the regulation of flowering time and flower development. The most appropriate reference gene for early- and late-flowering varieties was found to be PPC, while GTP was deemed the most suitable reference gene for flower bud differentiation and development. These findings provide a solid foundation for accurate gene expression analysis in tree peony and will contribute to advancing future molecular breeding and functional genomics research.
-
This study systematically screened and validated 23 candidate reference genes for qRT-PCR normalization in tree peony during flowering regulation and floral development. Comprehensive analysis using geNorm, NormFinder, BestKeeper, and RefFinder revealed that PPC was the most stable reference gene for comparing early-and late-flowering cultivars, while GTP performed best across floral bud differentiation and flower development stages. Validation using the flowering-related gene PsFRL5 confirmed the reliability of these reference genes. These results provide robust, condition-specific internal controls for accurate gene expression analysis in tree peony. The identified reference genes will facilitate future molecular studies on flowering time regulation, floral development mechanisms, and functional genomics in Paeonia species. This work also establishes a reproducible pipeline for reference gene selection in other woody perennial ornamentals with similar flowering characteristics.
Henan Province Science and Technology Project [Grant number 252102110323], National Natural Science Foundation Project [Grant number U1804233].
-
The authors confirm their contributions to this study as follows: writing – original draft, visualization, validation, software, methodology, investigation, formal analysis, and data curation: Wu J; conceptualization, data curation, and writing – review and editing: Tang W; investigation: Wang R; software, formal analysis, writing – review, and editing: Li Y; investigation and visualization: Chen L; resources: Guo L; project administration, resources, supervision, and funding acquisition: Hou X. All authors reviewed the results and approved the final version of the manuscript.
-
All data generated or analyzed during this study are included in this published article.
-
The authors declare no conflicts of interest.
- Copyright: © 2026 by the author(s). Published by Maximum Academic Press, Fayetteville, GA. This article is an open access article distributed under Creative Commons Attribution License (CC BY 4.0), visit https://creativecommons.org/licenses/by/4.0/.
-
About this article
Cite this article
Wu J, Tang W, Wang R, Li Y, Chen L, et al. 2026. Screening and verification of real-time fluorescence quantitative PCR reference genes related to flowering regulation of tree peony. Ornamental Plant Research 6: e026 doi: 10.48130/opr-0026-0016 

Screening and verification of real-time fluorescence quantitative PCR reference genes related to flowering regulation of tree peony
- Received: 12 February 2026
- Revised: 26 April 2026
- Accepted: 07 May 2026
- Published online: 28 July 2026
Abstract: Paeonia section Moutan DC is a group of economically significant plants in China, valued for their ornamental, medicinal, and industrial uses. As molecular studies on tree peony advance rapidly, identifying suitable reference genes for normalization of its real-time quantitative polymerase chain reaction (qRT-PCR) data has become increasingly important. In this study, petals collected at full bloom from 21 early-flowering and 21 late-flowering tree peony cultivars, as well as petals sampled across floral bud differentiation and flower development stages from the early-flowering cultivar Paeonia ostii "FengDan" and the late-flowering cultivar Paeonia suffruticosa "Lianhe", were used to systematically evaluate the stability of reference genes. The expression stability of 23 candidate reference genes was assessed using geNorm, NormFinder, BestKeeper, and RefFinder algorithms. Among these candidates, PPC was identified as the most suitable reference gene for both early- and late-flowering cultivars at the full-bloom stage. During floral bud differentiation and flower development, GTP exhibited high expression stability and was therefore deemed appropriate as a reference gene. The expression levels of all candidate genes were calibrated and normalized, providing a robust foundation for the accurate quantification of gene expression associated with flowering-time regulation in tree peony.
-
Key words:
- Reference gene /
- Tree peony /
- qRT-PCR /
- Gene expression