












-
Urban green spaces play a crucial role in addressing environmental challenges, such as air pollution[1], land use changes[2], and rising temperatures[3]. They mitigate heat by providing shade, cooling effects, and enhancing thermal comfort[4]. Remote sensing data efficiently monitor the distribution of urban green spaces, providing a scientific basis for environmental management[5]. Accurately extracting trees' attributes (e.g., species, structure, and spatial distribution) from remote sensing data has been widely used for urban forestry applications, such as pollutant monitoring and mitigation, particularly in large-scale urban ecosystems and biodiversity management[6].
Traditionally, field-based approaches for obtaining tree species information are considered to be reliable but are labor-intensive, costly, and impractical in large or inaccessible areas[7]. Recent advancements in remote sensing technologies, such as imagery and light detection and ranging (LiDAR), have opened new possibilities for the classification and identification of tree species[8−10]. Each of these technologies has distinct advantages and limitations in characterizing forest inventories. Imagery offers rich spectral information, which can effectively differentiate tree species by analyzing the reflective characteristics of various bands[11]. However, relying solely on two-dimensional (2D) imagery is incapable of capturing the three-dimensional (3D) spatial structures of trees, limiting the ability to accurately represent their true 3D morphology[12,13]. To address these limitations, researchers have increasingly explored the potential of directly processing 3D point clouds for classifying tree species. Man et al.[14] achieved an accuracy of 95.98% in tree classification using LiDAR, which demonstrated the generalizability and utility of 3D point clouds in complex scenarios. Using unmanned aerial vehicle (UAV) LiDAR data, Zhang et al.[8] used machine learning (ML) and deep learning (DL) techniques to classify four tree species in northern China, achieving high classification accuracy. Additionally, Vahrenhold et al.[15] introduced a novel architecture for automated tree species classification, classifying seven tree species using both airborne and UAV LiDAR data. Although LiDAR data excel at capturing spatial coordinates and 3D structures, LiDAR records only trees' return intensity and lacks detailed spectral information. Consequently, it remains challenging to distinguish between structurally similar yet spectrally distinct tree species solely on the basis of LiDAR return data. To overcome this limitation, LiDAR data have been fused with imagery, improving the identification of tree species[16−18].
Currently, there are two primary approaches for classifying tree species using fused imagery and LiDAR data: ML and deep learning (DL)-based. Traditional ML techniques require rigorous feature selection and various classifiers (i.e., K-nearest neighbors[19], support vector machines[20], and random forest[21]), most of which have yielded significant results. For example, Marrs et al.[19] successfully identified key parameters for differentiating tree species. Roffey et al.[20] achieved more reliable species classification results by integrating high-density LiDAR data with high-resolution Geoeye-1 imagery. Shi et al.[21] demonstrated substantial improvements in classification accuracy by combining features from both imagery and LiDAR data, compared with using LiDAR data alone. Although these methods have produced notable classification results, their accuracy and efficiency still require further enhancement in the areas of manual feature extraction and selection[10]. In contrast, DL has gained significant attention because of its ability to automatically extract and select features, yielding superior classification results through deep neural networks (DNNs)[22−24]. Most DL-based classification methods have been developed for fused imagery and LiDAR point cloud data. With regard to the data format, these methods can be categorized into two groups. The first group is that of image-based methods, such as PVRNet[25] and ResNet[26], which project 3D point clouds into multiview 2D images and process the 2D images using 2D convolutional neural networks (CNNs). However, this data transformation leads to the loss of subtle vertical structural information and reduces the accuracy of the canopy height model, thereby negatively influencing the performance of these methods on object identification and classification. The second group comprises point cloud-based methods, such as KPConv[27], which directly process irregular, unstructured point clouds, extracting discriminative features from both the spatial geometry and spectral attributes for identification and classification.
In recent years, research on tree species identification via DL-based networks has become a hot topic and has made significant progress. Wang et al.[17] utilized a DL network named Attribute-Aware Cross-Branch, achieving an overall accuracy of 83.1% at the species level. Gahrouei et al.[10] acknowledged the superiority of DenseNet in terms of overall accuracy in predicting the dominant species. Moreover, Hell et al.[28] demonstrated that PointCNN achieved high accuracy in tree species classification using 3D point cloud data, laser intensity, and spectral features. Similarly, Briechle et al.[29] showed that PointNet++ achieved an overall accuracy exceeding 90%, clearly outperforming a traditional ML-based method that utilized a random forest classifier with handcrafted features. Recent forestry-oriented DL methods, including TreeNet and PointTree, have demonstrated promising performance for classifying the species of individual trees. However, these methods generally assume accurately segmented trees and relatively complete canopy structures, making their direct application to canopy-cluster point clouds challenging. Existing DL-based methods for identifying tree species still struggle with sparse canopy point clouds, particularly in urban environments. Urban point clouds tend to be sparse[30], increasing the difficulties of abstracting and representating trees' features. Particularly after filtering that removes ground and on-ground points, and even data pre-processing that further removes most human-made building points, the number of tree canopy points decreases further, resulting in incomplete morphological and spectral feature representation. This sparsity severely hampers the performance of classification models in classifying tree species. In brief, the sparsity of point cloud data inherently hinders the extraction and representation of discriminative features. Moreover, preprocessing steps (e.g., ground filtering and the removal of human-made structures) exacerbate this issue by depleting the available canopy points, generating incomplete morphological and spectral information. Consequently, the resulting deficient feature representation significantly undermines the performance and robustness of classification models in accurately distinguishing tree species.
Thus, we propose TSC-Net, a DL network designed for tree species classification from sparse canopy point clouds. TSC-Net consists of two complementary modules: A vertical hierarchy module (VHM) to explicitly capture vertically layered structural patterns within 3D canopy points, and a multiscale canopy module (MCM) to extract morphological features across multiple spatial scales, enabling the recognition of canopies with varying sizes and shapes. To effectively integrate these heterogeneous representations, we further introduce a dedicated weighting network that analyzes the features produced by the VHM and MCM and dynamically predicts pointwise fusion weights. This adaptive fusion mechanism allows the model to simultaneously encode multiscale vertical structures and hierarchical relationships from local to global, thereby strengthening canopy representation for fine-grained tree species discrimination. The main contributions of this study are summarized as follows.
1. We propose a LiDAR-based tree species classification framework, termed TSC-Net. TSC-Net performs pointwise prediction to learn species-discriminative features and subsequently obtains canopy-level labels through majority voting. Extensive experiments on both a self-collected urban dataset and a public benchmark demonstrate its improved effectiveness under sparse canopy conditions.
2. We propose the VHM and MCM to capture vertical hierarchical structures and multiscale canopy morphology, respectively, and further adopt a pointwise weighting network for adaptive feature fusion, improving tree species classification in the context of sparse canopy point clouds.
-
As shown in Fig. 1, the survey area was located on the campus of Nanjing University of Information Science and Technology (NUIST), Nanjing, Jiangsu Province, China (32°12' N, 118°43' E), covering approximately 1.333 km2. The surveyed area has a typical subtropical monsoon climate with hot, rainy summers and cold, dry winters, with an annual mean temperature of 16 °C and annual precipitation of 1,178–1,256 mm. Situated in a transition zone from low hills to alluvial plains, the terrain is generally flat, with an average elevation of about 30 m. This area exhibits high vegetation coverage and diverse tree species, which is suitable for evaluating the proposed method of tree species classification. The map approval number for Fig. 1 is GS (2026) 2277.
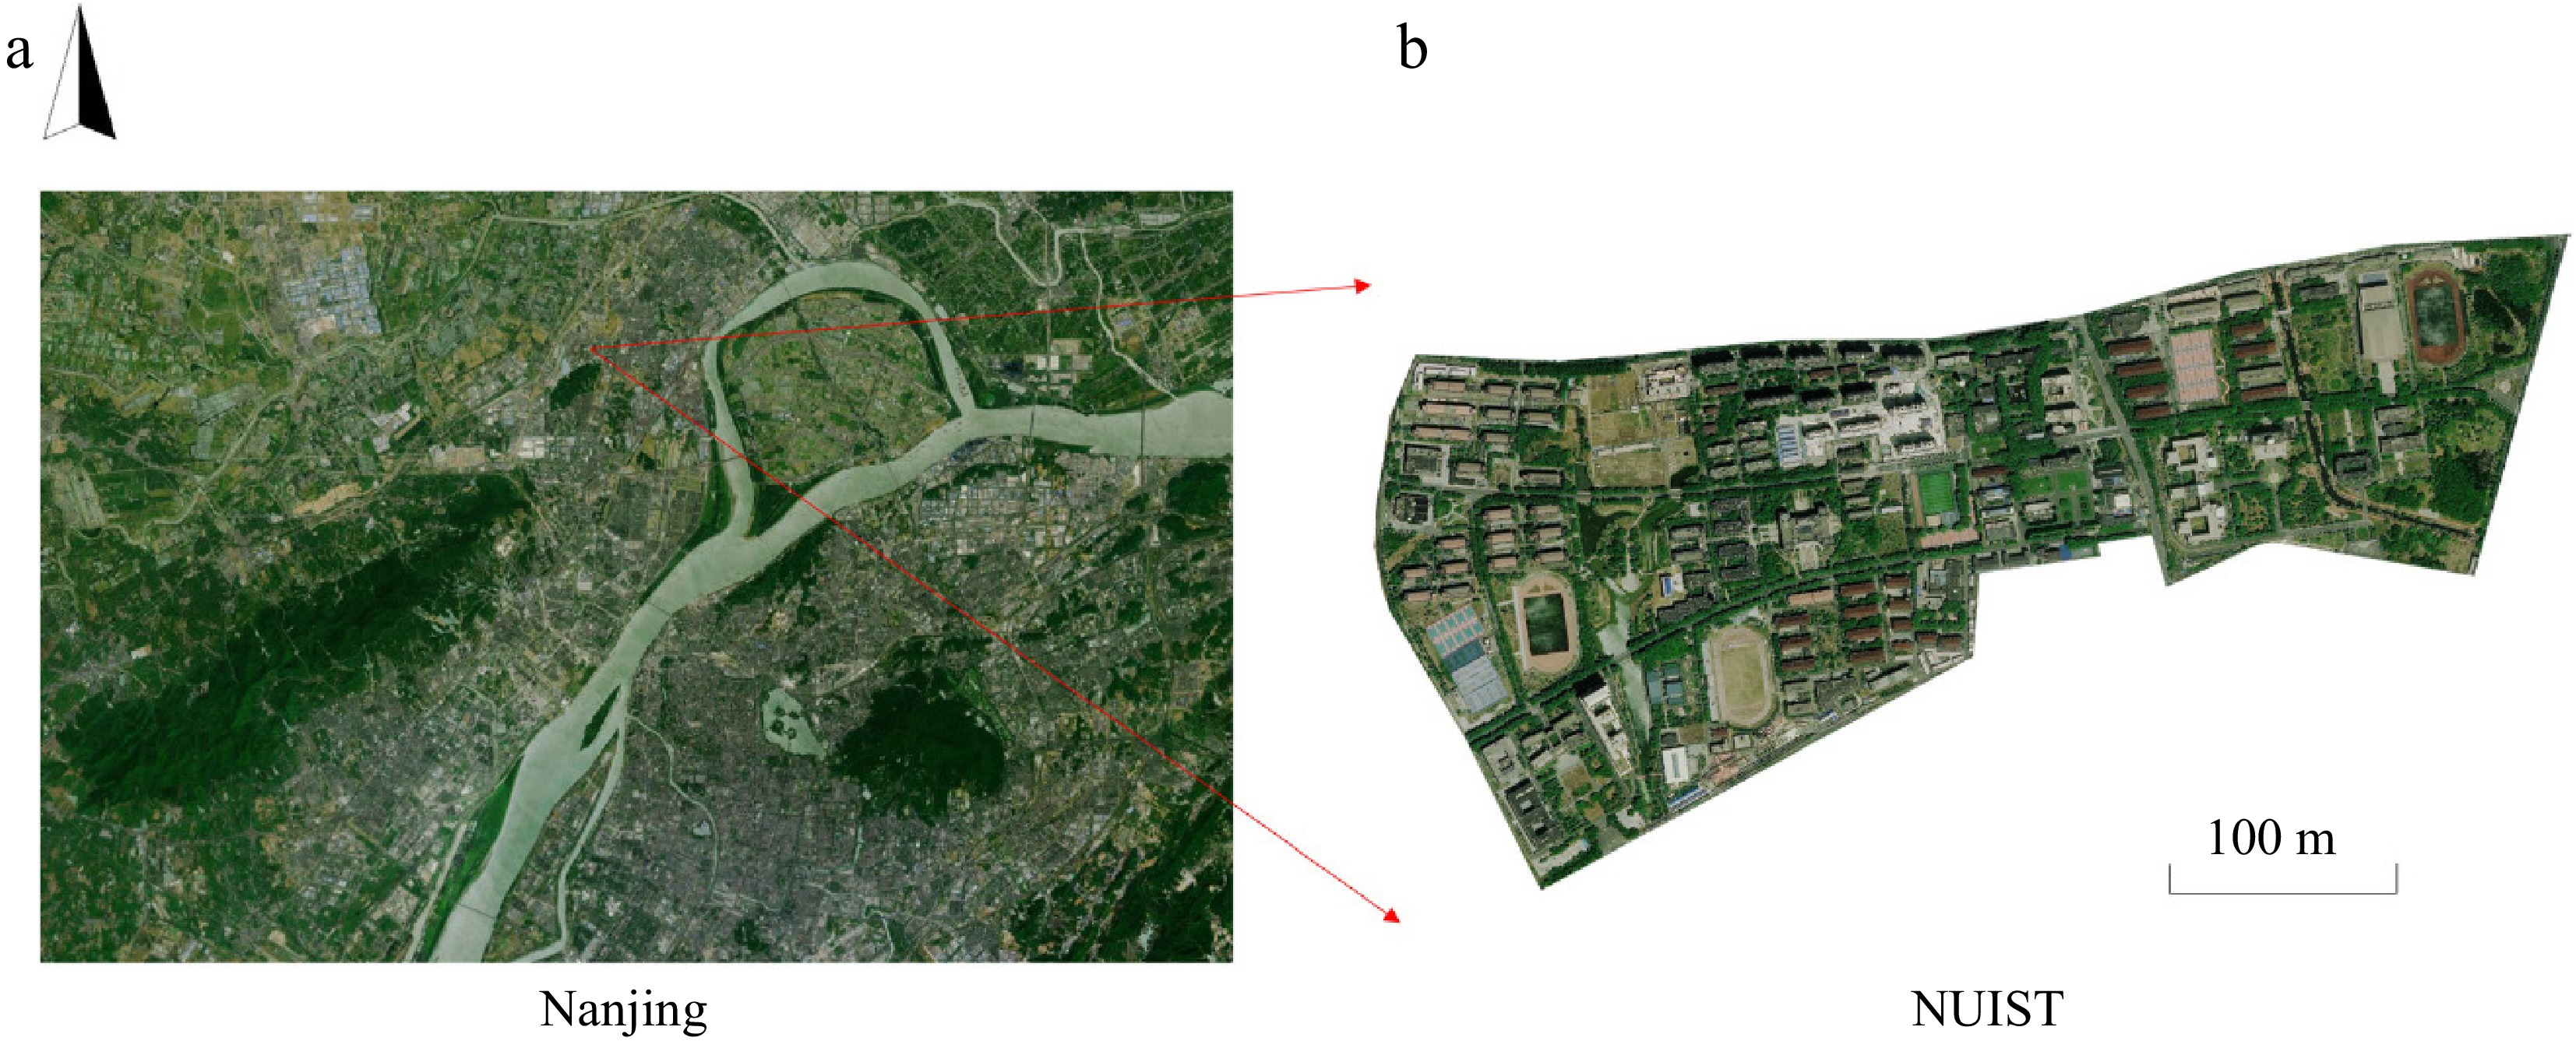
Figure 1.
Area of the NUIST dataset used in this study, located in Nanjing.
Data acquisition
-
LiDAR data and optical images were collected on June 10, 2022, by a Zenmuse L1 LiDAR sensor and a Sentera 6× multispectral sensor, respectively, mounted on a DJI Matrice 300 drone. The Zenmuse L1 LiDAR system was configured with a triple-return mode and a pulse repetition frequency (PRF) of 160 kHz, which collected point clouds with a flight altitude of 90 m, a side overlap rate of 30%, and a scanning duration of approximately 90 minutes. The average point cloud density was approximately 131 points per m2. The Sentera 6× optical sensor had a focal length of 8 mm and six bands [i.e., blue (475 nm), green (560 nm), red (668 nm), red edge (717 nm), near-infrared (840 nm), and full-color RGB], which collected images with a flight altitude of 150 m, as well as side and forward overlap rates of 80% and 70%, respectively. The collected image size was 1,904 × 1,429 pixels, with a ground sample distance (GSD) of 8.63 cm.
Data preprocessing
-
In order to generate the inputs required by TSC-Net, we sequentially performed the preprocessing work of data fusion, canopy extraction, and data annotation for the newly constructed NUIST dataset. First, we fused three bands (i.e., blue, green, and red) of the multispectral images and LiDAR point clouds into one set of point clouds via a multimodal data fusion method. Then we extracted the canopy point clouds of the 19 categories using RandLA-Net[31]. Finally, after labeling the canopy point clouds' data with tree species categories, the NUIST dataset was split into training and testing sets at the ratio of 8:2. In this study, the term "sparse canopy point cloud" does not refer to the original LiDAR acquisition density. Instead, it describes the canopy point clouds remaining after ground removal, filtering buildings, and canopy extraction, where a substantial proportion of points has been discarded and the canopy structures have become incomplete. Consequently, the available geometric and spectral information for classifying tree species is considerably reduced compared with the original fused point cloud, constituting the sparse canopy conditions investigated in this work.
Data fusion
-
To fuse the acquired LiDAR data and images, this study used a straight-line-primitive-based shape similarity multimodal fusion algorithm[32], generating high-precision 3D point clouds with spectral attributes. Before the classification of tree species, noise, such as low-rise, high-rise, and isolated points, were removed from the fused data. This preprocessing step is closely related to point cloud filtering methods used in forests[33,34], which are commonly adopted to improve canopy integrity and suppress terrain-induced interference before downstream segmentation and classification tasks.
Canopy extraction
-
This study used RandLA-Net for semantic segmentation, which extracts canopy points from the fused point clouds with RGB spectral attributes. RandLA-Net is well known for its ability to process large-scale point clouds efficiently via random sampling and to maintain accuracy through the local feature aggregation (LFA) module, achieving fast and accurate tree extraction from the fused data. The processing pipeline of RandLA-Net is as follows. RandLA-Net first preprocesses the point clouds by applying grid-based downsampling, which reduces the number of points while preserving the geometric structure of objects. During random sampling, the point clouds are divided into multiple subpoint clouds with an equal number of points, and a probability value is assigned to each point in every subpoint cloud. The minimum probability is taken as the probability of the corresponding subpoint cloud, and the subpoint cloud with the smallest probability is fed into the network. By updating the subpoint cloud probabilities, RandLA-Net ensures that all sub-point clouds are processed by the network, eventually extracting canopy point clouds with 94.58% accuracy.
Data annotation
-
After extracting the canopy point clouds, we manually annotated the tree species samples for the training and testing datasets according to field surveys. Notably, we annotated entire canopy clusters, rather than fine-grained individual trees, as the training samples. In our study, each annotated canopy cluster represents an individual tree, and all points within the same cluster are assigned an identical species label. Although many existing studies perform the task of tree species classification on accurately segmented individual trees, such strategies are often difficult to apply in urban environments with severe crown overlap, occlusion, and sparse canopy sampling. This method was selected in light of the inherent difficulty in accurately separating individual trees within point cloud data, a challenge that is particularly pronounced in areas with closely spaced or overlapping tree crowns. Therefore, instead of relying on precise individual tree segmentation, this study annotates canopy point clouds to preserve a more complete canopy morphology and improve robustness under sparse urban point cloud conditions. Given the clustered and often partially obscured growth patterns of urban trees, per-tree annotation could result in a loss of crucial structural information about the canopy as a whole. Our method, by annotating the canopy, captures the overall structure of the tree canopy, thus ensuring an enhanced and more realistic representation of urban green spaces. By adopting this approach, the model can thus effectively address the challenges posed by occlusion and limited resolution, which typically and severely hinder the segmentation of individual trees.
After data verification, investigation, and spatial positioning, a highly reliable tree species dataset, named the NUIST dataset, was constructed. The entire study area was evenly divided into 10 nonoverlapping spatial blocks, where each canopy cluster was treated as an independent sample. Eight blocks were used exclusively for training and the remaining two blocks for testing. The training set consisted of spatially distributed point cloud blocks containing multiple canopy clusters, whereas the testing set consisted of individual canopy clusters corresponding to single trees for canopy-level species classification. All canopy clusters were assigned according to their spatial locations, ensuring that no canopy cluster appeared simultaneously in both subsets. This effectively prevents data leakage. There are 19 tree species/genera in this surveyed area, including Phoenix spp. (phoenix palm), camphor (Camphora officinarum), Koelreuteria spp. (Chinese lantern tree), privet (Ligustrum spp.), Magnolia spp., Metasequoia spp. (dawn redwood), Sapindus spp., Osmanthus spp., cypress (Cupressus spp.), Albizia (silk tree), poplar (Populus spp.), elm (Ulmus spp.), willow (Salix spp.), Ginkgo spp., cedar (Cedrus spp.), Elaeocarpus spp., purple leaf plum (purple, Prunus spp.), loquat (Eriobotrya japonica), and cherry (Prunus spp.), as shown in Fig. 2, which also shows the proportion of training samples for each tree species. We found that some tree species, such as phoenix palm and camphor, have large numbers of points, whereas some tree species, like cherry, have relatively few points.
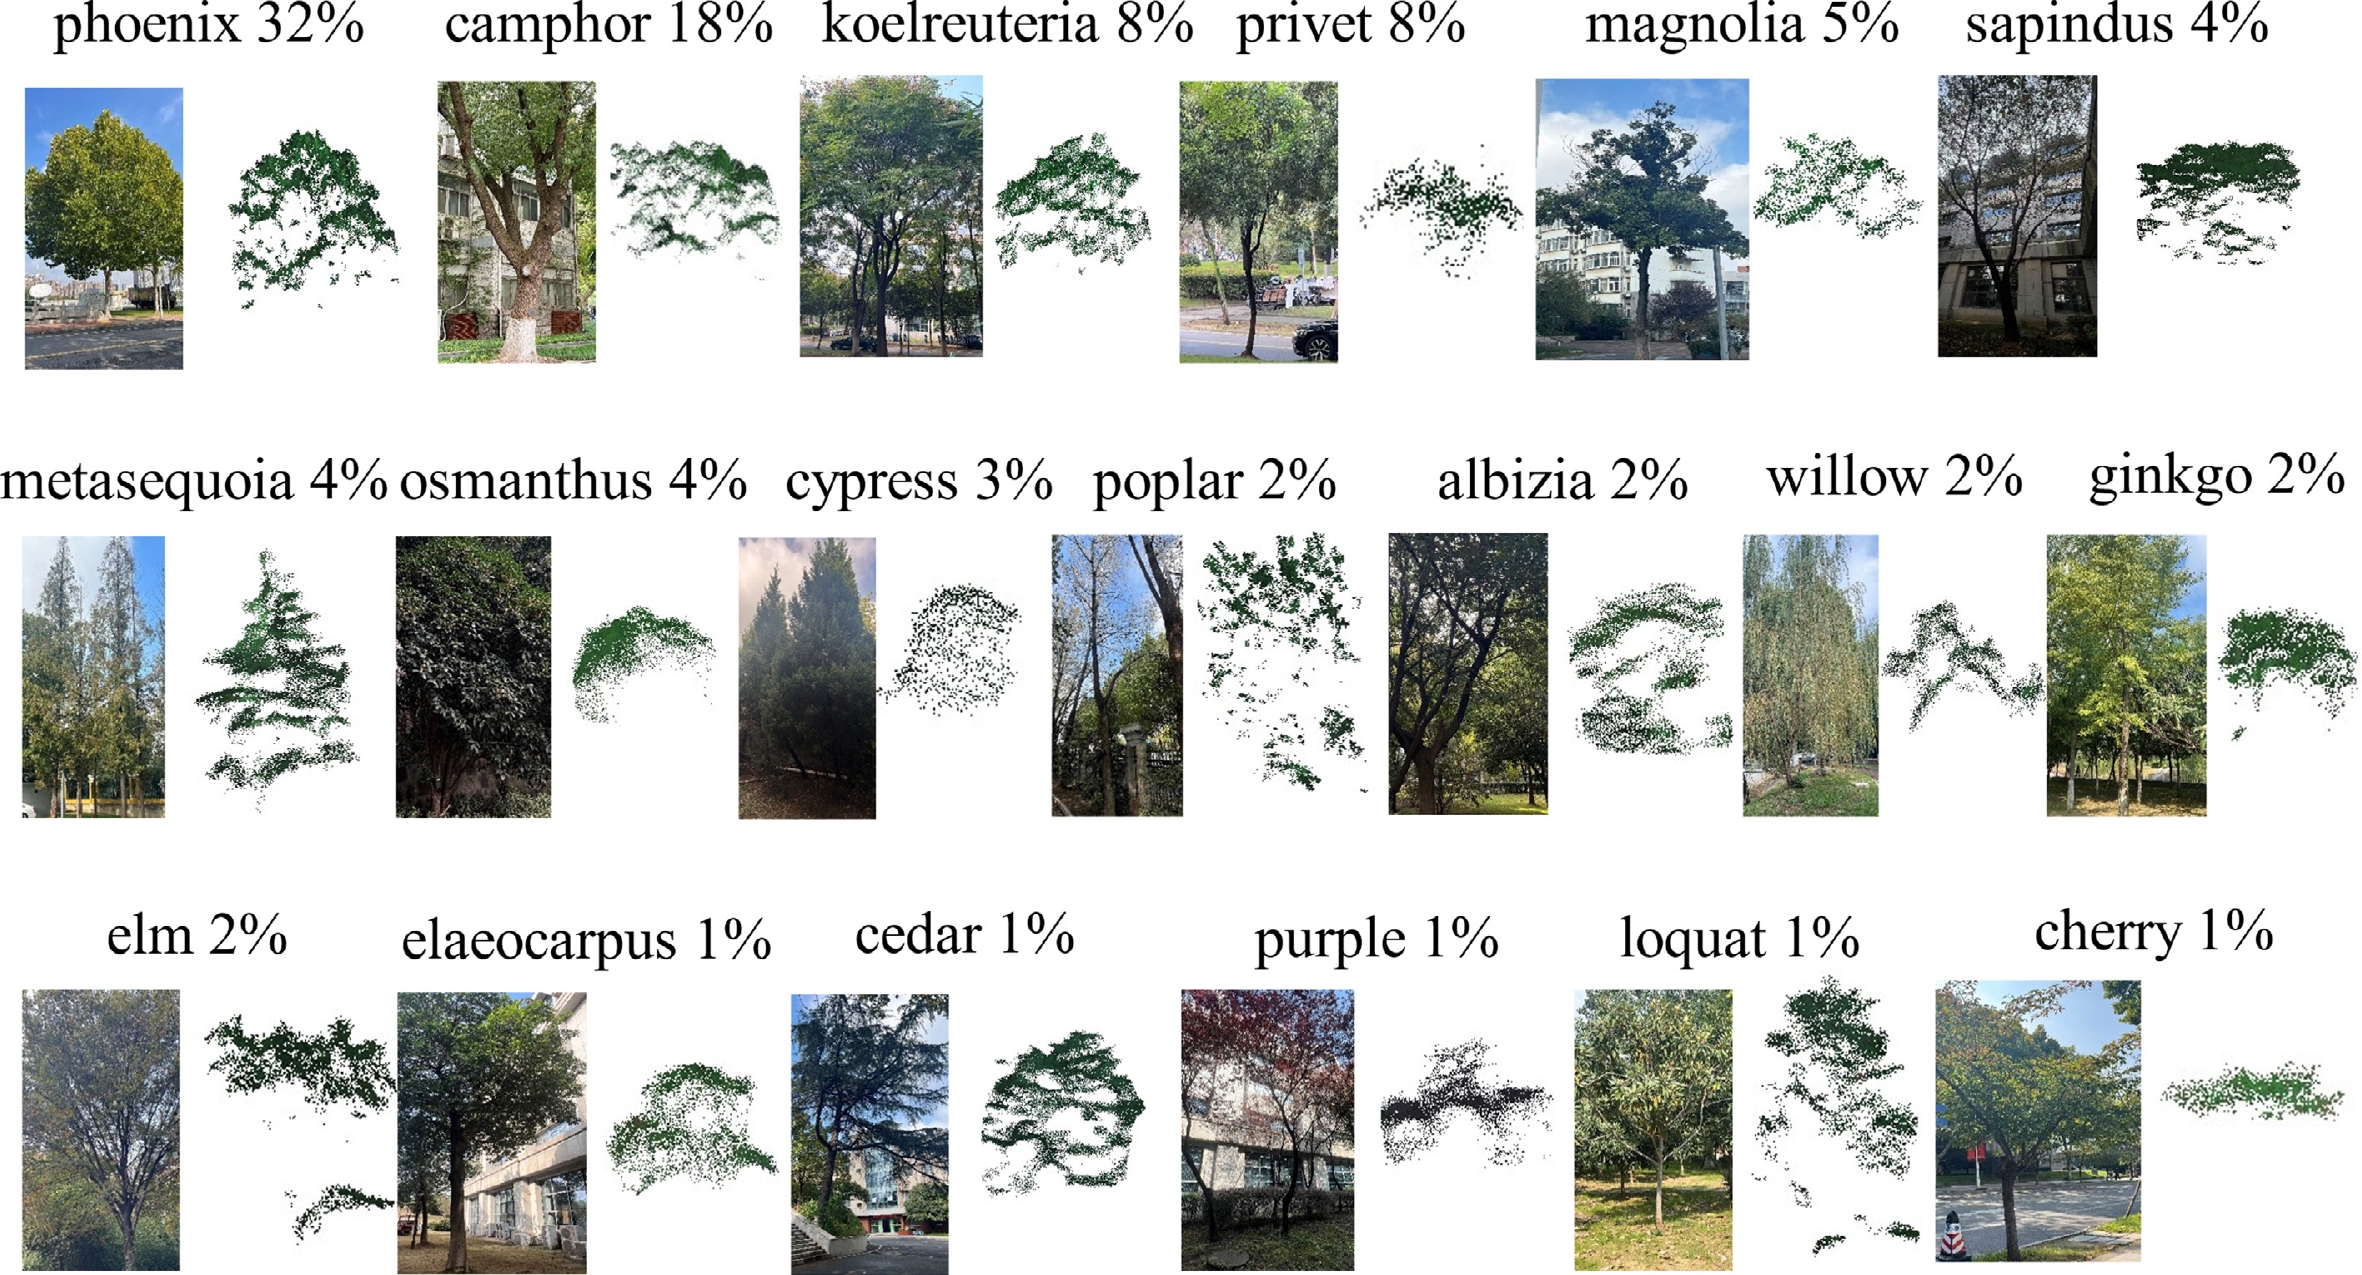
Figure 2.
Representative examples and proportion of training samples of each tree species class.
Framework of TSC-Net
-
Current DL-based methods typically rely on dense canopy point clouds to achieve a complete representation of trees' morphological and spectral characteristics. In urban environments, however, point clouds are often sparse and unevenly distributed, making it difficult to abstract and encode discriminative canopy features. This sparsity can substantially impair the performance of tree species classification models. To address this limitation, we propose TSC-Net, a sparse canopy tree species classification network designed for urban greening scenarios.
TSC-Net is a point-level tree species classification network. Specifically, given an input point cloud, the proposed framework learns discriminative geometric and spectral representations, generating a species prediction for each individual point. Subsequently, we obtain canopy-level species labels through majority voting.
As shown in Fig. 3, TSC-Net performs end-to-end classification on point clouds with RGB spectral attributes. The data are first voxelized and fed into a sparse-convolution backbone to extract pointwise features. The input features of TSC-Net consist of XYZ coordinates and RGB spectral attributes. The features are then processed in parallel by the VHM and MCM to encode vertical structural and multiscale morphological information, and are adaptively fused by a lightweight weighting module. The fused features are integrated with the backbone features through a residual connection to form enhanced representations. The fused features are processed by two fully connected (FC) layer modules and a Softmax-based classifier to output, for each point, the probability of belonging to each category, achieving pointwise tree species classification. During inference, each canopy cluster is treated as an individual tree instance. Finally, the canopy-level species labels are obtained through majority voting.
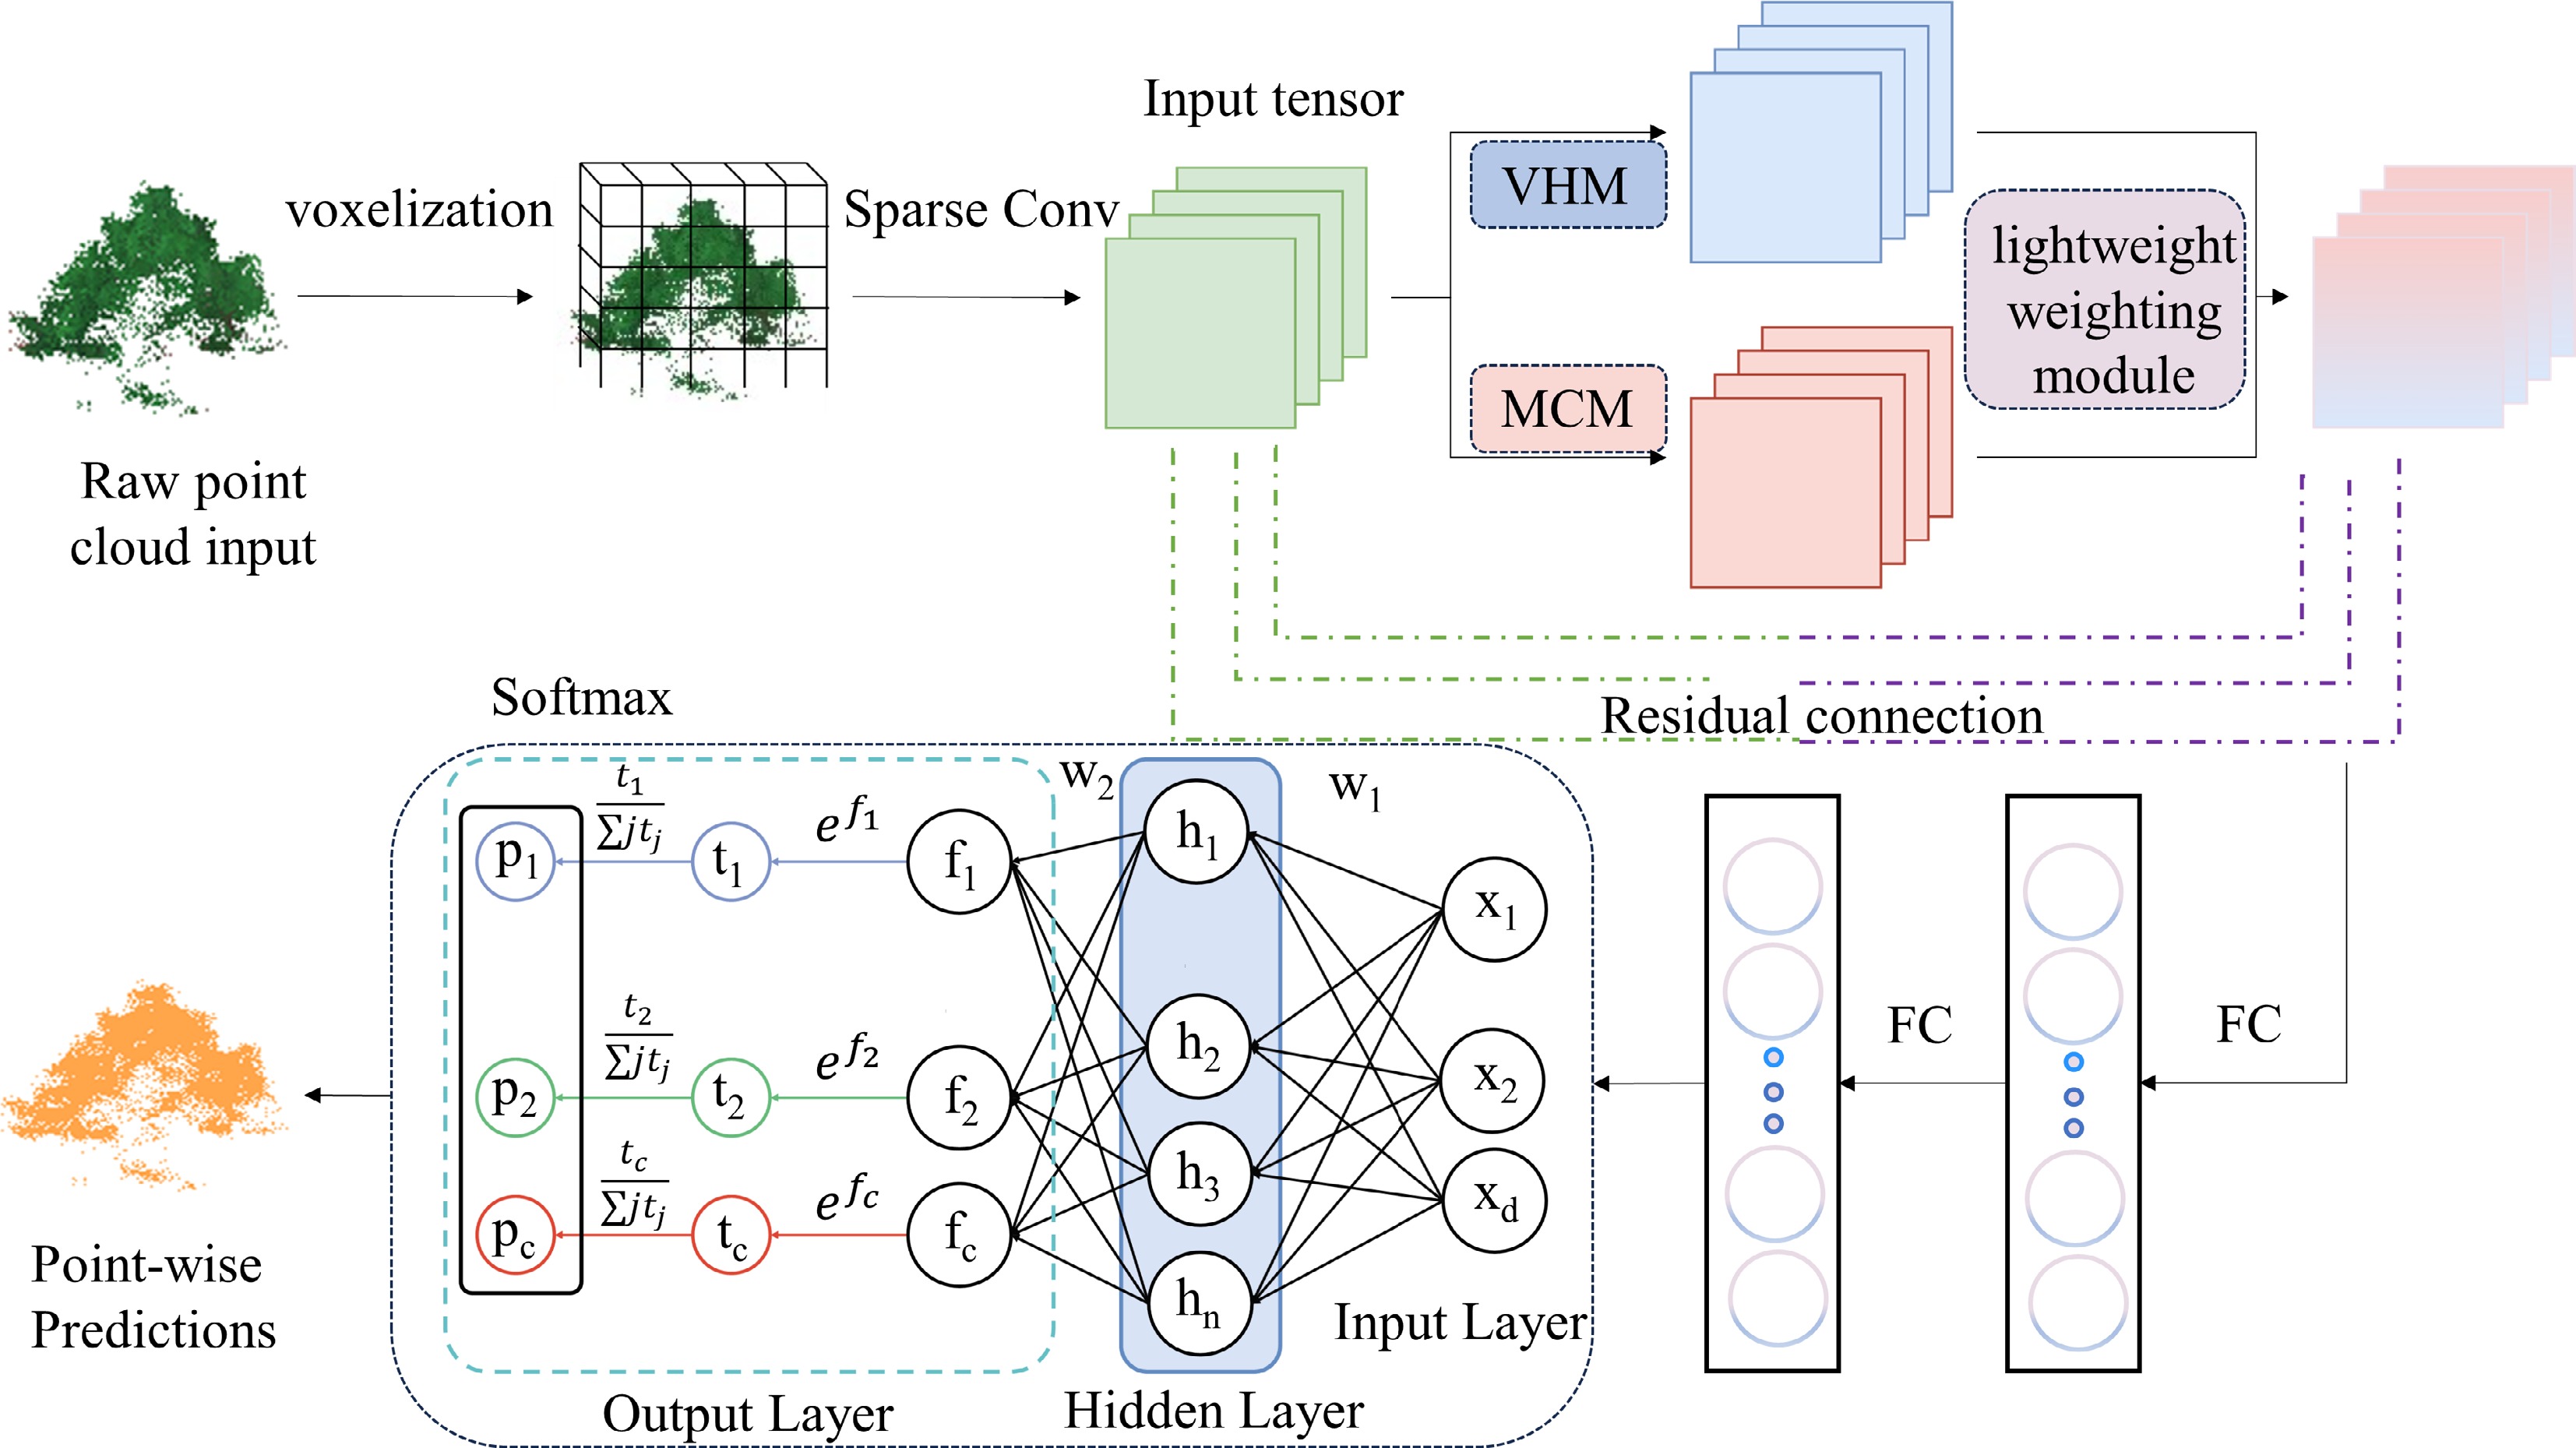
Figure 3.
The TSC-Net framework for classifying tree species.
Specifically, each input point cloud is subjected to a series of mandatory normalization procedures to ensure stable training and consistent feature representation within the framework. The spatial coordinates (XYZ) are normalized by centering each scene at its geometric centroid. The mean coordinate of all points within a scene is subtracted from each point, thereby eliminating variations in global translation and improving spatial consistency across samples. Then RGB color attributes are normalized to ensure numerical stability during feature learning. In particular, the raw intensity values are rescaled to the range [0, 1] by dividing by 255. The normalized point cloud is voxelized using a fixed voxel size to enable sparse convolution-based feature extraction. This discretization step converts continuous coordinates into integer voxel indices while preserving the local geometric structure, thereby facilitating efficient hierarchical feature learning. A sparse convolution backbone is then applied to extract the points' features. The backbone has seven sparse convolution blocks with a base feature dimension of 16 channels. To emphasize canopy features that are most informative for species classification, the backbone features are fed into the VHM and the MCM in parallel to further encode crown-related information.
Next, a lightweight weighting module analyzes the two feature streams and predicts pointwise fusion weights to adaptively combine them. The feature representations generated by the two modules are concatenated and passed through the lightweight two-layer multilayer perceptron (MLP) consisting of a 32–8–2 architecture. A Softmax activation function is applied to generate normalized fusion weights. The final fused representation is obtained through weighted aggregation of the VHM and MCM features, followed by a residual connection with the original backbone features and a 1 × 1 sparse convolution for feature refinement. Specifically, VHM is assigned higher weights in regions dominated by vertical structures (e.g., the tops of tall trees and complex multilayer canopies), whereas MCM is emphasized in areas characterized by pronounced scale variation (e.g., canopy edge transition zones and boundaries between adjacent species). In relatively homogeneous canopy interiors, the two modules receive comparable weights. This adaptive fusion enables the network to automatically adjust the relative contributions of vertical structural features and multiscale morphological features according to the local scene's complexity. Moreover, the fused features are integrated with the original backbone features via a residual connection, preserving critical information pathways and mitigating potential interference between feature streams.
The enhanced features are then fed into two FC layers, each consisting of a 32-dimensional FC layer, a batch normalization layer, and a Rectified Linear Unit (ReLU) activation function, to strengthen the nonlinear representation capability of the network. The resulting feature matrix is then passed to a Softmax-based classifier to output pointwise tree species predictions with a dimension of N × 19, where N denotes the number of input points and 19 is the number of tree species categories considered in the study area. The Softmax-based classifier enhances feature learning and model calibration through the joint application of label smoothing and stochastic regularization. Each canopy point corresponds to a 19-dimensional probability vector, and the category with the maximum probability is taken as the predicted tree species for that point. These pointwise predictions provide fine-grained information, from which the species label of each canopy cluster is subsequently obtained through majority voting.
Pointwise metrics (intersection over union [IoU] and mean IoU [mIoU]) are used to evaluate the capability of the network in learning species-discriminative representations at the point level. Higher pointwise prediction accuracy indicates that the network can better distinguish species-specific geometric and spectral characteristics at the point level, which consequently contributes to more reliable canopy-level tree species classification after majority voting.
The VHM
-
The VHM is designed to explicitly model vertical structural characteristics in 3D point clouds by incorporating height information, thereby strengthening the learning of vertical features and improving the representation of the canopy profile morphology, as shown in Fig. 4. Specifically, the module encodes height information by extracting the Z-coordinate of each voxel and mapping it into a learnable feature embedding, enabling the network to recognize each point's vertical position in 3D space. The VHM then performs dedicated processing along the Z-axis to enhance the extraction of height-dependent structural features.
Specifically, the input is a sparse convolution tensor x with 16-channel features and N active voxels, where N denotes the number of voxels that are occupied, contain valid features, and are indexed in the sparse tensor. For each voxel, its normalized height value (N × 1) is first processed by a two-layer MLP (1–32–16) to obtain a 16-dimensional height embedding, which is concatenated with the original features to form a 32-dimensional vector. This concatenated tensor then undergoes BatchNorm, ReLU, and a 3 × 3 × 3 submanifold convolution (32–16) that preserves the spatial resolution and voxel count, extracting initial vertical structure cues. A second sequence of BatchNorm, ReLU, and another 3 × 3 × 3 subconvolution (16–16) further strengthens the Z-direction correlations. The output remains a sparse tensor with N active voxels and 16 feature channels, which are directly compatible for fusion with the parallel MCM. Throughout the process, the channel dimension follows an "expand–compress" strategy to inject height information and refine the vertical features while maintaining full spatial fidelity.
With stacked multilayer convolutions, the VHM captures interactions across height levels and effectively differentiates vertical tiers, such as near-ground, midlayer, and upper layer regions. This design is particularly beneficial for canopy profile analysis, as it helps delineate height-dependent canopy components, thereby improving sensitivity to vertical morphological variations that are informative for species discrimination.
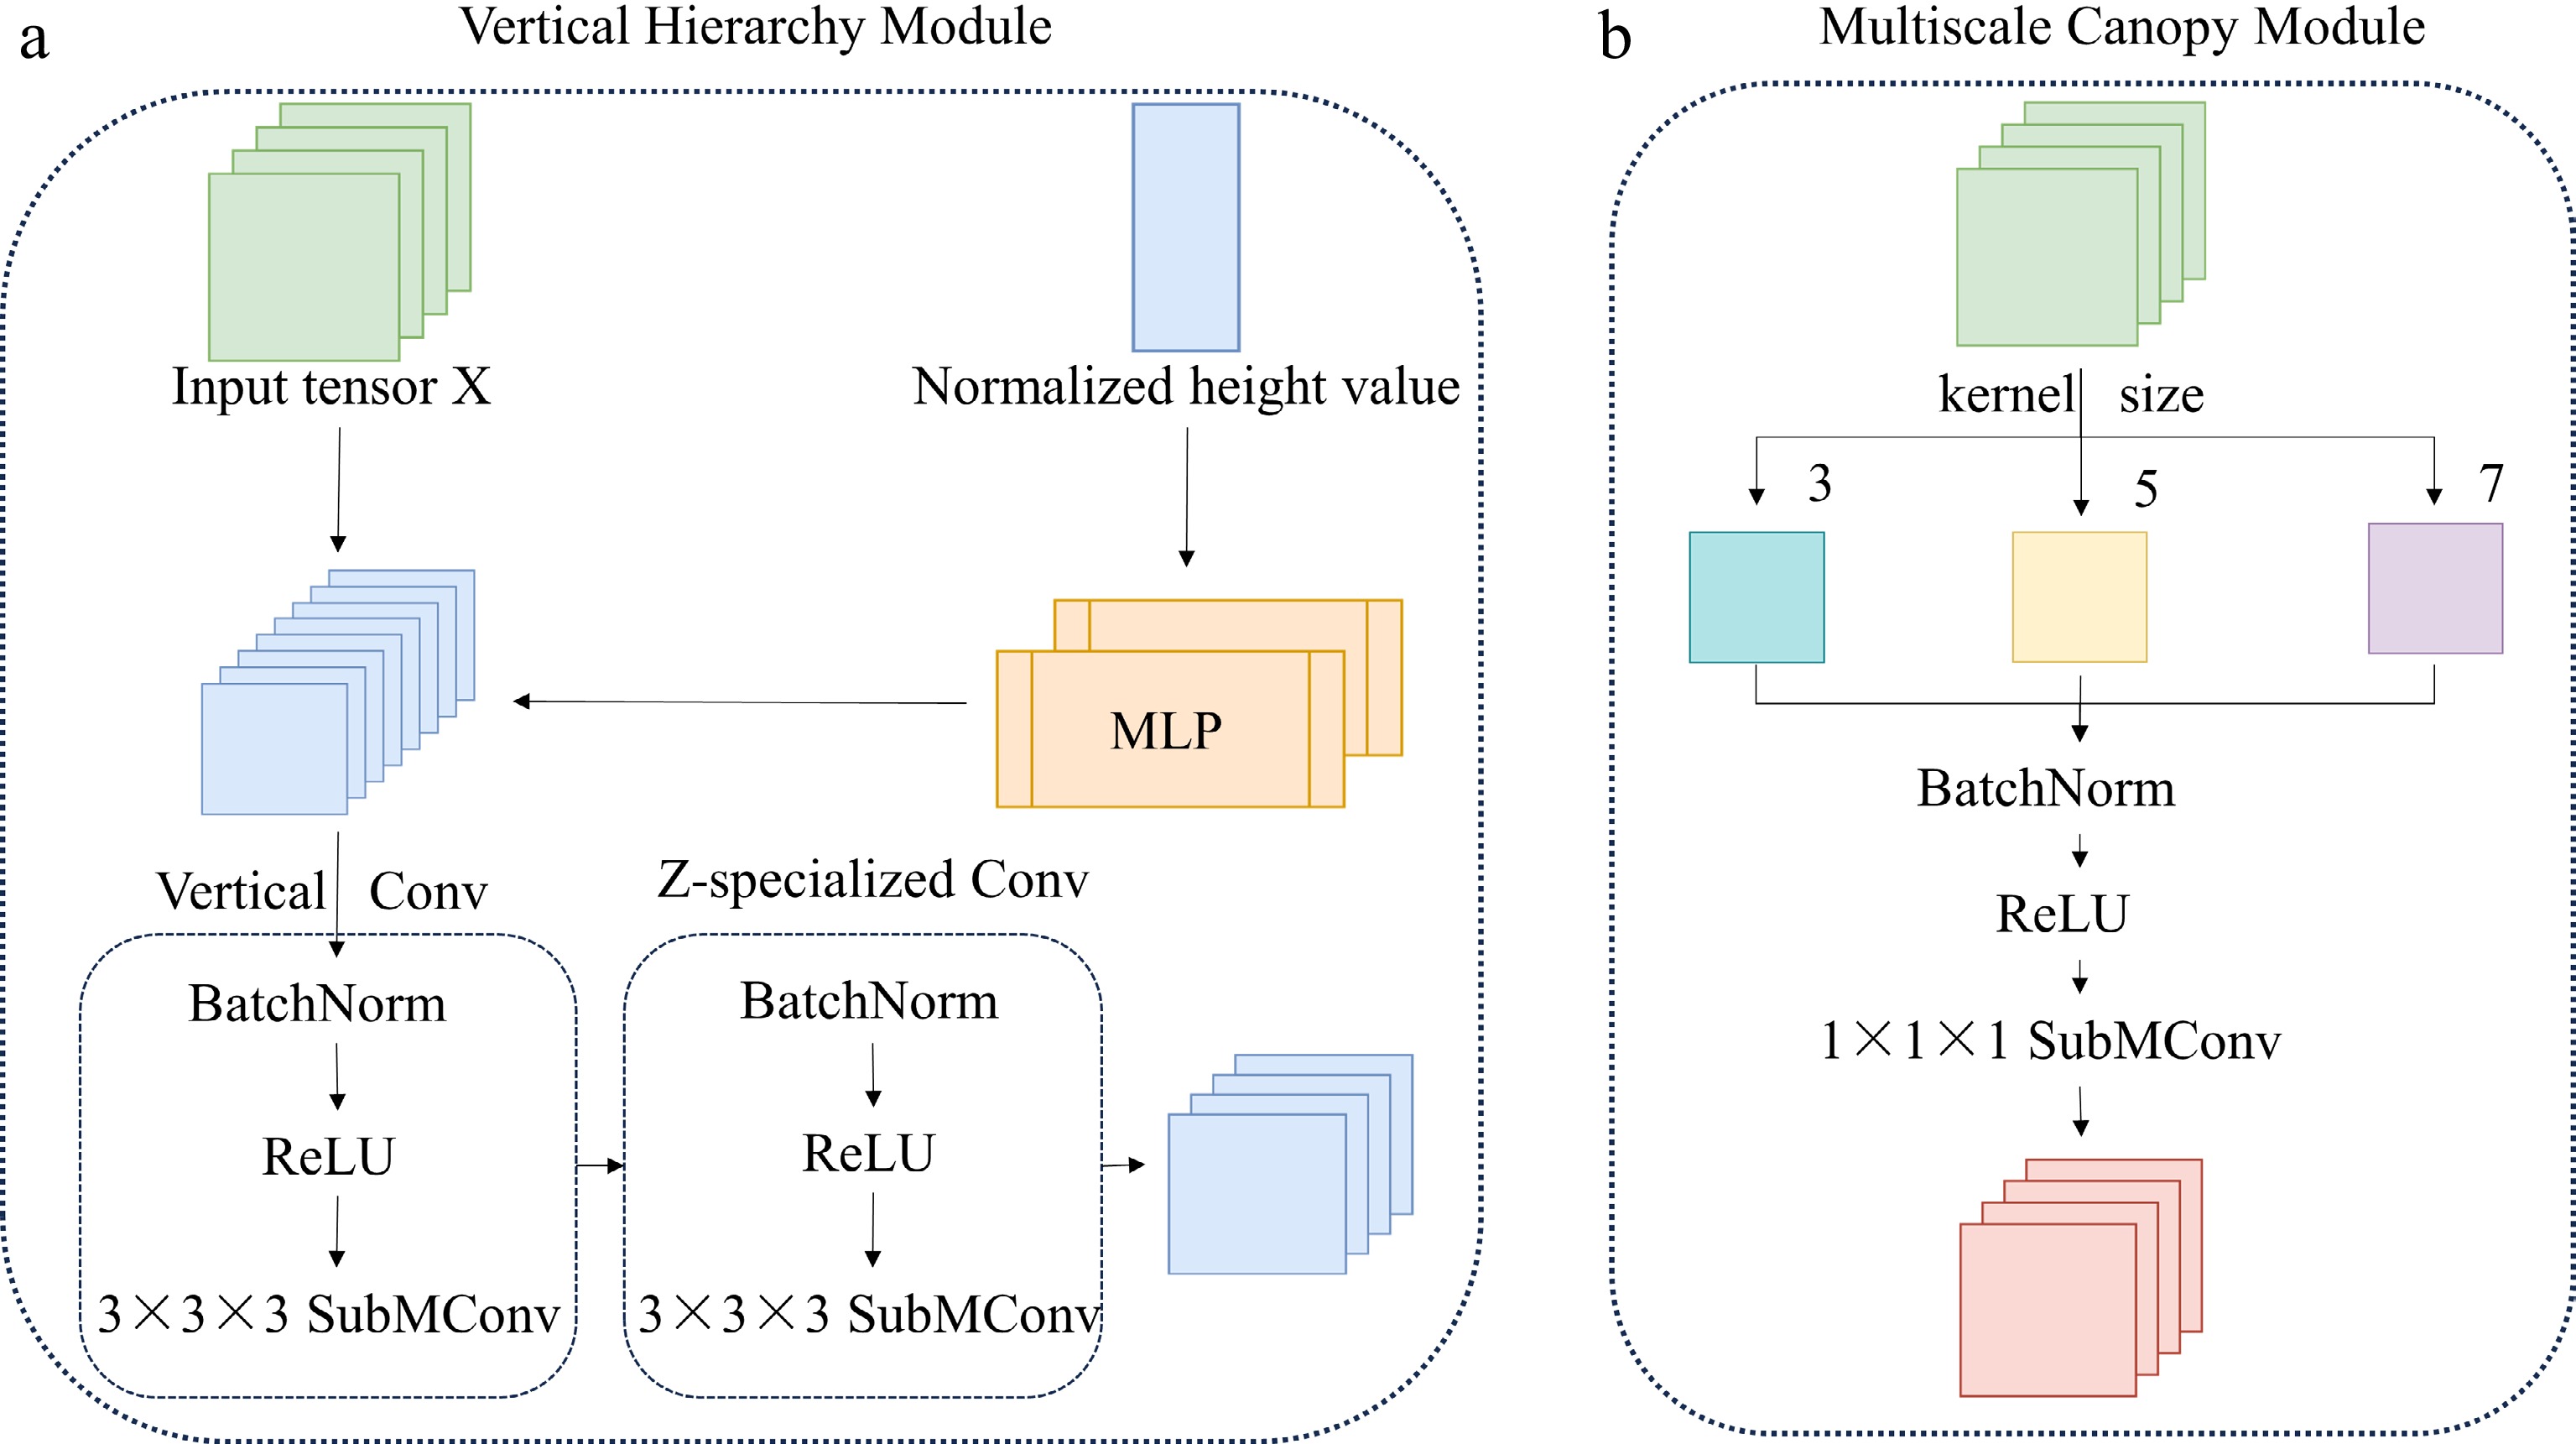
Figure 4.
Workflow of the two modules: (a) VHM; (b) MCM.
The MCM
-
The MCM is designed to capture the canopy's morphology across multiple spatial scales, thereby improving the recognition of tree crowns with varying sizes and structural complexity, as shown in Fig. 4. To this end, the MCM extracts features in parallel using three convolutional branches corresponding to small, medium, and large receptive fields. Specifically, the small-scale branch (kernel size = 3) focuses on fine-grained local details, the medium-scale branch (kernel size = 5) captures meso-level structural patterns, and the large-scale branch (kernel size = 7) emphasizes global morphological information.
After multiscale feature extraction, the outputs from the three branches are concatenated along the channel dimension to form a unified representation. A subsequent 1 × 1 convolution is applied to efficiently integrate and reweight the concatenated features, yielding a compact yet expressive embedding that spans the local-to-global context. By jointly modeling different canopy scales within a single module, the MCM reduces sensitivity to variations in crown size in complex urban scenes. Moreover, the parallel design maintains computational efficiency while preserving both detailed and contextual cues, resulting in richer and more discriminative morphological representations for downstream classification.
Regularized Softmax classification
-
To enhance the generalization capability of the Softmax classifier, we incorporate two regularization strategies, namely label smoothing and stochastic regularization, into the training process.
In standard Softmax classification, ground truth labels are typically encoded as one-hot vectors, which may lead to overconfident predictions and poor generalization. Particularly, this issue is problematic when dealing with noisy or incomplete data, such as sparse canopy point clouds. To address this issue, label smoothing is applied by replacing the hard one-hot targets with softened label distributions, thereby encouraging the model to learn with less overconfidence. Specifically, the ground truth label y is transformed into a smoothed target yc, where a small probability mass is redistributed uniformly across all classes, thereby reducing the peakiness of the target distribution. The smoothed target distribution is shown in Equation (1), where C is the total number of classes, and ε
$\in $ $ {y}_{C}=\left(1-\varepsilon \right)y+\dfrac{\varepsilon }{C} $ (1) In addition, stochastic regularization is applied in the form of dropout within the feature extraction layers preceding the Softmax-based classifier. Dropout is applied before the final fully connected layers with a dropout rate of 0.3 to reduce feature co-adaptation and improve generalization under sparse point cloud conditions. By randomly deactivating a subset of neurons with a predefined probability during training, this technique prevents feature co-adaptation, thereby improving the model's generalization ability, especially under conditions of data sparsity. This is especially critical in 3D point cloud processing, where input features are inherently incomplete and uneven. Although dropout is applied during training to prevent overfitting to such incomplete data, it is disabled during inference to allow deterministic predictions with the full network.
In summary, both label smoothing and stochastic regularization operate as training-time enhancements designed to improve feature learning and model calibration, while maintaining consistent prediction behavior during inference.
Loss function
-
This paper introduces a class weighting strategy in the loss function to construct a weighted cross-entropy loss. WCi denotes the weight for each class, NCi denotes the number of points per class, C denotes the total number of classes, and N denotes the total number of points. The initial weight is calculated by dividing N by NCi for each class. The class weight formula is shown in Equation (2):
$ {W}_{Ci}=\dfrac{N}{{N}_{Ci}} $ (2) A larger weight indicates lower class frequency in the training set, assigning higher importance during training. The final loss function uses weighted cross-entropy (Equation (3)), with the class weights directly passed as the weight vector. In Equation (3), log(pi,Ci) denotes the probability that point i is predicted as the true class, and WCi denotes the weight of the corresponding class of point i.
$ {L}_{WCE}=-\dfrac{1}{N}\sum\limits_{i=1}^{N}{W}_{Ci}\cdot \log \left({p}_{i},{C}_{i}\right) $ (3) -
Experiments were conducted on a server equipped with 20 Virtual Central Processing Units (vCPUs, Intel(R) Xeon(R) Platinum 8470Q processors), 90 GB of memory, and a 48 GB Virtual Graphics Processing Unit (vGPU). Training was performed using Python 3.7 and PyTorch 1.13. The entire region was evenly divided into 10 blocks, with 2 blocks used for testing and 8 blocks for training. No additional random resampling was performed after the spatial split. For TSC-Net, the batch size was 4, the number of input points per iteration ranged from 5,000 to 25,000, and the model was trained for 80 epochs. The Adam optimizer was used, with an initial learning rate of 0.004, which was kept constant for the first 20 epochs. Thereafter, it was decreased according to a cosine annealing schedule, with a minimum learning rate of 1e–6. Specifically, for epochs beyond 20, the learning rate was updated as lr = lrmin + 0.5 × (lr0 − lrmin) × [1 + cos (Π (epoch−20) / (80−20))], where lr0 = 0.004, lrmin = 1e−6, and the total number of training epochs was 80. The voxel grid edge length was empirically set to 1/3 m to balance computational efficiency and to preserve the canopy structure. A smaller voxel size increases the computational cost, whereas a larger voxel size may lead to the loss of fine-grained canopy geometry. The original experiments were conducted without explicitly fixing the random seed, which may have introduced minor stochastic variation. To improve reproducibility, we will release the complete training scripts.
Evaluation metrics
-
This study used mIoU and per-class IoU as the primary performance metrics to evaluate accuracy in point-level classification. Their definitions are provided in Eqs (4) and (5), where TP denotes the number of correctly predicted points for a class, FN represents the number of points whose true class was predicted incorrectly, FP refers to the number of points from incorrect classes that were predicted as the correct class, and k is the number of classes.
$ {IoU}_{i}=\dfrac{{TP}_{i}}{{FN}_{i}+{FP}_{i}+{TP}_{i}} $ (4) $ MIoU=\dfrac{1}{k}\sum\limits_{i=1}^{k}{IoU}_{i} $ (5) Experimental results on the NUIST campus dataset
-
To evaluate the effectiveness of the proposed method for sparse canopy point cloud classification, we compared TSC-Net on the NUIST dataset with several representative 3D point cloud models, namely BAAF-Net[35], PointNext[36], RandLA-Net[31], SCF-Net[37], BAF-LAC[38], and SoftGroup[39], and a traditional ML method, random forest[21] (RF). For a fair comparison, all representative 3D point cloud models were trained and tested using the same training/testing splits, and implemented under identical training conditions, including the same computing platform and hyperparameter settings. The RF classifier used six pointwise features (XYZ and RGB), excluding instance labels, offset features, and handcrafted neighborhood descriptors. It comprised 150 trees with Gini impurity, bootstrap sampling, a maximum depth of 20, a minimum leaf size of 5, square root feature selection, out-of-bag estimation, and a fixed random seed of 42. During inference, the trained RF independently assigned 1 of the 19 classes to each point according to its six-dimensional feature vector. Predictions were performed in batches of up to 200,000 points solely to reduce memory consumption, without affecting the predicted results. IoU and mIoU were adopted to quantitatively assess the feature learning capability of TSC-Net.
The evaluation results are summarized in Table 1, where IoU and mIoU are used to quantify the predictive capability of different models, and bold text highlights the best results for each category. The comparative results demonstrate that TSC-Net achieves superior pointwise prediction performance compared with the baseline methods on the dominant species. For instance, TSC-Net achieves higher IoU values than the compared networks for categories including Magnolia, Osmanthus, willow, Elaeocarpus, Phoenix, poplar, Ginkgo, purple, Metasequoia, cedar, cherry, elm, and privet. When compared with the baseline model, SoftGroup, our network also achieves higher pointwise IoU values in categories such as Osmanthus, Albizia, Elaeocarpus, poplar, Ginkgo, purple, cedar, cherry, elm, and privet. These improvements indicate that the proposed VHM and MCM modules enhance the extraction of discriminative geometric and spectral representations.
Table 1. Comparison of pointwise prediction performance on the NUIST campus dataset.
Tree species class IoU (%) TSC-Net RandLA PointNext SCF-Net BAF-LAC BAAF-Net SPVCNN SoftGroup Random forest mIoU 53.80 26.75 29.63 15.67 21.90 31.35 40.40 38.60 6.50 Magnolia 76.10 26.60 44.71 20.00 65.89 43.92 62.30 66.10 15.10 Osmanthus 67.60 17.13 38.12 3.71 1.77 28.64 71.60 43.60 5.85 Albizia 24.20 28.78 3.90 0.06 15.70 9.56 23.70 0.70 0.56 Willow 45.70 4.46 19.70 5.50 3.39 8.31 14.70 41.40 1.07 Koelreuteria 48.80 29.44 38.21 28.07 27.04 45.59 40.10 64.50 10.61 Loquat 0.60 0.01 4.05 0.00 1.08 0.00 0.00 0.10 0.89 Elaeocarpus 24.40 6.20 8.89 3.41 5.85 0.76 8.80 7.10 1.46 sapindus 11.70 3.01 1.97 0.43 3.72 5.65 40.30 20.70 0.40 Phoenix 87.60 61.61 71.19 70.14 64.40 82.39 47.00 81.50 2.76 Poplar 76.00 68.90 45.27 14.00 14.76 66.53 70.80 6.70 2.10 Ginkgo 90.10 20.70 23.05 1.93 10.13 34.51 67.70 63.60 6.39 Camphor 59.00 39.84 39.53 20.74 27.52 54.11 47.20 64.00 2.98 Purple 78.00 42.45 63.54 56.30 56.00 44.10 76.10 46.90 40.94 metasequoia 89.60 42.32 60.50 25.40 54.00 85.45 92.10 84.90 3.77 Cedar 87.30 49.36 66.75 38.45 48.53 43.98 2.90 67.60 19.63 cherry 34.50 2.40 0.01 0.00 0.00 0.00 35.30 1.20 2.59 elm 62.30 28.76 5.15 0.01 7.00 16.51 42.40 43.00 1.75 privet 53.30 20.71 28.00 9.32 9.00 25.66 24.80 13.00 4.54 Cypress 4.60 1.29 0.53 0.00 0.00 0.00 0.00 16.60 0.12 The number in bold indicates the highest accuracy among all networks. TSC-Net achieves an mIoU of 53.8% on the test set, higher than the compared methods in the current experimental setting. The percentage point (pp) differences in improvement compared with other baseline models are as follows: RandLA-Net (+27.05 pp), PointNext (+24.17 pp), SCF-Net (+38.13 pp), BAF-LAC (+31.90 pp), BAAF-Net (+22.45 pp), SPVCNN (+13.40 pp), SoftGroup (+15.2 pp), and RF (+47.3 pp). Notably, TSC-Net improves the classification performance of several minority classes, including Elaeocarpus, cherry, and cedar. However, certain challenging categories, such as loquat, cypress, and Sapindus, still exhibit relatively low IoU values, indicating that sparse and highly imbalanced canopy point clouds remain difficult for reliable species discrimination. The visualization results in Fig. 5 show that the network performs well on several dominant species with relatively sufficient point observations and distinctive canopy structures, indicating that the VHM and MCM contribute to improved representation of canopy morphology. For visualization purposes, the first column in Fig. 5 displays an RGB point cloud rendering. These colors originate from the RGB attributes of the point cloud and are independent of the species-label color mapping shown in the color bar. Moreover, the color bar only displays the tree species included in the visualization results in Fig. 5, and each color block in the color bar corresponds to the tree species below.
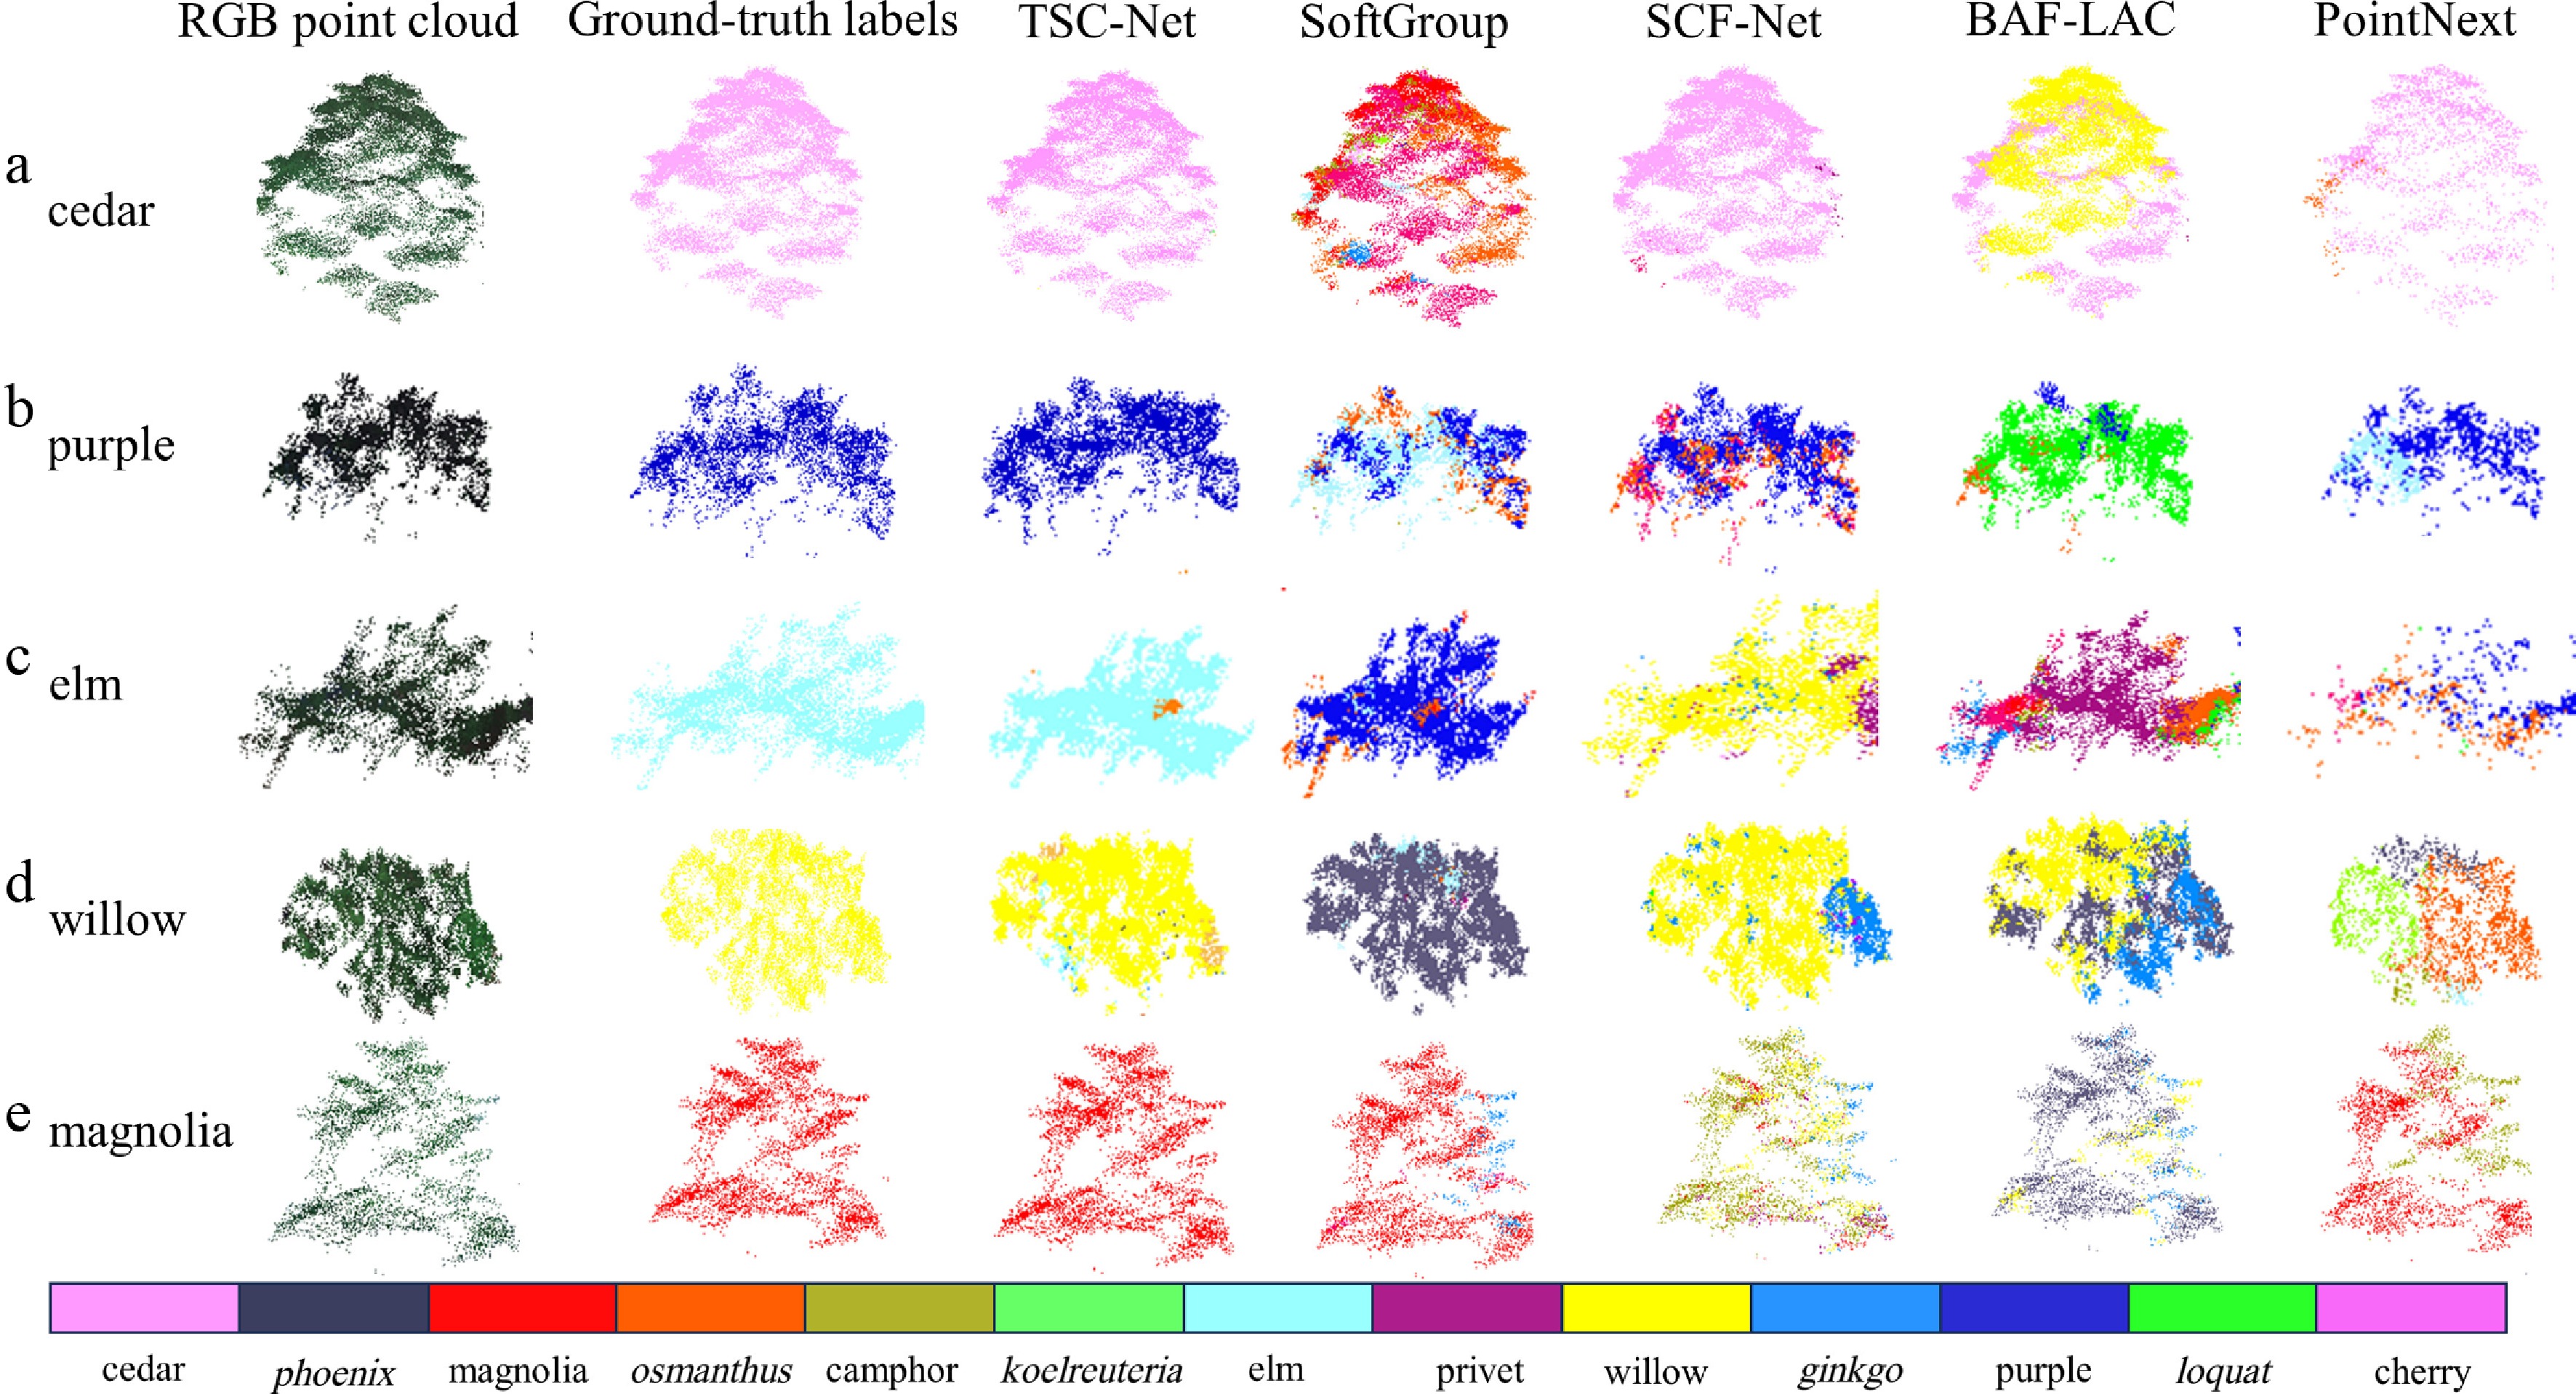
Figure 5.
Visualization of pointwise prediction results on representative canopy cluster samples from the NUIST dataset. The first column shows RGB-colored point cloud renderings used solely for visual reference and does not correspond to the labels' color bar. The second column presents the ground truth species labels, and the other columns show the corresponding predictions generated by the models. The color bar applies only to the ground truth labels and prediction panels.
Ablation studies
-
To validate the independent contributions and synergistic effects of the VHM and the MCM in enhancing pointwise classification performance, we conducted four ablation experiments on the NUIST dataset, using identical training set divisions and hyperparameter settings. To ensure a fair comparison with the baseline SoftGroup, we strictly kept all experimental configurations constant and only varied the proposed modules (i.e., the VHM and MCM). The results are presented in Table 2, where Method A uses the baseline SoftGroup model, Method B adds the VHM to Method A, Method C adds the MCM to Method A, Method D corresponds to the complete TSC-Net, which integrates both the VHM and MCM simultaneously. Hyperparameters were determined before the final experiments, according to preliminary exploratory experiments, and remained unchanged throughout all comparisons. During training, the model parameters were saved after each epoch. The final model weights obtained at the end of training were used for evaluation.
Table 2. Effects of introducing different modules on the NUIST dataset.
Module VHM MCM mIoU (%) iter_time (s) A 38.6% 0.5093 B √ 49.7% 0.6173 C √ 43.2% 0.5363 D √ √ 53.8% 0.5843 Method A denotes the baseline SoftGroup model. Method B represents the baseline model equipped with the VHM. Method C represents the baseline model equipped with the MCM. Method D corresponds to the complete TSC-Net integrating both the VHM and MCM. The model was trained for 80 epochs, and the final model weights obtained at the end of training were used for evaluation. The iteration time (iter_time) is the average time per iteration for training for 80 epochs.
Table 2 demonstrates that Methods B, C, and D achieve absolute mIoU improvements of 11.1, 4.6, and 15.2 pp, respectively, compared with Method A. Both the independent and simultaneous introduction of the VHM and the MCM enhance the model's recognition capability, with the combined use achieving the best performance for 3D point cloud-based tree species classification. The combined configuration provides complementary information by integrating multiscale morphological features and vertical structural cues. TSC-Net shows improved performance on the evaluated dataset containing complex vertical canopy structures.
Moreover, the proposed TSC-Net introduces only limited additional computational cost compared with the baseline SoftGroup. The model was trained for 80 epochs, and the final model weights obtained at the end of training were used for evaluation. The iteration time (i.e., iter_time in Table 2) is the average time per iteration for training for 80 epochs. Specifically, the proposed modules were applied to intermediate feature representations without modifying the backbone structure, preserving efficiency. Despite a marginal increase in computation, the proposed method achieved a notable improvement in classification performance, indicating a favorable trade-off between efficiency and accuracy.
By strategically integrating lightweight enhancement modules, TSC-Net maintains acceptable computational efficiency during training while achieving superior performance on 3D point clouds with complex spatial structures.
Extended experiments on the semantic terrain point labeling in synthetic 3D dataset
-
Despite the above-mentioned improvements, TSC-Net remains constrained by the limited diversity of the self-built datasets, which may affect its generalizability to unseen environments. The supplementary Semantic Terrain Point Labeling in Synthetic 3D (STPLS3D) experiment provides additional evidence that the proposed TSC-Net can be effectively applied to an independent point cloud dataset containing extracted tree categories. STPLS3D[40] is a large-scale dataset for semantic and instance segmentation for aerial 3D point clouds, combining real-world and synthetic data (see Fig. 6). In this study, several real-world subsets were selected for supplementary evaluation. Seven blocks from the real subsets were selected, from which five representative tree categories were manually extracted and annotated using CloudCompare. The selected samples were randomly divided into the training and testing sets in the ratio of 6:1. The original STPLS3D dataset does not provide species-level annotations for individual trees. The official semantic annotations categorize vegetation into broader classes such as low vegetation, medium vegetation, and high vegetation rather than specific tree species, not providing explicit botanical species names for these vegetation classes. During data preparation, five representative tree categories were manually extracted and annotated from the STPLS3D dataset for supplementary evaluation. The annotation procedure consisted of manually selecting representative tree samples from the vegetation regions of the STPLS3D dataset and assigning category labels. The five vegetation categories used in our experiments represent anonymous tree categories rather than confirmed tree species. Accordingly, we avoid assigning biological species names to these categories and use consistent terminology (Categories A–E) throughout the manuscript. The data schematic diagram is shown in Fig. 6. Categories A–E are five anonymized tree categories extracted from the STPLS3D dataset for evaluation purposes.
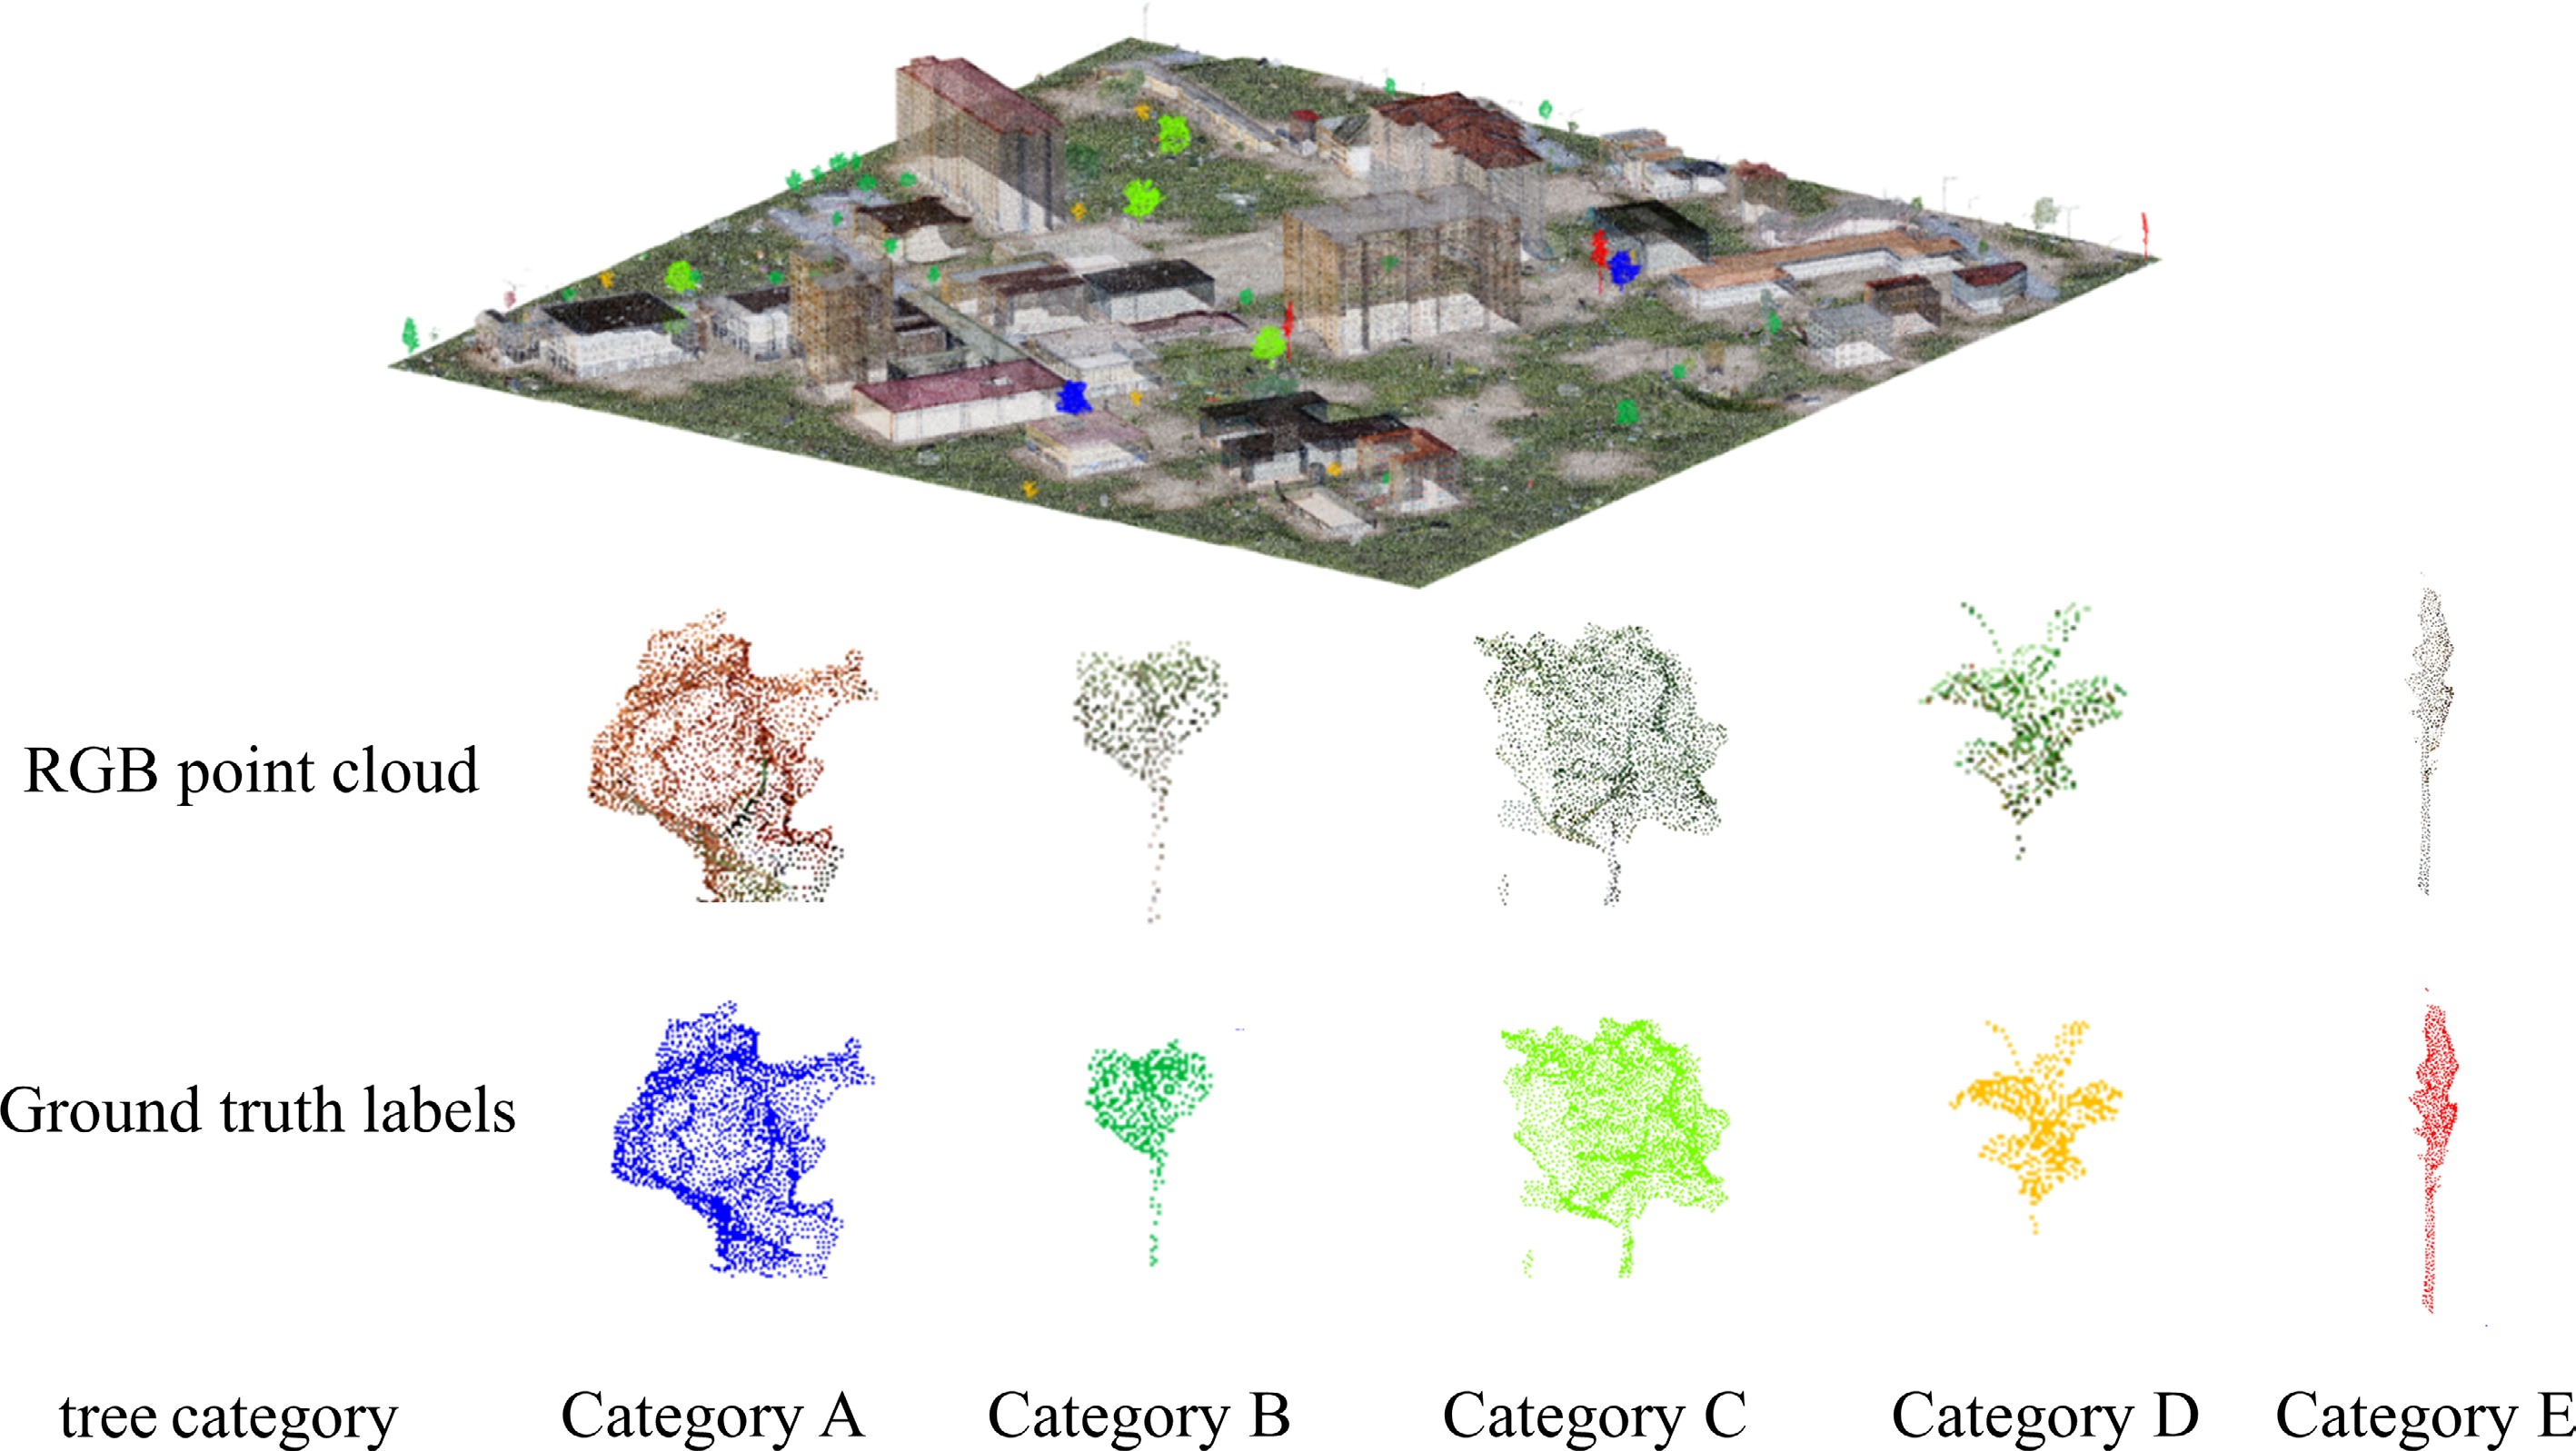
Figure 6.
Visualization of representative tree category samples extracted from the STPLS3D dataset. Since the original STPLS3D dataset provides anonymized tree category labels rather than botanical species names, the samples are denoted as Category A–E instead of specific species names.
Under the same experimental conditions as the NUIST experiment, TSC-Net was evaluated on five manually extracted anonymous tree categories from the STPLS3D dataset. Compared with the NUIST dataset, the selected regions in STPLS3D feature less tree occlusion and sparser tree point cloud data. According to the experimental results presented in Table 3, TSC-Net achieves IoU values higher than 70% for categories containing more than 200,000 points. Figure 7 demonstrates the visualization of classification results on the STPLS3D test set. Because of the limited sample size and sparse point cloud data of Category E, data preprocessing resulted in a significant loss of fine-grained features. This caused some tree trunks of Category E to be misclassified as Category A or Category B, and canopies to be misclassified as Category A, as shown in Fig. 7. Additionally, because of their similar RGB attributes and canopy structures, some trunk points of Category A and Category C were confused. The overall pointwise prediction performance across the five anonymous tree categories achieved an mIoU of 63.1%, indicating that the proposed framework maintains reasonable discriminative capability on an independent dataset. However, the results should be interpreted as supplementary evidence rather than a comprehensive validation of cross-dataset generalization, since species-level annotations and comparable baseline experiments are unavailable.
Table 3. Per-category point counts and IoU in the STPLS3D dataset.
Tree category Point counts IoU (%) Category A 248,264 86.9 Category B 278,469 71.1 Category C 412,494 86.9 Category D 135,507 53.9 Category E 31,411 16.7 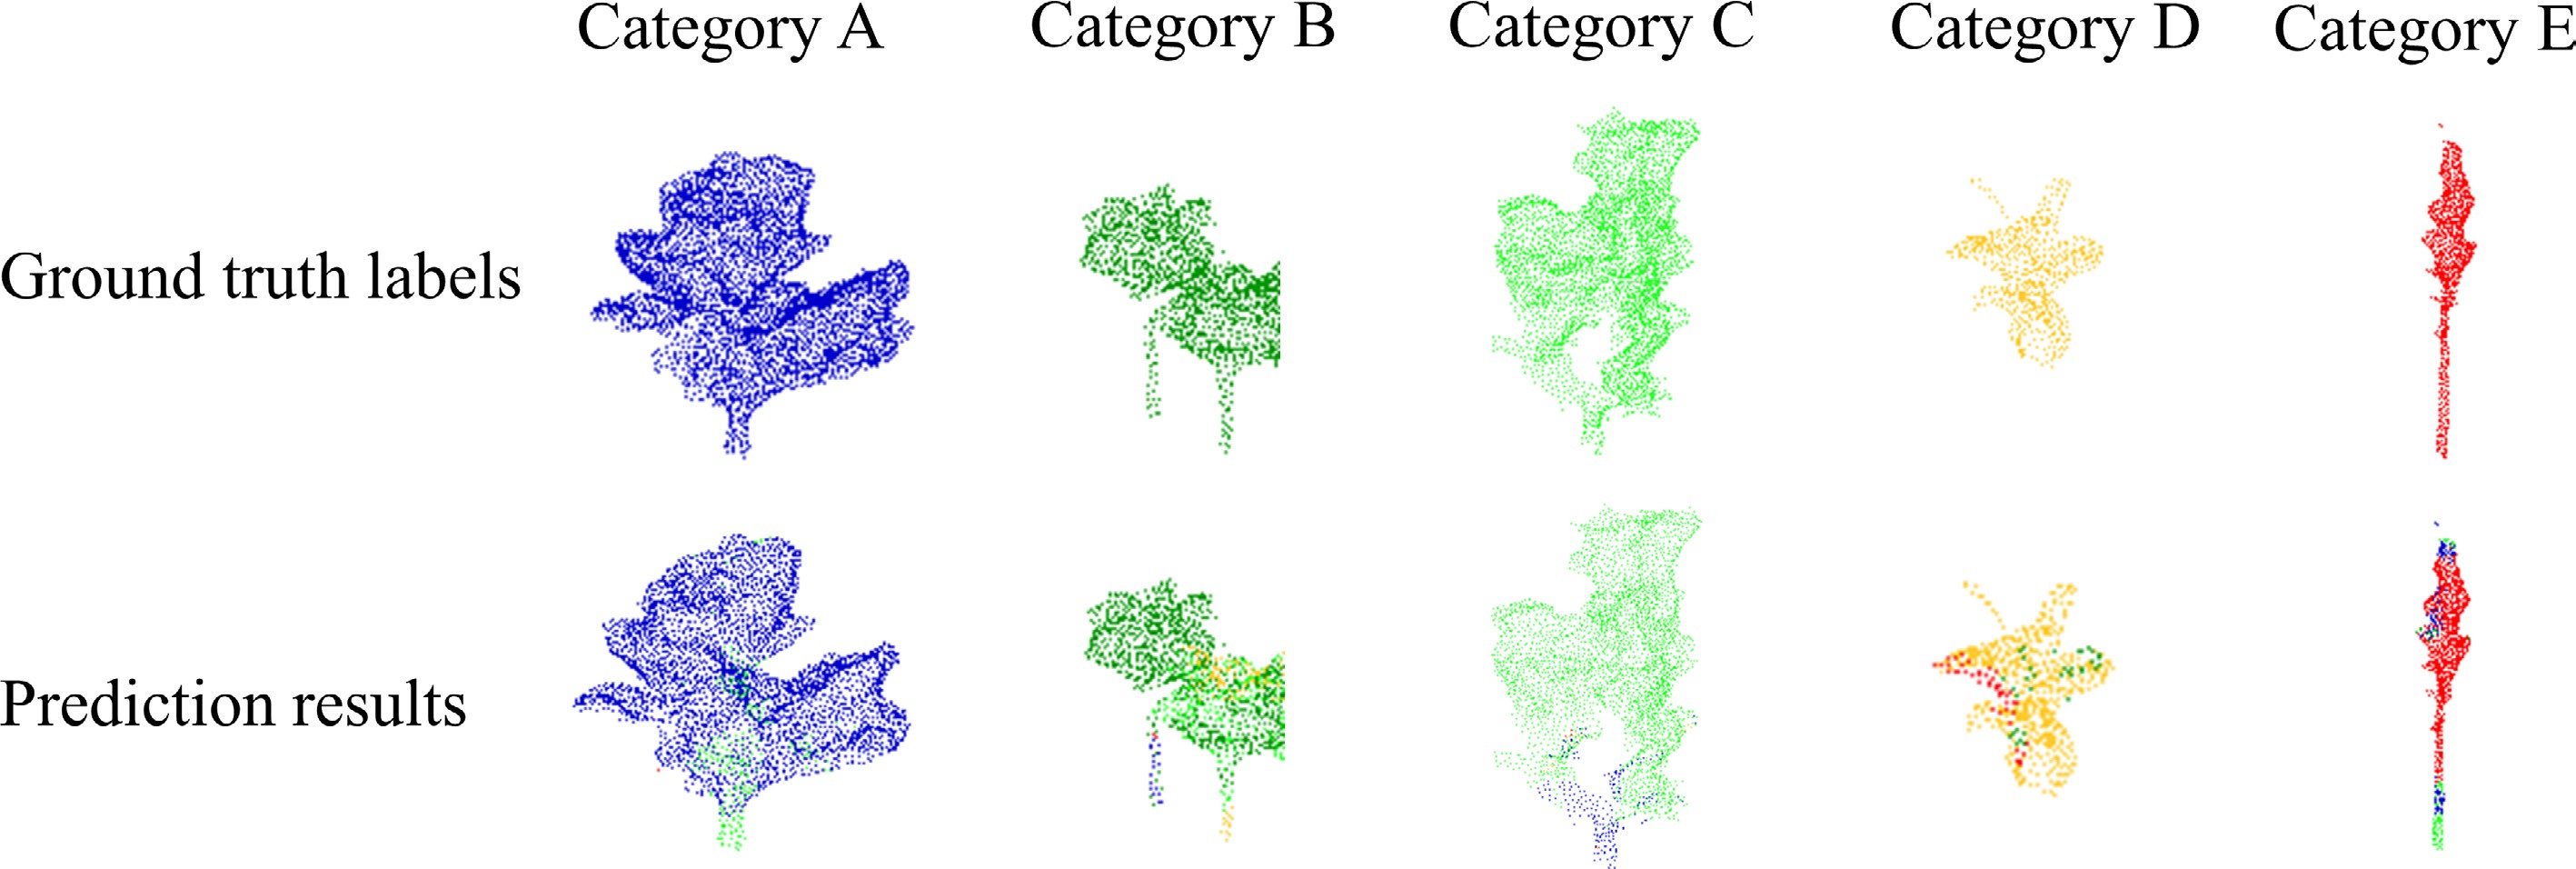
Figure 7.
Qualitative comparison between manually annotated category labels and TSC-Net's predictions on the STPLS3D dataset. The first row shows the ground truth labels, and the second row presents the corresponding predictions generated by TSC-Net.
-
The proposed TSC-Net achieves IoU values higher than 85% for several dominant species with relatively sufficient point observations and distinctive canopy structures, performing better than the representative general point cloud baselines. However, TSC-Net still exhibits several misclassification issues and uneven per-class results, showing limited improvement for minority classes.
Canopy-level tree species classification results
-
The canopy-level prediction achieved an overall classification accuracy (OA) of 90.67% on the NUIST test set after majority voting, calculated as the proportion of correctly classified canopy clusters among all test samples. The high classification accuracy indicates that the pointwise predictions generated by TSC-Net provide informative species-related cues, which can be effectively integrated through majority voting for reliable canopy-level tree species classification. Although pointwise predictions may contain local errors, majority voting within each canopy cluster can effectively suppress isolated misclassifications and generate robust canopy-level species labels. To further analyze the classification performance of individual species and reveal the dominant error patterns, a row-normalized confusion matrix was constructed on the NUIST test set (Fig. 8). The confusion matrix exhibits a pronounced diagonal distribution for most species, demonstrating that majority voting can effectively transfer pointwise predictions into reliable canopy-level tree species labels. According to the row-normalized confusion matrix, the diagonal values correspond to the recall of each species. Albizia, poplar, and cherry achieve a classwise recall of 100%, indicating that all tested tree instances from these categories are correctly recognized after aggregation. In addition, Phoenix, Ginkgo, Metasequoia, Koelreuteria, camphor, purple, and privet obtain high recall values ranging from 92.2% to 98.7%, demonstrating relatively robust classification capability for these categories.
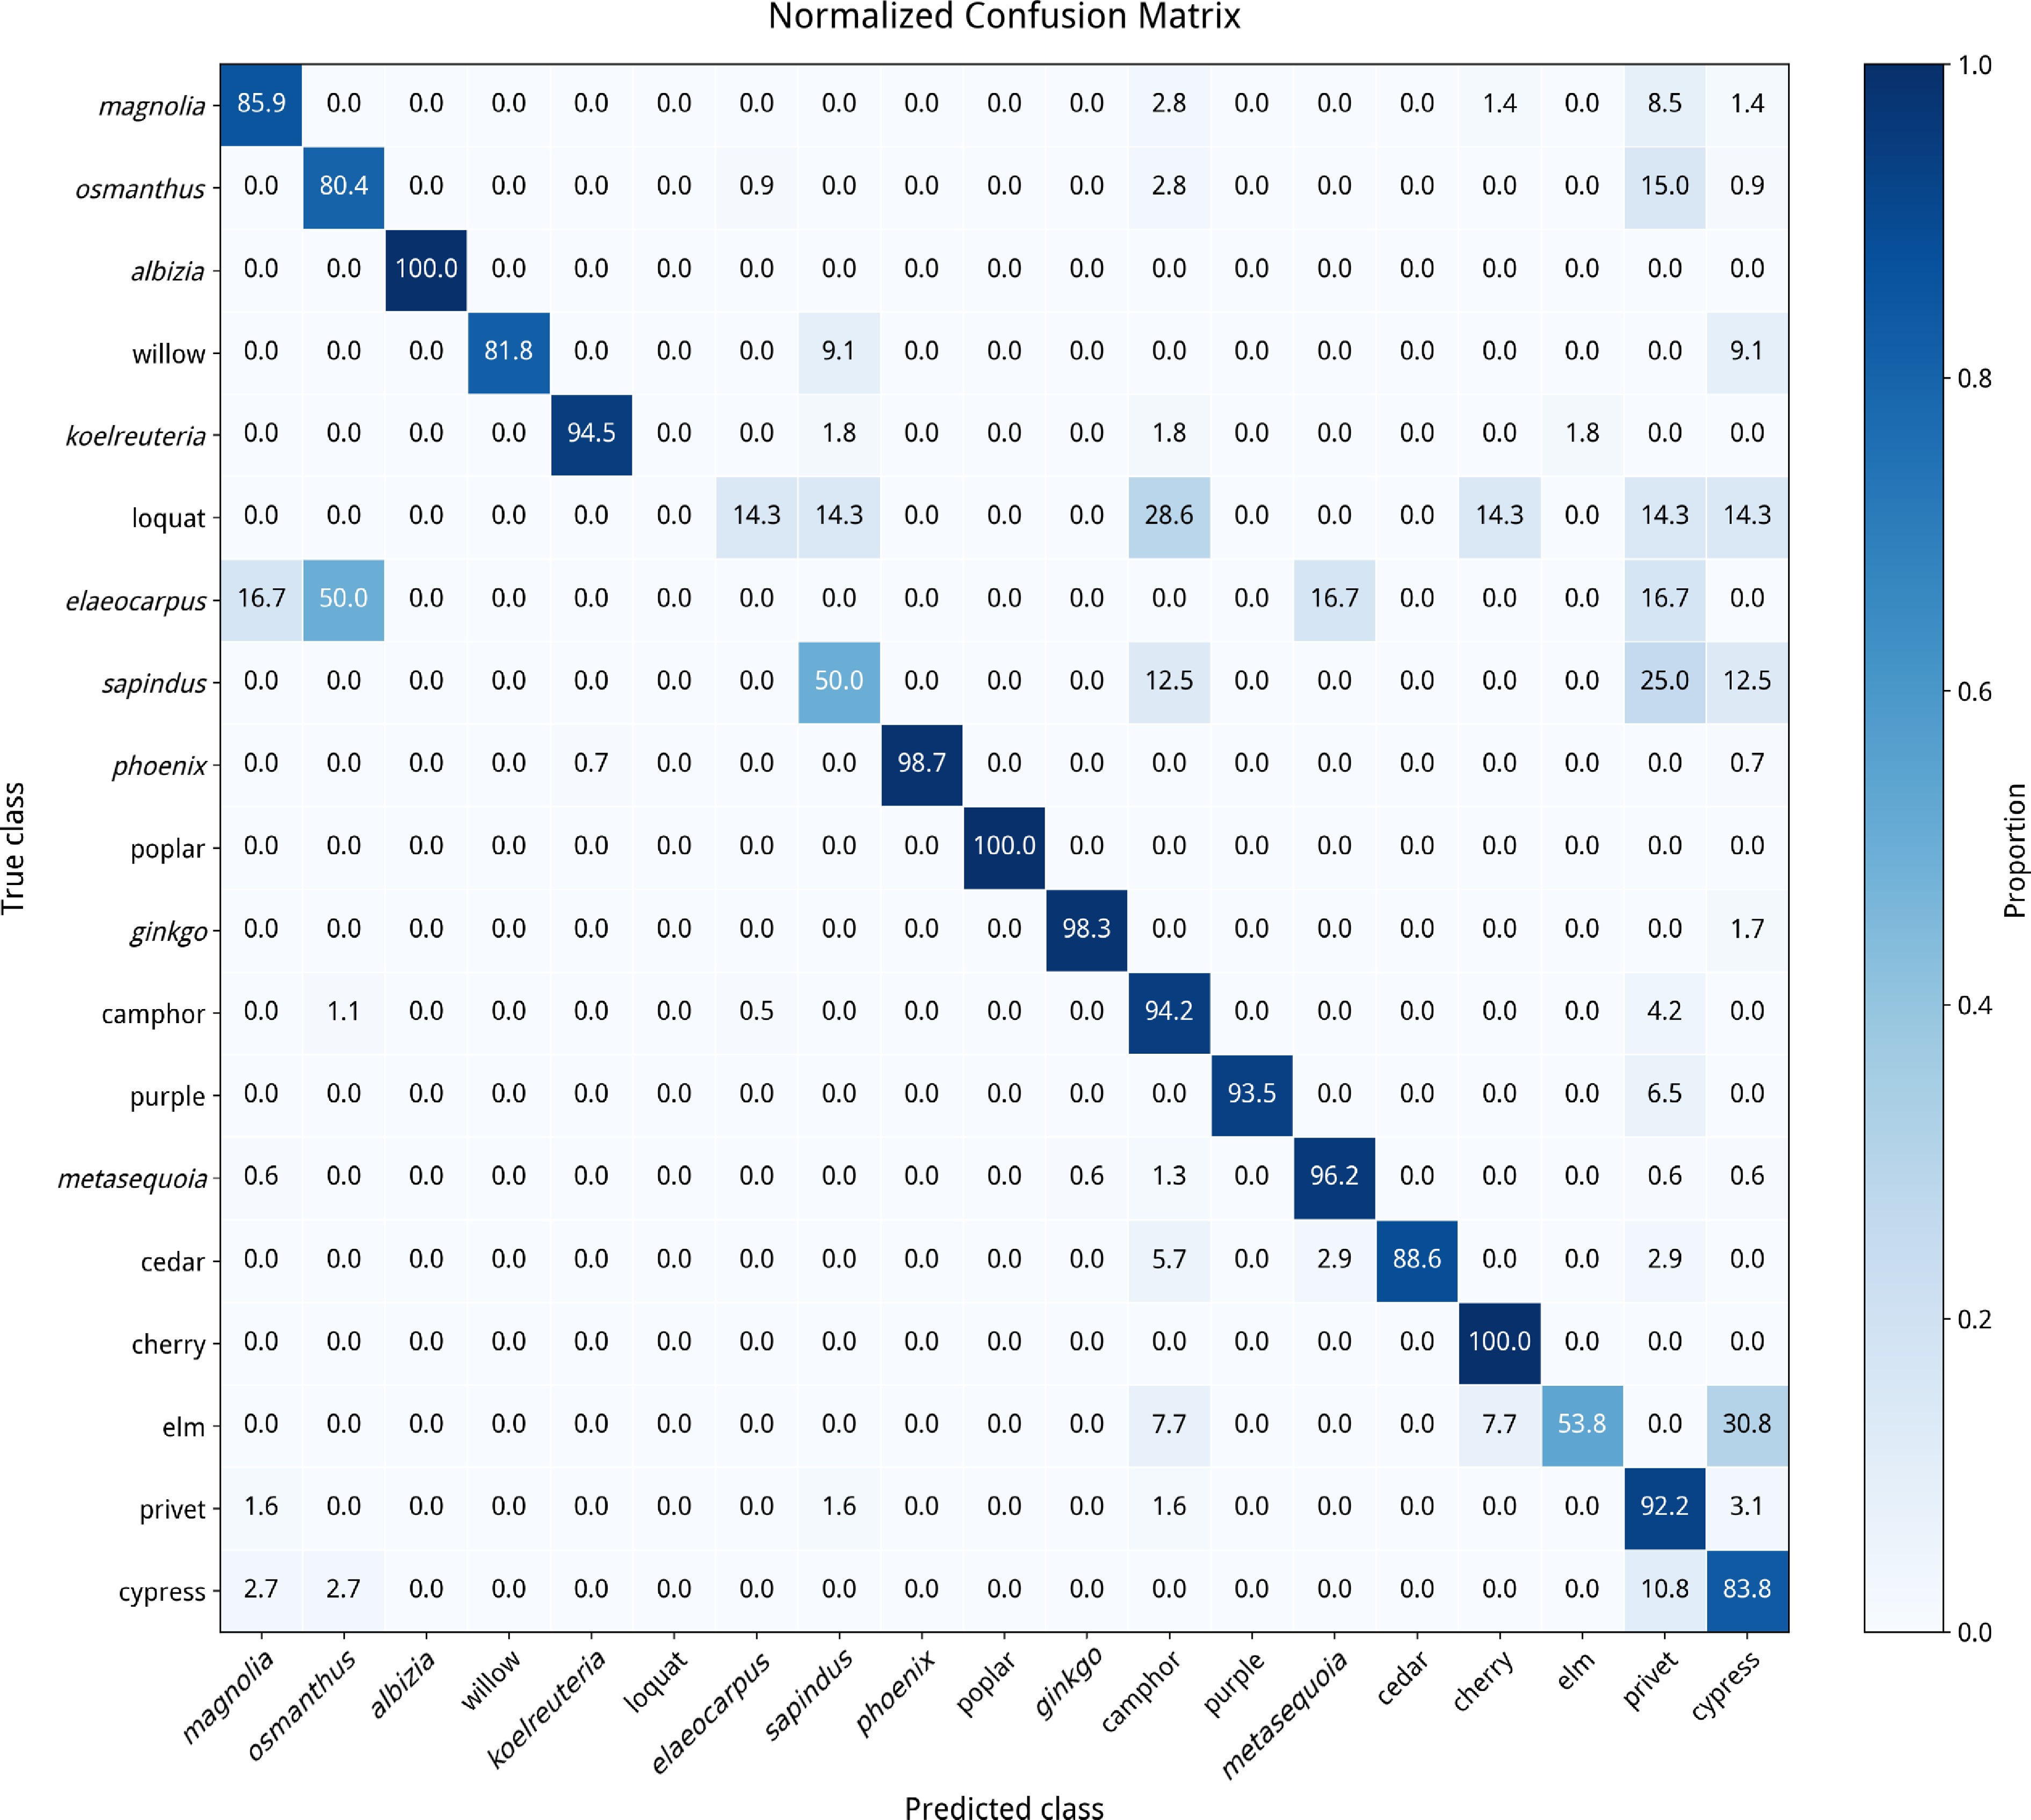
Figure 8.
Row-normalized confusion matrix for canopy-level tree species classification using majority voting. Each row represents the true species, and each column represents the predicted species. Diagonal values indicate the classwise recall, whereas off-diagonal values indicate interspecific misclassification rates.
Several species achieve moderate classification performance, including cedar, Magnolia, cypress, willow, and Osmanthus, with recall values between 80.4% and 88.6%. However, some categories remain challenging. For example, Sapindus and elm achieve relatively low recalls of 50.0% and 53.8%, respectively. Elm is mainly confused with cypress (30.8%), whereas Sapindus is frequently misclassified as privet (25.0%), suggesting that these species may be affected by similar canopy structures, spectral characteristics, and insufficient sample representation under sparse point cloud conditions.
The most difficult categories are loquat and Elaeocarpus, for which no tree instances have been correctly classified. Specifically, loquat samples are mainly assigned to camphor (28.6%), whereas the remaining samples are distributed among Elaeocarpus, Sapindus, cherry, privet, and cypress. Elaeocarpus is predominantly confused with Osmanthus (50.0%), followed by Magnolia, Metasequoia, and privet (16.7% each). Additional confusion patterns are observed between Osmanthus and privet (15.0%), cypress and privet (10.8%), and magnolia and privet (8.5%). These results indicate that although the framework successfully recognizes most tree species, distinguishing species with highly similar canopy morphology and limited training samples remains challenging.
Phoenix-related misclassification issues
-
As shown in Table 1, the network performs weakly on Koelreuteria and camphor, which contain relatively abundant samples, and notably on loquat, cypress, Sapindus, Albizia, and Elaeocarpus. To further investigate the cause, we conducted a visualization analysis, as shown in Fig. 9. To better illustrate challenging classification scenarios, Fig. 9 focuses on three tree species (i.e., Phoenix, camphor, and Koelreuteria) that exhibit frequent mutual confusion. The RGB point cloud renderings are shown only for visual reference and do not correspond to the color bar. Ground truth labels and predictions are visualized using the semantic color mapping shown in the color bar, where each color corresponds to one of the three selected species. Only the three species involved in the selected confusion cases are shown in the color bar. Therefore, the color bar does not include all species categories contained in the NUIST dataset. Each color block in the color bar corresponds to the tree species below. Figure 9 shows that the network tends to misclassify Koelreuteria and camphor as Phoenix. Although the VHM and MCM enhance the representation of vertical and multiscale canopy characteristics, these modules still have difficulty distinguishing species with highly similar structural and spectral patterns under sparse point cloud conditions. Specifically, the VHM extracts vertical structural features through height encoding and vertical-aware convolution, whereas the MCM captures multiscale morphological features using 3 × 3 × 3, 5 × 5 × 5, and 7 × 7 × 7 convolution kernels. The network struggles to distinguish Koelreuteria and Phoenix because of their similar canopy features. Moreover, the similar RGB features among Koelreuteria, camphor, and Phoenix further exacerbate the misclassification. Under sparse point cloud conditions, the reliability of feature extraction decreases, potentially reducing discriminative capability for these similar species.
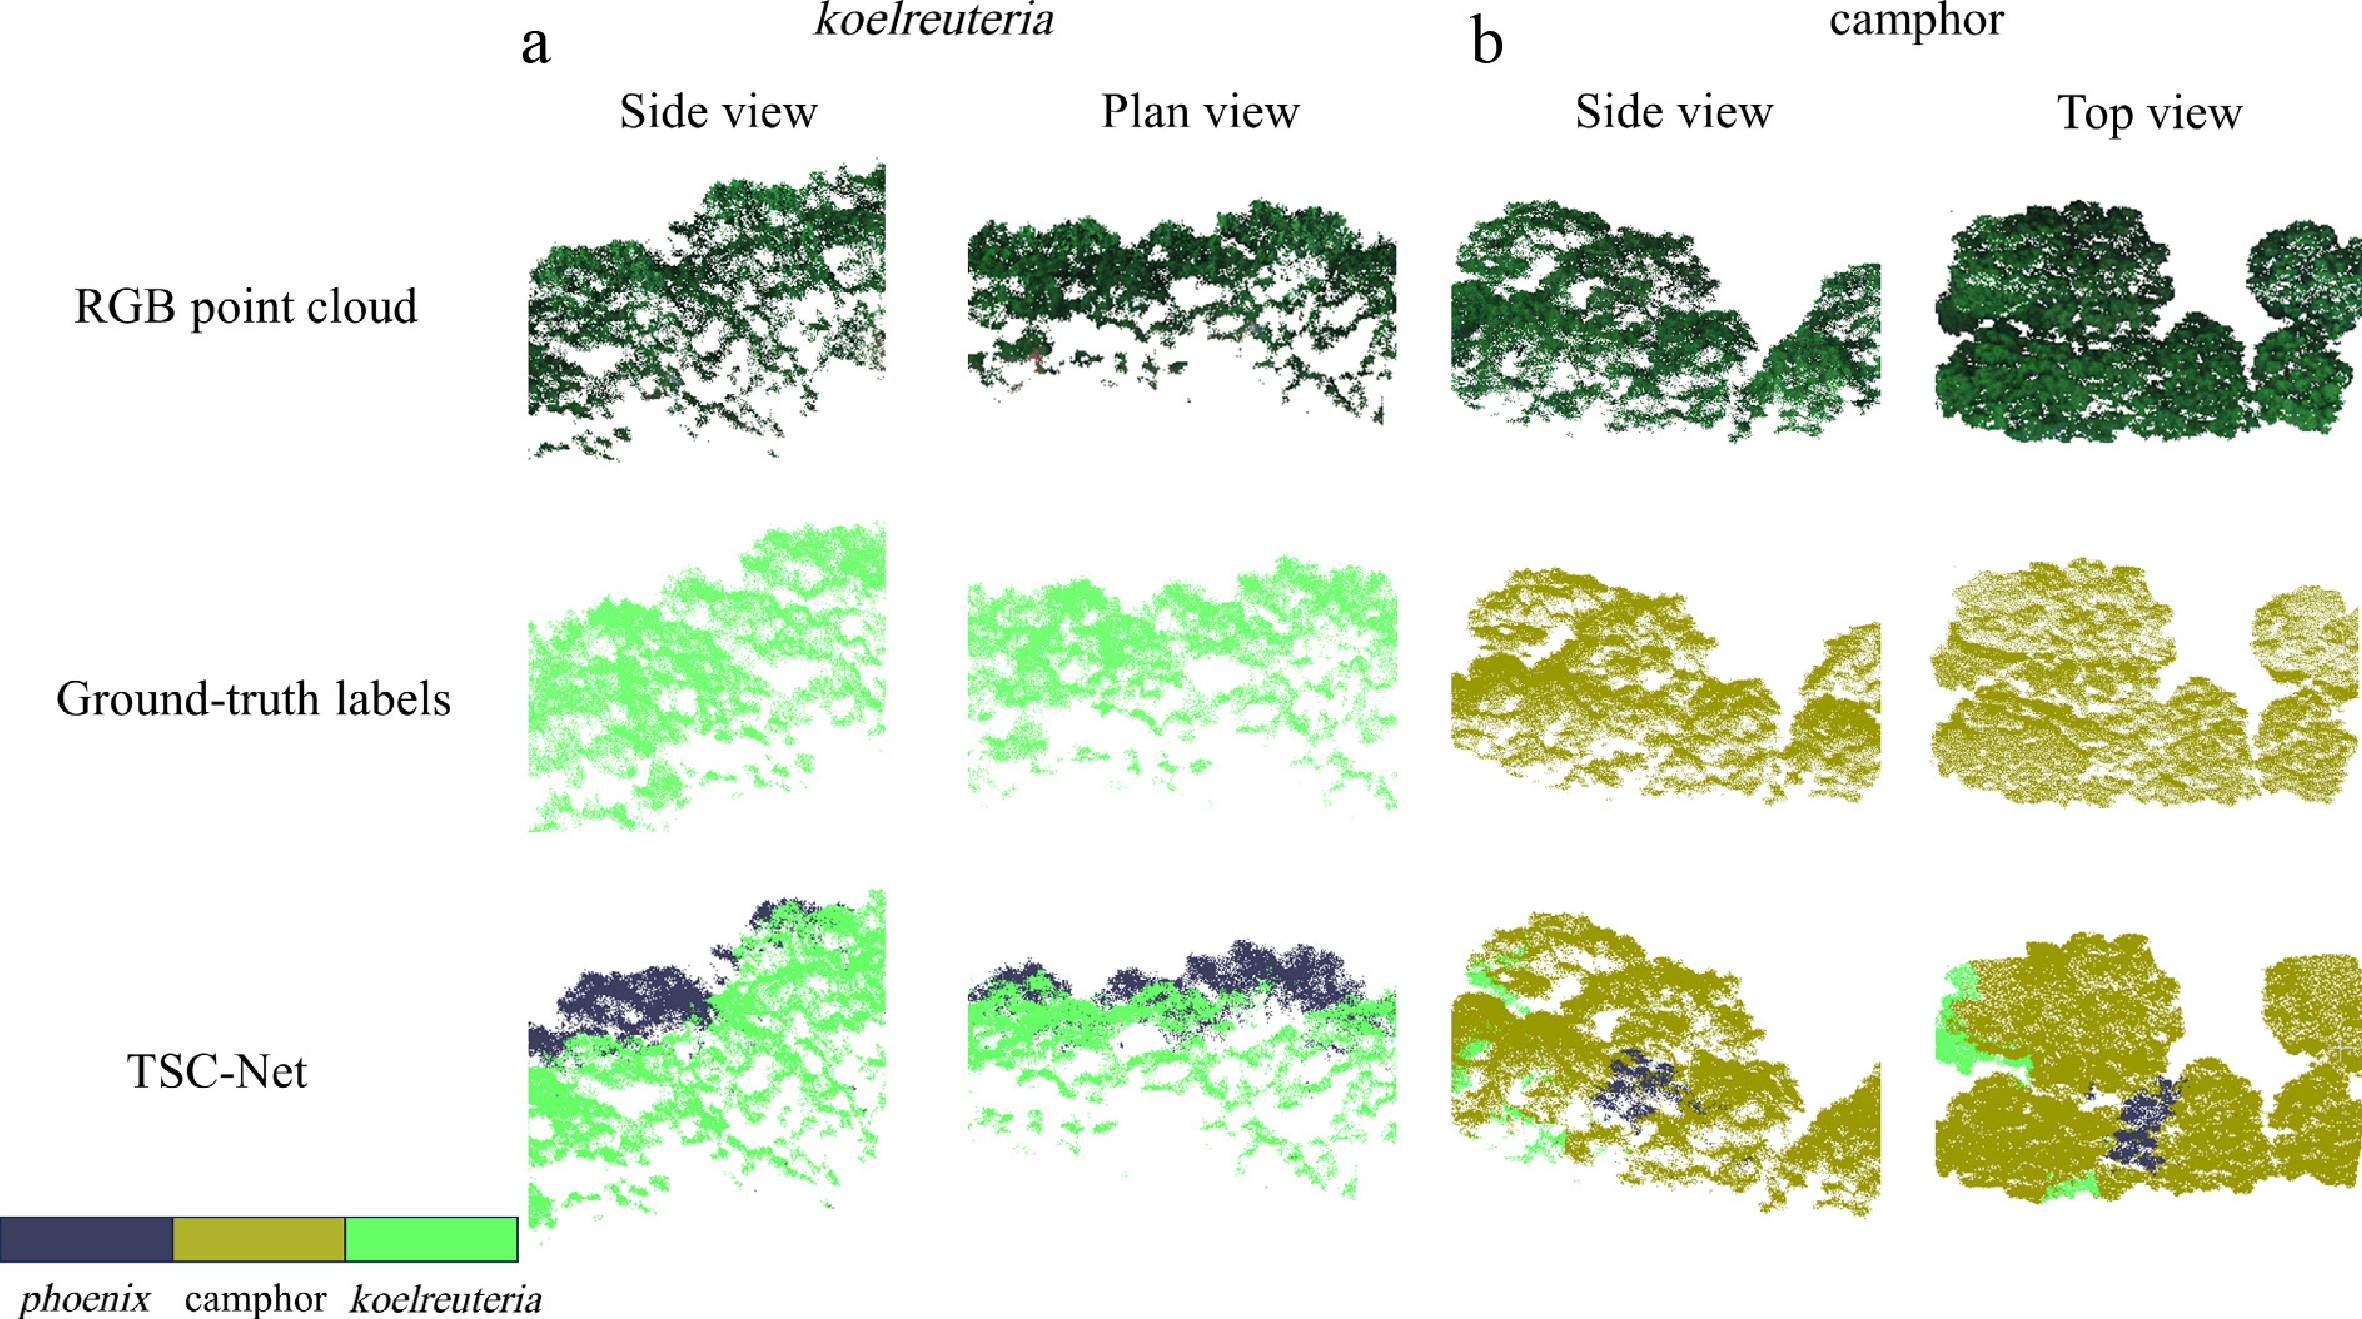
Figure 9.
Visualization of classification results for Phoenix-related errors. (a) Phoenix–Koelreuteria misclassification; (b) Phoenix–camphor misclassification. The first row shows RGB-colored point cloud renderings solely for visual reference and does not correspond to the color bar. The second row presents the ground truth species labels; the third row shows the corresponding predictions generated by TSC-Net. The color bar applies only to the ground truth and prediction panels, where colors represent the three species involved in the confusion analysis: Phoenix, camphor, and Koelreuteria.
Uneven per-class performance
-
Apart from the Phoenix-related errors, a noticeable variation across different tree species can be observed from the per-class IoU results. Specifically, certain classes such as Ginkgo (90.1%), Metasequoia (89.6%), and Phoenix (87.6%) achieve consistently high accuracy, although others, including loquat (0.6%), cypress (4.6%), and Sapindus (11.7%), remain challenging to classify.
To better understand these failure cases, a row-normalized confusion matrix was further analyzed for the NUIST test set (Fig. 10). The results indicate that the classification errors of minority species are not randomly distributed among all categories but are mainly concentrated on a limited number of dominant or structurally similar species. For example, loquat exhibits severe confusion with Koelreuteria (30.6%), elm (28.3%), and camphor (13.0%), suggesting that the learned features may not be sufficient to distinguish these species under sparse and incomplete canopy observations. Similarly, cypress shows strong confusion with camphor (42.1%) and Osmanthus (30.3%), which largely explains its extremely low IoU value. These results indicate that the model can recognize the general canopy characteristics of these classes but struggles to capture subtle inter-species differences when only incomplete canopy structures are available.
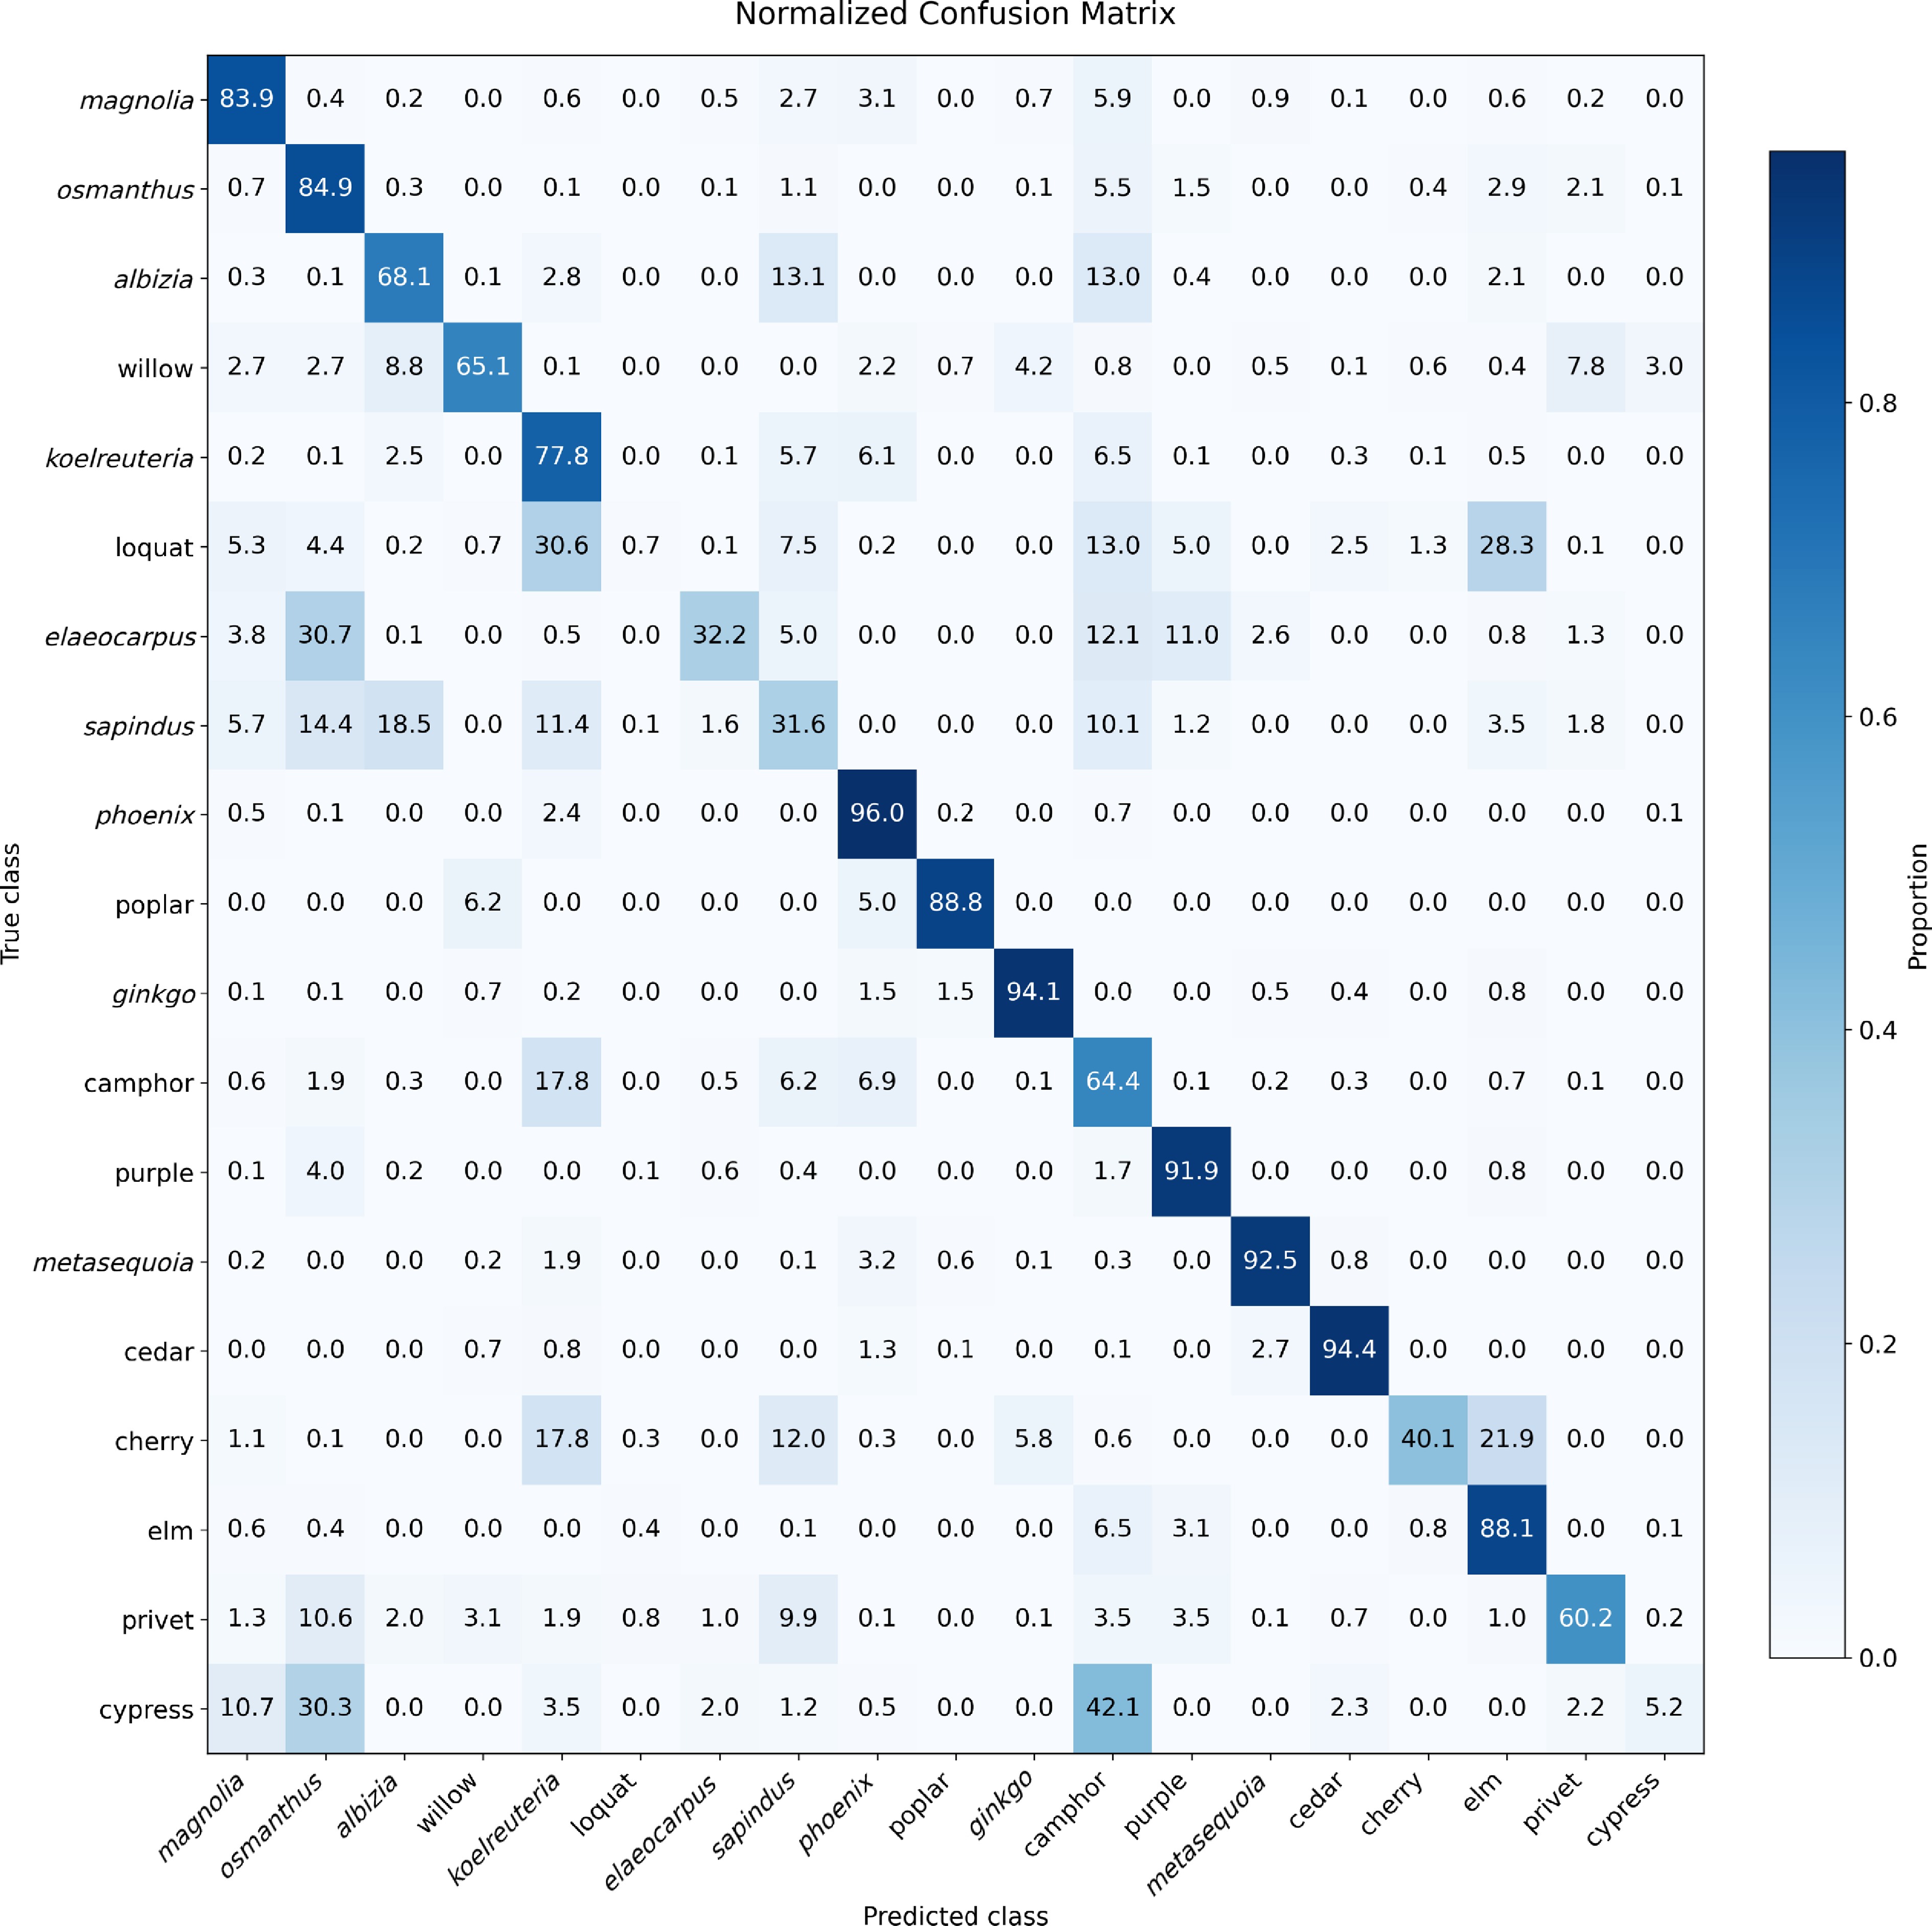
Figure 10.
Row-normalized confusion matrix of TSC-Net on the NUIST test set. The matrix reveals the dominant confusion patterns among minority and visually similar tree species.
In addition, Sapindus achieves a relatively low IoU (11.7%), with a considerable proportion of samples being incorrectly assigned to Osmanthus (14.4%), Albizia (18.5%), and Koelreuteria (11.4%). Meanwhile, only 31.6% of Sapindus samples are correctly classified according to the confusion matrix, suggesting that the learned features are insufficient to fully characterize this category. This limitation is likely associated with the limited number of training samples, the high intra-class variability of canopy structures, and the incomplete geometric information caused by sparse point distribution.
Limitations
-
The experimental results demonstrate that TSC-Net improved classification performance on both the NUIST and STPLS3D datasets. Nevertheless, the proposed framework still exhibits clear limitations when recognizing minority species. Extremely low IoU values for several categories indicate that severe class imbalance, incomplete canopy structures, and high spectral and geometric similarity among certain species remain significant challenges. Future improvements may benefit from more effective class-balancing strategies, such as class-balanced sampling, adaptive loss weighting, focal loss, and contrastive feature learning, together with further expansion of minority species samples.
Another limitation of this study concerns the characterization of sparse canopy point clouds. The proposed framework was evaluated under a single sparse canopy scenario generated by the adopted preprocessing pipeline, which reflects a practical urban application in which canopy extraction and filtering of vegetation substantially reduce the available point density. However, the robustness of TSC-Net under varying levels of point sparsity was not systematically investigated. Future work will perform density-controlled subsampling experiments to quantitatively evaluate the sensitivity and robustness of the proposed framework under progressively sparser point cloud conditions.
The cross-dataset evaluation on STPLS3D also has inherent limitations. Although this benchmark provides valuable evidence for assessing the capability of TSC-Net on an independent dataset, it contains only anonymized vegetation categories rather than verified botanical species labels. Therefore, the corresponding experimental results should be interpreted as recognition of the vegetation categories rather than botanical species identification. Future research will further validate the proposed framework on datasets with field-verified species annotations, enabling more rigorous biological interpretation and ecological analysis.
Overall, despite these limitations, the proposed framework demonstrates the potential of integrating vertical structural information and multiscale canopy features for sparse canopy point cloud classification. The identified limitations also provide clear directions for future improvements in data construction, benchmark design, and robust feature learning.
-
In this paper, we propose TSC-Net, a point-level tree species classification framework that learns pointwise classification representations from RGB-enhanced LiDAR point clouds and subsequently obtains canopy-level tree species labels through majority voting. The proposed framework enhances canopy-discriminative representation by integrating two complementary modules: The VHM, which strengthens height-aware vertical stratification modeling, and the MCM, which captures the canopy's morphology across multiple spatial scales. By dynamically fusing the outputs of these modules, TSC-Net enables adaptive integration of vertical structural and multiscale morphological information.
The pointwise prediction generated by TSC-Net achieves an mIoU of 53.8%, outperforming several representative point cloud baselines and Random Forest under the same experimental setting on the NUIST dataset. Subsequently, we achieved a canopy-level tree species classification accuracy of 90.67% after majority voting, demonstrating that accurate canopy-level tree species classification relies on effective representation of pointwise classification. In particular, the results suggest that explicitly modeling vertical hierarchy and multiscale morphology is beneficial for sparse canopy point cloud classification under the evaluated urban scenarios. Despite these improvements, the proposed method remains constrained by the limited geographic coverage and scene diversity of the currently available datasets. Future work will focus on validating TSC-Net in larger and more heterogeneous regions and conducting density-controlled experiments to further analyze its robustness under varying point sparsity levels, with the aim of improving its generalization to more complex urban vegetation conditions.
-
The authors confirm their contributions to this study as follows: study conception and design: Liu L; data collection: Shen L, Hu Q; analysis and interpretation of results: Liu L, Zhao H, Wang L; draft manuscript preparation: Liu L, Chen K, Guan H. All authors reviewed the results and approved the final version of the manuscript.
-
The source code, preprocessing scripts, configuration files, trained model weights, and environment specifications of TSC-Net will be publicly uploaded via a GitHub repository upon acceptance of this manuscript to facilitate reproducibility and further research. The released repository is available at https://github.com/600-386/TSC-Net.git. Because of the privacy and ownership restrictions associated with the NUIST campus dataset, the raw LiDAR and multispectral data cannot be directly uploaded to the public repository. The STPLS3D dataset used for supplementary experiments is publicly available at https://github.com/meidachen/STPLS3D. Researchers interested in accessing the NUIST dataset may contact the corresponding author with reasonable requests subject to institutional data-sharing policies.
-
The authors declare that they have no conflict of interest.
- This article is an open access article distributed under Creative Commons Attribution License (CC BY 4.0), visit https://creativecommons.org/licenses/by/4.0/.
-
About this article
Cite this article
Liu L, Chen K, Hu Q, Guan H, Shen L, et al. 2026. Urban tree species classification from LiDAR point clouds with RGB spectral attributes via deep learning. Smart Forestry 1: e015 doi: 10.48130/smartfor-0026-0012 

Urban tree species classification from LiDAR point clouds with RGB spectral attributes via deep learning
- Received: 05 March 2026
- Revised: 30 July 2026
- Accepted: 03 August 2026
- Published online: 31 August 2026
Abstract: With urban greening demands rapidly increasing, using imagery and light detection and ranging (LiDAR) technology to assess trees' attributes, including their species composition, and growth status, has become a key means of evaluating green spaces' ecological functions. However, urban point clouds tend to be sparse after extraction and filtering nonvegetation, resulting in incomplete morphological and spectral feature representation caused by reduced point density, severely hampering the performance of classification models on tree species classification. To address this issue, we propose a point-level tree species classification network (TSC-Net) based on red–green–blue (RGB)-enhanced LiDAR point clouds. To improve species-discriminative feature learning, two modules are introduced: (1) A vertical hierarchy module, designed to capture vertical structural patterns in three-dimensional 3D point clouds, and (2) a multiscale canopy module, which collects morphological traits at multiple scales. The two modules are deployed in parallel to enhance the recognition of trees across different sizes. The proposed method was evaluated on a self-built Nanjing University of Information Science and Technology (NUIST) dataset, with additional experiments conducted on the publicly available Semantic Terrain Point Labeling in Synthetic 3D (STPLS3D) dataset. The pointwise prediction generated by TSC-Net achieved a mean intersection over union (mIoU) of 53.8% on the NUIST dataset, outperforming several representative point cloud methods and a traditional machine learning method in the same experimental setting. The confusion matrix analysis further demonstrated that the proposed framework effectively recognized most tree species. Subsequently, the pointwise prediction generated by TSC-Net achieved a canopy-level tree species classification accuracy (overall accuracy) of 90.67% after majority voting. In addition, the experiment on the STPLS3D dataset further demonstrated the applicability of the proposed framework for anonymous tree category recognition under different point cloud conditions.