











-
Chinese fir is a pivotal timber species in China, and its sustainable management is essential for optimizing forest productivity. Despite its economic importance, current management practices frequently rely on 'realized harvest'—the yield obtained under existing stand structures and management regimes—rather than 'potential yield', which represents the maximum productivity attainable under optimal density conditions[1]. This discrepancy suggests that significant growth potential remains untapped. Consequently, there is an urgent need to shift from descriptive harvest assessments to an analytical framework capable of quantifying and realizing the potential yield of Chinese fir plantations through precise density control.
To establish a rigorous theoretical basis for this transition, it is necessary to differentiate between several related but distinct concepts. Site productivity refers to the inherent biological potential of a site (often measured by the site index), serving as a static baseline for natural ecological carrying capacity[2,3]. Actual yield denotes the current harvest observed from inventory data, which is constrained by current stand structures, competition, and past management practices[4,5]. In contrast, potential yield—also referred to as attainable or optimized yield—is defined as the theoretical maximum volume harvest achievable under given site conditions through optimal density regulation[6]. Unlike the static nature of site productivity or the restricted nature of actual yield, potential yield represents a dynamic target that reflects the upper boundary of stand performance under ideal silvicultural regimes.
However, traditional approaches to forest productivity have largely struggled to capture this dynamic potential. While early studies focused on site quality evaluation using site index models based on dominant or average tree height[7], advancements in field experimentation and forest science have facilitated the development of basal area and volume productivity models derived from regression equations[8,9]. More recently, the growing global emphasis on forest ecology and carbon sequestration has led to a proliferation of research employing the mean annual increment of stand biomass and carbon storage as key indicators of site productivity[10−13] or simple optimal density targets to guide thinning operations[14,15]. However, these studies generally stop at identifying optimal stocking levels, neglecting to quantify the specific production gap between current management and the site's true physiological potential. Furthermore, existing literature on stand harvest often treats potential productivity as a fixed attribute rather than a dynamic variable influenced by stand age, site quality, and density.
To address these limitations, Fu et al.[16] proposed a significant methodology for calculating potential basal area and volume increment by regulating stand density, offering a breakthrough in forest management. Their work demonstrated that realized productivity frequently falls short of site potential; consequently, subsequent studies have extended this framework to investigate potential growth patterns across a diverse range of tree species[17,18]. However, the application of their method is often restricted to specific reference ages, lacking the flexibility required for real-time, age-independent stand management. This study builds upon this foundation by extending the analysis of potential productivity to 'potential harvest'. By integrating the Generalized Algebraic Difference Approach (GADA) for site index modeling with dynamic programming for density optimization, this research provides a decision-making framework that is not constrained by specific time points.
Therefore, the objectives of this study are threefold: (1) to construct a robust potential harvest model for Cunninghamia lanceolata in Zhejiang province; (2) to determine optimal stand densities across varying ages and site conditions using dynamic programming; and (3) to quantitatively compare realized harvest with potential harvest. The proposed modelling framework uniquely estimates this potential yield through a dual-mechanism approach. The Generalized Algebraic Difference Approach (GADA) eliminates the dependency on reference age, allowing for a dynamic characterization of site productivity across various conditions. Simultaneously, the Dynamic Programming (DP) method incorporates stand density as a decision variable to derive the optimal trajectory for maximum volume accumulation throughout the rotation. This integrated GADA-DP framework effectively bridges the gap between static site evaluation and dynamic management optimization, providing a robust quantitative basis for estimating potential yield. This approach allows forest managers to identify specific gaps in stand production and optimize density regulation, providing a reliable methodological basis for improving the quality and yield of Chinese fir plantations.
-
Qingyuan County is located in the southern part of Lishui City, Zhejiang Province, China (118°50′–119°30′ E, 27°25′–27°51′ N; Fig. 1). The region boasts a long-standing tradition of Chinese fir (Cunninghamia lanceolata) cultivation. The plantations examined in this study primarily originated from artificial regeneration on clear-cut sites between the 1980s and 1990s. Afforestation typically involves pit site preparation following block clearing, with initial planting spacings of 2 m × 2 m or 1.5 m × 2 m. Throughout their development, these stands have undergone routine silvicultural treatments, including weeding during the juvenile stage and thinning during the pole stage[19]. The selected plantations are representative of typical local management practices, and their age structures and growth statuses accurately reflect the trajectory of regional forestry production over the past few decades.
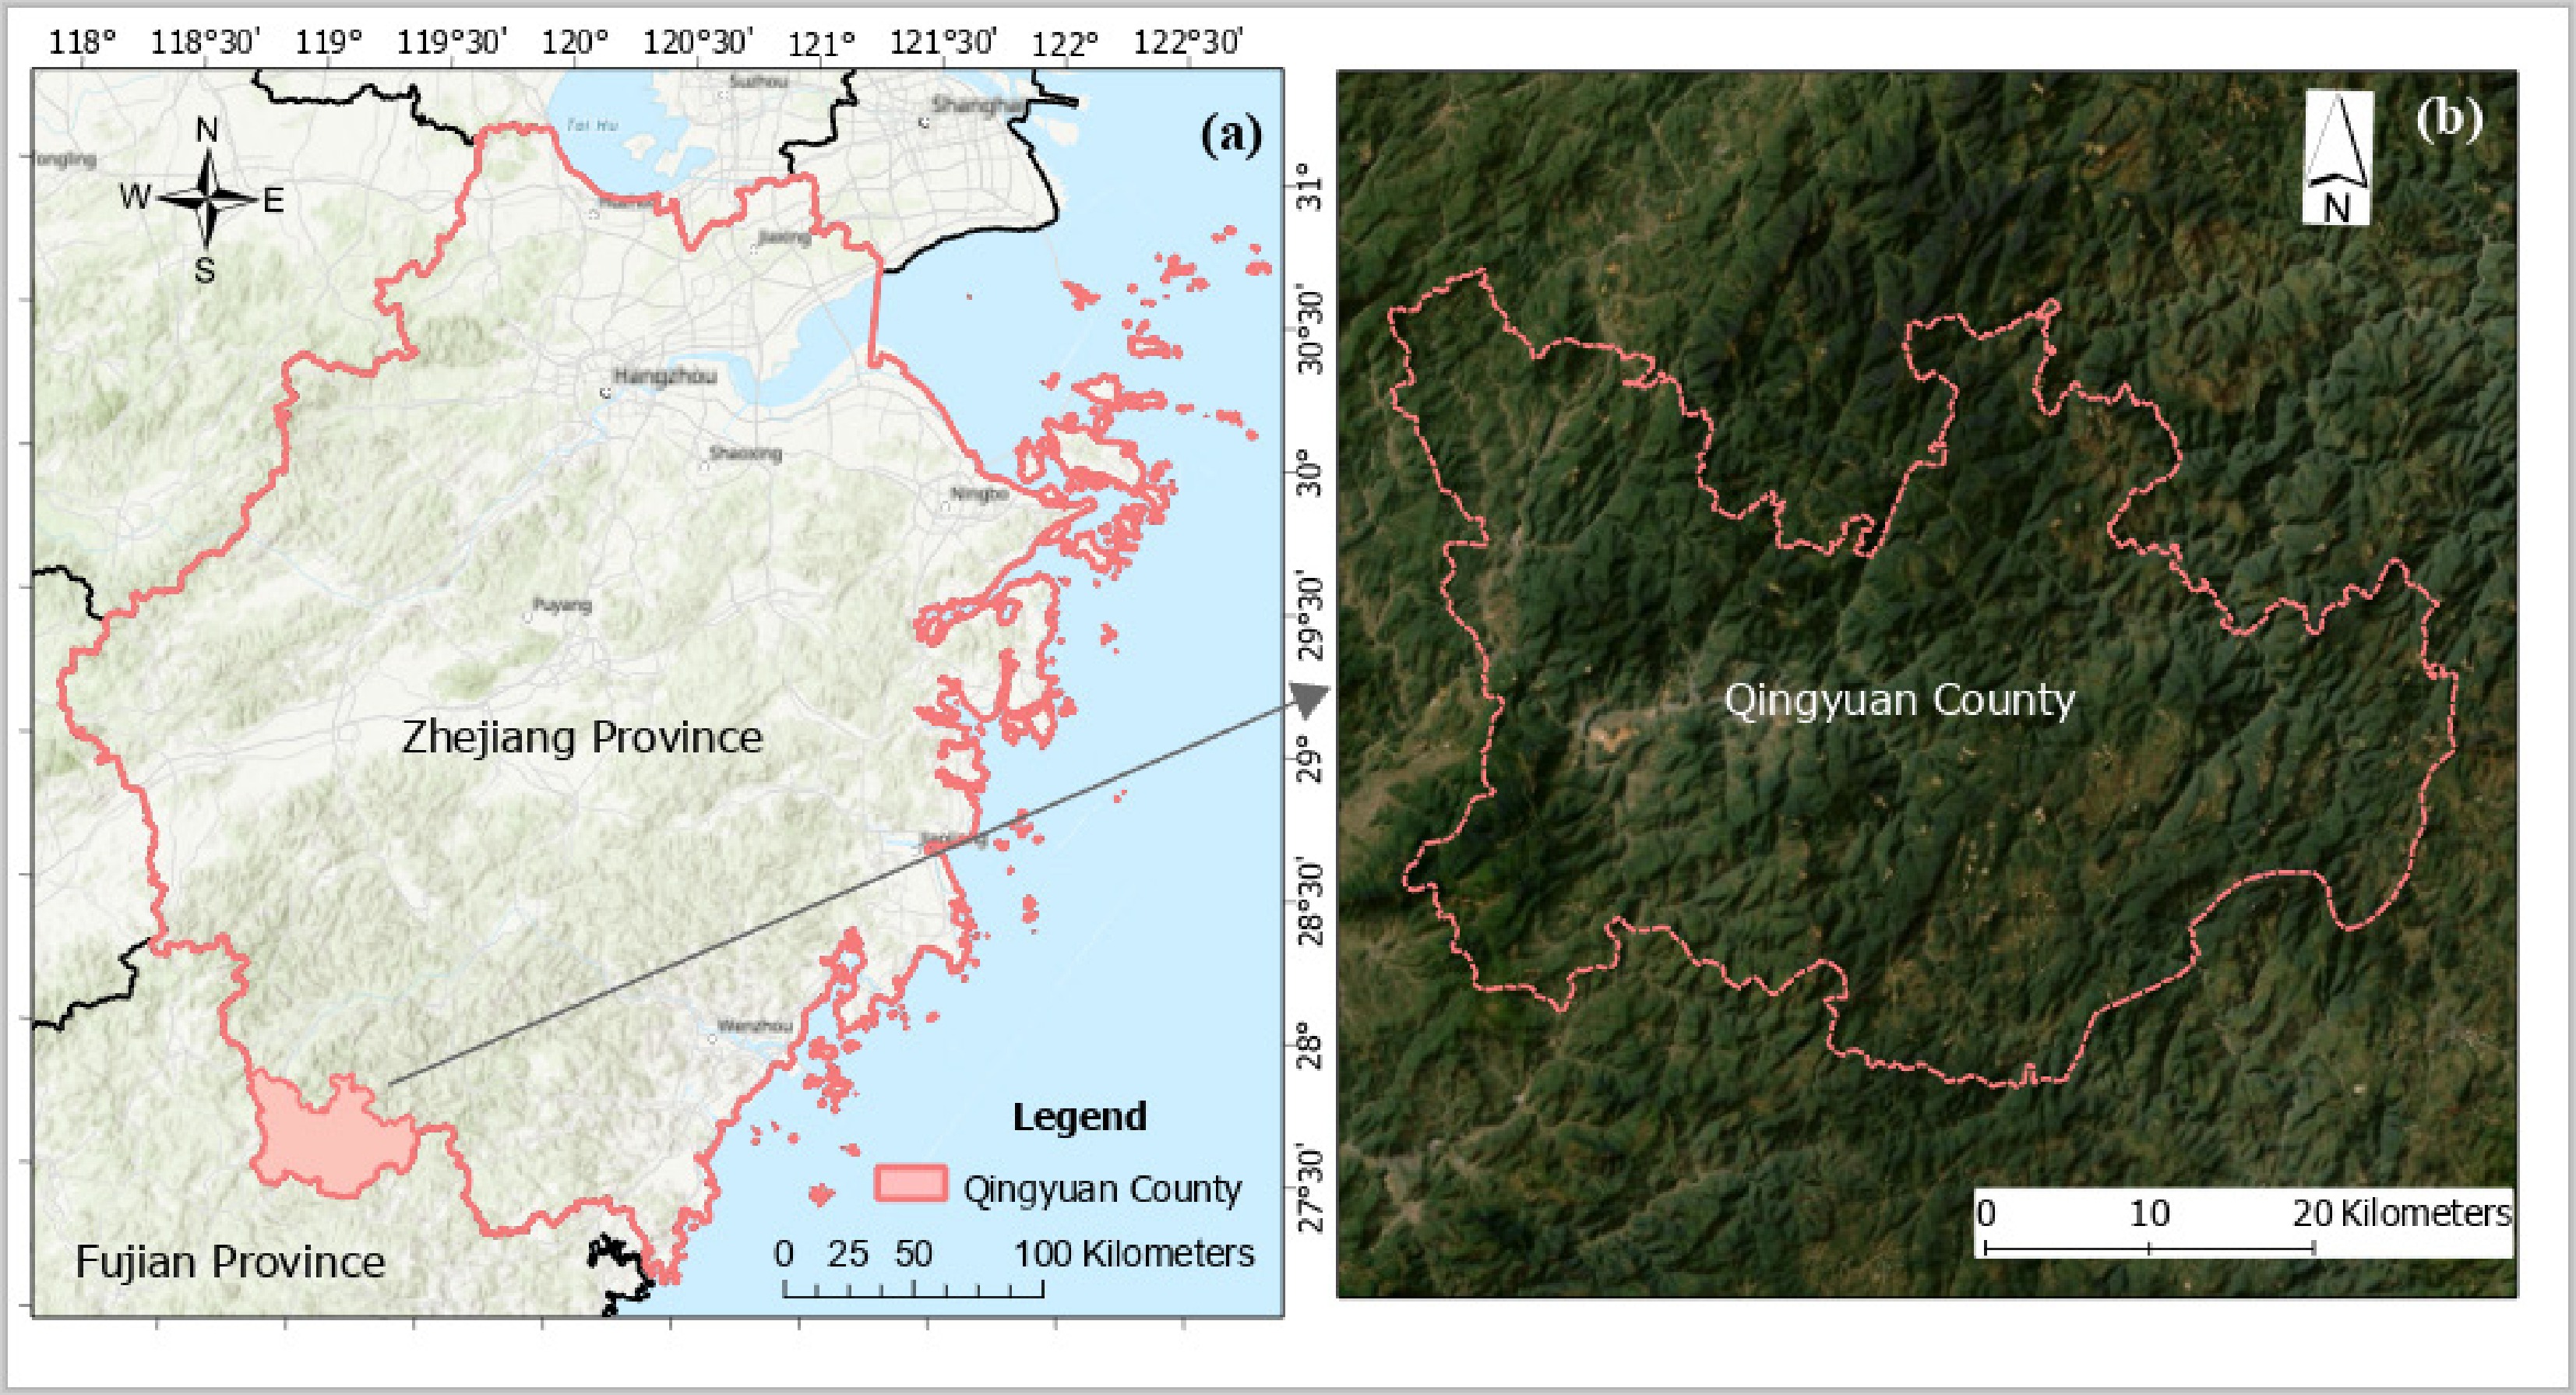
Figure 1.
Study area map of Qingyuan County, Zhejiang Province. The map is from the 2019 Chinese administrative division vector map (
https://download.csdn.net/download/gognzixiaobai666/14033998 ). (a) represents the vector map of Zhejiang Province, and (b) is the topographic map of Qingyuan County.Subcompartment data
-
These data were derived from the Forest Resource Planning and Design Program of the Chinese fir plantation in Qingyuan County in 2019. Investigation factors were based on subcompartments containing 75 investigation attributes, such as the basic information of subcompartments, site factors, stand factors, management measures, disease, insect, and fire information. In this study, data regarding stand age, volume, tree number per ha, and dominant tree height must be used to build the density effect model and the site index model. Given that the seedlings are recovering and rooting in the early stage, they enter a rapid growth phase after 5 years. At the same time, the relevant literature shows that only stands with a canopy density of more than 30% can fully reflect the growth state of trees[20]. Therefore, this study excluded the data of subcompartments with a canopy density of less than 0.3 and an age of less than 5 years. In addition, the data integrity and consistency were checked, and abnormal data were excluded by taking three standard deviations as the criterion. A total of 7,449 subcompartment data were obtained through data processing. In the model construction, the 7:3 principle was adopted: 70% of the data were used to fit the model, and the remaining 30% of the data were used for model testing. Subcompartment data were obtained, as depicted in Table 1. These data serve as the empirical basis for developing the density effect model and deriving the optimal stand density for Cunninghamia lanceolata.
Table 1. Subcompartments data for model fitting and testing.
Variables Fitting data Testing data Minimum
valueMaximum
valueMean
valueStandard
deviationMinimum
valueMaximum
valueMean
valueStandard
deviationStand age (year) 6 46 18.2 7.57 6 43 19.4 7.83 Density (N/hm2) 750 4,800 2,125 654.32 1,200 4,500 2,358 633.24 Average tree height (H, m) 4.3 21.5 12.0 3.71 4.4 22.0 12.1 4.13 Dominant tree height (HT, m) 5.1 23.5 13.7 3.60 5.0 23.2 13.8 3.11 Volume (m3 /ha) 11.3 432.3 100.8 75.9 11.7 429.0 100.9 76.1 Stem analysis data
-
Given that stand volume is primarily influenced by site quality and stand density, optimizing density necessitates an accurate assessment of site potential. Therefore, we developed a site index model for Chinese fir plantations using stem analysis data. A total of 30 sample plots were randomly established across the study area. Within each plot, one dominant tree that was healthy and free from mechanical damage or suppression was selected for destructive sampling. The selected trees were felled, and stem disks were extracted at specified intervals for stem analysis. A total of 189 pairs of dominant height–age observations were derived from these measurements.
To account for the temporal autocorrelation inherent in repeated measurements within individual trees during model construction, we employed a group-based cross-validation strategy. Specifically, the data from the 30 sampled dominant trees were randomly partitioned: data from 21 trees (135 observations) were designated as the fitting dataset for parameter estimation, while the data from the remaining nine trees (54 observations) were reserved as an independent testing dataset to evaluate the model's generalizability. The stem analysis data are presented in Table 2 and Fig. 2.
Table 2. Stem analysis data for model fitting and testing.
Variables Fitting data Testing data Minimum
valueMaximum
valueMean
valueStandard
deviationMinimum
valueMaximum
valueMean
valueStandard
deviationAge (t) 1 32 11.8 7.2 1 32 11.7 7.2 Dominant tree height (HT, m) 1.1 20.6 9.7 4.1 1.3 20.2 9.6 4.2 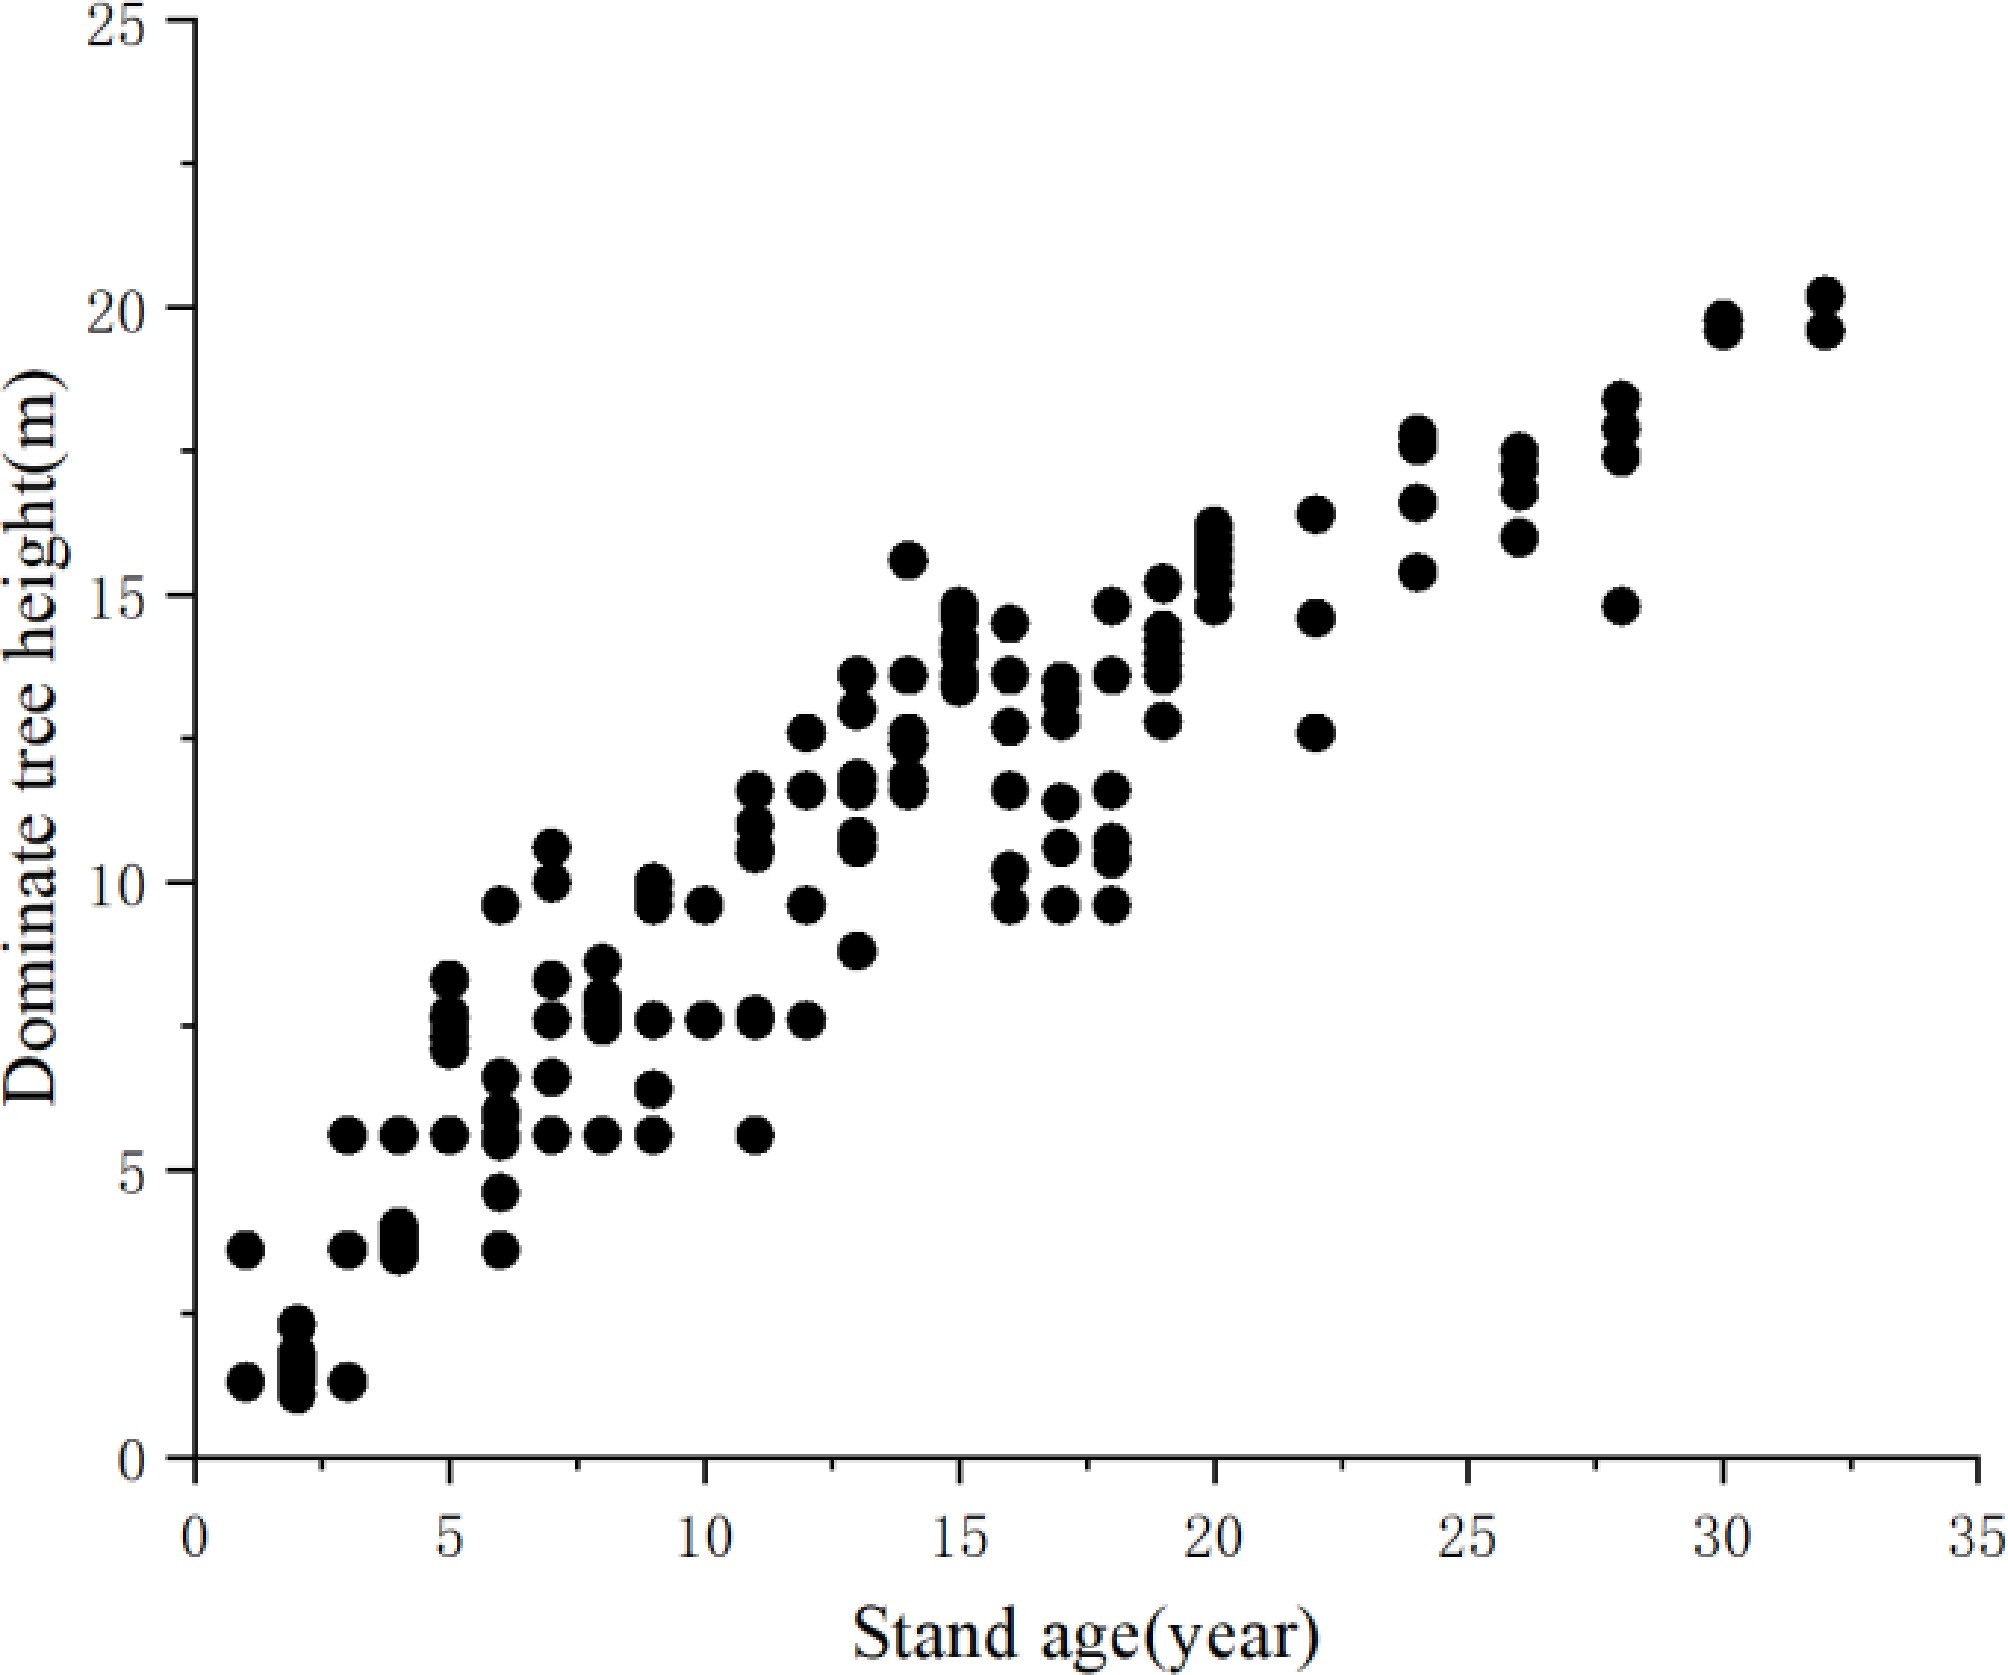
Figure 2.
Stem analysis data of Chinese fir.
Density effect model
-
Determining the optimum density of growth in a stand has always been an important issue for forest managers. Given that the quadratic effect model of density has stable mathematical properties in the optimization process, it can directly express the relationship between stand density and yield; hence, it can be used to determine the best management density of a stand from the perspective of mathematical theory according to the rule of stand growth[21]. The quadratic effect model of density is shown in Eq. (1):
$ M={a}_{11}H{T}^{{{b}_{11}}}N-{a}_{12}H{T}^{{{b}_{12}}}{N}^{2} . $ (1) Equation 1 is the volume-tree density effect curve. The volume yield of a stand is closely related to site quality, consequently,
$ {a}_{11}H{T}^{{{b}_{11}}} $ $ {a}_{12}H{T}^{{{b}_{12}}} $ Site index model based on generalized algebraic difference approach
-
The algebraic difference approach (ADA) is one of the common methods used to establish forest stand site indices. It selects a theoretical growth equation as the basic (fundamental) equation and chooses one parameter in the equation as the element elimination parameter. Thus, the equation is eliminated to obtain a difference equation including two groups of dependent and independent variables.
The site index is the average dominant height of the tree at the standard age. The first method to construct a site index was the ADA proposed by Bailey & Clutter[23]. The difference equation reflecting two groups of different ages and heights of dominant trees is established by parameter trimming of the equation to estimate the height of dominant trees at the standard age. However, the model constructed by ADA is a static equation, which depends on the preselected standard age. Only one elimination parameter can be set during the construction process, and the site index curve cannot simultaneously satisfy the polymorphism of tree height growth[24]. In this regard, Cieszewski & Bailey[25] proposed the generalized algebraic difference approach (GADA), which can set the maximum parameters of tree height and shape parameters during equation derivation and construct multiform curve clusters with multiple asymptotes independent of the fixed standard age. Many studies have shown that the site index model constructed by GADA is superior to the model based on fixed standard age; moreover, GADA is more reasonable in explaining the physiological growth characteristics of forest trees[26−28]. Therefore, this study used GADA to establish the site index model of the Chinese fir plantation.
Selection of theoretical model
-
The theoretical growth equation has a deep theoretical foundation. Hence, it has been widely used in the simulation of stand growth and harvest because of its expression flexibility and portability[29,30]. The modified Weibull equation Eq. (2), the Korf equation Eq. (3), and the Richards equation Eq. (4) are adopted as the theoretical models for the site index model.
${\rm{ Modified\; Weibull:}}\; h=a\left(1-{e}^{{{-bt}^{c}}}\right) , $ (2) $ {\rm{Korf}}:\; h=a{e}^{{{-bt}^{-c}}} , $ (3) $ {\rm{Richards}}:\; h=a{\left(1-{e}^{-bt}\right)}^{c} , $ (4) where, h is the dominant tree height, and t is the age of the stand. a, b, and c are the model parameters, where a is the tree height limit parameter, which represents the maximum tree height growth under certain site conditions, and b is the growth rate parameter. In the Korf equation, it is the scale parameter. Meanwhile, in the modified Weibull and Richards equations, it is the parameter related to the growth rate of trees. c is the shape parameter. In the Korf equation, it is related to the decay factor in the process of plant growth. In the modified Weibull and Richards equations, parameter c is related to the assimilation effect of tree growth[31].
Derivation process of GADA
-
For the status index, the following characteristics are required: (a) polymorphism, (b) base age independence, and (c) multiple horizontal asymptotes. GADA allows multiple elimination parameters to be set during derivation, thus enabling multiple horizontal asymptotes and polymorphism. The derivation steps of the GADA method are as follows:
(1) A theoretical equation is selected, and its elimination parameter is specified.
(2) A variable
$ {X}_{0} $ $ {X}_{0} $ (3) The functional relationship from step 2 is used in the theoretical equation. The expression of
$ {X}_{0} $ $ {X}_{0} $ (4) The site index and the standard age are taken into the tree height and age in the expression, respectively, and the expression is taken into
$ {X}_{0} $ On the basis of the three theoretical equations, six difference equations are derived using GADA, as shown in Table 3.
Table 3. Different site index equations.
Model no. Theoretical equations Elimination parameters Initial solution for $ {X}_{0} $ Difference equations M1 Modified Weibull:
$ {h} ={a}\left(1-{e}^{{{-bt}^{c}}}\right) $$ a={e}^{{{X}_{0}}} $
$ c={c}_{1}+{c}_{2}{X}_{0} $$ {X}_{0}=\ln {h}_{1}-\ln \left(1-{e}^{{{{{-bt}_{1}}}^{{{c}_{1}}+{{c}_{2}}{{X}_{0}}}}}\right) $ $ {h}_{2}={e}^{{{X}_{0}}}\left(1-{e}^{{{{{-bt}_{2}}}^{{{c}_{1}}+{{c}_{2}}{{X}_{0}}}}}\right) $ M2 $ a={e}^{{{X}_{0}}} $
$ c={c}_{1}+{c}_{2}/{X}_{0} $$ {X}_{0}=\ln {h}_{1}-\ln \left(1-{e}^{{{{{-bt}_{1}}}^{{{c}_{1}}+{{c}_{2}}/{{X}_{0}}}}}\right) $ $ {h}_{2}={e}^{{{X}_{0}}}\left(1-{e}^{{{{{-bt}_{2}}}^{{{c}_{1}}+{{c}_{2}}/{{X}_{0}}}}}\right) $ M3 Korf:
$ {h} ={a}{e}^{{{-bt}^{-c}}} $$ a={e}^{{{X}_{0}}} $
$ c={c}_{1}+{c}_{2}{X}_{0} $$ {X}_{0}=\ln {h}_{1}+b{t}^{-\left({c}_{1}+{c}_{2}{X}_{0}\right)} $ $ {h}_{2}={e}^{{{X}_{0}}}{e}^{{{{{-bt}_{2}}}^{-\left({c}_{1}+{c}_{2}{X}_{0}\right)}}} $
$ {h}_{2}={e}^{{{X}_{0}}}{e}^{{{{{-bt}_{2}}}^{-\left({c}_{1}+{c}_{2}/{X}_{0}\right)}}} $M4 $ a={e}^{{{X}_{0}}} $
$ c={c}_{1}+{c}_{2}/{X}_{0} $$ {X}_{0}=\ln {h}_{1}+b{t}^{-\left({c}_{1}+{c}_{2}/{X}_{0}\right)} $ $ {h}_{2}={e}^{{{X}_{0}}}{e}^{{{{{-bt}_{2}}}^{-\left({c}_{1}+{c}_{2}/{X}_{0}\right)}}} $ M5 Richards:
$ {h} = {a}{\left(1-{e}^{-bt}\right)}^{c} $$ a={e}^{{{X}_{0}}} $
$ \text{c=}{c}_{1}+{c}_{2}{X}_{0} $$ {X}_{0}=\left(\ln {h}_{1}-{c}_{1}{F}_{0}\right)/\left(1+{c}_{2}{F}_{0}\right) $
$ {F}_{0}=\ln \left(1-{e}^{{{-bt}_{1}}}\right) $$ {h}_{2}={e}^{{{X}_{0}}}{\left(1-{e}^{{{-bt}_{2}}}\right)}^{{{c}_{1}}+{{c}_{2}}{{X}_{0}}} $ M6 $ a={e}^{{{X}_{0}}} $
$ c={c}_{1}+{c}_{2}/{X}_{0} $$ {X}_{0}=\dfrac{1}{2}\left[{F}_{0}+\sqrt{{{{F}_{0}}}^{2}-4\times {c}_{2}\ln \left(1-{e}^{{{-bt}_{1}}}\right)}\right] $
$ {F}_{0}={\ln {h}_{1}-c}_{1}\ln \left(1-{e}^{{{-bt}_{1}}}\right) $$ {h}_{2}={e}^{{{X}_{0}}}{\left(1-{e}^{{{-bt}_{2}}}\right)}^{{{c}_{1}}+{{c}_{2}}/{{X}_{0}}} $ Note: $ {h}_{1} $ and $ {h}_{2} $ represent the dominant heights of the stand at ages $ {t}_{1} $ and $ {t}_{2} $, respectively. By setting the site index as
$ {h}_{1} $ $ {t}_{1} $ Optimal density and volume estimation based on dynamic programming
-
The DP model can set the objective function according to the purpose of forest management[33]. In the selection of the objective function, this study uses the quadratic effect model of density as the basic model, the tree number per ha as the control variable, and the volume yield of the stand as the target variable to build the optimal harvest decision model. Then, the optimal management density was calculated under different stands. Given that Chinese fir stands undergo thinning during their growth, stand density control is a multistep decision-making process. We take stand volume yield as an objective function and thinning as the management method. The process of DP in solving the optimum density of the stand is as follows.
The state transition equation is set:
$ {N}_{i+1}={N}_{i}-{n}_{i}={N}_{i}' , $ (5) $ {M}_{i+1}={M}_{i}-{v}_{i}+{\Delta }M(i,i+1) , $ (6) where,
$ {N}_{i} $ $ {N}_{i}' $ $ {n}_{i} $ $ {M}_{i} $ $ {v}_{i} $ $ {\Delta }M(i,i+1) $ The boundary condition is set:
$ \left({N}_{1},{M}_{1}\right)=\left({N}_{0},{M}_{0}\right) , $ (7) $ \left({N}_{k+1},{M}_{k+1}\right)=\left(0{,}0\right) . $ (8) The objective function is set:
$ {f}_{k}={R}_{1}+{R}_{2}+\ldots +{R}_{k} , $ (9) where, Ri is the stand volume of the ith harvest.
The density control of the optimal stand seeks the optimal decision sequence Ni*(i = 1, 2, 3…k) so that the stand growth under the decision achieves the maximum target value from the initial state to the terminal state.
$ {f}^{*}=\underset{N1',N2',\ldots Ni'}{max}({R}_{1}+{R}_{2}+\ldots +{R}_{k}) (i = 1,2,3\ldots k). $ (10) The decision model for optimal stand density can be derived by solving
$ {f}^{*} $ When I = 3,
$ {{{f}_{1}}}^{*}=\underset{{N}_{3}'}{max}\left\{{v}_{3}+{f}_{0}\right\} $ $ {f}_{0} $ $ {{{f}_{1}}}^{*} $ $ N_{3}^{*'} $ $ {{{f}_{1}}}^{*}={a}_{11}{{{H}_{3}}}^{{{b}_{11}}}{N}_{3}-{a}_{12}{{{H}_{3}}}^{{{b}_{12}}}{{{N}_{3}}}^{2}={a}_{11}{{{H}_{3}}}^{{{b}_{11}}}{N}_{2}'-{a}_{12}{{{H}_{3}}}^{{{b}_{12}}}{N}_{2}{'}^{2} . $ (11) When i = 2,
$ {{{f}_{2}}}^{*}=\underset{{N}_{2}'}{max}\left\{{v}_{2}+{{{f}_{1}}}^{*}\right\} $ $ \begin{split}=\;&\underset{{N}_{2}'}{max}\big\{{a}_{11}{{{H}_{2}}}^{{{b}_{11}}}{N}_{2}-{a}_{12}{{{H}_{2}}}^{{{b}_{12}}}{{{N}_{2}}}^{2}-({a}_{11}{{{H}_{2}}}^{{{b}_{11}}}{N}_{2}'-{a}_{12}{{{H}_{2}}}^{{{b}_{12}}}{N}_{2}{'}^{2})\\&+{a}_{11}{{{H}_{3}}}^{{{b}_{11}}}{N}_{2}'-{a}_{12}{{{H}_{3}}}^{{{b}_{12}}}{N}_{2}{'}^{2}\big\} . \end{split}$ (12) Taking the first derivative of
$ {N}_{2}' $ $ Y{'}_{{{N}_{2}}'}={a}_{11}({{{H}_{3}}}^{{{b}_{11}}}-{{{H}_{2}}}^{{{b}_{11}}})+2{a}_{12}({{{H}_{2}}}^{{{b}_{12}}}-{{{H}_{3}}}^{{{b}_{12}}}){N}_{2}' . $ (13) Given that
$ {a}_{11} $ $ {a}_{12} $ $ {H}_{3} $ $ {H}_{2} $ $ Y{'}_{{{N}_{2}}'} $ $ {f}_{2} $ $ Y{'}_{{{N}_{2}}'} $ $ N_{2}^{*'}= {a}_{11}({{{H}_{3}}}^{{{b}_{11}}}-{{{H}_{2}}}^{{{b}_{11}}}) / 2{a}_{12}({{{H}_{3}}}^{{{b}_{12}}}-{{{H}_{2}}}^{{{b}_{12}}}) . $ (14) The solution of Eq. (14) is the only optimal solution of
$ {f}_{2} $ $ {{{f}_{2}}}^{*} $ $ {a}_{11}{{{H}_{2}}}^{{{b}_{11}}}{N}_{2}-{a}_{12}{{{H}_{2}}}^{{{b}_{12}}}{{{N}_{2}}}^{2}+{\Delta }{M}_{(2{,}3)} $ When i = 1,
$ {{{f}_{3}}}^{*}=\underset{{N}_{2}'}{max}\left\{{v}_{1}+{{{f}_{2}}}^{*}\right\} $ $ \underset{{N}_{1}'}{max}\left\{\begin{array}{cc} {a}_{11}{{{H}_{1}}}^{{{b}_{11}}}{N}_{1}-{a}_{12}{{{H}_{1}}}^{{{b}_{12}}}{{{N}_{1}}}^{2}-({a}_{11}{{{H}_{1}}}^{{{b}_{11}}}{N}_{1}'-{a}_{12}{{{H}_{1}}}^{{{b}_{12}}}{N}_{1}{'}^{2})+\\{a}_{11}{{{H}_{2}}}^{{{b}_{11}}}{N}_{1}'-{a}_{12}{{{H}_{2}}}^{{{b}_{12}}}{N}_{1}{'}^{2}- ({a}_{11}{{{H}_{2}}}^{{{b}_{11}}}{N}_{2}'-\\{a}_{12}{{{H}_{2}}}^{{{b}_{12}}}{N}_{2}{'}^{2})+{a}_{11}{{{H}_{3}}}^{{{b}_{11}}}{N}_{2}'-{a}_{12}{{{H}_{3}}}^{{{b}_{12}}}{N}_{2}{'}^{2} \end{array}\right\} . $ (15) Taking the first derivative of
$ {N}_{1}' $ $ Y{'}_{{{N}_{1}}'}={a}_{11}({{{H}_{2}}}^{{{b}_{11}}}-{{{H}_{1}}}^{{{b}_{11}}})+2{a}_{12}({{{H}_{1}}}^{{{b}_{12}}}-{{{H}_{2}}}^{{{b}_{12}}}){N}_{1}' . $ (16) If
$ Y{'}_{{{N}_{1}}'} $ $ N_{1}^{*'}={a}_{11}({{{H}_{2}}}^{{{b}_{11}}}-{{{H}_{1}}}^{{{b}_{11}}}) / 2{a}_{12}({{{H}_{2}}}^{{{b}_{12}}}-{{{H}_{1}}}^{{{b}_{12}}}) . $ (17) The optimal target value is
$ {{{f}_{3}}}^{*} = {a}_{11}{{{H}_{1}}}^{{{b}_{11}}}{N}_{1}-{a}_{12}{{{H}_{1}}}^{{{b}_{12}}}{{{N}_{1}}}^{2}+{\Delta }{M}_{(1{,}2)}+{\Delta }{M}_{(2{,}3)} . $ (18) Similarly, for the ith thinning out of a total of k thinning decisions, the optimal operating density is
$ N_{i}^{*'}= {a}_{11}({{{H}_{i+1}}}^{{{b}_{11}}}-{{{H}_{i}}}^{{{b}_{11}}}) / 2{a}_{12}({{{H}_{i+1}}}^{{{b}_{12}}}-{{{H}_{i}}}^{{{b}_{12}}}) . $ (19) At this time, the optimal harvest quantity is
$ {{{f}_{k-(i-1)}}}^{*} = {a}_{11}{{{H}_{i}}}^{{{b}_{11}}}{N}_{i}-{a}_{12}{{{H}_{i}}}^{{{b}_{12}}}{{{N}_{i}}}^{2}+{\Delta }{M}_{(i,i+1)}+{\Delta }{M}_{(i+1,i+2)}+\ldots +{\Delta }{M}_{(\text{k-1,}k)} . $ (20) Equation (20) is a decision model for optimal density control with a variable thinning interval based on the density effect model and the DP method. To realize the application of the decision-making model, Eq. (20) was simplified without considering the thinned volume. The optimal yield under different densities and dominant tree height was obtained, as shown in Eq. (21):
$ {{{f}_{k-(i-1)}}}^{*} = {a}_{11}{{{H}_{i}}}^{{{b}_{11}}}{N}_{i}-{a}_{12}{{{H}_{i}}}^{{{b}_{12}}}{{{N}_{i}}}^{2} . $ (21) The density control decision-making model developed in this study provides a general dynamic programming framework capable of accommodating flexible thinning regimes and rotation lengths. In this study, to demonstrate its implementation, the framework optimizes stage-specific residual stand densities to maximize residual stand volume, using an illustrative silvicultural regime of two thinning operations and a 40-year rotation. Although this simplified potential-yield formulation currently excludes thinned volume and reflects a specific operational scenario, the underlying model offers an adaptable decision-support tool. It provides quantitative guidance for forest managers to tailor density control strategies to specific site conditions, establishing a theoretical foundation for adaptive silvicultural planning.
Model evaluation method
-
To provide a comprehensive evaluation of model performance, we employed distinct sets of metrics for the calibration and validation phases. During the calibration phase, we prioritized goodness-of-fit; consequently, the coefficient of determination
$ {R}^{2} $ $ RMSE $ $ MAE $ In this study, R language was used to estimate and test the parameters of the density effect model and the site index model.
$ {R}^{2}=1-\sum\nolimits_{i=1}^{n}{\left({y}_{i}-{\hat{y}}_{i}\right)}^{2}/\sum\nolimits_{i=1}^{n}{\left({y}_{i}-\overline{y}\right)}^{2} . $ (22) $ RMSE=\sqrt{\sum\nolimits_{i=1}^{n}{\left({y}_{i}-{\hat{y}}_{i}\right)}^{2}/\left(n-p\right)} , $ (23) $ MAE=\dfrac{1}{n}\sum\nolimits_{i=1}^{n}\left| {y}_{i}-{\hat{y}}_{i}\right| . $ (24) In Eqs (22) to (24),
$ {y}_{i} $ $ {\hat{y}}_{i} $ $ \overline{y} $ -
The density effect model results are shown in Table 4.
Table 4. Fitting and testing results of the density effect model.
Model Parameter value Fitting index Testing index a11 b11 a12 b12 R2 RMSE MAE Density effect model 1.06E-4 2.724 2.407E-9 3.393 0.839 28.104 20.602 From the fitting index, the
$ {R}^{2} $ $ RMSE $ $ MAE $ Site index model results
-
The fitting and testing results of the site index model are shown in Table 5. In the difference equations constructed by GADA, the fitting results were all good except for model M6. In the difference equation using modified Weibull as the basic equation, the
$ {R}^{2} $ $ RMSE $ $ MAE $ $ {R}^{2} $ Table 5. Parameter estimates and fitting and testing indicators of site index equations.
Model no. Parameters Estimated value Standard error Significance testing (p) R2 RMSE MAE M1 b 0.410 0.123 0.002** 0.998 0.343 0.259 $ {c}_{1} $ 1.471 0.162 < 0.001*** $ {c}_{2} $ −0.395 0.052 < 0.001*** M2 b 0.403 0.104 < 0.001*** 0.999 0.261 0.257 $ {c}_{1} $ −0.580 0.199 0.006** $ {c}_{2} $ 2.671 0.401 < 0.001*** M3 b 1.583 0.568 0.008** 0.982 1.336 0.409 $ {c}_{1} $ 2.803 622,600 0.999 $ {c}_{2} $ 2.799 403,800 0.999 M4 b 1.074 0.408 0.013* 0.999 0.101 0.232 $ {c}_{1} $ −0.156 0.248 0.533 $ {c}_{2} $ 1.881 0.556 0.001** M5 b 0.053 0.014 < 0.001*** 0.969 1.778 0.400 $ {c}_{1} $ −0.174 0.047 < 0.001*** $ {c}_{2} $ 0.222 0.049 < 0.001*** M6 b 0.072 0.026 0.009** 0.606 6.371 0.631 $ {c}_{1} $ 1.865 1.025 0.078 $ {c}_{2} $ −1.763 2.806 0.534 Note: * p < 0.05; ** p < 0.01; *** p < 0.001. Optimum density of the stand based on maximum volume yield
-
The height of dominant trees at different ages under different site indices was calculated according to the established model. Considering the actual growth of the Chinese fir plantation, this study set the thinning time in units of years. The final felling time was set to 40 years, and the site index was taken as 6, 8, 10, 12, 14, 16, 18, and 20 m. The average dominant height of stands in each year was substituted into Eq. (19) to calculate the best management density under different site conditions. The optimal density for different ages and site indices is shown in Table 6.
Table 6. Optimal density based on maximum stand volume yield with various sites.
Stand age Optimal density SI = 20 SI = 18 SI = 16 SI = 14 SI = 12 SI = 10 SI = 8 SI = 6 6 3,195 3,382 3,602 3,870 4,204 4,637 5,227 6,099 7 3,061 3,246 3,466 3,733 4,067 4,501 5,096 5,980 8 2,951 3,135 3,353 3,620 3,954 4,389 4,988 5,881 9 2,859 3,042 3,260 3,525 3,859 4,295 4,896 5,797 10 2,782 2,963 3,180 3,445 3,778 4,214 4,817 5,724 11 2,715 2,895 3,111 3,375 3,708 4,144 4,749 5,660 12 2,657 2,836 3,051 3,314 3,647 4,083 4,689 5,605 13 2,606 2,784 2,998 3,261 3,593 4,029 4,636 5,555 14 2,560 2,738 2,951 3,213 3,544 3,981 4,588 5,511 15 2,520 2,697 2,909 3,171 3,502 3,938 4,546 5,471 16 2,484 2,660 2,872 3,133 3,463 3,899 4,508 5,435 17 2,452 2,627 2,838 3,098 3,428 3,864 4,473 5,402 18 2,422 2,597 2,808 3,067 3,396 3,832 4,442 5,373 19 2,396 2,570 2,780 3,039 3,368 3,803 4,413 5,346 20 2,371 2,545 2,755 3,013 3,341 3,776 4,387 5,321 21 2,349 2,523 2,732 2,989 3,317 3,752 4,362 5,298 22 2,329 2,502 2,710 2,968 3,295 3,730 4,340 5,277 23 2,310 2,483 2,691 2,948 3,275 3,709 4,320 5,258 24 2,293 2,465 2,673 2,929 3,256 3,690 4,301 5,240 25 2,277 2,449 2,656 2,912 3,239 3,673 4,284 5,223 26 2,263 2,434 2,641 2,897 3,223 3,656 4,267 5,208 27 2,249 2,420 2,627 2,882 3,208 3,641 4,252 5,194 28 2,237 2,407 2,613 2,868 3,194 3,627 4,238 5,180 29 2,225 2,395 2,601 2,856 3,181 3,614 4,225 5,168 30 2,214 2,384 2,590 2,844 3,169 3,602 4,213 5,156 31 2,204 2,374 2,579 2,833 3,158 3,591 4,202 5,146 32 2,195 2,364 2,569 2,823 3,148 3,580 4,191 5,136 33 2,186 2,355 2,560 2,814 3,138 3,570 4,182 5,126 34 2,178 2,347 2,551 2,805 3,129 3,561 4,172 5,117 35 2,170 2,339 2,543 2,796 3,121 3,553 4,164 5,109 36 2,163 2,331 2,536 2,789 3,113 3,545 4,156 5,101 37 2,156 2,324 2,528 2,781 3,105 3,537 4,148 5,094 38 2,150 2,318 2,522 2,775 3,098 3,530 4,141 5,087 39 2,144 2,312 2,516 2,768 3,092 3,523 4,134 5,081 40 2,138 2,306 2,510 2,762 3,085 3,517 4,128 5,075 The data in Table 6 showed that the optimal management density of the Chinese fir plantation decreased with the increase in stand age. If the site index is 16, for example, the optimal density of the Chinese fir stand was 3,602 trees at 6 years, 2,755 trees at standard age (20 years), and only 2,510 trees at the final felling age (40 years). In addition, a higher site quality entails a smaller optimal density under the standard age. For example, the best density of a site index of 20 was 2,371 trees, and a site index of 6 has 5,321 trees. Woodlands with good site quality have a fast growth of trees, fierce competition among trees, and fast maturity. Therefore, under good site conditions, more wood can be harvested from fewer trees. This condition is very favorable for cultivating large-diameter wood with full stems.
Figure 3 is a graphical representation of the data from Table 6. As can be seen from Fig. 3, the number of Chinese fir stands varies greatly from the early growth stage to the rapid growth stage. The number of stands is dense in the initial stage, and limited land resources cannot meet the environmental needs of each tree, which leads to the drastic self-thinning of the stand. In addition, to cultivate specific wood assortments, operators usually conduct thinning activities during the rapid growth period to reduce stand density and improve forest quality. The change of the optimal tree number in the stand gradually decreases and tends to be stable from near maturity to maturity. We also found that a higher site quality of the stand entails an earlier change of the best density of the stand to become stable. A higher site index indicates faster growth renewal changes of Chinese fir. Hence, the effect of density on stand growth is reflected earlier.
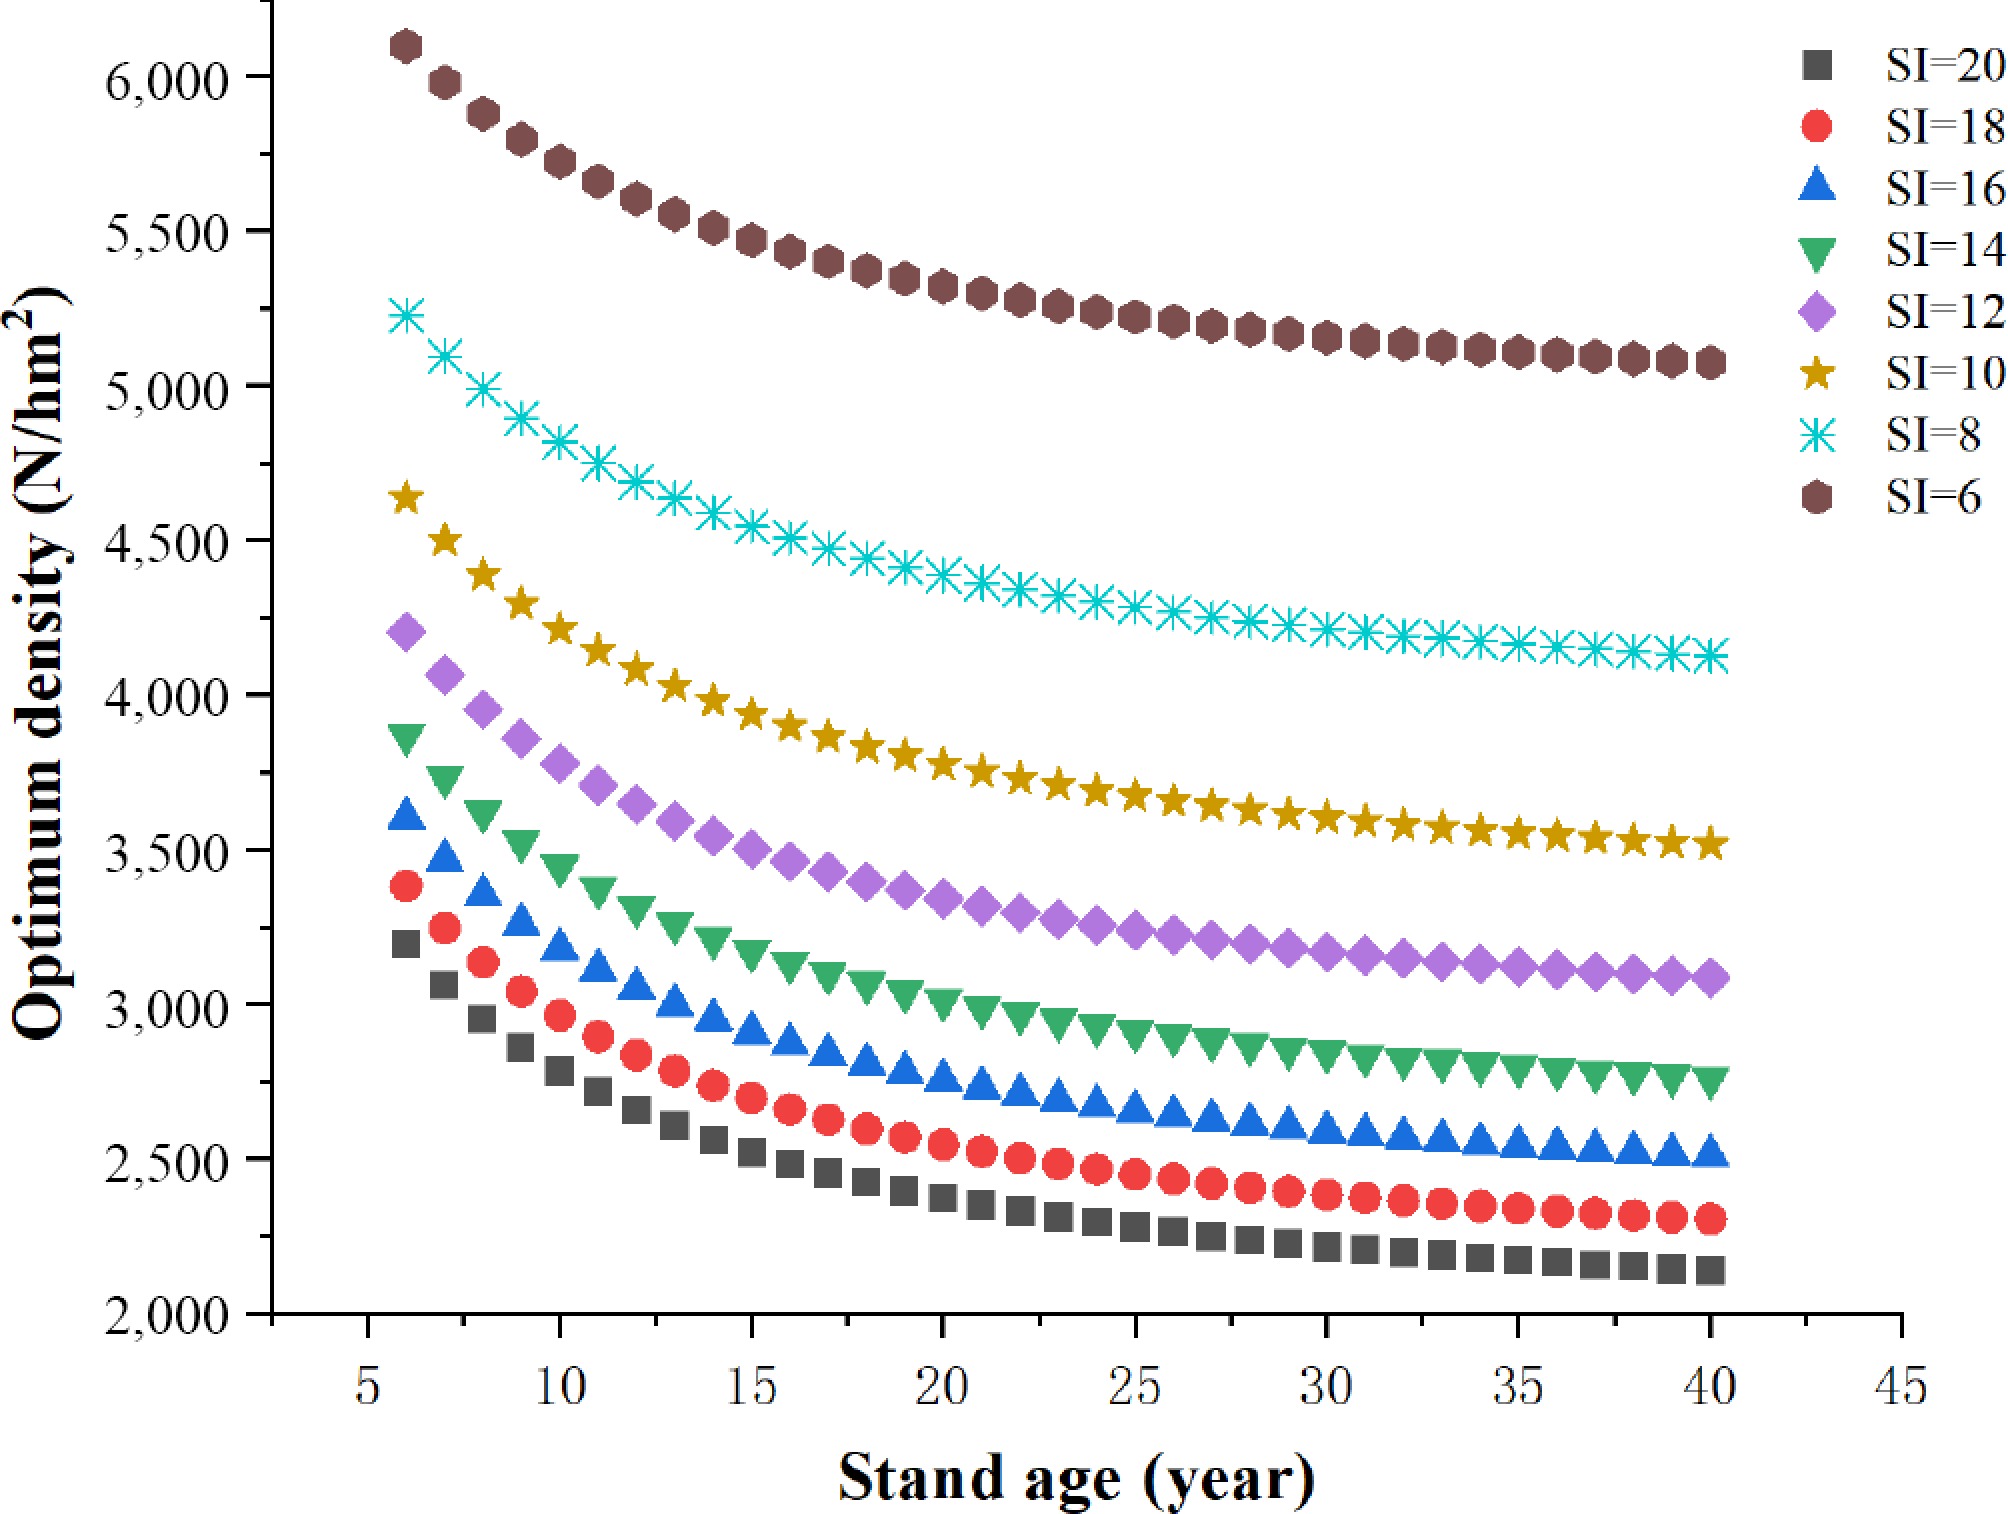
Figure 3.
Optimum stand density under different age and site index.
Calculation of stand potential yield
-
The site index of each subcompartment was calculated according to the site index model. The optimum volume of each subcompartment is calculated as the potential volume yield according to the optimum stand density (Table 6) under different age and status indices and the optimum yield formula Eq. (21).
The statistical results show that potential volume exceeded actual volume in 7,441 subcompartments, accounting for 99.9% of the evaluated subcompartments. This model-derived finding highlights a widespread productivity gap across the regional Chinese fir plantations, indicating significant technical potential for yield enhancement through optimal density regulation. Among the 7,441 subcompartments, the minimum difference from the actual volume was 1 m3/ha, which could demonstrate that the growth of this subcompartment was close to the potential growth. In addition, the maximum difference was 362.4 m3/ha; the observed difference between potential and actual yield indicates a silvicultural intervention potential. This gap represents the productivity increment that could theoretically be captured through optimized density regulation.
Comparison of stand potential volume and actual volume at different ages
-
By calculating the average actual and potential volume of Chinese fir forest each year, the difference between the potential volume and the actual volume was obtained. The results are presented in Fig. 4a. The figure shows that the average actual growth curve of the forest in the study area conforms to the S-shaped characteristics. In the early growth stages, the forest grew rapidly in the first 6 to 8 years. Then, the growth rate decreased slightly, and the volume increased steadily. The next rapid growth period was between 20–29 years. The forest then entered the mature stage, and the tree growth tended to be stable. After entering the over-mature stage, the stand volume showed an evident downward trend.
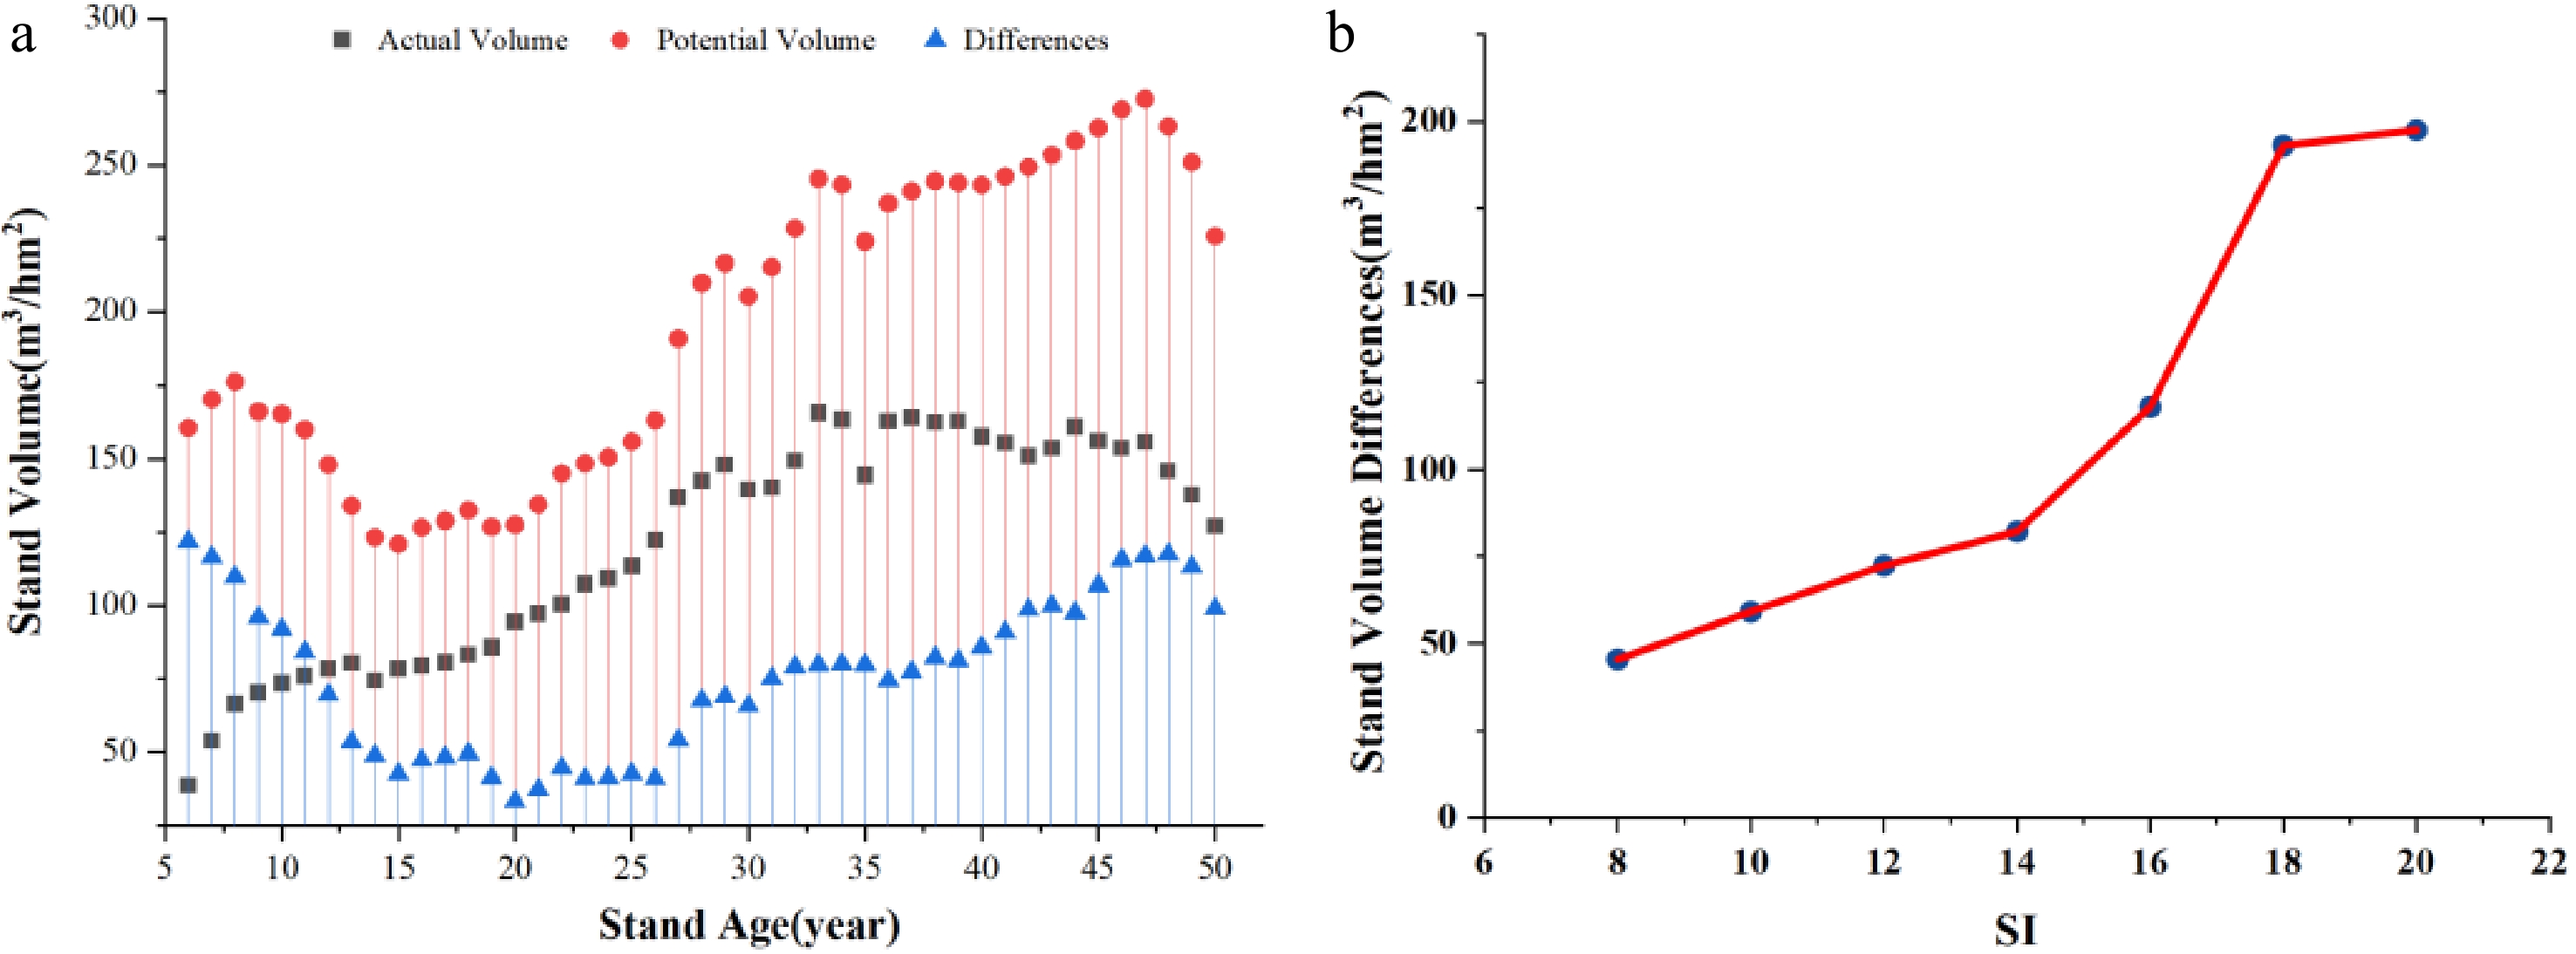
Figure 4.
Comparison of stand potential volume and actual volume at different ages and densities. (a) represents comparison of stand potential volume and actual volume at different ages, (b) represents comparison of stand potential volume and actual volume at different densities.
The regularity of the potential volume of Chinese fir with age is different from that of the actual volume. In the first 6–8 years, the potential volume increased rapidly. Then, a downward trend occurred in the near-mature stage to the over-mature stage of Chinese fir, and the potential volume showed a rapid growth state. To improve the growth potential of Chinese fir, perfect density control activities in the young and near-mature forest stages must be conducted. The difference curve of the above two showed that the difference value was the largest in the afforestation stage and gradually reduced in later stages. In the near-mature stage, that is, after about 25 years, the difference value gradually increased slowly. After 47 years, the difference value decreased.
Comparison of stand potential volume and actual volume under different site indices
-
The average difference between the potential volume and the actual volume in subcompartments under each site index is obtained. Figure 4b shows that the difference value of volume increases with the increase in the site index. Under site indices 8–14, the growth rate remains relatively flat and stable. Under site indices 14–18, the difference between the potential volume and the actual volume shows a rapid growth trend. Meanwhile, under site index 20, the difference value of the stand potential volume is not large. In general, with the increase of the site index, the difference value of the stand potential volume showed a 'slow-fast-slow' change trend, that is, the stand has greater growth potential under medium and good site conditions. This result is similar to the effect of age on potential volume difference.
Comparison of potential volume and actual volume at different densities
-
In addition to stand age and site quality, stand growth is also closely related to stand density. Given that stand density changes with age, we analyzed the changing rule of the stand potential yield under different densities according to different age groups. The age groups of Chinese fir are divided into young age (≤ 10 years), middle age (11–20 years), near mature age (21–25 years), mature age (26–35 years), and over mature age (≥ 36 years) based on the planning and design investigation of forest resources in Zhejiang Province.
In the selection of the density index, the stand density index (SDI) has strong stability and is little affected by stand age and site quality[34]. This index not only represents the number of trees per unit area but also reflects the size of trees. Therefore, SDI was used as the density index to analyze the relationship between stand density and the potential volume[35]. SDI can be calculated using Eq. (25):
$ SDI=N*{\left({D}_{g}/{D}_{0}\right)}^{1.323} , $ (25) where, N is the actual number of trees per ha, N/hm2; Dg is the mean DBH of the stand, cm; D0 is the standard diameter at breast height (DBH), and 20 cm is generally taken as the standard diameter of Chinese fir.
Figure 5 shows the scatter plots of stand potential volume difference and SDI under different age groups. We found that under any age group, the difference value of stand potential volume was negatively correlated with SDI. A smaller SDI indicates a larger difference and standard deviation of the stand potential volume. Meanwhile, a larger SDI entails a smaller difference and standard deviation of the stand potential volume.
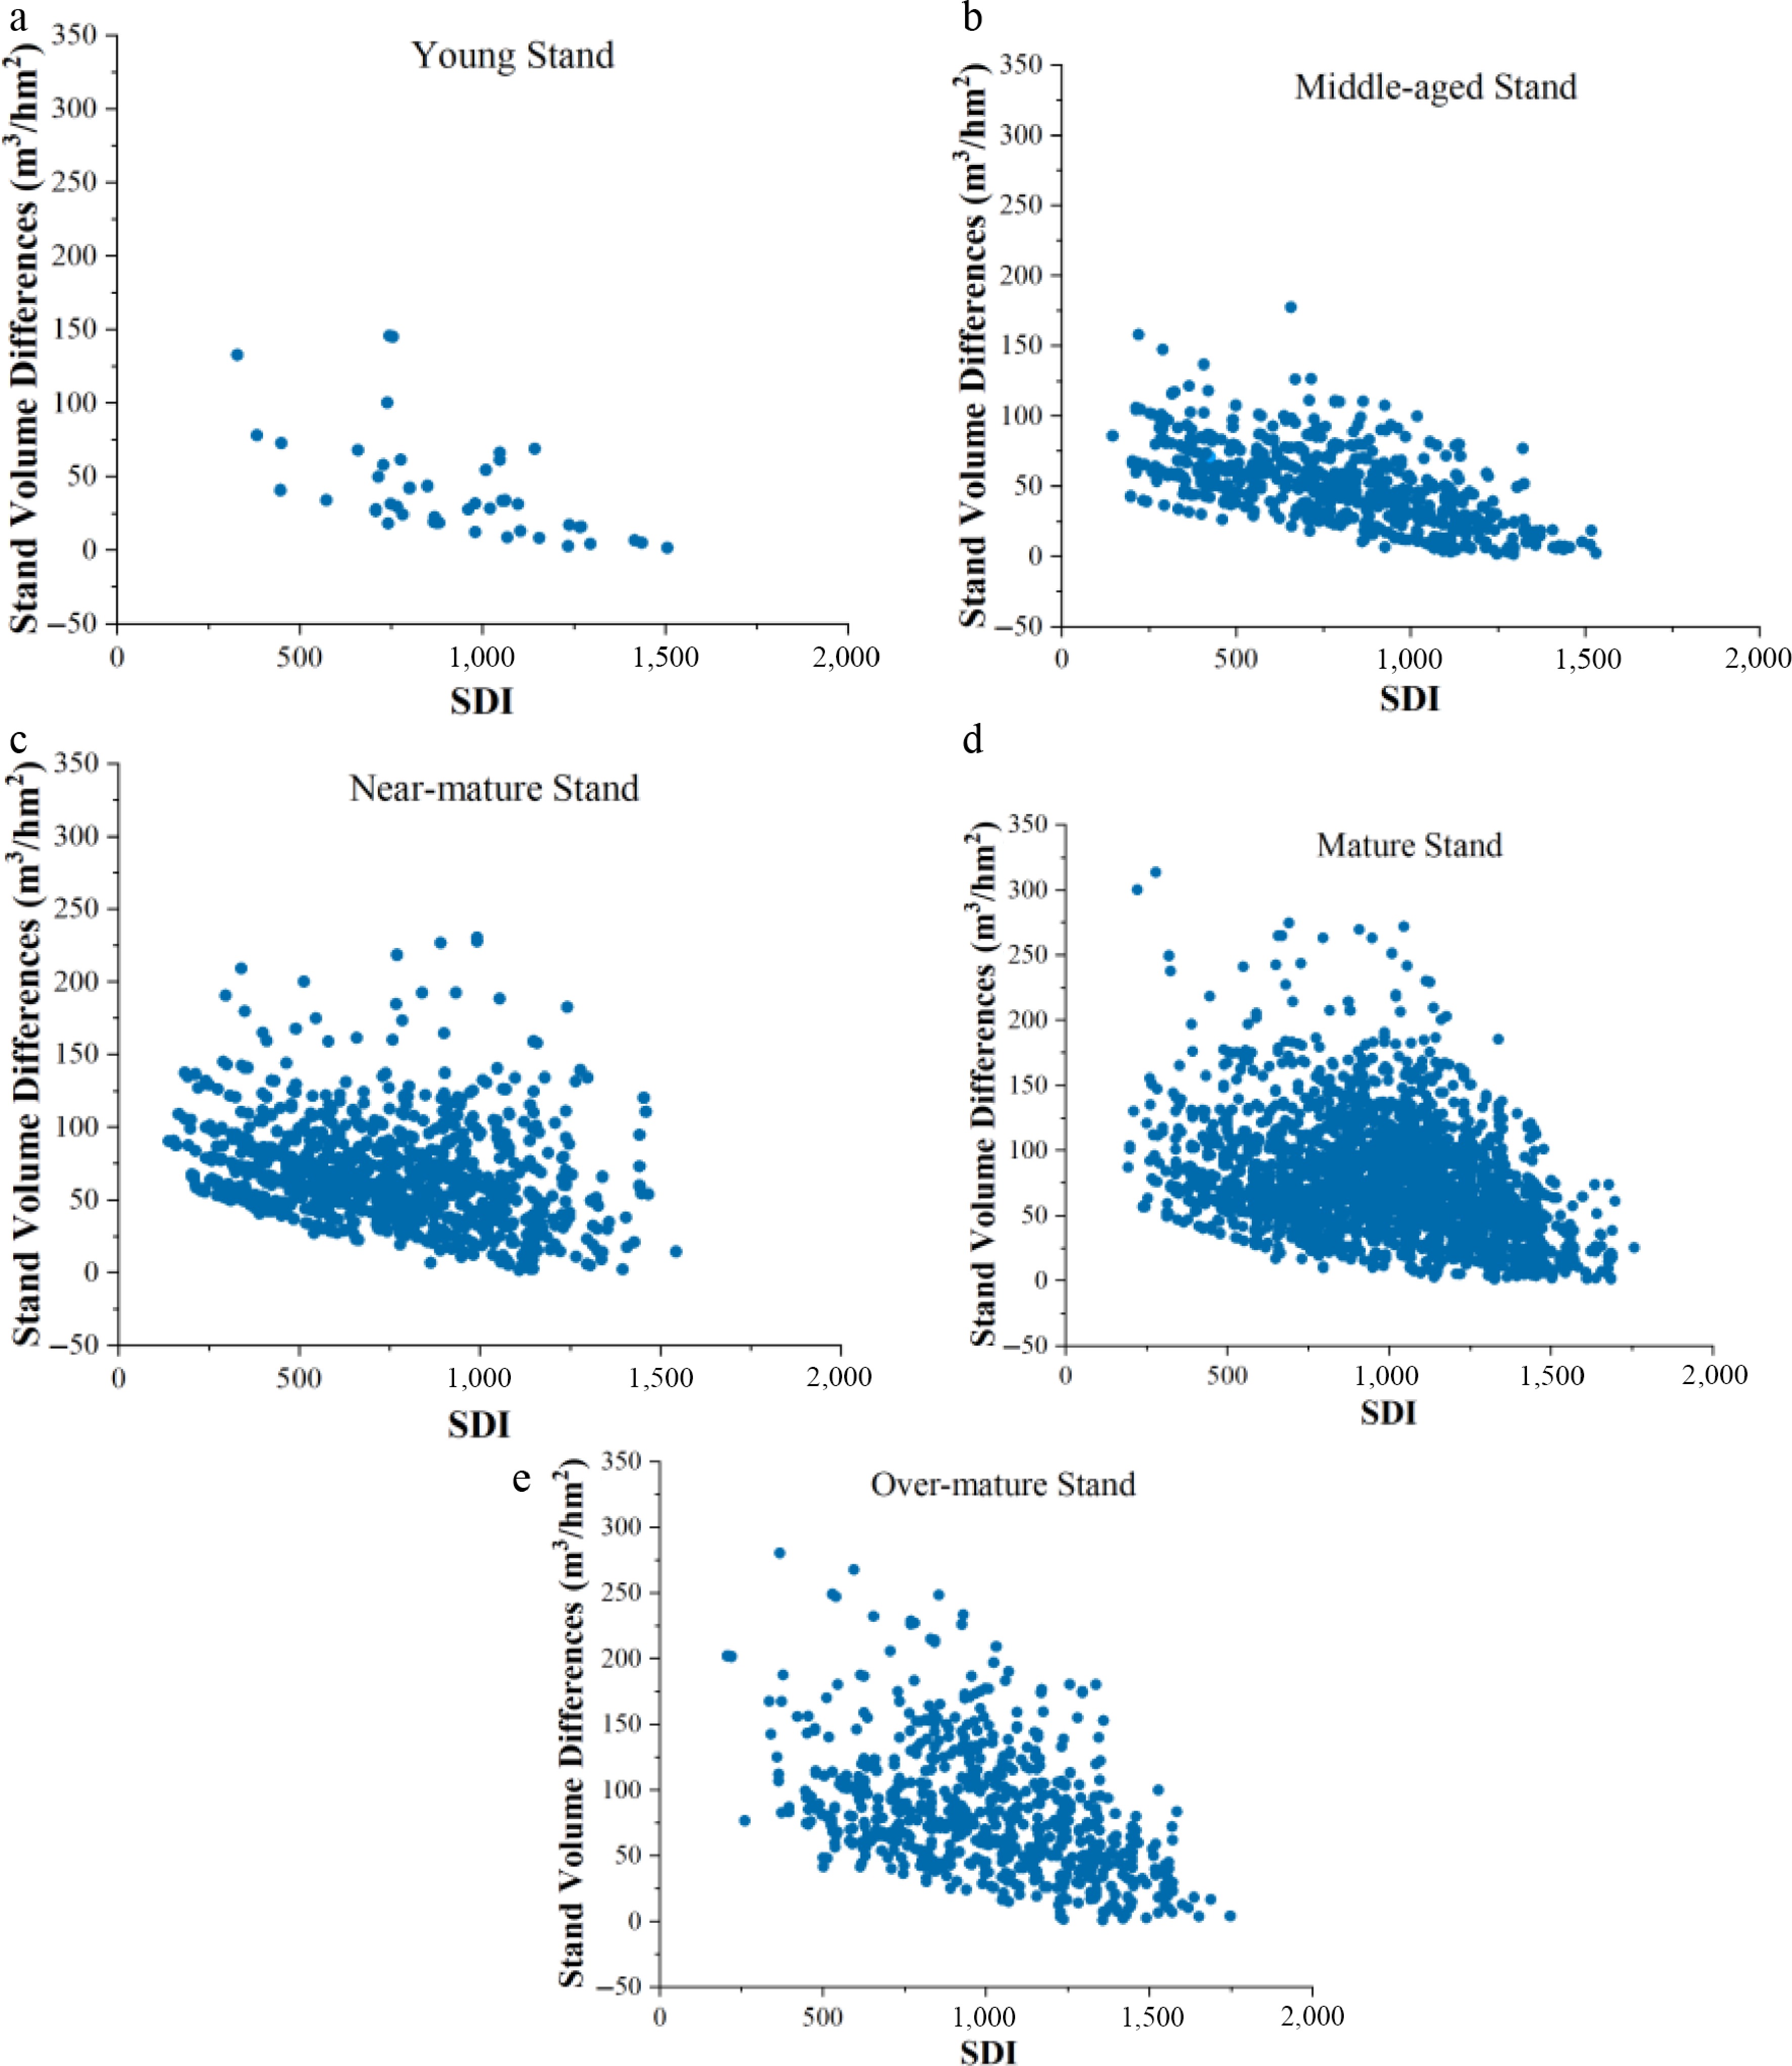
Figure 5.
Difference between potential and actual volume of stands under different SDI. (a) represents young stand, (b) represents middle-aged stand, (c) represents near-mature stand, (d) represents mature stand, (e) represents over-mature stand.
-
Among various model construction methods for site quality, ADA and GADA have better performance, and the curves fitted are more in line with the growth process of dominant trees under different site conditions. Therefore, the two methods have gradually become the preferred methods to establish the site index model. Many references show that GADA is a more ideal method to construct a site index model than ADA[36,37]. Qingyuan County is in the southwest of Zhejiang Province, China. The growth rate of Chinese fir in this area is good, which can be a representative example for Southern China. In this study, GADA with a modified Weibull equation as the theoretical equation was constructed. Good model fitting results were obtained with high accuracy, which could predict the site index of local Chinese fir plantations. Our results indicate that the site index of Chinese fir subcompartments in the study area ranges from 6 to 20 m. Comparisons with existing literature on Chinese fir growth in Southeastern China confirm that this range encompasses the primary productivity spectrum of local plantations[38]. However, this model is subject to certain data-related limitations. Due to local forest management policies, we were restricted to selecting only one dominant tree per sample plot for stem analysis. While we ensured regional representation by establishing 30 plots across diverse site conditions, increasing the number of dominant trees sampled per plot would further mitigate individual-level stochastic variation. Future research, if conditions permit, should aim to increase sampling intensity to enhance the robustness and resilience of the site quality evaluation model. Furthermore, given the finite size of the dataset used for GADA modeling, there is a risk of overfitting. Acquiring data from broader geographic ranges and more extreme environments in future studies would significantly improve the model's generalizability and stability across varying stand conditions.
Optimal density regulation and stand growth dynamics
-
Relevant studies have shown that stand density is the basis of the rationality of stand structure, which directly affects the distribution of ecological factors, such as light, water, and nutrients, as well as stand productivity, stand growth, canopy structure, and soil fertility[39,40]. Under certain site conditions, stand density is the dominant factor controlling the growth rate of individual trees[41]. It is also one of the few factors that can be effectively controlled by forest managers. Combined with the density effect model and DP method, the optimum density obtained in this study is similar to that obtained by Ren et al. in their study of the relationship between the height and diameter class structure of dominant trees[42]. Based on the optimal density of Chinese fir under different age and site indices, with the increase of the age of Chinese fir, the density of the remaining standing trees in each site index decreases, thus indicating that the DP density decision model represents the growth law of the Chinese fir population. It is noteworthy that the rapid decline in optimal density during the juvenile stage (< 10 years), as illustrated in Fig. 3, is primarily driven by the DP model's optimization objective—maximizing total volume yield—rather than being a surrogate for the natural self-thinning process. During the juvenile stage, the small stature of trees allows for high initial densities to facilitate rapid early volume accumulation. However, as stand age advances and individual tree volume increases, the model prescribes a sharp reduction in optimal stocking levels to mitigate growth stagnation resulting from excessive intraspecific competition. This strategy ensures the continuous, efficient utilization of site resources and the maintenance of high productivity across all developmental stages. Mechanistically, this management-induced reduction is fundamentally distinct from natural self-thinning, which is typically governed by resource limitation and ensuing tree mortality. At the same time, with the increase in the stand site index, stand retention trees also decrease gradually, which is consistent with the research results of Sun et al.[43] and Pan et al.[44]. Regulating the stand density is often profitable because determining whether the stand density is reasonable can directly indicate whether the forest potential and forest function can be maximized[45]. The results further show that for the same thinning interval, the stands with a high site index should retain relatively fewer trees because of the faster growth of trees. Meanwhile, the stands with a low site index should retain relatively more trees because of the slower growth of trees. Therefore, the thinning of stands with different site indices at the same time according to the optimal management density will reach the reclosing of stands at the same time after thinning. For Chinese fir stands with different site indices, the same standing density should be retained, and the thinning interval should be different. In other words, stands with a high site index should have short thinning intervals, while stands with a low site index should have long thinning intervals.
Definition of potential yield and future perspectives
-
In this study, the volume potential yield is defined as the volume yield with the optimum density under a certain site index. It is important to acknowledge that the calculated potential yield is a theoretical maximum derived from a specific density-effect model. The uncertainty in these estimates stems from three main sources: (1) the estimation error in site index, which acts as the foundation of our model; (2) the inherent variance in growth parameters; and (3) the exclusion of stochastic disturbances (e.g., extreme climate events, pests) which may temporarily reduce attainable yield. Therefore, the presented potential yield should be interpreted as a strategic benchmark rather than a fixed operational target.
It should be noted that the 7,449 subcompartment inventory records used in this study represent cross-sectional observational data. Consequently, the fitted density-volume relationships reflect predictive and associative patterns rather than strict causal effects, as observed stand density is endogenously shaped by past management history, thinning, and natural mortality. The derived optimal density and potential standing-volume gaps should therefore be interpreted as model-based decision-support benchmarks rather than deterministic growth guarantees. Future research utilizing long-term permanent plots and explicit thinning experiments will be essential to further quantify causal stand responses to specific density interventions. It should also be noted that the optimal densities in Table 6 represent unconstrained theoretical benchmarks rather than prescriptive operational guidelines. Extremely high densities (e.g., > 6,000 trees ha−1) occur exclusively during the early stage under poor site conditions (e.g., site index = 6), mathematically compensating for slow individual growth. As unconstrained optima may exceed standard planting densities (2,500–3,333 trees ha−1), future studies will explicitly integrate operational constraints (e.g., initial spacing limits and thinning feasibility) to refine these reference limits.
Moreover, the simplified calculation formula Eq. (21) was used in the calculation of the potential volume yield in this study. However, the thinned volume was not considered because the corresponding thinning data of the subcompartments could not be obtained. If the thinned volume of Chinese fir is also included, the actual volume of the potential harvest will be greater than the calculated potential harvest, which further indicates that the actual subcompartments have a greater volume of potential harvest than the calculated result in this study. In addition, with the increasing attention to global climate change, researchers have been considering the impact of climate factors on forest harvest and have used models to examine forest growth and management under climate change[46].
-
This study proposed a novel methodology to quantify the potential volume yield of Cunninghamia lanceolata plantations. We constructed a site index model and a volume-tree height density effect model, and established a decision framework for optimal management density across various site conditions using dynamic programming (DP). Our main scientific findings are as follows:
(1) This study evaluated the regional stand growth status and identified a widespread productivity gap across Cunninghamia lanceolata plantations. Model-derived evaluations showed that 99.9% of the subcompartments had an actual standing volume lower than their density-optimized standing-volume benchmark, with differences ranging from 1.0 to 362.4 m3/ha. These findings highlight the significant potential for standing volume enhancement through targeted density regulation strategies, including initial spacing design and thinning.
(2) The dynamic distribution pattern of the yield gap was clarified. The difference between potential and actual harvest was largest during the young stand stage, subsequently decreased, and showed a slow increase after the near-mature stage (approximately 25 years). Furthermore, the yield gap exhibited a 'slow-fast-slow' trend with increasing site index (SI), indicating that stands under medium-to-high site conditions possess greater potential for yield optimization.
(3) The density regulation strategy based on DP provides scientific guidance for bridging this yield gap. The study confirmed that optimal retention density decreases with increasing stand age. For different site conditions, stands with high site indices should be managed with shorter thinning intervals to match their rapid growth rates, whereas stands with low site indices require longer thinning intervals. These findings offer quantitative decision support for developing precision forest management plans aimed at enhancing stand volume.
-
The authors confirm their contributions to the paper as follows: writing − original draft, visualization, validation, methodology, formal analysis, data curation, funding acquisition: Dong C; writing − review and editing, project administration, conceptualization, visualization, data curation: Zheng X; writing − review and editing, formal analysis, data curation, visualization: Lou X; writing − review and editing, investigation, data curation: Weng Y; visualization, formal analysis, data curation: Xue X; visualization, data curation: Min Z; data curation: Wu R. All authors reviewed the results and approved the final version of the manuscript.
-
The datasets generated during and/or analyzed during the current study are not publicly available due [REASON WHY DATA ARE NOT PUBLIC] but are available from the corresponding author on reasonable request.
-
The authors declare that they have no conflict of interest.
- Copyright: © 2026 by the author(s). Published by Maximum Academic Press, Fayetteville, GA. This article is an open access article distributed under Creative Commons Attribution License (CC BY 4.0), visit https://creativecommons.org/licenses/by/4.0/.
-
About this article
Cite this article
Dong C, Zheng X, Lou X, Weng Y, Xue X, et al. 2026. Study on potential yield models and analysis of Chinese fir (Cunninghamia lanceolata) plantations under different site conditions and stand densities - a case study in Southwest Zhejiang. Smart Forestry 1: e016 doi: 10.48130/smartfor-0026-0013 

Study on potential yield models and analysis of Chinese fir (Cunninghamia lanceolata) plantations under different site conditions and stand densities - a case study in Southwest Zhejiang
- Received: 27 April 2026
- Revised: 10 August 2026
- Accepted: 14 August 2026
- Published online: 28 September 2026
Abstract: Chinese fir (Cunninghamia lanceolata) plantations are crucial for timber production in Southern China. However, traditional yield assessments often fail to quantify site-specific potential productivity. This study used 189 repeated dominant height–age observations from 30 stem-analysis trees and 7,449 forest subcompartment inventory records to establish site index models using the Generalized Algebraic Difference Approach (GADA) and stand density effect models. We proposed the concept of 'stand potential yield' and applied dynamic programming (DP) to optimize stand density trajectories across site indices and ages, evaluating regional yield gaps. Results showed that: (1) The volume–height density effect model achieved strong predictive performance (R2 = 0.839), and the modified Weibull GADA model best explained site quality (R2 = 0.999). (2) Dynamic programming revealed that optimal stand density decreased over time and with increasing site index. (3) Model-derived evaluations indicated that potential volume exceeded actual volume in 99.9% of subcompartments. The yield gap was largest during initial afforestation, narrowed through intermediate stages, and re-expanded after the near-mature stage. Across site indices, the gap followed a 'slow-fast-slow' trajectory and was negatively correlated with the stand density index. Overall, this framework provides a quantitative decision-support tool for density regulation to unlock forest growth potential and enhance productivity.