


-
Campus fire, traffic accidents, drowning, psychological problems, bullying and violence, fraud, network security problems and other emergencies are increasing, testing the emergency ability of colleges and university students. Most students cannot maintain emotional composure and clear thinking in emergencies, which hinders the effective play of emergency ability[1]. The psychological reaction of these individuals is often accompanied by the related physiological reaction, so through the measurement and analysis of physiological indicators, we can evaluate the effective play of college students' emergency ability.
Physiological signals are change signals controlled by the human autonomic nervous system and endocrine system that are not affected by human social factors[2,3], and can truly and objectively reflect human emotional state and psychological feelings[4]. At the same time, it is necessary to find out the relevant factors affecting the emergency response ability of college students, and conduct corresponding education and popularization for students with different emergency response ability[5].
Researchers at home and abroad have carried out research on the emergency ability of college students. Liu et al.[6] randomly selected thousands of graduate and undergraduate students to conduct a questionnaire survey, which included four aspects: (1) knowledge of handling representative emergencies; (2) ways to obtain emergency knowledge; (3) situation of attention to emergency knowledge; and (4) learning desire. Crowe[7] used a self-designed questionnaire to investigate the impact of safety values on the safety behaviors of American college students in the Midwest, and found that female students have stronger safety awareness than male students. Through the experiment, Wang[1] found that the psychological status significantly affected the changes of related physiological indexes from the event period to the recovery period, which indicated that the college students with better psychological status had stronger ability of emotional regulation. Earl et al.[8] asked a total of 1,059 undergraduates from four universities in the Midwest of the United States to complete the same questionnaire as the one designed by Crowe, and found that age has a great impact on college students' safety belief and safety behavior. Skurka et al.[9] conducted experiments and questionnaires on 419 students and found that students who watched videos of emergency drills and learned about emergency measures were able to act more regularly in an emergency two weeks later. Cheng[10] found that the degree of interest in disaster education and other factors will also have an impact on the disaster response ability of college students. The research by Zhang[11] found that residence can also significantly affect college students disaster literacy.
Wang[1] adopted the BioLAB human factor data synchronous acquisition system to measure five groups of physiological indicators, including students' heart rate, skin electricity, respiratory sinus arrhythmia, pre-ejection period, and ratio of low frequency to high frequency, under the simulated situation constructed by an emergency video, and obtained the variation rules of these five groups of physiological data. Yang[12] adopted the Tobii eye tracker to study students' risk identification and emergency response ability under different emergency situations through eye movement parameters such as the number of visits and first fixation time. Chen et al.[13] used virtual reality technology to create a virtual fire scene in the dormitory building. At the same time, physiological index sensors were used to monitor the heart rate, skin electricity and skin temperature of 40 college students participating in the experiment in real time. The predecessors have laid a solid foundation for the future study of the emergency ability of college students. However, the authenticity of the virtual situation of university emergencies, the accuracy of the collected information and the means of data analysis need to be further strengthened.
In this paper, a virtual reality system is used to create a college emergency situation, and physiological signals of the subjects are collected by physiological multiguides to verify the significance of the fluctuation of relevant physiological signals in the virtual college emergency situation in the resting period and the event period. The purpose is to analyze the change of physiological indicators of college students in the emergency situation, as an indicator of the physiological emergency ability of college students. It has been shown that the influencing factors include emergency knowledge, psychological status, gender, age, emergency drill, residence and so on. Therefore, this article hopes to test the above conclusion by the method of combining experiment and questionnaire, and to explore the correlation between the influencing factors and physiological fluctuation by the results of a questionnaire survey and data analysis, the related factors of college students physiological reactions under the situation of unexpected events were obtained.
-
Through the collation and analysis of university emergencies, it is found that fire and earthquake cause the most extensive harm to university students, and are most often used as the scene of emergency education and emergency drills. Therefore, this paper selects fire and earthquake as the virtual situations of university emergencies. We made use of the existing experimental platform of the college, including a virtual reality system, Physiolab multi-guide and other equipment, combined with the questionnaire were used to conduct experimental research on the emergency ability of college students (Fig. 1).
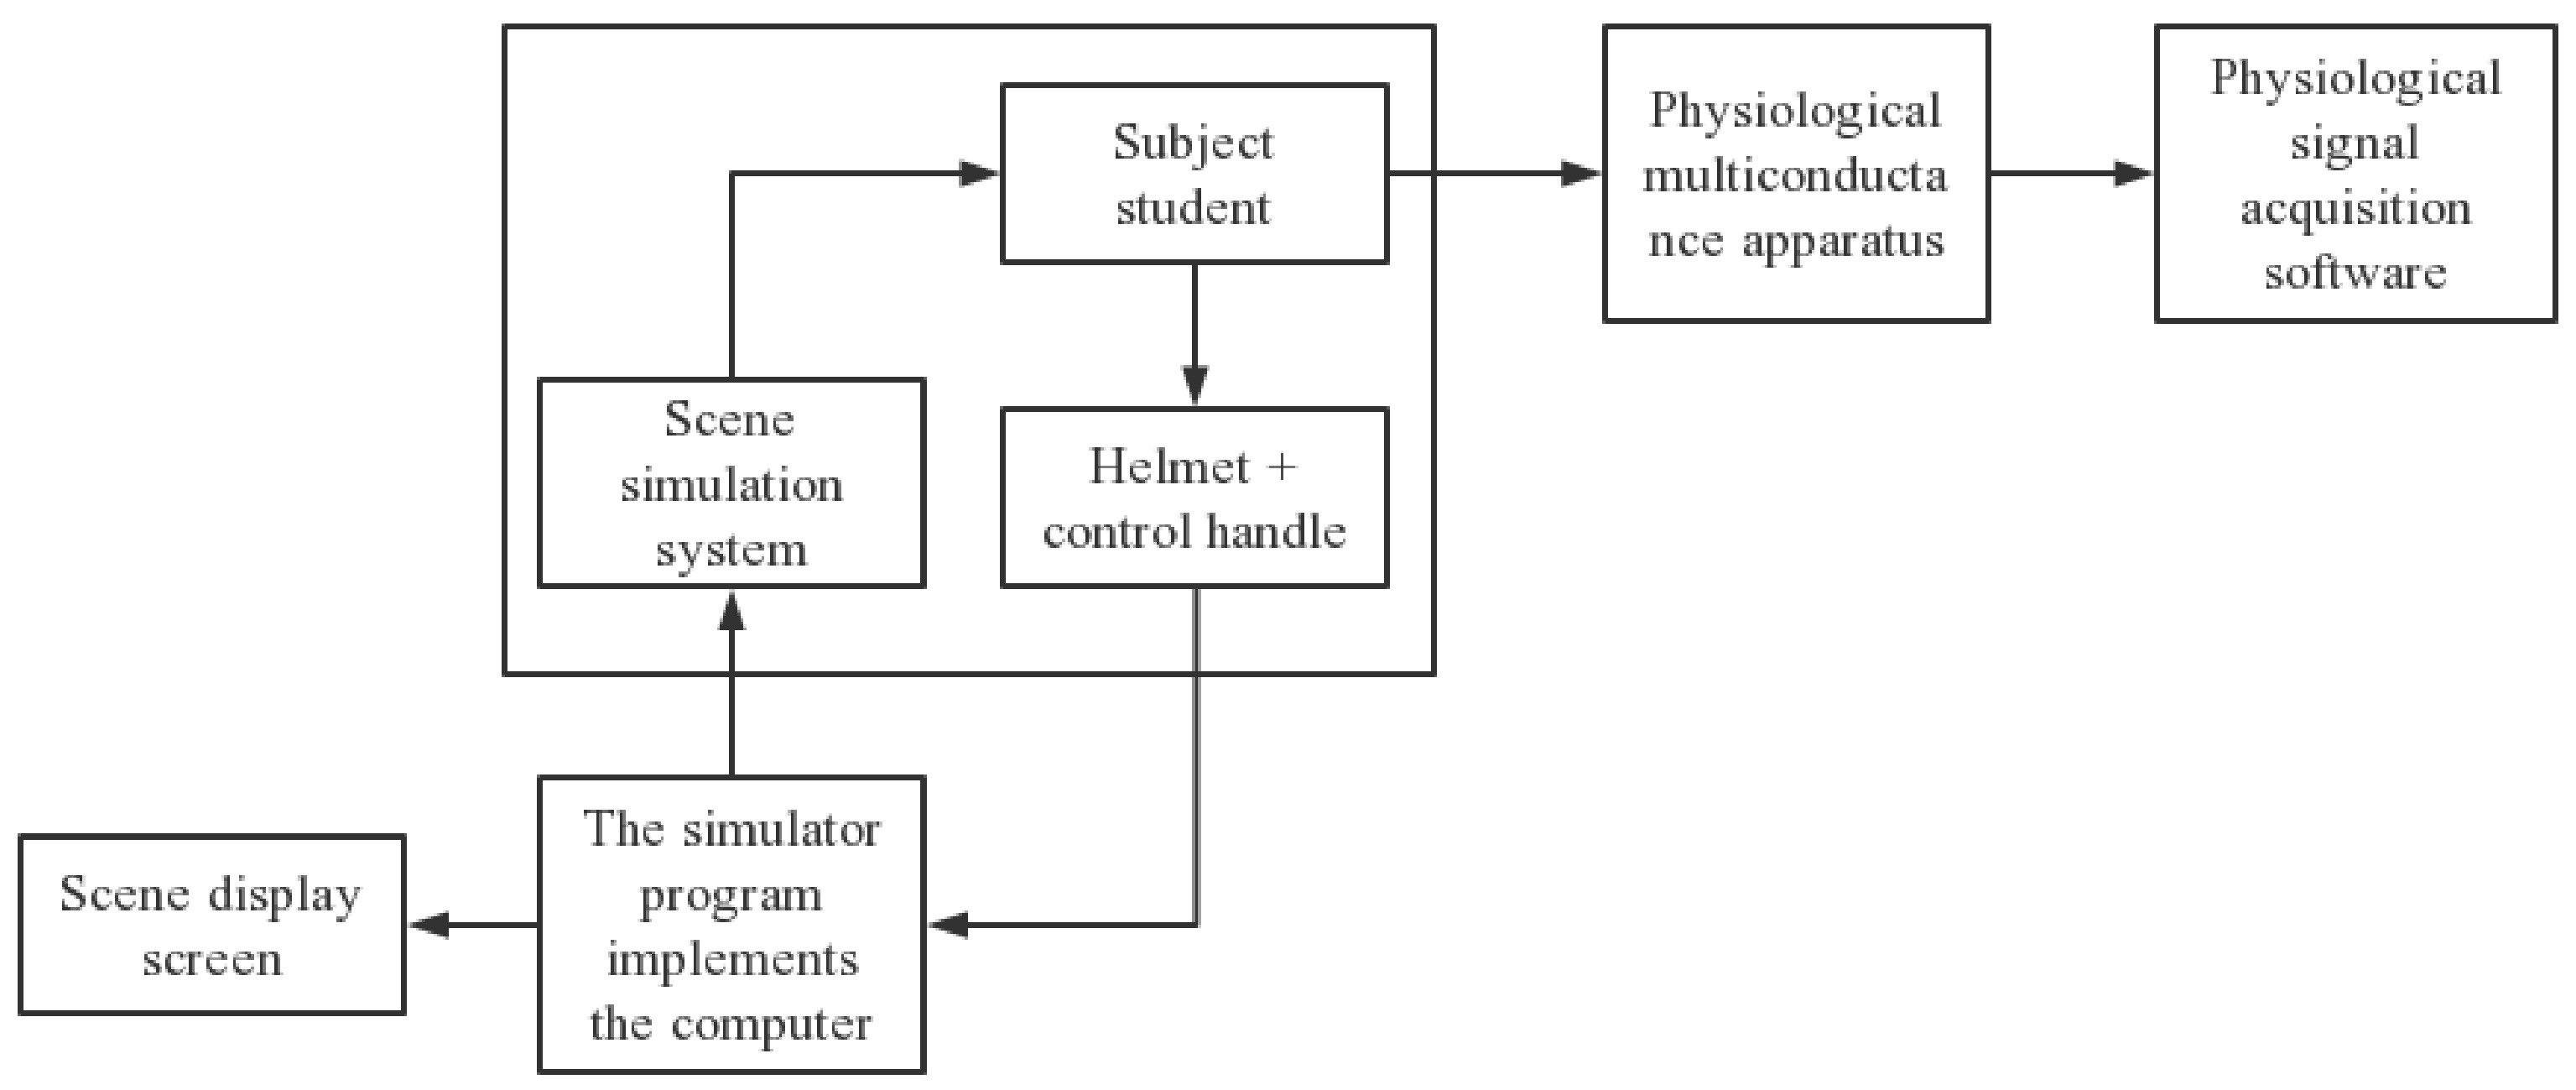
Figure 1.
Schematic diagram of Emergency Response Ability Experiment System for college students.
-
The participants in the university emergency simulation experiment are all re-studying undergraduates and postgraduates in our school, including 100 students (34 males, 66 females), aged 18−26 years old. In terms of education level, all sophomores were from The College of Safety and Emergency Management Engineering, all graduate students were students who had studied and had a certain professional background and knowledge of safety and emergency management, while freshmen of The College of Safety and Emergency Management Engineering and students of other colleges were students without a professional knowledge and background of safety and emergency management. The group is divided into undergraduate and postgraduate students.
All participants were in good health and had no history of mental illness or substance abuse. Before the study, participants were told to avoid strenuous exercise on the day of the study, not to take drugs that could affect cardiovascular and cerebrovascular function, not to drink coffee or other energy drinks, and not to stay up late. In order to further ensure the effectiveness of the experiment, the subjects should have had contact with the virtual reality system used in this experiment in advance, and be familiar with the experimental process and the use of the control handle. Each subject signed an informed consent form.
Experimental questionnaire
-
(1) The Self-Assessment Scale of Psychological Symptoms (SCL-90) selected in this study is one of the most famous mental health test scales internationally recognized and the most widely used outpatient examination scale for mental disorders and mental diseases. The test is applicable to people over 16 years old. There are 90 items in the scale, which contains a wide range of psychiatric symptomatology.
(2) Referring to the Questionnaire on Disaster Response Knowledge and Skills of Urban Community residents compiled by Professor Li[14] from the School of Nursing of Jilin University, and the Questionnaire on Disaster Knowledge of Xi 'an College Students compiled by Cheng[10] in 2015, this study determined the Questionnaire on Emergency knowledge and skills of college students according to the purpose of this study. There are 26 items in the questionnaire, including eight items for natural disaster test, eight items for man-made disaster test and 10 items for on-site rescue treatment test.
(3) The virtual reality system subjective evaluation scale, which requires subjects to score according to their real experience in the experimental task, is shown in Table 1.
Table 1. Virtual reality system subjective evaluation scale.
Evaluation item Score For questions 1 & 2, on a scale of 1−7, 1 being 'not at all realistic' and 7 being 'very realistic': 1. The fidelity of 3D objects in the scene 2. Test the fidelity of the task For questions 3−6, on a scale of 1−7, where 1 is 'strongly disagree' and 7 is 'strongly agree': 3. I have the freedom to control my movements within the situation 4. Experimental scenes can give me a sense of urgency to escape 5. I can concentrate in a situation 6. I felt no physical discomfort during the experiment The subjective evaluation scale can represent the emotional arousal degree of the subjects. Through statistical analysis of the mean, standard deviation and range of scores of each question, it can be compared with the change rate of physiological signals to explore whether it will have an impact on the physiological signals of the subjects.
Experimental equipment
-
Virtual reality system
In virtual reality, users can feel the simulation of different senses such as vision, sound and touch, which can effectively stimulate the emotional experience and physiological arousal of the subjects and make it easier to obtain relatively objective physiological data[15]. Figures 2 and 3 are the local maps of the virtual reality system used in this experiment.

Figure 2.
Virtual reality headset.
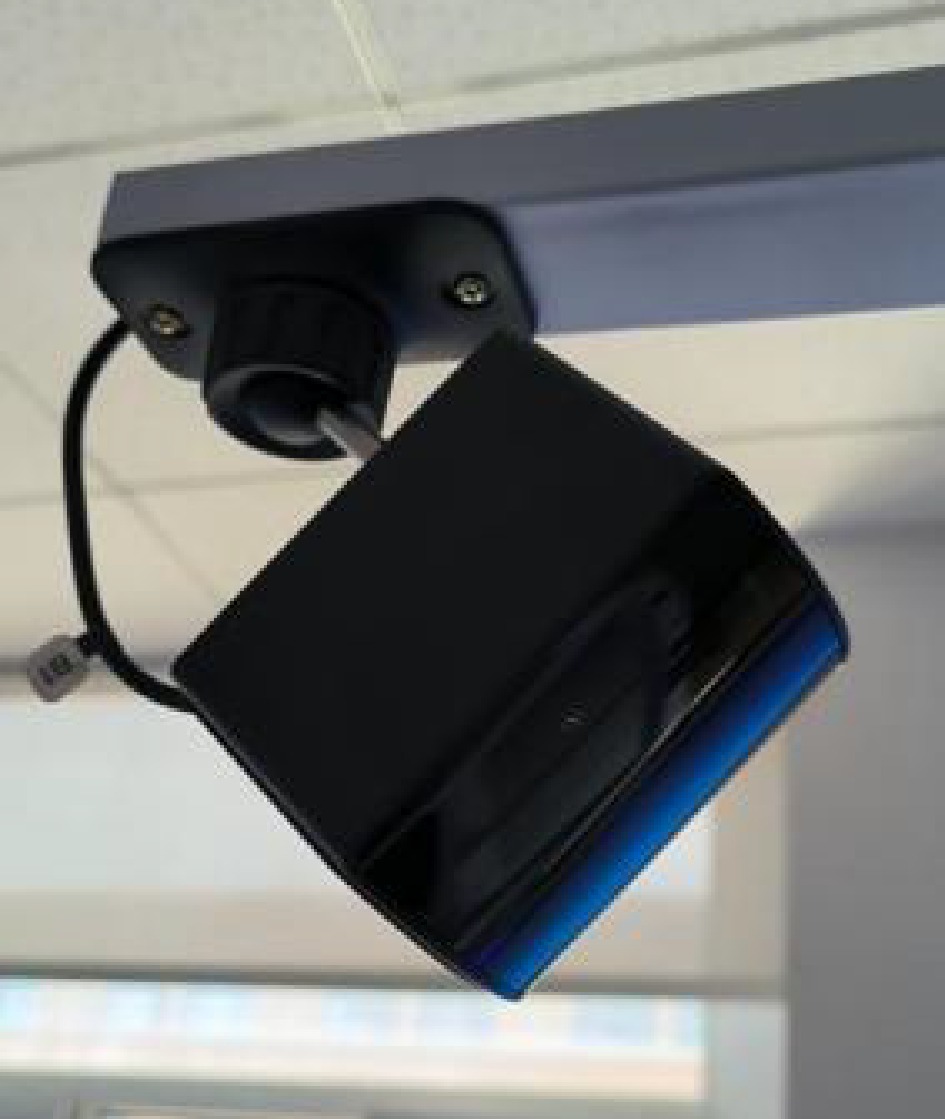
Figure 3.
Virtual reality system locator.
In the fire scene (Fig. 4), the subjects were required to complete the escape tasks according to the instructions, such as dialing the rescue phone, ringing the alarm bell, covering the mouth and nose with a wet towel, operating the fire extinguisher, opening the door, etc. In the earthquake scene (Fig. 5), the subjects had to put their schoolbags on their heads, squat under desks, knock on pipes with iron bars for help, and escape falling objects. In the process of escape, the subjects needed to complete the task by operating the handle. The virtual situation presents 360° 3-D surround scene, with sound, vibration and other effects.
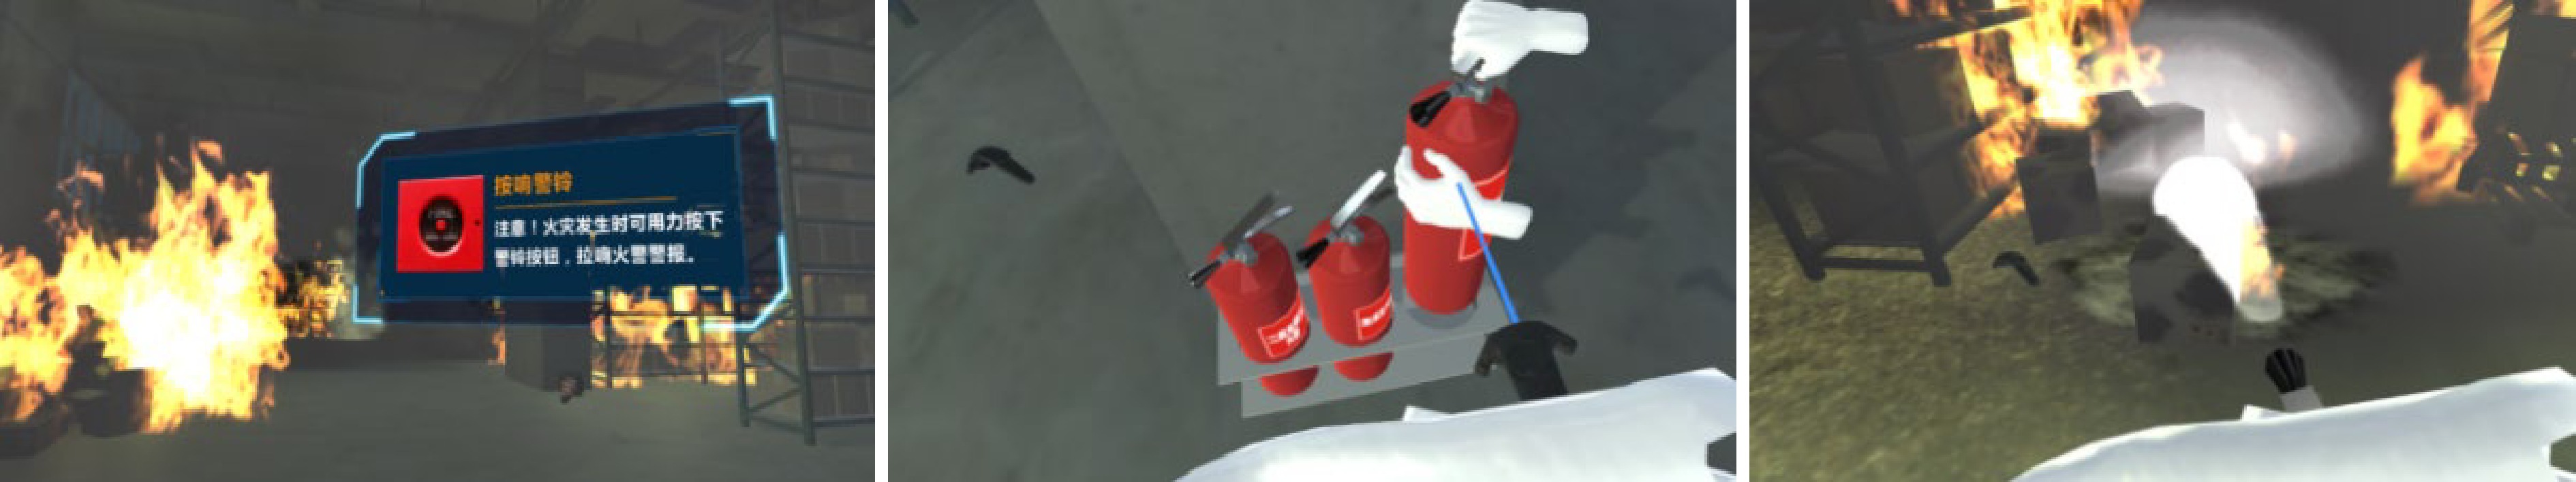
Figure 4.
Fire scene.

Figure 5.
Earthquake scene.
Physiological multiconductance instrument
Emotions can be identified by changes in physiological signals that come from uncontrolled activity in the autonomic nervous system in the human brain. Cannon[16] believed that people first feel the stimulation of emotional response to the hypothalamus and then transmit the signal to the autonomic nervous system, thus triggering physiological signal changes. It has been accepted that emotional generation is accompanied by obvious physiological reactions[3]. The physiological signals of the human body are bioelectrical signals generated by the autonomic nervous system and endocrine system controlling the internal organs along with the changes of emotions, which can more objectively and truly reflect the mood and pressure at that time[4]. In this paper, five groups of physiological indexes including heart rate, LF/HF, NN50, skin electricity and respiratory rate were selected to study the physiological fluctuation of subjects in the virtual situation of a university emergency.
Physiolab multiguides come from ERGONEERS (Germany). They collect heart rate, skin electricity, respiratory rate, LF/HF, NN50 and other physiological data to study the effects of physiological signals on students in real-life university emergencies. Figure 6 shows the physiological signal data acquisition system, and Fig. 7 shows the physiological signal acquisition page output.
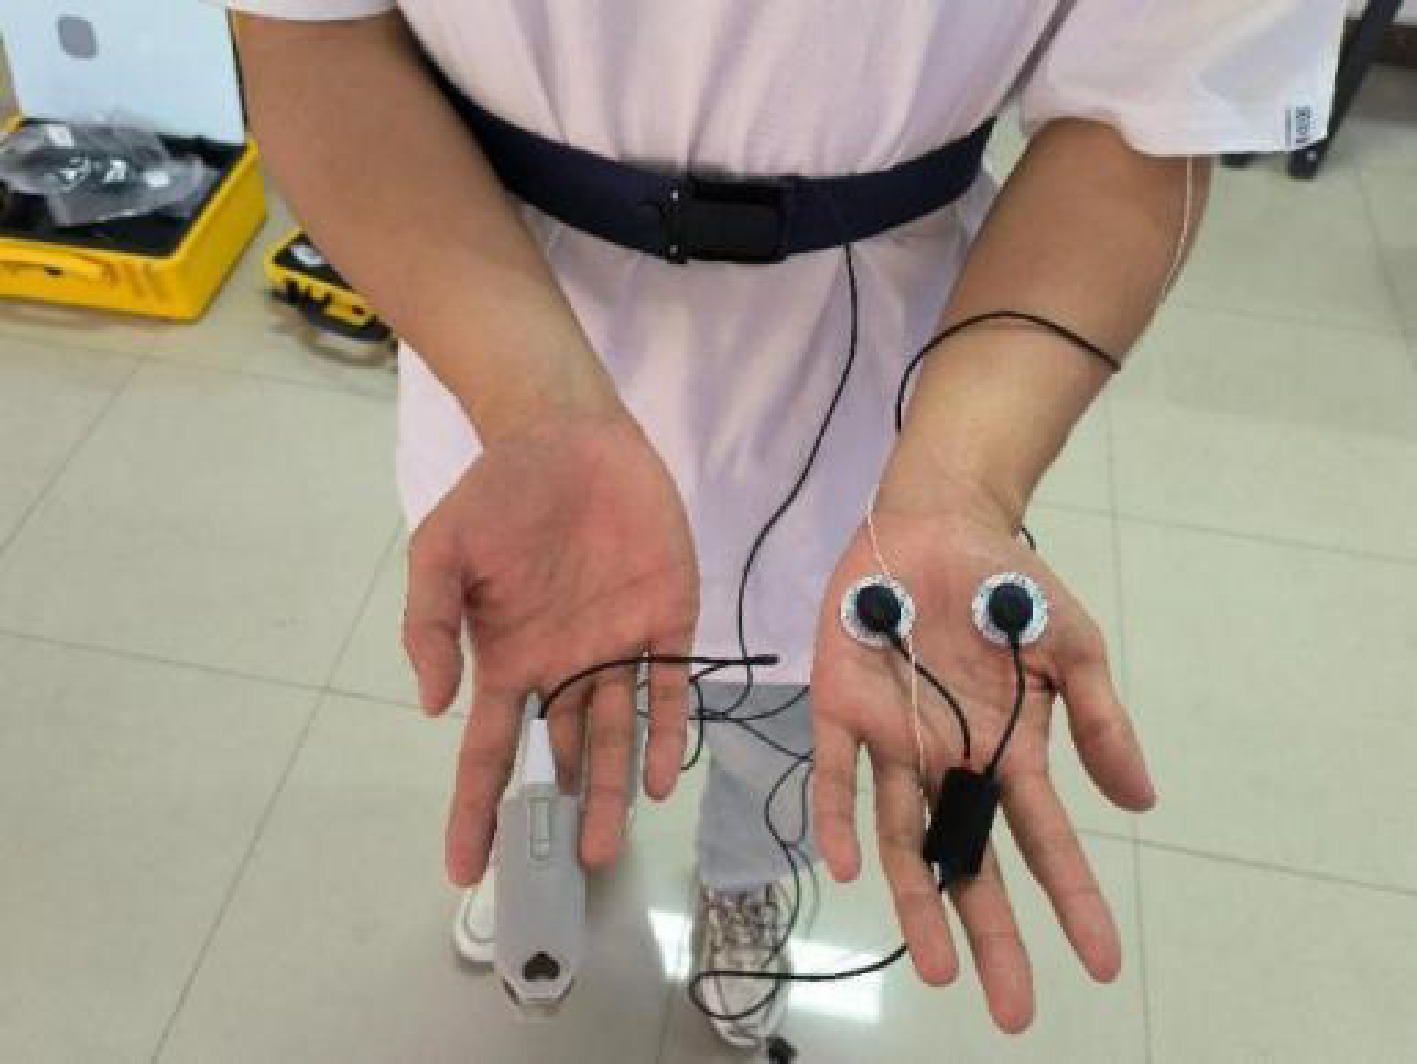
Figure 6.
Physiological signal data acquisition set-up.
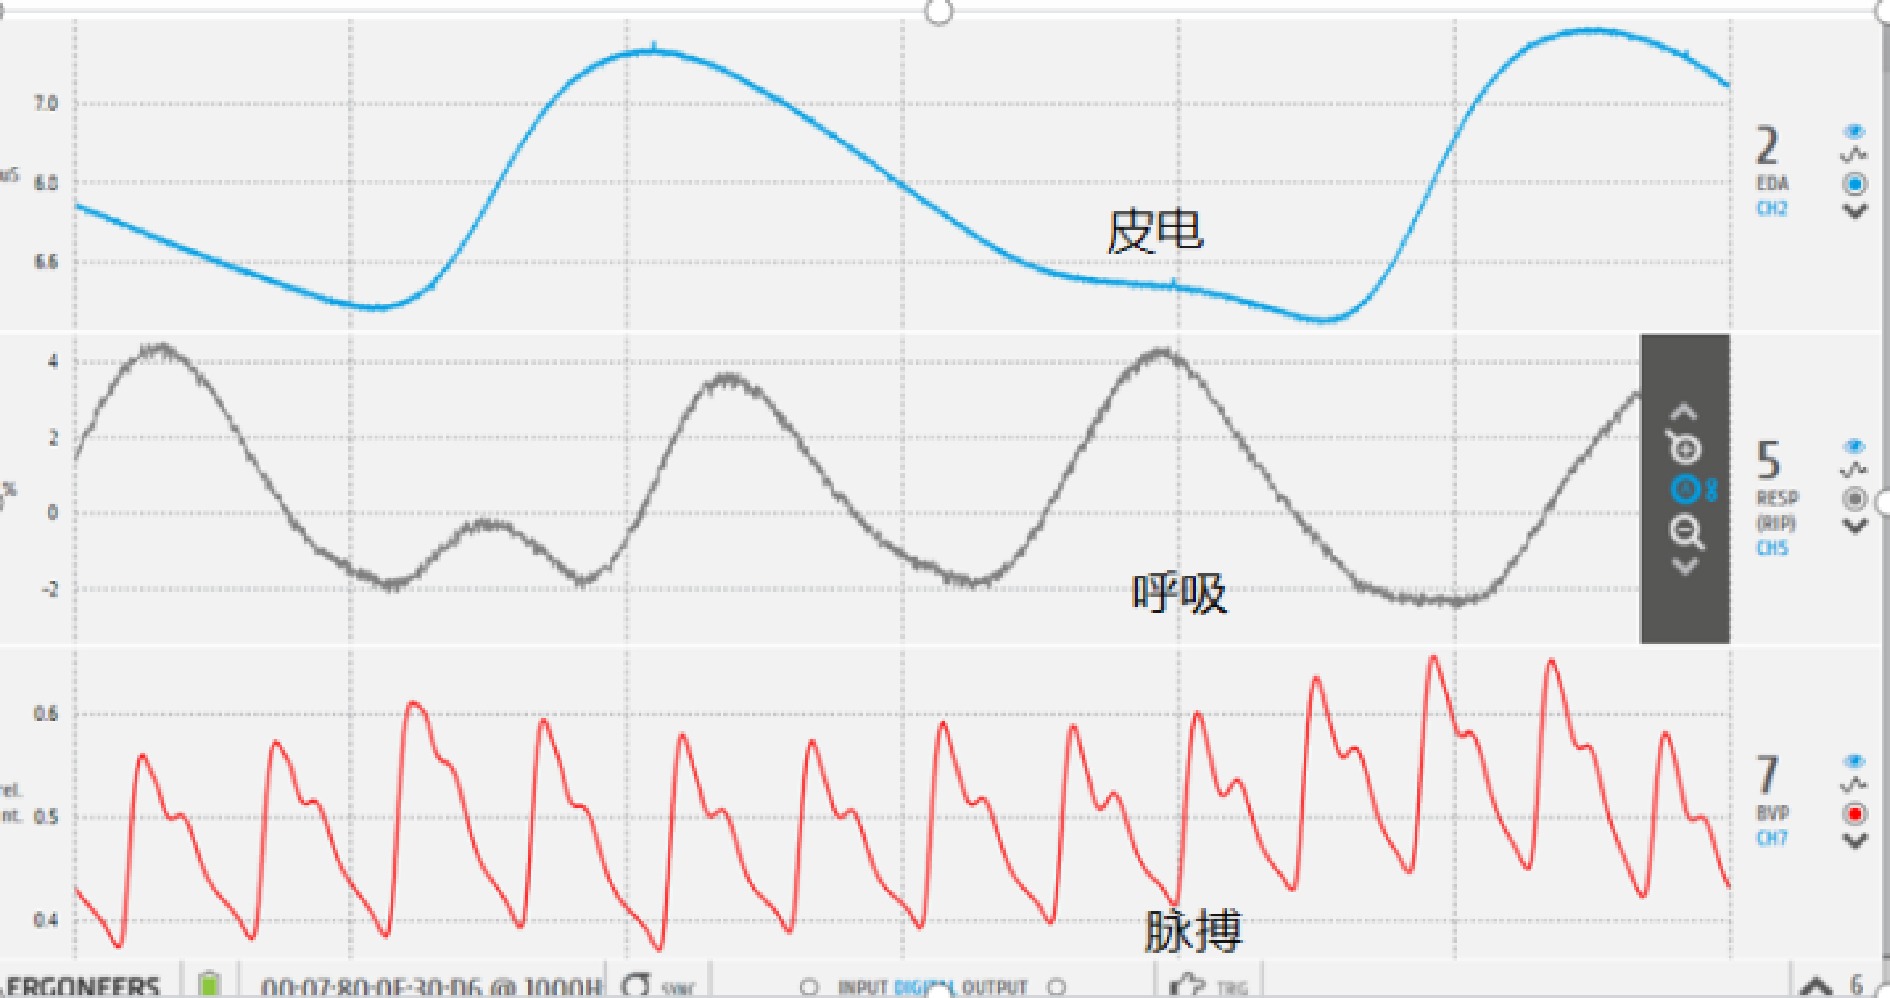
Figure 7.
Physiological signal acquisition page diagram.
-
The virtual reality system handles the interactive function, and the subjects have an independent test-bed, which can move in a range of about 5 m2. The laboratory temperature is kept at about 20 °C. In this experiment, 100 students were selected as subjects to collect physiological data.
Virtual simulation system (VR) was used to simulate real fire and earthquake events in colleges and universities to induce tension, panic, fear and other emotions of the subjects. The physiolab physiological multi-guide was used to collect and store physiological indicators of the subjects. In addition, a questionnaire survey was used to study the basic information, psychological conditions, emergency knowledge and skills of the subjects.
Prior to the experiment, the participants were required to complete the Psychological Symptoms Self-Rating Scale and the Emergency Knowledge and Skills Questionnaire for College Students, which included their personal information, such as gender, age, relevant professional background, place of origin and whether they were an only child or not. The experiment requires the subjects to complete the tasks of escaping a campus fire and earthquake respectively in the VR system, as shown in Fig. 8. The experimental time of each group is about 5−7 min according to the performance of different subjects. In order to reduce the impact of continuous experiments on various test indicators, subjects rested for about 10 min between each group of experiments, and the total time in each experimental scene was about 10 min. After the experiment, the subjects completed the virtual Reality System Subjective Evaluation Scale. Finally, the subjective evaluation method of questionnaire and objective indicators of physiological polyconductance were used to make statistical analysis on the influence of the emergency ability of college students.
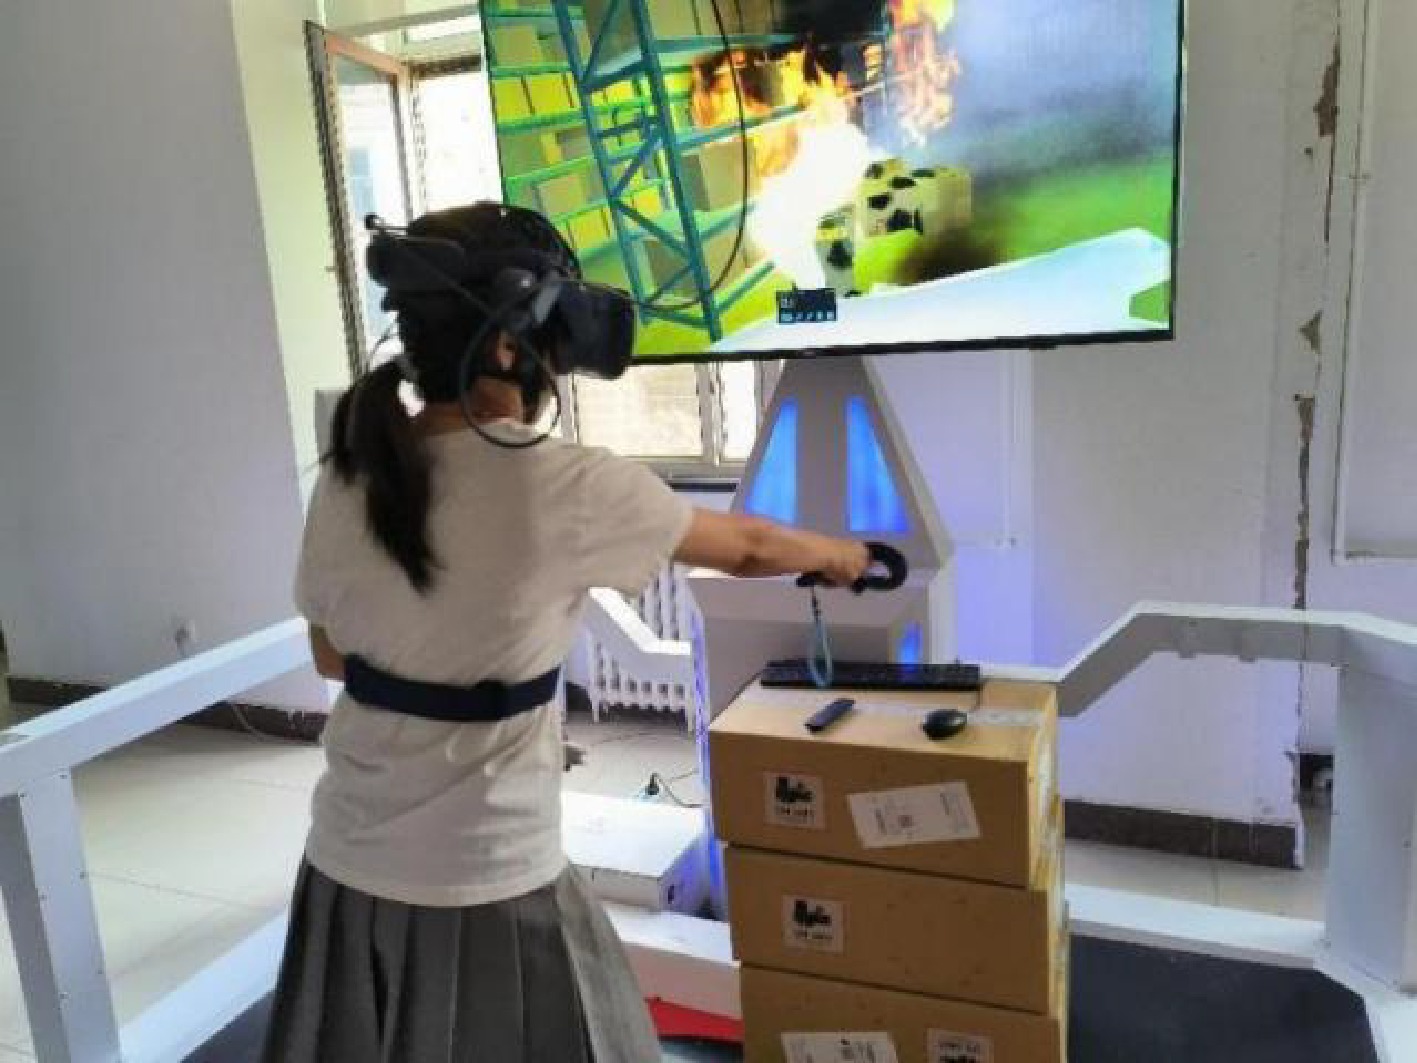
Figure 8.
Subject in the experiment.
-
The results of the Virtual Reality System Subjective Evaluation Scale filled in by the subjects were statistically analyzed, and the results are shown in Table 2.
Table 2. Descriptive statistics of university emergency virtual situation project scores.
Serial number Scoring item N Mean
valueStandard deviation 1 Fidelity of 3D objects 81 5.74 1.070 2 Test the fidelity of the task 81 5.79 1.104 3 You can freely control movement in the scene 81 5.86 1.181 4 The scene can bring a sense of urgency to escape 81 5.95 1.629 5 You can concentrate in the scene 81 6.32 0.849 6 There was no discomfort during the experiment 81 6.62 0.982 Valid N (list state) 81 Eighty-one subjects scored six items in the questionnaire, with a full score of seven for each item, with an average score of more than 80%. The validity of the experimental scenario is proven. The mean score of each item is shown in Fig. 9.
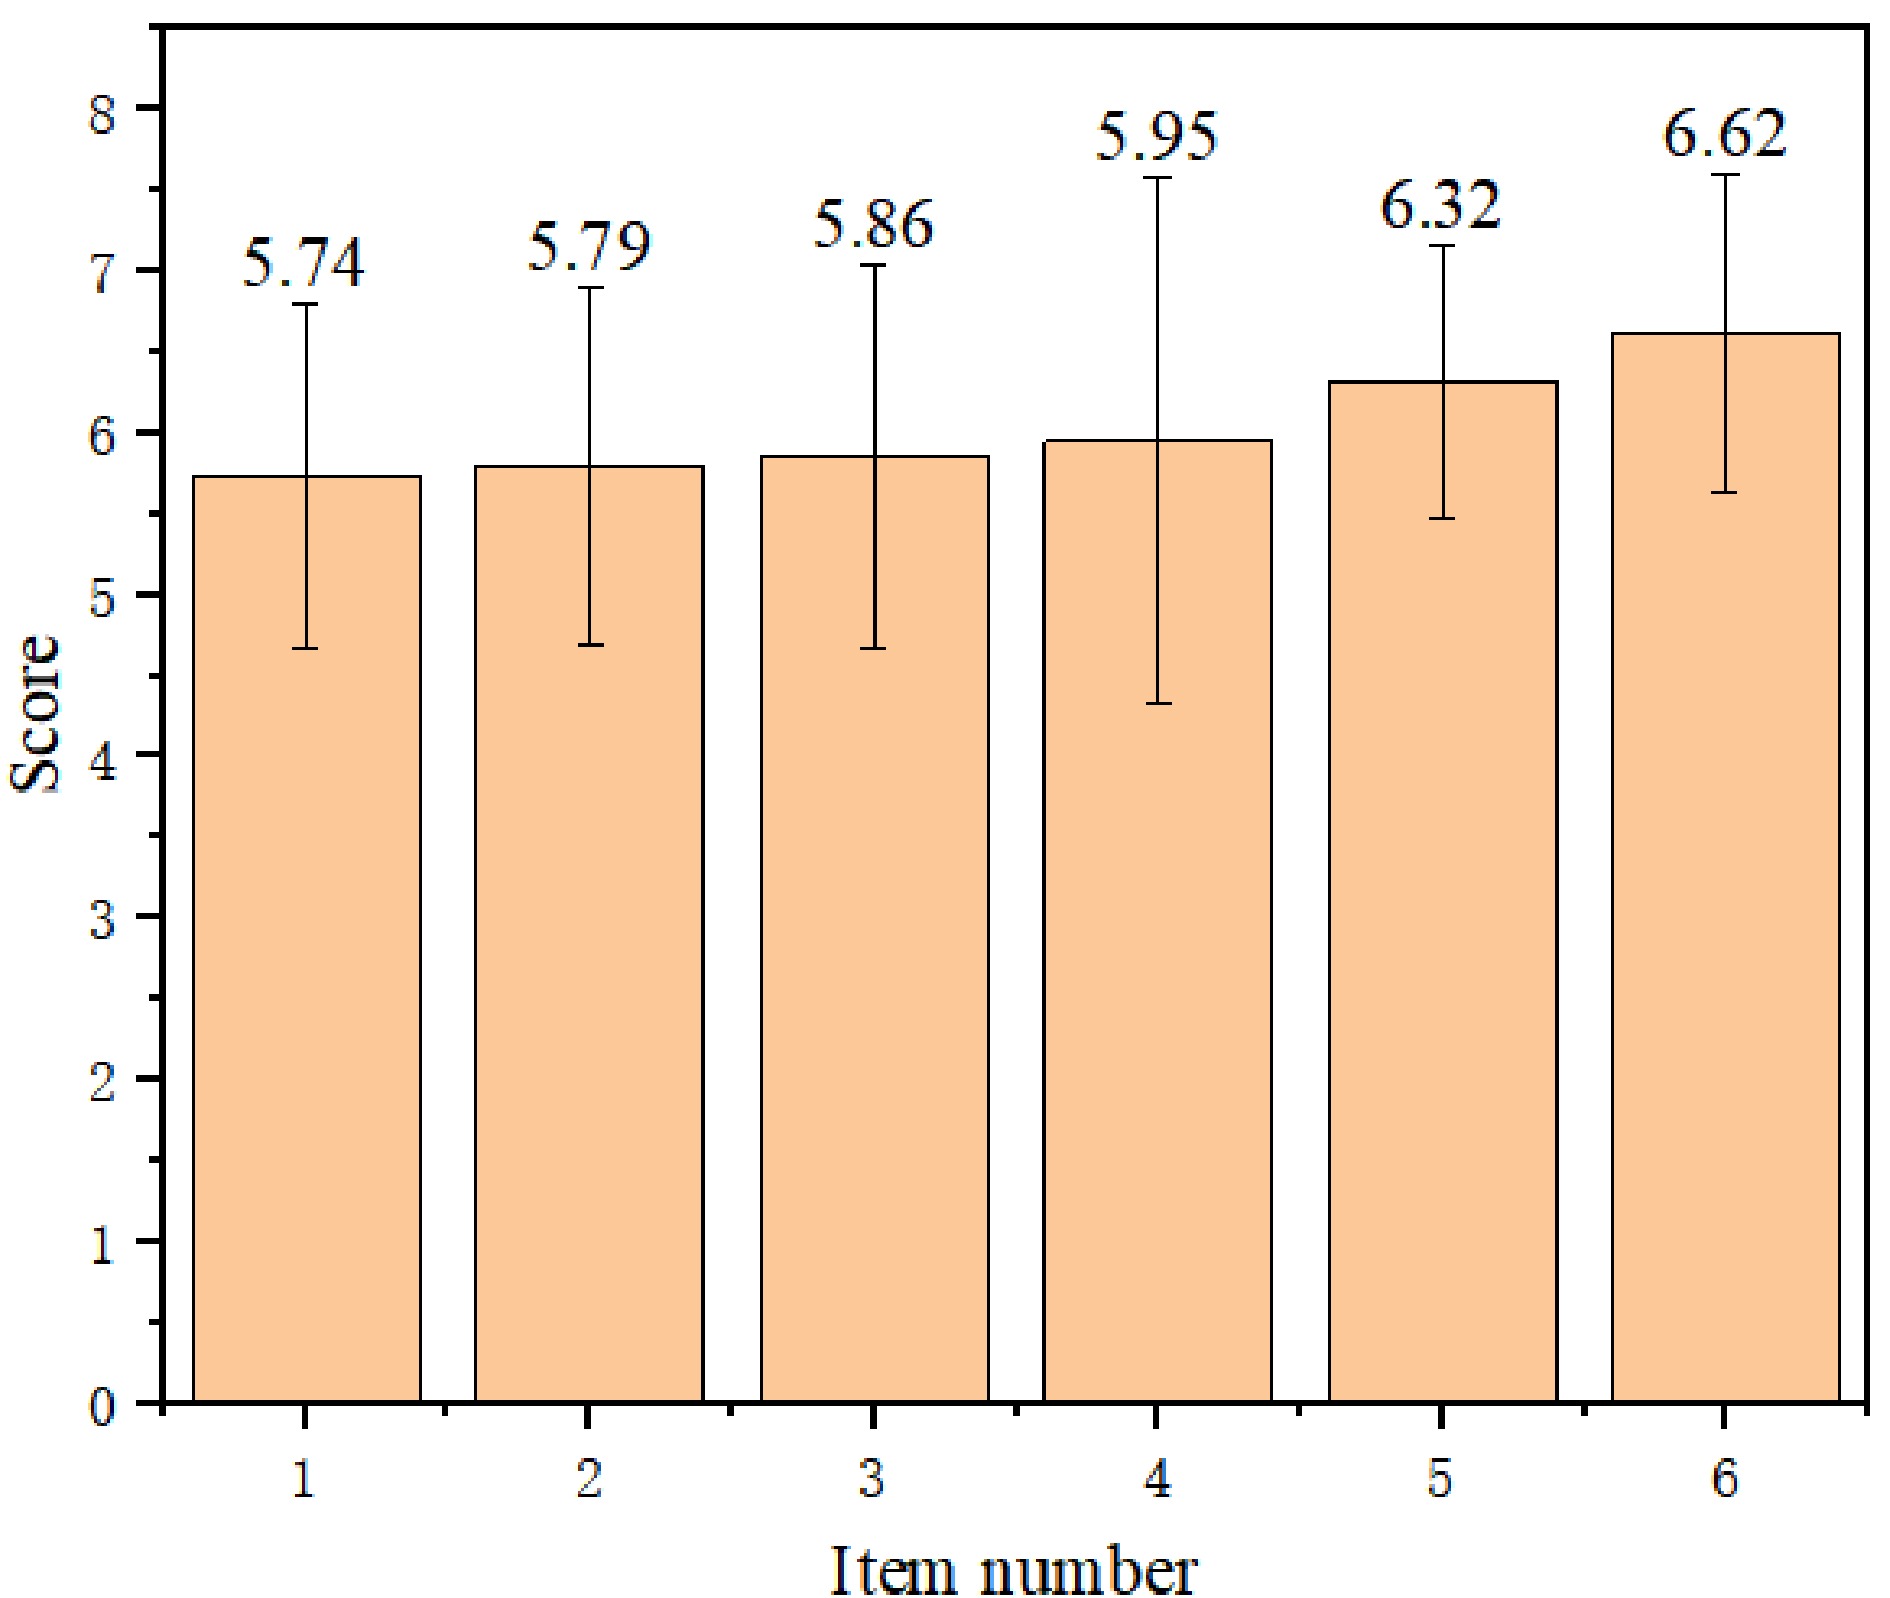
Figure 9.
Mean scores of subjective evaluation items in virtual situations.
Test of physiological data fluctuation
-
In this section, physiological signals 60 s before the experiment were intercepted as physiological signal values in the resting period, and fragments with significant fluctuations in physiological signal data in the fire and earthquake scenes were taken 30 s apart respectively The mean value of each subject's physiological signals in the two scenes was calculated as physiological signal values in the event period.
Figure 5 shows the number of only child and non-only child subjects in diffierent physiological indicattors. Tables 3 & 4 mainly show the paired differences of the two samples, as well as the T-test values, degrees of freedom values and significance probability P. Among them, the significance probability values of LF/HF, skin electricity, respiratory rate, heart rate and NN50 are all less than 0.05, and the T-values are −2.797, −4.707, −9.720, −7.246, respectively. −2.267 were all less than 0, indicating that the physiological indexes of the five groups in the event period were significantly improved. The results show that the five groups of physiological indicators selected in this paper have physiological significance.
Table 3. Mean value of physiological indexes.
Resting period Event period LF/HF 2.252 3.781 Skin electricity (us) 10.031 11.856 Respiratory rate (times per min) 16.407 20.621 Heart rate (times per min) 81.340 89.190 NN50 9.950 12.810 Table 4. Five groups of physiological indicators paired sample test.
Physiological index Mean value Standard
deviation95% confidence interval for the difference t P Lower limit Upper limit Resting period LF/HF - Event period LF/HF −1.529 5.466 −2.613 −0.445 −2.797 0.006 Resting period electrocution - Event electrocution −1.825 3.574 −2.596 −1.054 −4.707 0.000 Resting respiratory rate - Event respiratory rate −4.214 4.335 −5.074 −3.353 −9.720 0.000 Resting heart rate - Event heart rate −7.850 10.833 −9.999 −5.700 −7.246 0.000 Resting period NN50 - Event period NN50 −2.860 12.616 −5.363 −0.357 −2.267 0.026 The changes of LF/HF and NN50 increased significantly during the event period, indicating that the balance between the sympathetic nerve and vagus nerve changed and the sympathetic nerve activity was dominant. The increasing trend of skin electrocution in the event period indicated that the participants were emotionally nervous in the virtual situation, and the enhanced sympathetic nerve effect would lead to the increase of sweat secretion, resulting in enhanced skin conductivity. The respiratory rate showed an increasing trend in the event period, indicating that the subjects experienced emotional changes in the virtual situation of university emergency, and their breathing would become short, resulting in a significant increase in the respiratory rate. The significantly increased heart rate (HR) indicates that individuals show nervous emotions in the virtual situation of university emergency, which is in agreement with the results of previous studies.
In summary, the five groups of physiological indicators have significantly changed, and the trend of change is consistent with previous studies on the correlation between emotion and physiological response.
Significance test of influencing factors
-
In this paper, the change rate of physiological indexes from the resting period to the event period was used as the evaluation parameter of physiological response when the emergency occurred. The following formula shows the calculation method:
${A}_{{i}}=\dfrac{{{h}}_{{i}}-{{q}}_{{i}}}{{{q}}_{{i}}} $ (1) In Eqn. (1), A is the change rate of physiological indexes from the resting period to the event period, hi is the value of physiological indexes in the event period of each subject, qi is the value of physiological indexes in the resting period of each subject, n is the total number of subjects, i = 1,2,3...... n. According to the above formula, the change rate of physiological indicators from the resting period to the event period was calculated for 100 subjects.
According to the characteristics of different influencing factors, the single factor test, independent sample T test and Pearson correlation test were conducted on the change rate of the five groups of physiological indicators, all of which required the data to conform to the normal distribution, so as to obtain more scientific data analysis results. Kolmogorov-Smirnov test on the five groups of physiological indicators found that the change rate of LF/HF and heart rate did not conform to the normal distribution, while the change rate of skin electricity, respiratory rate and NN50 conform to the normal distribution. Therefore, the change rate of LF/HF and heart rate were replaced by sqrt (original data). The rate of change of retained skin, respiratory rate and NN50, and the rate of change of physiological indexes in the five groups were in line with normal distribution.
According to the characteristics of relevant influencing factors, Pearson correlation test, independent sample T test and single factor test were conducted using SPSS 20.0 to analyze the influencing factors of age, gender, emergency knowledge and skills, psychological symptoms, professional background, origin of students, whether they had conducted emergency drills, whether they were the only child, and how interested they were in emergency knowledge.
Through the test, it was found that whether an only child or not, professional background, emergency drills and the degree of interest in emergency knowledge have regularity or significance on the change rate of physiological signals of college students in the virtual emergency situation. The specific analysis follows.
Influence of singleton or not on emergency response ability of college students
-
According to the results of the questionnaire, the number of the only child and the number of the non-only child in the five groups of physiological indicators can be obtained as follows (Table 5).
Table 5. Affect of indicators based on only child/non-only child subjects.
Indicators Number of
only childrenNumber of
non-only childrenLF/HF change rate 23 45 Rate of change of skin electricity 29 54 Respiratory rate change 31 67 Rate of change of heart rate 67 31 Rate of change of NN50 31 60 Figure 10 shows the mean change rates of various physiological indicators of the only child and non-only child subjects. In order to analyze the influence of the only child or not on the fluctuation of individual physiological data, the independent sample T test of the only child and non-only child individuals was conducted. '0' represents not the only child, and '1' represents an only child.
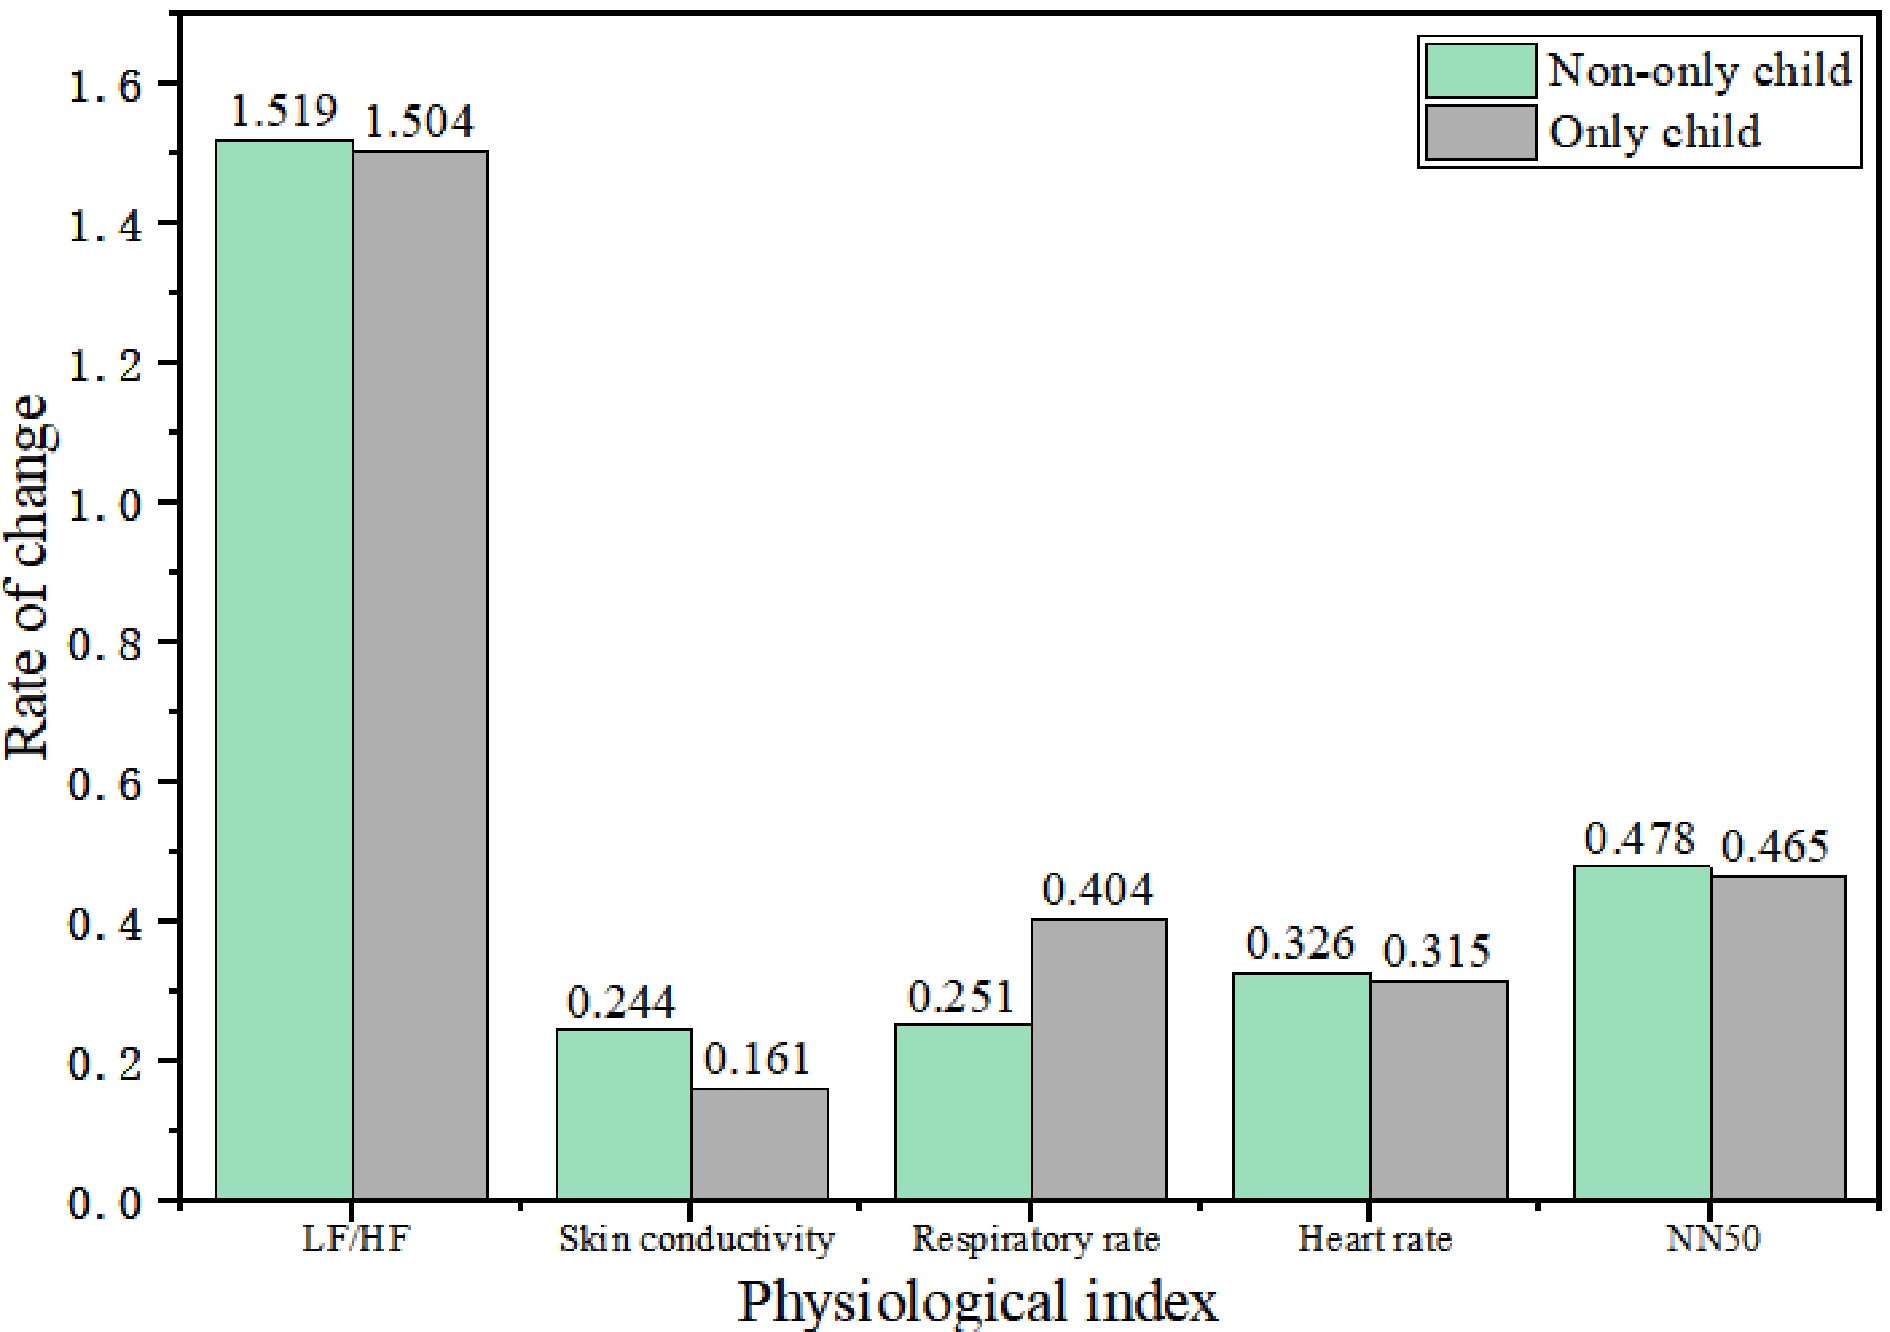
Figure 10.
Average change rate of physiological indexes in resting period and event period.
In the virtual scenario, the mean values of skin electrical change rate, heart rate change rate and NN50 change rate of non-only child subjects were higher than those of only child subjects, and the mean values of LF/HF change rate and respiratory rate change rate were lower than those of only child subjects.
The values of p were 0.951, 0.378, 0.01, 0.090, and 0.965, respectively. There was no significant difference in the changes of various physiological indexes except respiratory rate, and the respiratory rate of non-only child subjects was significantly lower than that of only child subjects.
Research on the impact of professional background on college students' emergency response ability
-
According to the results of the questionnaire, Table 6 shows the number of people with a professional background and those without a professional background in the five groups of physiological indicators.
Table 7. Independent sample test of single child and physiological indicators.
Levene test of
variance equationT test for the mean value equation F Sig. t df Sig.
(bilateral)95% confidence interval
for the differenceLower limit Upper limit LF/HF change rate Assume equal variance 0.036 0.849 0.062 66 0.951 −0.455 0.484 Assume the variances are not equal 0.06 40.539 0.953 −0.477 0.506 Rate of change of skin electricity Assume equal variance 2.231 0.139 0.887 81 0.378 −0.104 0.270 Assume the variances are not equal 0.779 40.547 0.441 −0.133 0.299 Respiratory rate change Assume equal variance 0.351 0.555 −2.642 96 0.010 −0.268 −0.038 Assume the variances are not equal −2.557 54.077 0.013 −0.273 −0.033
Rate of change of Heart rateAssume equal variance 1.233 0.27 0.299 92 0.766 −0.058 0.078 Assume the variances are not equal 0.331 65.006 0.742 −0.052 0.072 Rate of change of NN50 Assume equal variance 0.522 0.472 0.044 89 0.965 −0.599 0.626 Assume the variances are not equal 0.042 52.073 0.967 −0.642 0.669 Figure 11 shows the mean change rates of various physiological indicators of subjects without a professional background and those with a professional background. In order to analyze the influence of professional background on the fluctuation of individual physiological data, independent sample T-test of individuals with different professional backgrounds were conducted. The undergraduate students and all graduate students of the College of Safety and Emergency Management Engineering in grade two or above are students who have studied and have certain professional knowledge of safety and emergency management; the freshmen students of the College of Safety and Emergency Management Engineering and the subjects of other colleges are students who have no professional knowledge of safety and emergency management. '0' indicates no professional background, '1' indicates a professional background. The test results are shown in Table 7.
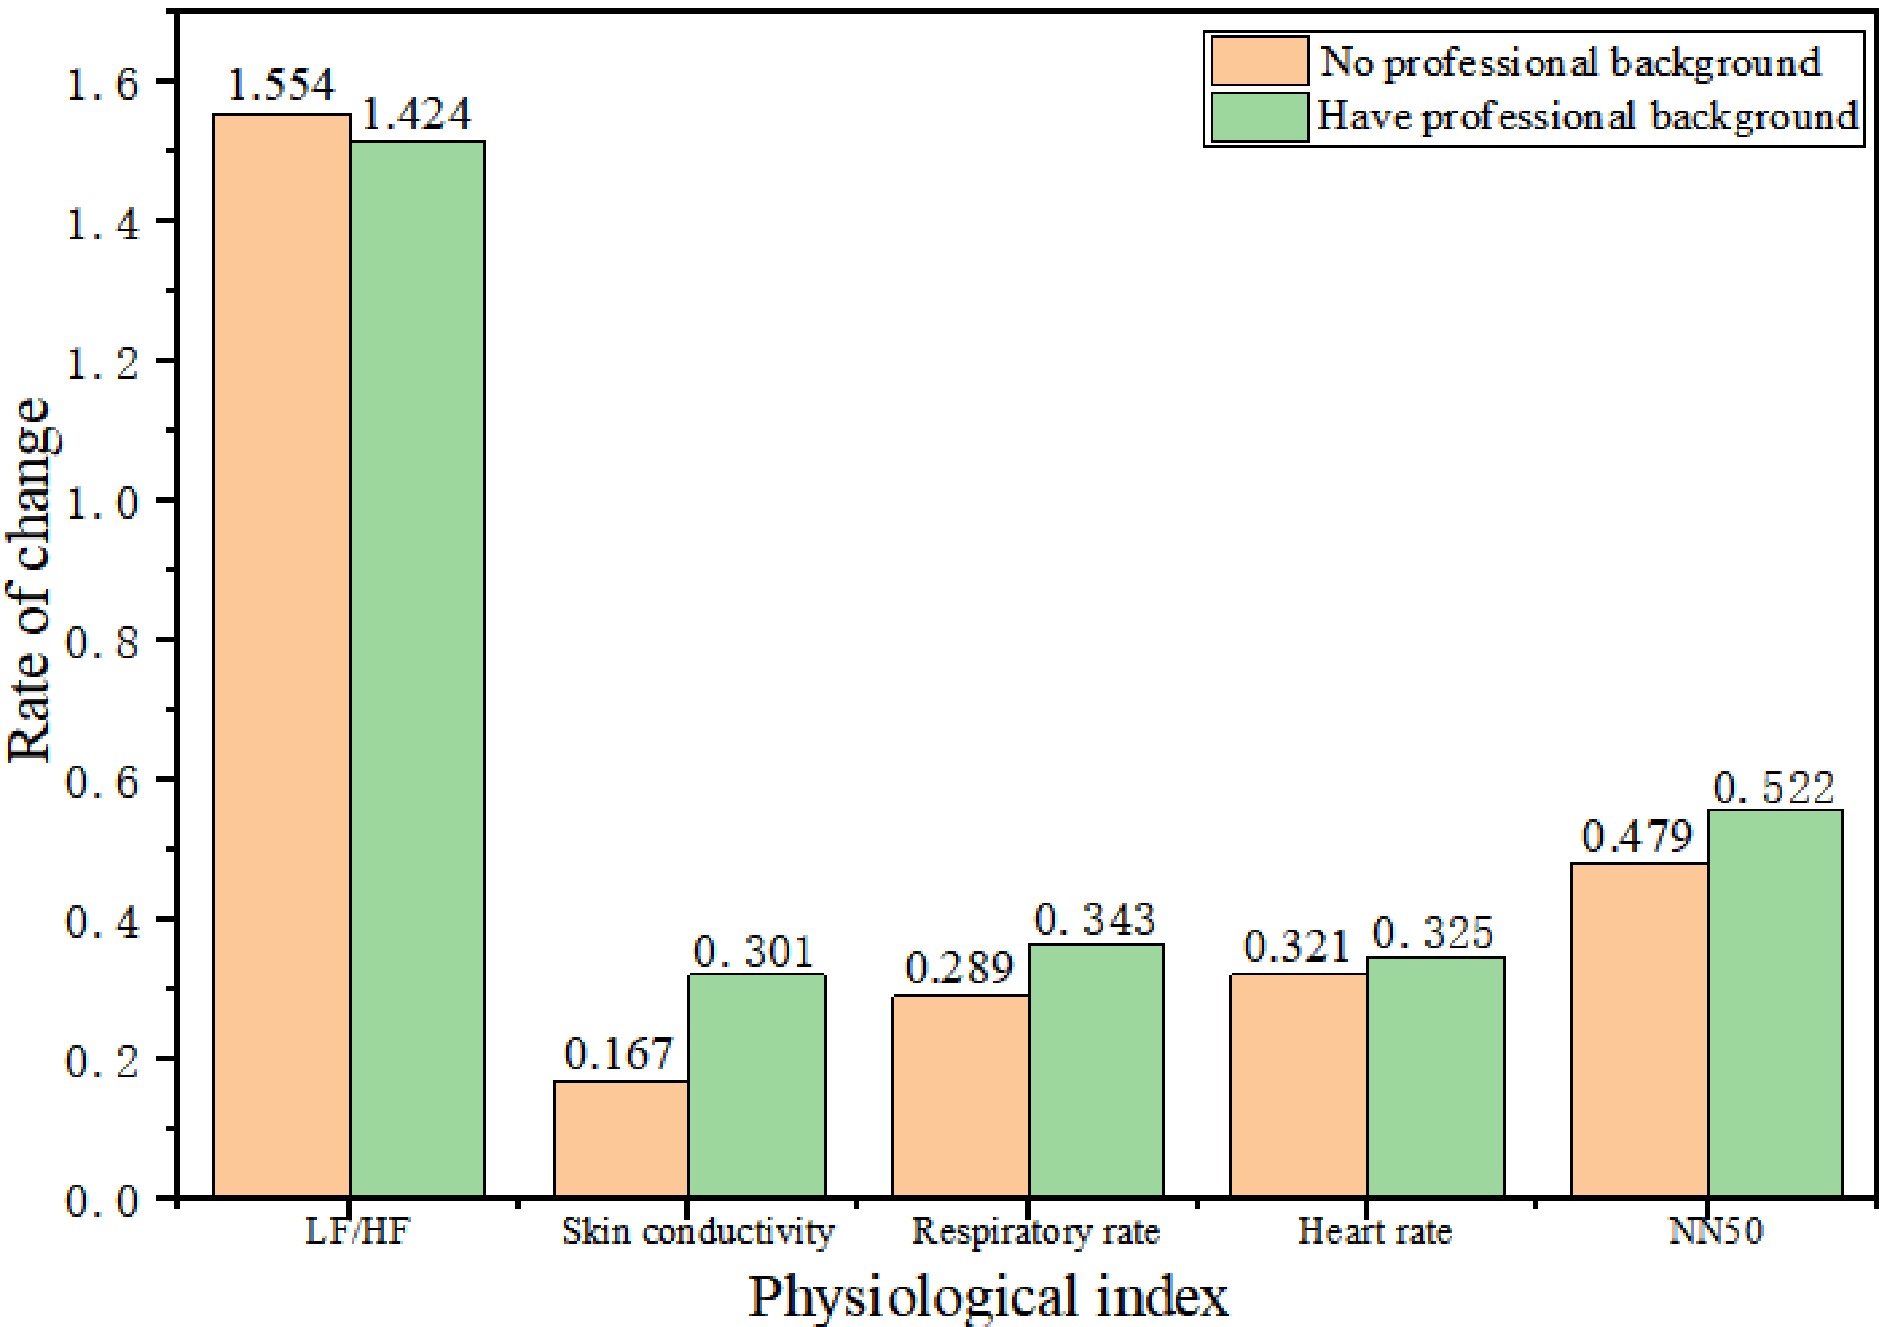
Figure 11.
The average change rate of physiological indexes in resting period and event period.
Table 6. Professional background data.
Indicators Number of subjects
with a professional
backgroundNumber of subjects
without a professional
backgroundLF/HF change rate 21 47 Rate of change of skin electricity 27 58 Respiratory rate change 31 69 Rate of change of heart rate 29 67 Rate of change of NN50 30 63 The average heart rate change rate, skin electrical change rate, respiratory rate change rate and NN50 change rate of the subjects with a professional background were higher than those without a professional background. It can be seen from Table 8 that the values of p are 0.526, 0.158, 0.375, 0.891 and 0.890, respectively, which are all greater than 0.05. Therefore, there is no significant difference in the change rate of the five physiological indicators in terms of professional background.
Table 8. Independent sample test of professional background and five groups of physiological indicators.
Levene test of
variance equationT-test for mean equation F Sig. t df Sig.(both sides) 95% confidence interval
for the differenceLower limit Upper limit LF/HF change rate Assumed equal variance 6.713 0.012 0.54 66 0.591 −0.350 0.609 Suppose the variances are not equal 0.638 58 0.526 −0.277 0.537 Skin electrical change rate Assumed equal variance 0.037 0.848 −1.423 83 0.158 −0.320 0.053 Suppose the variances are not equal −1.478 55.875 0.145 −0.314 0.047 Rate of change of respiratory rate Assumed equal variance 0.41 0.523 −0.89 98 0.375 −0.176 0.067 Suppose the variances are not equal −0.841 50.76 0.405 −0.184 0.076 Heart rate change rate Assumed equal variance 6.897 0.01 −0.118 94 0.907 −0.070 0.062 Suppose the variances are not equal −0.095 36.022 0.925 −0.088 0.080 NN50 change rate Assumed equal variance 2.144 0.147 −0.138 91 0.890 −0.653 0.568 Suppose the variances are not equal −0.123 43.378 0.903 −0.741 0.656 Research on the impact of emergency drills on college students' emergency ability
-
According to the results of the questionnaire, Table 9 shows the number of subjects who have participated in an emergency drill and the number of participants who have not participated in an emergency drill.
Table 9. Number of participants who participated in emergency drills.
Indicators Number of participants in emergency drills Number of people who have not participated in emergency drills LF/HF change rate 47 21 Rate of change of skin electricity 59 26 Respiratory rate change 59 26 Rate of change of heart rate 68 28 Rate of change of NN50 64 29 Figure 12 shows the mean change rates of various physiological indicators of the subjects who have not participated in emergency drills and those who have participated in emergency drills. In order to analyze the impact of whether or not they have participated in emergency drills on the fluctuation of individual physiological data, an independent sample T-test is conducted for individuals who have participated in emergency drills and those who have not participated in emergency drills. '0' represents that they have not participated in emergency drills, and '1' represents that they have participated in emergency drills. The test results are shown in Table 10. Table 6 shows the number of subjects who participated and did not participate in emergency drills in different physiological indicators.
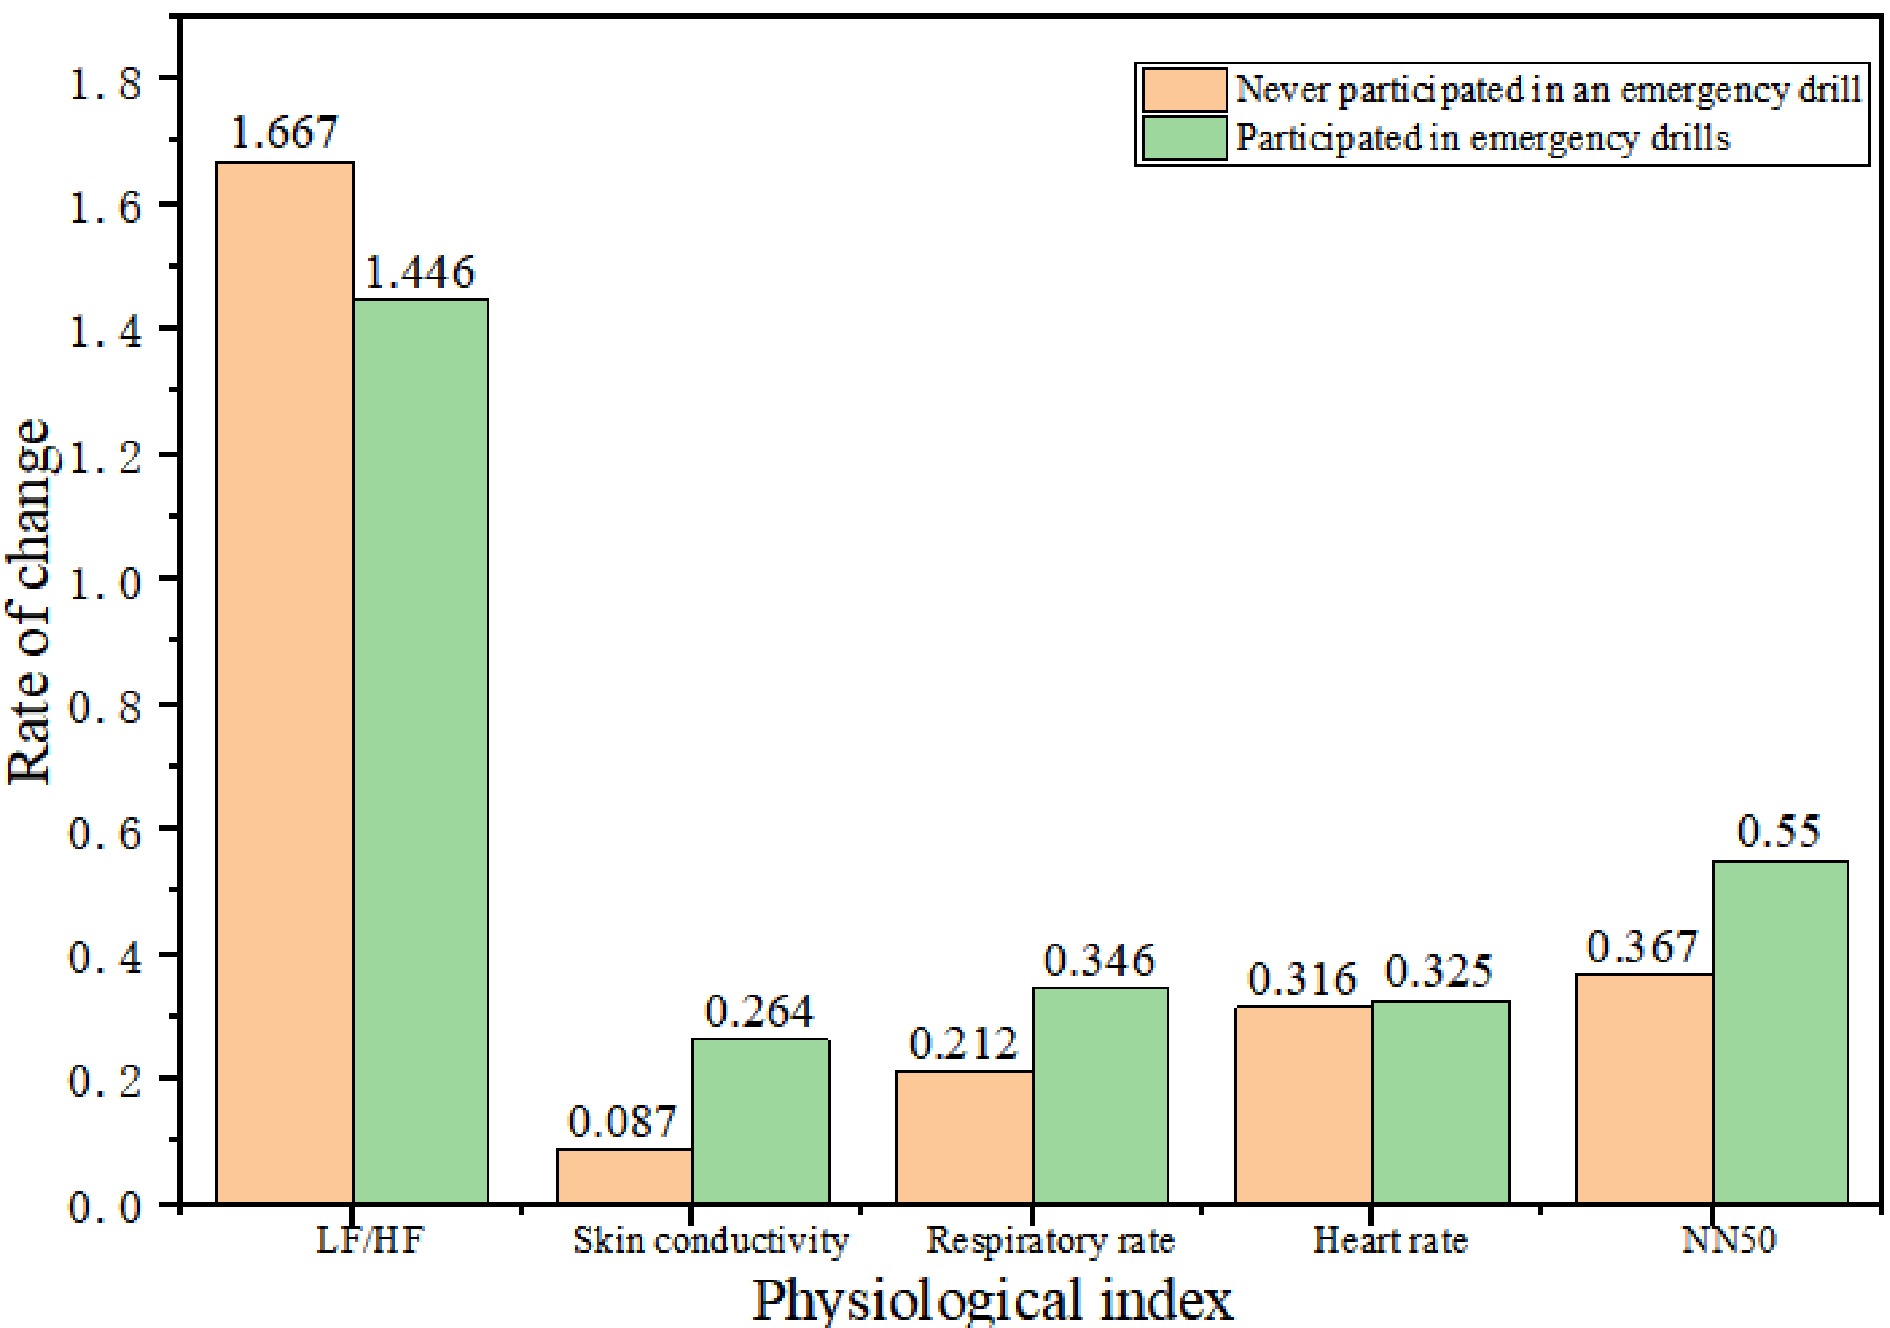
Figure 12.
The average change rate of physiological indexes in resting period and event period.
Table 10. Have participated in an emergency drill and independent sample test of five groups of physiological indicators.
Levene test of
variance equationT-test for mean equation F Sig. t df Sig.(both sides) 95% confidence interval
for the differenceLower limit Upper limit LF/HF change rate Assumed equal variance 0.553 0.46 0.926 66 0.358 −0.256 0.699 Suppose the variances are not equal 0.897 35.797 0.376 −0.279 0.723 Skin electrical change rate Assumed equal variance 1.913 0.17 −1.882 83 0.063 −0.363 0.010 Suppose the variances are not equal −2.265 74.909 0.026 −0.332 −0.021 Rate of change of respiratory rate Assumed equal variance 5.14 0.026 −2.205 98 0.030 −0.253 −0.013 Suppose the variances are not equal −2.49 73.816 0.015 −0.240 −0.027 Heart rate change rate Assumed equal variance 0.183 0.669 −0.266 94 0.791 −0.076 0.058 Suppose the variances are not equal −0.234 39.46 0.816 −0.087 0.069 NN50 change rate Assumed equal variance 1.879 0.174 −0.589 91 0.557 −0.798 0.433 Suppose the variances are not equal −0.703 83.071 0.484 −0.699 0.334 In summary, there was a significant difference in the rate of change of respiratory rate in whether or not people had participated in emergency drills (p < 0.05). The mean value of skin electrical change rate, heart rate change rate and NN50 change rate of the subjects who participated in the emergency drill were higher than those who did not participate in the emergency drill in the virtual situation, but there was no significant difference (p > 0.05).
The influence of the degree of interest in emergency knowledge on the emergency ability of college students
-
Through the questionnaire survey, we found that of the 100 participants in the questionnaire survey, all the subjects are interested in emergency knowledge. The number of people who were generally interested in emergency response knowledge and those who were very interested in the five groups of physiological indicators are shown in Table 11.
Table 11. The number of subjects interested in emergency knowledge.
Indicators Number of people who are generally interested in emergency knowledge Number of people who are very interested in emergency knowledge LF/HF change rate 30 38 Rate of change of skin electricity 40 45 Respiratory rate change 48 52 Rate of change of heart rate 47 49 Rate of change of NN50 46 47 Through the questionnaire survey, it was found that of the 100 participants in the questionnaire survey, all of them chose to be interested in emergency knowledge. Figure 13 shows the mean change rates of various physiological indicators of subjects who are generally and very interested in emergency knowledge. In order to analyze the influence of the degree of interest in emergency knowledge on the fluctuation of individual physiological data, an independent sample T-test was conducted for individuals who are very and generally interested in emergency knowledge. '0' and '1' represent subjects who are generally and very interested in emergency knowledge respectively, see Table 12.
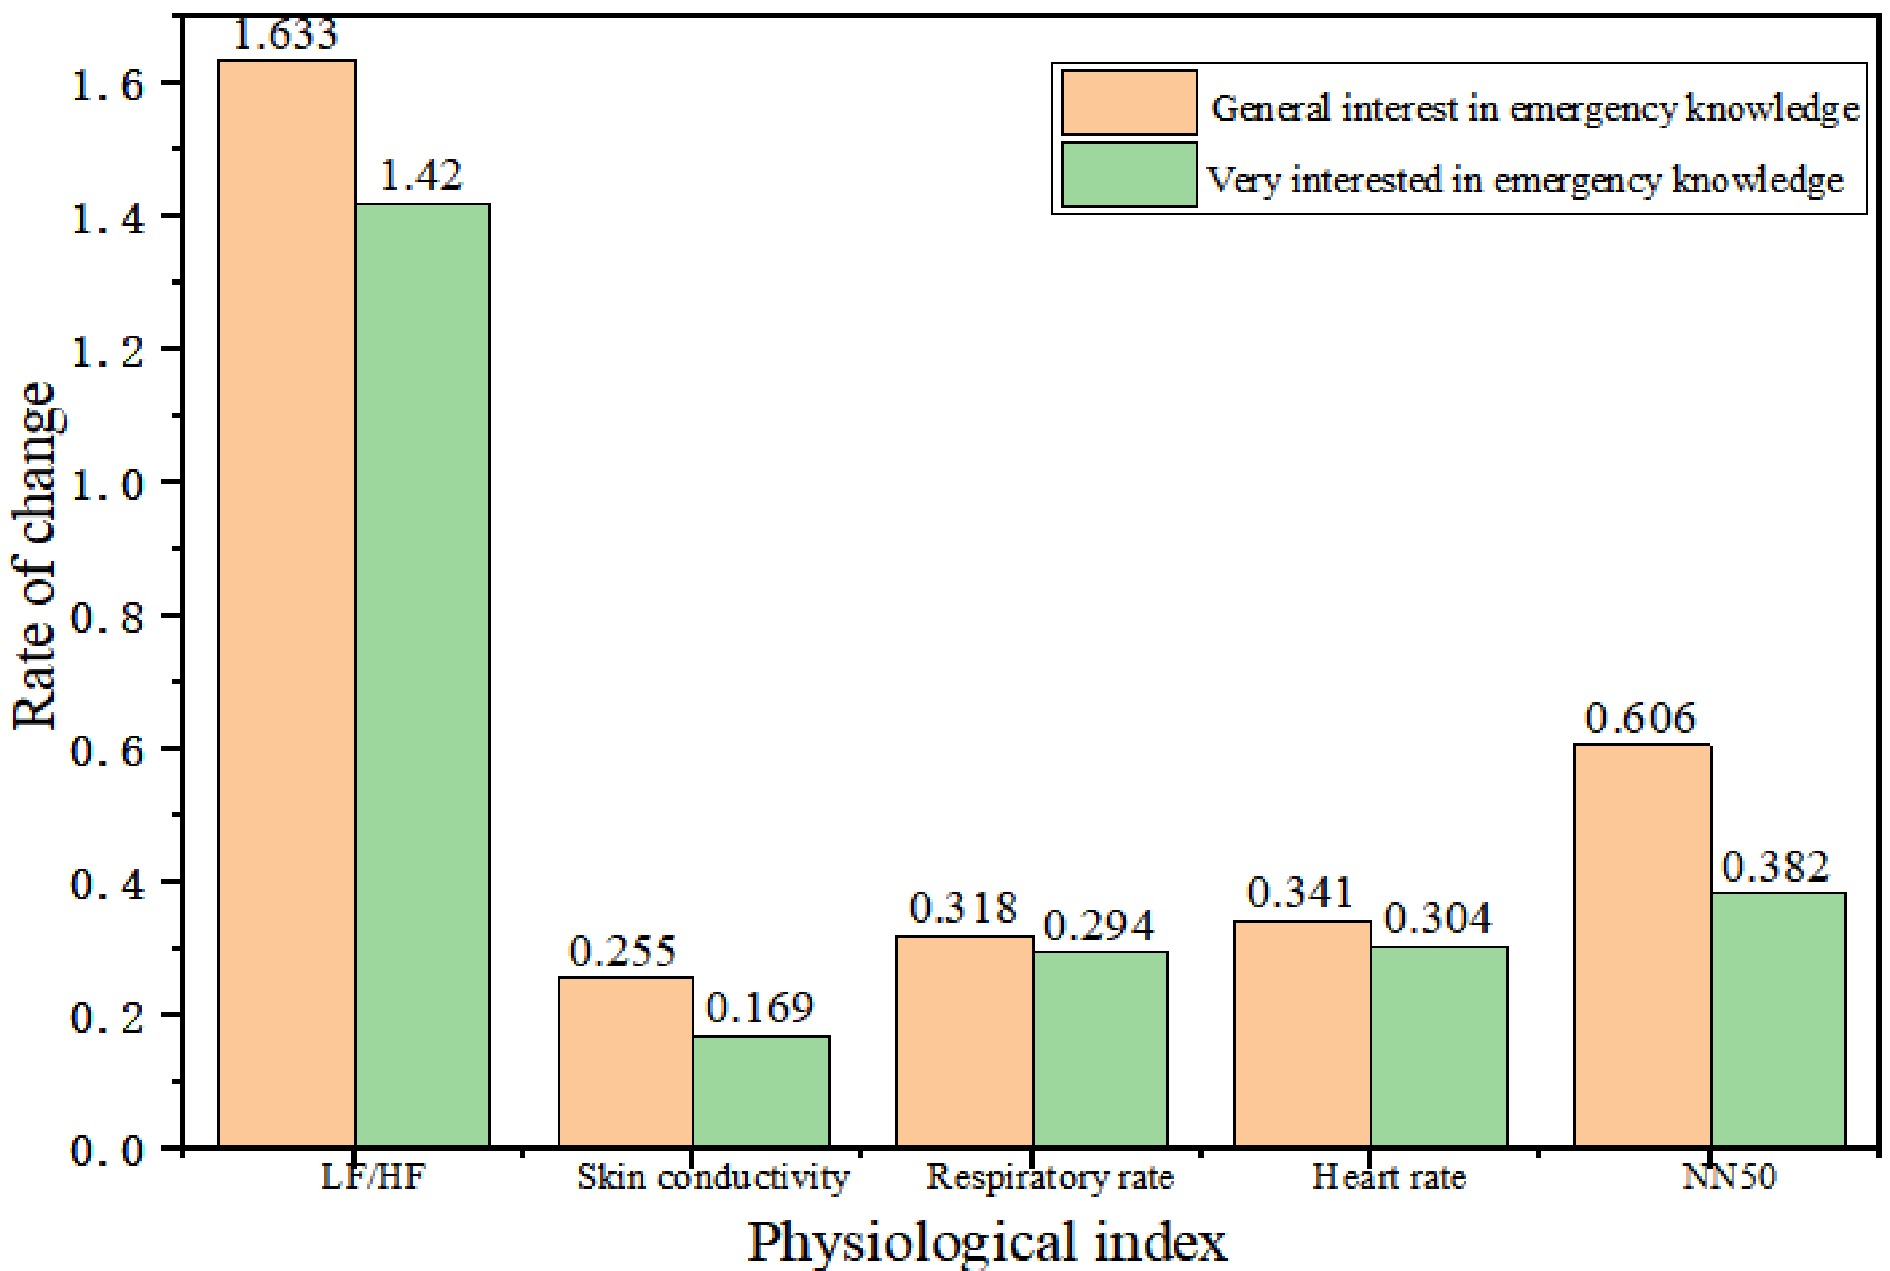
Figure 13.
The average change rate of physiological indexes in resting period and event period.
As can be seen from Table 12, the values of p are 0.343, 0.331, 0.681, 0.236 and 0.437, all of which are greater than 0.05. Therefore, there is no significant difference in the rate of change of physiological indicators among the five groups in the degree of interest in emergency knowledge. However, it can be seen from Fig. 13 that the average values of skin electrical change rate, heart rate change rate, NN50 change rate, LF/HF change rate and respiratory rate change rate of subjects who are generally interested in emergency knowledge in the virtual situation are higher than those of subjects who are very interested in emergency knowledge.
Table 12. Independent sample test of the degree of interest in emergency knowledge and physiological indicators.
Levene test of variance equation T-test for mean equation F Sig. t df Sig.(both sides) 95% confidence interval for the difference Lower limit Upper limit LF/HF change rate Assumed equal variance 0.075 0.785 0.955 66 0.343 −0.232 0.657 Suppose the variances are not equal 0.957 62.961 0.342 −0.231 0.656 Skin electrical change rate Assumed equal variance 0.315 0.576 0.978 83 0.331 −0.089 0.261 Suppose the variances are not equal 0.977 81.259 0.332 −0.089 0.261 Rate of change of respiratory rate Assumed equal variance 0.161 0.689 0.412 98 0.681 −0.089 0.136 Suppose the variances are not equal 0.411 94.784 0.682 −0.090 0.136 Heart rate change rate Assumed equal variance 0.146 0.704 1.192 94 0.236 −0.024 0.097 Suppose the variances are not equal 1.187 89.221 0.238 −0.024 0.097 NN50 change rate Assumed equal variance 2.273 0.135 0.78 91 0.437 −0.346 0.793 Suppose the variances are not equal 0.777 82.297 0.439 −0.348 0.796 The influence of other factors on the emergency ability of college students
-
In order to analyze the effect of age difference on the change of physiological indexes, Pearson correlation test was used to test the change rate of LF/HF, skin electricity, respiratory rate, heart rate and NN50, the significance was 0.09, 0.370, 0.831, 0.272, and 0.817, respectively, which was more than 0.05. Therefore, age had no significant effect on the changes of physiological indexes.
In order to analyze the influence of sex on the fluctuation of individual physiological data, the independent sample T-test was carried out for different sex individuals, and the p values were 0.954, 0.095, 0.69, 0.26, and 0.943, respectively, there were no significant gender differences in the rates of electrical growth, respiratory rate, heart rate, and NN50.
The scoring method of the questionnaire of emergency knowledge and skills of college students is that the correct answer receives a '1', the wrong answer receives a '0', and the full score is 26. Sixty percent of the time for passing 15 points, 19 points and above for excellent, 15−18 for general, 14 points and below for failure. '1' is excellent, '2' is a pass, and '3' is a fail. In order to analyze the influence of emergency knowledge and skill mastery on the fluctuation of individual physiological data, a single-factor test was conducted on the scores of the questionnaire of emergency knowledge and skill, the results showed that 25 excellent subjects, 64 general subjects and 11 failed subjects answered the questionnaire of emergency knowledge and skills. The change rates of LF/HF, skin electricity, respiratory rate, heart rate and NN50 were 0.792, 0.54, 0.886, 0.641, and 0.609 respectively, all were more than 0.05, no significant difference was found.
According to the results of Chinese norm, if the total score of SCL-90 exceeds 160, it should be further examined. In this experiment, the scores of all the subjects were all in the range of 90−250 points. We think that the subjects with the scores of 90−120 are better in psychological symptoms, and those with the scores of 120−160 are general in psychological symptoms, the psychological symptoms of the subjects with a score of 160 or more were worse. '1' means that the psychological symptoms of the subjects are good, '2' means that the psychological symptoms of the subjects are general, and '3' means that the psychological symptoms of the subjects are poor. In order to analyze the influence of psychological symptoms on the fluctuation of individual physiological data, the single factor test of the score of self-rating scale of psychological symptoms was carried out, the results showed that there were 54 subjects with good psychological symptoms, 22 subjects with general psychological symptoms and 14 subjects with poor psychological symptoms. The levels of psychological symptoms were 0.664, 0.982, 0.915, 0.124, and 0.460 in the change rate of LF/HF, skin electricity, respiration, heart rate and NN50, respectively, no significant difference was found.
In order to analyze the influence of students' place of origin on the fluctuation of individual physiological data, the independent sample t-test was carried out for individuals from different places of origin. The values of p were 0.744, 0.511, 0.377, 0.928, and 0.059, which were all greater than 0.05, respectively, so the change rate of LF/HF, skin electricity, respiratory rate, heart rate and NN50 had no significant difference in the source area.
-
The significant changes in the physiological signals of the subjects before and after the experiment were tested, and the change rate of each physiological index was calculated. In addition, Pearson correlation test, independent sample T test and single factor test were conducted for each participant's age, gender, mastery of emergency knowledge and skills, psychological symptoms, professional background, place of origin, whether they had conducted emergency drills, whether they were the only child, how interested they were in emergency knowledge, and personality. Through the test of various influencing factors, we can see that:
(1) The respiratory rate of the only child was significantly higher than that of the non-only child, probably because the non-only child had better adaptability and coordination ability through getting along with siblings;
(2) The respiratory rate of participants who had participated in emergency drills was significantly higher than that of participants who had not participated in emergency drills, which may be because participants who had participated in emergency drills and had professional background had a deeper understanding of emergencies, but had no clear understanding of their own emergency ability, which aggravated their inner panic and anxiety in dealing with emergencies and affected the fluctuation of psychological symptoms and physiological signals;
(3) This paper also found that all subjects were interested in emergency knowledge, and the change rates of the five groups of physiological indicators of subjects who were generally interested in emergency knowledge and those with a professional background were greater than those who were very interested in emergency knowledge and those without a professional background. It shows that students are eager to learn emergency knowledge, and their interest in emergency knowledge will affect their ability to deal with emergencies.
Due to the influence of various factors, there are some differences among individuals in their ability to deal with emergencies. Different individuals have different psychological responses and show different capacity when they are stimulated by unexpected events. The research on the difference of emergency ability of college students can help to determine the relevant factors, and controlling and mastering these factors can promote the emergency response ability of college students.
Based on the above results, this paper holds that colleges and universities should pay attention to enhance the effectiveness, regularity, interest and pertinence of Emergency Education and emergency drills, and enhance students' knowledge and skills of emergency in an all-round way, emergency drills are often organized to enhance the psychological quality of students to deal with emergencies, to reduce the fear of students to deal with emergencies, and to significantly improve the emergency ability of college students.
-
The authors confirm contribution to the paper as follows: study conception and design: Wang X; data collection: Li Y. Both of authors reviewed the results and approved the final version of the manuscript.
-
The data used to support this study are included within the manuscript.
-
Thanks to every participant of this experiment, thanks to the laboratory teacher Feng Zeyu, and thanks to each person who provided help in publishing this article.
-
The authors declare that they have no conflict of interest.
- Copyright: © 2023 by the author(s). Published by Maximum Academic Press on behalf of Nanjing Tech University. This article is an open access article distributed under Creative Commons Attribution License (CC BY 4.0), visit https://creativecommons.org/licenses/by/4.0/.
-
About this article
Cite this article
Wang X, Li Y. 2023. Experimental research on college students' emergency ability and its influencing factors in virtual emergency situations. Emergency Management Science and Technology 3:16 doi: 10.48130/EMST-2023-0016 

Experimental research on college students' emergency ability and its influencing factors in virtual emergency situations
- Received: 12 June 2023
- Accepted: 14 November 2023
- Published online: 30 November 2023
Abstract: In this paper, the physiological emergency ability of college students and its influencing factors are analyzed using the experimental method. College students are grouped according to gender, age, emergency knowledge mastery, psychological condition, professional background, origin of students, interest in emergency knowledge, whether they have conducted emergency drills, whether they are the only child, etc. The difference between each influencing factor and individual physiological index is significant. It provides a theoretical basis for improving the emergency ability of college students, and makes up for the theoretical gap that few experimental methods are used to study the emergency ability of college students.