


-
Vitis aestivalis-derived 'Norton', a North American species-based cultivar, is grown in the midwestern and eastern United States, regions with high disease pressure and cold winter temperatures for which V. vinifera is not adapted[1,2]. The "best red wine of all the nations" is how Dan Mouer, an eastern United States winemaker and writer, describes some 'Norton' wines produced from old Missouri vines, but he was not the first to state it. That distinction was awarded by judges of the 1873 World Fair in Vienna[3,4]. 'Norton' lacks the intense "foxy" aromas associated with Vitis × labruscana cultivars (e.g. 'Concord')[5,6]. However, 'Norton' grape composition still presents several challenges for premium wine production, the most commonly reported being high organic acids, high pH, and low tannin[7−10].
The major organic acids in grapes are tartaric acid and malic acid which together constitute up to 90% of the total berry acids[11]. High concentrations of malic acid result in excessive sourness, which is associated with diminished wine quality[12,13]. Excessive tartaric acid is of less consequence than malic acid because the solubility of tartaric acid in wine is limited. Both tartaric and malic acid accumulate in the berry pre-veraison, but malic acid is the sole organic acid metabolized in grapes[14−16]. Thus, malic acid content on a per-berry basis will decrease post-veraison, while tartaric acid remains stable. However, on a concentration basis, both organic acids will undergo dilution due to berry expansion during ripening[17]. In 'Norton' malic acid and tartaric acid concentrations typically range from 3.2 to 7.8 g/L and 6.0 to 10.1 g/L, respectively, which are high compared to V. vinifera cultivars. V. vinifera values are often approximately 1.7−4.2 g/L for malic acid and 1.7−7.9 g/L for tartaric acid[18−20].
Excessive wine pH facilitates oxidative and microbial spoilage[21]. The relationship between pH and total acid is inverse but imperfectly correlated and influenced by variation in both organic acid compositions and the partial exchange of titratable protons for minerals, especially potassium[21−24]. Ranges for pH in 'Norton' between approximately 3.4 and 3.9 have been reported[7,9]. These ranges are comparable to V. vinifera reds pH (3.2−4.2)[18−20]. A moderate pH for 'Norton', despite high organic acids, is likely a consequence of its higher potassium content (up to 6 g/L) as compared to V. vinifera[7].
Low tannin results in low wine astringency which also diminishes wine quality[25]. Tannin also accumulates prior to veraison but remains localized to the seed coating and outer skin of grapes[21,26,27]. Whole grape tannin is generally low in Norton, approximately 2.9 mg/g via a methyl cellulose precipitable tannin assay[9,28]. In comparison, high tannin red wine cultivars like V. vinifera 'Cabernet Sauvignon' have methyl cellulose precipitable tannin concentrations of approximately 4.2−5.5 mg/g homogenate[29].
While cultivar-type and growing region are substantial determinants of organic acid composition, limited adjustment can be achieved with manipulation of the environment and cultural practices[30,31]. It can be, instead, more effective to manipulate organic acids during vinification using practices such as potassium bitartrate precipitation, carbonate salt addition, and malolactic fermentation[32]. However, these practices cannot fully address high acid musts – especially those with high malic acid – and may result in unwanted sensory changes[33]. Low tannin wines can potentially be remediated by the addition of exogenous tannins sourced from grapes or other plant species. However, the recovery of added tannins to wines is low due to binding to other wine components especially in those produced from interspecific hybrids, and the expected sensory impact is negligible.
The inheritance of berry traits with enological importance, such as acidity and tannins, has begun to be investigated in grapevine. Chen et al.[34] reported six QTLs on two linkage groups for malic acid with each accounting for a small percentage of variation. Other studies have reported QTLs for malic acid, tartaric acid, and their ratio[35−38]. However, the observed QTLs vary across studies and thus may be unique for a V. aestivalis-derived cultivar. Identifying the DNA markers linked to fruit quality traits will be important for the preservation of wine quality while maintaining pest and/or disease resistances possessed by the cultivar.
Modern marker-assisted selection strategies involve the development of mapping populations and the construction of linkage maps. The single nucleotide polymorphism (SNP) markers have become widely used for this purpose and successfully implemented in Vitis spp. in the last 10 years[36,39−41]. Specifically, genotyping-by-sequencing (GBS)-derived SNPs have proved to be a successful, fast, and low-cost marker system[2,36,40], despite concerns regarding the high number of SNP calling errors in heterozygous species which results from low read depths associated with the method[42,43]. Using SNPs in linkage map construction can overcome the low marker density of maps generated exclusively from simple sequence repeat (SSR) markers[34,36]. However, SNP markers have limited transferability between Vitis species[44]. Given the widespread use of interspecific hybrids for developing improved cultivars, the high transferability of SSR markers remains an important advantage. Previously, a mapping population of 183 genotypes from 'Norton' × 'Cabernet Sauvignon' was used to construct a linkage map via 411 SSR markers[45]. This map was then improved by integrating 1,665 GBS-derived SNP markers to develop a high-density linkage map for further horticultural studies[2]. The use of both SSR and SNP markers for linkage map construction provides the opportunity to improve both marker density and transferability.
The present study investigated the genetic determinants of tartaric acid, tannin, pH, and malic acid using an expanded 'Norton' × 'Cabernet Sauvignon' mapping population. The population was genotyped using GBS-derived SNP and SSR markers and phenotyped over three years. An improved, high-density linkage map was developed with additional markers and used to identify QTLs for all investigated traits.
-
A total of 63,488 SNPs were generated from GBS. After filtering GBS markers to minimums of 90% population coverage, 0.10 minor allele frequency, and 0.10 heterozygous proportion, 9,663 markers remained. After thinning by physical position, the GBS marker number was 3,366. All SNPs were successfully converted to JoinMap format using the NGSEP (Next Generation Sequencing Eclipse Plugin) program. Markers which sorted into incorrect groups based on the reference genome were discarded after an initial mapping. In total, 2,502 SNP and 402 SSR were used at the outset of the final map construction. The final consensus map (Supplemental Fig. 1) included 2,468 markers (384 SSR and 2,084 SNP) which covered 1,441.9 cM and represented 19 LGs (Table 1). Linkage groups varied in size and marker number from 63.6 cM (LG 15) to 95.8 cM (LG 7) and 81 markers (LG 15) to 171 markers (LG 14). Marker density averaged 0.75 cM between markers.
Table 1. Marker distributions of the 'Norton' × 'Cabernet Sauvignon' consensus genetic map.
LG No. of markers Inter-marker distances (cM) Length
(cM)Total SSR SNP Average Maximum 1 149 29 120 0.72 3.4 80.3 2 109 15 94 0.78 3.4 69.1 3 89 13 76 0.86 6.8 63.7 4 154 29 125 0.72 4.5 79.0 5 121 21 100 0.71 4.3 70.4 6 164 17 147 0.67 3.8 78.7 7 170 27 143 0.69 3.6 95.8 8 167 24 143 0.66 3.8 84.8 9 99 14 85 0.85 3.4 70.7 10 99 14 85 0.75 3.6 64.2 11 110 21 89 0.79 5.9 71.4 12 122 14 108 0.72 3.8 66.0 13 145 13 132 0.70 3.1 87.7 14 171 45 126 0.62 3.8 87.0 15 81 8 73 0.96 8.4 63.6 16 114 17 97 0.82 4.3 74.3 17 125 13 112 0.72 2.7 75.1 18 167 36 131 0.72 5.4 94.5 19 112 14 98 0.76 3.4 65.9 Total 2,468 384 2,084 0.75 8.4 1,441.9 Of the 2,468 markers used, the dominant segregation patterns were informative for one of two parents. Those which varied in only 'Norton' (lm × ll) included 1,400 (56.7%) SNPs and 120 (4.9%) SSRs while markers segregating exclusively in 'Cabernet Sauvignon' (nn × np) numbered 552 (22.4%) SNPs and 29 (1.2%) SSRs. Markers that segregated with two identical alleles in both parents (hk × hk) numbered 132 (5.3%) SNPs and 3 (0.12%) SSR. The remaining 232 (9.4%) markers segregated with more than two alleles. SSRs which were fully informative for both parents (ab × cd) totaled 147 (6.0%) and tri-allelic SSRs (ef × eg) counted 85 (3.4%). Distorted markers (α < 0.05) were seen randomly distributed on every linkage group (LG) with regions of clustering also present. These markers were included in the final genetic linkage map unless they hindered linkage map construction.
Phenotypic evaluations
-
All traits varied continuously (Fig. 1). Each year, traits were evaluated in 131 to 186 individuals (Table 2). In 2019, pH and malic acid mean values were lower than other years while tartaric acid was greater in 2019 than 2018. The smallest range for each trait was reported in 2018. Tartaric acid in 2019 and tannin in 2018 were more broadly distributed across the trait range than seen in the other reported year. The only trait that was normally distributed was pH in all years, according to a Shapiro-Wilk's test (p ≥ 0.05). The normality of all traits was improved through the Box-Cox transformation.
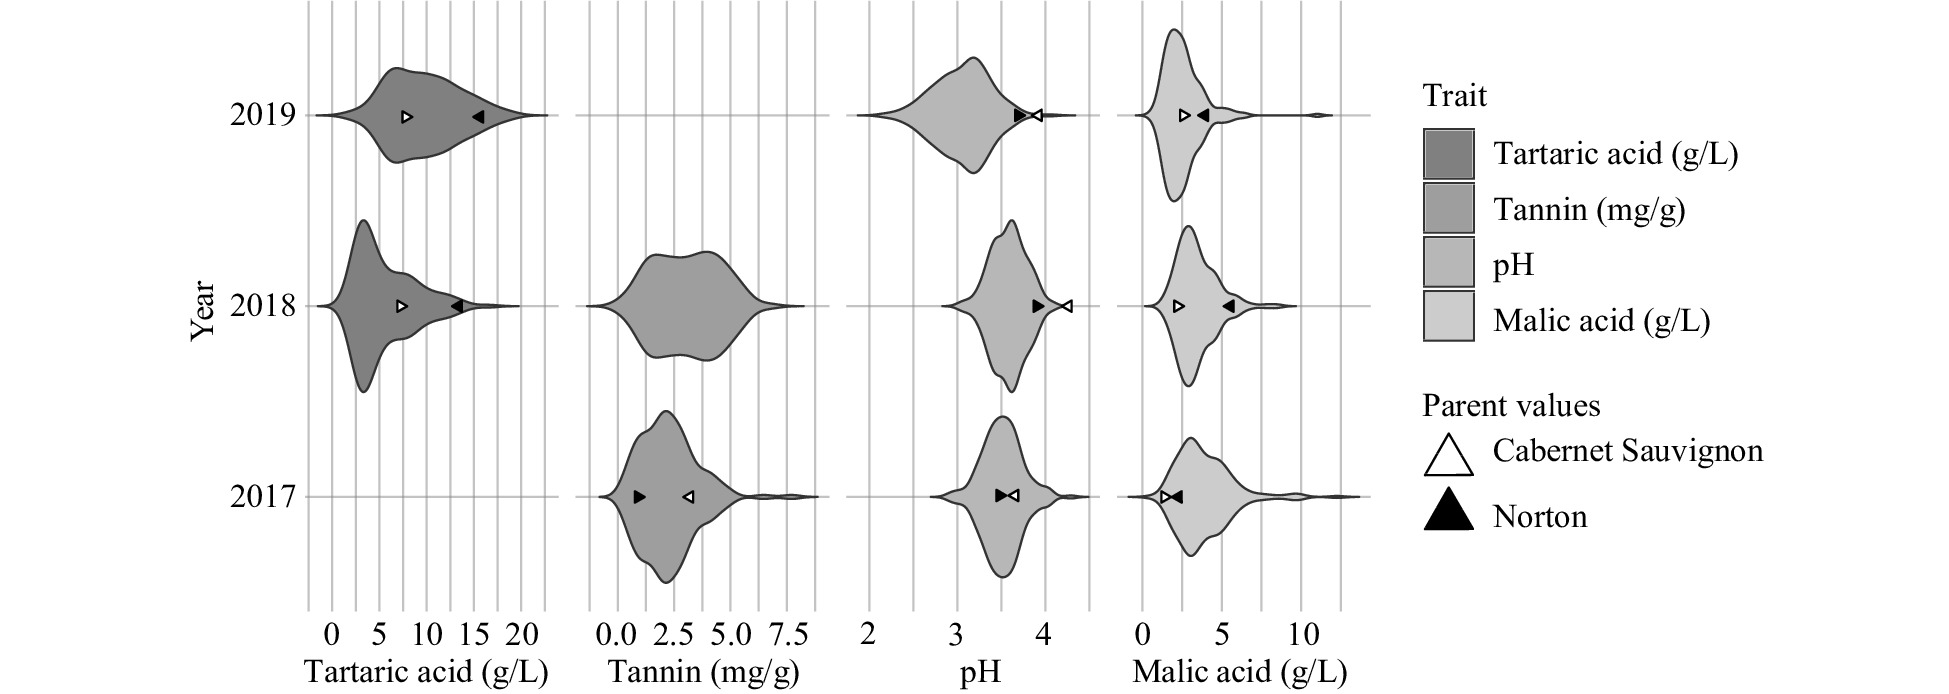
Figure 1. Frequency distribution (violin plot) of berry quality traits by year.
Table 2. Summary statistics and broad-sense heritability values for evaluated traits.
Trait Year N1 Mean H2 (2) Minimum Median Maximum Tartaric acid (g/L) 18 138 5.5 0.24 1.7 4.4 16.6 19 183 9.7 1.9 9.3 19.2 Tannin (mg/g3) 17 131 2.3 0.46 0.36 2.1 7.7 18 175 3.1 0.07 3.2 6.8 pH 17 179 3.5 0.32 2.9 3.5 4.3 18 143 3.6 3.0 3.6 4.1 19 186 3.1 2.2 3.1 4.0 Malic acid (g/L) 17 178 3.9 0.70 0.52 3.5 12.3 18 138 3.4 1.3 3.2 8.5 19 185 2.5 0.50 2.3 11.0 1 N: Number of individuals, (2) H2: Broad sense heritability, 3 epicatechin equivalents Malic acid reported here (0.50−12.3 g/L) exceeded the range reported in V. vinifera populations (approx. 1.1−7.6 g/L)[19,24] but was within the range of other Vitis spp. populations (approx. 0.80−21.3 g/L)[34,36]. Tartaric acid values (1.7−19.2) exceeded those reported for V. vinifera (1.4−7.9 g/L)[19,24] and in 2019 slightly exceeded the range seen in another interspecific hybrid population (1.5−17.2 g/L)[34]. The pH range (2.2−4.3) was similar to other V. vinifera populations (3.0−4.3)[1,24]. Mean tannin concentrations in the population (2.3 and 3.1 mg/g epicatechin equivalents in 2017 and 2018, respectively) were comparable to or below the lowest levels reported in three V. vinifera cultivars using the same assay[29]. Mean values of the hybrid population were similar to 'Norton' (mean values of 2.5−3.4 mg/g)[9,28]. Overall, malic and tartaric acid values exceeded, and tannin values were lower than those seen in V. vinifera populations.
Broad-sense heritability was 0.24 for tartaric acid, 0.46 for tannin, 0.32 for pH, and 0.70 for malic acid (Table 2). Tartaric acid was significantly correlated (p < 0.05; Pearson test) between the years 2018 and 2019 (0.23) (Table 3). Significant correlations also existed for pH between 2017 and 2018 (0.54), 2017 and 2019 (0.52), and 2018 and 2019 (0.67). Malic acid was also correlated between years 2017 and 2018 (0.66), 2017 and 2019 (0.50), and 2018 and 2019 (0.66). Tannin (0.13) was not correlated between years. Due to the logarithmic nature of the pH scale, pH was converted to hydrogen-ion concentration ([H+]) for evaluation of linear partial correlation. Results of the partial correlations, malic acid and pH (as [H+]) were correlated in 2018 and 2019 (p ≤ 0.05) with coefficients of 0.40 and 0.20, respectively. The remaining traits were not significantly correlated.
Table 3. Pearson correlation coefficients between years of trait evaluation.
pH Malic acid Tannin Tartaric acid 2017 2018 2017 2018 2017 2018 2018 0.54 ***1 0.66 *** 0.13 ns 2019 0.52 *** 0.67 *** 0.50 *** 0.66 *** 0.23 * 1 ***: p < 0.001, *: p < 0.05, ns: not significant QTL detection
-
Acid-related phenotypes (tartaric acid, pH, and malic acid) were analyzed in three data sets which were divided by year, while tannin was analyzed separately from the acid traits in two data sets by year. At the genome-wide level (GW) of significance (p < 0.05), 12 quantitative trait loci (QTLs) were identified and distributed across ten linkage groups (Table 4). Tartaric acid, tannin, pH, and malic acid showed 5, 1, 3, and 3 QTLs, respectively. The GW significance thresholds varied in each trait and were relatively high, ranging from a LOD score of 5.1 (pH 2017, malic acid 2019) to 5.9 (tartaric acid 2018), so individual thresholds were retained for each trait. The maximum LOD scores for the reported QTLs varied between 5.1 (pH LG 6) and 9.0 (pH LG 4, malic acid LG 8) and the percentage of variance explained (PVE) by each ranged from 8.8 (tartaric acid LG 6) to 24.7 (tannin LG 2). Significant QTLs were identified in all traits.
Table 4. Summary of QTLs for wine grape juice components in 'Norton' × 'Cabernet Sauvignon' F1 population.
Trait LG Year Max LOD GW LOD threshold PVE Peak (cM) 1.5-LOD interval (cM) Physical interval (bp) Tartaric acid 1 2019 7.0 5.2 12.3 43.0 41.5−44.6 8335044−9738524 6 2019 5.2 5.2 8.8 39.1 30.6−41.5 6679935−7615750 7 2019 6.9 5.2 12.1 36.7 35.8−37.3 8215450−9475359 9 2018 7.0 5.9 14.1 5.2 5.0−6.1 198079−460535 17 2018 7.1 5.9 14.3 56.8 56.4−56.8 9295617−10144592 Tannin 2 2018 5.8 5.5 24.7 54.6 36.5−54.6 6360230−15748193 pH 4 2019 9.0 5.3 21.6 53.4 51.8−56.4 16450987−18940320 6 2017 5.1 5.1 16.2 2.8 2.8−43.9 141387−11607560 2018 7.0 5.4 19.2 46.0 44.0−46.0 14849083−15724160 2019 6.6 5.3 20.2 49.4 43.4−54.0 8139288−16573962 8 2018 5.9 5.4 13.0 32.8 32.0−33.2 8553958−10498296 Malic acid 8 2017 9.0 5.2 19.6 30.5 30.2−36.0 9992297−11975066 2018 7.3 5.3 20.1 32.8 14.0−39.6 2400696−11975066 2019 7.6 5.1 13.4 31.2 30.6−31.2 9992297−10385236 14 2019 6.8 5.1 13.7 7.9 6.4−8.2 1426689−1955725 18 2019 5.9 5.1 9.5 21.2 21.2−21.8 4020114−4997180 Both malic acid and pH had a QTL stable across three years. The LOD maximums for the stable malic acid QTL on LG 8 were positioned within a 2.3 cM range in all three years. The 1.5 LOD confidence intervals converged on the interval between 30.6 and 31.2 cM and were associated with the physical interval from 9992297−10385236 bp. Within this QTL region, the alleles with the largest magnitude of effect (i.e. effect size) on the malic acid phenotype all segregated for 'Norton' (Table 5). Regarding the allele with the greatest effect size for marker VVS4, individuals possessing the allele length of 183 bp (progeny genotypes 183/169 bp and 183/173 bp) had an average malic acid concentration 0.74 g/L greater than individuals which inherited the 169 bp allele from 'Norton' (progeny genotypes 169/169 bp and 169/176 bp). (Fig. 2a). Both SSR and SNP marker effects reported for this QTL were significant (p < 0.05). Additional single-year (2019) QTLs were detected for malic acid on LGs 14 and 18. On LG 14, phenotype averages differed between 'Cabernet Sauvignon' alleles while on LG 18 significant effects were seen from 'Norton' alleles. Effect sizes from LGs 14 and 18 were smaller (0.65 and 0.54 g/L) than those on LG 8 (0.74 g/L).
Table 5. Allele effects and parental genotypes of markers associated with berry acid and tannin QTL.
Trait LG Marker Allele Effect size Parental genotype Physical position (bp) 'Norton' 'Cab Sauv' Tartaric acid 1 1_8118509 T 1.5 *1 AT AA 8118509 VVIP60 332 −2.4 *** 310/332 307/315 8803413 VMC7g5 167 2.3 *** 157/167 171/186 9804330 6 VMC2G2 131 −1.3 * 128 127/131 5819478 6_6679935 A −1.6 ** GG AG 6679935 VMC2F10 105 1.5 * 95/114 95/105 7615750 7 ctg9481 403 −0.40 ns 394/397 394/403 7446186 VMC1A2 149 0.52 ns 108/217 108/149 8230151 7_16971155 A −1.2 − GG AG 16971155 9 9_240934 T −0.30 ns GT GG 240934 FAM26 301 1.0 − 295/301 295/303 461325 17 17_9295617 C 0.62 ns CT TT 9295617 17_9884306 C 1.7 ** AC AA 9884306 17_10144592 C −1.1 − AC AA 10144592 Tannin 2 VVIO55 148 −0.81 *** 144 144/148 5523290 2_6360230 C 0.81 ** CT TT 6360230 FAM24 266 0.84 *** 266/270 270/277 13396269 FAM24 277 0.77 *** 266/270 270/277 13396269 VMC8C2 196 0.80 *** 148/196 148/150 17514943 VMC8C2 150 0.80 *** 148/196 148/150 17514943 pH 4 VVIN75 194 0.20 *** 196/212 188/194 14823485 VMC2E10 59 0.25 *** 53/55 57/59 17456655 VVIP77 191 0.21 *** 180/186 186/191 19317923 62 6_9366152 A 0.09 ** GG AG 9366152 6_12192456 T −0.11 *** CC CT 12192456 VVS5 128 0.10 *** 113/NULL 104/128 12956677 6_13625084 C 0.14 *** GG CG 13625084 6_14347587 T 0.12 *** CC CT 14347587 VMC4G6 130 0.12 *** 124/140 124/130 15179752 8 8_7718022 T 0.03 ns CC CT 7718022 VMC7H2 135 0.07 − 125/132 122/135 10149243 8_10699999 T −0.03 ns CC CT 10699999 Malic acid 82 VVS4 183 0.74 *** 169/183 169/176 9992297 VMC7H2 125 0.68 *** 125/132 122/135 10149243 8_10159975 T 0.69 *** CT CC 10159975 8_10222803 G 0.53 ** AG AA 10222803 FAM16 326 0.67 *** 326/329 329/329 10384476 14 VVC62 204 0.65 ** 184/188 184/204 1426689 14_1714481 A 0.60 ** CC AC 1714481 14_2083206 A 0.51 * GG AG 2083206 18 18_4020114 T 0.42 * AT AA 4020114 18_4607745 G 0.54 * CG CC 4607745 VMCNg1b9 151 0.22 ns 151/160 160/160 5645610 1 ***: p < 0.001, **: p < 0.01, *: p < 0.05, −: p < 0.10, ns: not significant, 2 QTL effects were calculated using BLUP values in place of single year data. 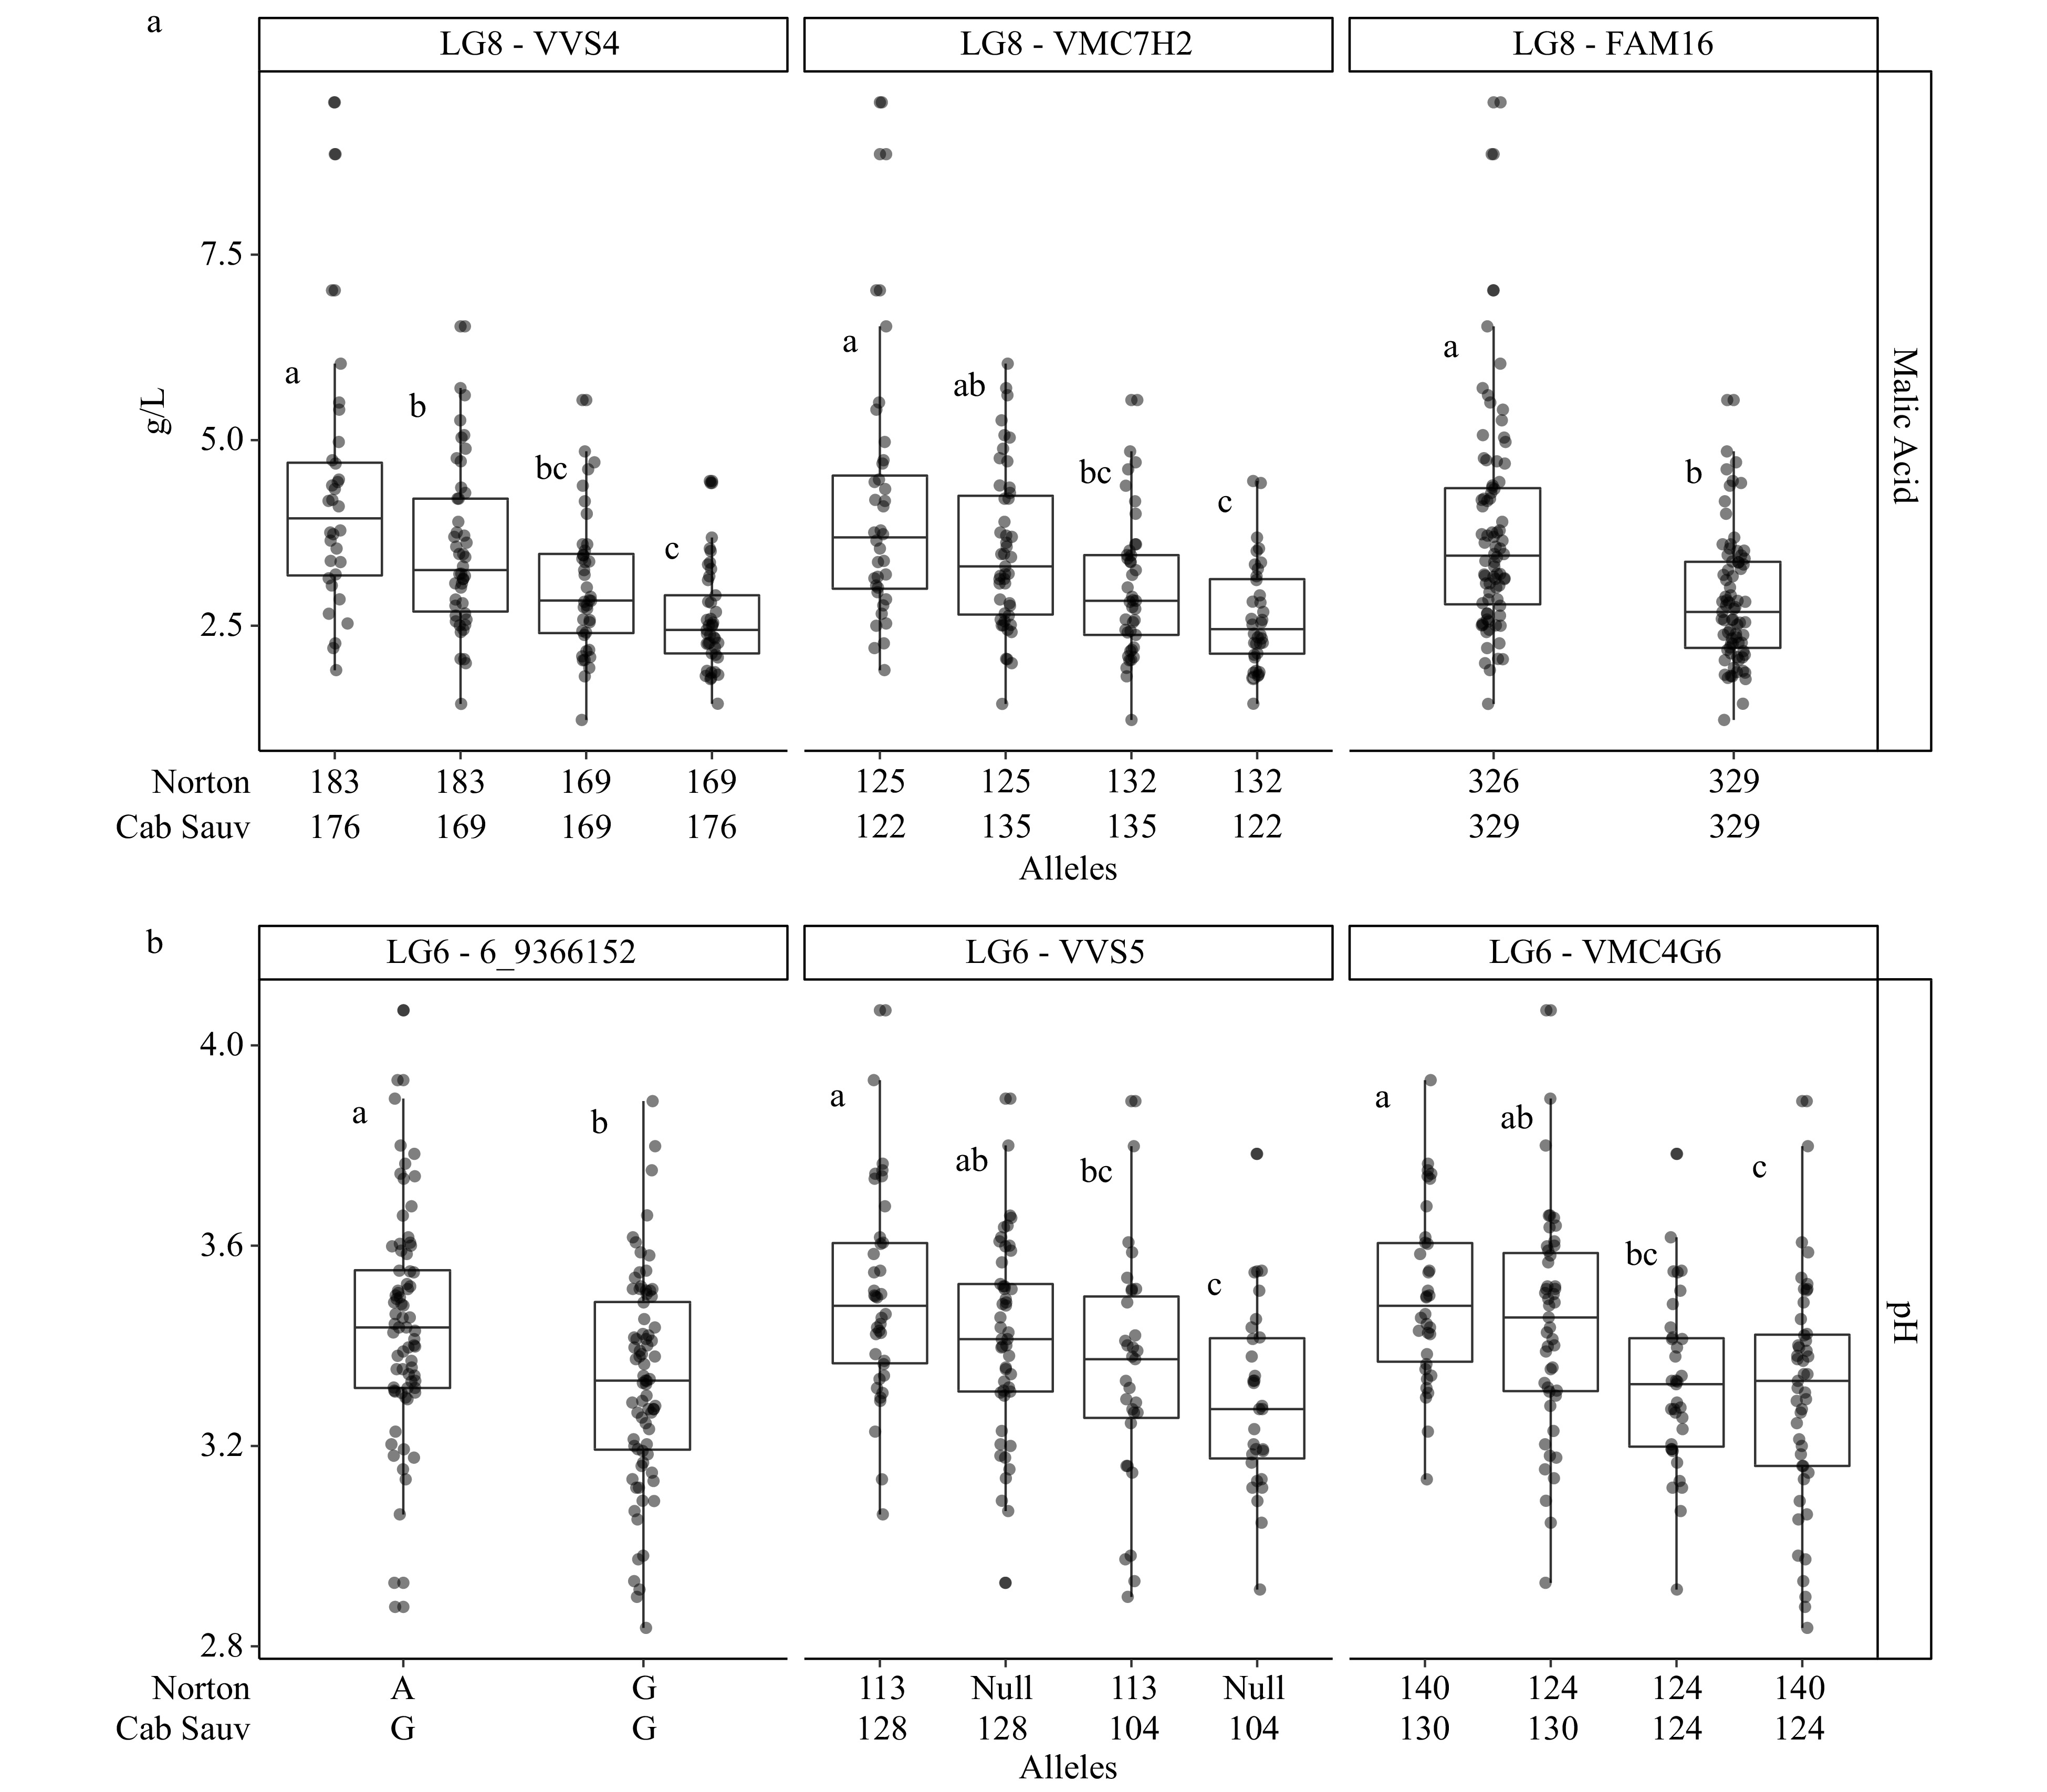
Figure 2. Phenotypes as BLUP values for (a) malic acid and (b) pH assorted by alleles from markers associated with stable QTLs on LG 8 and 6. Statistical significance as determined by Tukey's HSD test (p < 0.05) has been designated with different letters.
A stable QTL associated with pH was located on LG 6 at a common interval of 43.9 to 46.0 cM on the linkage map and 11607560 and 15724160 bp in physical position. An increased average pH corresponded with allele size 128 (Cabernet Sauvignon) of marker VVS5 (Fig. 2b) The effect size at this marker was a 0.10 difference between alleles (Table 5). Single-year QTLs for pH were also detected on LGs 4 and 8. The effects of alleles on LGs 4, 6, and 8 associated with pH were all attributed to Cabernet Sauvignon. Effects on LG 4 (0.20−0.25) were the greatest of those reported for pH. The pH QTL on LG8, which appeared to co-locate with the stable malic acid QTL, was attributed to 'Cabernet Sauvignon' but only nearly significant (p < 0.10) allele effects were seen.
The remaining traits, tartaric acid and tannin, demonstrated only single-year QTLs. QTLs associated with tartaric acid were located on LG 1, 6, 7, 9, and 17. 'Norton'-associated allele effects were found on LG 1, 9, and 17, while 'Cabernet Sauvignon' alleles explained variation on LGs 6 and 7. Only two markers were reported on LG 9 as 9_240934 was a marker interior to the reported physical region but also the most distal informative marker. Tannin also showed a single QTL located at LG 2 which explained the highest percentage of all trait variation at 24.7%. Tannin allele effects were significant for alleles from both parents. Effect sizes were very similar for all reported alleles with the central marker having a slightly higher 'Norton' attributed effect (0.84 g/L) as compared to 'Cabernet Sauvignon' (0.77 g/L). Additional markers were reported to represent both parental effects.
-
V. aestivalis-derived 'Norton' has achieved regional acceptance in states such as Missouri, Arkansas, and Virginia[5]. Its popularity with growers may be attributed to high levels of resistance to many destructive diseases, pests, and winter temperatures. However, the flavor chemistry of 'Norton' (low tannin, high malic acid) diminishes its acceptability as compared to international red V. vinifera cultivars, such as 'Cabernet Sauvignon'. Prior to this investigation of berry quality traits, a 'Norton' × 'Cabernet Sauvignon' mapping population was developed[46] and two linkage maps were constructed for 'Norton'[2,45]. Here we report on the increase of the mapping population, improvement upon previous maps, and identification of QTLs related to berry traits. These advancements may be useful in the marker-assisted selection of progeny possessing the complex agronomical traits of 'Norton'.
Genotyping and genetic maps
-
QTL analysis results that approach fine-mapping to the greatest degree possible are desirable for accurate marker-assisted selection. Increasing mapping resolution requires capturing more recombination events within a region of interest. This can be accomplished through larger population sizes and increased marker numbers[47]. The integrated SSR and SNP-based map for this population was improved by both the addition of new F1 genotypes and a greater number of markers compared to the previous SSR[45] and integrated SSR and SNP[2] maps (Table 6). In comparison to the 2019 map, this map was constructed using 64 more F1 individuals in the mapping population and 396 more markers. The map size was reduced by 236.7 cM (1,678.6 cM) from the 2017 map and 761.6 cM from the 2019 map (2,203.5 cM). The average interval between markers was decreased by 3.4 cM and 0.35 cM from 2017 and 2019, respectively. In addition, there are no gaps in length greater than 10.0 cM which is an improvement over the previous maps which contained 26 (2017) and 4 (2019) such gaps[2,45]. The reduction in map size likely results from improved genotype error handling and minimized missing data[48,49]. Lep-MAP3 uses genotype-likelihoods rather than observed genotypes for all calculations which makes map ordering more robust against potential genotyping errors[50]. Additionally, the SNP marker diversity is more reflective of increased heterogeneity expected from a hybrid Vitis spp. cultivar -'Norton' in comparison to a V. vinifera cultivar -'Cabernet Sauvignon'. Of the markers segregating in a single parent (2,102 SSRs and SNPs) nearly three-fourths (72.3%) were polymorphic for 'Norton'. Further improvements included the reducing percentage of missing data allowed in the initial marker set to below 10%. The map size of 1,441.9 cM was maintained within the range of other published maps (1,301.0−1,967.4 cM) as was the average marker spacing of 0.75 cM (0.41−2.5 cM)[34,40,51,52]. Segregation distorted loci were included during map construction to minimize potential marker gaps, as distorted markers are often clustered which was also observed in the final map[53]. The longest gap of 8.4 cM was located on LG 15 (Table 1). Linkage group 15 contains the fewest markers, so the increased marker spacing compared to other LGs should be expected.
Table 6. Comparison between the previously published and current genetic map constructed for the 'Norton' × 'Cabernet Sauvignon' F1 population
Year Marker type Population size Number of markers Map size (cM) Average distance between loci (cM) Number of gaps >10 cM 2017 SSR 183 413 1,678.6 4.1 26 2019 SSR, SNP 159 2,072 2,203.5 1.1 4 2020 SSR, SNP 223 2,468 1,441.9 0.75 0 Phenotyping
-
Variation in traits among years indicated the influence of environment. Substantial defoliation, which has been shown to impact berry quality, did occur during all years because of considerable Japanese beetle (Popillia japonica) populations during and after veraison. Increased sun exposure and leaf removal have been shown to decrease malic acid in 'Norton'[9,28]. The malic acid levels from Jogaiah et al.[28] decreased from 5.8 g/L with full shading to 3.2 g/L with full sun exposure. Jogaiah et al.[9] similarly showed a reduction in malic acid from 7.8 g/L to 3.9 g/L with leaf removal at fruit set. If similar reductions in malic acid occurred in our 'Norton' × 'Cabernet Sauvignon' population in 2017−2019 due to leaf damage, a difference of approximately 3.0 g/L malic acid would be enough to shift the population means (3.9, 3.4 and 2.5 g/L) from the low end of the expected value range to the mid-upper section of the range. In 2019, slightly warmer temperatures from veraison until harvest than in previous years (Supplemental Table 1) in combination with the defoliation, likely contributed to the higher tartaric acid and lower malic acid means seen during that year. An additional possible factor contributing to the variability of tartaric acid and pH includes potassium bitartrate precipitation as sample preparation did not include heating which would dissolve any precipitates which occurred from freezing and thawing of the berries. A narrower range was observed for all trait values in 2018 than in other years. This attribute may be generally due to the reduced genotypes available in 2018 for tartaric acid, malic acid, and pH as this trend was also not seen in the ranges of the 95% confidence intervals for the means (data not shown).
The broad-sense heritability value of malic acid (0.70) (Table 2) was intermediate to the ranges reported by Liu et al.[19] of 0.79−0.91 and Bayo-Canha et al.[37] of 0.51−0.69. The broad-sense heritability of tartaric acid (0.24) was lower than previously seen by Liu et al.[19] (0.59−0.84) and Bayo-Canha et al.[37] (0.49−0.56) but greater than the reports of Houel et al.[35] (0.13). The heritability of pH was lower (0.32) than those of Duchêne et al.[24] (0.71−0.93). Overall, the broad-sense heritability scores indicated the traits are considerably impacted by genetic factors. The correlations between years seen for malic acid (0.50−0.66) and pH (0.52−0.67) demonstrate the stability of these traits across years. For malic acid, the high correlation and high heritability may be indicative of the consistent genetic influence as demonstrated by the QTL results. Inversely for tannin, the moderate heritability in spite of insignificant correlations between years (0.13) may be an associated effect of the considerable PVE by the single-year QTL. Correlation between malic acid and pH, on a [H+] basis, in 2018 (0.40) and 2019 (0.20), but not for other years or traits, demonstrates that pH is only weakly influenced by concentration of organic acid. Significant and nonsignificant correlations between pH and organic acids have also been seen elsewhere[54,55].
QTLs
-
QTLs have been reported on LGs 5, 6, 8, 15, and 18 related to malic acid[34,36−38]. QTLs for malic acid on LG 8 have been reported in V. vinifera populations, but not previously in an interspecific hybrid population[37,38]. Duchêne et al.[38] investigated the region from 8669988 to 13093399 on chromosome 8 for both malic and tartaric candidate genes, but the malic acid QTL may be attributed to a more defined region based on their SSR-based map[56]. That confidence interval was flanked by markers at physical positions of 10702981 and 14039528. Bayo-Canha et al.[37] presented a QTL flanked by nearest markers at positions of 5145874-14039528 bp. The confidence interval for this QTL spans approximately 8.9 Mbps making it difficult to validate against the position of the QTL on LG 8 reported here. However, the cofactors associated with the QTL of Bayo-Canha et al.[37] may indicate a more concise location of the responsible region as they are all located within the interval of 5145874−8533120 bp. The ambiguity of QTL reported on low-density maps or with relatively large confidence intervals can make it difficult to validate the uniqueness of new findings. The QTL on LG 8 reported here (9992297−10385236 bp) appears to be unique to 'Norton' as shown by the attributed alleles in Table 5. Two single-year QTLs for malic acid in 2019 were also identified on LGs 14 and 18. A QTL on LG 18 has previously been reported in an interspecific hybrid population[34]. A QTL on LG 14 has been found for pH but it has not been shown to be connected to malic acid[38].
QTLs for pH have on LGs 10, 11, 13, and 14 been previously demonstrated[38]. However, a stable QTL for pH on LG 6 identified here has not previously been reported. Additional pH QTLs were observed here on LGs 4 and 8 in single years. On LG 8, the pH QTL is located at the same position we reported for malic acid. However, differing parental alleles were shown to be responsible with pH allelic effects originating from 'Cabernet Sauvignon' rather than 'Norton' as seen for malic acid. Tartaric acid QTLs on LGs 2, 4, 6, 7, 8, and 13 have been reported previously[35,38]. Tartaric acid QTLs reported here on LGs 6 and 7 coincide with those reported by Houel et al.[35] and Duchêne et al.[38], both of which used V. vinifera-based populations. Allele effects by the V. vinifera parent in this study further supports the QTLs being identical to those previously reported. Duchêne et al.[38] also showed a QTL for the malic-tartaric acid ratio located on LG 1 which coincided with the location of the tartaric acid QTL from this study. QTLs for tartaric acid on LGs 9 and 17 have not previously been reported. The QTL for tannin on LG 2 is located within the same region as a condensed-tannin QTL identified by Huang et al.[57]. Tannins and anthocyanins are both synthesized through the same flavonoid biosynthesis pathway so similar genetic regions may play roles in both traits[58]. Significant effect sizes for alleles from both 'Norton' and 'Cabernet Sauvignon' indicate the presence of this QTL across multiple Vitis species and may explain the large PVE from the QTL despite failing to observe the QTL in a second year.
The study presented here confirms that GBS-derived SNP and SSR markers can be combined to generate a high-density genetic map for study of an interspecific F1 population. Significant QTLs for berry quality traits with enological importance were identified, some of which have not previously been seen. QTL variability within and across populations demonstrates the importance of data replication across environments and high-resolution genetic mapping for accurate QTL identification. QTLs for malic acid, tartaric acid, pH, and tannin were identified for the first time in a V. aestivalis-based population. Stable QTLs across at least two years for malic acid and pH can help guide the selection of new hybrid cultivars for improved berry quality.
-
The mapping population was developed from a crossing between V. aestivalis-based 'Norton' and V. vinifera 'Cabernet Sauvignon'. The population is located at the Missouri State Fruit Experiment Station (MSFES) in Mountain Grove, MO, USA. An initial planting in 2005 contained 74 progeny, and an additional 310 genotypes were planted in 2011 as described by Adhikari et al.[46]. Vines were spaced with 10-feet (3.0 m) between rows and 8-feet (2.4 m) within rows. A bilateral cordon system was used for vine training.
Genomic DNA was extracted from young leaves using the same procedure as Adhikari et al.[46] and stored at −20 °C for use in SSR genotyping. Additional leaf samples were collected and packaged as previously described by Sapkota et al.[2] for shipment to the VitisGen (http://www.vitisgen.org) genotyping center for the development of GBS-derived SNPs.
Genotyping
-
Genotypes for 413 polymorphic SSR markers were previously identified in the mapping population[45]. A subset of the population (159 individuals) was previously genotyped using GBS[2]. An additional 64 individuals from the mapping population were subsequently genotyped using the procedure described by Sapkota et al.[2]. Briefly, GBS was carried out according to the protocol of Elshire et al.[42] using ApeKI restriction digestion and Illumina Highseq 2000 platform for sequencing which was performed at the Cornell University Biotechnology Resource Center (BRC, Ithaca, NY, USA). Individuals in the F1 mapping population were all sequenced once and aligned to the 12× v2 V. vinifera 'PN40024'. Parental DNA was sequenced in three separate replicates. Burrows-Wheeler alignment tool (BWA) with default settings was used for alignment[40,59]. The resulting SNP data, contained within a VCF file, were filtered in TASSEL (v. 5.2.04)[60]. Markers possessing both parental genotypes, genotypes for at least 90% of the population, a minor allele frequency of at least 0.10, and a heterozygous proportion of at least 0.10 were retained. The remaining markers were evenly thinned based on physical positions (100 base pairs or more between markers) to total 142 to 216 markers per chromosome.
Linkage map construction
-
Genetic map construction was accomplished in Lep-MAP3 (v. 0.2)[50]. SNP markers were encoded into the format used in JoinMap 4[61] (lm × ll, nn × np, hk × hk) using the NGSEP[62]. SSR markers were concatenated with the SNP markers. Linkage phases for all markers were extracted from JoinMap 4. The marker file was converted using an awk command provided by Lep-MAP3 and used, with the pedigree, in the ParentCall2 module. Markers were separated into linkage groups using distortion-aware LOD scores using SeparateChromosomes2. LOD limits for grouping ranged from 6 to 10, as needed to achieve 19 LGs. Remaining single, ungrouped markers were iteratively joined to existing groups via JoinSingles2All. Finally, using the OrderMarkers2 module, markers were ordered into a sex-averaged map based on the maximized order likelihood of 100 mapping iterations. Mapping distances and marker orders were extracted from the output of OrderMarkers2 and formatted for use with MapQTL6[63].
Phenotyping
-
Berries were sampled from the population at post-veraison maturity in the years 2017, 2018, and 2019. Harvest dates varied from year to year in accordance with a physical assessment of grape maturity (stage 38−40 on modified E-L system)[64]. All samples were collected during the same harvest period within each year. Samples contained 200−300 g of berries from each genotype. Two sampling replicates of each genotype, as fruit availability allowed, were collected and stored at −20 °C. One replicate was kept at Missouri State University, and the second was overnight shipped with dry ice to the VitisGen Fruit Quality Phenotyping Center for tannin analysis at Cornell University (Ithaca, NY, USA).
For acid and pH evaluation, berries (100 g) were destemmed and thawed at room temperature for approximately 2 h before being crushed in a Stomacher 80 Biomaster (Seward, Worthing West Sussex, UK) for 1 min at 'normal' speed. Samples were transferred to 50 mL plastic centrifuge tubes and centrifuged in a Sorvall Legend Mach 1.6 R model (Thermo Fisher Scientific, Waltham, MA, USA) at 12,000× g for 15 min, and the supernatant transferred into 20 mL plastic centrifuge tubes.
The concentrations of malic and tartaric acids were evaluated using an Agilent 1100 Series HPLC system (Agilent Technologies, Santa Clara, CA, USA) with a Synergi Hydro-RP column (Phenomenex, Torrance, CA, USA) and an Agilent 1100 Diode Array Detector. The column was held at 22 °C. Samples were eluted with a 20 mM KH2PO4 solution at a pH of 2.9, a flow rate of 0.40 mL per min, and at a UV absorbance of 220 nm. The injection volume was 5.0 µL of undiluted juice. Duplicate analysis was completed on each sample. Malic and tartaric acid concentrations were calculated using standard curves of (L-(-)-malic and L-(-)-tartaric acid (Sigma-Aldrich, St. Louis, MO, USA) and expressed in g/L. An Orion Star A211 pH meter (Thermo Fisher Scientific, Waltham, MA, USA) was used to evaluate the pH of extracted juice samples.
Tannin concentrations were evaluated using a methyl cellulose precipitable tannin assay using berry samples sent to Cornell University. Following storage at −18 °C, the frozen berry samples (50 g) were thawed at room temperature for 30 min. Samples were macerated using a 250 mL Waring Blender (Waring Laboratory Science, Stamford, CT, USA). Tannins were quantified using the 10 mL assay protocol described by Mercurio and Smith[65], and absorbance measurements were taken using a ThermoScientific Genesys 10 s UV-VIS spectrophotometer. For the assay, ammonium sulfate (Alfa Aesar, Ward Hill, MA, USA) and methylcellulose (1,500 cp at 20 °C; VWR, Solon, OH, USA) were purchased commercially. Concentrations were reported based on a point-calibration curve prepared from epicatechin (HWI pharma services, Ruelzheim, Germany).
Statistical calculations
-
Normality, transformations, heritability, correlations, and best linear unbiased predictor (BLUP) estimates were performed in the statistical software R (v. 3.6.3)[66]. The normality of trait distributions was evaluated using the Shapiro-Wilk's test. All phenotypes were Box-Cox transformed using MASS package (v. 7.3-51.6)[67] to improve the normality of the traits for QTL analysis.
The full model used for BLUPs and broad-sense heritability estimates was Pij = µ + Gi + Ej + rij, where Pij was the trait phenotype for genotype i in year j, µ the overall mean, Gi the random effect of genotype i, Ej the random effect of year j, and rij the residual term. BLUPs were calculated for traits that were phenotyped in at least three years and individuals for which at least two sets of data were available. Broad-sense heritability was estimated for each trait as the proportion of phenotypic variance which is explained by the genotypic variance using the following equation:
$ \sigma _G^2/\left( {\sigma _G^2 + \sigma _E^2} \right)$ , where${\sigma _G^2} $ is the variance due to genotype and${\sigma _E^2} $ is the variance due to environment. The linear model and variances were calculated using the lme4 package (v. 1.1-21)[68]. Correlations between years of data were determined using the Pearson test in Hmisc (v. 4.4-0)[69]. Partial correlations of traits were evaluated using ppcor (v. 1.1)[70] with default methods.QTL analysis
-
QTL analysis was performed in MapQTL6[63]. The restricted multiple QTL model (rMQM) mapping method was used with cofactor selection for final analysis of all phenotypes. Cofactor selection was accomplished using the 'automatic cofactor selection' tool. The PVE by the QTL and QTL position was extracted from the final rMQM result. Confidence intervals for the QTL were defined by a 1.5-LOD support interval (the region containing markers with LOD scores which fall within 1.5 of the QTL's maximum). Significance thresholds were estimated using 1000 permutations of each phenotype. The LOD threshold equivalent to α = 0.05 at the GW level was considered significant. QTLs observed in at least two years were considered stable. QTLs detected in a single year were reported but considered unstable.
An analysis of variance (ANOVA) evaluating differences in trait means between genotypes at a given locus was used for single-year effect sizes. BLUP values were used in place of single-year phenotypes for loci located at stable QTL. Default settings for 'Anova' function from the car package (v. 3.0-6)[71] were used. All markers within the QTL regions and the closest flanking markers were tested. Alleles of the greatest effect size for the QTL and flanking marker alleles and effect size were reported for single-year QTL. Multi-year QTL effect sizes were reported for all markers within the support interval. Tukey's honest significant difference (HSD) test (p < 0.05) was conducted to evaluate the differences in each haplotype combination's average effect for stable QTL flanking markers and one interior maker. P-values were also extracted from the analysis of variance model. All effect sizes are reported in units corresponding to the trait values and are not standardized.
- The authors thank S. Jacob Schneider and Marilyn Odneal for valuable discussions and constructive comments on the manuscript. The authors also thank Rayanna Bailey for technical assistance. In addition, the authors thank Eric Blumenberg at Blumenhof Winery (Dutzow, MO) for providing the berries of 'Cynthiana' and 'Cabernet Sauvignon' for the comparisons of berry acid traits. GBS experiments were performed by the Biotechnology Resource Center (BRC) Genomics Facility at the Cornell Institute of Biotechnology. This study is supported by Capacity Building Grants for Non-Land Grant College of Agriculture, Award No. 2016-70001-24623, and Specialty Crop Research Initiative Competitive Grant, Award No. 2017-51181-26829, from the USDA National Institute of Food and Agriculture.
- The authors declare that they have no conflict of interest.
- Supplemental Fig. S1 Genetic linkage map in centimorgans for a 'Norton' × 'Cabernet Sauvignon' F1 population.
- Supplemental Table 1 Daily air temperature at vineyard during post-veraison and pre-harvest period .
- Copyright: © 2021 by the author(s). Exclusive Licensee Maximum Academic Press, Fayetteville, GA. This article is an open access article distributed under Creative Commons Attribution License (CC BY 4.0), visit https://creativecommons.org/licenses/by/4.0/.
-
About this article
Cite this article
Negus KL, Chen L, Fresnedo-Ramírez J, Scott HA, Sacks GL, et al. 2021. Identification of QTLs for berry acid and tannin in a Vitis aestivalis-derived 'Norton'-based population. Fruit Research 1: 8 doi: 10.48130/FruRes-2021-0008

Identification of QTLs for berry acid and tannin in a Vitis aestivalis-derived 'Norton'-based population
- Received: 17 June 2021
- Accepted: 18 August 2021
- Published online: 30 August 2021
Abstract: Acidity and tannins are among the grape berry quality traits that influence wine quality. Despite advantageous environmental tolerances of Vitis aestivalis-derived 'Norton', its acidity and tannin concentrations often deviate from expectations set for V. vinifera. Identification of the genetic determinants of malic acid, tartaric acid, pH, and tannin can assist in the improvement of new hybrid cultivars. For this purpose, a 'Norton' and V. vinifera 'Cabernet Sauvignon' hybrid population containing 223 individuals was used to construct a linkage map containing 384 simple sequence repeat (SSR) and 2,084 genotyping-by-sequencing (GBS)-derived single nucleotide polymorphism (SNP) markers. The resulting map was 1,441.9 cM in length with an average inter-marker distance of 0.75 cM and spanned 19 linkage groups (LGs). Quantitative trait loci (QTLs) were detected for malic acid, tartaric acid, pH, and tannin. QTLs for malic acid (LG 8) and pH (LG 6) were observed across multiple years and explained approximately 17.7% and 18.5% of the phenotypic variation, respectively. Additionally, QTLs for tartaric acid were identified on linkage groups 1, 6, 7, 9, and 17 and tannin on LG 2 in single-year data. The QTLs for tartaric acid explained between 8.8−14.3% and tannin explained 24.7% of the phenotypic variation. The markers linked to these QTLs can be used to improve hybrid cultivar breeding through marker-assisted selection.
-
Key words:
- Vitis aestivalis /
- Norton /
- Simple Sequence Repeats /
- Single Nucleotide Polymorphism /
- Quantitative Trait Loci /
- Malic Acid /
- pH /
- Tannin