


-
Plant leaf color mutation is a character with high frequency and easy identification. Leaf etiolation is widely found in many plants such as Arabidopsis[1], rice[2] and cucumber[3]. In recent years, leaf color mutants have been widely used in basic studies of genetic patterns, pigment synthesis, photosynthesis, cell structure and development, and have become one of the hot spots in molecular and developmental biology[4−6]. A large number of studies have divided leaf color mutants into total chlorophyll increased or decreased type, chlorophyll b deleted type and carotenoid increased or decreased type. In higher plants, most of the photosynthetic pigments are synthesized in the chloroplast. If the genes related to chloroplast development are mutated, the synthesis of photosynthetic pigments will be blocked, which will eventually lead to the change of leaf color. Therefore, a lot of research has focused on the influence of chloroplast and chlorophyll development metabolism on leaf color change.
Chlorophyll organisms begin with δ-aminolevulinic acid, which is processed by 15 enzymes such as aminolevulinic acid synthetase to form aminolevulinic acid, protoporphyrin ⅸ and other metabolites, and finally converted into chlorophyll a and b[7]. Changes in the expression of any gene in this pathway will affect the accumulation of chlorophyll and reduce the photosynthetic capacity[8]. In rice, at least 50 related genes have been cloned and located through the study of a large number of leaf color mutants, some of which are directly involved in the metabolic pathways of photosynthetic pigments, such as OsCHLH, OsCAO, YGL1 and OsDVR[6]. In other crops, such as the yellow leaf mutant of Populus deltoides W. Bartram ex Marshall, the photosynthetic pigment content was significantly reduced, and the expression of chlorophyllase (CLH) related to chlorophyll degradation was up-regulated[9]. Under low temperature conditions, the expression of POR in the kale leaf color mutant showed a significant down-regulation trend[10]. In the yellow cabbage mutant, the expression of CHLG gene encoding chlorophyll synthase was significantly reduced[4].
However, in addition to chlorophyll, photosynthetic pigments also include carotenoids. Although chlorophyll accounts for a higher proportion of photosynthetic pigments, the proportion of carotenoids still reaches about 20%[11]. In plants, carotenoids are also one of the factors that determine the color (yellow, orange, and red) of the plant[12]. Li et al.[13] found that PPO and NYC/NOL inhibited the synthesis of chlorophyll in ginkgo biloba leaves, while Z-ISO, ZDS and LCYE promoted the accumulation of carotenoids, which confirmed that the change of leaf color was accompanied by the change of carotenoid content.
Light intensity and light quality play an important role in the regulation of plant carotenoid metabolism and are the most important signals for regulating the expression of carotenoid structural genes in plant photosynthetic tissues[14, 15]. Light quality refers to the spectral composition of the light that plants receive, and each spectral band has different effects on plants. Plants sense light in different wavelength ranges such as red, blue, and green through various pigment systems in the cell, thereby regulating plant leaf elongation and stem elongation, photoprotection mechanisms, and assimilation and transport processes[16, 17]. Studies have found that the difference in light quality not only affects the total chlorophyll content of plants[18, 19], but also has different regulatory mechanisms on plant carotenoids[20]. The concentration of β-carotene and lutein in spinach (Spinacia oleracea L.) can be significantly increased by using blue LED light at a photosynthetic photon flux of 300 μmol·m−2·s−1[21]. The lutein content of purple cabbage (Brassica oleracea L. Winterbor) reaches the maximum at a wavelength of 640 nm, and the concentration of β-carotene reaches the maximum at 440 nm[22]. In the study of broccoli, short-time blue light could significantly increase the content of β-carotene and xanthophyll cycle pigments compared with red-blue mixed LED treatment[23]. The lutein and neoxanthin of broccoli sprouts under UV-A irradiation increased by 22.4% and 33.5%, respectively. While UV-B irradiation lutein and neoxanthin increased significantly by 16.9% and 36.7%[24]. However, the existing studies have paid less attention to carotenoids in leaf color mutants, and the research on effects of light quality differences on the changes of carotenoid components in leaf color mutants is even less.
Pepper (Capsicum annuum L.), belonging to the genus Capsicum in the Solanaceae family, is the largest seasoning crop and the third largest vegetable crop in the world. Although some studies have been carried out on the color of pepper[25, 26] the study of carotenoid metabolism in pepper is still not in-depth, and mainly focuses on capsanthin or capsorubin. There are few studies on other substances in the carotenoid pathway, and the regulatory mechanism is still unclear. Based on the above reasons, this study intends to comprehensively study the dynamic changes of carotenoid components and gene expression in leaf yellowing mutants of pepper under different light quality by transcriptomics and metabolomics, and reveal the changes of key pigments and key regulatory genes related to leaf color transformation. This study will provide a reference for further understanding of the molecular mechanism of light quality in regulating carotenoid metabolism and inducing leaf color change.
-
The leaves of the mutants under different light quality showed obvious differences, among which the leaves under purple light were significantly yellowing, the leaves under blue light were pale green, and the leaves under red and green light were still green (Fig. 1a). The contents of chlorophyll a, chlorophyll b, chlorophyll (a+b) and carotenoids were the highest in the red and green light treatments, and the contents of these photosynthetic pigments were the lowest in the purple light treatments, which decreased significantly by 64.41%, 40.75%, 57.95% and 58.12% compared with the blue light treatments, respectively (Fig. 1b). By measuring the color parameters of mutant leaves under different light quality, it was found that the red value (Δa), color luminance value (ΔL), yellow value (Δb) and total chromaticity value (ΔE) of leaves under purple light treatment were significantly higher than blue, red and green light treatment (Fig. 1c). And it was also found that the Pn and Fv/Fm of yellowed leaves under purple light were significantly lower than those under other light quality, the qP value was significantly higher than that under other light quality, and the NPQ value was significantly higher than that under red and green light (Fig. 1d).
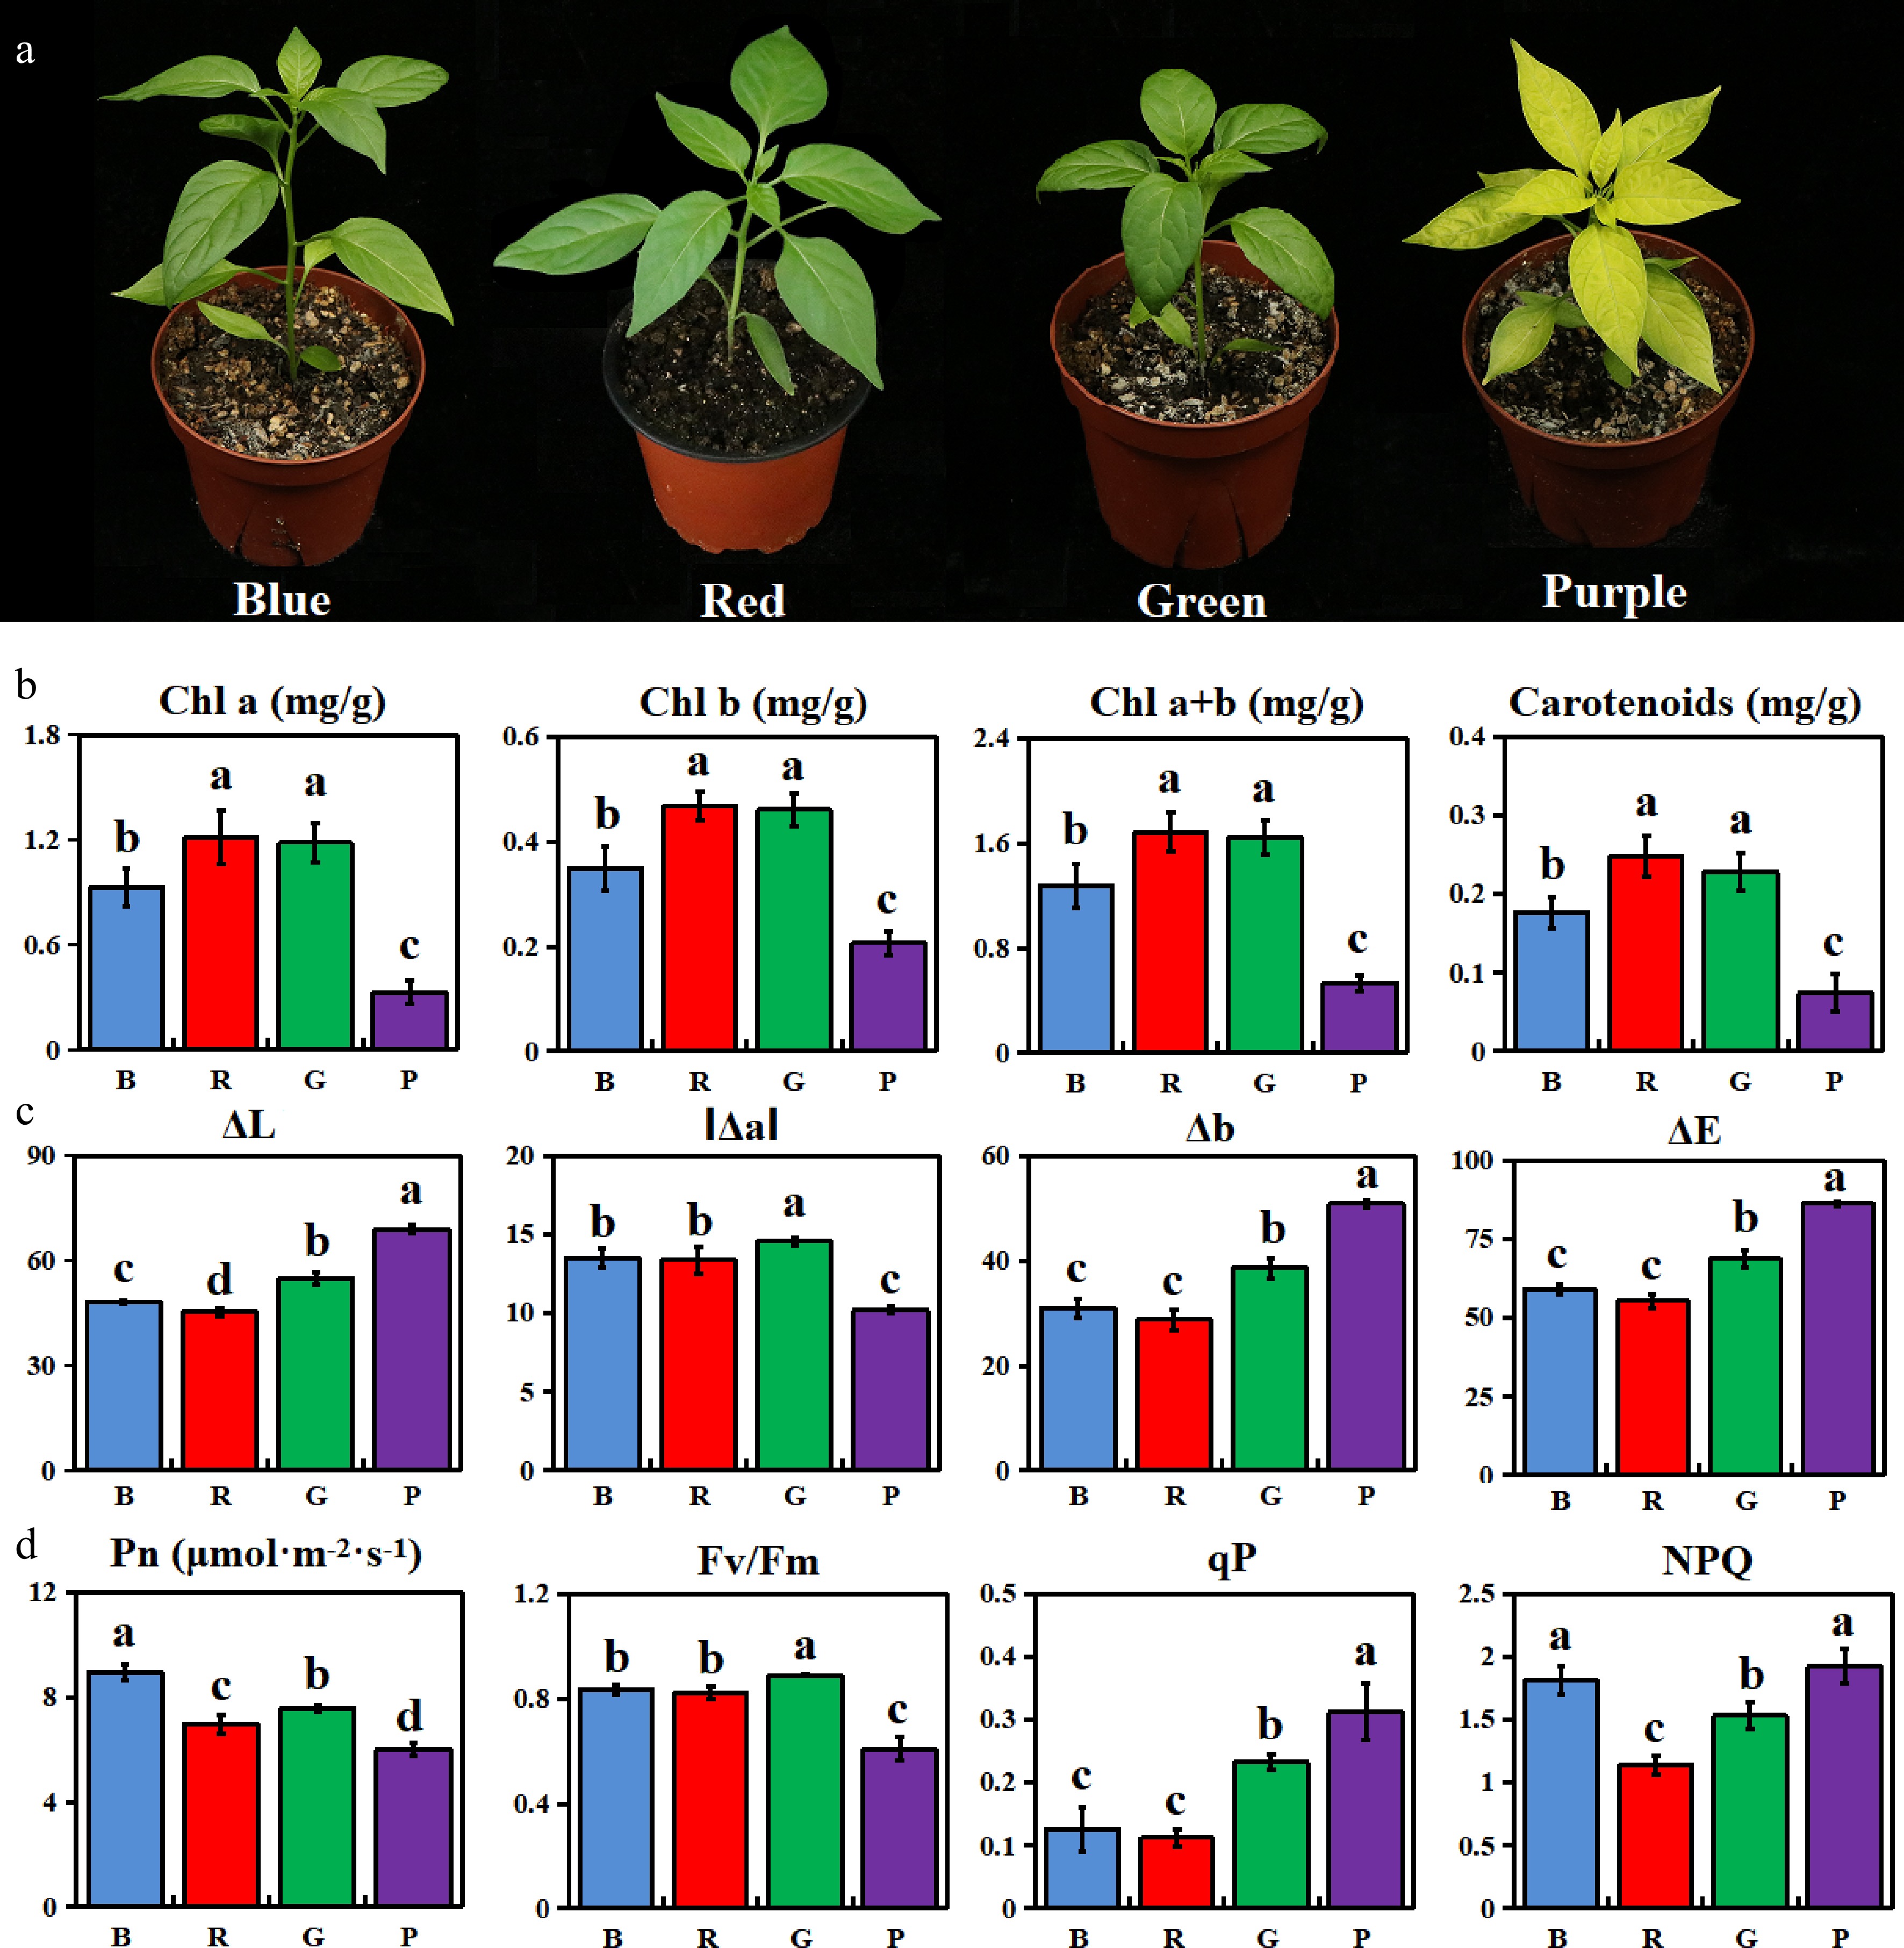
Figure 1.
Analysis of phenotypes and physiological characteristics of mutants under different light qualities. (a) Phenotypic identification of pepper leaves; (b) Photosynthetic pigment content; (c) Color chromaticity value; (d) Characteristics of photosynthesis and chlorophyll fluorescence.
Transcriptome sequencing analysis
-
A total of 77,910,471,234 raw reads were obtained from 12 pepper samples by Illumina-nova 6000 sequencing. After removing adaptor sequences, low-quality sequences and rRNA, a total of 261,581,124 clean high-quality reads were obtained. A total of 43,751 genes were identified after mapping to the C. annuum L_Zunla-1 Database[27], among which 31,853 genes were quantified, of which 27,085 genes (85.03%) were quantified in all samples (Fig. 2a, Supplemental Table S1). At the same time, it was also found that some genes were only quantified under certain light quality treatments. Among them, 666, 401, 369 and 228 genes were unique to purple, green, red and blue light treatment, respectively.
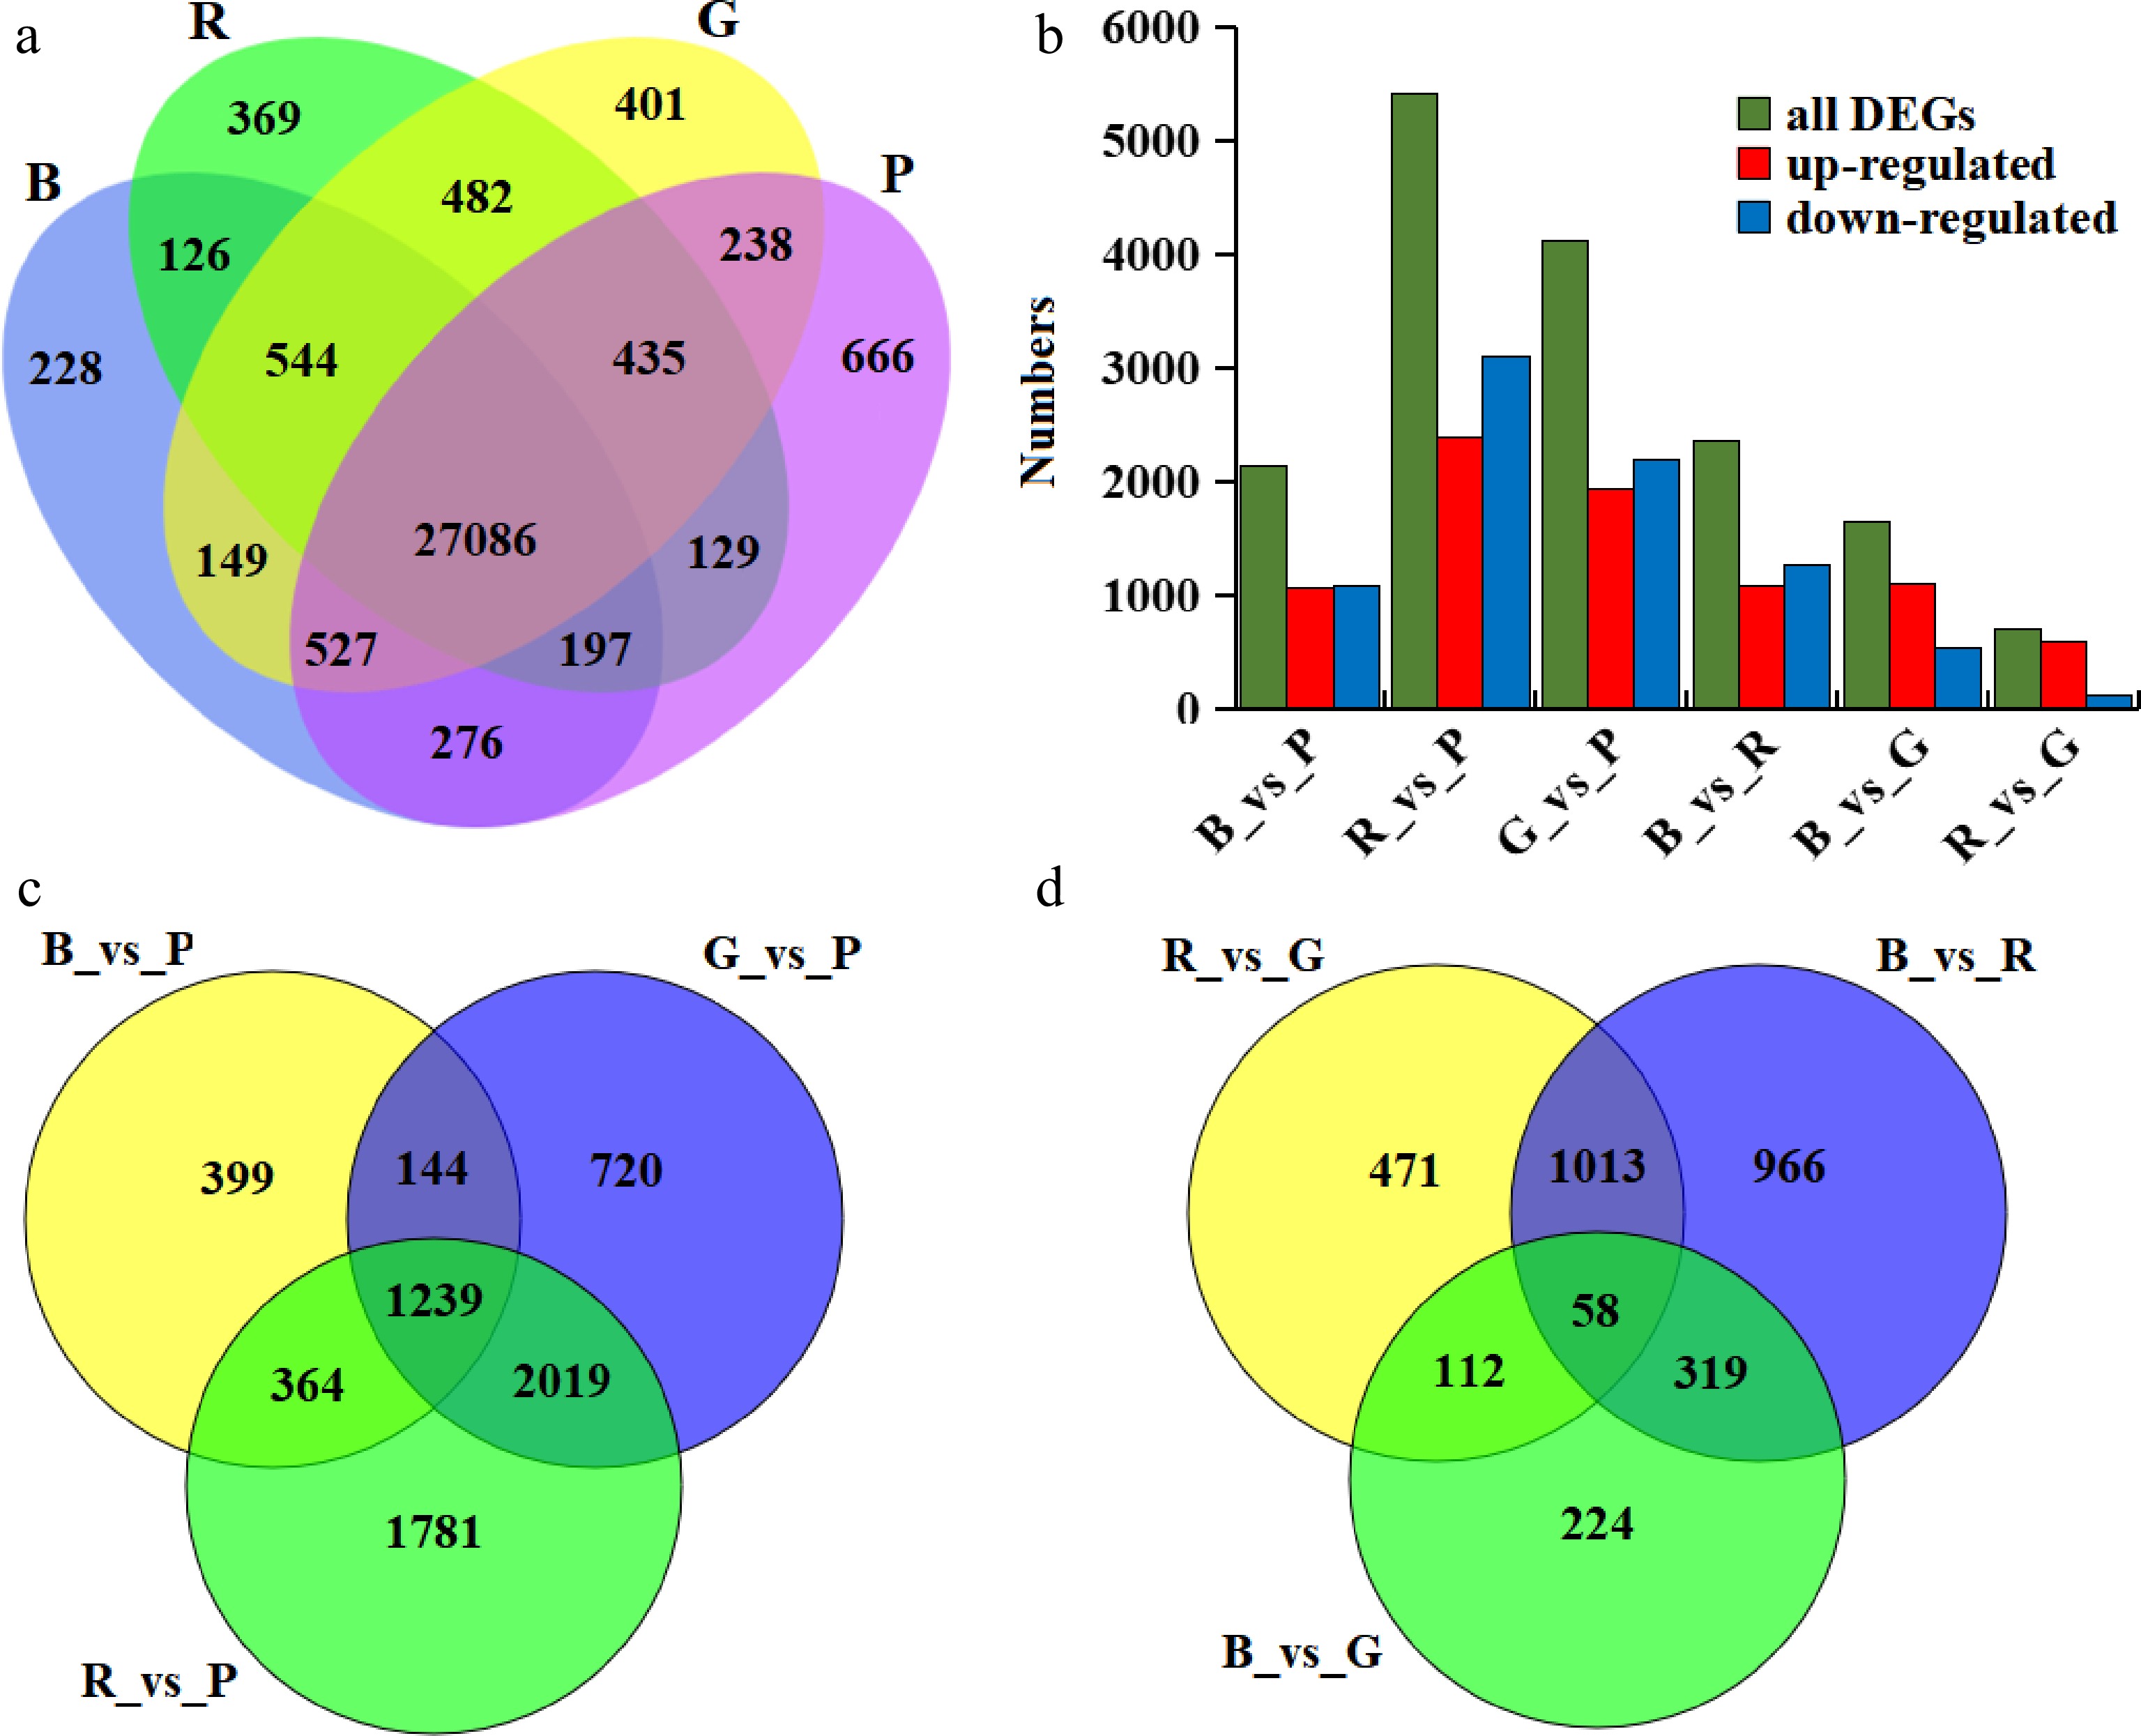
Figure 2.
Statistical analysis of the genes identified by transcriptome analysis. (a) Quantified genes under different light qualities; (b) Differentially expressed genes under different light qualities; (c) Venn diagram of differentially expressed genes between purple light compared to red, blue, and green light; (d) Venn diagram of differential genes between red, blue, and green light.
Analysis of differentially expressed genes (DEGs)
-
A total of 7,175 DEGs were identified by comparing gene expression between different light quality (Supplemental Table S2). Among these comparison groups, the R_vs_P group showed the largest difference in gene expression, with 5,403 DEGs, while there were only 713 DEGs in R_vs_G group (Fig. 2b). By comparing green leaves under blue, red and green light with yellowing leaves under purple light, 1,239 genes were found to be significantly different in all three groups (Fig. 2c). However, among the green leaves treated with blue, red and green light, only 58 genes had significant changes in expression between the comparison groups (Fig. 2d). This indicates that the differential expression of these 1,239 genes may be closely related to leaf etiolation.
Further analysis showed that genes involved in chlorophyll synthesis and metabolism were differentially expressed under different light quality. Among them, the expression levels of POR (Capana10g000065) under red and green light were at higher levels, which were 2.15 and 1.63-fold higher than those under purple light, respectively. The CAO (Capana06g001723) gene also maintained a high level of expression under red and green light, and the green light was 1.71-fold higher than the purple light treatment. The expression trend of CHLG (Capana09g001431) was different from that of the above genes, which significantly increased under purple light and was 1.45-fold higher than that under red light. The differential expression of these genes related to chlorophyll biosynthesis pathway under different light quality may be closely related to the changes of leaf color under different light quality.
Functional enrichment analysis of DEGs
-
The quantified DEGs were classified using the gene ontology (GO) database, and it was found that these DEGs cover a wide range of molecular function, biological process and cellular component, which can be classified into 21, 15 and 18 terms, respectively (Fig. 3a). The top 10 GO terms in each category were further analysed and results showed that catalytic activity and binding processes were predominant in the category of molecular function. In terms of biological process, the largest group is metabolic process, followed by cell process and single-organism process. Then the cellular components of these DEGs mainly enriched in membrane, membrane part, cell, cell part, and organelle. Among the light quality comparison groups, R_vs_P and G_vs_P had the most enriched DEGs in each GO terms, while R_vs_G had the least enriched DEGs.
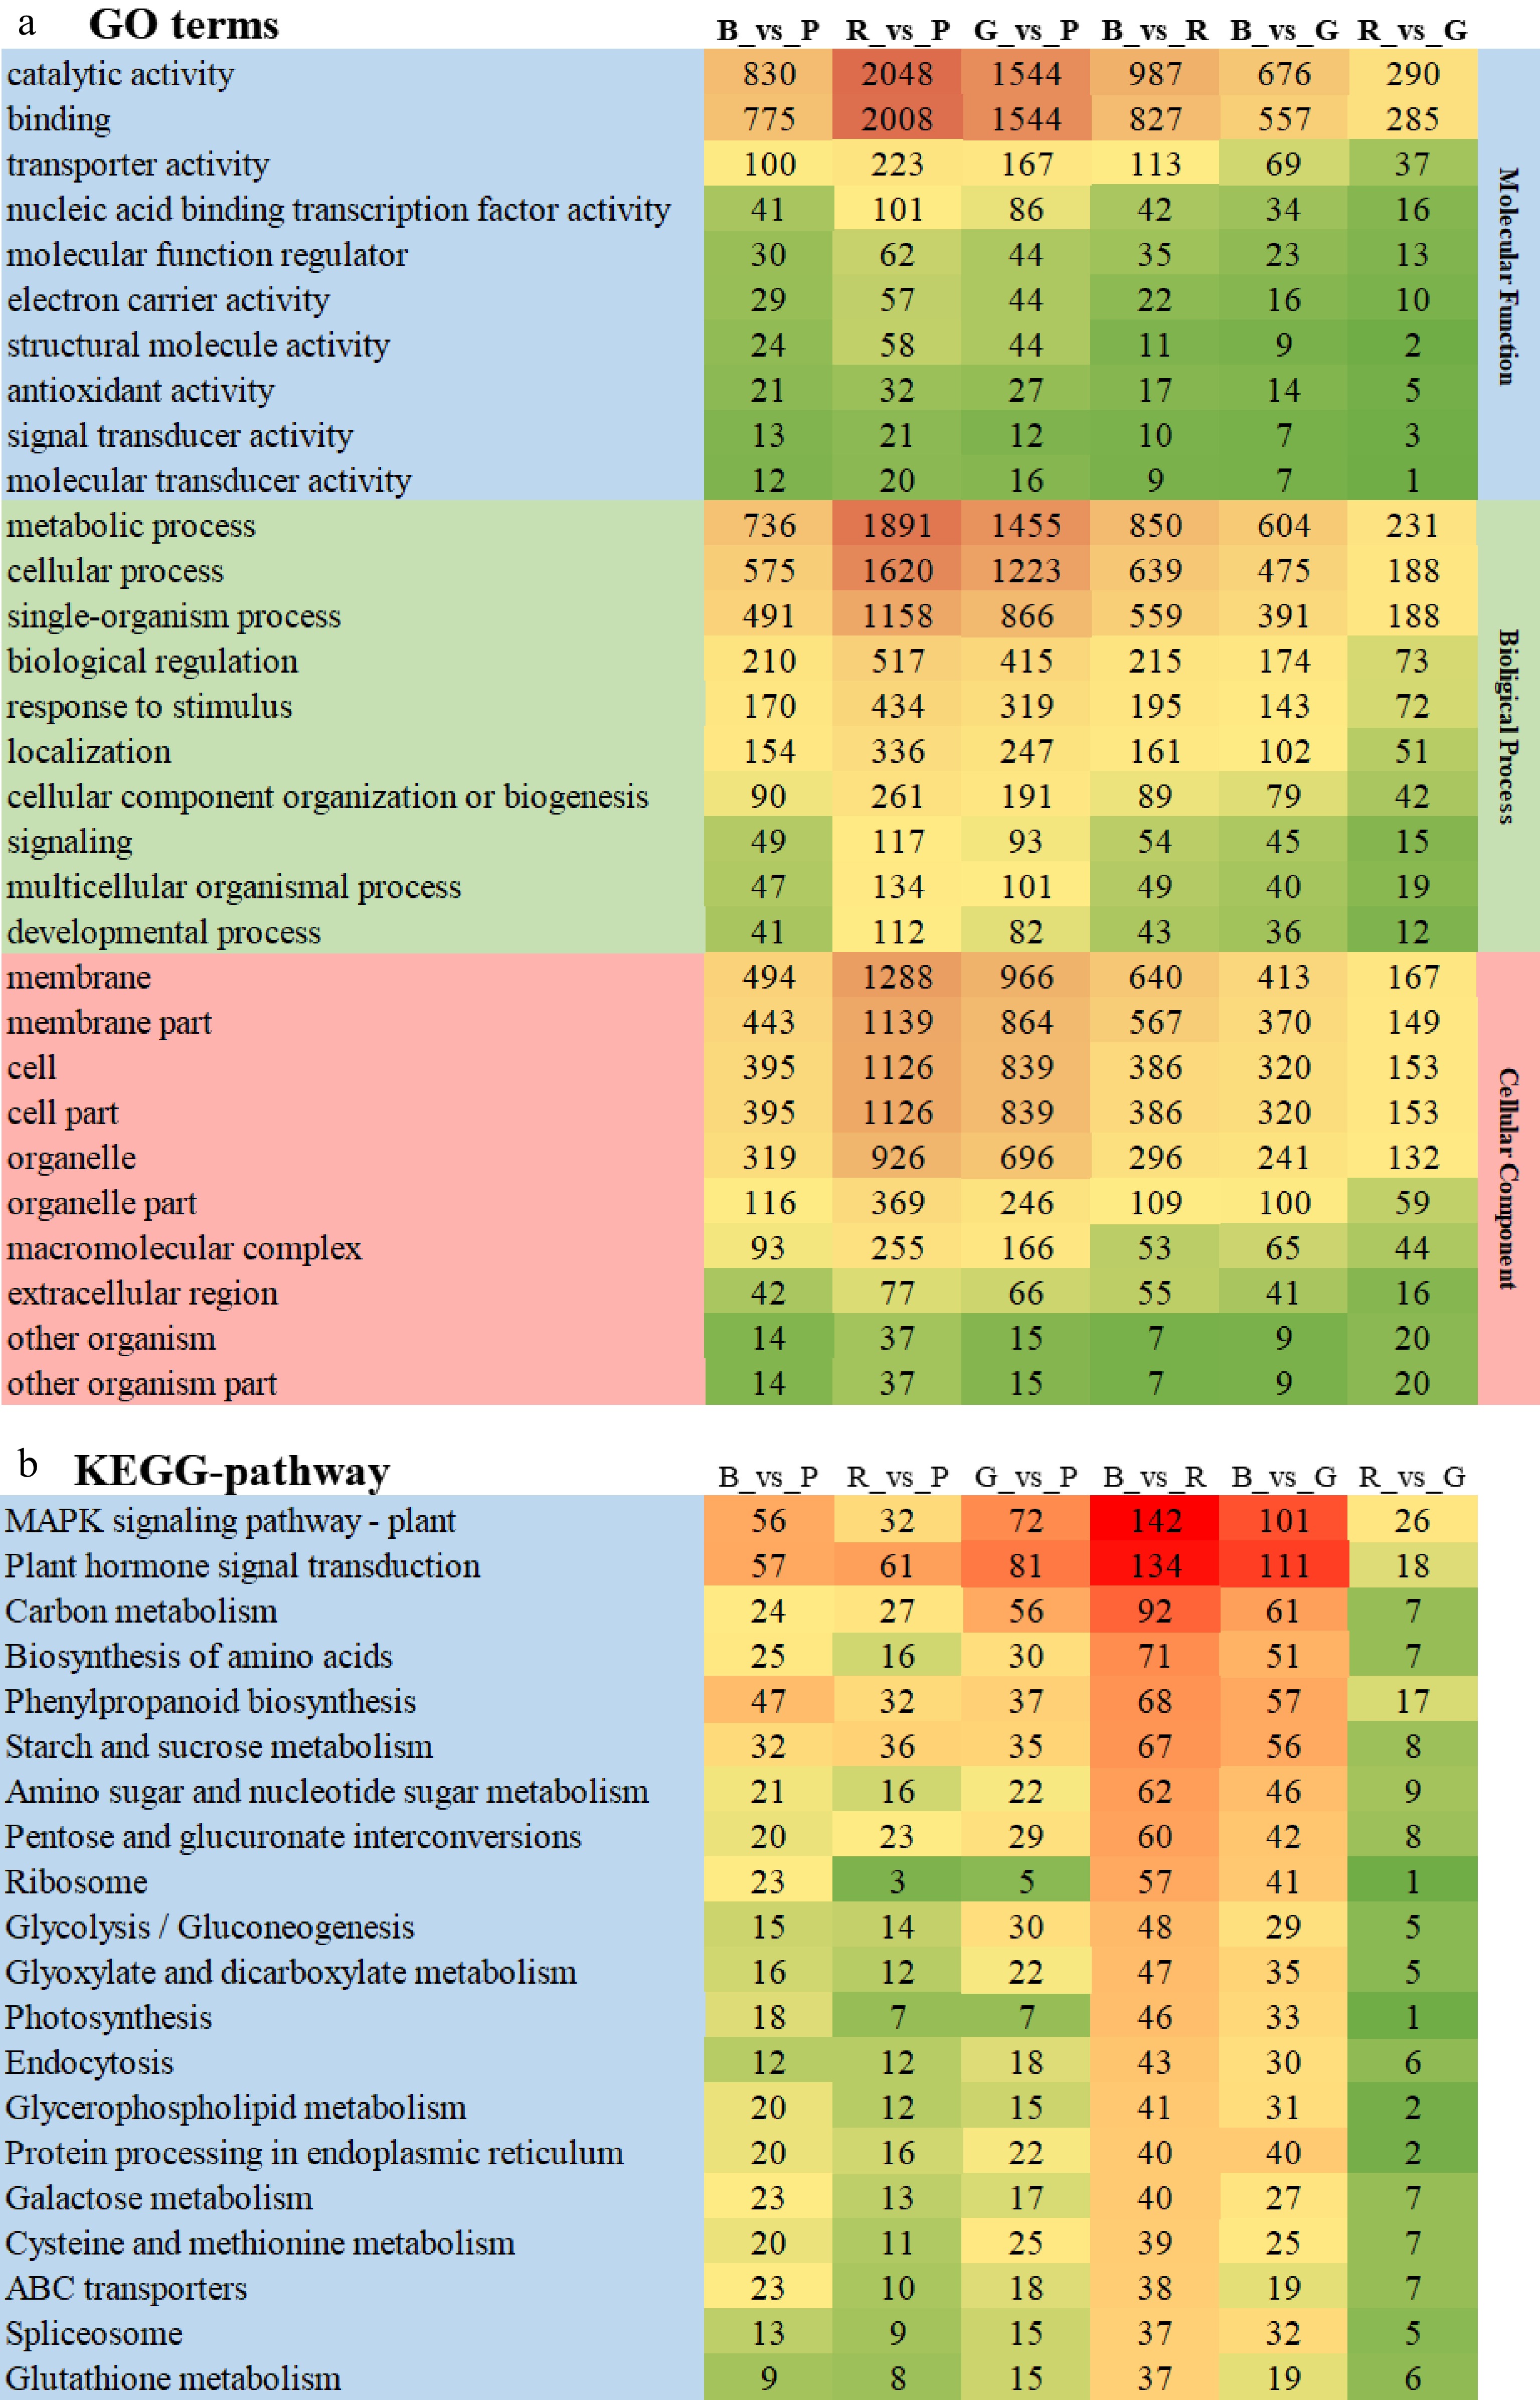
Figure 3.
Functional enrichment analysis of DEGs. (a) GO enrichment analysis; (b) KEGG enrichment analysis.
KEGG pathway enrichment analysis was also performed on the top 20 DEGs in each comparison group (Fig. 3b). Results showed that DEGs were mainly significantly enriched in MAPK signaling pathway-plant, plant hormone signal transduction, carbon metabolism, biosynthesis of amino acids, phenylpropanoid biosynthesis starch and metabolism, in all light quality comparison groups. The number of DEGs enriched in R_vs_P was also the largest in all comparison groups, which DEGs enriched in MPAK signaling pathway-plant and plant hormone signal transduction were both 116 more than those in R_vs_G groups.
Gene expression patterns of the carotenoid pathway
-
Through the expression analysis of genes involved in the carotenoid metabolism pathway (Fig. 4a), it was found that there were significant differences in gene expression under different light quality. Among different light quality treatments, the expression levels of PSY (Capana04g002519) and LUT5 (Capana12g001743) under purple light were the highest, which were significantly higher than other lights. CrtISO (Capana00g004805, Capana11g002179), LCYB (Capana05g000023), LUT1 (Capana10g001912), PDS (Capana03g000054), VDE (Capana12g001449) and Z-ISO (Capana12g000229) gene expression levels were significantly higher than those of red and green light, while slightly higher than those of blue light. The expression trends of CrtZ-2 (Capana06g002492) and ZEP (Capana02g003105) were different from those of the above genes, among which CrtZ-2 was highly expressed under red and green light, and significantly decreased under purple light. While ZEP was the highest under blue light, it was significantly higher than that of red and green light, but had no significant difference with purple light. Pearson correlation matrix analysis showed that all genes were positively correlated with each other except LCYE (Capana00g002014) and CRTZ-2 (Capana06g002492), which were negatively correlated with other genes in the carotenoid pathway.
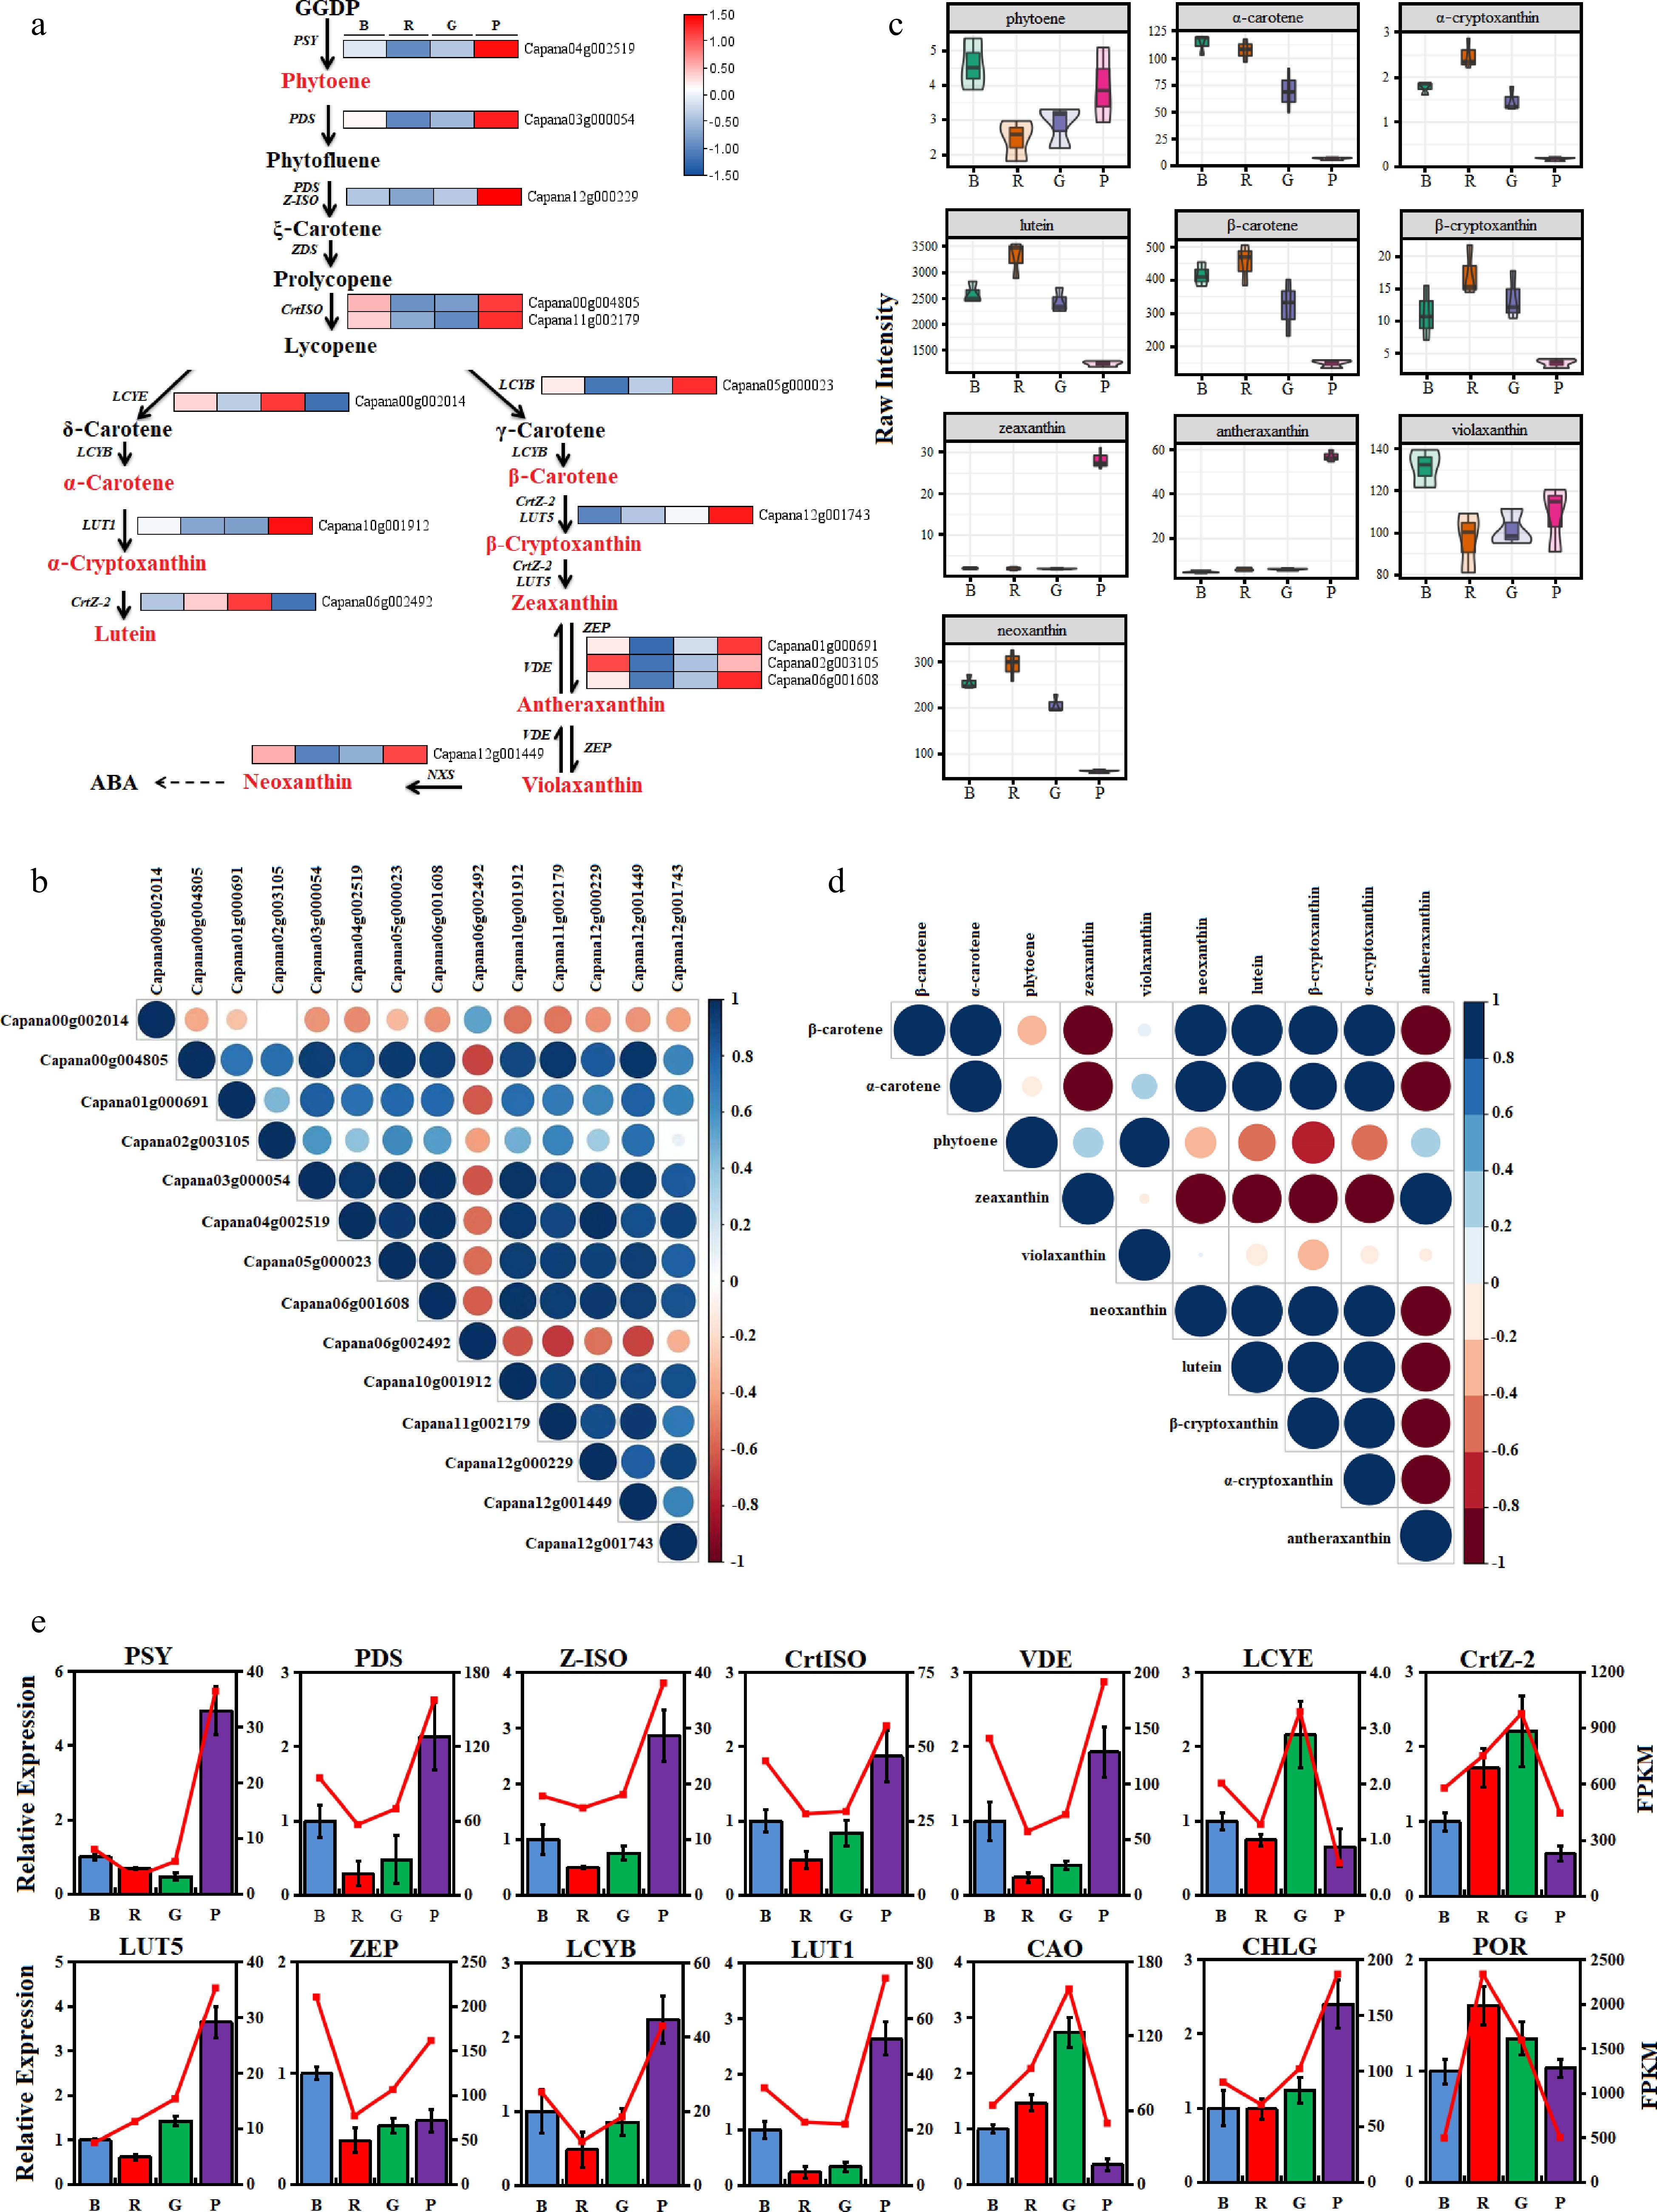
Figure 4.
Expression of carotenoid pathway genes and metabolites. (a) Analysis of gene expression; (b) Gene correlation analysis; (c) Analysis of metabolites synthesis; (d) Metabolite correlation analysis; (e) Quantitative verification of carotenoid pathway genes and chlorophyll metabolism related genes.
Content of metabolites in the carotenoid pathway
-
In order to study the pattern of carotenoid accumulation in leaves, the distribution of carotenoid metabolites under different light quality treatments was analyzed by liquid chromatography-mass spectrometry/mass spectrometry. A total of 21 carotenoids were detected from the four light quality treatments (Fig. 4c, Supplemental Table S3). Ten carotenoids including Phytoene, α-Carotene, β-Carotene, Antheraxanthin, Lutein, Neoxanthin, Violaxanthin, Zeaxanthin, β-Cryptoxanthin and α-Cryptoxanthin were abundant in pepper leaves, and the contents of these carotenoid metabolites were significantly different under different light quality treatments. Among them, α-Carotene, β-Carotene, Lutein, Neoxanthin, α-cryptoxanthin and β-Cryptoxanthin were accumulated in a large amount under blue, red and green light, but were less accumulated in purple light. However, zeaxanthin and antheraxanthin, two important metabolites of the xanthophyll cycle, accumulated in large quantities under purple light, and their contents were lower under blue, red and green light, resulting in their significantly higher contents under purple light than under blue, red and green light. In addition, pearson correlation coefficient matrix analysis showed that zeaxanthin and antheraxanthin were mainly negatively correlated with other metabolites in different degrees (Fig. 4d).
Real Time PCR validation
-
qRT-PCR experiments were performed on carotenoid pathway genes including PSY, PDS, Z-ISO, CrtISO, VDE, LCYE, CrtZ-2, LUT5, ZEP, LCYB, LUT1 and CAO, CHLG, POR genes related to chlorophyll metabolism using gene-specific primers. By comparing the transcript abundance (FPKM) obtained by transcriptome sequencing, it was found that the qRT-PCR results of related genes under different light were basically consistent with the variation trend of FPKM values, indicating that the transcriptome sequencing data was reliable in this study (Fig. 4e).
Phenotypic identification and expression analysis of CaVDE silenced lines
-
Since the mutant leaves only turn yellow under purple light, we found that the expression level of VDE gene in leaves under purple light was significantly increased by RNA-Seq and qRT-PCR. Meanwhile, the contents of zeaxanthin and antheraxanthin were significantly increased under purple light. Therefore, we speculated that the increased expression of VDE, a key gene in the lutein cycling pathway, may lead to the accumulation of zeaxanthin and antheraxanthin and eventually lead to leaf yellowing. To verify this hypothesis, we constructed a silenced expression vector using the specific fragment of CaVDE gene, and introduced the vector into leaf color mutants and incubated it under purple light environment. The results showed that the leaves of the empty vector control (EV) line turned yellowing under purple light, while the leaves of the pTRV2-CaVDE silencing line turned green, and the degree of yellowing was obviously weakened (Fig. 5a). Further analysis showed that the contents of chlorophyll a, chlorophyll b, total chlorophyll and carotenoids in CaVDE-silenced lines were significantly higher than those in EV line (Fig. 5b). Color parameters analysis also showed that the color luminance value (ΔL), yellow value (Δb) and total chromaticity value (ΔE) of CaVDE-silenced lines were significantly lower than those of the EV line (Fig. 5c). These results indicated that silencing CaVDE gene could weaken leaf etiolation and deepen green color of mutant seedlings under purple light. At the same time, the Pn, Fv/Fm and NPQ values of the silent lines were found significantly higher than those of the EV line, and the qP values were significantly lower, which indicated that the photosynthetic characteristics of the CaVDE-silenced lines restored to green were enhanced (Fig. 5d).
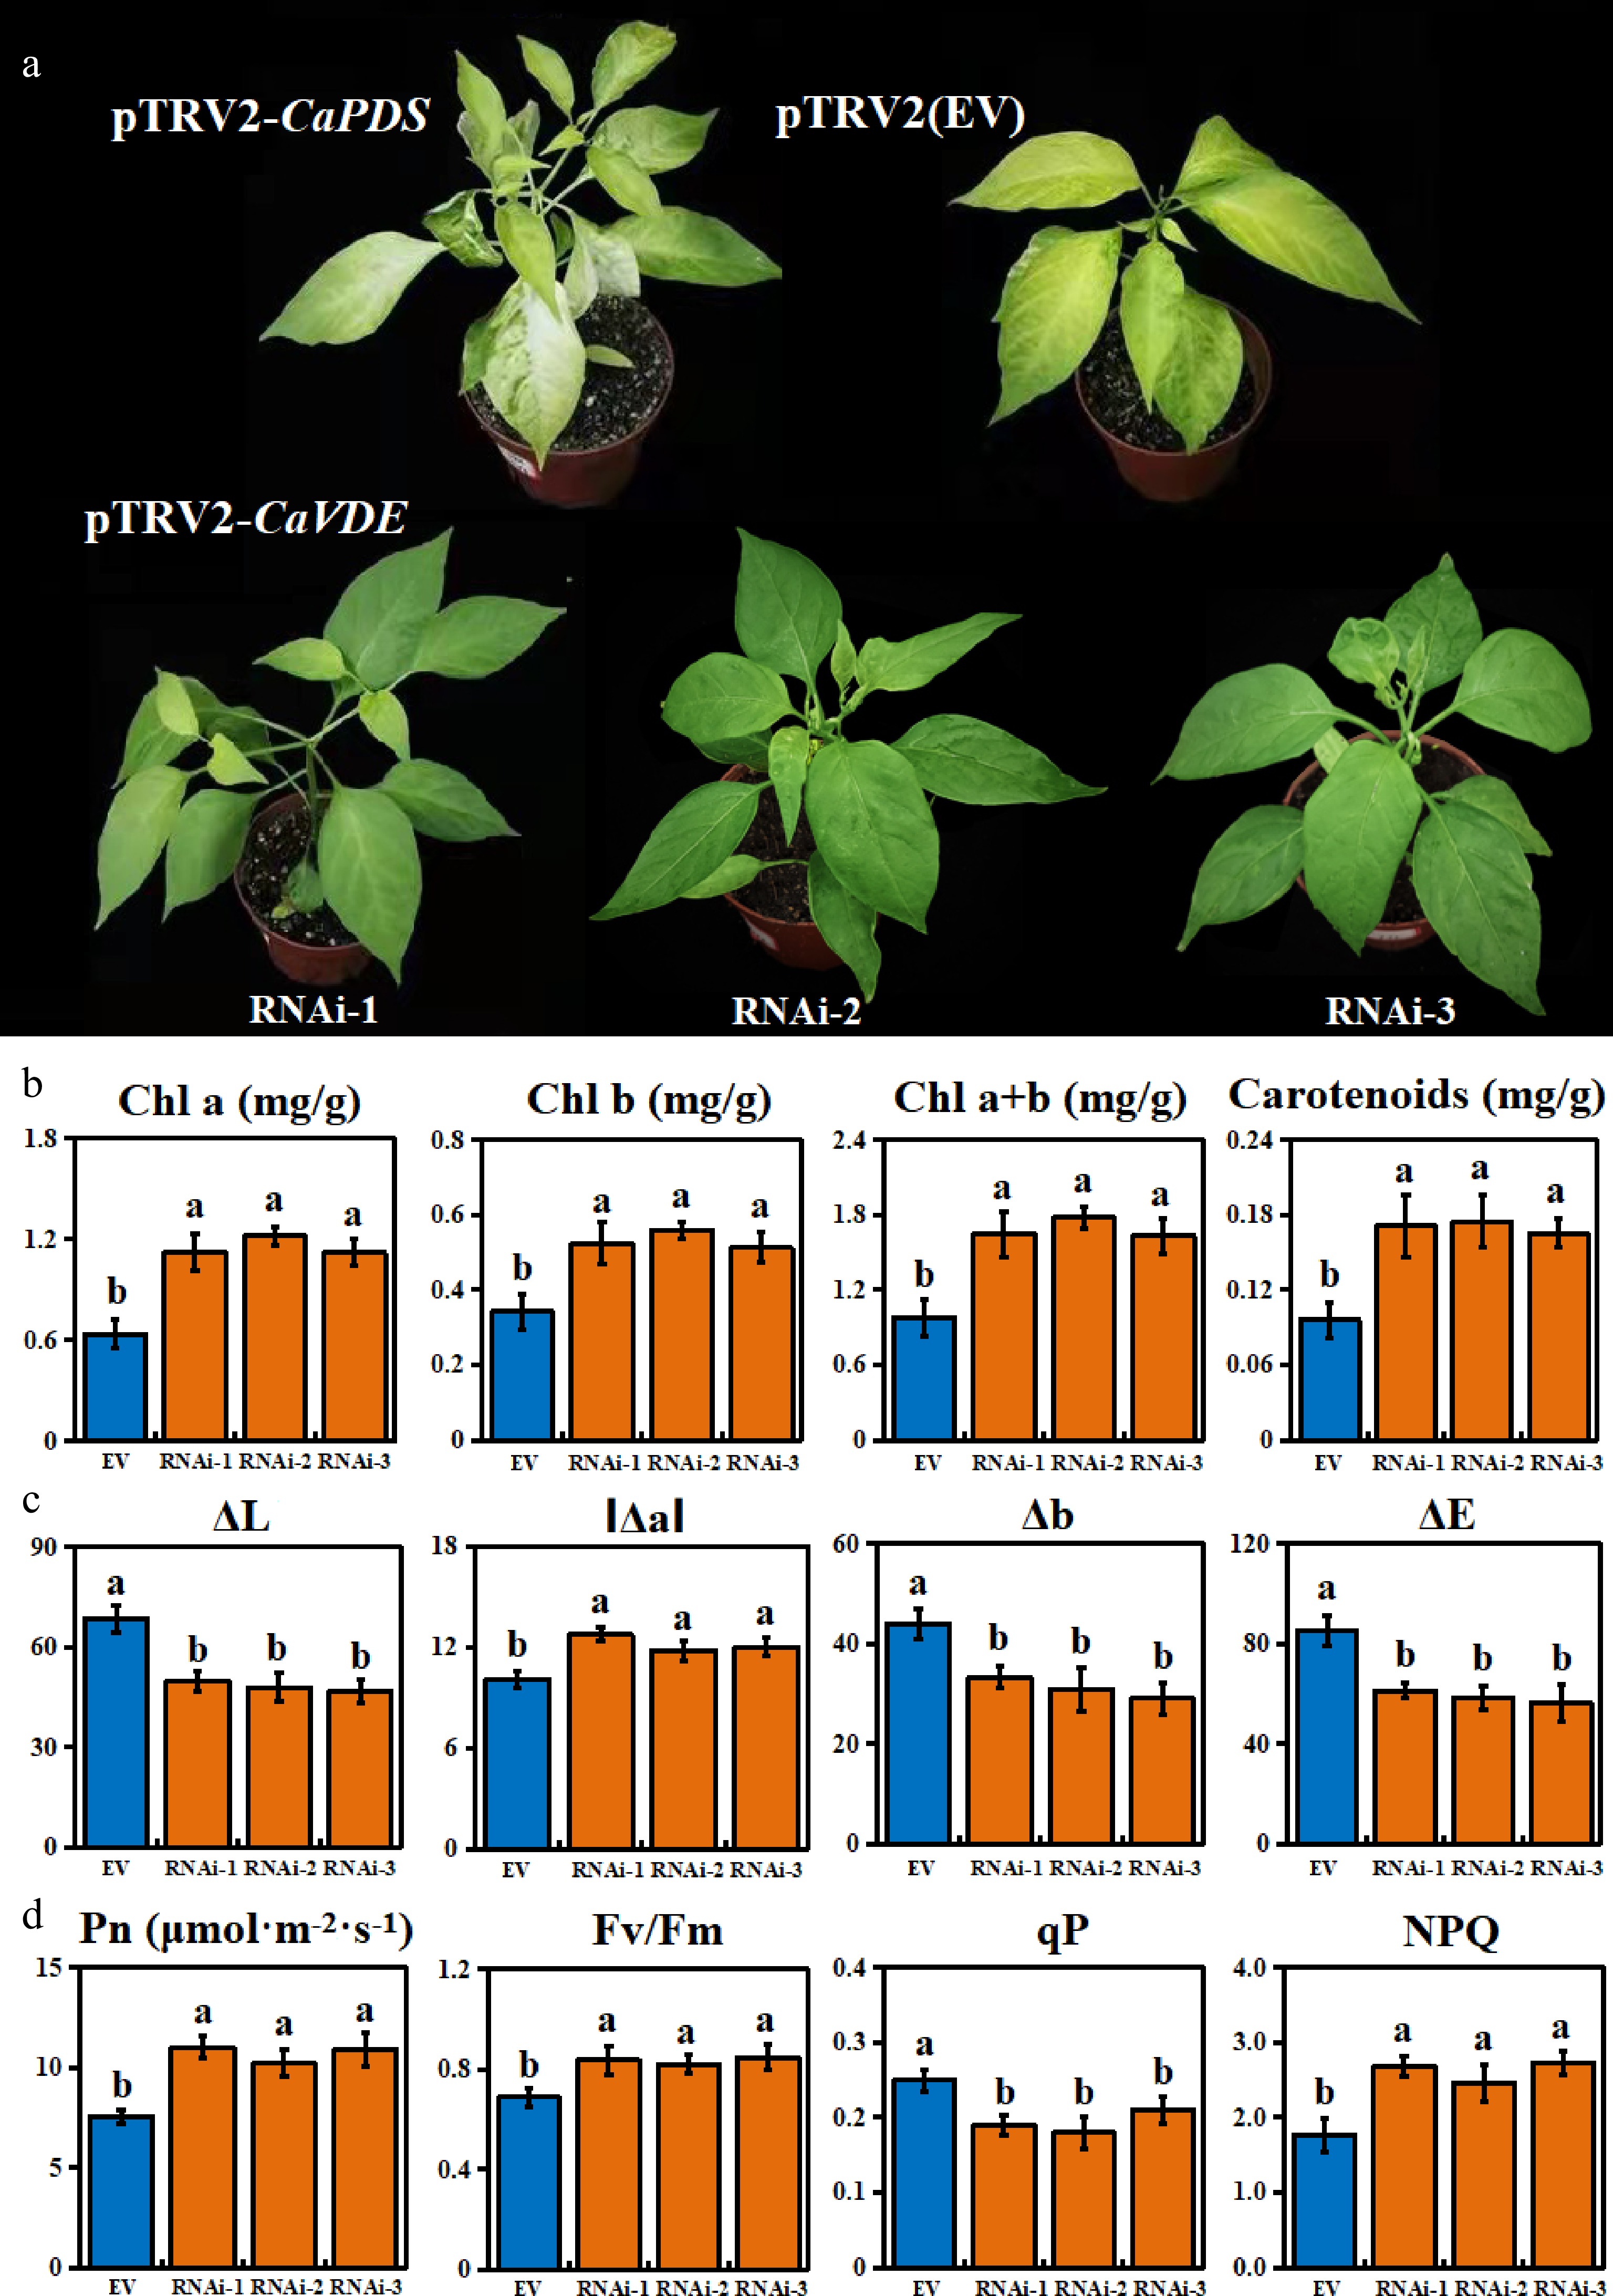
Figure 5.
Phenotype and physiological characteristics of CaVDE silenced lines. (a) Phenotypic identification of CaVDE silenced and EV line; (b) Photosynthetic pigment content of CaVDE silenced and EV line; (c) Color chromaticity value of CaVDE silenced and EV line; (d) Characteristics of photosynthesis and chlorophyll fluorescence of CaVDE silenced and EV line.
Changes of carotenoid pathway gene expressions and contents in CaVDE silenced lines
-
In order to confirm the changes in the content of carotenoid metabolites in leaf yellowing, we further measured the content of carotenoid metabolites in empty vector control and CaVDE-silenced lines (Fig. 6a). The results showed that α-Carotene, α-cryptoxanthin, Lutein, β-Carotene and Neoxanthin of CaVDE-silenced lines were significantly increased by 689.52%, 116.58%, 41.98%, 63.56% and 101.97% compared with empty vector control line, respectively. However, the accumulation of zeaxanthin and antheraxanthin was less, which decreased significantly by 83.61% and 79.42% compared with empty vector control lines. In addition, we also performed qRT-PCR analysis of carotenoid pathway genes in pTRV2 and PTRV2-CavDE lines(Fig. 6b). The results showed that the expression levels of PSY, PDS, Z-ISO, CrtISO, LUT5, LCYB, LUT1 genes were significantly down-regulated, while the expression levels of CrtZ-2 and ZEP genes were significantly up-regulated in CaVDE-silenced lines. This indicates that the silencing of VDE in pTRV2-CaVDE lines inhibits the process of catalyzing the production of zeaxanthin and antheraxanthin from violaxanthin in the xanthophyll cycle, resulting in a decrease in the accumulation of zeaxanthin and antheraxanthin, and further promoting the greening of leaves.
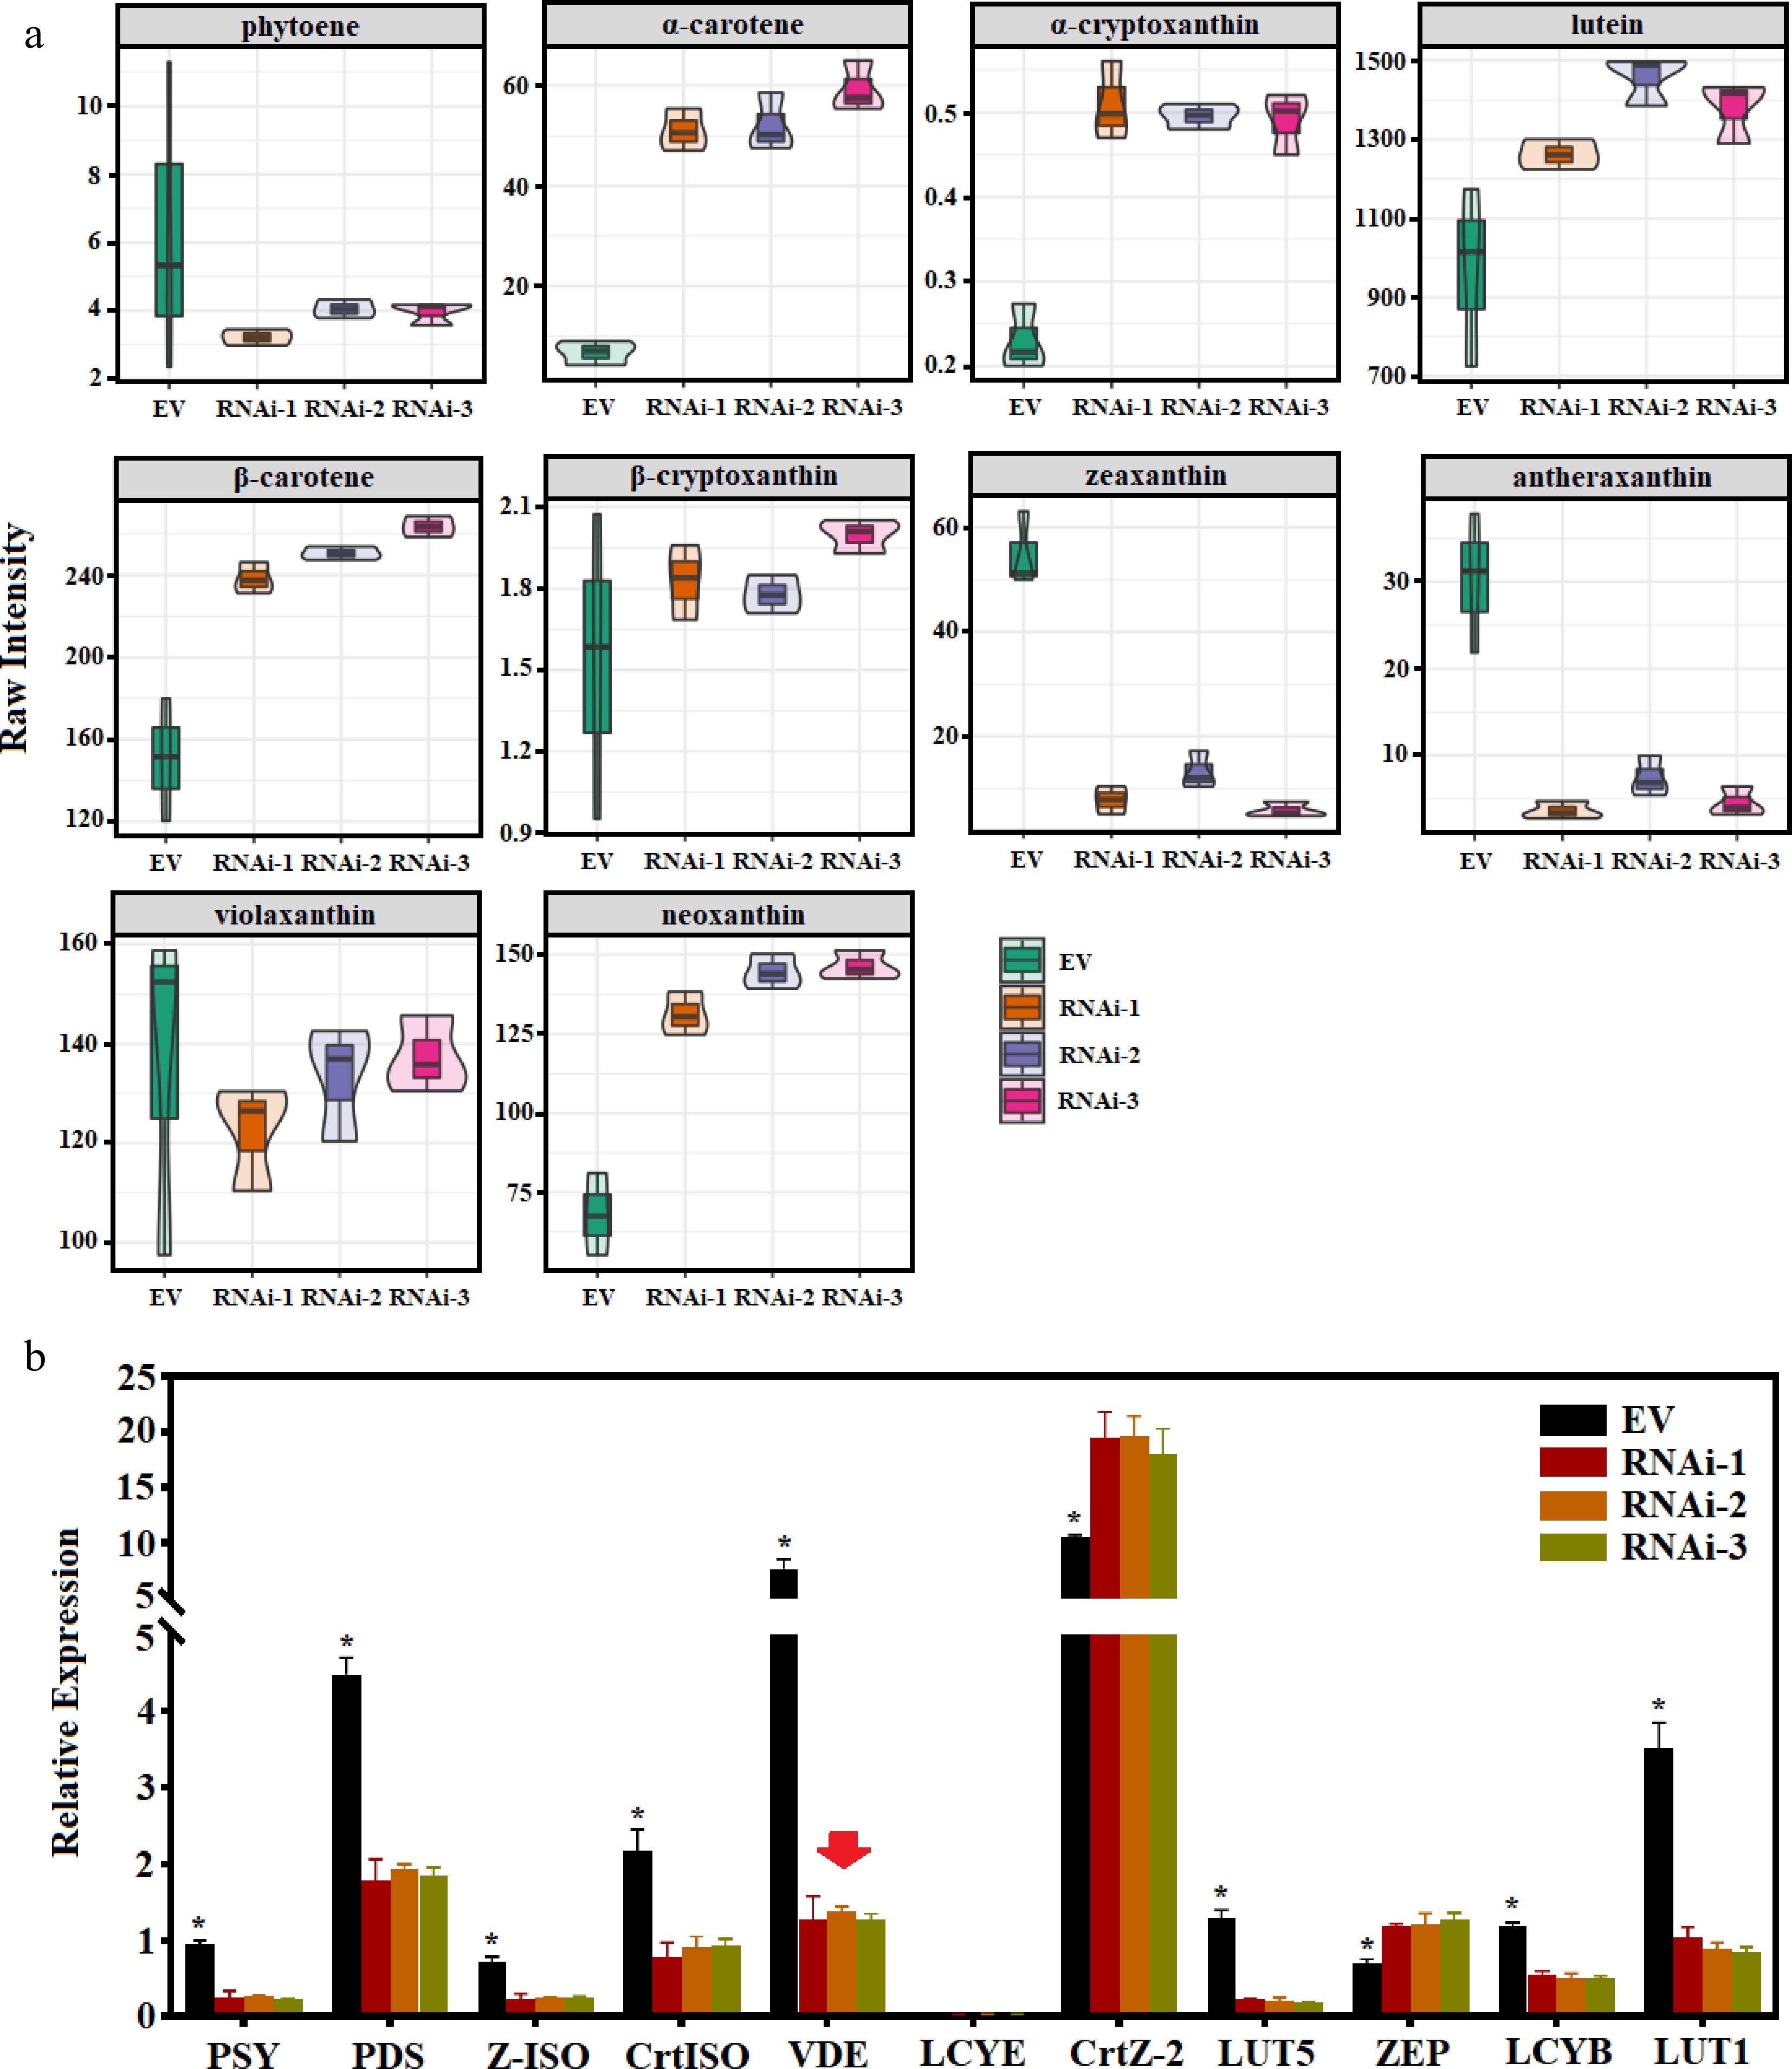
Figure 6.
Carotenoid content and gene expression of CaVDE silenced lines. (a) Volin plot of raw values of CaVDE silenced and EV line; (b) Quantitative verification of carotenoid pathway genes of CaVDE silenced and EV line.
-
The photosynthetic pigments of higher plants are mainly composed of chlorophyll and carotenoids. Leaf etiolation is mainly manifested in the inhibition of chlorophyll and carotenoid biosynthesis, resulting in the reduction of chlorophyll and carotenoid content, and finally leading to the generation of etiolated varieties[28]. Light quality plays an important role in regulating the content of photosynthetic pigments in plants[29], and different light qualities have different biological effects. Plants perceive different light qualities through photoreceptors, thus causing changes in photosynthetic pigments. Studies have found that the chlorophyll content of eggplant[30] and cucumber[31] plants under red light was significantly higher than that under blue light. Other studies have shown that green light could promote chlorophyll production by Chlorella vulgaris[32]. In plants, POR is a key enzyme in chlorophyll synthesis. It depends on light and catalyzes the conversion of DV-Pchlide to DV-Chlide a or the conversion of Pchlide a to Chlide a[33]. Chlorophyll A oxygenase (CAO) could convert Chlide a into Chlide b[34]. Chlorophyll synthetase (CHLG) can catalyze the synthesis of chlorophyll A and B in higher plants, completing the final step of chlorophyll synthesis[35]. In this study, POR (Capana10g000065) and CAO (Capana06g001723) were highly expressed under red and green light, while their expression levels were significantly decreased under blue and purple light, especially purple light. The high expression of POR and CAO genes further led to the synthesis of chlorophyll under the red and green light treatments. At the same time, although the expression of CHLG (Capana09g001431) was significantly increased under purple light, the low expression of POR and CAO under purple light resulted in less accumulation of chlorophyll synthesis precursor products, which ultimately resulted in the lowest chlorophyll content under purple light.
As part of the photosystem, carotenoids are essential for their assembly, light harvesting and light protection. The most important factor affecting the change of carotenoid content is light quality and light intensity, in which different wavelengths of light affect the composition and structure of the photosystem, thus providing the possibility to influence the concentration and composition of carotenoids in the photosystem by specific narrowband spectral illumination[36, 37]. However, the effect of different light qualities on carotenoid concentrations appears to be species dependent. The study found that blue light can increase the concentration of carotenoids in lettuce[18, 38] and spinach[39], and red light supplementation can promote the accumulation of carotenoids in tomatoes[40, 41], while komatsuna has the highest carotenoid content under white fluorescent light[39]. In this study, the highest carotenoid concentration was observed under red and green light treatment, while the lowest was observed under purple light treatment. This suggests that light quality has an important effect on carotenoid concentration in leaf yellowing mutants. At the same time, previous studies found that carotenoid content of Sinapis alba, Arabidopsis thaliana and tobacco increased during photoinduced de-etiolation[42, 43]. However, in this study, the leaf color of the mutant was significantly yellowed under purple light, indicating that the etiolation process was not only accompanied by the decrease of chlorophyll content, but also ccompanied with carotenoid content decreased.
The change of light quality not only affects the concentration of carotenoids, but also the composition of carotenoids. Previous studies have shown that changes in light quality can affect the contents and proportions of β-cryptoxanthin, zeaxanthin, β-carotene and lutein in citrus[44], Tartary buckwheat[45], and tomato[46]. In this study, contents of lutein, neoxanthin, α-cryptoxanthin, β-cryptoxanthin and β-carotene were higher under red light than those with other light conditions. The content of above metabolites were very low under purple light treatment, while zeaxanthin and antheraxanthin had a large amount of accumulation and were significantly higher than other light quality treatments. We believe that the difference in carotenoid component content may be caused by the different expression of genes related to carotenoid metabolism pathway induced by different light quality treatments.
Carotenoid biosynthesis in plants is mainly regulated by a series of enzymes or genes. PSY is considered to be the rate-limiting enzyme in the carotenoid synthesis pathway, its expression level and activity can affect the metabolic flux of the synthetic pathway[47]. The overexpression of PSY in some plants can significantly promote the accumulation of phytoene in leaves and greatly increase the synthesis of β-carotene[48, 49]. It has been found that a large number of genes are activated during plant etiolation[50], among which the transcript abundance of genes controlling metabolic fluxes (such as PSY and DXS) is greatly enhanced[47, 51]. In this study, the expression of PSY (Capana04g002519) gene under purple light was significantly increased compared with other light quality, and the phenomenon of leaf etiolation was also observed, suggesting that the increase of PSY gene expression promoted leaf etiolation. However, it has also been found that PSY transcripts are similarly increased during de-etiolation in Sinapis alba, Arabidopsis thaliana and tobacco seedlings[42, 43]. These results indicated that leaf etiolation was not only determined by PSY expression level, but also regulated by downstream related genes.
There are many carotenoid synthetases, which can form multi-enzyme complexes to play a role and accelerate the metabolic intensity of carotenoid biosynthesis[52]. At present, there are four putative models of carotenoid metabolic enzyme complexes, including PDS, Z-ISO, ZDS, CrtISO and LCYB complexes, which are capable of synthesizing β-carotene from phytoene[53]. In this study, the expression of PDS (Capana03g000054), CRTISO (Capana00g00480、Capana11g002179) and Z-ISO (Capana12g000229) under purple light were significantly higher than those under blue, red and green light, which was conducive to the massive synthesis of lycopene under purple light. However, the content of related metabolites was not identified, which may be that the intermediate lycopene was further catalyzed by the downstream enzymes to synthesize other substances. LCYB and LCYE are important nodes that control the diversion of lycopene to downstream branches, its relative expression levels determine the contents of β-carotene and α-carotene in the downstream of the branches, and the proportion of zeaxanthin, violaxanthin, lutein, neoxanthin, etc, in the total carotenoids[54−56]. In this study, LCYB (Capana05g000023) gene was highly expressed under purple light, while the expression trend of LYCE (Capana00g002014) was opposite to that of LCYB. This made a large number of upstream metabolites that were involved in β-carotene metabolic branch and less metabolite that was involved in α-carotene metabolic branch under purple light. While higher amounts of upstream metabolites were involved in α-carotene metabolic branch rather than β-carotene metabolic branch under red and green light. Meanwhile, higher expression of CRTZ-2 (Capana06g002492) under blue, red and green light resulted in further catalytic production of lutein by metabolites that are involved in the α-carotene metabolic branch. The low expression of LUT5 (Capana12g001743) results in metabolites involved in the β-carotene metabolic branch that cannot be further catalyzed in large quantities, resulting in accumulation of β-carotene and β-crpytoxanthin. However, the higher expression of LUT5 under purple light made β-carotene and β-crpytoxanthin could be further catalyzed to synthesize downstream metabolites, which significantly reduced the accumulation of β-carotene and β-crpytoxanthin.
The Xanthophyll cycle is located downstream of the carotenoid pathway[50] and is considered to be the main process of plant defense against stress damage such as strong light[55]. In chloroplasts, zeaxanthin epoxidase (ZEP) and violaxanthin de-epoxidase (VDE)[57, 58] are key enzymes in the regulation of the Xanthophyll cycle[50], which catalyze the interconversion of antherxanthin, violaxanthin and zeaxanthin components. Light intensity and redox status of chloroplasts can regulate the composition of xanthophyll[59]. When light energy is excessive in plants, a low pH environment will be formed in chloroplasts, which promotes the activation of VDE, thereby producing zeaxanthin[53]. Zeaxanthin can dissipate the excess light energy in the light-trapping complex (LHC), which can protect the photosynthetic organs from bright light damage[60]. However, when light energy is no longer excess, the direction of transformation is reversed, and zeaxanthin is regenerated into violaxanthin through antheraxanthin under the catalysis of ZEP[61]. In potato tubers, reduced expression of the ZEP gene promotes a large accumulation of zeaxanthin, resulting in an orange phenotype[62]. In this study, the expression of ZEP (Capana02g003105) and VDE (Capana12g001449) was at a high level under both blue and purple light, but the antheraxanthin and zeaxanthin accumulated a lot under purple light, but less accumulated under blue light. This is because the expression of VDE under purple light treatment was 36.01% higher than that under blue light, while the expression of ZEP was 23.24% lower than that under blue light. Due to such expression differences, the process of VDE catalyzed deepoxidation of violaxanthin to form antheraxanthin and zeaxanthin under purple light was enhanced, while the catalytic process of zeaxanthin to violaxanthin under the catalysis of ZEP is weakened. As a result, the blue light treatment catalyzed the synthesis of more violaxanthin, while the purple light treatment catalyzed the synthesis of antheraxanthin and zeaxanthin in large quantities, thus making the leaves under purple light treatment yellow.
-
In this study, a total of 31,853 genes were quantified and 1,239 genes were differentially expressed in blue, red, green and purple light. The genes related to carotenoid metabolism pathway such as PSY, LUT5 and VDE were significantly increased, while the expression levels of chlorophyll synthesis related genes POR and CAO were significantly decreased under purple lught. At the same time, 10 kinds of metabolites were detected more abundant in pepper leaves. Among them, zeaxanthin and antheraxanthin were accumulated in large quantities under purple light. After silencing CaVDE gene under purple light, leaf etiolation degree was significantly weakened, chlorophyll, carotenoids and net photosynthetic rate were significantly increased, and the accumulation of zeaxanthin and antheraxanthin was significantly decreased.
-
Pepper leaf yellowing mutant material yl1 was provided by the College of Horticulture, Hunan Agricultural University. Seeds were sown in 50 hole trays with the nutrient substrate (organic matter ≥ 20%) and grown in a greenhouse (the photoperiod was set to 16/8 h day/night, the temperature was 30 ± 2 °C / 20 ± 2 °C). After growing to two-leaf stage, the seedlings were transplanted to 6 cm × 10 cm pots and then placed under four different light qualities of blue (B), red (R), green (G) and purple light (P) for 15 d. The light intensity was set to 60 ± 5 μmol·m−2·s−1 (Supplemental Fig. S1), the photoperiod was set to 16/8 h day/night, the temperature was 28/20 °C, and the humidity was controlled at 65% ± 5%. Fifteen seedlings were planted in each light treatment and each treatment was repeated three times. After 15 d of normal fertilizer and water management of each light treatment, the color index, photosynthetic rate and chlorophyll fluorescence parameters of seedlings were measured at 10:00 to 11:00 in the morning. Five pepper seedlings with the same growth were selected from each repetition, and the 3rd to 8th true leaves (six leaves in total) from top to bottom of the seedlings were sampled, mixed and divided into three parts, and quickly frozen into liquid nitrogen and stored at −80 °C for physiological measurement, transcriptome, and metabolome analysis.
Determination of leaf color index, photosynthesis and chlorophyll fluorescence parameters
-
The ΔL, Δa and Δb values of pepper leaves under different light quality treatments were measured using a spectrophotometer (Ts7600, Shenzhen 3nh Technology Co., Ltd., Shenzhen, China). At 9:00−11:00 in the daytime, the photosynthetic parameters of pepper seedling functional leaves (3rd to 4th leaves from the top) were measured by LI-6400 photosynthetic apparatus. The photosynthetic apparatus was set as red and blue light source, the light intensity was 800 μmol·m−2·s−1, and the CO2 concentration was 400 μmol L−1. After the photosynthetic parameters were determined, the functional leaves of pepper under various light quality treatments were fully dark adapted, and the chlorophyll fluorescence parameters were determined by Fluorpen (FP110/D) handheld chlorophyll fluorescence instrument. The maximum photochemical efficiency Fv/Fm, photochemical quenching coefficient qP and non-photochemical quenching coefficient NPQ of light system II were calculated according to the method of Maxwell & Johnson[63]. Three plants were selected for each treatment and repeated three times.
Determination of chlorophyll content
-
Referring to the method reported by Arnon[64], the materials were extracted with 80% acetone and then whitened. The absorbance values at wavelengths of A663, A645 and A470 were measured by multi-functional microplate reader (TECAN/ SPARK), and the contents of chlorophyll a, chlorophyll b and carotenoids were calculated.
Construction of gene fragment and VIGS system
-
The RNA of pepper leaves was extracted by the TRIzol[65] method, and the extracted RNA was reverse transcribed into cDNA using Vazyme reverse transcriptase kit (Jiangsu, China). The NCBI database (
www.NCBI.nlm.nih.gov ) was searched for the full-length CDS sequence of VDE. The most effective silent area on sitehttps://vigs.solgenomics.net/ . was found according to the principle of primer specific design, the primers for silencing VDE gene sequence (F: CGCTTGTCCCTCAGTCAAAC, R: TCTTCCGCACCATCAAAGCT) were designed by Primer 5.0 software. The target fragment was obtained by PCR, and the selected endonuclease EcoRI and ExnaseII, recombine the purified product of the target fragment with TRV2 vector, and transfer the recombinant product into E. coli DH5 α. Monoclonal cells were selected for PCR identification and sequencing verification. Finally, the right monoclonal solution was selected to extract the plasmid, and then transferred into Agrobacterium tumefaciens GV3101. After PCR identification of Agrobacterium tumefaciens, the infection solution was prepared for use in the infection of pepper leaves by Agrobacterium tumefaciens.Method for detecting efficiency of gene silencing plants
-
Three weeks after the injection of Agrobacterium tumefaciens into pepper plants, the leaves of some plants inoculated with TRV1-PDS showed albinism, and the inoculation was confirmed to be successful. The TRV1-PDS plants, TRV1-TRV2 plants and TRV1-VDE silenced plants were placed under purple light (light intensity 60 ± 5 μmol·m−2·s−1, photoperiod 16/8 h day/night, temperature 28/20 °C, humidity 65% ± 5%), 15 d after treatment. The color value, photosynthetic rate and chlorophyll fluorescence parameters were measured. At the same time, the leaves of TRV1-TRV2 no-load plants and TRV1-VDE silencing plants were collected and stored at −80 °C for qPCR determination. The primers were listed in Supplemental Table S4. The relative expression levels were measured and calculated by Roche Lightcycler® 96 instrument.
RNA Extraction, library preparation and sequencing
-
According to the manufacturer’s instructions, TRI reagent (Sigma Life Science, USA) was used to extract total RNA instructions from tissues. RNA was examined by non-ribonuclease agarose gel electrophoresis to avoid possible degradation and pollution, and then verified by Agilent 2100 biological analyzer (Agilent Technology Company, Santa Clara, California, USA). Next, oligo-dT beads (Qiagen, Germany) were used to isolate Poly (A) mRNA, and then the mRNA was randomly disrupted into 200–300 bp short segments by adding Fragmentation Buffer. The first cDNA chain was synthesized by using mRNA as the template with random hexamers, and then the second cDNA chain was synthesized by adding buffer, dNTPs, RNaseH and DNA polymerase I. The cDNA was purified by AMPure XP beads. After purification, the double-stranded cDNA was subjected to terminal repair. A tail was added, and the sequencing joint was ligated, and then AMPure XP beads were used for fragment size selection. Finally, cDNA library was obtained by PCR enrichment. Then Illumina sequencing platform (Illumina-nova6000) using paired-end sequencing technology. Each strain was subjected to three biological replicates, and finally 12 DGE libraries were generated and sequenced.
Transcriptome analysis
-
The original image data generated by the sequencer is converted into a sequence, which is defined as 'original read'. Low-quality sequences were removed (more than 50% of the base mass of a sequence is less than 20, 5% of the unknown base (N) readings and reads containing adapter sequences) to obtain high-quality clean data. All downstream analysis in this article is based on high-quality clean data[66].
TopHat2 were used to map clean readings to the pepper reference genome, allowing up to one mismatch. All successfully mapped transcripts were identified and analyzed using R packaging edgeR, and the expression levels of each gene were calculated and normalized to FPKM. Log2fold change (log2FC) value > 2 (up-regulated) or < −2 (down-regulated). FDR was used to determine the threshold of P value in multiple experiments. The transcripts with FDR < 0.05 were considered to be meaningful and used as the significant indigenous boundary for gene expression differences. Differential genes were used for GO and KEGG enrichment analysis. GO term with P-value < 0.05 and KEGG pathway with P-value < 0.05 were considered as significant enrichment of differentially expressed genes.
Metabolite extraction
-
The pepper leaves were freeze-dried and ground into powder on a grinding machine, then the tissue samples (50 mg) were weighed and dissolved in 500 μL extract (50% methanol aqueous solution containing 0.1% hydrochloric acid). The samples were subjected to the following procedures: vortex 5 min, ultrasonic 5 min, centrifuge 3 min (12,000 r/min, 4 °C), extract the supernatant, repeat the operation once; the supernatant was combined twice, and the samples were filtered from the microporous membrane (0.22 μm pore size) and collected into a bottle for LC-MS/MS analysis. Supernatant mixtures of biological samples of the same volume were used as quality control (QC) samples to evaluate the stability of the system. In addition, the blank control was established to run with QC samples to remove background pollution[67] .
HPLC-MS/MS analysis
-
ExionLC was used for LC-MS/MS analysis of the AD system (SCIEX) of TM New Gene Co., Ltd. (Beijing, China) coupled with QTRAP® 6500+mass spectrometer (SCIEX). The samples were subjected to chromatographic column (ACQUITY BEH C18 1.7 μm, 2.1 mm × 100 nm), flow rate 0.35 mL·min−1, column temperature 40 °C, and positive/negative polarity mode. The mobile phase was divided into phase A and phase B, with liquid phase A containing ultrapure water (0.1% formic acid) and liquid phase B containing methanol (0.1% formic acid). Solvent gradient program is set as follows: 0.00 min, 5% B; 50% B, 6.00 min; 95% B, 12.0 min; 2 min, 5% B, 14; 2% B, balance 2 min. Mass spectrometry conditions mainly include electrospray ionization (ESI) QTRAP® 6500+mass spectrometer operating in positive ion mode, temperature parameter setting is 550 °C, ion spraying voltage is set to 5,500 V, Curtain Gas (CUR) is set to 35 psi, medium collision gas, ion source gas 1:60, 2:60 ion source gas. QTRAP® 6500+mass spectrometer works in negative mode, voltage-4500V, temperature 550 °C, medium collision gas, ion source gas 1:60, ion source gas 2:60.
Metabolic data analysis
-
The gene sequences were obtained from the NCBI (
ftp://ftp.ncbi.nih.gov/blast/db/ ) database, and the metabolites were annotated using the KEGG database (www.genome.jp/kegg ), HMDB database (www.hmdb.ca ) and Lipidmaps database (www.lipidmaps.org ) principal component analysis (PCA)) and partial least squares discriminant analysis (PLS-DA)) in metaX (a flexible and comprehensive processing software). The statistical significance (P value) was calculated by single factor analysis (t test). The metabolites with VIP > 1, P value < 0.05, fold change ≥ 2 or FC ≤ 0.5 were differential metabolites. Volcanic maps are used to screen interested metabolites according to the metabolites of Log2 (FC) and −log10 (P value) ggplot2 in R language. For the clustering heat map, the z scores of different metabolite intensity regions are used to normalize the data, and the Pheatmap package in R language is used to draw the data. The correlation between different metabolites was analyzed by R language cor, and the correlation between different metabolites was corrected by R language. When the metabolite metabolic pathway P-value < 0.05, statistically significant enrichment was considered, and the correlation mapping language was used in the Corrplot software package to study the function and metabolic pathways of these metabolites using the KEGG database when x/n > y/n.Quantitative real-time PCR
-
The qRT-PCR method was performed according to Taylor et al.[68]. Using cDNA as template, the Vazyme fluorescent quantitative kit (ChamQTM SYBR® qPCR Master Mix, Jiangsu, China) was used for qRT-PCR validation. Gene-specific primers for qPCR were designed based on selected sequences from RNA-seq (Supplemental Table S4). The relative expression level of genes was standardized by 2−ΔΔCᴛ method[69] .
Data analysis
-
The experimental results were expressed in mean ± standard error and analyzed in Excel 2010 and SPSS 23.0. Duncan's test at a significance level of P < 0.05 was used to analyze the significance of the difference between different data sets.
Registration mark
-
The RNA-Seq data generated in this study are available from the SRA archive (
www.ncbi.nlm.nih.gov/sra ) registration number: PRJNA868108. This research was Supported by the Project of Education Department of Hunan Province (Grant No. 22B0229), the China Agriculture Research System of MOF and MARA (Grant No. CARS-24-A05), and the Special Project of Biological Seed Industry and Fine and Deep Processing of Agricultural Products (Grant No. 202202AE090031)
-
The authors declare that they have no conflict of interest.
-
# These authors contributed equally: Zhoubin Liu, Yunhua Dai
- Supplemental Table S1 Transcriptome data of pepper leaves under different light qualities.
- Supplemental Table S2 Differentially expressed genes in different comparision groups.
- Supplemental Table S3 Statistics of metabolite content in Carotenoid pathway.
- Supplemental Table S4 List of the primers used in this study.
- Supplemental Fig. S1 Photomass spectrometry with different light qualities.
- Copyright: © 2022 by the author(s). Published by Maximum Academic Press, Fayetteville, GA. This article is an open access article distributed under Creative Commons Attribution License (CC BY 4.0), visit https://creativecommons.org/licenses/by/4.0/.
-
About this article
Cite this article
Liu Z, Dai Y, Mao L, Yang S, Yang B, et al. 2022. Integrated metabolome and transcriptome analysis revealed carotenoid metabolism difference in pepper (Capsicum annuum L.) yellowing mutants under different light quality. Vegetable Research 2:21 doi: 10.48130/VR-2022-0021 

Integrated metabolome and transcriptome analysis revealed carotenoid metabolism difference in pepper (Capsicum annuum L.) yellowing mutants under different light quality
- Received: 08 October 2022
- Accepted: 22 November 2022
- Published online: 19 December 2022
Abstract: Light is an important environmental factor for plant growth and development, different light qualities have different regulatory effects on plants. To investigate the effect of light quality on plants, we determined the physiological characteristics, transcriptome and metabolome analysis of pepper yellowing mutants yl1 treated with blue, red, green, and purple light. Results showed that the leaf of yl1 was obviously yellowing, and the contents of chlorophyll, carotenoid and net photosynthetic rate in yl1 were significantly decreased under purple light. A total of 31,853 genes were quantified under blue, red, green and purple light. The genes related to carotenoid metabolism pathway such as PSY, LUT5 and VDE were significantly increased, while the expression levels of chlorophyll synthesis related genes POR and CAO were significantly decreased under purple light. At the same time, 21 carotenoid pathway metabolites were detected under the four light different lights, and 10 metabolites were more abundant in pepper leaves. α-carotene, β-carotene, lutein, neoxanthin, α-cryptoxanthin and β-cryptoxanthin were significantly accumulated under blue, red and green light. However, zeaxanthin and antheraxanthin were accumulated in large quantities under purple light. After silencing the CaVDE gene under purple light, leaf etiolation degree was significantly weakened, chlorophyll, carotenoids and net photosynthetic rate were significantly increased, and the accumulation of zeaxanthin and antheraxanthin was significantly decreased. These results provide a reference for analyzing the changes of carotenoid components induced by VDE in purple light and provide new insights into the mechanism of leaf color change in plants.
-
Key words:
- Light quality /
- Pepper /
- Yellowing mutants /
- Carotenoid /
- Zeaxanthin /
- Antheraxanthin