


-
In recent years, increasing attention has been directed toward the widespread occurrence of endocrine-disrupting compounds (EDCs) in aquatic environments, owing to their persistence, bioactivity, and potential risks to ecological and human health[1,2]. Among these, estriol (E3), a naturally occurring estrogen, has been frequently detected in domestic sewage, hospital effluents, and discharges from municipal wastewater treatment plants[3−5]. Although environmental concentrations of E3 are typically in the range of ng/L to μg/L[6,7], its high estrogenic potency enables it to exert biological effects at sub-nanogram levels, thereby raising concerns even at trace exposure concentrations[8,9]. Moreover, it can range from μg/L to mg/L in hospital wastewaters, pharmaceutical manufacturing effluents, and pig farm wastewaters[10,11], posing a considerable challenge to conventional treatment systems.
Conventional wastewater treatment technologies, particularly activated sludge systems, often exhibit limited efficiency in removing estrogens[12,13], primarily due to their low biodegradability and resistance to microbial degradation[14]. Meanwhile, advanced physicochemical methods, such as ozonation, advanced oxidation processes, and adsorption, although capable of improving removal efficiencies, often involve high capital and operational costs, complex operations, and a risk of forming toxic transformation byproducts[15−17]. Although pure cultures (e.g., Novosphingobium sp.) can effectively degrade E3, their sensitivity to environmental fluctuations and lack of functional redundancy stand in sharp contrast to the robustness of complex microbial communities in the microalgal-bacterial granular sludge (MBGS) system[18].
MBGS has emerged as a promising sustainable solution for wastewater treatment, integrating the complementary roles of phototrophic microalgae and heterotrophic bacteria within a self-aggregated granular structure[19,20]. This system enhances the removal of organic matter and nutrients, promoting the biodegradation of recalcitrant micropollutants through diverse microbial consortia and internal oxygen cycling[21,22]. Notably, the dominance of Proteobacteria within MBGS[20], a phylum with known E3-degrading capabilities[18,23], suggests an inherent potential for E3 removal. Furthermore, the synergistic relationships between microalgae and bacteria can improve the adsorption, transformation, and mineralization of refractory compounds[21,24]. The structural integrity provided by Cyanobacteria is essential for granule stability and system resilience[25,26], and their sensitivity to high E3 stress is a critical determinant of the system's overall stability. However, their possible susceptibility to high E3 stress remains a key factor influencing overall system performance. Given its documented resilience to environmental perturbations and shock load[27,28], the MBGS system represents a compelling candidate for treating wastewaters containing high or fluctuating levels of E3. A systematic understanding of its metabolic responses and biodegradation pathways under sustained E3 exposure however, remains insufficient.
This study aims to investigate the metabolic responses and biodegradation pathways of the MBGS system when exposed to varying concentrations of E3 (0, 0.1, 1, and 10 mg/L). By integrating analysis of granule morphological characteristics, pollutant removal efficiency, and microbial community succession, this research aims to elucidate the adaptive responses of the MBGS system to varying E3 concentrations. This approach enables a comprehensive assessment of the MBGS system robustness, microbial adaptability, and functional gene responses under estrogenic stress. Insights from this work will contribute to a deeper understanding of E3 biodegradation mechanisms in MBGS systems, and inform the development of resilient and efficient biotechnological solutions for the treatment of EDC-contaminated wastewater.
-
Synthetic wastewater was formulated to contain 400.0 mg/L chemical oxygen demand (COD) (as CH3COONa), 25.0 mg/L ammonia nitrogen (NH4+-N) (as NH4Cl), and 3.5 mg/L phosphorus (PO43−-P) (as KH2PO4). The required dosages were 527.0, 95.5, and 15.4 mg/L of each compound, respectively, whereas the other compositions are shown in Supplementary Table S1. The influent dissolved oxygen (DO) concentration was maintained at around 3.2 mg/L, while the pH and water temperature were controlled at about 7.4 and 22.5 °C, respectively.
E3 was purchased from Shanghai Aladdin Biochemical Technology Co., Ltd. (Shanghai, China). A stock solution was prepared by dissolving E3 in ultrapure water with 0.5 h of magnetic stirring, followed by 1.0 h of ultrasonication (40 kHz) using an ultrasonic cleaner[29]. Synthetic wastewaters containing 0, 0.1, 1, and 10 mg/L E3 were prepared daily for experiments.
Experimental setup
-
The MBGS, sourced from previous work[20], had the following initial physical properties: average size of 2.8 mm, 5-min sludge volume index (SVI5) of 46.5 mL/g, zone settling velocity (ZSV) of 1.5 cm/s, and volatile suspended solids (VSS) concentration of 4.0 g/L in all reactors. Daily experiments were conducted using 12 glass vials (organized into four groups with triplicate samples each) with an effective working volume of 100 mL. Illumination was provided by four LED lamps (MBTL-T8-18, Hangzhou Mobet Biotechnology Co., Ltd., China) to achieve a uniform light intensity of 200 μmol/m2/s. The hydraulic residence time (HRT) was maintained at 12 h under a 12 h/12 h light/dark cycle. Influent and effluent samples were collected daily at 9:00 and 21:00 to assess the removal efficiencies of conventional pollutants (COD, NH4+-N, PO43−-P) and E3 over 12 h intervals. MBGS samples were taken from each group on days 1 and 21 for further analysis. Batch experiments were performed using 24 glass vials (eight groups of triplicates) with an effective working volume of 50 mL, and spiked with 10 mg/L of E3. The experiments were conducted separately under light (day phase), and dark (night phase) conditions. Water samples were taken at time intervals of 0, 0.5, 1, 1.5, 2, 3, 4, 8, and 12 h to determine the kinetics of pollutant and E3 removal by the MBGS.
To evaluate the contribution of adsorption to E3 removal, batch adsorption experiments were conducted using autoclave-inactivated MBGS. MBGS obtained from the control reactor was sterilized via autoclaving at 121 °C for 30 min. This treatment effectively eliminated microbial activity while retaining the structural integrity and adsorption capacity of the extracellular polymeric substances (EPS). The inactivated biomass was subsequently rinsed with sterile phosphate-buffered saline (PBS; 0.1 M, pH 7.0) to eliminate soluble compounds released during autoclaving. All glass vials were incubated in the dark to preclude photodegradation. Liquid samples were collected at predetermined time intervals (0, 0.5, 1, 1.5, 2, 3, 4, 8, and 12 h), and promptly filtered through 0.22-μm nylon membrane filters for subsequent analysis.
For pollutant analysis, water samples were filtered through a 0.45 μm membrane and stored in a refrigerator at 4 °C for subsequent measurements. For E3 analysis, water samples were acidified to a pH of 3 with HCl, and stored at 4 °C in amber glass vials to prevent photodegradation. All water samples were analyzed within 24 h. Biomass samples for DNA extraction and EPS analysis were flash-frozen in liquid nitrogen and stored at −80 °C until processing to preserve biomolecular integrity.
Analytical methods
-
Pollutant concentrations and granular characteristics were measured using standard analytical methods[30]. The theoretical COD contribution from E3 was calculated based on its stoichiometric oxidation equation (C18H24O3 + 20O2 = 18CO2 + 12H2O), and deducted from measured influent and effluent values. Therefore, all reported COD removal efficiencies reflect only the removal of the underlying synthetic wastewater substrate. MBGS morphology was visualized using an inverted fluorescence microscope (Olympus IX83, Tokyo, Japan) and a scanning electron microscope (Gemini 500, Zeiss, Germany). The surface functional groups of EPS were analyzed by a Fourier transform infrared spectrometer (FT-IR, IRTracer 100, Shimadzu, Japan). Specific methods for detecting granule size, EPS (including protein (PN) and polysaccharide (PS)) content, 3D-EEM fluorescence spectrum of EPS, chlorophyll (Chl) content, and glycogen content of MBGS are described in Supplementary Text S1. Instruments used to measure light intensity, DO concentration, pH, and temperature during the experiment are presented in Supplementary Text S2.
E3 concentration and metabolism analyses
-
For the quantification of E3 concentration, water samples were analyzed using high-performance liquid chromatography (HPLC, Foley LC5090, Zhejiang Fuli Analytical, China) coupled with a UV detector[31]. The chromatographic separation was performed using a reversed-phase C18 column (250 mm × 4.6 mm i.d., 5 μm particle size; Shimadzu, Kyoto, Japan) maintained at 25 °C. Isocratic elution was employed using a mobile phase of HPLC-grade acetonitrile and ultrapure water (65:35, v/v) at a flow rate of 1.0 mL/min. Detection was carried out at 250 nm with an injection volume of 10.0 μL. The autosampler needle was rinsed with chromatographic-grade methanol between injections. Quantification was conducted using an external standard method based on a calibration curve. The method demonstrated excellent linearity (R2 > 0.999) across the concentration range of 0.05–20 mg/L.
For metabolite analysis of E3, an ultra-high-performance liquid chromatography (UHPLC, ExionLC™ 2.0, Shimadzu, Japan) with a high-resolution mass spectrometry system (HRMS, QTOF X500R, AB SCIEX, USA) was used to analyze the effluent samples of 10 mg/L E3 addition[18]. Chromatographic separation was performed on an ACQUITY UPLC BEH C18 column (100 mm × 2.1 mm i.d., 1.9 μm; Waters, Milford, MA, USA) maintained at 50 °C. The mobile phase consisted of: (A) an aqueous solution containing 0.1% (v/v) formic acid; and (B) acetonitrile, with a flow rate of 0.3 mL/min and an injection volume of 4 μL. Mass spectrometric detection was conducted using electrospray ionization (ESI) in both positive/negative modes with the following parameters: capillary voltage, 5 kV; curtain gas, 35 psi; desolvation temperature, 550 °C; nebulizer gas, 50 psi; auxiliary gas, 50 psi; and nitrogen as the collision gas. The scanning mode was information-dependent acquisition (IDA), with the mass range of 50~1,050 Da, and the voltage parameters included de-clustering voltage 80 V, MS1 fragmentation voltage 10 V and MS2 fragmentation voltage 35 V. In addition, E3 and its eventual degradation products were analyzed for toxicity prediction, including the bioconcentration factor and mutagenicity, using TEST 5.1.2.0 software[32].
Metagenomic sequencing analysis
-
Genomic DNA was extracted from MBGS samples using the FastPure Soil DNA Isolation Kit (MJYH, Shanghai, China) and assessed by 1% agarose gel electrophoresis. The DNA was sheared to approximately 350 bp fragments using a Covaris M220 instrument, followed by library construction (paired-end, bridge PCR) and Illumina sequencing[33]. Open reading frames (ORFs) were predicted from assembled contigs with Prodigal v2.6.3, and a non-redundant gene catalog was constructed using CD-HIT. Gene abundance was quantified by aligning high-quality reads to this catalog via SOAPaligner. Taxonomic and functional annotations were assigned through alignment against the NR database (for species annotation) and the KEGG pathway database (for functional annotation)[34]. The raw metagenomic sequences are available under NCBI BioProject Accession No. PRJNA1245017.
Functional annotation of non-redundant genes was conducted by BLASTP alignment (e-value < 1e−5) against the KEGG database. Genes were assigned to KEGG orthologs (KOs) and metabolic pathways based on top BLAST hits. Key functional genes related to carbon, nitrogen, phosphorus, and E3 metabolism were screened using KO identifiers. The abundance of each KO was calculated as the sum of the abundances of all corresponding genes and normalized to transcripts per million (TPM) to facilitate cross-sample comparison. Taxonomic annotation of ORFs was performed using BLASTP against the NR database (e-value < 1e−5), with the top hit used for family-level classification. For each key KO, the relative contribution of a taxonomic group was calculated as the proportion of the total KO abundance accounted for by that group. This method identified microbial taxa central to carbon, nitrogen, phosphorus, and estrogen metabolism within the community.
Statistical analysis
-
All experimental data were collected in triplicate and statistically assessed by one-way ANOVA using SPSS software. Statistical significance thresholds were assigned based on the following criteria: * p < 0.05, ** p < 0.01, and *** p < 0.001. Correlation analysis and first-order kinetic modeling were performed using OriginPro 2025 software.
-
The addition of E3 significantly impacted the granular morphology and characteristics of MBGS, especially at concentrations of 1 and 10 mg/L. E3 was found to disrupt the filamentous structure of Cyanobacteria within the MBGS, resulting in structural breakage and membrane rupture (Fig. 1). Consequently, the abundance of Cyanobacteria, chlorophyll content, and glycogen content in MBGS were significantly reduced (Fig. 2a, b). As Cyanobacteria act as a reticular skeleton for the MBGS[25], their structural disruption and decreased abundance negatively affect the settling performance of the system[22]. At E3 concentrations of 1 and 10 mg/L, MBGS exhibited increased granule size, along with higher SVI5, and lower ZSV (Fig. 2c; Supplementary Fig. S1). In contrast, 0.1 mg/L E3 might promote the growth and settling performance of MBGS, as evidenced by an increased VSS concentration, a lower SVI5, and a higher ZSV compared to 0 mg/L (Fig. 2c; Supplementary Fig. S1a, S1b).
Figure 1.
Microbial morphological characteristics of MBGS under varying estriol (E3) concentrations (0, 0.1, 1, and 10 mg/L). (a) White-light, and (b) red-light micrographs, with red autofluorescence indicating Cyanobacteria. (c) SEM images.
Figure 2.
Physiological and biochemical responses of MBGS to varying estriol (E3) concentrations (0, 0.1, 1, and 10 mg/L). (a) Chl-a and Chl-b contents. (b) Glycogen content. (c) Granule size and SVI5. (d) EPS content and PN/PS ratio. (e) FT-IR spectrum of EPS.
Additionally, exposure to E3 prompted MBGS to enhance its secretion of EPS (Fig. 2d; Supplementary Fig. S1c), particularly polysaccharides (PS), as a compensatory response to mitigate its toxicity[35]. This response supports two primary protective functions: the formation of a cross-linked physicochemical barrier against xenobiotic intrusion[36]; and the provision of functional groups that facilitate E3 adsorption[37]. FT-IR analysis further confirmed interactions between EPS functional groups and E3 molecules (Fig. 2e; Supplementary Table S2). Key spectral shifts, including N−H, C=O, and COO− groups from PN, along with O−H, C−O groups from PS, implied they may interact with hydroxyl or ketone groups in E3 and thus serve as the primary adsorption sites for E3. Under high E3 stress (10 mg/L), a marked reduction in proteins (PN) coincided with an increase in the abundance of oxidative stress genes (SOD, CAT; Supplementary Table S3), indicating a metabolic reallocation from polymer synthesis toward essential detoxification processes. The dynamic PN/PS ratio variations further reflect EPS-mediated adaptive strategies. Collectively, these results demonstrate that EPS contributes critically to MBGS resilience through barrier formation and contaminant adsorption, although precise binding mechanisms remain a focus for future investigation.
Inhibition of pollutant removal by MBGS under E3 exposure
-
As indicated in Fig. 3, high concentrations of E3 (1 and 10 mg/L) significantly inhibited pollutant removal by MBGS, particularly for COD (p < 0.05). In contrast, an E3 concentration of 0.1 mg/L enhanced COD removal efficiency, with average COD removal efficiencies increasing from 74.4% to 84.1% during the daytime, and from 49.6% to 53.8% at night. During days 8 to 21 of exposure to 10 mg/L E3, nighttime COD removal efficiency experienced a significant decline (Supplementary Fig. S2), likely due to structural damage in Cyanobacteria that impaired organic assimilation by MBGS[29]. Although NH4+-N and PO43−-P removal exhibited similar dependence on cyanobacterial activity (Supplementary Fig. S3a), their underlying mechanisms were distinct. Importantly, NH4+-N removal depends on light availability[38], with sufficient daylight irradiation offsetting the reduction in Cyanobacteria, causing comparable daytime performance but significant variability during nighttime. Conversely, PO43−-P removal exhibited compromised diurnal variation, as the destruction of Cyanobacteria hindered normal nighttime phosphate release[39], ultimately diminishing subsequent phosphorus uptake during the day.
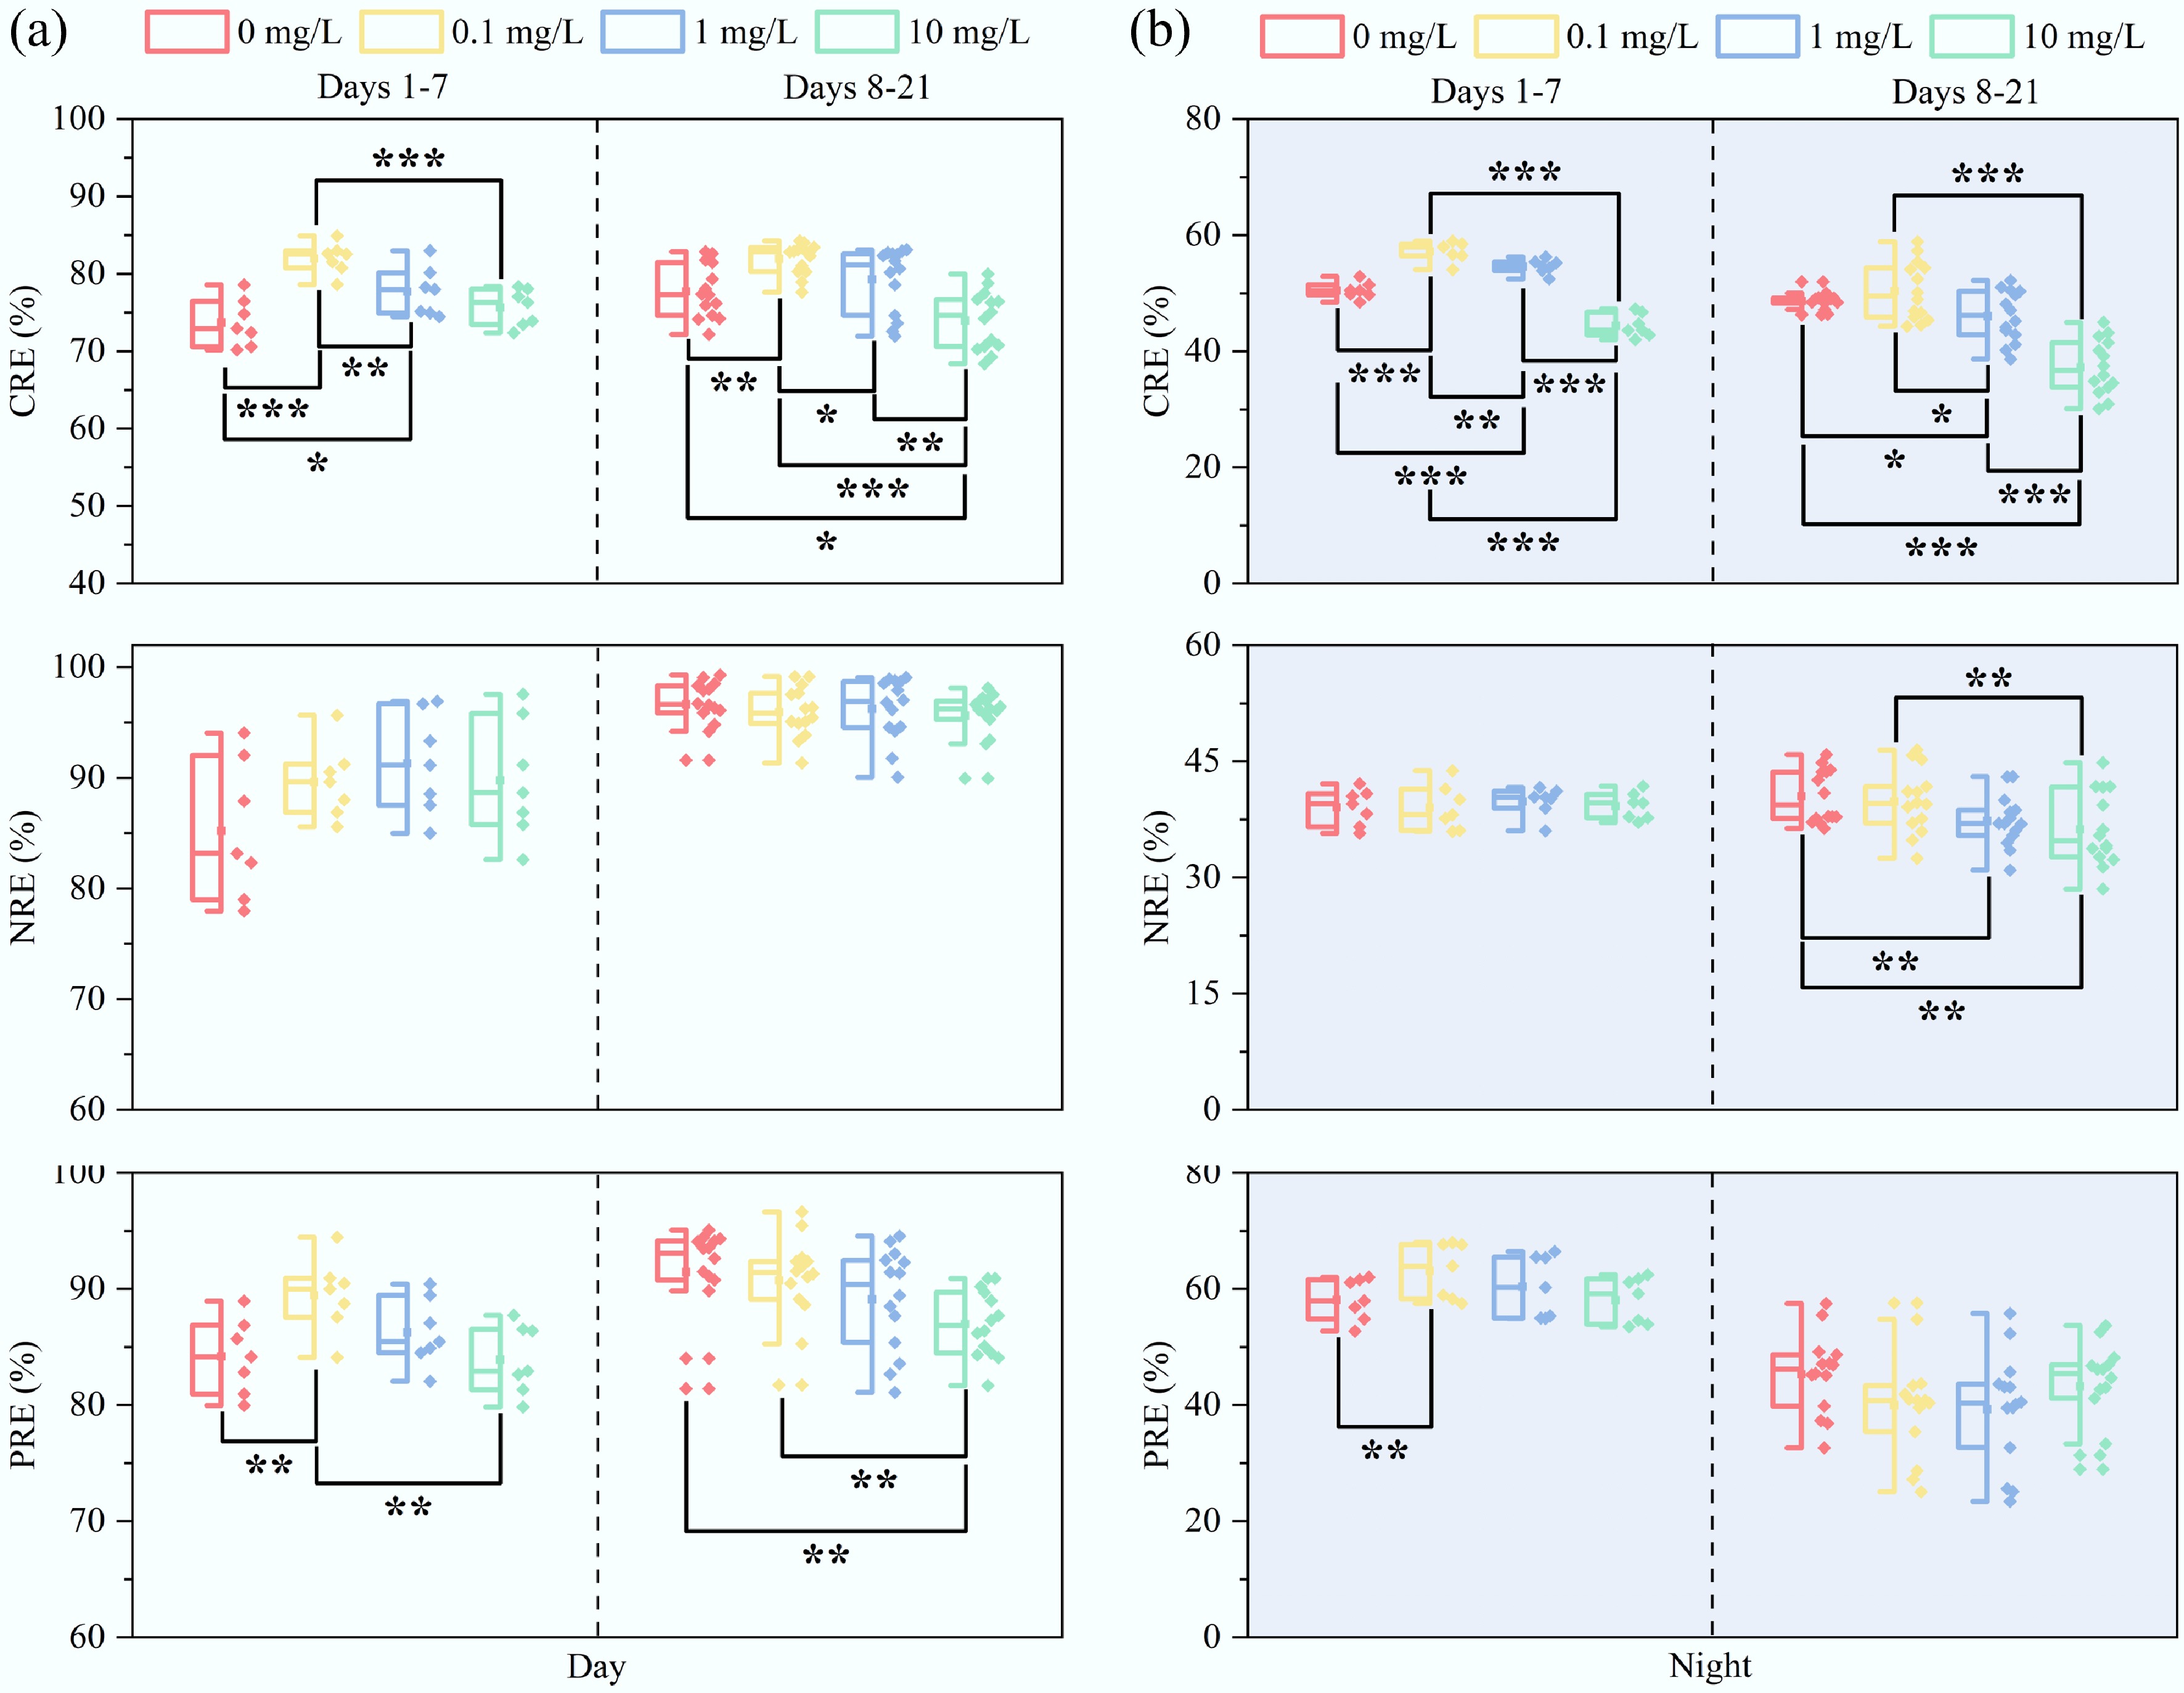
Figure 3.
Diurnal removal performance of pollutant by MBGS under varying estriol (E3) concentrations (0, 0.1, 1, and 10 mg/L). Removal efficiencies (RE) of COD, NH4+-N, and PO43−-P during (a) daytime, and (b) nighttime. n = 7 and 14 for days 1–7, and 8–21, respectively. * p < 0.05, ** p < 0.01, and *** p < 0.001.
Figure 4 illustrates the cyclical removal performance of pollutants by MBGS under 10 mg/L E3 stress. The removal efficiencies of MBGS for COD, NH4+-N, and PO43−-P were 70.5%/32.0%, 97.9%/26.1%, and 81.6%/28.4%, respectively, during the daytime and nighttime periods, and they stabilized at 4 h/4 h, 8 h/1 h, and 3 h/1.5 h, respectively. The rapid stabilization and low removal performance of MBGS for NH4+-N during nighttime further illustrate the crucial significance of Cyanobacteria activity on NH4+-N removal[40]. In summary, the MBGS system effectively tolerated and even showed enhanced performance at an E3 concentration of 0.1 mg/L. In contrast, concentrations of 1 and 10 mg/L significantly impaired pollutant removal by disrupting the cellular structures of Cyanobacteria.
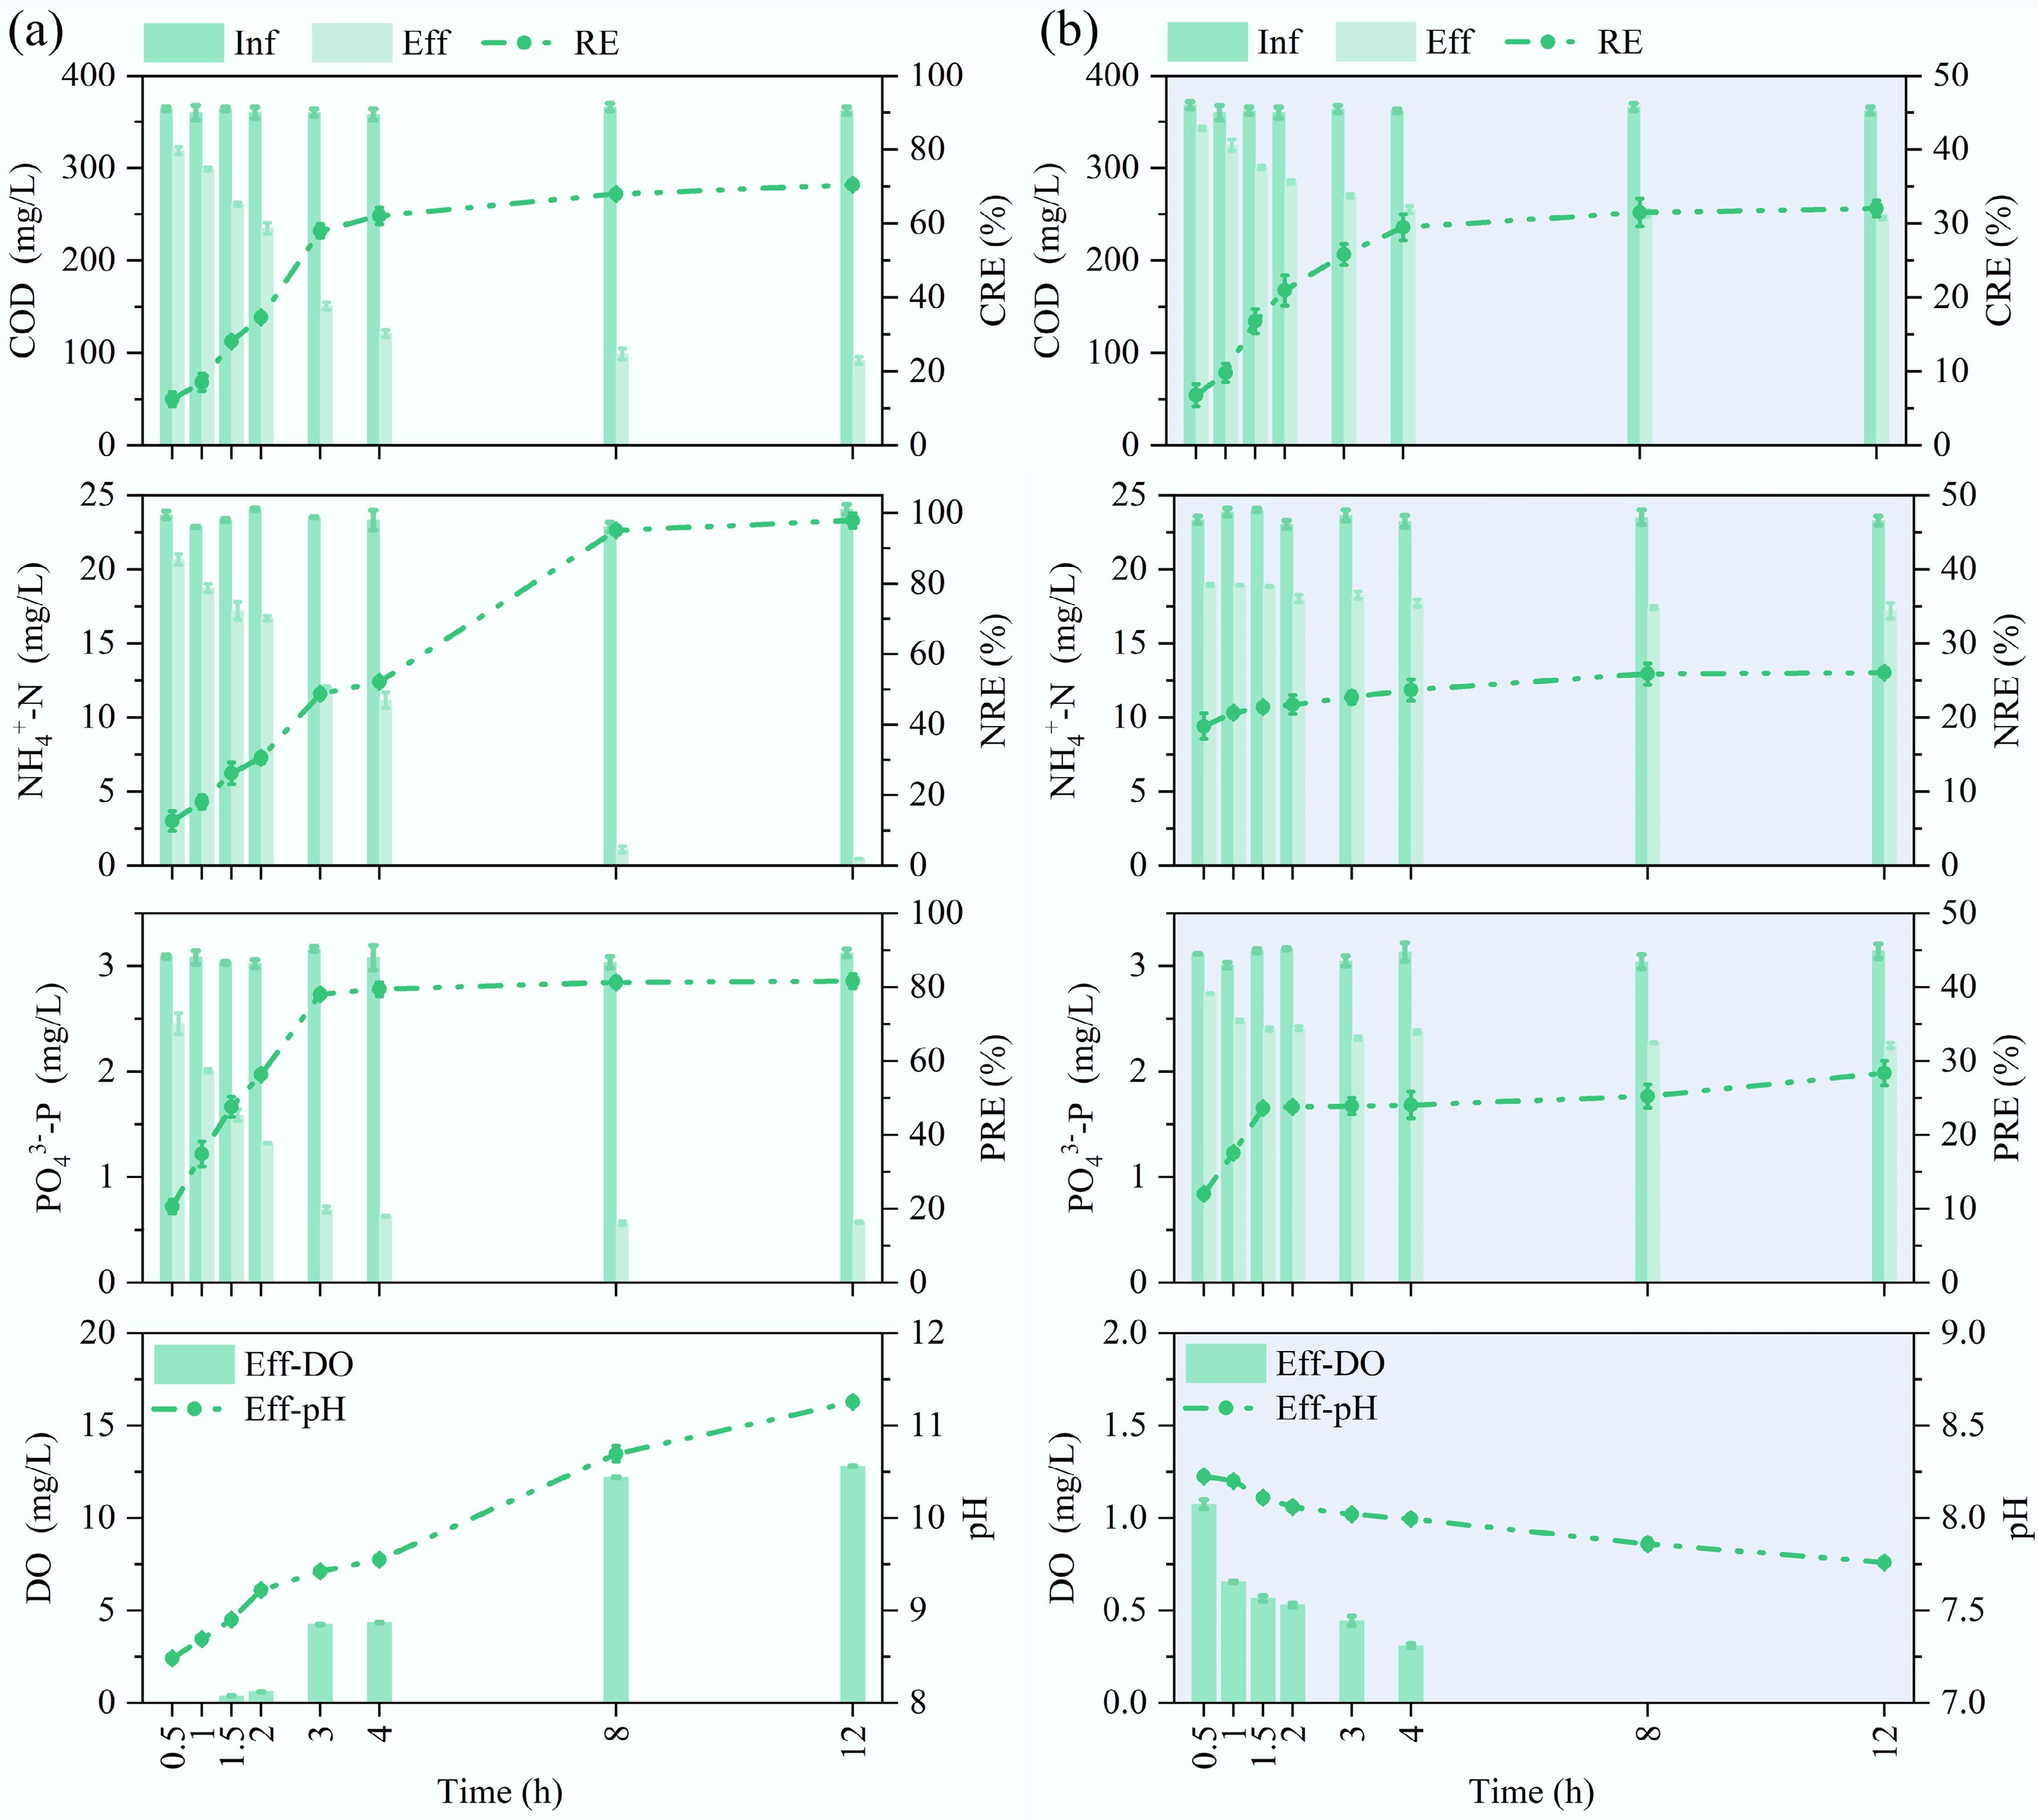
Figure 4.
Batch removal performance of pollutants by MBGS and effluent characteristics at 10 mg/L estriol (E3) addition. Removal efficiencies (RE) of COD, NH4+-N, and PO43−-P, along with effluent DO concentration and pH value, during (a) daytime, and (b) nighttime.
Removal efficiency and metabolic pathways of E3 by MBGS
-
Figure 5a, b demonstrates that the MBGS system achieved removal efficiencies of 97.9% during the daytime, and 85.7% during nighttime for 0.1 mg/L E3. In contrast, the removal efficiencies for 1 mg/L E3 were 44.5% and 19.6%, and for 10 mg/L E3, they were 12.6% and 10.6%, respectively. The MBGS system demonstrated significant adaptability when exposed to low concentrations of E3 (0.1 mg/L), showing a progressive enhancement in removal efficiency over time. However, when challenged with higher E3 concentrations (1 and 10 mg/L), the system demonstrated no significant capacity for adaptation, resulting in lower biodegradation performance. Based on kinetic analysis of the time-course removal data at 10 mg/L E3, the first-order degradation rate constant was significantly higher during the day (0.0121 h−1) than during the night (0.0053 h−1) (Fig. 5c, d; Supplementary Fig. S4). The nocturnal decrease in E3 removal efficiency was attributed to oxygen limitation, which suppressed the metabolic activity of heterotrophic degraders, thereby highlighting the crucial role of photosynthetic oxygen production in sustaining biodegradation of E3. Additionally, EPS adsorption accounted for 21.9% of the total E3 removal within 12 h in the live system. The adsorption process was characterized by a rapid initial phase, reaching equilibrium within approximately 1.5 h, followed by a stable phase with no significant further removal, confirming the absence of biodegradation in the inactivated systems (Supplementary Fig. S5). This clearly indicates that adsorption plays a significant, but not dominant, role in the initial phase of E3 removal, facilitating the subsequent biodegradation by immobilizing the substrate on the biomass.
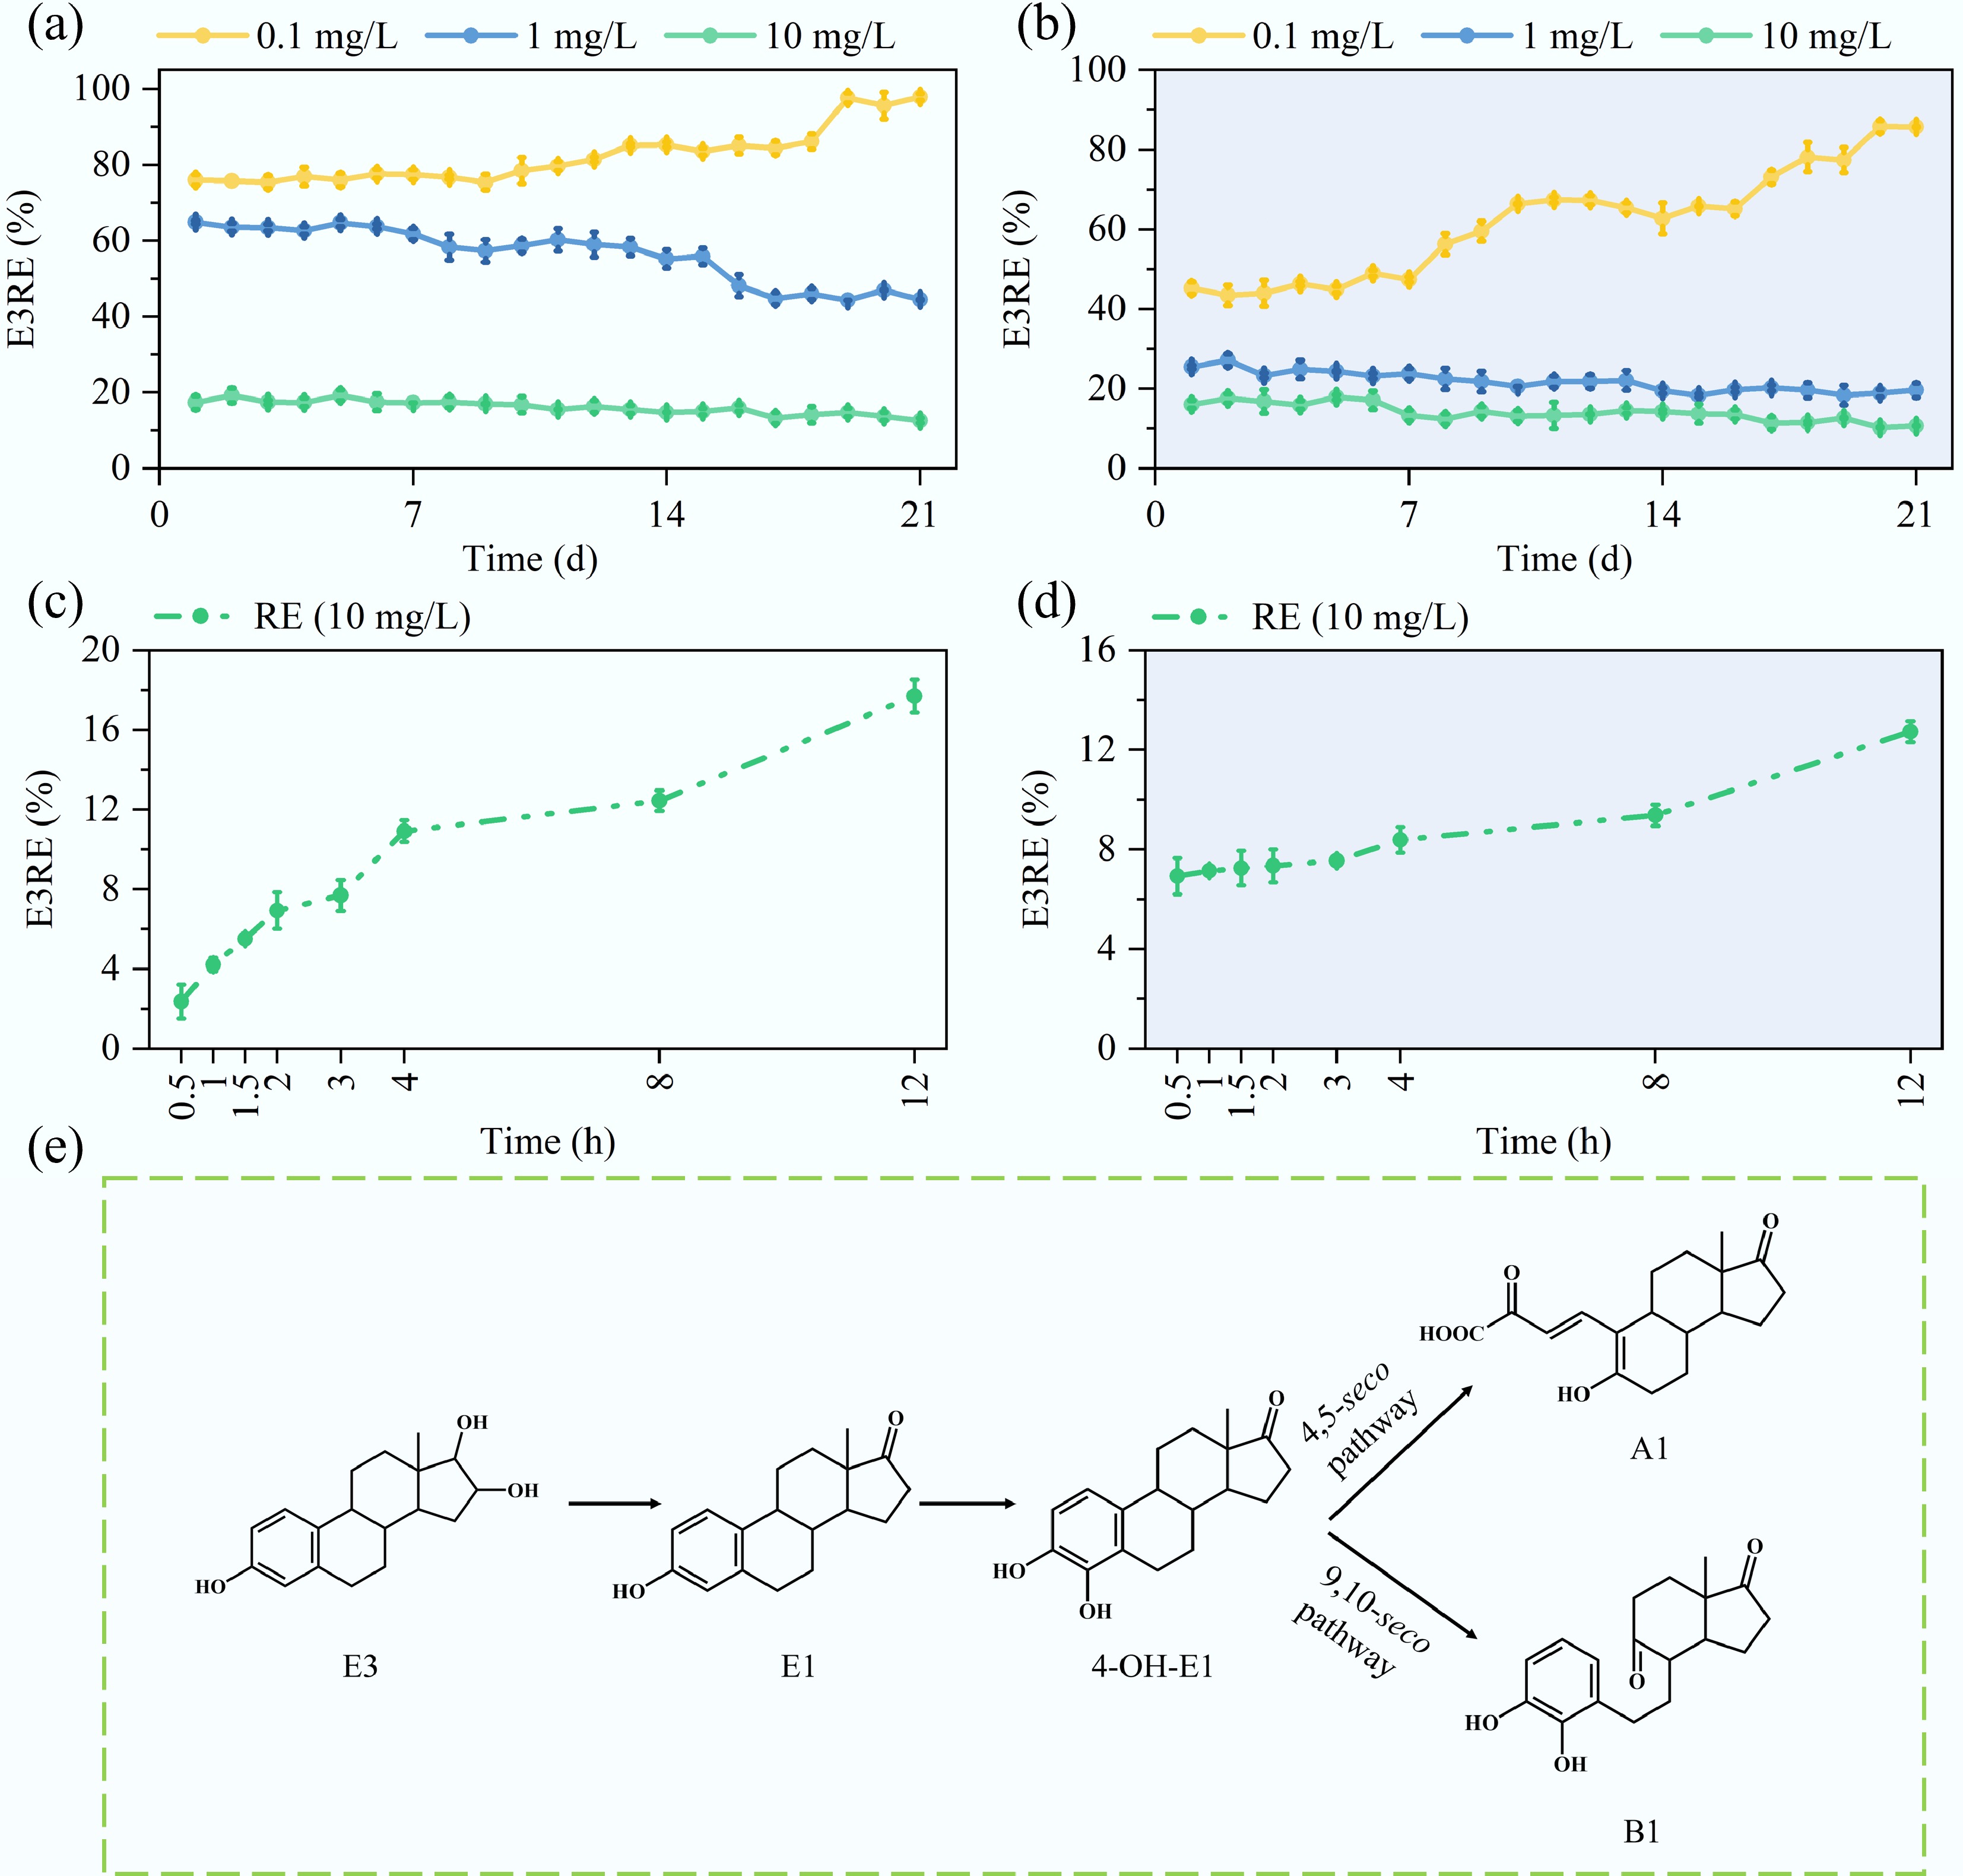
Figure 5.
Diurnal, batch, and metabolic profiling of estriol (E3) removal by MBGS. (a), (b) Daily removal efficiencies (RE) for 0.1, 1, and 10 mg/L E3, and (c), (d) batch removal efficiencies (RE) for 10 mg/L E3 during daytime and nighttime. (e) Proposed metabolic pathways.
Through UHPLC-HRMS analysis, four estrogenic compounds (E3, E1, A1, and B1) were identified in the effluent samples, as shown in Supplementary Fig. S6. Recent studies indicate that the biodegradation process begins with the oxidation of E3 to E1, followed by conversion to 4-hydroxyestrone (4-OH-E1)[18]. Although this transient intermediate was not detected in the aqueous matrix, several studies have clearly demonstrated that it serves as a crucial node in the Proteobacteria-mediated degradation pathway of E1[23,41,42]. The absence of 4-OH-E1 may be attributed to its rapid enzymatic conversion[43,44]. Subsequent metabolism diverges through stereospecific oxidation reactions, yielding metabolite A1 via the 4,5-seco pathway and metabolite B1 via the 9,10-seco pathway (Fig. 5e). Notably, the terminal metabolites A1 and B1 display a markedly lower ecotoxicological risk relative to E3, as evidenced by reduced bioconcentration factors and mutagenicity, suggesting an environmentally safer profile (Supplementary Table S4). Future investigations will employ isotope tracing, quantitative monitoring of intermediates, and advanced molecular techniques to elucidate the degradation pathways and the transformation kinetics of intermediates.
Microbial response mechanisms revealed by metagenomic analysis
Microbial community shift and Cyanobacteria decline under E3 stress
-
The microbial community was primarily composed of Cyanobacteria (33.5%), Betaproteobacteria (19.1%), Gammaproteobacteria (13.0%), and Alphaproteobacteria (11.8%). At the family level, Oculatellaceae (12.0%), Leptolyngbyaceae (9.5%), Sphaerotilaceae (7.2%), and Rhodanobacteraceae (6.7%) were dominant in the MBGS (Fig. 6a). The introduction of E3 significantly reduced the relative abundance of Cyanophyceae (including Oculatellaceae, Leptolyngbyaceae) and Comamonadaceae from the Betaproteobacteria (Fig. 6b, c). In contrast, it stimulated the growth of Rhodanobacteraceae and Xanthomonadaceae among the Gammaproteobacteria, and Sphingomonadaceae within the Alphaproteobacteria (Fig. 6b, c; Supplemetnary Fig. S3b). Although Sphingomonadaceae and Rhodanobacteraceae have been reported to degrade E3[18,45], their enrichment did not improve the overall E3 removal efficiency. This outcome likely reflects a functional trade-off resulting from the collapse of Cyanobacteria, which compromised both oxygen supply and structural support, counteracting potential degradation gains. The decline in Leptolyngbyaceae (key phosphorus-accumulating microalgae[39]) and Comamonadaceae (key phosphorus-accumulating bacteria[46]) probably contributed to the diminished PO43−-P removal. Notably, Sphaerotilaceae reached its peak abundance at an E3 concentration of 0.1 mg/L, coinciding with optimal COD removal. As this family enhances carbon fixation capacity in MBGS[47], its proliferation likely supported improved system function at this concentration.
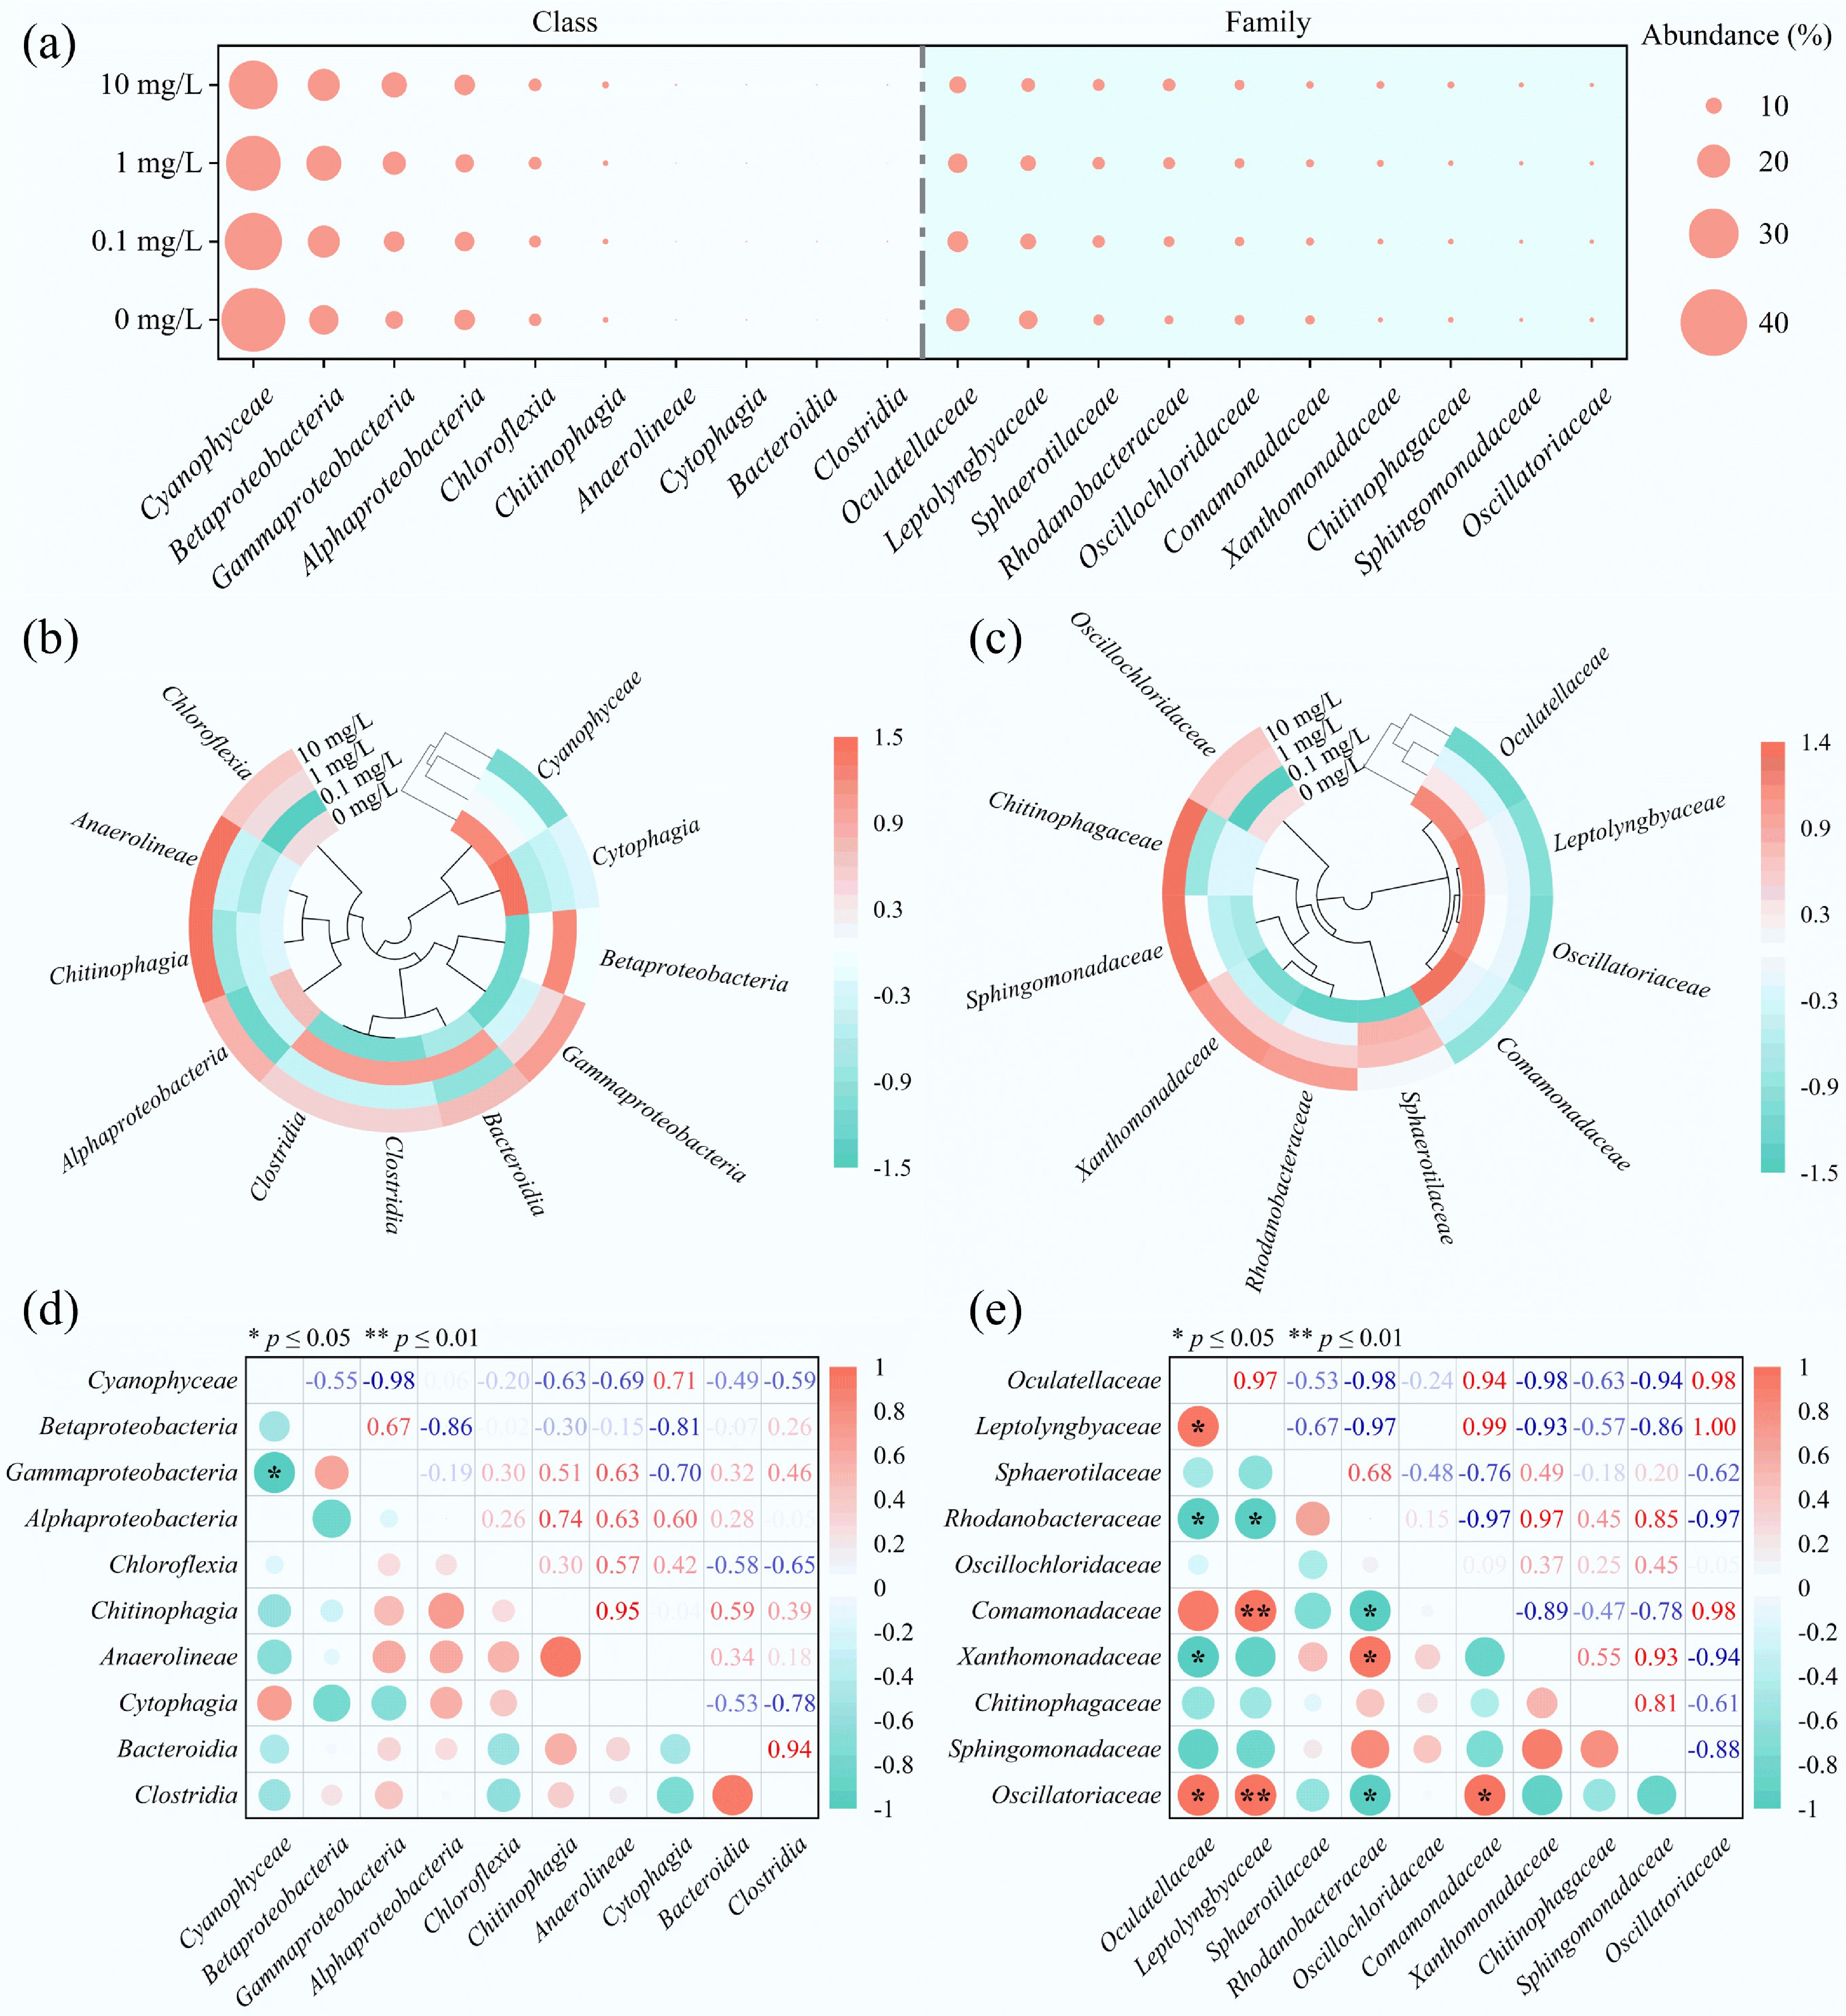
Figure 6.
Microbial community composition of the MBGS under varying estriol (E3) concentrations at class and family levels. (a) Relative abundance bubble plot, with circle size indicating abundance. (b), (c) Clustering heat maps, color intensity reflecting abundance changes. (d), (e) Correlation plots, with red and green denoting positive and negative correlations, respectively.
Correlation analysis indicated significant negative relationships between Cyanobacteria and Gammaproteobacteria, as well as between Oculatellaceae and Rhodanobacteraceae/Xanthomonadaceae (Fig. 6d, e). This contrasts with previous network analyses that identified a strong positive correlation between Cyanobacteria and Gammaproteobacteria[26]. In MBGS, Cyanobacteria are essential structural components that maintain granule stability[25]. Collectively, these findings suggest that functional impairment induced by E3 in MBGS primarily results from structural damage to Cyanobacteria, disrupting essential microbial interactions, particularly inverting the relationships between Oculatellaceae and Rhodanobacteraceae/Xanthomonadaceae. As a result, even though the abundance of these degraders increased, it did not lead to improved E3 degradation efficiency. Future research will employ techniques such as metatranscriptomics of key taxa, targeted inhibition of specific groups, or isolation of key organisms in defined co-cultures to establish direct causal mechanisms linking community structure to the seco-pathway dynamics.
Functional gene attenuation and metabolic shifts under E3 exposure
-
As illustrated in Fig. 7a–c, the MBGS system assimilated carbon, nitrogen, and phosphate through glycolysis/gluconeogenesis (ko00010) and the TCA cycle (ko00020), nitrogen metabolism (ko00910), and oxidative phosphorylation (ko00190), respectively. Key functional genes associated with variations in removal efficiency include the mqo linked to the TCA cycle, and fccA genes involved in electron transport chain, the GLU gene associated with nitrogen metabolism, and the ppk1 and atpA genes involved in oxidative phosphorylation (Fig. 7d). The observed decline in functional gene abundance was primarily induced by E3 stress, which targeted the core of microbial metabolic pathways. This perturbation severely disrupted energy generation, as evidenced by the reduced abundance of key genes involved in ATP production (e.g., atpA, mqo, and fccA), resulting in a critical shortage of ATP. The ensuing energy crisis directly starved the highly ATP-dependent processes responsible for COD removal and phosphorus uptake. Critically, polyphosphate kinase (ppk1)-mediated phosphorus assimilation was severely impeded due to the lack of ATP substrate[48], leading to a failure in biological phosphorus removal. Furthermore, the stress compromised biosynthetic capacity, exemplified by reduced GLU gene, which disrupted nitrogen assimilation and thereby de novo protein synthesis, aggravating the functional collapse of the treatment system.
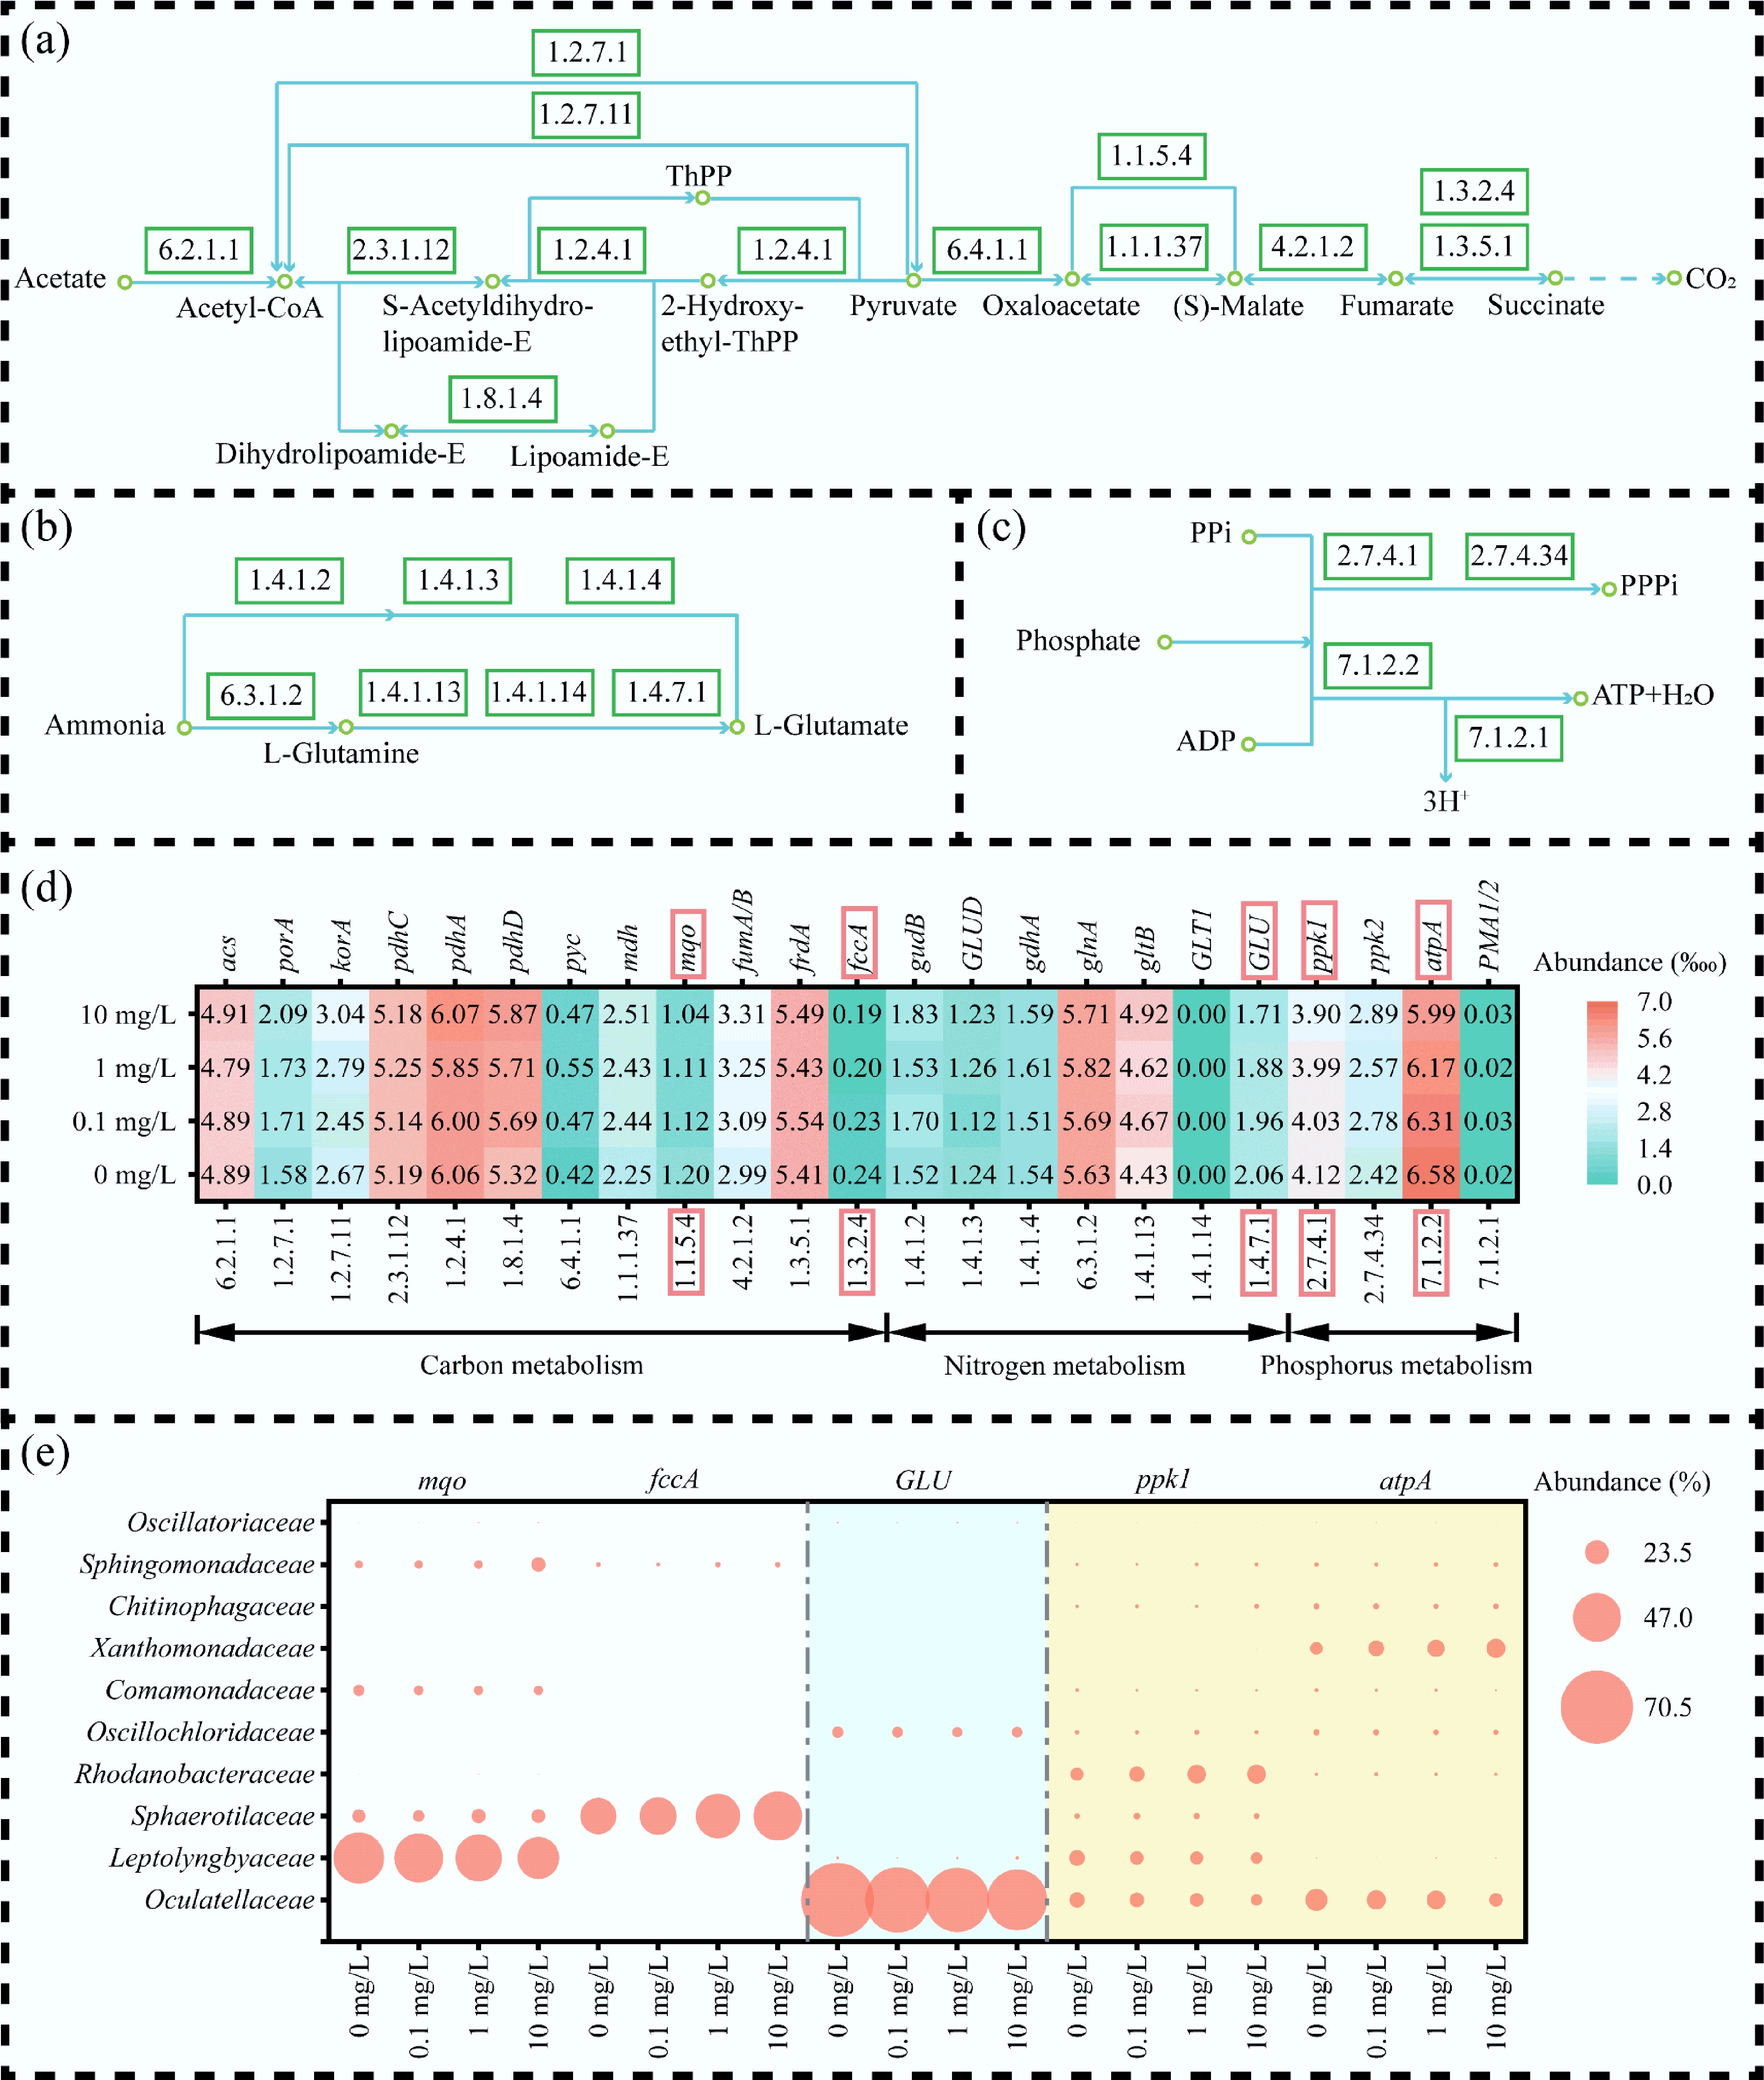
Figure 7.
Functional metabolic response of MBGS to varying estriol (E3) concentrations across carbon, nitrogen, and phosphate pathways. (a)–(c) Metabolic pathways of carbon, nitrogen, and phosphorus, respectively. (d) Relative abundance (‱) of key functional genes, with color intensity indicating abundance level. (e) Microbial contribution (%) to functional gene, with circle size indicating contribution.
Further analysis indicated that increasing E3 concentrations significantly reduced the contributions of the dominant families Oculatellaceae and Leptolyngbyaceae to the mqo, GLU, ppk1, and atpA genes (Fig. 7e). Oculatellaceae and Leptolyngbyaceae primarily regulated the mqo and GLU genes, influencing the ability of the MBGS system to remove carbon and nitrogen. The reduced involvement of Leptolyngbyaceae and Comamonadaceae in the ppk1 and atpA genes critically impacted phosphorus removal. The increased contribution of Sphaerotilaceae to the fccA gene likely explains the optimal COD removal efficiency observed at an E3 concentration of 0.1 mg/L. Furthermore, Xanthomonadaceae enhanced the energy metabolism of the MBGS system under E3 stress by increasing their contributions to the atpA gene.
The impact of E3 addition on the pollutant removal performance of the MBGS system was concentration-dependent. At high concentrations (1 and 10 mg/L), E3 significantly disrupted the filamentous structure and cellular integrity of Cyanobacteria, thereby impairing the structural stability and settling ability of the MBGS. This structural damage resulted in a marked decline in removal efficiencies for COD, NH4+-N, and PO43−-P, particularly during nighttime. Metagenomic analysis further revealed that E3 altered the microbial community composition by suppressing key functional taxa such as Oculatellaceae, Leptolyngbyaceae, and Comamonadaceae, while promoting the proliferation of Sphingomonadaceae, Rhodanobacteraceae, and Xanthomonadaceae. These shifts disrupted microbial interactions and reduced the abundance of critical functional genes (e.g., mqo, GLU, ppk1, atpA). In contrast, the low E3 concentration (0.1 mg/L) slightly enhanced system performance, likely due to the increased abundance of Sphaerotilaceae and its contribution to the fccA gene, which is involved in carbon metabolism.
Biodegradation mechanism of E3 by MBGS
-
The microbial transformation of E3 to E1 was primarily catalyzed by 17β-hydroxysteroid dehydrogenase (EC: 1.1.1.51, encoded by hshA)[49]. Subsequent aerobic catabolism of the steroidal A-ring involved a series of key reactions, including initial hydroxylation and ring-opening mediated by a two-component system comprising HSA monooxygenase (EC: 1.14.14.12, hsaA) and its reductase component (EC: 1.5.1.-, hsaB), which generated a catecholic intermediate (4-OH-E1). This intermediate was then cleaved by 4,5-DHSA dioxygenase (EC: 1.13.11.25, hsaC), which performed intra-diol fission of the aromatic ring, leading to the production of A1. Alternatively, the classical meta-cleavage pathway was facilitated by catechol 2,3-dioxygenase (EC 1.13.11.2, xylE), leading to the formation of B1 (Fig. 8a). Gene abundance analysis demonstrated a concentration-dependent increase in hshA, hsaA, and hsaB under E3 exposure, with hshA exhibiting the highest abundance (0.730‰ at 10 mg/L), suggesting its dominant role in the initial transformation step. In contrast, hsaC showed relatively low abundance (0.044‰ at 10 mg/L), implying a potential rate-limiting function. The sharp decline in hsaC and xylE abundance at 10 mg/L E3 may partially account for the suboptimal removal efficiency observed at this concentration (Fig. 8b).
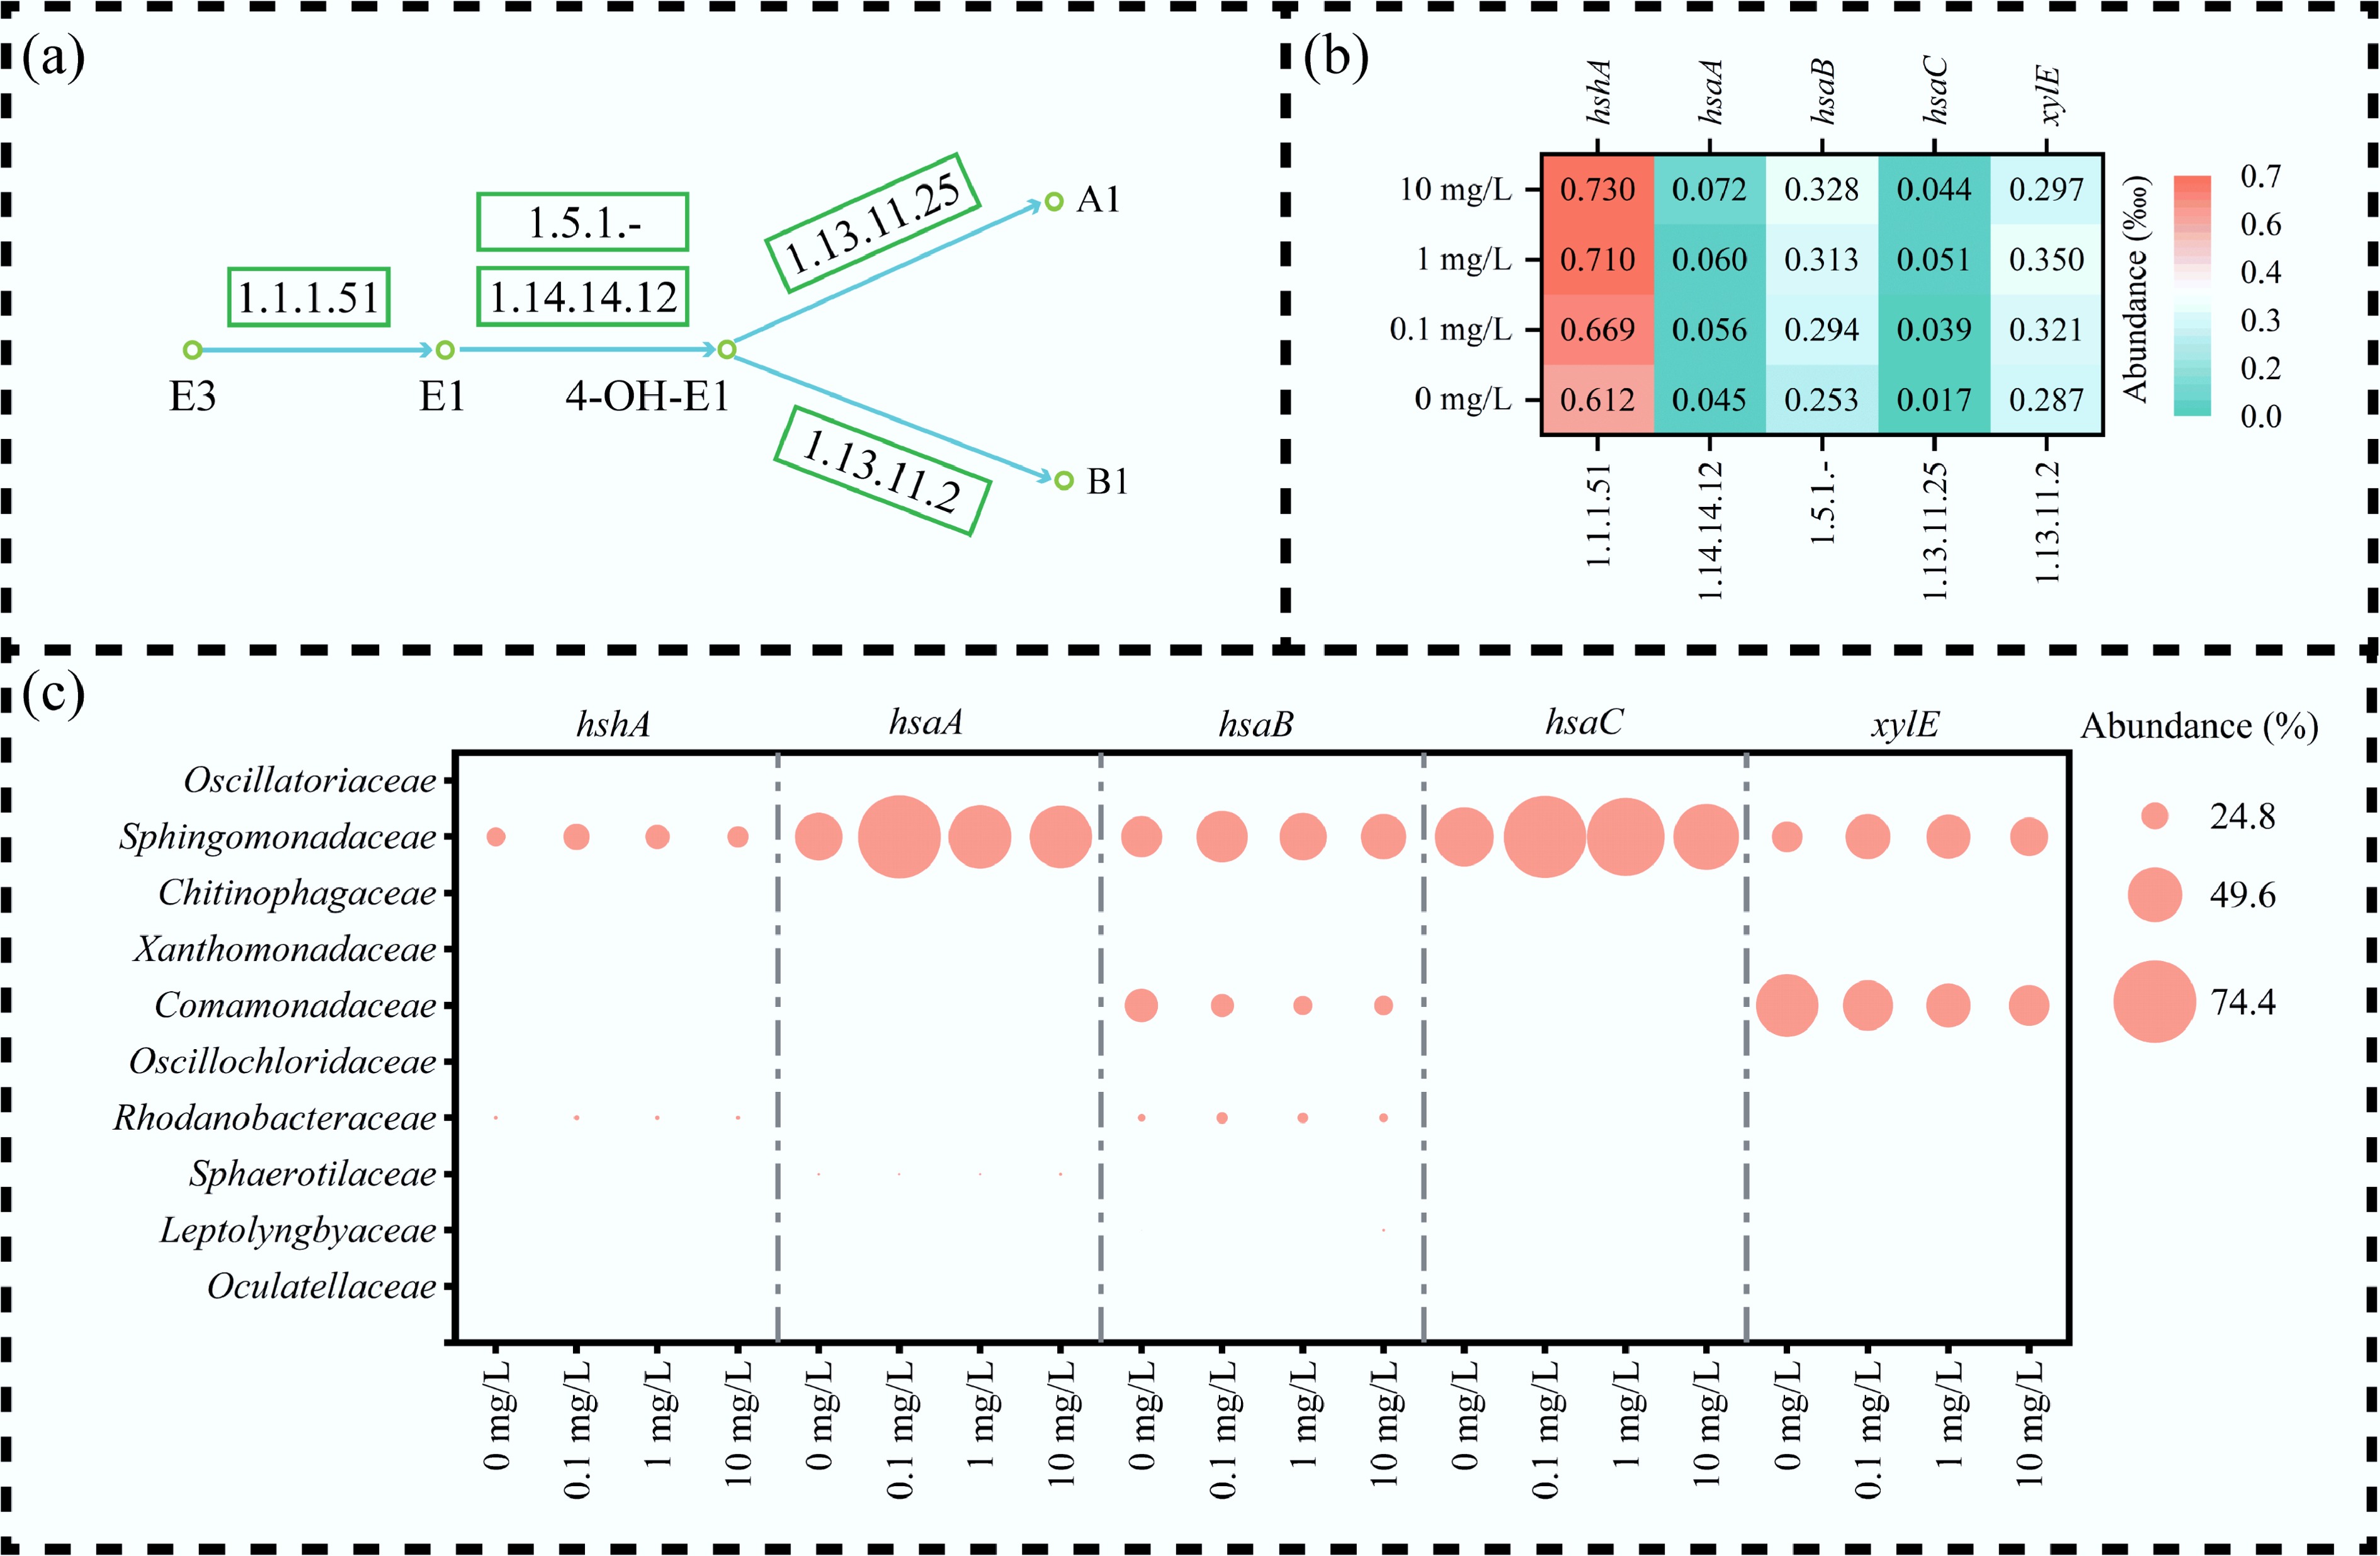
Figure 8.
Functional metabolism of estriol (E3) by MBGS. (a) Metabolic pathways and associated enzymes of E3. (b) Relative abundance (‱) of key functional genes, with color intensity indicating abundance level. (c) Microbial contribution (%) to functional gene, with circle size indicating contribution.
From the perspective of functional microbial contributions, Sphingomonadaceae dominated the abundance of hshA, hsaA, hsaB, and hsaC, accounting for more than 58% of hsaC at 10 mg/L, highlighting their pivotal role in aromatic ring degradation[50]. Meanwhile, Rhodanobacteraceae were mainly associated with hshA and hsaB, underscoring their importance in the initial transformation of the substrate. The superior removal efficiency observed at 0.1 mg/L aligns with the concurrent abundance peak of key functional genes contributed by these two families (Fig. 8c). Overall, the metabolic conversion of E3 into E1, 4-OH-E1, A1, and B1 was mediated by the coordinated activity of enzymes encoded by hshA, hsaA, hsaB, hsaC, and xylE, with keystone taxa including Sphingomonadaceae and Rhodanobacteraceae playing critical roles in maintaining pathway efficacy.
-
This study elucidates the effects of E3 on the structure, performance, microbial dynamics, and function of MBGS. At a low concentration of 0.1 mg/L, E3 promoted the growth of Sphaerotilaceae, which in turn improved COD removal. Conversely, exposure to higher E3 concentrations of 1 and 10 mg/L caused significant damage to Cyanobacteria, leading to impaired granular structure and decreased pollutant removal efficiency. The significant inhibition of keystone taxa (Oculatellaceae, Leptolyngbyaceae, and Comamonadaceae) and their associated functional genes (mqo, GLU, ppk1, and atpA) was indentified as the primary cause of the decline in removal performance. In response, the MBGS system enhanced the conversion of E3 to putative metabolites A1 and B1 by increasing the abundance of Sphingomonadaceae and Rhodanobacteraceae, which contributed significantly to key functional genes (hshA, hsaA, hsaB, hsaC, and xylE) essential for E3 removal. Concurrently, Xanthomonadaceae maintained partial energy metabolism functions by elevating their contribution to the atpA gene. Collectively, these findings highlight the importance of Cyanobacteria-driven structural integrity and functional microbial synergies in maintaining the resilience of the MBGS system against estrogenic stress. This work provides critical insights for developing robust MBGS-based technologies for treating wastewater contaminated with EDCs.
-
It accompanies this paper at: https://doi.org/10.48130/biocontam-0025-0004
-
During the preparation of this work, the authors used ChatGPT to improve readability. After using this tool, the authors reviewed and edited the content as needed and take full responsibility for the content of the publication.
-
The authors confirm their contributions to the paper as follows: material preparation, data collection and analysis: Shi Y, Chen C, Ding B, Shu Y, Feng J; writing the first draft of manuscript: Shi Y; commenting on draft manuscript: all authors. All authors reviewed the results and approved the final version of the manuscript.
-
The datasets used or analyzed in the current study are available from the corresponding author upon reasonable request.
-
The research leading to these results was funded by the National Natural Science Foundation of China under Grant Agreement Nos 52261135627 and 52270048.
-
The authors declare that there is no conflict of interest.
-
Full list of author information is available at the end of the article.
- Supplementary Text S1 Specific methods for detecting granule size, extracellular polymeric substances (EPS) content, 3D-EEM fluorescence spectrum of EPS, chlorophyll (Chl) content, and glycogen content of MBGS.
- Supplementary Text S2 Instruments for light intensity, DO concentration, pH, and water temperature.
- Supplementary Table S1 The composition of the synthetic wastewater.
- Supplementary Table S2 FT-IR spectral characteristics of the main functional groups in EPS under different concentrations of estriol (E3) addition (0, 0.1, 1, and 10 mg/L) at the end of the experiment.
- Supplementary Table S3 Relative abundance (‱) of SOD and CAT under different concentrations of estriol (E3) addition (0, 0.1, 1, and 10 mg/L) at the end of the experiment.
- Supplementary Table S4 TEST toxicity prediction table for estriol (E3) and its terminal metabolites.
- Supplementary Fig. S1 Settling characteristics and extracellular polymeric substances fluorescence profiling of MBGS under different estriol (E3) concentrations (0, 0.1, 1, and 10 mg/L). (a) ZSV; (b) MLVSS; (c1−c4) 3D-EEM fluorescence spectra of EPS.
- Supplementary Fig. S2 Pollutant concentrations and removal efficiencies by MBGS under different estriol (E3) concentrations (0, 0.1, 1, and 10 mg/L) across diurnal cycles. Concentrations and removal efficiencies of COD, NH4+-N, and PO43−-P during (a) daytime and (b) nighttime.
- Supplementary Fig. S3 Linear correlation analysis plots. (a) Correlations between daytime/nighttime NH4+-N removal and PO43--P removal with Cyanobacteria abundance; (b) Correlations between Rhodanobacteraceae, Xanthomonadaceae, and Sphingomonadaceae with E3 concentrations.
- Supplementary Fig. S4 First-order kinetics of E3 removal over a 12 h period. (a) Daytime and (b) nighttime fitting curves.
- Supplementary Fig. S5 Batch removal efficiencies (RE) of extracellular polymeric substances (EPS) adsorption for 10 mg/L E3.
- Supplementary Fig. S6 Mass spectrometric analysis of potential estriol (E3) metabolites. UHPLC-HRMS spectra of primary and secondary peaks for (a) E1, (b) E3, (c) A1, and (d) B1 in positive or negative ionization mode.
- Copyright: © 2025 by the author(s). Published by Maximum Academic Press, Fayetteville, GA. This article is an open access article distributed under Creative Commons Attribution License (CC BY 4.0), visit https://creativecommons.org/licenses/by/4.0/.
-
About this article
Cite this article
Shi Y, Chen C, Ding B, Shu Y, Feng J, et al. 2025. Metabolic responses and biodegradation pathways of microalgal-bacterial granular sludge to estriol: structural remodeling, microbial shifts, and gene dynamics. Biocontaminant 1: e004 doi: 10.48130/biocontam-0025-0004 

Metabolic responses and biodegradation pathways of microalgal-bacterial granular sludge to estriol: structural remodeling, microbial shifts, and gene dynamics
- Received: 04 September 2025
- Revised: 24 September 2025
- Accepted: 13 October 2025
- Published online: 03 November 2025
Abstract: The persistence of endocrine-disrupting compounds such as estriol (E3) in wastewater presents a critical challenge for conventional treatment systems. This study investigates the metabolic responses and biodegradation pathways of microalgal-bacterial granular sludge (MBGS) under varying E3 concentrations (0, 0.1, 1, and 10 mg/L). The results indicate a concentration-dependent effect of E3 on MBGS performance. At 0.1 mg/L E3, COD removal was enhanced, correlating with an increased abundance of Sphaerotilaceae and their elevated contribution to the fccA gene. In contrast, higher concentrations (1 and 10 mg/L) severely disrupted the filamentous structure of Cyanobacteria, resulting in diminished removal efficiencies for COD, NH4+-N, and PO43−-P. Metabolically, E3 was first oxidized to E1 and then converted into less toxic intermediate metabolites, achieving 97.9% and 85.7% removal at 0.1 mg/L during the day and night, respectively. Metagenomic analysis revealed that E3 altered the microbial community by suppressing the Oculatellaceae, Leptolyngbyaceae, and Comamonadaceae, while enriching the Sphingomonadaceae, Rhodanobacteraceae, and Xanthomonadaceae. These shifts led to disrupted microbial interactions and reduced abundance of key functional genes, including mqo, GLU, ppk1, and atpA. Importantly, E3 biodegradation was primarily facilitated by Sphingomonadaceae and Rhodanobacteraceae through their heightened contributions of core catabolic genes (hshA, hsaA, hsaB, hsaC, and xylE). In the meantime, Xanthomonadaceae contributed to energy maintenance via the atpA gene. These findings demonstrate the adaptive capacity of MBGS to estrogenic stress, offering insights into its potential application for sustainable wastewater treatment.