


-
The tea plant (Camellia sinensis (L.) O. Kuntze) is cultivated worldwide as an economical woody plant. Tea leaves contain a variety of biologically active compounds, including flavonoids, amino acids, caffeine, etc[1]. These compounds are essential in defining the distinctive quality of tea, including its color, aroma, and flavor. Metabolites related to the quality of tea leaves are affected by various factors, including tea varieties, environmental conditions (climate, soil), agronomic practices (intercropping, crop rotation, no-tillage, fertilization), and tea manufacturing processes[2]. The main planting pattern of tea plantations in China is monocropping, but long-term monocropping causes irreversible damage to the ecology of tea plantations as well as tea plants[3]. Intercropping tea plants with leguminous crops can promote plant growth and improve soil quality, which is a popular planting mode in modern agricultural systems. Therefore, different intercropping sets of cultivation patterns have started to be applied in the construction of eco-tea gardens.
A previous study has shown that legumes can establish a mutually beneficial relationship with rhizobia[4]. This relationship improves the uptake of atmospheric nitrogen, which is an important component of tea plant growth and health and can affect the synthesis of amino acids related to tea quality[5,6]. In particular, soybeans and peas, which are part of the legume family, have received much attention. However, in Shandong province, soybeans were typically sown from April to May and harvested from September to October, effectively enhancing the quality and aroma of tea in autumn, but having less impact on tea in spring. Another legume plant of pea was reported to enhance tea quality when intercropped with tea plants. However, peas were usually planted in March or April and harvested in May or June, so they had a positive effect on spring tea but less on autumn tea[7]. Moreover, the cultivation and management of these two crops in rotation required a significant amount of manpower, material resources, and financial investment. Therefore, there was a need for other more cold-tolerant and easier-to-manage legume plants. Trifolium (Trifolium repens L.), a perennial herbaceous plant belonging to the Leguminosae family, has developed internodes and creeping stems. It can fix a large amount of nitrogen from the air and is a common green manure intercropped material[8,9]. Related studies have also shown that intercropping trifolium could improve soil physicochemical properties, inhibit weed growth, and increase ecological stability[10]. Planting trifolium as green manure can improve the quality of tea leaves, bring both economic and ecological benefits, and can be regarded as an important measure in the construction of ecological tea gardens[11]. However, the principle of how the intercropping of trifolium and tea plants regulates tea metabolism remains unclear.
This study compares the transcriptome and metabolome of tea shoots from monoculture tea plants and those intercropped with trifolium to evaluate the impact of trifolium intercropping on tea metabolism. This study will provide guidance for choosing tea plant intercropping plants and provide a scientific basis to understand the relationship mechanism between tea plants and intercropping plants.
-
The present study was carried out in Jiusheng Yudao Tea Garden, Changqing District, Jinan City, Shandong Province, China (36°16' N, 116°59' E, 200 m above sea level). The tea plant was three-year-old 'Baiye 1'. The trifolium seeds were sown between the rows in October 2021, with a sowing density of 75 kg/ha. On May 6, 2022, one bud and two leaves of new shoots of tea plants were picked, and RNA extraction was carried out at −80 °C. Monocropped tea plants were used as the control. Each sample was replicated three times with at least 10 buds for each repeat.
RNA extraction and cDNA library construction
-
The Plant RNA Extraction Kit, sourced from Beijing Biotechnology Co. (China), was employed to isolate the RNA. To assess both the quality and concentration of the extracted RNA, agarose gel electrophoresis and the NanoDrop 2000 spectrophotometer from Thermo Fisher Scientific in Wilmington, DE (USA), were used. A total of 1 μg RNA was used for cDNA library construction using the Illumina Hieff NGS Ultima Dual Mode mRNA Library Preparation Kit (Yersen Biotechnology, Shanghai, China). The mRNA was randomly interrupted by the addition of fragmentation buffer and then was utilized to synthesize the first strand of cDNA, then the second strand of cDNA was synthesized and the cDNA was purified. Afterward, the cleaned double-stranded cDNA was subjected to terminal repair, the addition of A-tail, and ligation of sequencing junctions, and then fragment size selection was performed with AMPure XP beads. Finally, the cDNA library was enhanced by PCR. Once the quality of the library was confirmed, it was sequenced on the Illumina NovaSeq6000 platform, generating 150 bp paired-end reads.
Quality assessment of sequences
-
To obtain high-quality clean data, the reads containing adapters reads with a rate of N (representing uncertain base information) higher than 10% and reads with a value of Q (representing the value of base quality) ≤ 10 as a percentage of the entire reads 50% or more of the reads[12]. Q30 was used for base sequencing quality assessment.
Differential expression gene identification and functional annotation
-
To obtain information on the localization of reads on the reference genome (NCBI accession no. PRJNA597714), the HISAT2 software was utilized for a swift and precise alignment of pure reads with the reference genome[13]. Gene expression levels can be assessed by the number of transcripts per kilobase fragment for every million mapped reads (FPKM). To screen for genes with significant differential expression (DEGs), fold change ≥ 2 and FDR < 0.01 were used as screening criteria[14]. Annotation of the DEGs was carried out with NR[15], Swiss-Prot[16], COG[17], KOG[18], and KEGG[19] databases using DIAMOND software. Pearson's correlation coefficient (R2) was used for biological replicate relevance assessment, the stronger the correlation between the two replicates, the closer the R2 is to 1.
Real-time quantitative PCR validation
-
For checking the dependability of DEG expression, nine DEGs were randomly selected for real-time quantitative PCR (qRT-PCR) verification. Primers were designed through Primer3 (v.0.4.0) (
https://bioinfo.ut.ee/primer3-0.4.0/ ) (Supplementary Table S1). The reaction volume was 20 μL, including 10 μL of SYBR Green qPCR mix, 1 μL of primer (10 μM), and 2 μL of cDNA. qRT-PCR was performed using a BioRad CFX96 real-time system. The reference gene was CsGAPDH. Reaction conditions were as follows: primary denaturation at 95 °C for 30 s, followed by 40 cycles of 10 s at 95 °C and 30 s at 60 °C, with a final melting curve inserted. The relative expression of the selected genes was counted using the 2−ΔΔCᴛ method.Extraction of metabolites
-
Initially, the sample was weighed and vacuum freeze-dried to 50 mg, then 1 mL of the extraction solution (acetonitrile : water, 1:1, v/v) was stirred for 30 s, then adding steel balls and mixing for 10 min at 45 Hz followed by ultrasonication for 10 min (ice water bath), Subsequently, the mixture was centrifuged at 12,000 rpm for 15 min at 4 °C. Lastly, 120 μL of the supernatant was taken into a 2 mL sample tube then 10 μL of each sample was mixed to produce a QC sample for controlling the stability of the experiment.
Identification of metabolites
-
Two microliters of the liquid sample were introduced into an Acquity I-Class PLUS Ultra-Performance Liquid Chromatography (UPLC) system, coupled with an AB Sciex Qtrap 6500+ High Sensitivity Mass Spectrometer. The chromatographic separation was conducted using a Waters Acquity UPLC HSS T3 column (1.8 μm particle size, 2.1 mm × 100 mm dimensions). The mobile phases employed were: mobile phase A, comprising 0.1% formic acid and 5 mM ammonium acetate in water; and mobile phase B, consisting of acetonitrile with 0.1% formic acid. Starting conditions of 98% A held for 1.5 min. Within 5.0 min, a linear gradient was set to 50% A, then decreased to 2% A in 9 min and held for 1 min, finally increased to 98% A within 1 min and held for 3 min. The speed of the mobile phase flow was 0.35 mL/min, and the temperature of the column was 50 °C.
ESI Operating Temperature was at 550 °C, and positive- and negative ion IS voltage was +5,500 V and −4,500 V, respectively. Pressure settings were GSI 50 psi, GSII 55 psi, and CUR 35 psi, respectively. For instrument tuning and mass calibration, solutions of 10 μmol/L and 100 μmol/L polypropylene glycol were utilized in QQQ and LIT modes, respectively. During QQQ scans conducted in MRM mode, the crash gas (nitrogen) was adjusted to a moderate level. Each stage of the process monitored a distinct set of MRM ion pairs, tailored to the metabolites eluted during that particular stage.
Qualitative and quantitative analysis of metabolites
-
Quantification of metabolites was performed by triple quadrupole mass spectrometer in multiple reaction monitoring (MRM) mode. The screening criteria of different metabolites were set as fold change ≥ 2, VIP ≥ 1, and p value < 0.05. The Spearman Rank Correlation coefficient (r) was used as an evaluation index for the correlation of biological replicates. As the correlation between two replicates gets closer, r gets closer to one. To functionally annotate the metabolites, the KEGG database was used.
Statistical analysis
-
Microsoft Excel 2016 and SPSS 23.0 software were used for statistical analysis. Comparisons between groups were made by t-test, p < 0.05 was considered to be different significantly.
-
A total of 41.07 Gb clean data was produced by RNA-Seq sequencing. More than 88.17% clean reads mapped successfully to the reference genome, indicating a high degree of matching between the sequencing data and the reference genome, providing a solid foundation for subsequent analysis. The GC content ranged from 44.50% to 44.65%, which was relatively consistent and may reflect the typical characteristics of GC content in the tea genome. The high percentage of Q30 (all above 92.68%) indicated good quality and high reliability of the sequencing data (Table 1). These results had important reference values for subsequent gene expression analysis, variation detection, and genetic analysis.
Table 1. Sequencing quantity statistics.
Samples Clean reads Clean bases Mapped reads GC content % ≥ Q30 Tea1 23,570,422 7,054,602,050 41,774,983 (88.62%) 44.52% 93.33% Tea2 20,615,161 6,169,899,398 36,528,370 (88.60%) 44.65% 93.25% Tea3 24,660,697 7,380,548,288 43,486,810 (88.17%) 44.60% 92.68% Tri-Tea1 21,547,499 6,447,675,024 38,340,714 (88.97%) 44.60% 92.91% Tri-Tea2 22,998,322 6,882,715,378 40,668,190 (88.42%) 44.50% 93.26% Tri-Tea3 23,851,520 7,138,434,388 42,510,817 (89.12%) 44.63% 93.46% Identification of differentially expressed gene identification
-
Correlation analysis showed a strong correlation (R2 > 0.99) between biological replicates in monocropped and intercropped samples. A total of 4,580 DEGs were discovered in intercropped tea plants, including 2044 up-regulated genes and 2,536 down-regulated genes. 3,978 genes were annotated in the NR database. In addition, 3,131, 2,860, 3,171, 2,642, 2,586, 2,055, and 1,177 DEGs were identified in eggNOG, Pfam, GO, Swiss-Prot, KEGG, KOG, and COG databases, respectively. The COG functional classification analysis showed that the DEGs with the most abundant functions were related to carbohydrate transport and metabolism, translation, ribosomal structure, and biosynthesis, posttranslational modification, protein folding, and chaperone (Fig. 1a). KEGG pathway enrichment analysis showed the highest levels of metabolic enrichment were peroxisomes, valine, leucine, and isoleucine degradation (Fig. 1b).
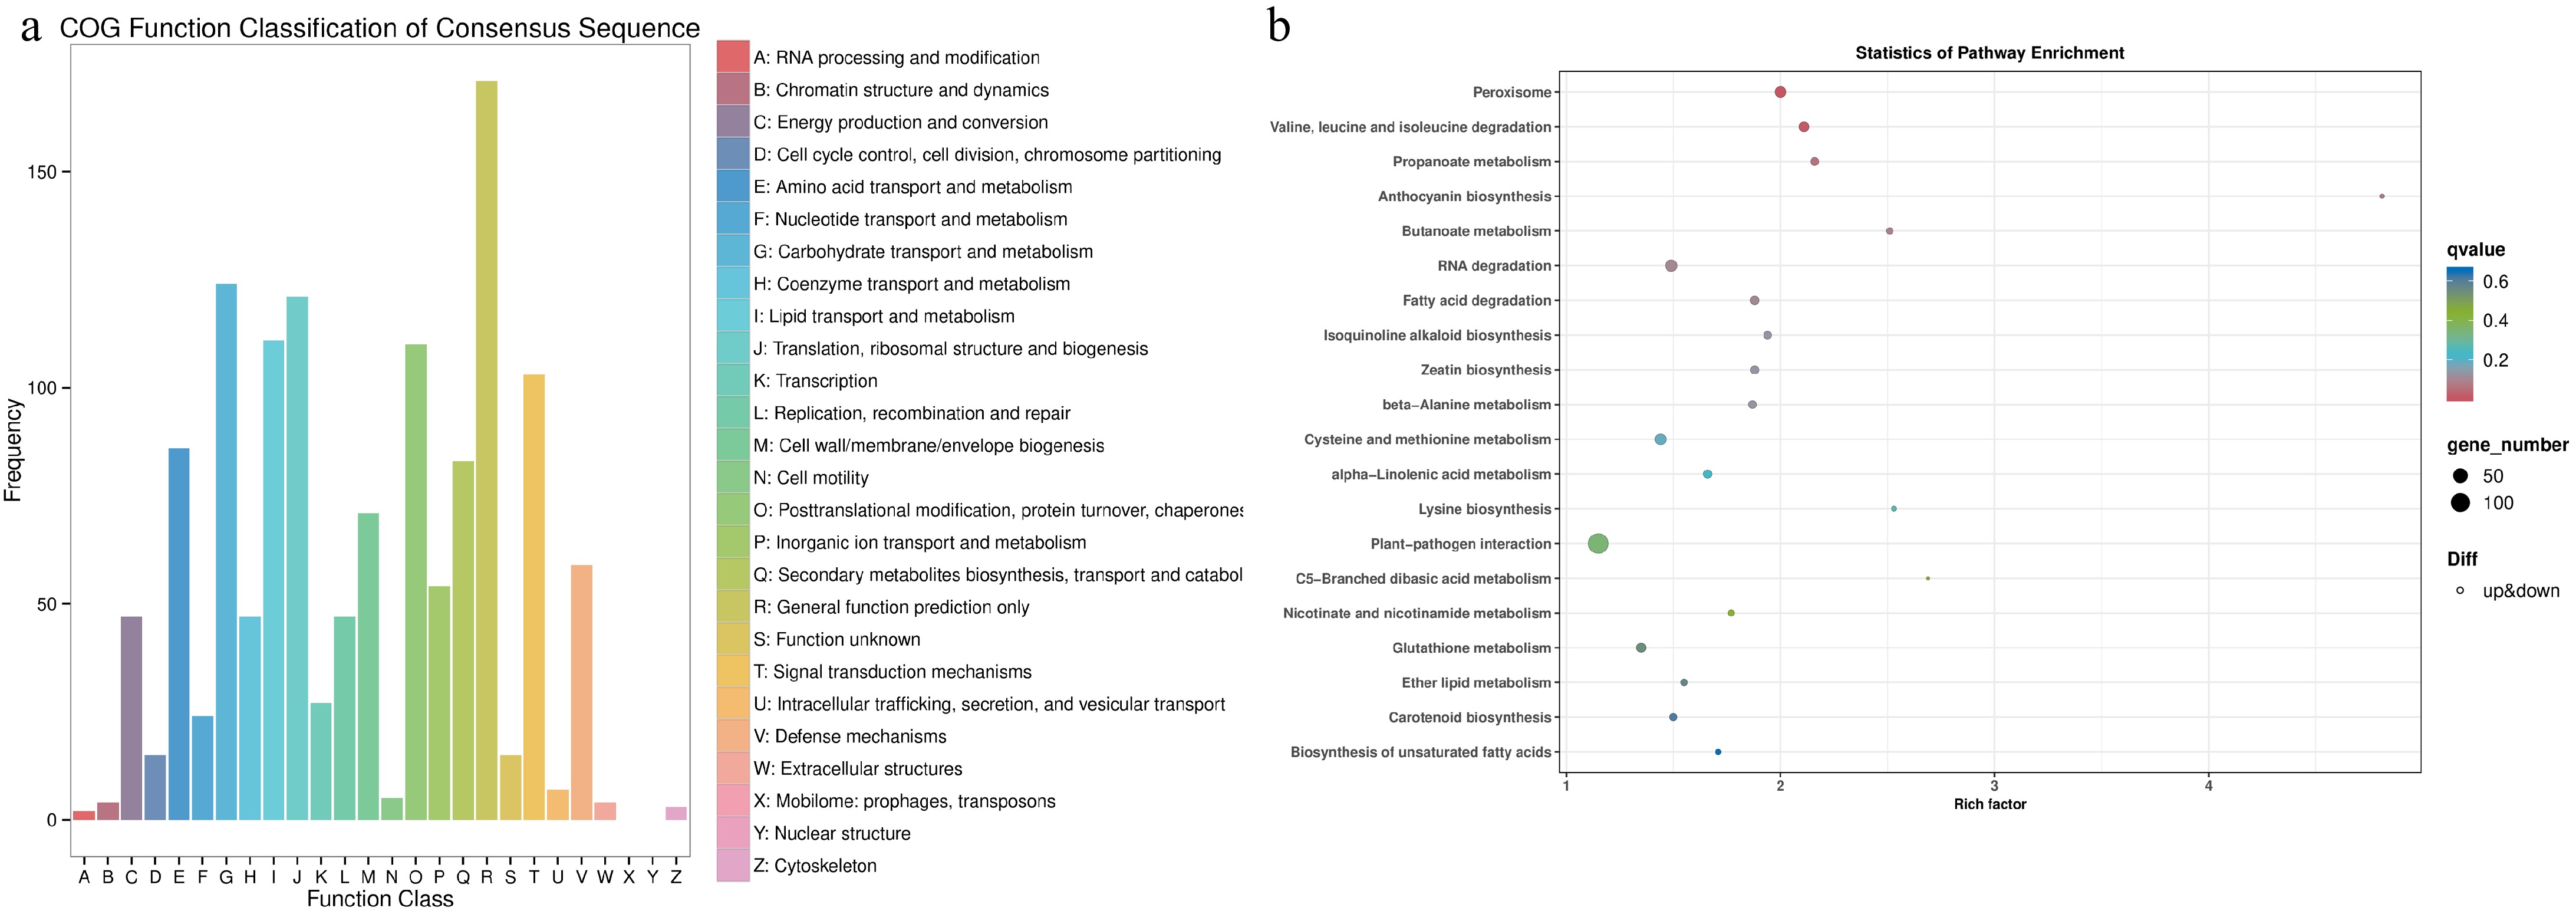
Figure 1.
Functional annotation of differentially expressed genes (DEGs) in tea plants grown in monoculture and intercropped with peas. (a) COG functional classification of DEGs. (b) Enrichment analysis of KEGG pathways for DEGs. A lower q-value signifies a higher degree of enrichment.
It was chosen that a total of nine DEGs were chosen for qRT-PCR validation (Fig. 2). As the results show, the relative expression levels of all selected DEGs were comparable to the fold change trend of FPKM in RNA-Seq analysis. The identification of DEGs based on RNA-Seq analysis was proved to be reliable for further analysis.
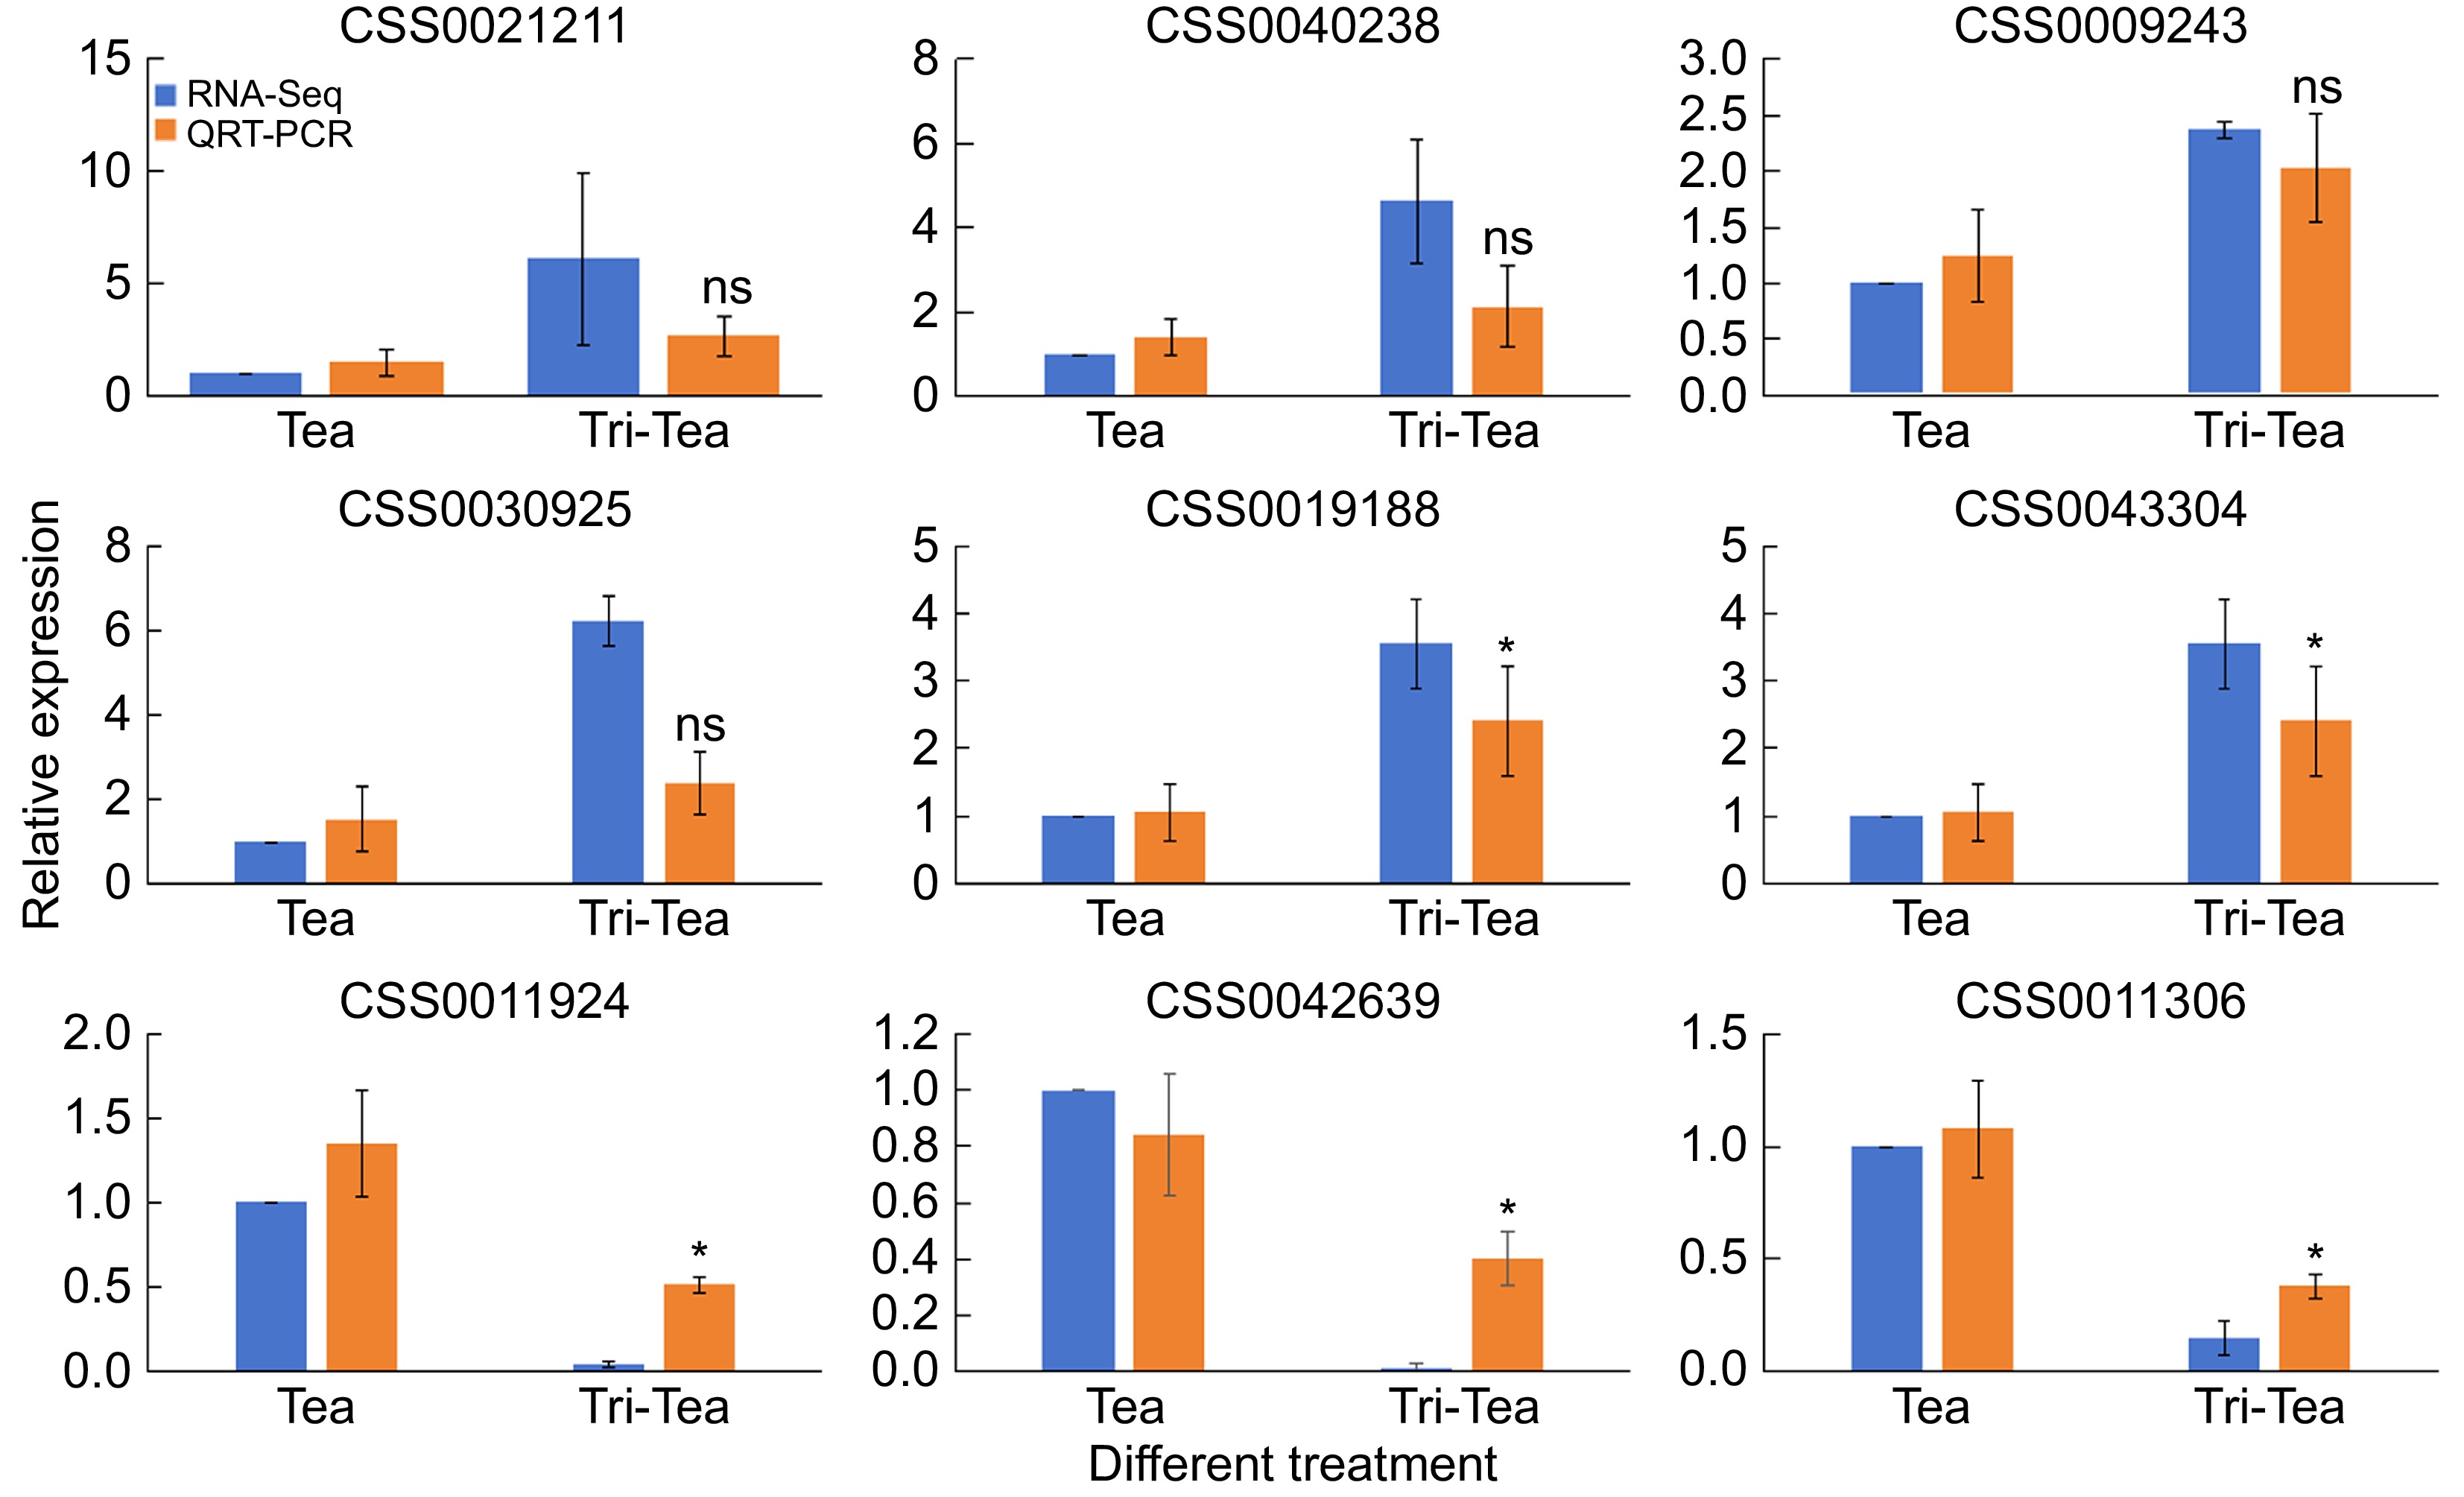
Figure 2.
Validation of differentially expressed genes through quantitative real-time PCR (qRT-PCR). RNA-Seq indicates changes in gene expression through fold changes in FPKM, while qRT-PCR validates these changes by calculating the relative expression levels of specific gene cDNAs using the 2−ΔΔCᴛ method. * Indicates significant difference, ns indicates non-significant difference.
Differential metabolite identification
-
A total of 871 metabolites were identified. Flavonoids were the most abundant differential metabolites including 203 compounds, followed by terpenoids (91), amino acids (90), alkaloids (85), organic acids (82), sugars and alcohols (80), lipids (37), nucleotides (30), and other metabolites (173) (Fig. 3a). Compared to monocropped tea plants, 171 differential metabolites, including 78 up-regulated metabolites, and 93 down-regulated metabolites, were identified in tea plants intercropped with trifolium. Of these differential metabolites, amino acid metabolism enriched 33 metabolites, followed by flavonoid metabolism (32), organic acid metabolism (18), and terpene metabolism (15). KEGG annotation revealed that amino acid metabolism enriched the most metabolites with 34 compounds, followed by ABC transporters with nine compounds, and flavonoid biosynthesis with six compounds (Fig. 3b). Among these metabolized species, most of the amino acids and ABC transporters were higher in tea plant intercropped with trifolium than in monocultured tea plant. Amino acids contribute to the flavor and functionality of tea and enhance the umami taste of tea[20]. ABC transporters have been reported to inhibit the production of flavonoids[21]. Flavonoids are secondary metabolites in tea leaves with a bitter flavor. Therefore, the intercropping of trifolium with tea plants improved tea quality by enhancing the synthesis of amino acids and inhibiting flavonoid biosynthesis.
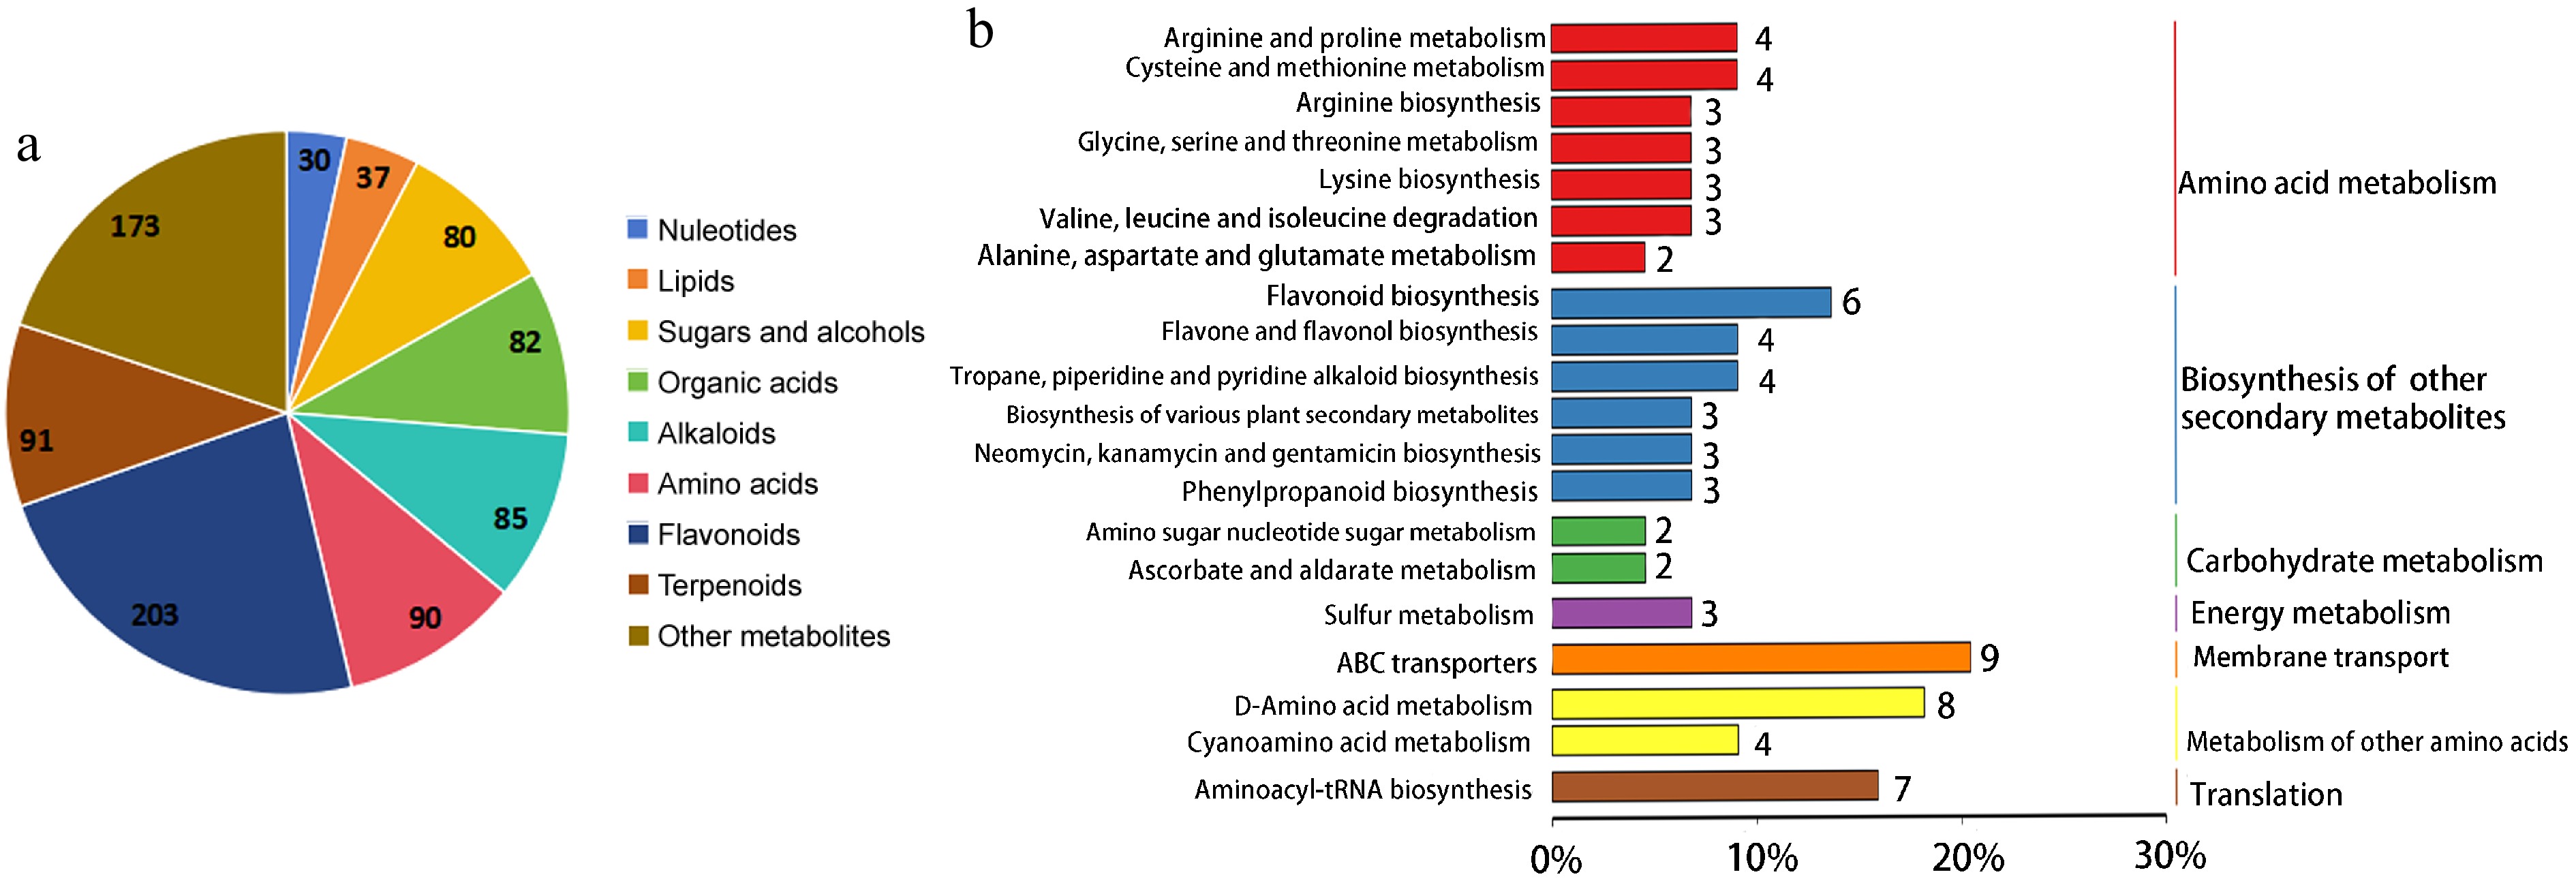
Figure 3.
Metabolites functional annotation and classification analysis. (a) All the identified metabolites classification of tea plants. (b) KEGG pathway annotation of differential metabolites between mono- and trifolium-intercropped tea plants.
Amino acid metabolism in intercropped tea plants with trifolium
-
A total of 33 differential amino acids were identified in trifolium intercropped tea plants, of which all the differential amino acids were upregulated except three downregulated amino acids (Supplementary Table S2). Of the upregulated amino acids, L-Histidine (Log2FC 2.58) was the most significantly up-regulated (Supplementary Table S3), which was a bitter amino acid that enhances the taste of tea and also had anti-fatigue properties. For amino acid metabolism-related genes, CsSHTM (Serine hydroxymethyltransferase, CSS0015428, 1.76), CsHDC (Histidine dehydrogenase, CSS0043348, 1.42), and CsLCD (L-cysteine desulfurase, CSS0029518, 1.29) were upregulated in intercropped tea plants, while CsGGTA (Glutamate-glyoxylate aminotransferase, CSS0043419 −1.42, CSS0014253 −2.74), and CSmetB (Cystathionine gamma-synthase, CSS0019809, −2.06) were downregulated in the intercropping of trifolium and tea plants. (Fig. 4, Supplementary Table S4).
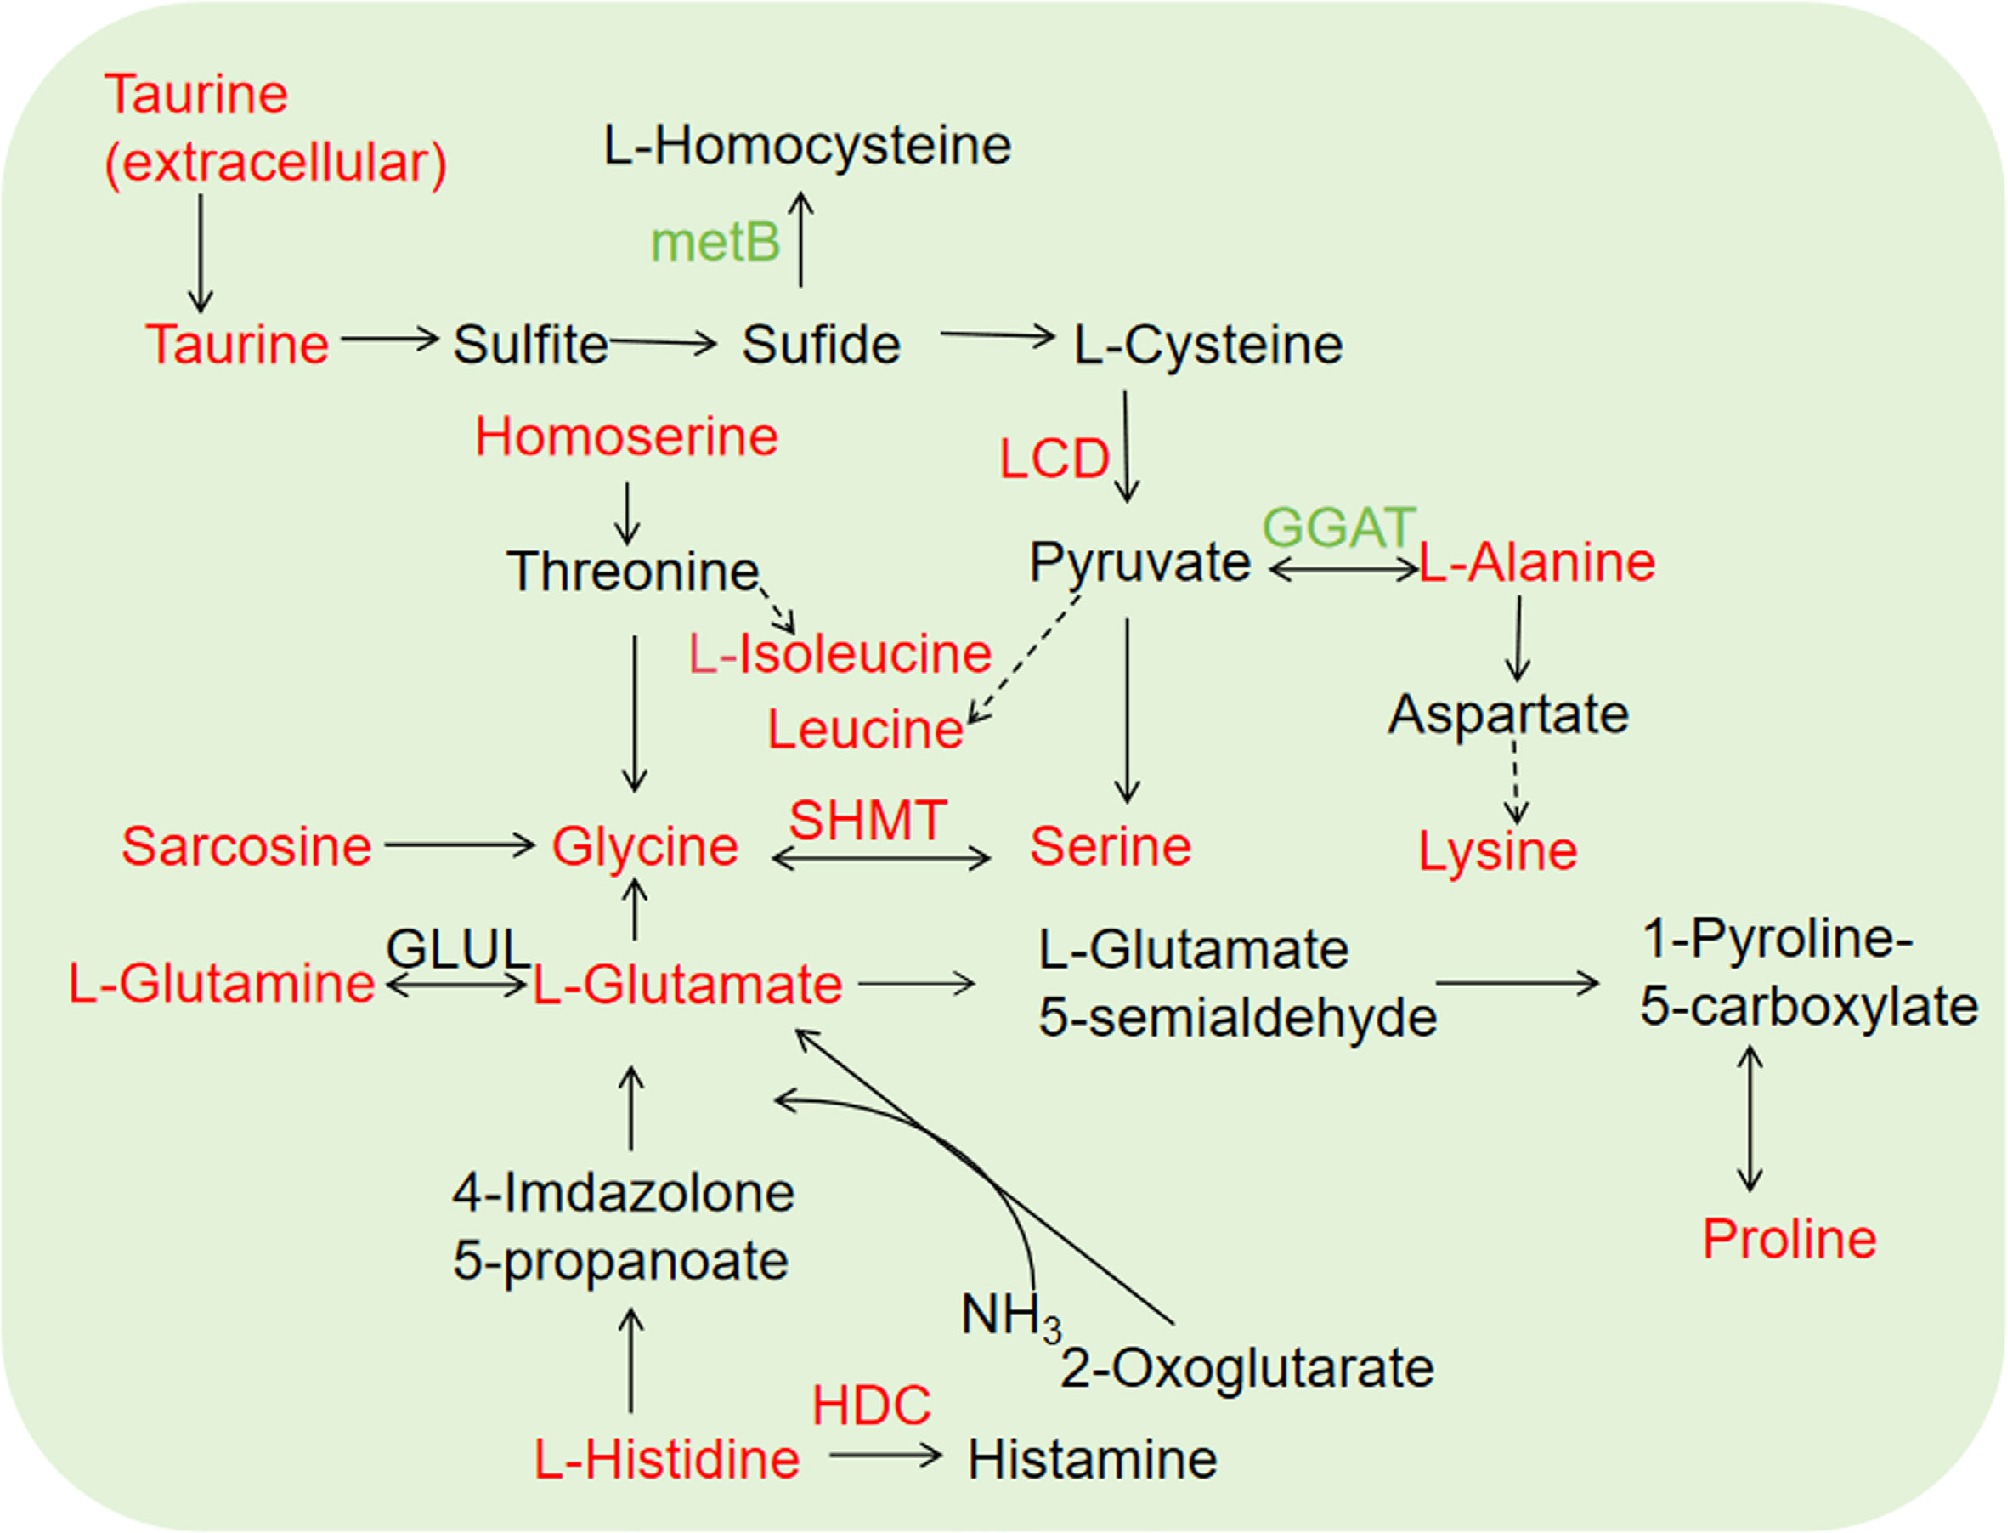
Figure 4.
Amino acid metabolism in tea plants intercropped with trifolium. Red and green indicate upregulated and downregulated genes/metabolites, respectively. Solid line and dotted line represent direct and indirect reactions, respectively.
Flavonoid metabolism of tea plants intercropped with trifolium
-
KEGG pathway enrichment revealed four flavonoid metabolism-related DEGs, including two upregulated DEGs flavonoid CsF3'5'H (3',5'-hydroxylase, CSSOO14132, 1.31) and CsF3H (naringenin, 3-dioxygenase, CSS0019002, 1.58), and two down-regulated DEGs CsCHI (chalcone isomerase, CSS0064350, −1.33) and CsANR (anthocyanidin reductase, CSS0046350, −1.33) (Fig. 5, Supplementary Table S3). In the tea plants intercropped with trifolium, 32 differential flavonoids were identified, of which all the differential flavonoids were downregulated except three upregulated flavonoids. Among the 32 flavonoids, there were eight flavonols, four flavones, and one flavanones. Among flavonols, 3-methyl nhamnazin (Log2FC −18.69), Quercetin 3-O-Neohesperidoside (Log2FC −1.88) and Quercetin-3-O-gentiotetroside (Log2FC −1.58) were the most significantly changed; among flavones, except Lucenin (Log2FC 23.25), all of other three metabolites were decreased, including Neoeriocitrin (Log2FC −2.96), Naringin (Log2FC −2.03), Vicenin 3 (Log2FC −0.81). Only one differential flavanone was identified, which was Plantagoside (Log2FC −1.14) (Supplementary Tables S2, S3; Fig. 5). Intercropping of trifolium with tea plant inhibited the production of flavonoids in general.
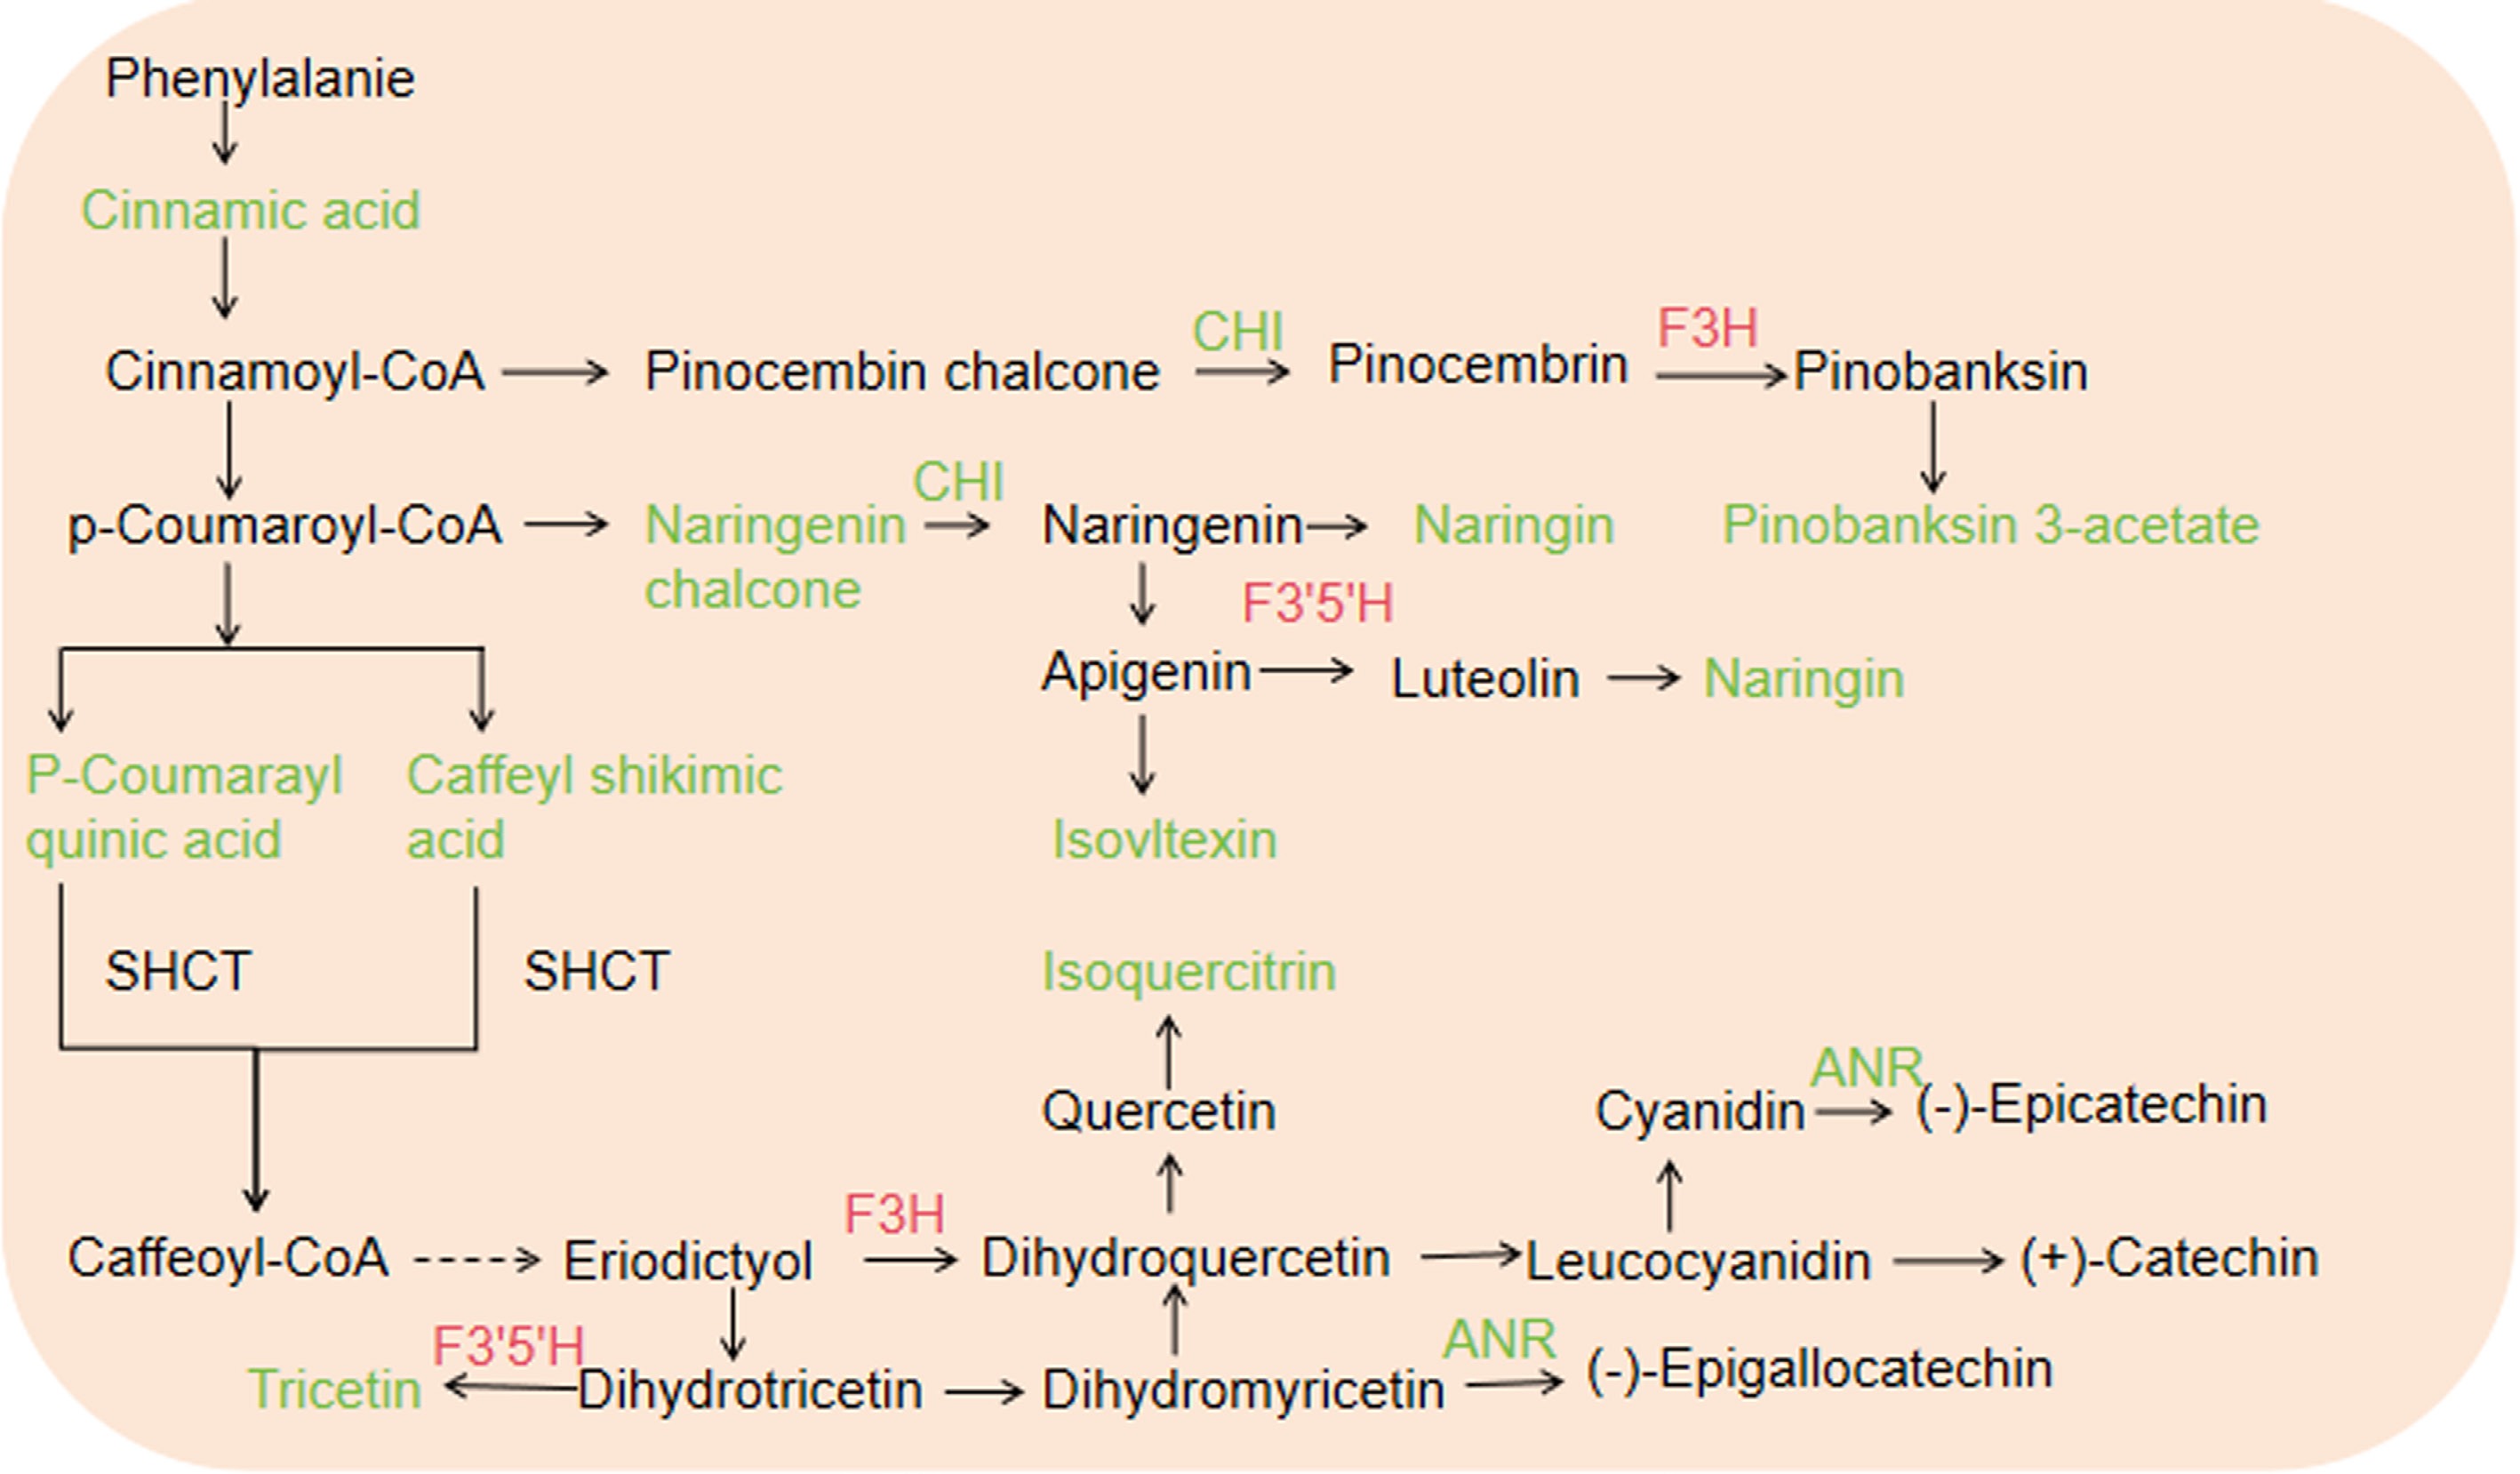
Figure 5.
Flavonoid metabolism in tea plants intercropped with trifolium. Red and green indicate upregulated and downregulated genes or metabolites, respectively. The solid line and dotted line represent direct and indirect reactions, repectively.
-
To clarify the effects of trifolium intercropping on tea plant metabolism, the transcriptome and metabolome of tea plants grown in mono- and trifolium intercropping were examined. It was shown that trifolium intercropping promoted amino acid metabolism and suppressed flavonoid biosynthesis in tea plants.
Intercropping of tea plants and trifolium promotes amino acid accumulation
-
Amino acids are essential for the growth of tea plants and are one of the important components that affect the quality of tea leaves[22]. In this study, most amino acids in tea plants were upregulated, and CsSHMT can catalyze the reversible reaction of serine and glycine[23]. Among them, CsSHMT was upregulated in tea plants intercropped with trifolium, leading to a simultaneous increase in the levels of glycine and serine. This may be due to the accumulation of substrates. The down-regulation of CsGGAT but up-regulation of alanine may be due to the many metabolic pathways that may exist during the pyruvate metabolism process. When CsGGAT was down-regulated, other enzymes or pathways that can catalyze the conversion of pyruvate or related metabolites to alanine may be more active, thus compensating for the effects of CsGGAT down-regulation and resulting in upregulation of alanine levels[24]. In addition, gene expression and metabolites were not directly related, genes need to be translated into proteins to perform their functions, and there are many post-transcriptional and post-translational modifications during the translation process, which also affect the function of proteins, so it was hypothesized that another reason for the inconsistency between gene expression and metabolite changes might be that there was a complex post-transcriptional and post-translational regulatory mechanism in the process from genes to proteins and then producing metabolites.
Glutamic acid is one of the umami compounds that can enhance the flavor and taste of tea[20]. Glutamine is one of the sweet-tasting compounds, and it can interconvert with glutamic acid[25]. Glutamic acid is synthesized from 2-oxoglutarate through an amination reaction, utilizing glutamine as the nitrogen source. In this process, glutamine acts as a donor of the amino group that is attached to the 2-oxoglutarate molecule, forming glutamic acid[26]. The increase of glutamic acid and glutamine in the new shoots of tea plants which intercropped with trifolium can effectively enhance the taste of tea. While the sweet and umami amino acids play a role, it's worth noting that the content of bitter-tasting amino acids such as leucine and isoleucine also increases. Nevertheless, the overall upregulation of amino acid levels in tea plants intercropped with trifolium contributed to a richer and more full-bodied taste of tea. The balance of these various amino acids would create a complex flavor that enhance the overall drinking experience[27].
Trifolium intercropping slows down the production of flavonoids in tea plant
-
Flavonoids are important secondary metabolites in plants and the most critical quality-related compounds, which not only impart tea with its unique bitterness and color but also possess significant biological activities in the form of antioxidant and anti-inflammatory properties[28]. They exhibit various physiological activities such as antioxidant and anti-inflammatory effects. However, an excessive amount of flavonoid compounds can lead to the bitterness of tea. Intercropping trifolium with tea plants can reduce the content of flavonoid compounds, thereby alleviating the bitterness of tea.
The bitter and astringent tastes of tea are primarily attributed to certain secondary metabolites present in tea leaves, among which catechins are the main components of tea bitterness and astringency[29]. It is noteworthy that the content of catechins, the most abundant flavonoid in tea leaves, did not show significant changes after intercropping trifolium. Catechins have strong antioxidant properties and also affect molecular mechanisms such as angiogenesis in tumors and related diseases[30]. This indicates that the antioxidant capacity of tea did not decrease significantly.
Flavonoids can be enzymatically modified to participate in the synthesis of catechins[31]. The study showed that the amount of CSANR, which is required for the biosynthesis of C, EC, and EGC in tea plants intercropped with trifolium, decreased, but the contents of C, EC, and EGC did not decrease significantly. The reason for this phenomenon may be that the transcription level of the gene is downregulated, but the modification increases the translation efficiency of RNA, so the synthesis of protein does not decrease significantly. Another possible reason is that the experiment used a broad-spectrum measurement method with insufficient precision, which may also lead to the non-decrease in catechin content. In the flavonoid biosynthesis pathway, different enzymes may compete for the same substrate. CSF3'5'H has been proven to act on multiple flavonoid substrates[32]. Therefore, the upregulation of CSF3'5'H and CSF3H may increase the demand for substrates, thereby reducing the amount of substrates for flavonoid biosynthesis. Consequently, the flavonoid biosynthesis in intercropped tea plants may be reduced due to competition for the same substrates with enzymes.
-
In summary, the intercropping mode of trifolium and tea regulated the metabolism of tea plants in two pathways. The trifolium intercropping could promote amino acid biosynthesis and suppress flavonoid metabolism, which was significantly related to the umami and bitter taste of tea, respectively. Therefore, trifolium intercropping is a potential cultivation method for improving tea quality. This study provides a new insight for guiding tea plantations.
This study was supported by the National Natural Science Fund of China (32302607), the Youth Innovation Team Project of Shandong Province (2023KJ208), the Natural Science Fund of Shandong Province (ZR2021QC159), and the Open Project of Liaocheng Universtiy Landscape Architecture Discipline (319462212).
-
The authors confirm contribution to the paper as follows: study conception and design: Ding Z, Ma Q; tea sample collection: Yu Q, Lv H, Zhao M, Sun L; experimental conduction: Qiu Z, Yu Q, Sun L, Wang Y; data analysis: Ding Z, Ma, Q, Yu Q; original draft preparation: Ma Q, Yu Q. All authors reviewed the results and approved the final version of the manuscript.
-
The datasets generated and analyzed during the current study are available from the corresponding authors on reasonable request.
-
The authors declare that they have no conflict of interest.
- Supplementary Table S1 Primers used for qRT-PCR.
- Supplementary Table S2 KEGG differential metabolite classification.
- Supplementary Table S3 Differential metabolism genes.
- Supplementary Table S4 Differential metabolites.
- Copyright: © 2025 by the author(s). Published by Maximum Academic Press, Fayetteville, GA. This article is an open access article distributed under Creative Commons Attribution License (CC BY 4.0), visit https://creativecommons.org/licenses/by/4.0/.
-
About this article
Cite this article
Yu Q, Qiu Z, Zhao M, Lv H, Sun L, et al. 2025. Trifolium intercropping promotes amino acid metabolism and suppresses flavonoid metabolism of tea plants. Beverage Plant Research 5: e013 doi: 10.48130/bpr-0025-0003 

Trifolium intercropping promotes amino acid metabolism and suppresses flavonoid metabolism of tea plants
- Received: 23 October 2024
- Revised: 14 January 2025
- Accepted: 20 January 2025
- Published online: 07 May 2025
Abstract: This study aimed to elucidate the mechanism of trifolium-tea intercropping on the metabolism of tea plants. High-throughput sequencing was used for transcriptome analysis to screen differential expressed genes (DEGs) between mono- and inter-cropped tea plants. LC-MS was used for metabolome analysis of tea plants. The results showed that the DEGs and metabolites on flavonoid metabolism and amino acid metabolism pathways were significantly changed after intercropping of trifolium and tea plants. For flavonoid biosynthesis, a total of 32 differential flavonoids were identified, including 29 downregulated metabolites in trifolium intercropped tea plants. The most significantly down-regulated flavonoids were Rhamnazin (Log2FC −18.69), Neoeriocitrin (Log2FC −2.96), and Plantagoside (Log2FC −1.14). Also, two down-regulated DEGs of flavonoid biosynthesis, including CsCHI (Chalcone isomerase, CSS0064350, −1.33) and CsANR (Anthocyanin reductase, CSS0046350, −1.33) were identified. For amino acid biosynthesis, 33 differential amino acids and derivates were identified, with 30 upregulated amino acids and derivates. The most accumulated amino acids in trifolium intercropped tea plants were L-histidine (Log2FC 2.58), N-Carbamoyl-Dl-aspartic acid (Log2FC 1.96) and L-lysine (Log2FC 1.61). In addition, three amino acid metabolic pathway-related upregulated DEGs were identified, including CsSHTM (Serine hydroxymethyltransferase, CSS0015428, 1.76), CsHDC (Histidine dehydrogenase, CSS0043348, 1.42) and CsLCD (L-cysteine desulfurase CSS0029518, 1.29). The results indicated that intercropping of trifolium inhibited flavonoid metabolism and promoted the amino acid metabolism of tea plants.
-
Key words:
- Tea plants /
- Trifolium intercropping /
- Amino acids /
- Flavonoids /
- Metabolism