













-
China is one of the centers of origin of the tea plant[1]. Its diverse geographical and climatic environments have fostered rich genetic diversity in tea plants. As a core region of tea plant origin, Guizhou Province harbors abundant wild tea plant germplasm resources. This is attributed to its unique geographical environment, characterized by an altitude that drops steeply from over 2,000 m in the west to around 200 m in the east, combined with ample rainfall and diverse terrain conditions[2]. The extensive distribution of local tea germplasm in Guizhou Province is accompanied by rich genetic diversity and a wealth of elite germplasm. This is reflected in the multitude of regionally cultivated varieties developed through long-term artificial selection, domestication, and breeding[3]. It has been reported that tea contains approximately 4,000 bioactive compounds, one-third of which are contributed by tea polyphenols[4−6]. Tea polyphenols, a class of phenolic compounds abundant in tea leaves, refer to a group of polyhydroxy phenolic substances that include epicatechins, epigallocatechins, and gallate esters. As the primary component of tea polyphenols and one of the most biologically active compounds in tea, catechins possess a range of health-promoting functions, including antioxidant and antiaging effects, as well as the potential for preventing cardiovascular and cerebrovascular diseases[7−9]. Catechins are both the primary functional substances and key quality components in tea, in which the catechin index (CI) of fresh leaves dictates the eventual theaflavin content and quality of black tea[10]. Theaflavins significantly influence the key qualities of black tea, including its color, aroma, and taste. They are the primary compounds responsible for the characteristic “brightness” and “golden ring” observed in the liquor.
The biosynthesis of flavonoids involves the coordinated action of both structural and regulatory genes. Catechins may be categorized as either galloylated catechins (ECG and EGCG) or nongalloylated catechins (C, GC, EC, and EGC) based on the presence or absence of a galloyl group attached to the 3-position of the C-ring. Their biosynthesis is primarily mediated by the shikimic acid pathway, the phenylpropanoid pathway, the nongalloylated catechin synthesis pathway, and the galloylated catechin synthesis pathway (Fig. 1).
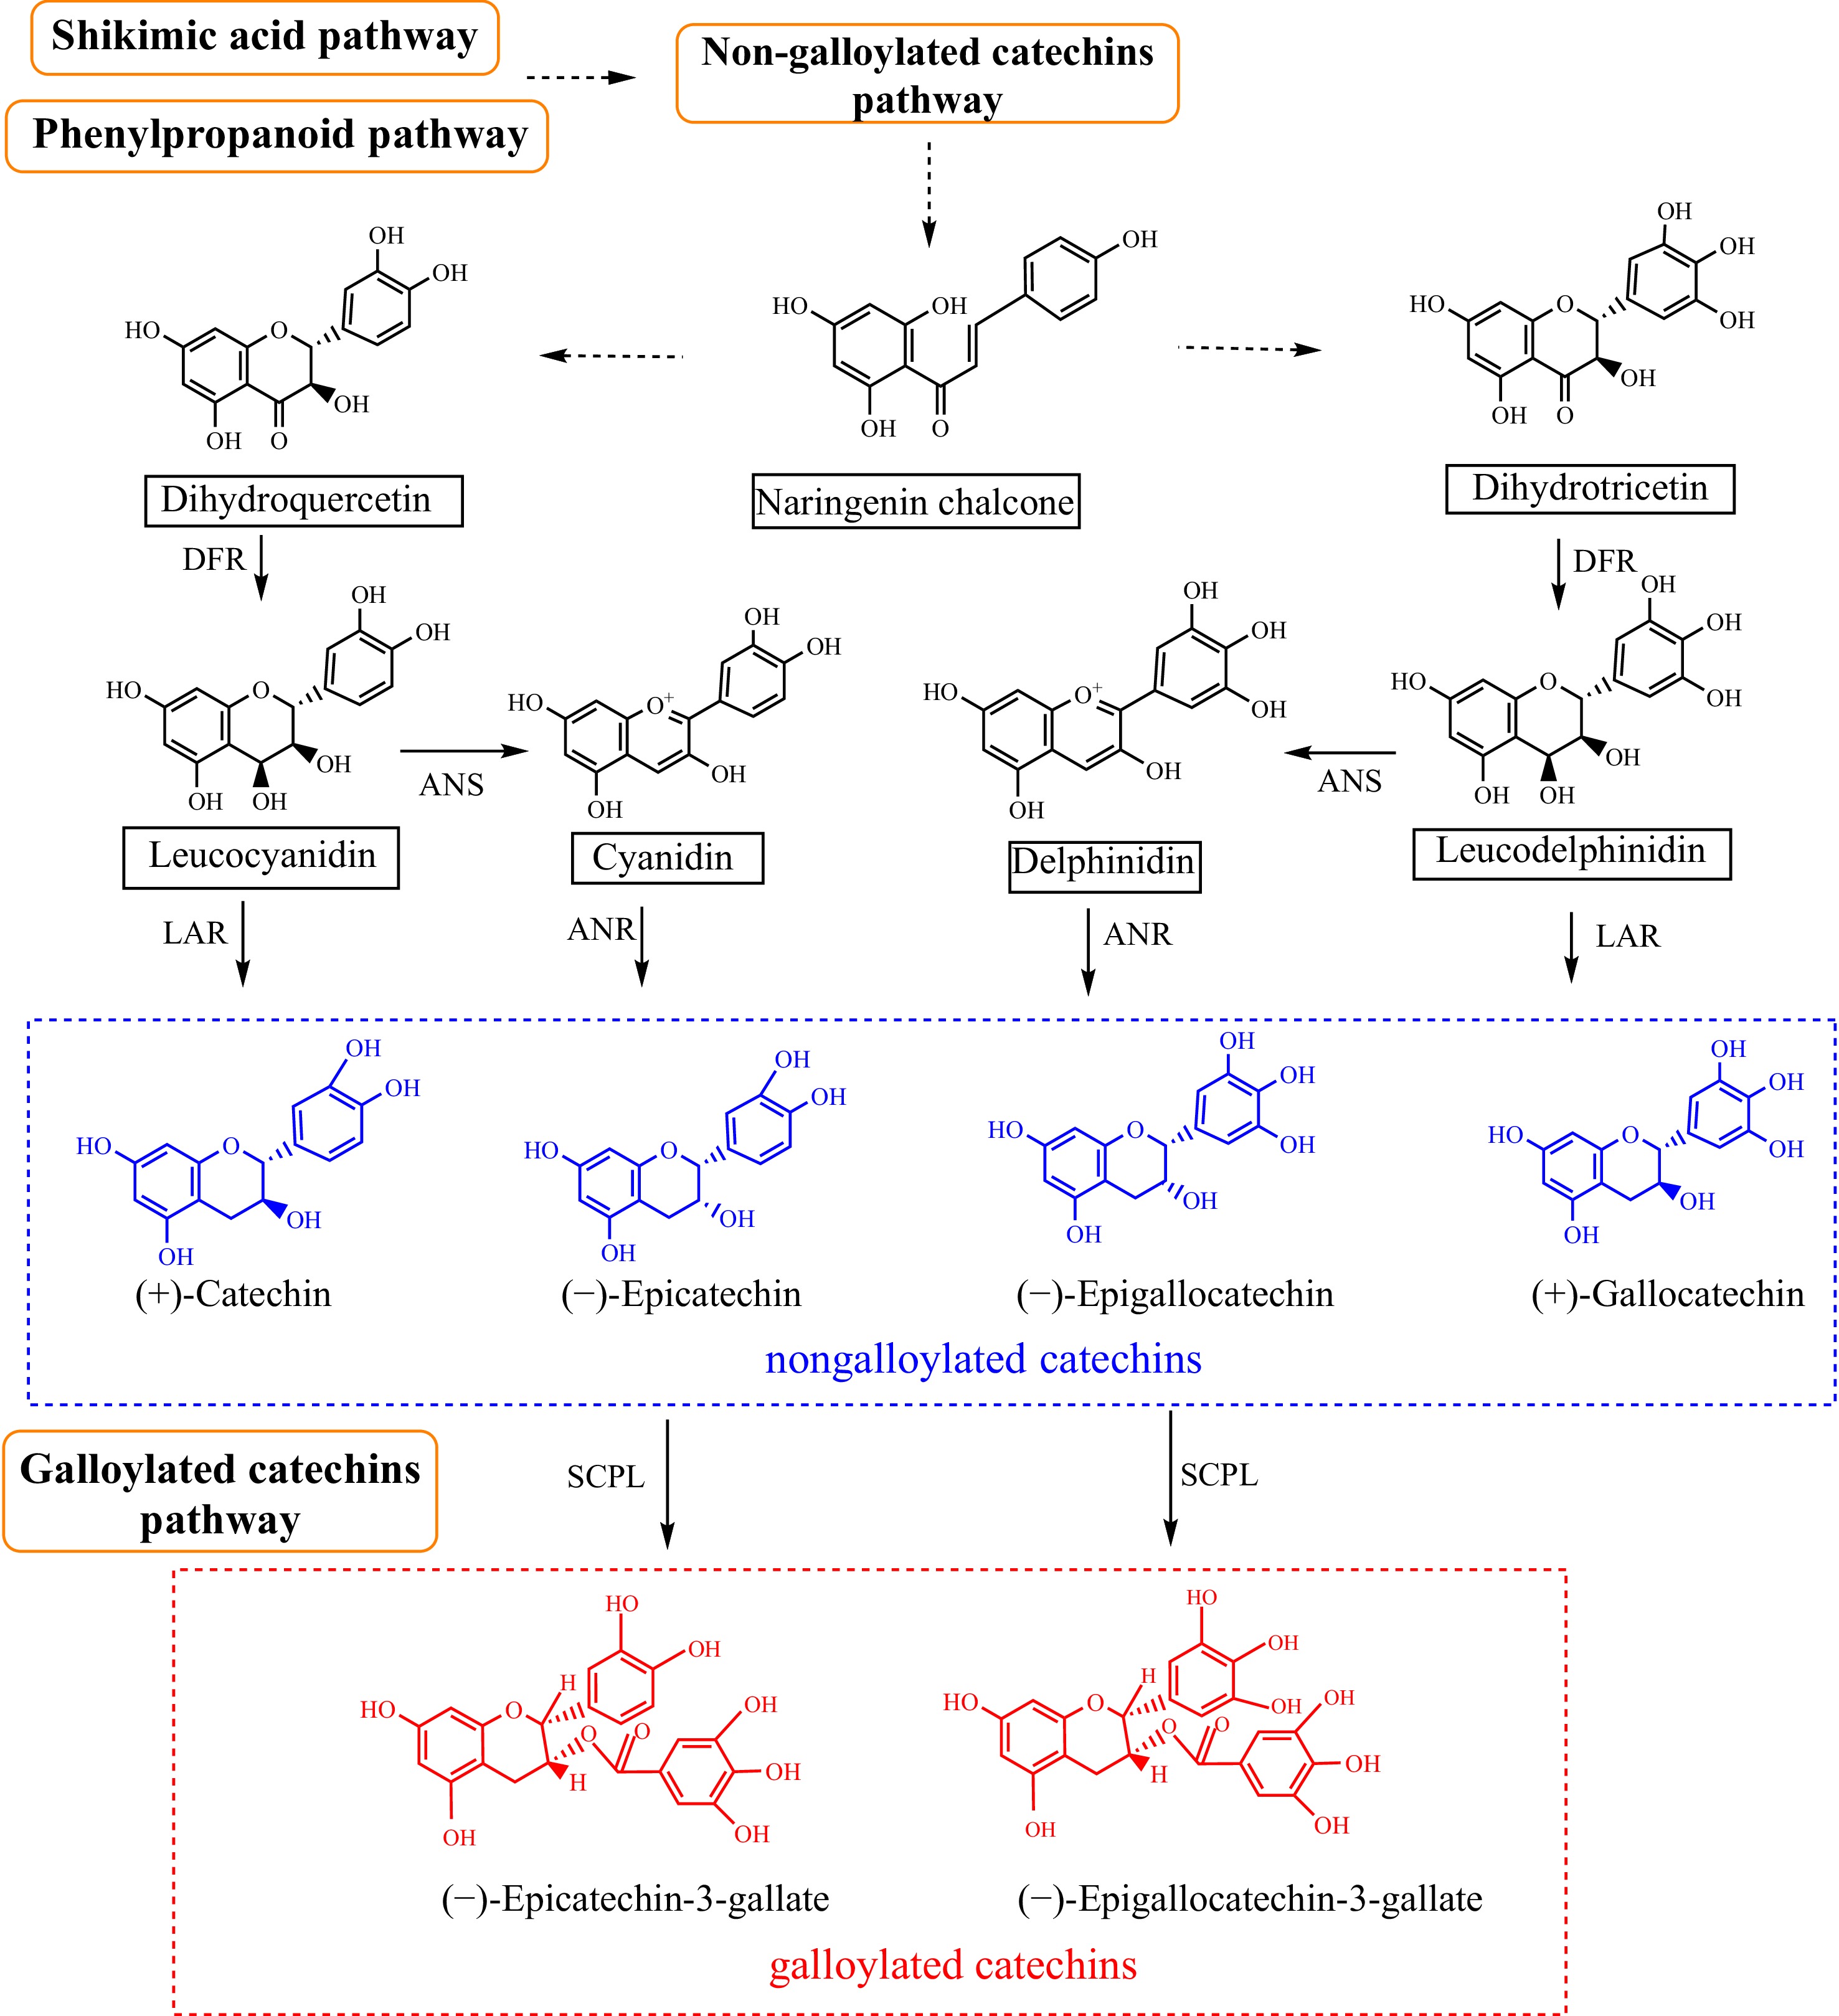
Figure 1.
The biosynthetic pathways underlying different types of catechins. DFR, dihydroflavonol 4-reductase; LAR, leucoanthocyanidin reductase; ANS, anthocyanidin synthase; SCPL, serine carboxypeptidase-like. Blue dashed box: nongalloylated catechins; black dashed box: galloylated catechins.
Genome-wide association study (GWAS) is a statistical approach used to identify associations between genome-wide polymorphisms, such as insertions, deletions, and structural variations on chromosomes, and phenotypic variations[11]. Conventional quantitative trait locus (QTL) mapping relies on the limited genetic diversity between two parental lines and requires the construction of specific mapping populations. Due to typically restricted population sizes, the identified QTL intervals are often broad, making it difficult to achieve gene-level precision in localization[12]. In contrast, GWAS utilizes natural populations, thereby significantly reducing the time required for preliminary work. A key advantage is that the genetic data from a natural population can be reused to study multiple traits, preventing redundant population development and substantially reducing sequencing costs. GWAS was first applied to identify genetic variants underlying human diseases. With advancements in technology, plant geneticists have since extended its application to the field of plant breeding[13,14]. Screening for single-nucleotide polymorphism (SNP) refers to the process of detecting DNA sequence polymorphisms caused by variations such as single-base substitutions, characterized by their large number, wide distribution, biallelic nature, and genetic stability[15]. The rapid development of third-generation molecular markers, exemplified by SNPs, has greatly propelled research into the genetic foundations of key agronomic traits in tea plants. For instance, Fang et al.[16] identified 307 SNP markers associated with theanine, caffeine, and catechin levels in 191 tea accessions using association analysis. In addition, 17 SNPs were validated to be significantly or highly significantly associated with the levels of specific metabolites. Deng et al.[17] screened the gene CsNCED1 by GWAS and validated its role as a negative regulator of salicylic acid (SA)-mediated immune responses, advancing the development of molecular marker-assisted breeding for insect-resistant cultivars.
With the largest area under tea cultivation in China, Guizhou Province plays a pivotal role in the national tea industry. However, its varietal diversity remains relatively limited. Crucially, a vast reservoir of locally preserved tea germplasm resources, characterized by superior quality, strong resilience, and unique flavor profiles, has yet to be systematically explored and utilized. Therefore, conducting in-depth research on the genetic dissection and functional gene mapping of catechin components in Guizhou tea plant resources will not only enrich the theoretical framework of tea functional genomics but also provide a solid theoretical and data-driven foundation for the precise conservation of Guizhou Province tea germplasm resources and the high-value industrial utilization of these resources.
This study utilized tea germplasm resources from Guizhou Province, which exhibit rich variation in tea polyphenols. Genotyping-by-sequencing (GBS) technology and high-performance liquid chromatography (HPLC) were employed to analyze catechin components and identify SNP markers. A GWAS was conducted to associate catechin component phenotypes with genotypes, aiming to locate SNP loci and their linked functional genes related to catechin composition. The results are expected to provide new insights for breeding tea cultivars with specific catechin profiles.
-
A total of 329 tea germplasm accessions, collected from 31 counties/districts in Guizhou Province, were used in this study. The collection comprised 187 accessions of Camellia sinensis (L.) O. Kuntze, 85 accessions of C. tachangensis F.C. Zhang, and 57 accessions of C. remotiserrata Zhang (Supplementary Table S1). To ensure uniform growth conditions, all accessions were planted at the tea germplasm repository of Guizhou University and maintained under standardized management practices, including irrigation, pruning, and fertilization. Fresh shoots comprising one bud and two leaves were harvested in the spring of 2023. The collected samples were immediately subjected to steam fixation to inactivate enzymes and reduce moisture content. Subsequently, the samples were dried in an oven at 90 °C until constant weight was achieved. The dried samples were stored for subsequent analysis of their catechin content.
HPLC analysis of catechin composition
-
The quantification of catechin components was performed using HPLC, based on a previously established methodology with appropriate modifications[18,19]. Tea powder (approximately 0.2 g, accurately weighed to 0.0001 g) was transferred into a 10 mL centrifuge tube and mixed with 5 mL of preheated (70 °C) 70% aqueous methanol. The mixture was vortexed vigorously and then subjected to extraction in a 70 °C water bath for 10 min. Following cooling, centrifugation was performed at 3,500 r/min for 10 min to collect the supernatant. The residue underwent a second extraction under identical conditions, and the combined supernatants were diluted to 10 mL with 70% methanol to prepare the stock solution. From this, a 300 µL aliquot was diluted with 2,700 µL of 70% methanol. After filtration through a 0.22 µm organic membrane, 1,000 µL of the diluted sample was transferred for injection analysis. All treatments were conducted in triplicate (n = 3). The mobile phase was prepared, and the chromatographic column was selected, as previously described[20].
Catechin components were analyzed using an HPLC system equipped with an SB-C18 column (250 mm × 4.6 mm, 5 μm). The detection wavelength was set at 278 nm, the flow rate was 1.0 mL/min, the column temperature was maintained at 30 °C, and the injection volume was 5 μL. The mobile phase consisted of solvent A (methanol), solvent B (acetonitrile), and solvent C (0.5% acetic acid aqueous solution, v/v). For qualitative and quantitative analysis, standard working solutions of various catechin monomers were prepared, and the retention times of each catechin monomer were determined. By comparing the retention times with those of the reference standards, GA, C, EC, EGC, GC, ECG, EGCG, and GCG were identified. Finally, the content of individual catechins was calculated using the following formula:
$ C=\dfrac{\left(A-A_0\right)\times f\mathrm{_{std}}\times V*d\times100}{m\times10^6\times W}. $ In the equation, C is the catechin content (%); A is the peak area of the analyte in the sample; A0 is the peak area of the analyte in the reagent blank; fstd is the calibration factor for the analyte (concentration/peak area, μg/mL); V is the volume of the sample extract (mL); m is the sample weight (g); W is the dry matter content of the sample (%); and d is the dilution factor.
Sequence alignment and SNP identification
-
Illumina's HiSeq-X platform was applied for sequencing the isolated genomic DNA from 329 tea accessions retrieved from published data (ID: CRA001438,
https://ngdc.cncb.ac.cn/gsa/browse/CRA001438 ). Raw sequencing reads were quality-filtered to remove adapter sequences and low-quality bases. Clean reads were aligned to the tea reference genome "Shuchazao" (http://tpia.teaplant.org ) using BWA-MEM v. 0.7.10 (https://sourceforge.net/projects/bio-bwa/files ) with default parameters[21]. SNPs were called and filtered as described by Niu et al.[2]. SNP calling was performed using GATK v. 3.7.0. High-quality SNPs were filtered based on the following criteria: minor allele frequency (MAF) > 0.05 and missing data rate < 20%.Population structure, genetic diversity, and genetic differentiation
-
Population structure was analyzed using ADMIXTURE with the number of ancestral clusters (K) set from 1 to 9. The optimal K was determined by identifying the lowest cross-validation (CV) error, while also considering the interpretability of the corresponding population structure plots. The neighbor-joining (NJ) phylogenetic tree was constructed using MEGA software[22]. Principal component analysis (PCA) was conducted using TASSEL[23]. The following genetic diversity and differentiation indices were calculated for different populations using VCFtools: population differentiation coefficient (Fst), observed heterozygosity (Ho), nucleotide diversity (Pi), Tajima's D, and inbreeding coefficient (Fis)[24]. Significant genetic differentiation between populations was assessed based on Fst values.
Statistical and correlation analysis of phenotypic variation in catechin components
-
Origin 2024 software was employed to conduct statistical analysis of catechin components and gallic acid (GA) content across 329 germplasm materials. Box plots were utilized to visualize the distribution of each component, with outliers identified and excluded based on these plots. For each component, the mean, standard deviation, and coefficient of variation were calculated. Normal distribution plots were generated to examine data distribution characteristics, and Pearson correlation analysis was ultimately used to assess the correlations between different catechin components.
GWAS analysis
-
GWAS was conducted on 329 samples using TASSEL software, using three statistical models: the general linear model (GLM), the mixed linear model (MLM), and the compressed mixed linear model (CMLM). To account for population structure and kinship, the models included the Q matrix (population structure), P matrix (principal components), and K matrix (kinship) as covariates, all calculated using the software's built-in functions. This yielded six linear regression models: GLM-Q, GLM-P, MLM-Q+K, MLM-P+K, CMLM-Q+K, and CMLM-P+K. Results were visualized using Manhattan plots and quantile–quantile (Q–Q) plots generated in RStudio. Based on Q–Q plot comparisons, the observed p values from the optimal model aligned more closely with the expected p values and yielded significant sites. Therefore, the optimal model was adopted to conduct GWAS on catechin components. Linkage disequilibrium (LD) between SNP markers was analyzed using PopLDdecay software by calculating the square of the allele correlation coefficient (r2)[25].
Candidate gene prediction
-
Significant SNP loci were identified based on GWAS derived threshold, defined as −log10(p-value) = −log10(1/SNPs)[26]. These SNPs were subsequently mapped to regions within 50 kb of candidate genes[27]. Their functions were subsequently annotated based on sequence information using the Arabidopsis Information Resource (TAIR,
www.arabidopsis.org ) and the National Center for Biotechnology Information (NCBI,www.ncbi.nlm.nih.gov ) databases.Analysis of candidate genes expression pattern by reverse transcription quantitative polymerase chain reaction (RT-qPCR)
-
To verify the correlation between the expression of candidate genes and catechin accumulation, materials were selected in descending order of EC content: high content (N564, N485, and N343), medium content (M12, M14, and M5), and low content (M93, M27, and M78); high EGCG content (N145, N149, and N143), medium content (N465, M24, and N572), and low content (N343, M12, and M77); high ECG content (N546, M77, and N560), medium content (N143, N474, and M24), and low content (M91, M27, and M93); high EGC content (M48, M95, and N343), moderate content (N143, N465, and M39), and low content (N564, M18, and M93) (Supplementary Table S2). Total RNA was extracted from one bud and two leaves of tea plant accessions using an RNA extraction kit (Hua Yueyang Biotechnology Co., Ltd., Beijing, China). After reverse transcription, the resulting cDNA was used as a template for RT-qPCR to assess the expression levels of candidate genes. RT-qPCR was performed as previously described[28]. The 2−ΔΔCᴛ method[29] was used to calculate the relative expression of candidate genes, with GAPDH as the reference gene. Each sample was replicated thrice. Finally, the data underwent normality testing using Origin 2024 software. Significant differences were indicated by asterisks (*, p < 0.05; **, p < 0.01; ***, p < 0.001), and data are presented as means ± SD. Following the generation of the significance results data table, graphical representations were produced. The correlation between candidate genes and catechin content variations in tea leaves was assessed.
-
GBS sequencing of 329 tea plant germplasm accessions yielded a total of 318.2 Gb of quality-controlled clean data, with an average of 0.97 Gb per accession. Alignment to the reference genome (TPIA) was performed using BWA-MEM. SNP calling was conducted with GATK, resulting in 29,393,327 raw SNPs. After stringent filtering, 102,538 high-quality SNPs were retained for subsequent analysis (Supplementary Table S3, Supplementary Fig. S1). The distribution of SNPs across chromosomes was uneven, with the highest number occurring on chromosome 1 (9,311) and the lowest on chromosome 15 (4,210). Among the 102,538 SNPs, 79,883 (77.90%) were transition sites, and 22,655 (22.1%) were transversion sites (Table 1).
Table 1. GBS sequencing substitution and inversion ratio.
Transitions Transversions CT AG AT AC CG GT Number of sites 40,076 39,807 6,592 5,691 4,633 5,739 Percentage of allelic sites 39.08 38.82 6.43 5.55 4.52 5.60 Total (%) 79,883 (77.90) 22,655 (22.1) Population structure and LD analysis
-
Based on the population structure analysis of 329 tea germplasm resources from Guizhou, the lowest CV value was observed at k = 5, indicating that this is the most probable number of genetic clusters (Fig. 2a). Therefore, it was determined that the 329 tea germplasm resources can be divided into five ancestral populations. A threshold of 0.6 was applied to the membership coefficients, resulting in the identification of five pure groups (GP1-GP5) and one mixed group (GP6) (Fig. 2b). The first pure group consisted of 25 accessions, of which C. sinensis accounted for 72%. The second pure group contained 26 accessions, with C. sinensis accounting for 92%. The third pure group comprised 123 accessions, of which C. sinensis accounted for 91%. The fourth pure group included 12 accessions, with C. remotiserrata accounting for 100%. The fifth pure group contained 42 accessions, with C. tachangensis accounting for 100%. The sixth group was the mixed group, consisting of 101 tea accessions (Supplementary Table S4). The results of the population structure analysis (Fig. 2c, d) were confirmed by the NJ phylogenetic tree and PCA.
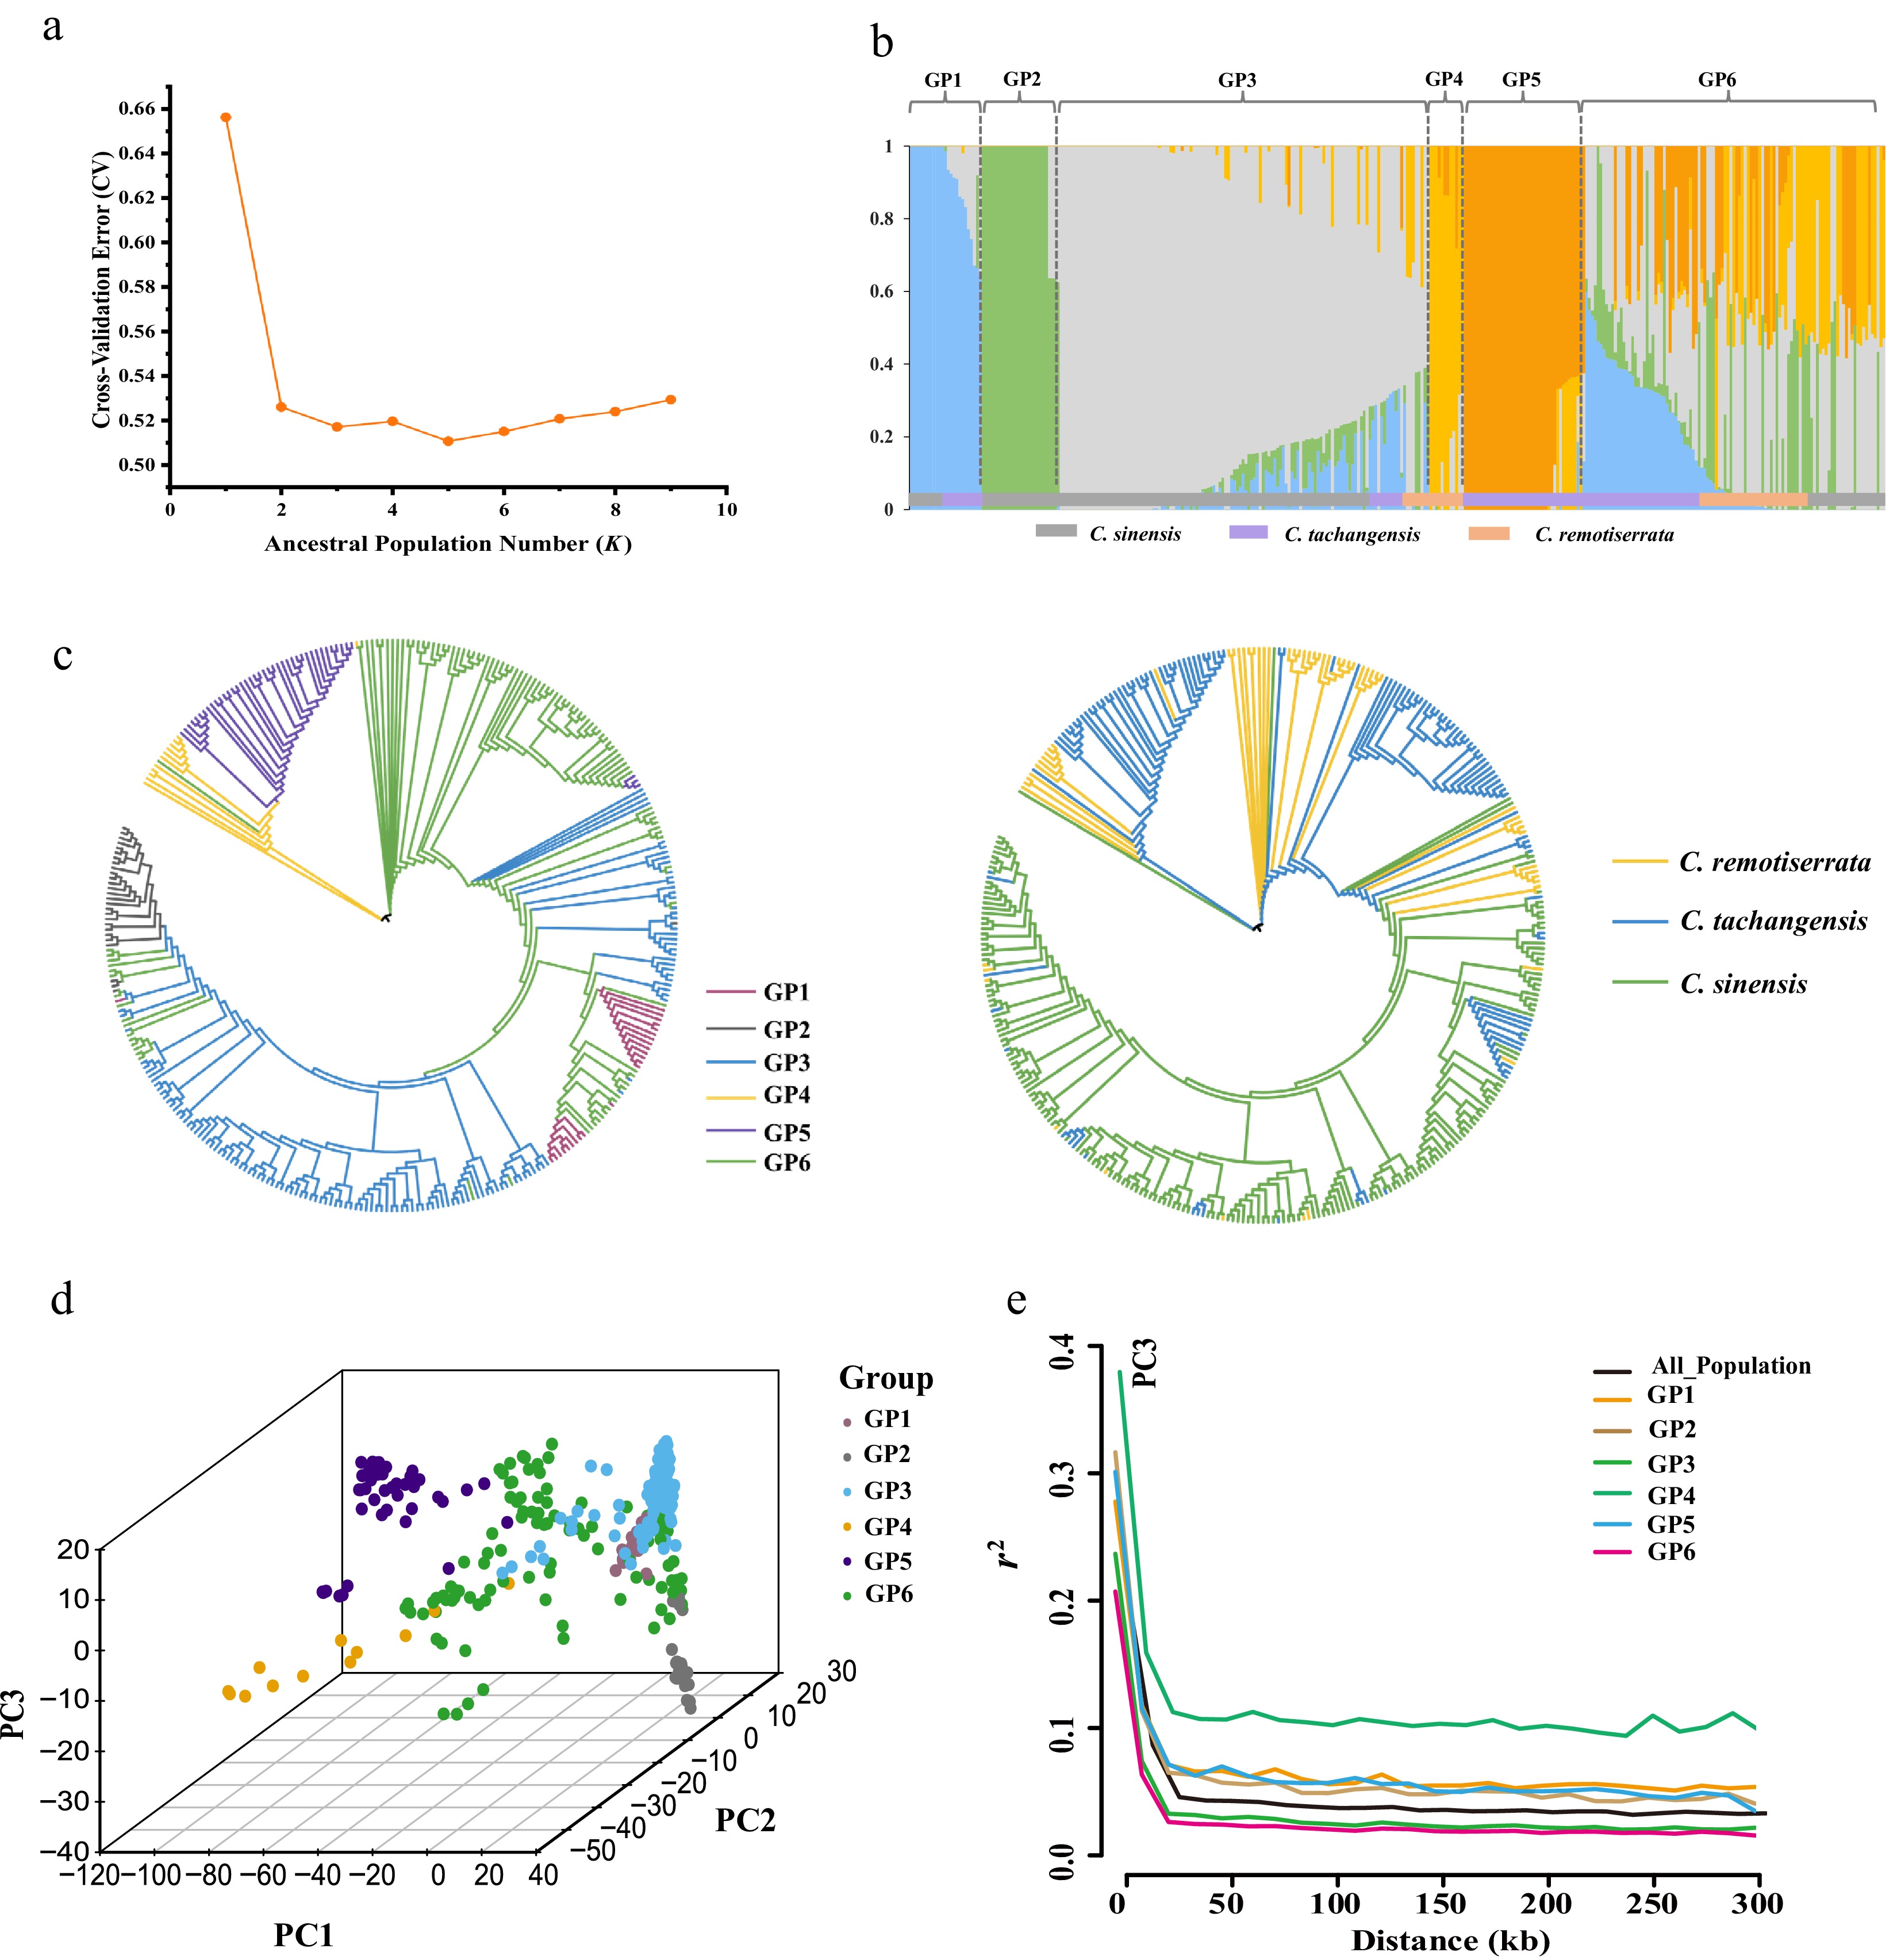
Figure 2.
Population structure, PCA, and NJ tree of the 329 tea accessions: (a) Cross-validation line chart, the lowest CV error (0.51075) was observed at K = 5; (b) K = 5 membership function bar graph (one color represents one ancestor); (c) NJ phylogenetic tree of 329 tea germplasm resources and evolutionary trees; (d) principal component analysis of tea germplasm resources; (e) LD decay of 329 accessions.
Furthermore, we observed differentiated linkage disequilibrium (LD) lengths across different populations (calculated based on half the maximum r2 value). Among the 329 tea germplasm accessions, the maximum r2 value for LD decay reached 0.72. When LD decayed to half its value (r2 = 0.36), the corresponding physical distance was 13.1 kb. LD decay estimates were calculated for these six inferred populations. Population GP4 exhibited the slowest LD decay, with a distance of 24.8 kb when r2 reached 0.36. Conversely, population GP6 demonstrated the fastest LD decay rate, corresponding to a physical distance of approximately 12.3 kb at r2 = 0.36. The corresponding physical distances for GP1, GP2, GP3, and GP5 at r2 = 0.36 were approximately 16.3, 16.6, 18.4, and 14.9 kb, respectively (Fig. 2e).
Analysis of genetic diversity
-
Genetic diversity analysis of the 329 tea germplasm resources across the six inferred populations demonstrated the following values: the average nucleotide diversity (Pi) was 0.230, the observed heterozygosity (Ho) was 0.070, the inbreeding coefficient (Fis) was 0.690, and Tajima's D was 1.190 (Table 2). A comparative analysis of genetic diversity among the six inferred tea populations revealed significant variation across key parameters. The Ho ranged from 0.057 to 0.179. Population GP3 exhibited the highest Ho (0.179), whereas GP5 showed the lowest (0.057). The Fis ranged from 0.525 to 0.632, with GP6 showing the highest Fis (0.632) and GP2 showing the lowest (0.525). The Pi ranged from 0.141 to 0.229. Population GP6 presented the highest Pi (0.229), whereas GP2 had the lowest (0.141). All six inferred tea subgroups showed positive Tajima's D values, suggesting population bottlenecks and/or balancing selection.
Table 2. Genetic diversity analysis of 329 tea germplasm resources.
Group Ho Fis Tajima's D Pi GP1 0.065 0.63 0.276 0.17 GP2 0.065 0.525 0.329 0.141 GP3 0.179 0.626 0.398 0.18 GP4 0.069 0.615 0.452 0.188 GP5 0.057 0.63 0.65 0.164 GP6 0.089 0.632 0.755 0.229 Total 0.07 0.69 1.19 0.23 Ho, observed heterozygosity; Fis, inbreeding coefficient; Pi, average nucleotide diversity. Analysis of population genetic differentiation
-
A comparative analysis of the pairwise genetic differentiation coefficients (Fst) among the six inferred populations was conducted (Supplementary Table S5). The results showed substantial genetic differentiation (Fst > 0.15) between the following population pairs: GP1 and GP4, GP1 and GP5, GP2 and GP4, GP2 and GP5, GP3 and GP4, GP3 and GP5, and GP5 and GP6. Moderate differentiation (Fst ranging from 0.05 to 0.15) was observed between GP1 and GP2, GP2 and GP6, GP3 and GP6, GP4 and GP5, and GP4 and GP6. The remaining pairwise Fst values were below 0.05, indicating low levels of genetic differentiation.
Statistical analysis of phenotypic variation in catechin components
-
Statistical analysis and outlier removal were performed on the catechin components and GA content. The corresponding coefficients of variation were 38.6%, 42.1%, 38.2%, 68.6%, 28.6%, 37.2%, 33.6%, and 28.9%. The skewness and kurtosis values ranged from −0.839 to 0.912 and from −0.541 to 0.925, respectively (Supplementary Table S6). To compare the catechin composition and distribution differences among the three tea groups (C. sinensis, C. remotiserrata, and C. tachangensis), we plotted box-and-whisker plots of catechin proportions (Fig. 3a). The C. tachangensis group exhibited the lowest median EGCG content compared with the other two groups, with the widest interquartile range. Furthermore, the lowest EGCG content within this group was approximately 1.9%, indicating a high degree of variation among individuals. In contrast, the EGCG content distribution in both C. sinensis and C. remotiserrata was more concentrated. Concurrently, the median ECG content in C. tachangensis was the highest, with the longest box length for C content, indicating greater variation among individuals within this group. Similarly, EGC content exhibited higher variability among individuals within the C. remotiserrata group. No significant differences were observed in GC, EC, or GCG content across the three groups (Supplementary Fig. S2). The three Camellia species displayed distinct catechin compositional signatures (Fig. 3b). Pie chart analysis revealed that C. tachangensis exhibited the highest proportion of ECG among the catechin components (16.9%), whereas its EGCG content constituted the smallest proportion among the three groups. Differences in the ratio of nongalloylated to galloylated catechins were observed across the three tea groups. C. tachangensis exhibited the highest proportion of nongalloylated catechins, with nongalloylated and galloylated catechins accounting for 32% and 68%, respectively, which is significantly higher than the values for both C. sinensis and C. remotiserrata (Fig. 3c). Histograms of the catechin component contents (Fig. 3d, e) indicated that the distributions were approximately normal, supporting the feasibility of conducting GWAS.
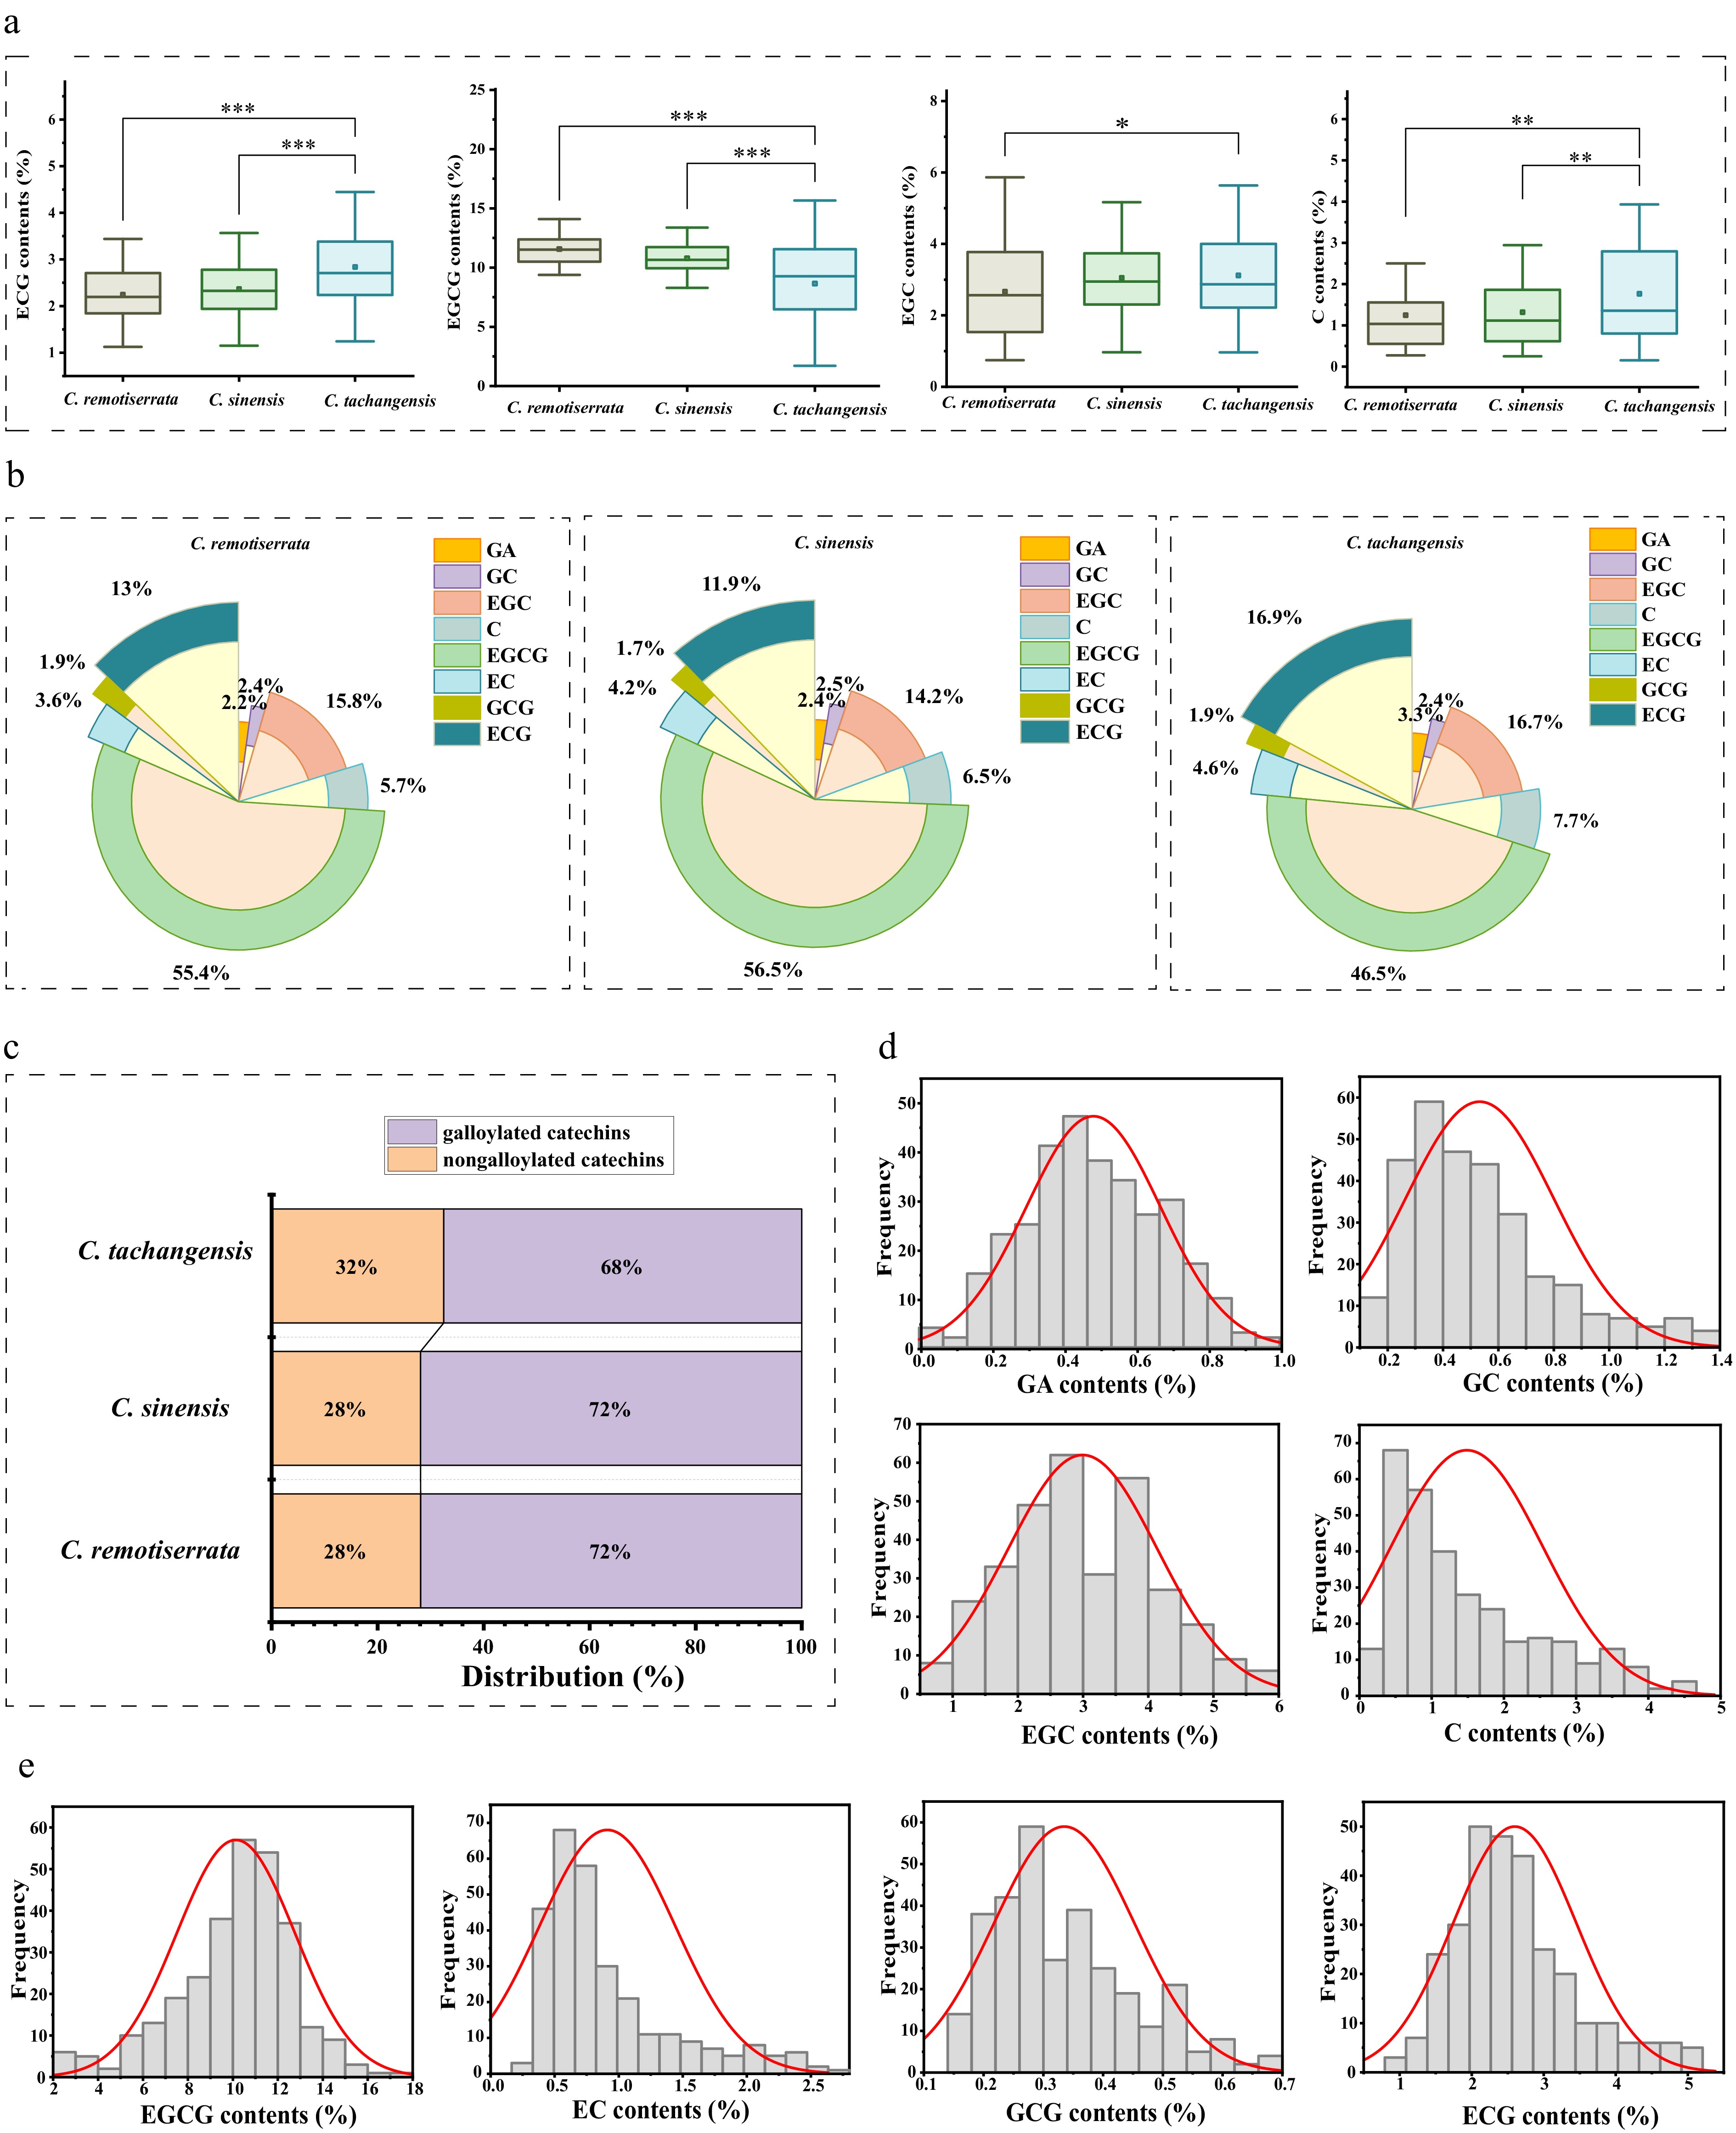
Figure 3.
Differences in catechin composition and distribution among three tea groups and phenotype of catechin components and frequency distribution: (a) Box plot comparison of catechin components among the three tea groups, *, **, and *** indicate statistically significant differences at p < 0.05, p < 0.01, and p < 0.001, respectively; (b) comparison of the catechin composition of three Camellia species using pie charts; (c) proportion diagram of nongalloylated catechins and galloylated catechins in three tea groups; (d) histogram of GA, GC, EGC, and C; (e) histogram of EGCG, EC, GCG, and ECG.
Correlation analysis among different catechin components
-
Correlation analysis revealed distinct patterns of association among the catechin components (Supplementary Table S7). C, GCG, and ECG all showed significant positive correlations with EGC. EGCG exhibited negative correlations with C, EC, and ECG (including highly significant negative correlations with EC and ECG), but a positive correlation with GCG. ECG demonstrated significant positive correlations with EC, C, and GCG.
Genome-wide association identifies catechin biosynthetic loci
-
To identify genes associated with variation in catechin content, the optimal model for downstream analysis for each trait was selected by comparing Q–Q plots and choosing the model that best fitted the observed distribution to the expected distribution (Supplementary Fig. S3). The results indicated that the GLM-P, MLM-Q+K, CMLM-P+K, CMLM-P+K, MLM-Q+K, MLM-Q+K, CMLM-P+K, and MLM-P+K models were most suitable for GWAS analyses of GA, C, GC, EGC, EC, EGCG, GCG, and ECG, respectively. A total of ten and nine SNPs were identified that were significantly associated with the content of GA and C, respectively (Supplementary Table S8, Fig. 4a, b), with −log10(p) ≥ 5.0. Meanwhile, we identified four, four, six, four, seven, and four SNPs significantly associated with the content of GC, EGC, EC, EGCG, GCG, and ECG, respectively (Supplementary Table S8, Fig. 4c−h), with −log10(p) ≥ 4.5. These SNPs explained 6.71%−13.33% of the phenotypic variation (R2). The estimated effects ranged from −3.390 to 2.639 for the major allele and from −4.707 to 0.649 for the minor allele.
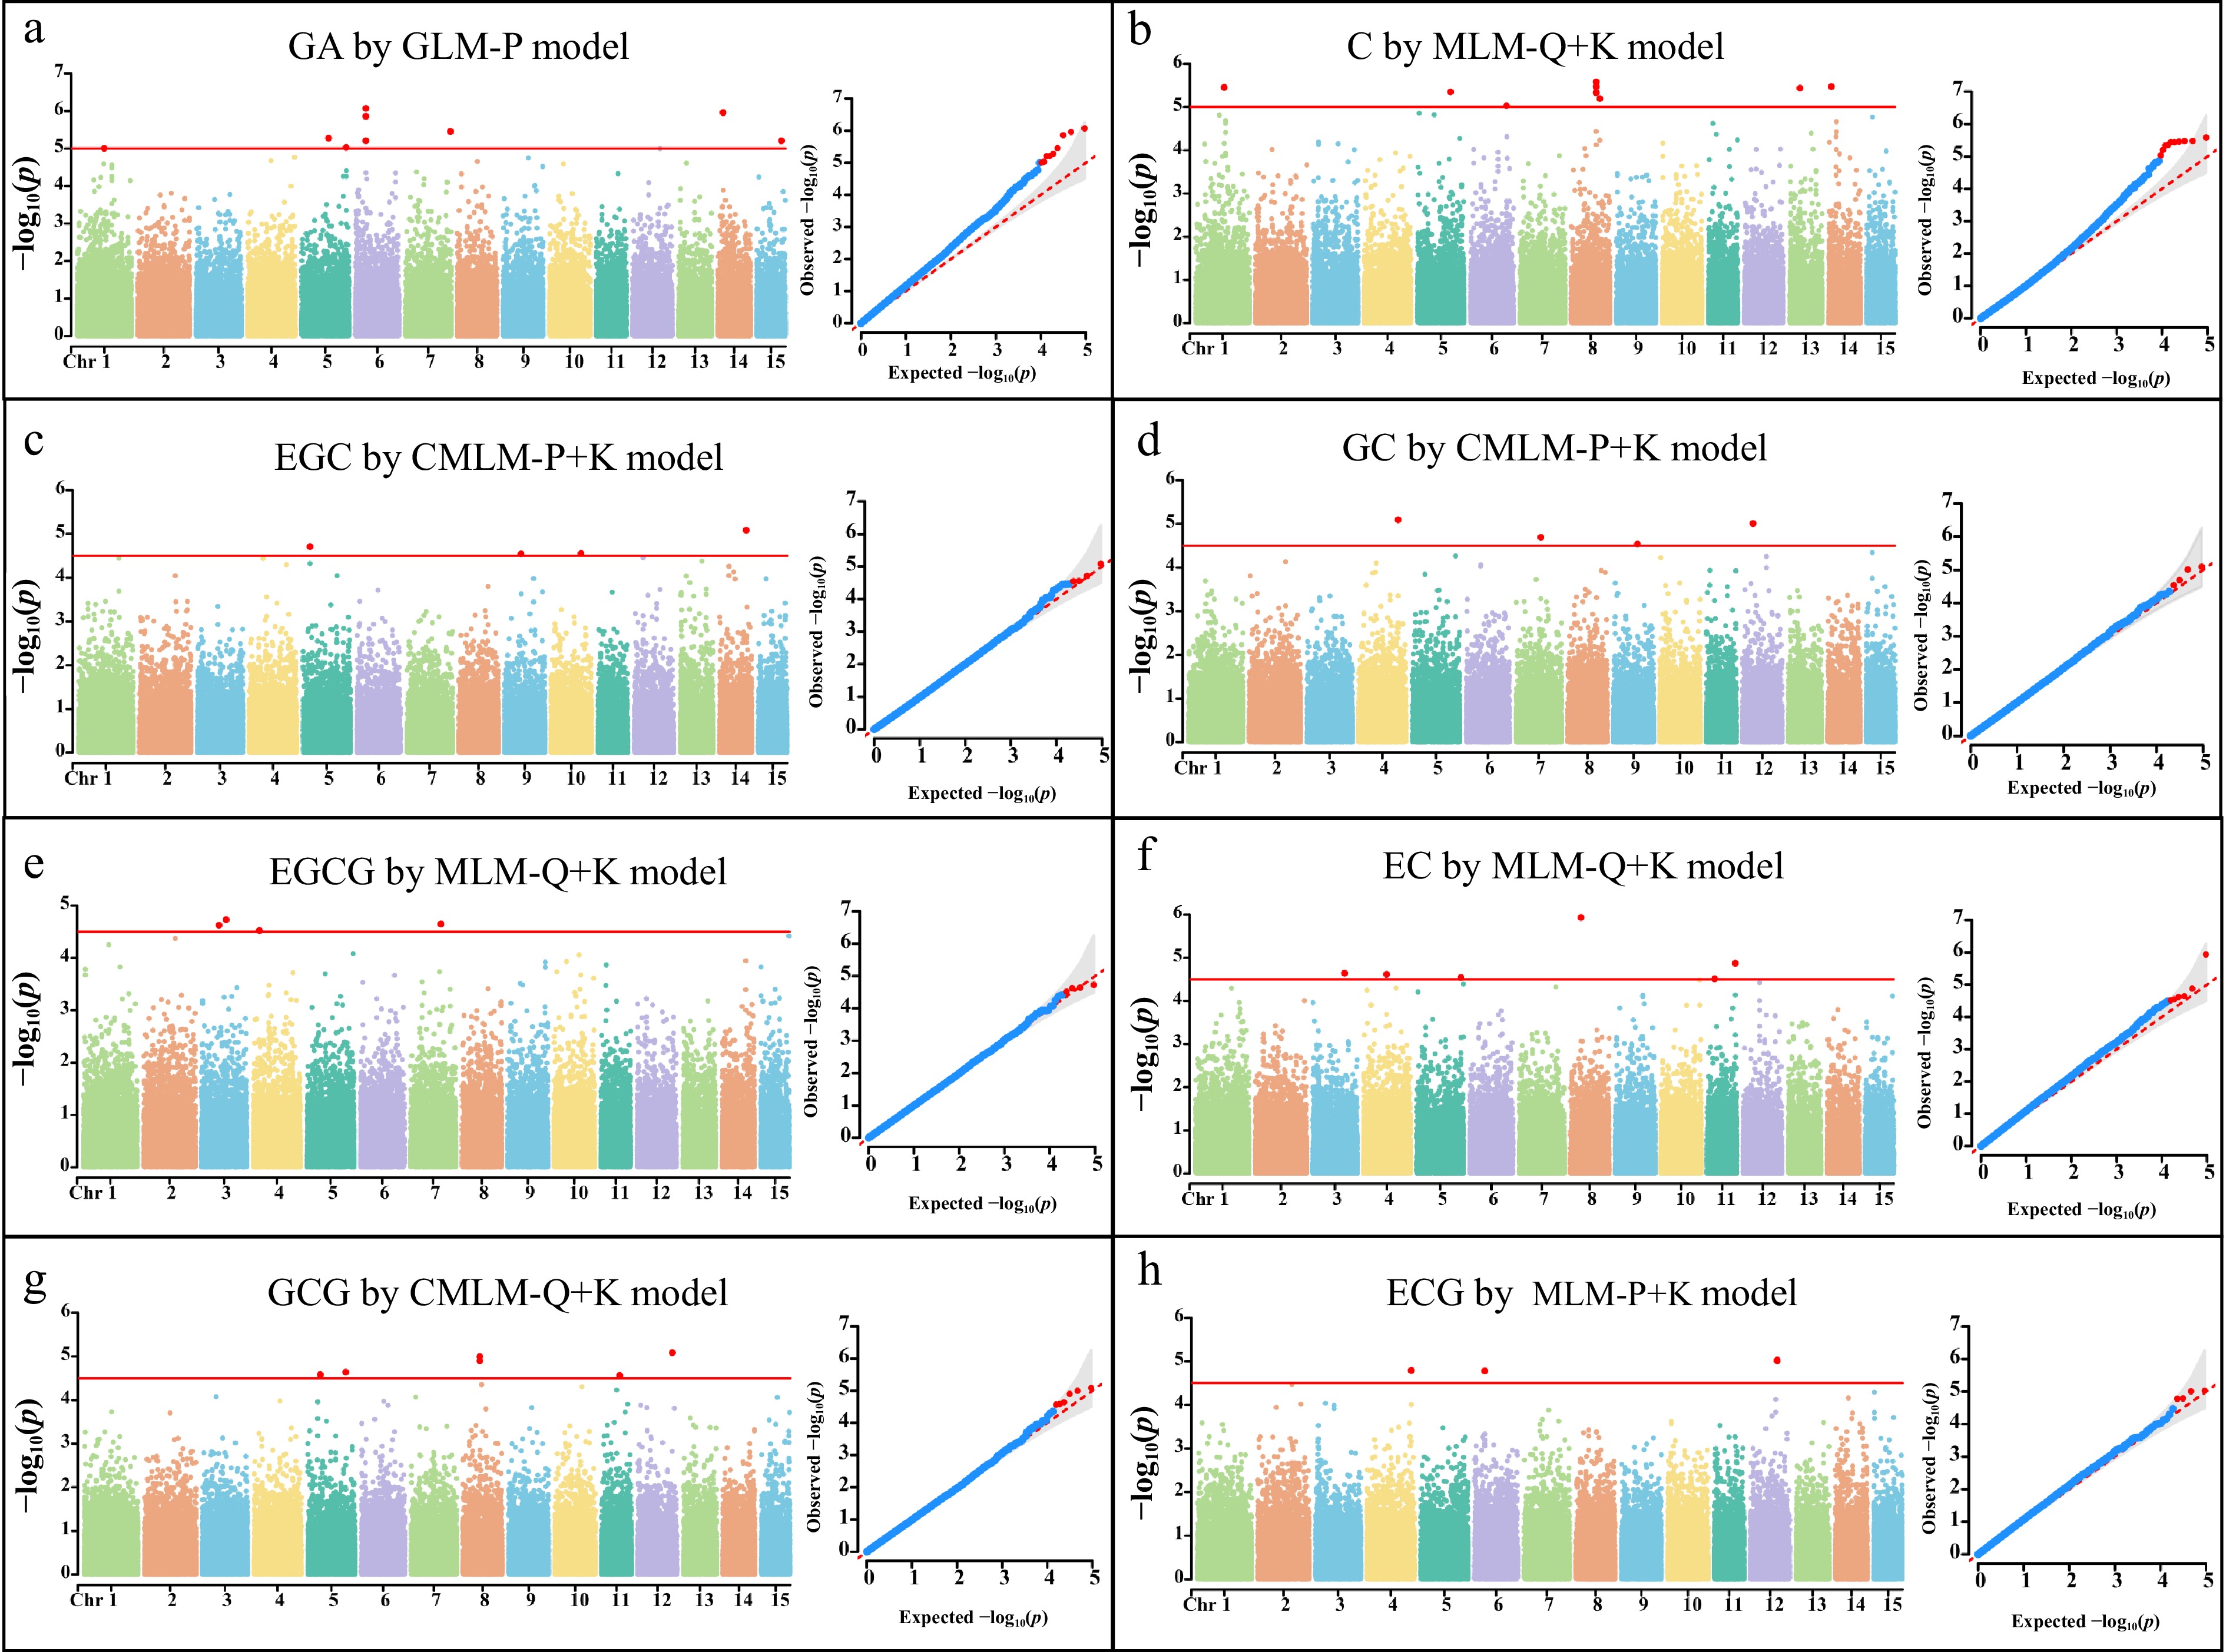
Figure 4.
Genome-wide association analysis of GA, C, GC, EGC, EC, EGCG, GCG, and ECG: (a) Manhattan plots and Q–Q plots of GA; (b) Manhattan plots and Q–Q plots of C; (c) Manhattan plots and Q–Q plots of EGC; (d) Manhattan plots and Q–Q plots of GC; (e) Manhattan plots and Q–Q plots of EGCG; (f) Manhattan plots and Q–Q plots of EC; (g) Manhattan plots and Q–Q plots of GCG; (h) Manhattan plots and Q–Q plots of ECG.
Functional annotation prioritizes catechin biosynthetic candidate genes
-
Using the TPIA, TAIR, and NCBI databases along with gene annotation information of the materials, the functional information of genes within a 50 kb region upstream and downstream of the obtained SNP loci was analyzed to predict candidate genes associated with catechin component content. A total of 13 candidate genes related to catechin component content were predicted (Table 3). Representative examples include TEA026236.1 (associated with EGC), which is involved in the phenylpropanoid metabolism pathway; TEA023243.1 (associated with ECG), a key gene in the phenylpropanoid pathway for lignin and flavonoid production; TEA011262.1 (associated with EC), implicated in sucrose transport and sucrose-induced anthocyanin accumulation; and TEA000116.1 (associated with EGCG), which is predicted to catalyze the biosynthesis of flavonoid glycosides.
Table 3. Candidate genes and functional annotations.
SNP locus Gene ID Functional annotation S8_104392830 TEA026827.1 This gene encodes an ABC transporter that mediates transmembrane transport and is involved in flavonoid sequestration into vacuoles. S13_43497176 TEA019082.1 This gene encodes a catecholamine-responsive transmembrane electron transporter that regulates physiological functions and signaling via electron transfer. S3_133542716 TEA007496.1 This gene encodes a protein that degrades key regulators of the cell cycle, differentiation, and organ development, thereby ensuring orderly developmental progression. S4_95939387 TEA011262.1 This gene encodes a sucrose transporter that facilitates sucrose uptake from extracellular sources or storage compartments for cellular metabolism. S14_33134994 TEA000989.1 This gene encodes the rate-limiting enzyme in sucrose biosynthesis and serves as a pivotal regulator of carbon allocation within leaves. S7_102036877 TEA003558.1 This gene encodes a phosphoglucose isomerase that catalyzes the interconversion of G6P and F6P in glycolysis, thereby supplying phosphoenolpyruvate (PEP) as a precursor for the shikimate pathway. The shikimate pathway provides phenylalanine for phenylpropanoid and flavonoid biosynthesis. S9_67890060 TEA026236.1 This gene encodes an enzyme that channels phenylpropanoid metabolism towards lignin biosynthesis. S6_43615287 TEA023243.1 This gene encodes a key metabolic node that regulates phenylpropanoid metabolism, including lignin and catechin biosynthesis. S3_101510193 TEA021131.1 This gene encodes a kinase that catalyzes phosphorylation reactions, providing universal precursors for chlorophyll, carotenoid, and other downstream metabolites. S7_125575552 TEA000116.1 This gene encodes a glycosyltransferase that mediates the glycosylation of phenolic compounds, including flavonoids. S4_25654704 TEA022371.1 This gene encodes an enzyme that catalyzes the synthesis of UDP-glucuronic acid, thereby competing for UDP-glucose and reducing the substrate pool available for flavonoid glycosylation. S8_69959923 TEA020506.1 This gene encodes a membrane-associated protein that is involved in flavonoid storage and biosynthesis. S5_110977386 TEA002191.1 This gene encodes a methyltransferase that converts phenolic hydroxyl groups into methoxy groups, thereby participating in the methylation modification of flavonoids. RT-qPCR validates gene expression across catechin gradients
-
To determine whether the five candidate genes (TEA000116.1, TEA023243.1, TEA011262.1, TEA007496.1, and TEA026236.1) are involved in the regulation of EGCG, ECG, EC, and EGC, we examined their expression levels by RT-qPCR. The results revealed differential expression levels of these candidate genes among tea accessions with varying catechin contents. Specifically, the expression of TEA011262.1 showed negative correlation with EC (r = −0.82, p = 0.006) (Fig. 5a), and the expression of TEA000116.1, TEA023243.1, and TEA026236.1 showed positive correlations with EGCG (r = 0.92, p = 0.0004), ECG (r = 0.94, p = 0.0001), and EGC (r = 0.99, p = 0.0001) levels (Fig. 5b−d), respectively. However, the expression of TEA007496.1 in materials with different EC contents did not follow any clear pattern (r = 0.41, p = 0.27) (Supplementary Fig. S4).
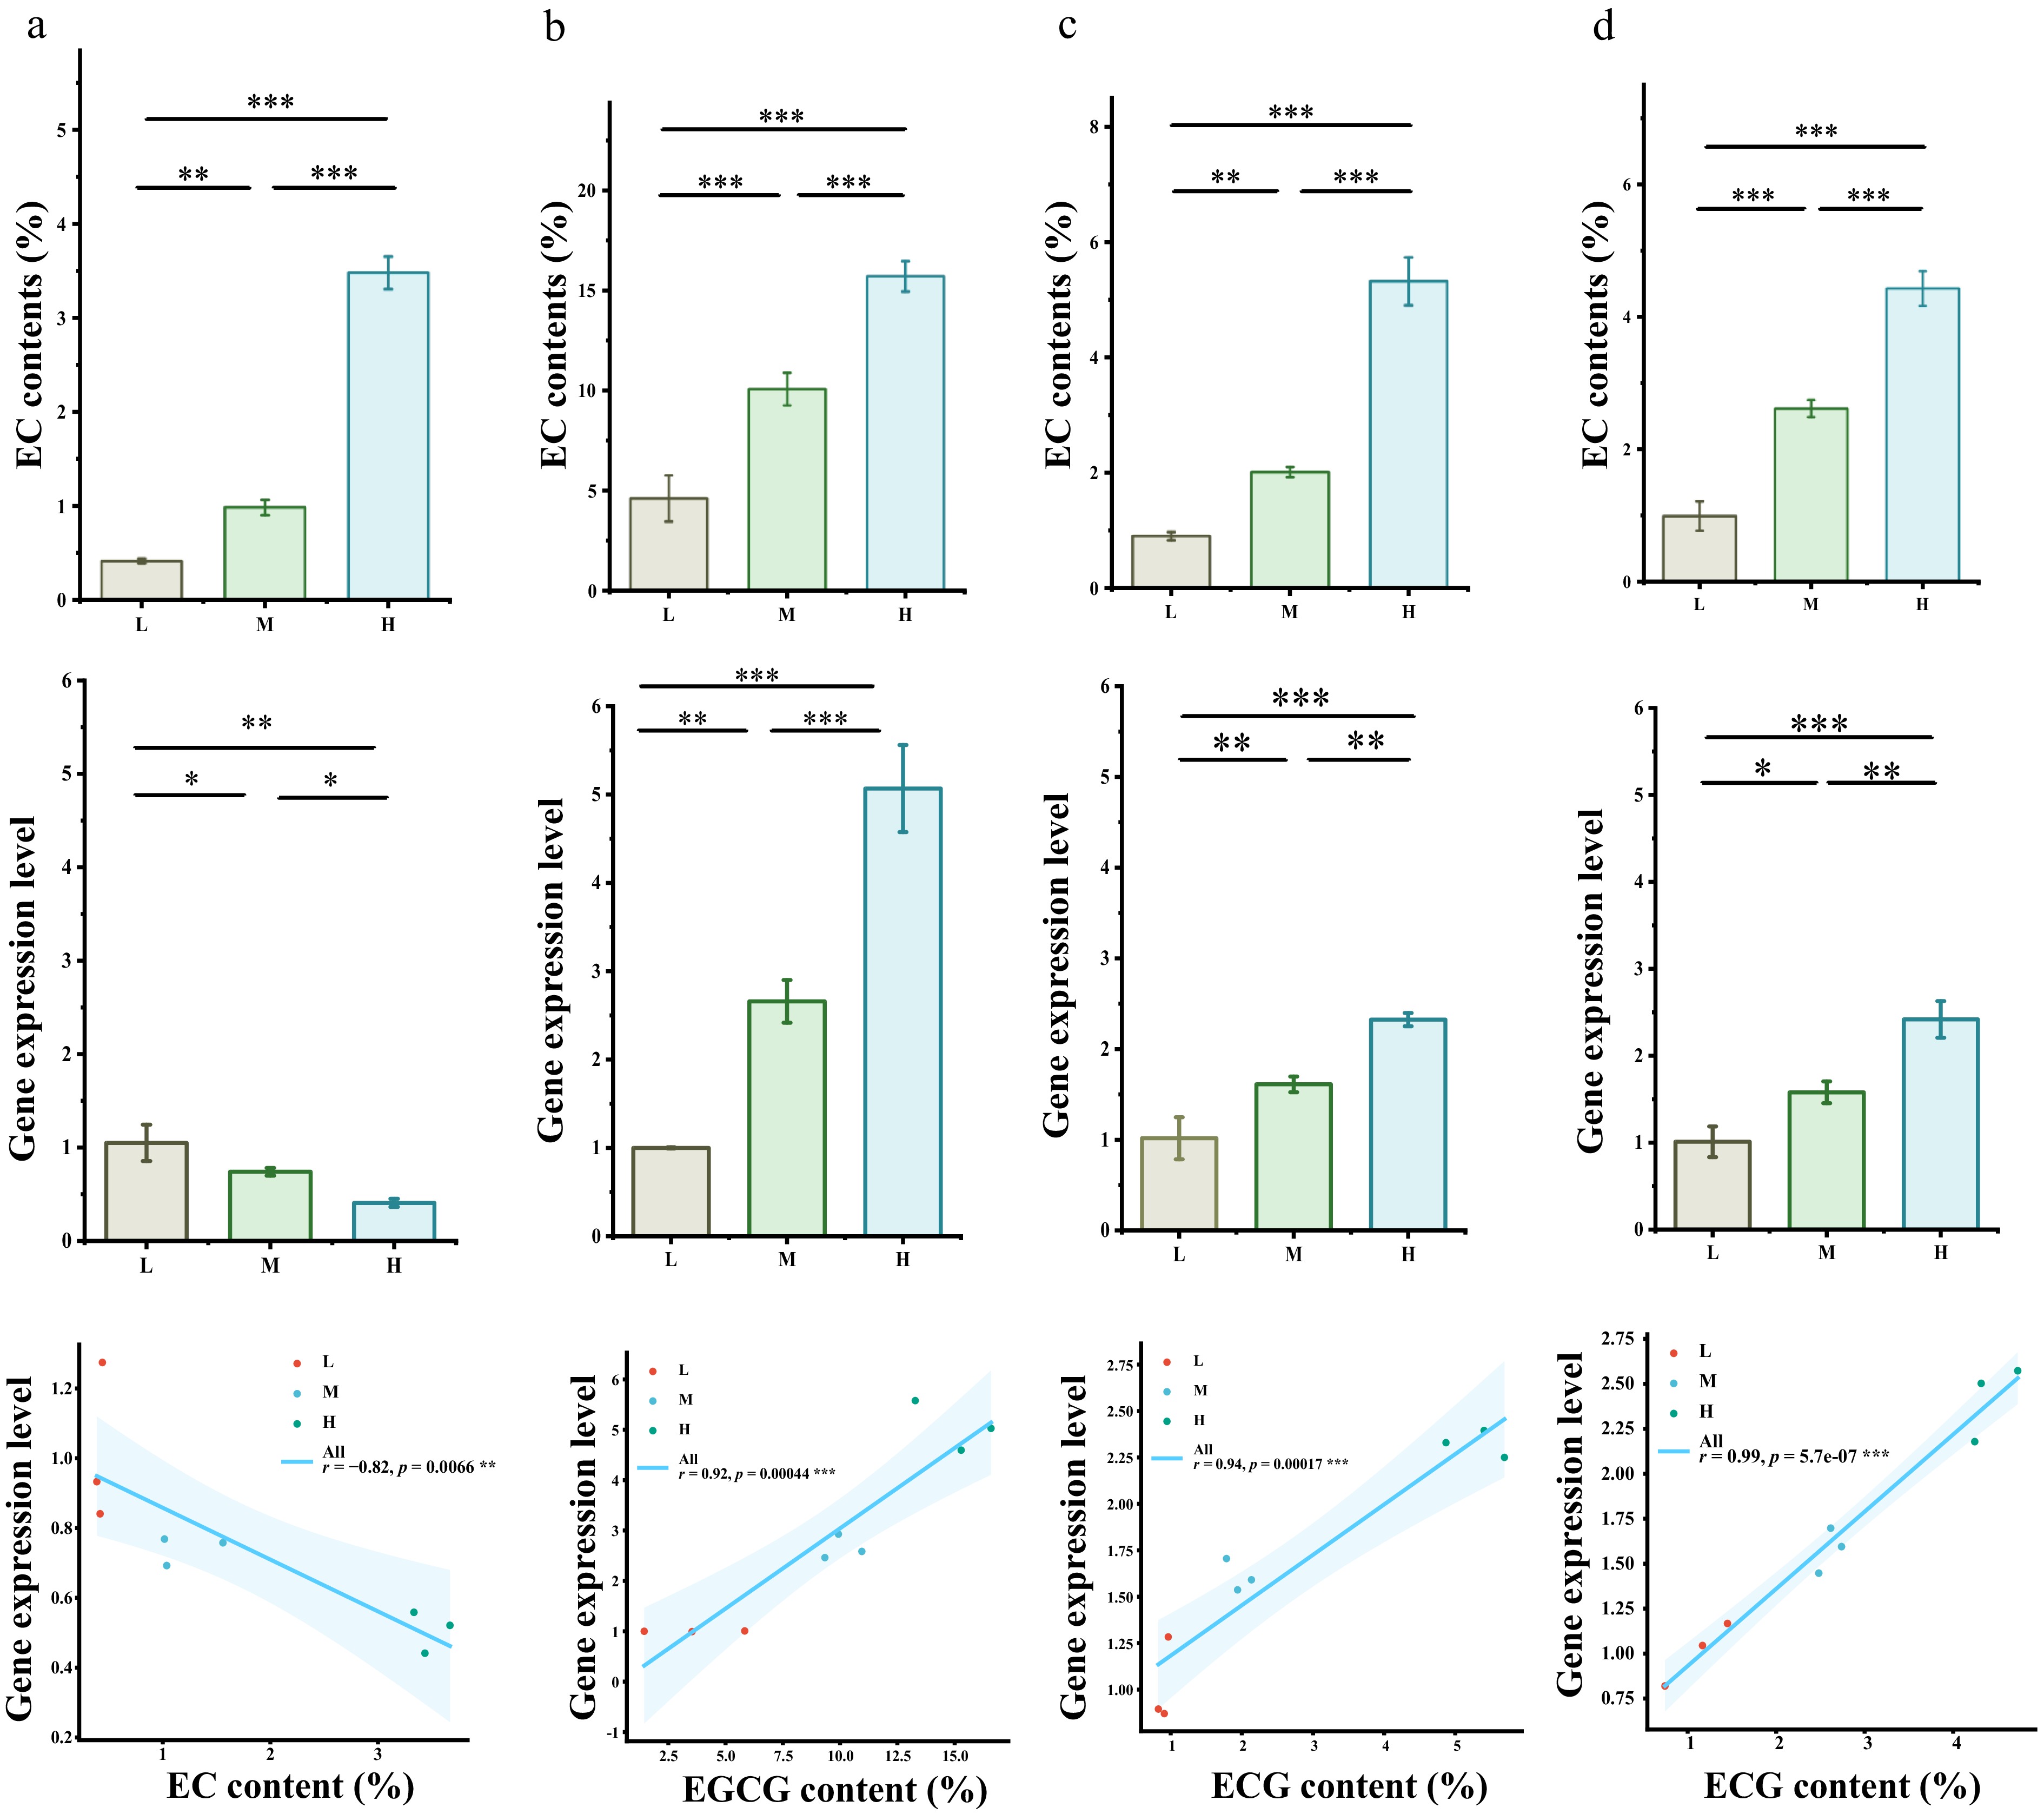
Figure 5.
RT-qPCR analysis of four candidate genes: (a) content of EC, expression level of TEA011262.1, and correlation analysis. “H” indicates high EC content: N564, N485, and N343; “M” indicates moderate EC content: M12, M14, and M5; and “L” indicates low EC content: M93, M27, and M78. (b) Content of EGCG, expression level of TEA000116.1, and correlation analysis. “H” indicates high EGCG content: N145, N149, and N143; “M” indicates moderate EGCG content: N465, M24, and N572; and “L“ indicates low EGCG content: N343, M12, and M77. (c) Content of ECG, expression level of TEA023243.1, and correlation analysis. “H“ was high: N546, M77, and N560; “M“ was medium: N143, N474, and M24; and “L“ was low: M91, M27, and M93. (d) Content of EGC, expression level of TEA026236.1, and correlation analysis. “H“ was high: M48, M95, and N343; “M“ was medium: N143, N465, and M39; and “L“ was low: N564, M18, and M93. ***, **, and * indicate statistically significant differences at p < 0.001, p < 0.01, and p < 0.05, respectively.
-
The tea plant is an economically crucial leaf-harvested crop, whose young leaves are rich in catechin compounds. The highest catechin content is typically found in the one-bud-and-two-leaves stage, and it gradually decreases as leaves mature. Eight major catechin monomers have been identified in tea leaves: C, GC, EGC, EC, EGCG, CG, GCG, and ECG[30,31]. Interestingly, CG was barely detected in these 329 samples. Consistent with previous studies, these findings suggest that CG is not a stable end product in fresh tea leaves, but rather is transformed from other catechins during processing. This reflects the dynamic nature of catechin synthesis and conversion pathways within the tea plant[32,33].
In this study, we found that the optimal GWAS models varied markedly across different catechin components. GA performed best under the GLM-P model, suggesting that it may be controlled by a few major-effect genes and that correcting for population structure via PCA alone is sufficient for effective detection of associated loci[34]. GC, EGC, and GCG were best fitted by the CMLM-P+K model, indicating that they are substantially influenced by a polygenic background and require simultaneous correction for both population structure and kinship. C, EC, and EGCG were best fitted by the MLM-Q+K model, implying that their phenotypic variation is not only governed by multiple genes but also significantly correlated with population stratification; thus, both the covariate Q matrix and the kinship matrix K must be incorporated simultaneously to effectively control false positives. ECG was best fitted by the MLM-P+K model, for which the major-effect locus signals are relatively clear, and replacing the fixed-effect Q matrix with PCA is sufficient to adequately correct for population structure[35,36].
The 329 tea tree populations exhibited a half-distance of 13.1 kb at r2 = 0.36. Compared with model plants such as Arabidopsis thaliana, which have extremely short LD (< 10 kb)[37], this value falls within an intermediate range, suggesting that tea trees, as perennial woody crops, may have maintained a relatively substantial effective population size during domestication. However, differentiation between subpopulations was markedly pronounced. Subpopulations GP4 and GP3 exhibited the slowest LD decay, demonstrating the strongest persistence of linkage disequilibrium. We identified GP3 as predominantly comprising artificially domesticated C. sinensis, hypothesizing that this likely reflects GP3 representing germplasm collections subjected to intense artificial selection or severe genetic bottlenecks. Notably, GP4 is the smallest population genetically, comprising solely C. remotiserrata. It may represent core breeding material derived from a very small number of superior individuals. GP6 and GP5 exhibit the fastest LD decay, maintaining larger effective population sizes with weaker genetic drift. Less influenced by intense artificial selection, their long evolutionary history has allowed recombination to sufficiently break LD, rendering them closer to wild or local germplasm resources[38], consistent with our population analysis. LD structure reflects parental genetic backgrounds. Crossbreeding populations with strong LD (GP4) and weak LD (GP6) may yield greater genetic complementarity and hybrid vigor.
Modern genomics approaches have significantly accelerated traditional breeding processes. Despite demonstrating immense potential, the overall progress in tea plant molecular breeding remains constrained by a paucity of key genomic resources and genetic tools. Therefore, genetic approaches, such as GWAS, are essential for accelerating variety improvement and supporting the sustainable development of the tea industry. Konwar et al.[39] analyzed the association between markers for 13 quality-related metabolites and corresponding traits in 160 tea germplasm accessions. Using a GWAS approach, they identified candidate genes associated with catechin derivatives, including MYB transcription factors, serine carboxypeptidases, and chalcone isomerases. Kong et al.[40] conducted a GWAS on 1,562 metabolites from young tea leaves and identified the following three transcription factors that influence the synthesis of (−)-epicatechin: MYB36, bHLH62, and NY-YB. These candidate genes can be used for marker-assisted selection, thereby accelerating the breeding of tea plants with desirable traits. Wang et al.[41] analyzed SNP and metabolite data from 320 tea germplasm resources. GWAS identified 439 significant SNP loci associated with four types of catechins (EC, ECG, EGC, and EGCG). Wang et al.[42] mapped the major-effect QTL qGCI6.2 in the “Longjing 43” × “Baihaozao” F1 population and identified CsSDH3 and CsSDH4 as shikimate dehydrogenases that catalyze the conversion of 3-dehydroshikimate acid (3-DHS) into GA, thereby promoting the synthesis of galloylated catechins. Using a multimodel genome-wide association analysis, we identified 48 loci in the tea genome that were significantly associated with catechin and GA content and predicted 13 candidate genes. Among these loci, C/T transitions occurred more frequently than C/G transitions, consistent with previous findings[3]. Notably, we identified the S6_43615287 locus as associated with two metabolites (GA and ECG), suggesting potential pleiotropic effects. In tea plants, the biosynthesis of catechins is subject to significant pleiotropic regulation. CsMYB1 simultaneously regulates both tea downy hair development and EGCG/ECG synthesis[43], while CsF3'5'H controls the synthesis of multiple trihydroxy catechins, including EGC, EGCG, and GCG[44]. This suggests that catechin composition may be coordinately controlled by a small number of key regulatory genes, rather than being independently regulated by a large number of genes with minor effects. In breeding, such multifunctional loci can coordinate and optimize the supply of precursors and the synthesis of products, thereby achieving holistic improvement of metabolic pathways.
To further elucidate the regulatory mechanisms underlying catechin variation, we selected five functionally promising genes for expression validation: CsUGT73C2 (TEA000116.1), CsCCR2 (TEA026236.1), CsSUT5 (TEA011262.1), CsPAL (TEA023243.1), and CsF-box (TEA007496.1). UDP-glucosyltransferases (UGTs) promote glycoside formation by transferring sugar groups from donor molecules. TEA000116.1 is a UGT belonging to the uridine diphosphate-glucosyltransferase family, potentially exerting positive effects on biosynthetic pathways. In plants, glycosylation of flavonoids represents a crucial modification that significantly alters their stability and intracellular accumulation[45]. Our findings indicate that CsUGT73C2 expression has a strong positive correlation with EGCG accumulation. We have identified a CsUGT73C2 gene located 4.36 kb downstream of an EGCG-associated SNP. Konwar's[39] association analysis of catechins using an MLM also identified a UGT gene that plays a key role in catechin biosynthesis. Tyrosine deaminase catalyzes the nonoxidative deamination of tyrosine to form trans-cinnamic acid, directly controlling the carbon flux from the shikimate pathway to the benzenecarboxylic acid branch of the metabolic pathway. Studies indicate that elevated PAL expression induces downstream flavonoid synthesis genes, increases flavonoid and anthocyanin accumulation, and plays a key role in boosting catechin levels in tea plants[46,47]. We identified a phenylalanine ammonia-lyase gene located within 1 kb downstream of an ECG-associated SNP.
CCR2 belongs to the cinnamoyl-CoA reductase family, catalyzing the conversion of cinnamoyl-CoA to cinnamaldehyde. Located at a branching point in phenylpropanoid metabolism, it has been found to play a key role in regulating ketone-like metabolic pathways[48,49]. We have identified a CsCCR2 gene located 25.6 kb upstream of an EGC-associated SNP. Sucrose transporter 5 belongs to the major facilitator superfamily (MFS) and facilitates transmembrane transport of sucrose, transferring photosynthesized sucrose from the "source" (leaves) to the "sink" (other tissues)[50]. Sugar content increases with shoot and leaf maturation and aging, and it exhibits a negative correlation with fresh leaf tenderness in tea plants[51]. Sucrose constitutes the primary soluble sugar in tea plants, and studies indicate that in vitro sucrose treatment of tea plants leads to increased polyphenol content[52]. Through sequence alignment, AtSUC2 was found to be closely related to CsSUT5. In Arabidopsis, the deletion of AtSUC2 and AtSUC4 leads to sucrose accumulation in the shoot leaves and reduced sucrose content in the roots, severely affecting plant growth and development[53]. In our study, a CsSUT5 gene was identified as being located 9.2 kb downstream of an EC-associated SNP.
F-box proteins, as substrate-recognition subunits in the ubiquitin-dependent degradation pathway, regulate the proteolytic process of PAL through ubiquitination and degradation, thereby controlling phenylpropanoid metabolism via posttranslational modification[54]. The CsF-box gene is located within 38.1 kb upstream of the SNP associated with the EC trait. Notably, not all candidate genes exhibit expression patterns closely correlated with phenotypes. The gene TEA007496.1, encoding an F-box protein, showed no discernible expression pattern across materials with varying EC content.
The association between SNPs and gene expression is primarily manifested by their presence in the DNA sequence. SNPs can also be found in various genomic regions, including coding regions, introns and regulatory regions, and ultimately influence gene expression by modulating the functions of these regions. The biosynthesis of secondary metabolites (such as plant-derived anthocyanins, alkaloids, and terpenoids) is governed by a complex metabolic network comprising enzyme systems encoded by multiple genes and transcriptional regulatory factors. The regulation of this network by SNPs can be summarized at three core levels: first, by directly acting on the biosynthetic pathway through altering the structure or activity of key enzymes; second, by indirectly regulating pathway flux through the expression of transcription factors and their target genes; and third, by altering the dynamic homeostasis of the pathway through influencing feedback regulatory elements.
The present study identified 13 candidate genes associated with catechin content through GWAS, yet RT-qPCR validation was performed only on five genes exhibiting the strongest association signals and clear functional annotations. Notably, CsF-box displayed no significant correlation across high, medium, and low-catechin accessions, suggesting that although the gene is located within the association region, it may not be the gene responsible for the EC variant itself. Its genetic signal may originate from other regulatory elements in the vicinity. This also suggests that candidate genes predicted based on GWAS require preliminary screening and prioritization through the critical layer of expression patterns. This approach allows research resources to be focused on the most promising targets.
Although none of these 13 candidate genes encodes the classic R2R3-MYB or WRKY transcription factors that directly regulate the biosynthesis of flavonoids, TEA007496.1 and TEA019082.1 likely regulate the metabolic flux indirectly in the phenylpropanoid pathway by modulating cellular redox status and developmental programs. In plants, redox signaling and cellular transport determine the synthesis of secondary metabolites in advance and coordinate it[55,56]. Most of the enzymes encoded by our candidate genes catalyze key reactions or branching points within or upstream of the catechin metabolic pathway. The transporters TEA026827.1, TEA011262.1, and TEA020506.1 are likely to function at the most fundamental level, mediating the intracellular transport of catechins, their precursors, and carbon sources. This hierarchical structure suggests that the genetic architecture of catechin biosynthesis is not determined by independent genes, but is instead jointly regulated by coordination at the transcriptional, enzymatic, and transport levels.
The biosynthetic pathway of catechins involves multiple branching points, including the upstream hydroxylation branch (mediated by F3′H and F3′5′H) and the downstream galloylation branch (mediated by the SCPL acyltransferase)[57]. In this study, all strains of C. tachangensis exhibited a pattern of low EGCG and high ECG accumulation; however, the enzymatic or genetic basis for this difference remains unclear. To determine whether this chemical phenotype arises from differences in enzyme activity, substrate specificity, or transcriptional regulation, comparative enzymatic studies using recombinant proteins from C. sinensis and C. tachangensis, as well as stable transgenic or genome-editing approaches, are required. These studies represent important avenues for future research.
In summary, this study systematically revealed the complex regulatory network governing natural variation in tea catechin components through genome-wide association analysis and expression validation. These findings deepen our understanding of the formation mechanisms of tea catechin components. In the future, these genes may serve as valuable molecular marker resources to guide marker-assisted breeding for superior flavor qualities such as high EGCG and high ECG. Through polygenic aggregation breeding, it is anticipated that precise improvement of complex tea tree traits can be achieved, thereby cultivating novel tea tree varieties with distinctive flavors and superior quality. However, this study still has certain limitations. Although we have demonstrated associations between the genotypes and expression patterns of key candidate genes and the phenotype, the exact causal relationships still require further validation through functional experiments. Future studies could utilize VIGS gene silencing and transient overexpression techniques in C. sinensis to investigate the relationship between genetic variations and catechin composition, as well as heterologous expression methods to assess the influence of key genes on catechin levels.
-
Through a population analysis of 329 tea germplasm accessions, this study preliminarily elucidated the complex genetic architecture underlying the variation in catechins and gallic acid. Using a multimodel GWAS strategy, we consistently detected 48 significant SNP loci and successfully pinpointed 13 functional candidate genes. These genes are enriched in secondary metabolic pathways such as phenylpropanoid and shikimate biosynthesis, which not only validates the effectiveness of GWAS in dissecting complex traits in tea plants but also provides key gene targets for further unraveling the molecular regulatory network of catechin biosynthesis.
-
The authors confirm their contribution to the paper as follows: study conception and design: Niu S, Yang S, Xiong B; data collection: He L, Peng Q; analysis and interpretation of results: Yang S, Zhan X, Xiong B; draft manuscript preparation: Yang S, Xiong B, Song Q, Niu S. All authors reviewed the results and approved the final version of the manuscript.
-
The datasets generated and/or analyzed in the current study are available from the corresponding author upon reasonable request.
-
The authors declare that they have no conflict of interest.
-
accompanies this paper online at: https://doi.org/10.48130/bpr-0026-0036.
- Supplementary Table S1 329 tea germplasm resources information.
- Supplementary Table S2 Information on materials for RT-qPCR.
- Supplementary Table S3 SNP distribution on 15 chromosomes.
- Supplementary Table S4 The group information of each accession.
- Supplementary Table S5 Analysis of Fst differences among different inferred populations of tea plants.
- Supplementary Table S6 Description and statistics of catechin component content.
- Supplementary Table S7 Correlation analysis between tea catechin components.
- Supplementary Table S8 The optimal model of major catechin components traits of 329 tea accessions was used for SNPs analysis.
- Supplementary Fig. S1 Distribution map of SNPs in 329 accessions on 15 Chromosome.
- Supplementary Fig. S2 Box plot comparison of catechin components among the three tea groups.
- Supplementary Fig. S3 Comparison of Manhattan plots and QQ plots for catechin components and GA across six models.
- Supplementary Fig. S4 The content of EC, expression level of TEA007496.1and correlation analysis.
- Copyright: © 2026 by the author(s). Published by Maximum Academic Press, Fayetteville, GA. This article is an open access article distributed under Creative Commons Attribution License (CC BY 4.0), visit https://creativecommons.org/licenses/by/4.0/.
-
About this article
Cite this article
Yang S, He L, Peng Q, Zhan X, Song Q, et al. 2026. Dissecting the genetic architecture underlying catechin composition and galloylation in tea germplasm through genome-wide association analysis. Beverage Plant Research 6: e032 doi: 10.48130/bpr-0026-0036 

Dissecting the genetic architecture underlying catechin composition and galloylation in tea germplasm through genome-wide association analysis
- Received: 27 February 2026
- Revised: 28 June 2026
- Accepted: 29 June 2026
- Published online: 26 August 2026
Abstract: Catechins are the primary polyphenolic compounds determining tea leaf quality, nutritional value, and processing suitability. Despite considerable academic effort expended on elucidating catechin biosynthesis mechanisms, the genetic basis underlying the natural variations in catechin composition—particularly the differentiation mechanisms between galloylated and nongalloylated catechins—remains incompletely understood. This study employed genome-wide association study (GWAS) to analyze 329 tea germplasm samples spanning multiple Camellia species, aiming to elucidate the genetic basis of catechin composition. Through genotyping-by-sequencing, coupled with high-performance liquid chromatography metabolite profiling, we quantitatively determined eight major catechin components and gallic acid (GA), revealing significant phenotypic variation and unique association patterns among catechin monomers. The analysis of population structure, linkage disequilibrium, and genetic diversity indicates that this trait is determined by a complex genetic background shaped by extensive gene flow and balancing selection. Multimodel GWAS identified 48 single-nucleotide polymorphisms (SNPs) significantly associated with catechin traits, including strong loci specifically linked to GA-modified catechins such as epigallocatechin gallate and epicatechin gallate. Candidate gene analysis focused on 13 genes involved in phenylpropanoid metabolism, coumarin pathway activity, sugar transport, and flavonoid modification, indicating a synergistic regulatory mechanism between catechin biosynthesis and structural diversification. Expression profiling of representative candidate genes further confirmed their potential role in regulating catechin accumulation. These findings comprehensively elucidate the genetic regulatory mechanisms governing catechin composition in tea plants, providing valuable genetic resources for marker-assisted breeding aimed at quality improvement.