


-
Platform screen doors (PSDs) are critical safety equipment in metro systems, installed along platform edges to completely isolate platforms from tracks. To ensure operational safety, a gap must be maintained between PSDs and metro doors (Fig. 1). However, these gaps introduce new safety risks. For instance, when passengers' belongings become trapped between PSDs and metro doors, the consequences can range from operational delays to severe threats to passenger safety and property damage.
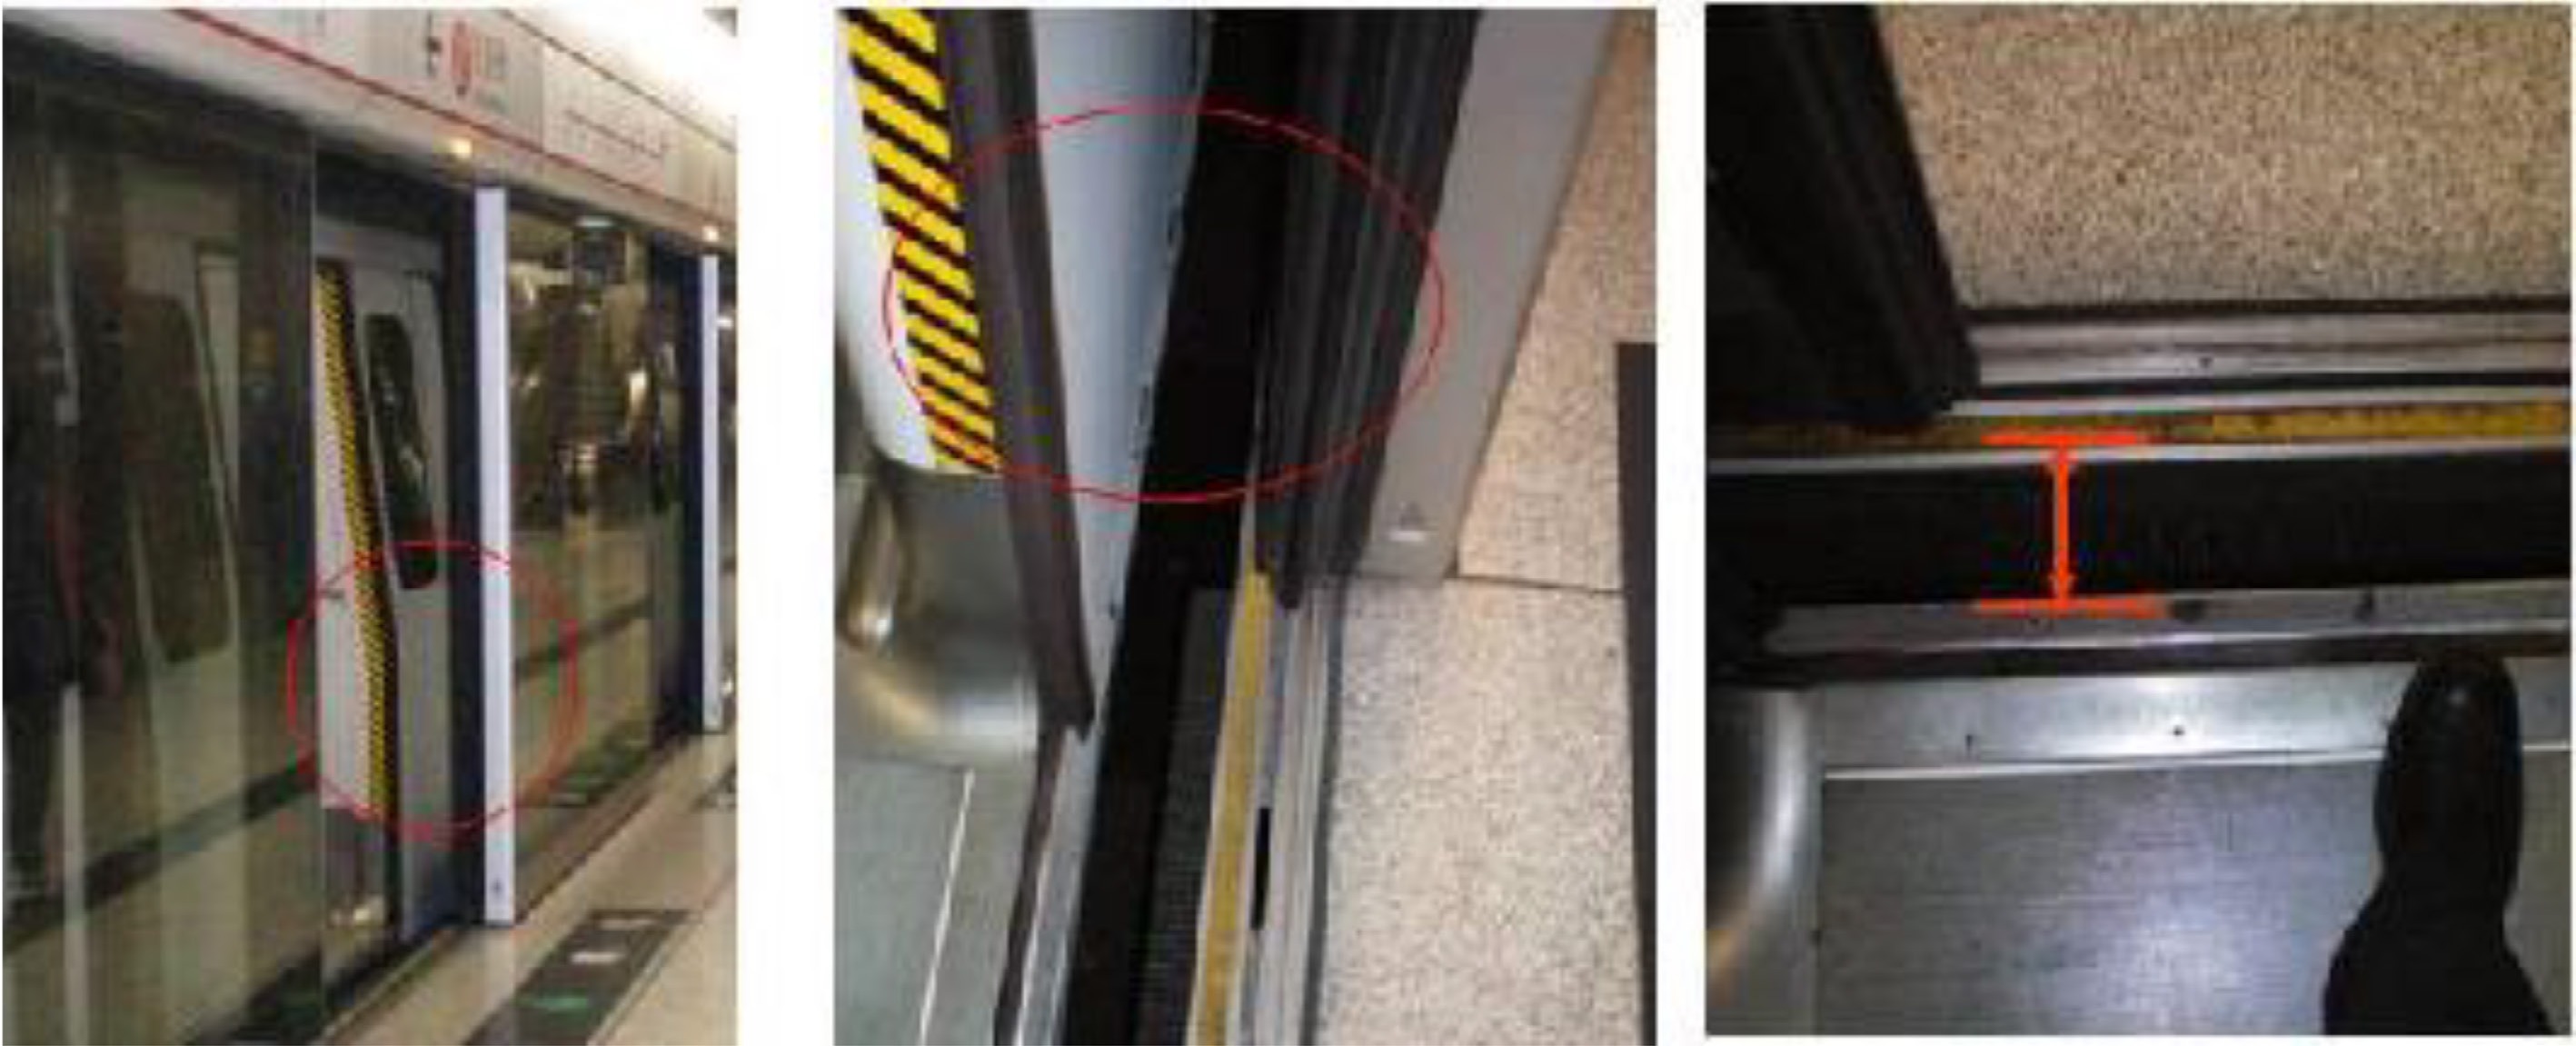
Figure 1.
Images of the gap between PSDs and metro doors.
For foreign object detection (FOD) in metro systems, current methods primarily rely on manual observation, which cannot effectively monitor long straight, and curved platforms. Automatic detection methods, mainly including laser detection[1], and infrared light curtain detection[2], are point and area detectors respectively, prone to false alarms due to vibration. Moreover, these methods have significant detection blind spots at stations with large gaps, compromising operational safety. Therefore, achieving accurate automatic detection of foreign objects between PSDs and metro doors are fundamental to building intelligent metro systems.
With the continuous advancement of computational capabilities, deep learning has demonstrated exceptional performance across various domains, including computer vision (image classification[3,4], object detection[5,6]), natural language processing (sentiment analysis[7,8], relation extraction[9]), and other fields[10,11]. Deep learning-based object detection, which automatically extracts feature representations through neural networks to improve efficiency has become one of the most widely applied artificial intelligence technologies in real-world applications.
Several studies have attempted to apply deep learning to metro FOD. Specifically, Lan et al.[12], and Gao & Huang[13] employ basic convolutional neural networks trained on metro foreign object samples for detection. Liu et al.[14] and Dai et al.[15] developed a small-scale metro foreign objects dataset and compared various deep learning detection models, including YOLOv3[16], and CenterNet[17]. While these studies demonstrate the feasibility of deep learning approaches in metro FOD, their research still shows notable limitations. The analysis of metro system specificities is insufficient, failing to adequately address challenges such as low detection precision, high time consumption, and algorithm interpretability. Moreover, their experimental evaluations are limited by small datasets, preventing comprehensive validation of results. These studies primarily focus on large deep-learning models, that struggle to meet metro systems' real-time requirements even on high-performance platforms.
To address these limitations, this paper presents the following work: First, the specific challenges encountered in metro systems are analyzed. Second, representative deep learning-based object detection models are reviewed from recent years, including both large and lightweight models. Third, foreign object images are collected from actual metro stations to construct the first large-scale foreign objects dataset. Finally, comparative experiments are constructed with 36 models on the constructed dataset.
In summary, the main contributions of this paper are as follows:
(1) A systematic analysis of three critical challenges in metro FOD are presented: low detection precision, high computational cost, and limited algorithm interpretability. This analysis specifically addresses the complexities of metro environments and provides insights for future research directions.
(2) A comprehensive review of deep learning-based object detection models are conducted, including both large-scale and lightweight architectures. The review synthesizes recent advances from top conferences and journals, providing researchers with a clear understanding of current technological capabilities and limitations in metro FOD applications.
(3) The first large-scale metro foreign objects dataset is established, comprising 5,854 images from actual metro operations. This dataset serves as a benchmark platform for evaluating various deep learning-based detection algorithms in real-world metro scenarios, facilitating fair comparisons and practical assessments.
(4) Extensive experiments comparing 36 different models on the proposed dataset are carried out. The results demonstrate that lightweight neural networks often outperform larger models in metro FOD applications, challenging the 'bigger is better' assumption. These findings provide valuable guidance for selecting appropriate models in practical metro deployments.
-
Current mainstream object detection algorithms based on deep learning are categorized into two-stage and one-stage approaches, distinguished by their proposal generation strategy. Two-stage algorithms first generate candidate boxes before refining them for final detection. R-CNN marked a milestone in applying deep learning to object detection and exemplifies the two-stage approach. Subsequent improvements include Fast R-CNN[18], Faster R-CNN[19], FPN[20], and Mask R-CNN[21], which achieve higher detection accuracy but at the cost of computational speed.
In contrast, one-stage algorithms directly generate detection results from input images. YOLOv1[22], inspired by GoogleNet[23], pioneered this approach by utilizing cascaded smaller convolutional networks. While YOLOv1 significantly outperformed contemporary one-stage models in both accuracy and speed, it struggled with small object detection. Later developments, including SSD and YOLOv2−5[24−26], addressed these limitations. Recent research has shown promising applications of these models in rail safety. For instance, a study integrated YOLOv5 with risk assessment mechanisms for railway obstacle detection, demonstrating both high accuracy and practical applicability in varying lighting conditions[27].
Lightweight deep learning for object detection
-
To address the substantial computational demands of large deep learning models, researchers have developed lightweight alternatives suitable for mobile and resource-constrained environments. The MobileNet[28−30] and ShuffleNet[31,32] series represent significant achievements in this direction, substantially reducing computational requirements while maintaining acceptable accuracy.
MobileNetv1 introduced depth-wise separable convolutions, combining depth-wise and point-wise operations. MobileNetv2 and MobileNetv3 further optimized this architecture through linear bottlenecks, inverted residuals, and neural architecture search (NAS). Similarly, ShuffleNetv1 employed group convolution and channel shuffle operations to minimize model parameters while maintaining inference speed. ShuffleNetv2 established four key guidelines for lightweight model design, significantly influencing subsequent research. In resource-limited scenarios, these lightweight models often match or exceed the performance of their larger counterparts.
Applications in transportation systems
-
Deep learning models have demonstrated remarkable success across various domains, particularly in transportation safety. In metro systems, early applications utilized basic CNNs for foreign object detection. Dai et al.[15] advanced this field by creating a dataset of 984 images and evaluating various models including YOLOv3 and CenterNet. While these studies confirmed the feasibility of deep learning in metro FOD, they were limited by dataset size and computational constraints.
Recent developments have shown promising directions for practical implementation. For example, researchers have successfully integrated detection systems with risk assessment mechanisms in railway applications, addressing not only object detection but also threat evaluation and warning generation. Similar approaches could benefit metro systems, particularly in distinguishing between different types of foreign objects and their potential risks. Additionally, studies in related fields, such as the studies by Mao et al.[33,34] on communication systems and the research by Cha et al.[35] on structural defect detection, provides valuable insights for improving metro FOD systems.
-
The critical problems in metro FOD can be categorized as follows:
● PROB1: Detection uncertainty. Metro passengers carry diverse objects, many of which may not be represented in training datasets. This presents a significant challenge as the current deep learning methods typically assume all detectable classes are available during the training phase. The uncertainty and variety of potential foreign objects make it difficult to maintain robust detection performance in real-world scenarios.
● PROB2: Data constraints. Foreign object incidents are relatively rare events in metro operations, leading to two critical issues: (1) Data scarcity: The low occurrence rate of foreign object incidents make it difficult to collect sufficient real-world examples for training. (2) Class imbalance: The vast majority of operational data represents normal conditions, resulting in highly imbalanced datasets that can bias model performance.
● PROB3: Computational constraints. Most existing metro systems operate with limited computing resources. The computational devices installed in metro stations typically lack the processing power required to run complex deep-learning models efficiently, constraining the selection and deployment of detection algorithms.
Major challenges
-
The problems mentioned above lead to the following significant challenges:
● CH1: Low detection precision. Deep learning models require substantial labeled data for optimal performance. The scarcity of foreign object incidents (PROB2) and detection uncertainty (PROB1) directly impact the detection precision, making it difficult to achieve consistently high accuracy in real-world applications.
● CH2: High time consumption. Computing power is the engine of deep learning. Limited computational resources (PROB3) mean that larger deep learning models often require excessive processing time. This is particularly problematic in metro systems, where short departure intervals demand rapid detection to maintain operational efficiency.
● CH3: Algorithm interpretability. Deep learning algorithms often function as 'black boxes', making their decision-making processes difficult to understand and explain. This lack of interpretability is particularly concerning in metro systems, where safety-critical decisions affecting passengers' lives and property require high confidence and clear justification.
-
The data collection process was conducted under formal approval and strict supervision from Guangzhou Metro, with comprehensive safety protocols and privacy protection measures implemented throughout. All data collection activities were carried out exclusively during non-operational hours at metro stations. VGA cameras with a resolution of 640 × 480, mounted on metro doors as shown in Fig. 2a and b were utilized. The fixed camera positions ensured stable and clear image capture, producing high-quality data suitable for deep learning applications while minimizing operational disruption. During the collection, it was observed that external flashing red lights affected certain PSDs, resulting in two distinct lighting conditions for some doors, as illustrated in Fig. 2c and d. This natural variation in lighting conditions enhances the dataset's robustness for real-world applications. Throughout the entire process, from data collection to processing and storage, strict adherence to privacy protection protocols were maintained through careful scheduling and data anonymization procedures, ensuring full compliance with metro operation standards and regulations.
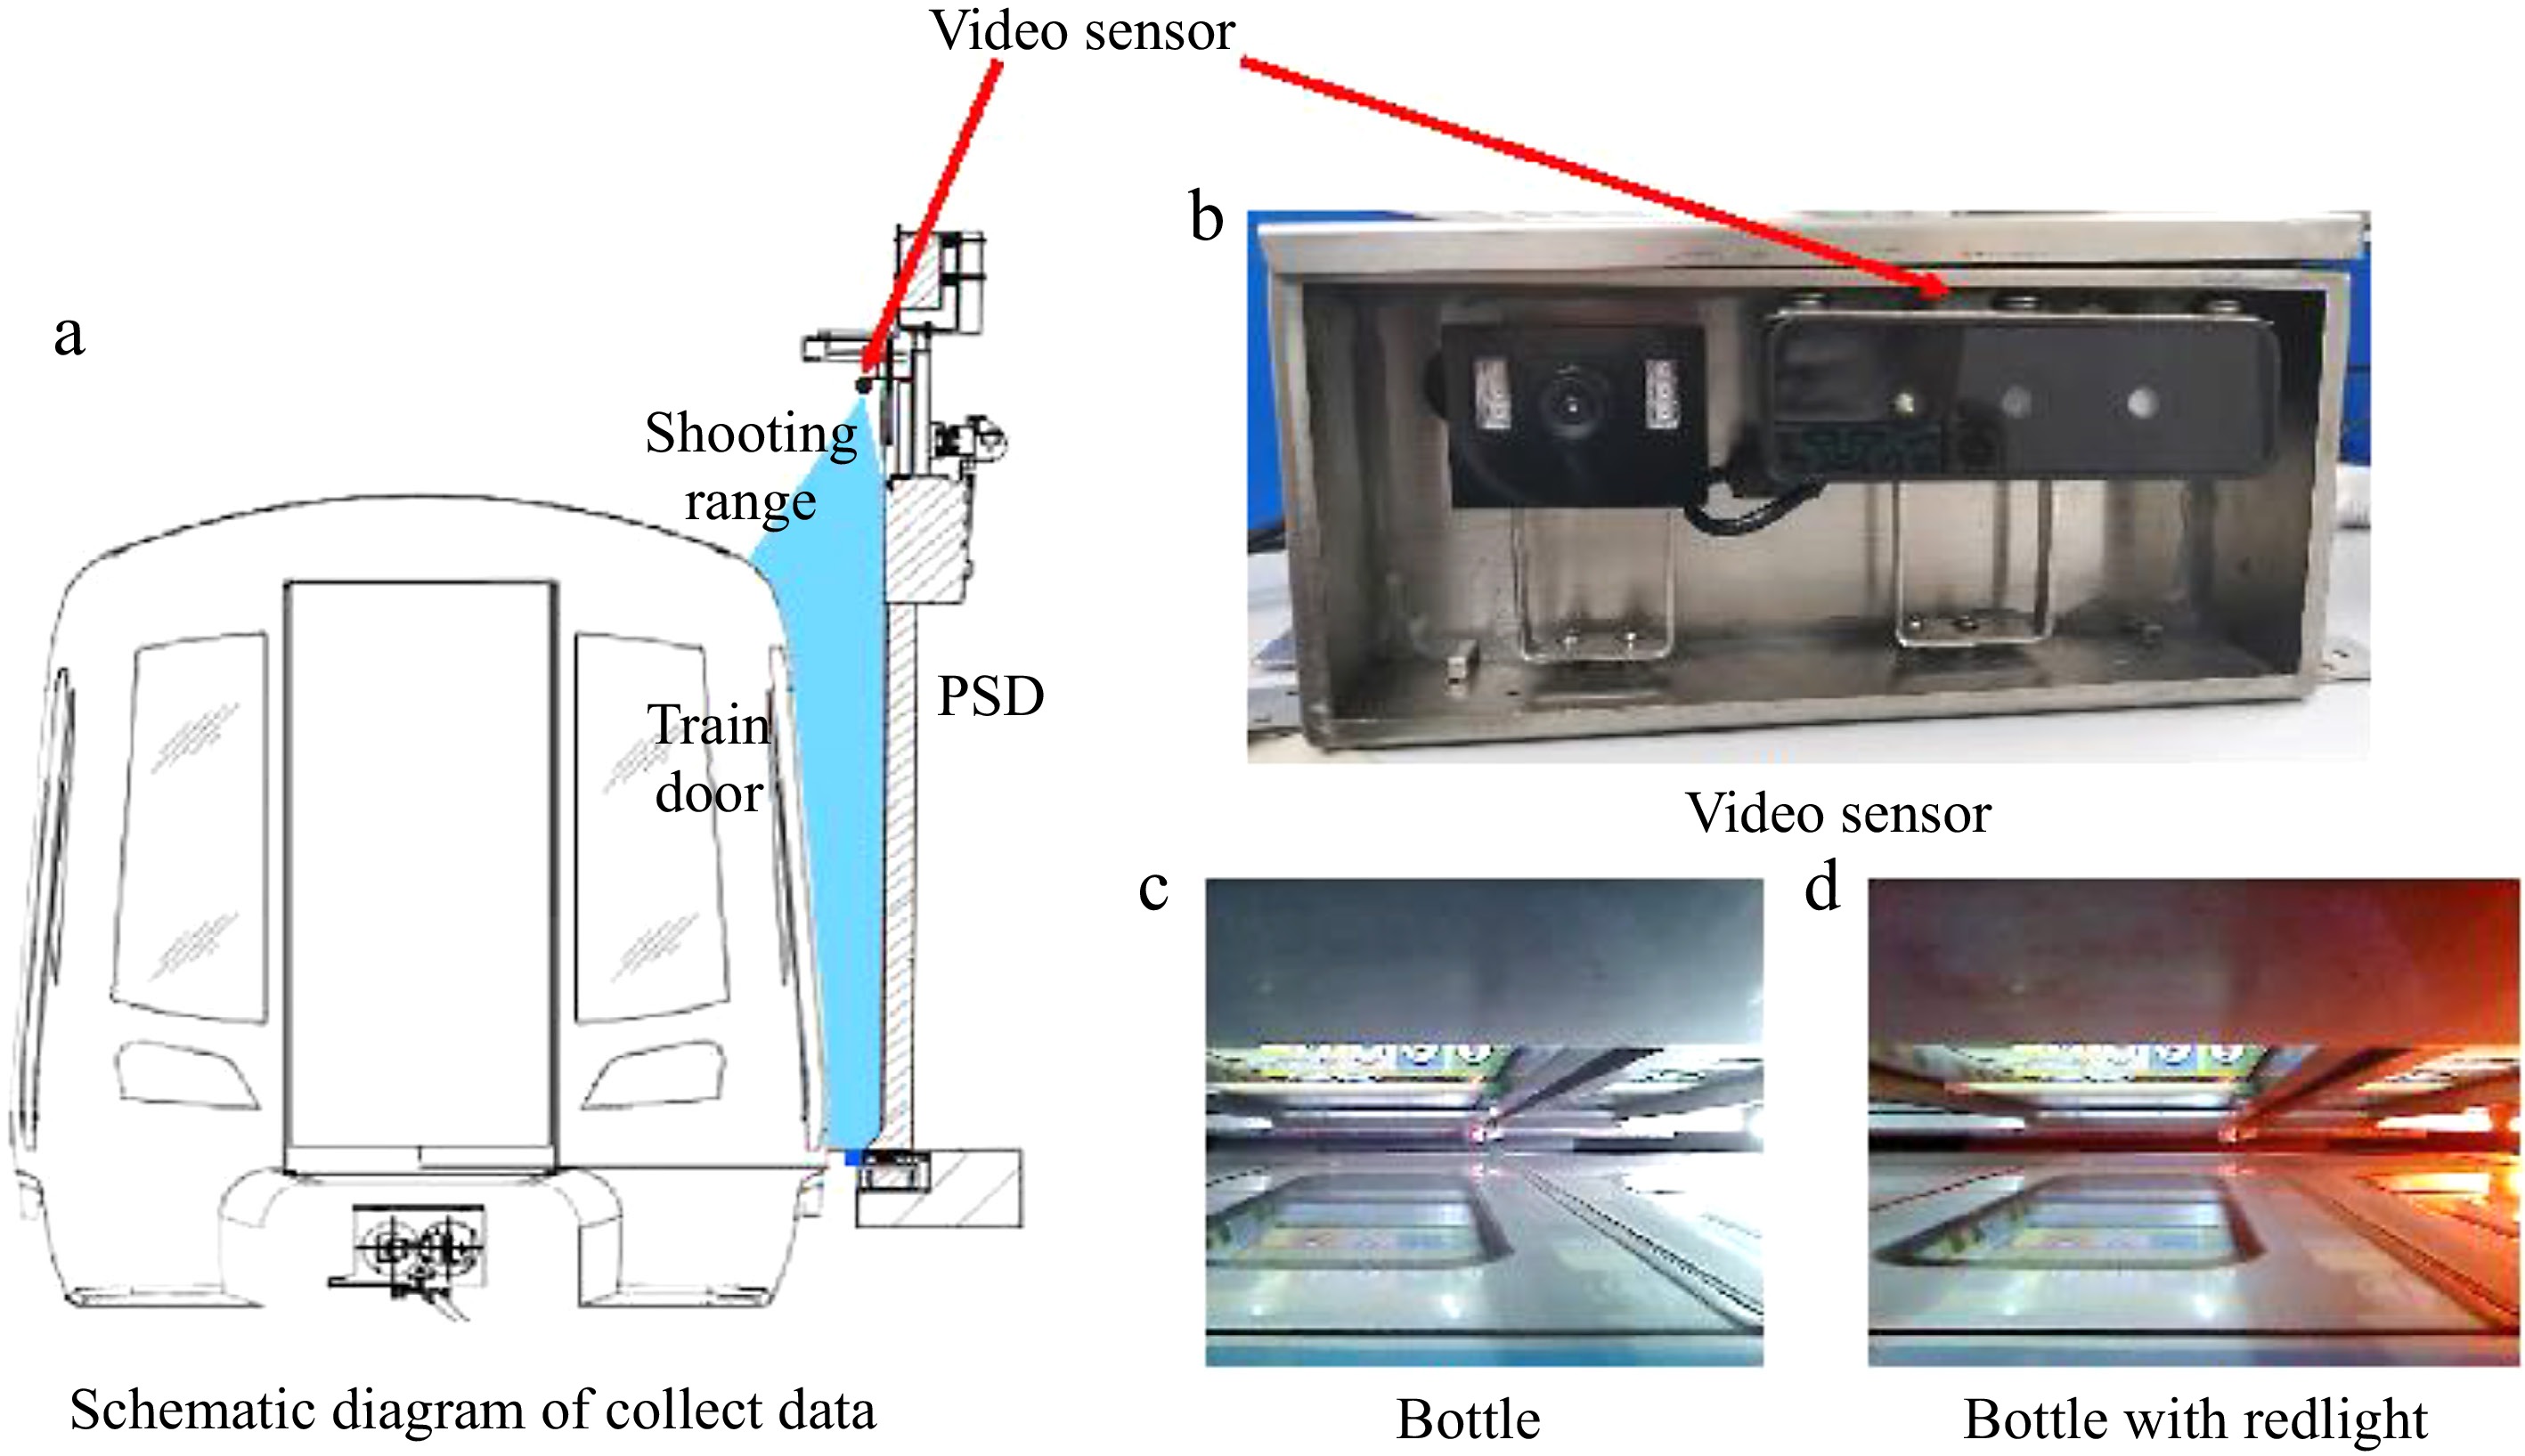
Figure 2.
Schematic diagram of data collection and sample images.
Object categories and annotation
-
Through comprehensive analysis of metro operation incidents and safety considerations, 15 distinct categories of foreign objects were established. These categories encompass safety-related items such as ropes and cords (representing different sizes of children's anti-loss tethers), and common passenger belongings including various types of bags (schoolbags, plastic bags, shoulder bags), personal items (wallets, cellphones, bottles, umbrellas), and containers (boxes, cardboard). For safety considerations, simulated objects in certain cases, were used such as wigs instead of actual caught hair. The dataset also includes special categories for person detection, normal conditions, and an 'others' category for objects that proved unidentifiable during the labeling process.
The final dataset comprises 5,854 images containing 5,935 annotated objects, following the PASCAL VOC[36] annotation format. An 80−20 split for the dataset was employed, with 80% allocated for training and validation, and the remaining 20% reserved for testing. Table 1 provides detailed statistics of the dataset distribution. To facilitate future research and development in metro safety systems, the plan is to make this dataset available to the research community, following appropriate data privacy and security protocols.
Table 1. The statistics of the current dataset.
Foreign object categories Training and validation Testing Total Rope 472 123 595 Cord 363 96 509 Wig 19 5 24 School bag 70 19 89 Plastic bag 507 121 628 Box 72 15 87 Shoulder bag 292 66 358 Wallet 549 136 690 Cell phone 491 134 625 Bottle 722 206 928 Umbrella 79 15 94 Person 87 10 97 Others 53 12 65 Normal 510 124 634 Cardboard 362 100 512 Total 4748 1187 5935 -
This section reviews key object detection models evaluated in the present study, focusing on their architectural innovations and practical implications for metro FOD applications.
SSD
-
SSD performs detection across six multi-scale feature maps, with low-level maps targeting small objects and high-level maps for larger ones. It employs varied-size default boxes at each feature map pixel, complemented by zoom-in and zoom-out data augmentation. While this approach improves robustness to scale variations, the independent processing of feature maps can lead to redundant detections. SSDLite enhances efficiency by replacing standard convolutions with depthwise separable ones, making it more suitable for resource-constrained environments.
YOLO family
-
YOLOv3 introduced the Darknet-53 backbone, utilizing 3 × 3 and 1 × 1 convolutions to achieve ResNet-152-comparable[38] accuracy with reduced computational cost. Its three-scale feature map fusion and logistic regression-based multi-label detection capability marked significant improvements. YOLOv3-SPP enhanced feature representation through spatial pyramid pooling (SPP)[39], while YOLOv3-Tiny offered a lightweight alternative with two prediction branches (Fig. 3).
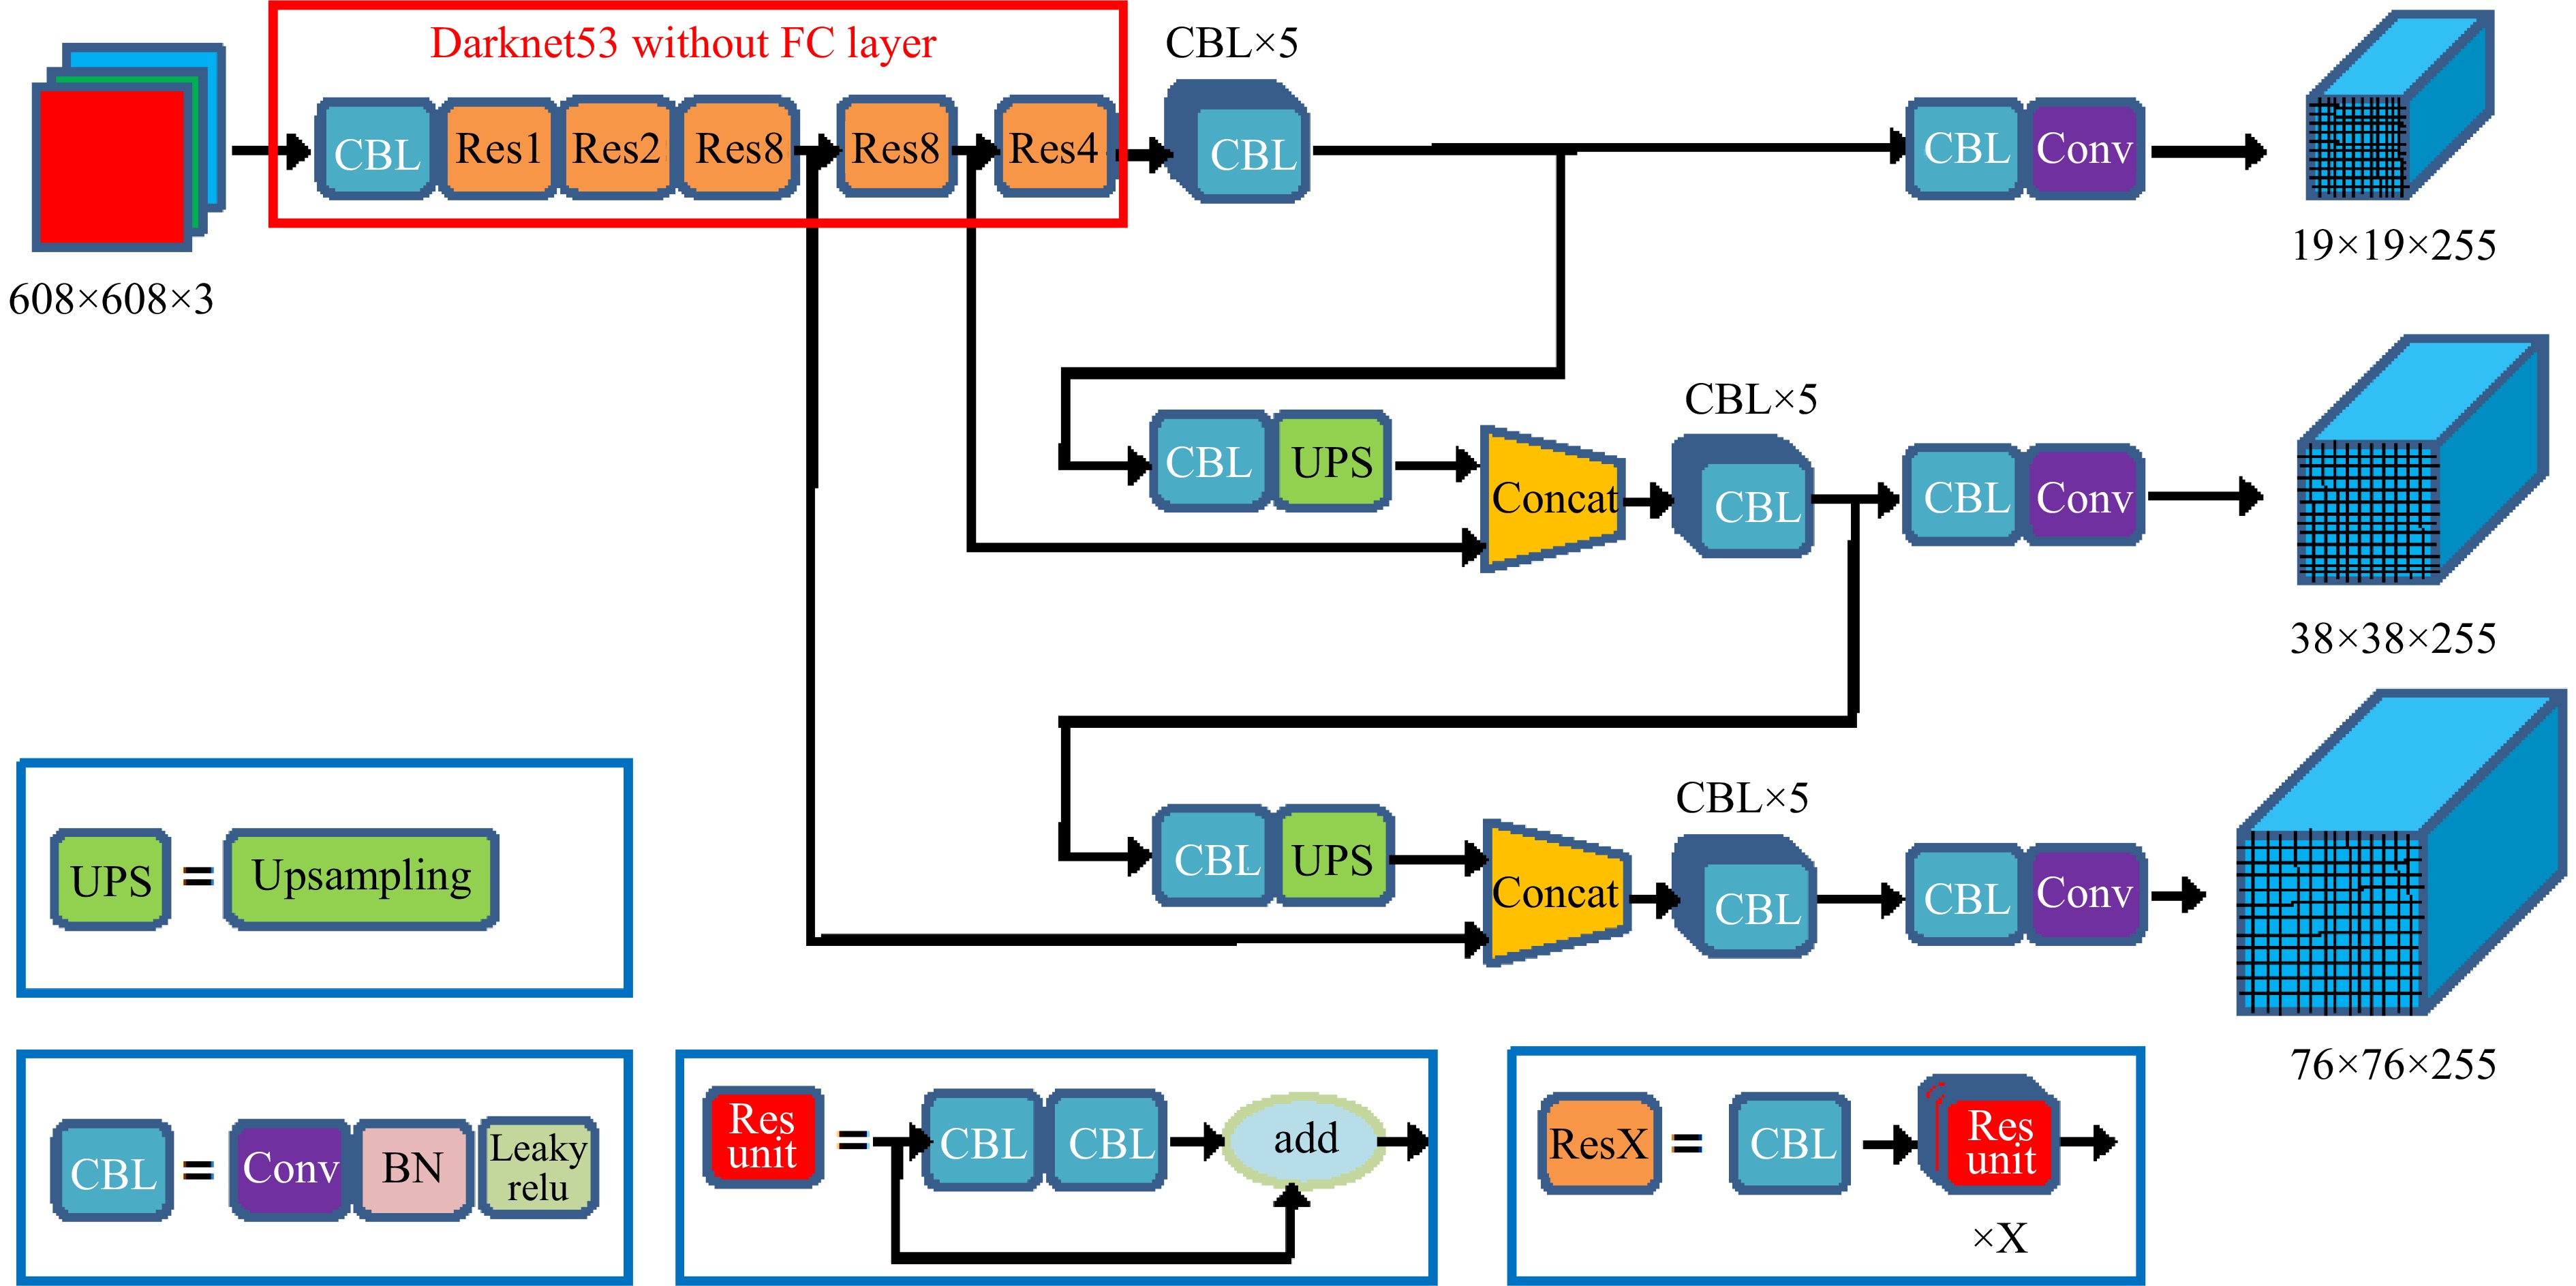
Figure 3.
Network architecture[37] of YOLOv3.
YOLOv4 advanced the architecture through enhanced data augmentation techniques including mosaic[40], cross mini-batch normalization (CmBN), and self adversarial training (SAT), while implementing the CSPDarknet-53 backbone with mish-activation[41]. It also introduced improved feature aggregation through SPP, feature pyramid network (FPN), and path aggregation network (PAN)[42] structures, along with refined loss functions using CIoU loss[43] and DIoU NMS. Following this, YOLOv5 further optimized performance through adaptive techniques in anchor calculation and image scaling, integrating focus structure with CSPNet principles. YOLOv5 offers multiple model variants for different scenarios, with YOLOv5-Lite utilizing a ShuffleNetv2 backbone for resource-constrained applications.
YOLOX[44] modernized the YOLO architecture by transitioning to anchor-free detection, implementing a decoupled head design, and adopting the SimOTA label assignment strategy. PPYOLOv1[45] and PPYOLOv2[46] focused on practical engineering deployment, emphasizing effective trick combinations and balancing accuracy with speed in industrial applications.
Lightweight architectures
-
GhostNet[47] introduced the innovative ghost module, generating feature maps through linear transformations of original inputs. This approach significantly reduced computational requirements while maintaining detection quality, making it particularly relevant for embedded applications in metro systems.
The MobileNet family evolved through three key iterations, with MobileNetV1 pioneering depthwise separable convolutions, MobileNetV2 introducing linear bottlenecks and inverted residuals, and MobileNetV3 integrating neural architecture search and optimized network structures.
The ShuffleNet series addressed efficiency through channel shuffle operations in ShuffleNetV1, later optimized in ShuffleNetV2 with improved channel split operations and reduced memory access cost (Fig. 4). These innovations significantly improved the balance between computational efficiency and detection accuracy.
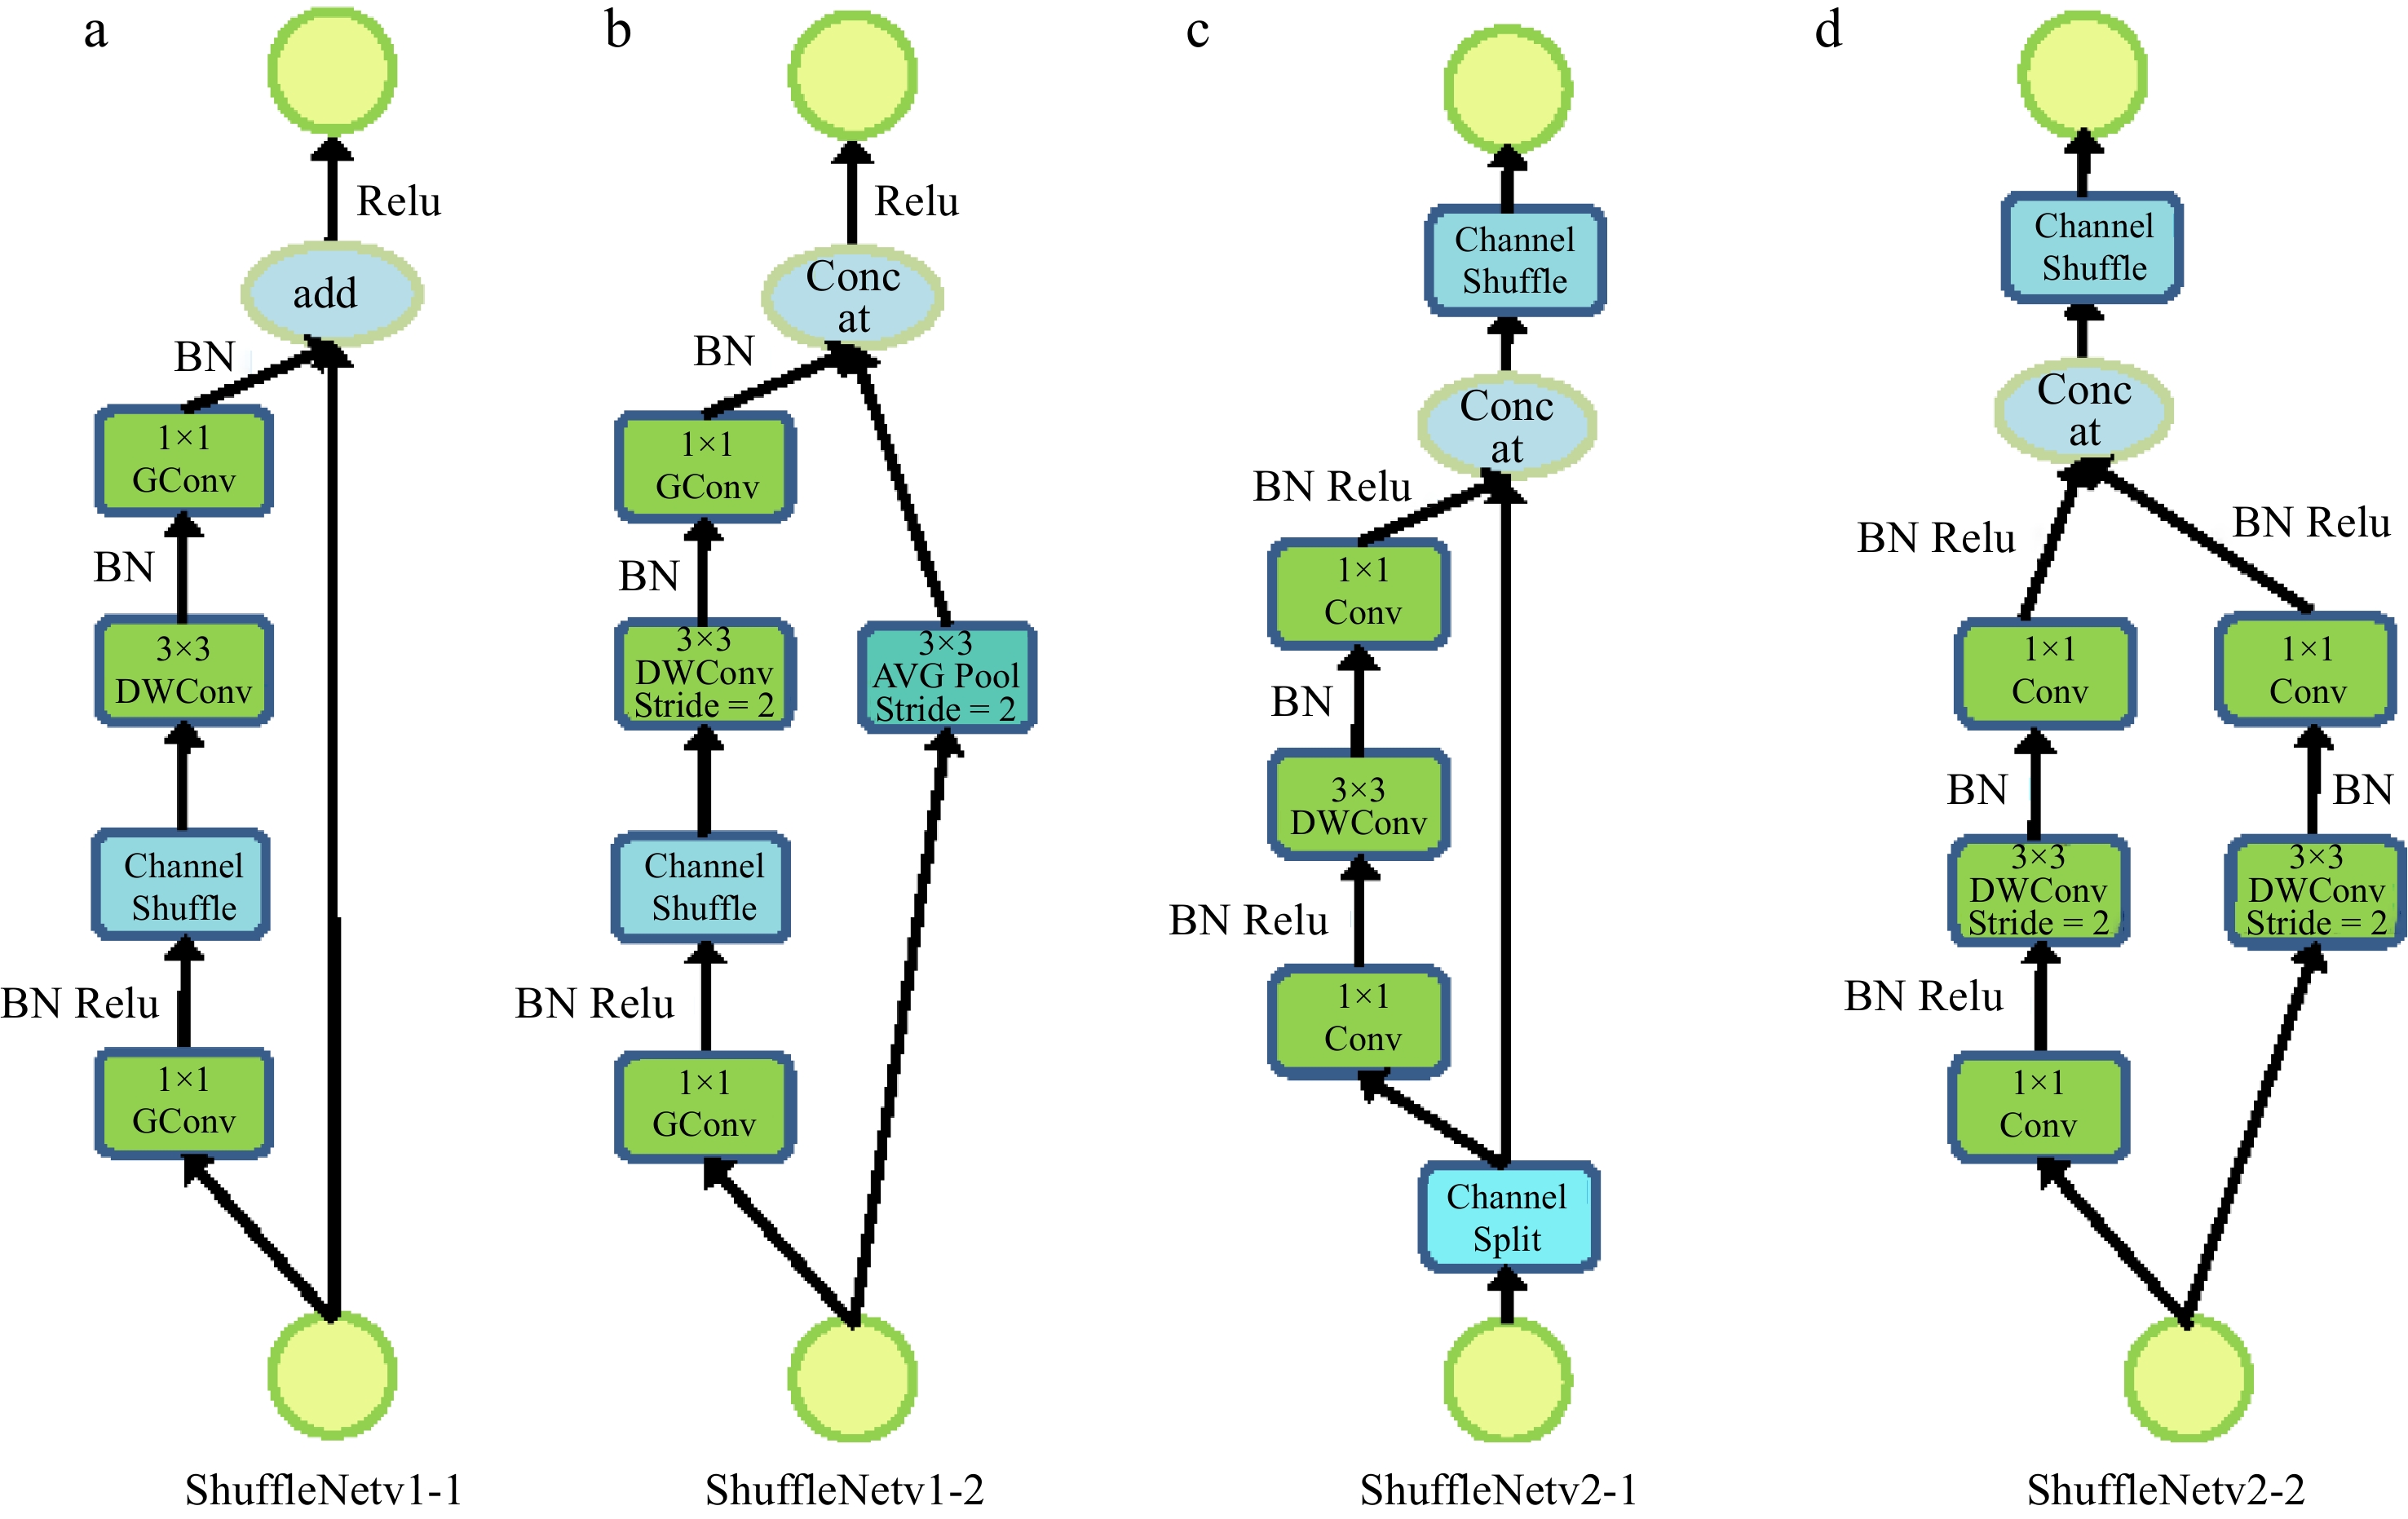
Figure 4.
Building blocks of ShuffleNetV1 and ShuffleNetV2.
-
Models were trained and tested on a server with AMD EPYC 7302 CPU, 64 GB DDR4 memory, and NVIDIA GeForce RTX 3090 GPU.
Evaluation metrics
-
The evaluation metrics in object detection mainly include accuracy, precision, recall, average precision (AP), mean average precision (mAP), and frame per second (FPS). In order to better describe these evaluation metrics, the following definitions are given:
- TP (True Positives): The number of samples that are predicted to be positive and are positive. That is the number of positive samples that are correctly identified.
- TN (True Negatives): The number of samples that are predicted to be negative and are negative. That is the number of negative samples that are correctly identified.
- FP (False Positives): The number of samples that are predicted to be positive and are negative. That is the number of negative samples that are incorrectly identified as positive samples.
- FN (False Negatives): The number of samples that are predicted to be negative and are positive. That is the number of positive samples that are incorrectly identified as negative samples.
Based on the above definition, we can more clearly define the evaluation metrics in object detection.
- Accuracy: The proportion of samples that are correctly predicted to the total test samples. Accuracy = (TP + TN)/N, where N = TP + TN + FP + FN
- Precision: The proportion of the predicted positive samples that are actually positive samples. Precision = TP/(TP + FP)
- Recall: The proportion of all positive samples that are correctly predicted as positive samples. Recall = TP/(TP + FN)
- F1: F1 is proposed based on Precision and Recall, which is used for the overall evaluation of Precision and Recall. F1 = 2PR/(P + R) = 2TP/(2TP + FP + FN)
- AP: The area under the Precision-Recall curve. The better the classification performance of the classifier, the higher the AP.
- mAP: Calculate the AP for each category first, and then calculate the average of AP. The value range of mAP is [0, 1], the larger the value, the better.
- FPS: FPS is a metric used to describe the detection speed. The higher the FPS of the model, the closer to real-time detection.
At present, the primary evaluation metrics used in object detection are mAP and FPS, so this paper's subsequent experimental results also mainly show these two evaluation metrics. In addition, the purpose of this paper is to explore which deep learning method is more suitable for metro systems with low computing power. Therefore, the model size is also an important metric.
Performance analysis
Precision
-
As mentioned previously, CH1: Low detection precision is a problem that cannot be ignored. It can be observed in Table 2 that the mAP of larger deep learning models is still in an advantageous position over lightweight neural networks. YOLOv5-x achieved the highest mAP, reaching 0.894. With the highest mAP, its FPS is 72 and the model size occupies 167 MB. The highest mAP in the lightweight neural networks also comes from the YOLO family, which is YOLOv5-s. Its mAP has reached 0.880, which is also at the upper-middle level among all compared models. As a lightweight neural network, its FPS reached 588, and it only occupies 13.7 MB of space.
Table 2. Experimental results on the present dataset.
Algorithms Backbone Size mAP@0.5 FPS Model size (MB) SSD VGG 300 × 300 0.859 126 97.7 YOLOv3 Darknet-53 640 × 640 0.889 213 117 YOLOv3 Darknet-53-SPP 640 × 640 0.879 208 119 YOLOv4 CSPDarknet53 with Mish activation 640 × 480 0.869 92 245 YOLOv4 Leaky-CSPDarknet53 with Leaky activation 640 × 480 0.876 93 245 YOLOv4 SAM-Leaky-CSPDarknet53 with Leaky activation-SAM 640 × 480 0.876 86 250 YOLOv4 Mish-CSPDarknet53 with Mish activation 640 × 480 0.867 92 245 YOLOv4 SAM-Mish-CSPDarknet53 with Mish activation-SAM 640 × 480 0.874 86 250 YOLOv5-m CSPDarknet-SPP 640 × 640 0.884 233 40.6 YOLOv5-l CSPDarknet-SPP 640 × 640 0.884 154 89.5 YOLOv5-x** CSPDarknet-SPP 640 × 640 0.894 72 167 YOLOX-m Modified CSP in YOLOv5 640 × 640 0.865 149 194 YOLOX-l Modified CSP in YOLOv5 640 × 640 0.868 105 364 YOLOX-x Modified CSP in YOLOv5 640 × 640 0.854 57 757 YOLOX-DarkNet53 Darknet-53 640 × 640 0.848 92 487 PPYOLOv1 ResNet18-vd 512 × 512 0.831 75 49.5 PPYOLOv1 ResNet50-vd-dcn 608 × 608 0.843 47 178 PPYOLOv2 ResNet50-vd-dcn 640 × 640 0.849 42 207 PPYOLOv2 ResNet101-vd-dcn 640 × 640 0.855 37 279 SSD MobileNetV1 300 × 300 0.819 157 22 SSDLite MobileNetV1 300 × 300 0.865 159 23 SSDLite MobileNetV3-Small 320 × 320 0.849 140 5.1 SSDLite MobileNetV3-Large 320 × 320 0.857 143 11 SSDLite GhostNet 320 × 320 0.868 142 23 YOLOv3 MobileNetV1 608 × 608 0.847 83 93 YOLOv3 MobileNetV3 608 × 608 0.854 80 89 YOLOv3-Tiny* Darknet-53 640 × 640 0.854 1667 16.6 YOLOv4-Tiny CSPDarknet-53 640 × 480 0.831 549 22.5 YOLOv5-s*** CSPDarknet-SPP 640 × 640 0.88 588 13.7 YOLOv5-Lite ShuffleNetv2 640 × 640 0.871 1250 3.3 YOLOX-s Modified CSP in YOLOv5 640 × 640 0.848 282 69 YOLOX-Tiny Modified CSP in YOLOv5 640 × 640 0.854 560 39 YOLOX-Nano Modified CSP in YOLOv5 640 × 640 0.84 804 7.3 PPYOLOv1 MobileNetV3-Small 320 × 320 0.856 147 9.9 PPYOLOv1 MobileNetV3-Large 320 × 320 0.865 148 18 PPYOLOv1 PPYOLO-Tiny 320 × 320 0.818 190 3.95 * Fastest, ** highest mAP, *** best one in comparison. To further explore what affects the mAP of the models, the F1 scores and PR values of YOLOv5-x and YOLOv5-s are provided in Table 3. It can be seen that these two algorithms perform unsatisfactorily in detecting cords, wigs, others, and normal. In the present analysis, this result may be due to the small number of samples in these four categories in the present dataset, so models cannot learn features satisfactorially during the training process. Returning to Table 1, the number of objects in the training and validation set of these four categories are 363, 19, 53, and 510 respectively. Furthermore, these four categories are unique to metro systems, unlike school bags, boxes, etc., which are also very small in the present dataset but are fully trained in the pre-trained model.
Table 3. PR values and F1 scores of YOLOv5-x, -s.
Class YOLOv5-x YOLOv5-s P R F1 mAP@0.5 mAP@0.5:0.95 P R F1 mAP@0.5 mAP@0.5:0.95 Rope 0.883 0.764 0.819 0.839 0.515 0.865 0.729 0.791 0.836 0.499 Cord 0.826 0.693 0.754 0.822 0.41 0.757 0.646 0.697 0.75 0.384 Wig 0.779 0.8 0.789 0.938 0.521 0.789 0.8 0.794 0.84 0.426 School bag 0.899 0.737 0.81 0.84 0.516 0.901 0.737 0.811 0.825 0.461 Plastic bag 0.972 0.967 0.969 0.979 0.695 0.967 0.977 0.972 0.97 0.68 Box 0.975 1 0.987 0.995 0.811 0.976 1 0.988 0.995 0.809 Shoulder bag 0.955 0.985 0.97 0.984 0.72 0.969 0.985 0.977 0.983 0.703 Wallet 0.874 0.887 0.88 0.912 0.452 0.903 0.924 0.913 0.906 0.479 Cell phone 0.989 0.963 0.976 0.987 0.561 0.962 0.957 0.959 0.962 0.556 Bottle 0.994 0.995 0.994 0.993 0.642 0.994 0.995 0.994 0.993 0.639 Umbrella 0.865 1 0.928 0.946 0.64 0.86 0.933 0.895 0.899 0.586 Person 0.896 1 0.945 0.995 0.942 0.964 1 0.982 0.995 0.902 Others 0.581 0.579 0.58 0.405 0.22 0.666 0.666 0.666 0.477 0.208 Normal 0.821 0.628 0.712 0.794 0.399 0.834 0.649 0.73 0.811 0.415 Cardboard 0.971 0.96 0.965 0.982 0.576 0.96 0.98 0.97 0.958 0.576 All 0.885 0.864 0.874 0.894 0.575 0.891 0.865 0.878 0.88 0.555 P: precision, R: recall, mAP@0.5:0.95: average mAP over different IoU thresholds, from 0.5 to 0.95, step 0.05 (0.5, 0.55, 0.6, 0.65, 0.7, 0.75, 0.8, 0.85, 0.9, 0.95). Speed
-
Similarly, CH2: High time-consuming is another looming issue. Experimental results (Table 2) show that lightweight neural networks have obvious advantages over larger deep learning models in terms of detection speed. In the present experiments, YOLOv3-Tiny showed an incredible detection speed, reaching 1667 FPS, the fastest algorithm. At the same time, its mAP reached 0.854, which is in the lower middle level among the compared algorithms. 1667 FPS means that YOLOv3-Tiny can realize real-time detection, and to a certain extent solves CH2: High time-consuming.
Another point worth noting is that although the FPS of the lightweight neural networks using the MobileNet and ShuffleNet series as the backbone has certain advantages over most large deep learning models, their performance is not in line with expectations (Table 2). After investigation, the results occurred because the MobileNet and ShuffleNet series did not reach the upper limit of the computational intensity when running on the GPU, and the speed of data exchange in memory became the bottleneck. On the contrary, these series can reach the upper limit when running on the CPU, so they will have more advantages on the CPU.
Interpretability
-
At the same time, it was noticed that all the algorithms explored in this paper ignore CH3: Interpretability of Algorithms, they only focus on detection speed and accuracy. These deep-learning-based algorithms are similar to black boxes, making them difficult to trust fully, especially in metro security operations involving passenger safety and property. Therefore, improving model interpretability while maintaining efficiency will be the focus of future research.
Practical deployment analysis
-
To determine the most suitable model for metro deployment, 13 representative algorithms were compared (Fig. 5). Using 30 FPS as the real-time detection standard, it is noted that while most models meet this threshold on RTX 3090, practical deployment considerations necessitate the evaluation of more cost-effective hardware. Based on the TFLOPS ratio analysis, RTX 2070 is recommended for actual deployment, considering power consumption, price, and performance requirements.
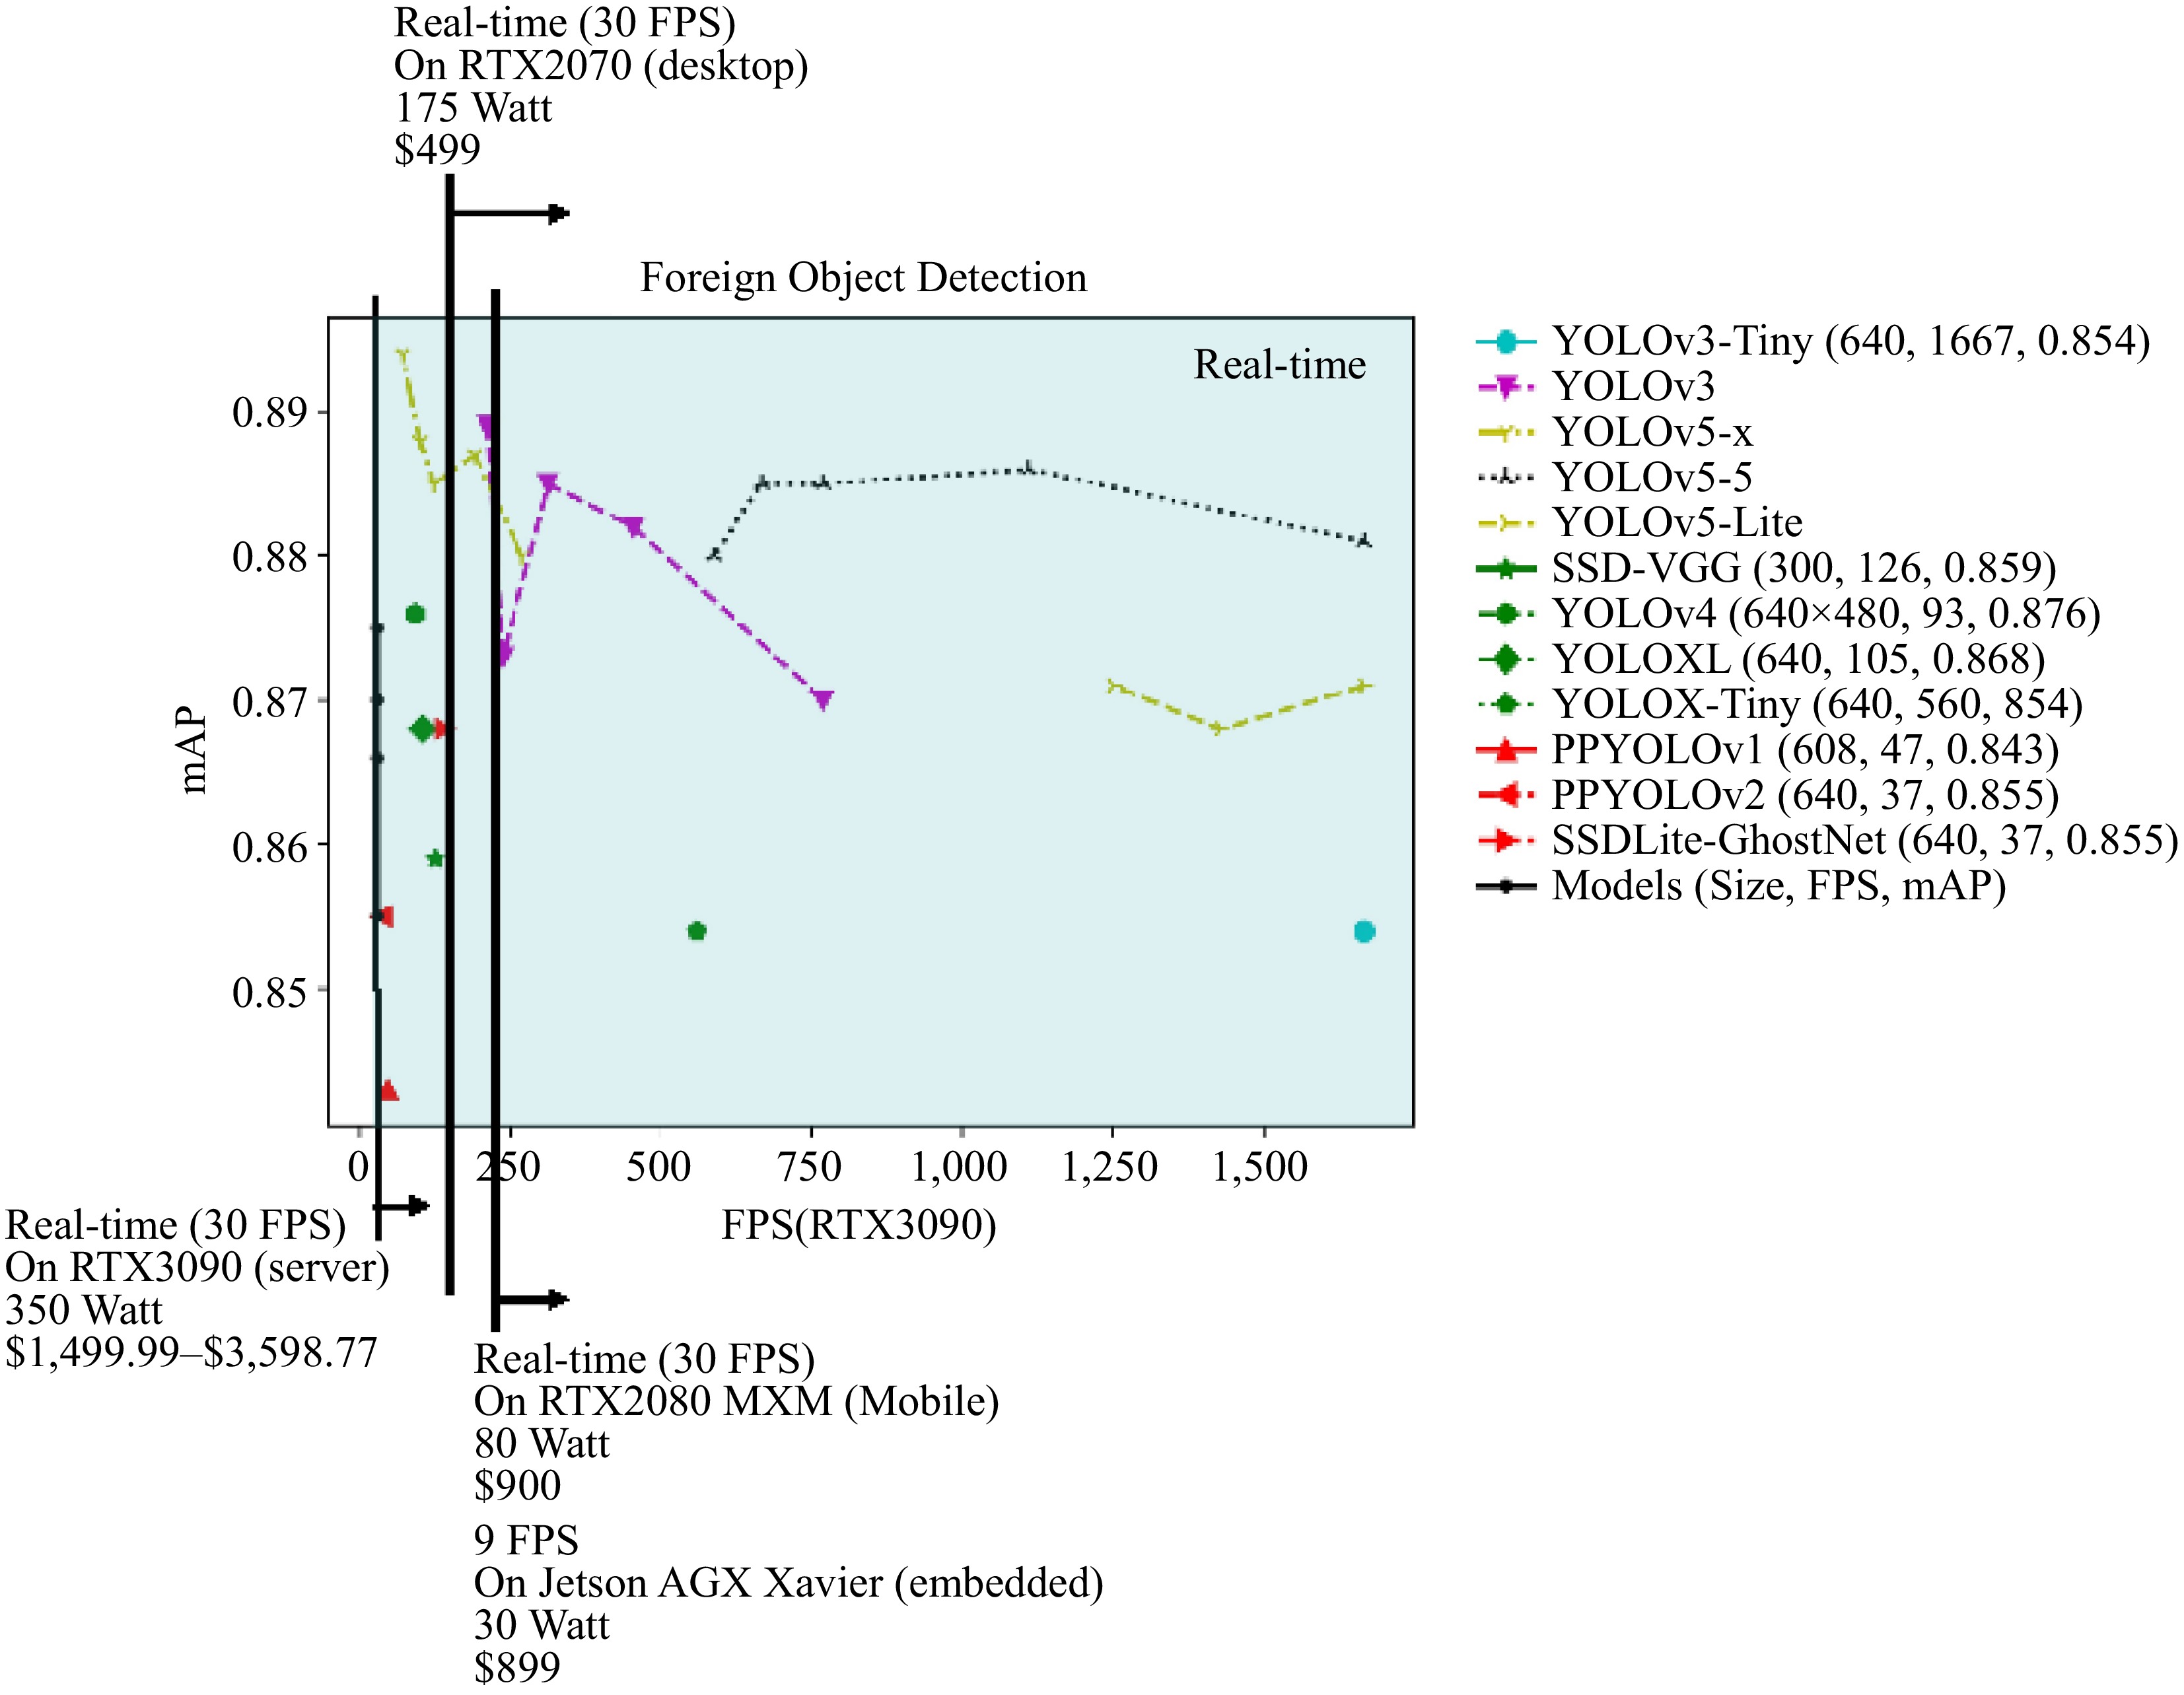
Figure 5.
FPS vs mAP on the present dataset. FPS is measured on the RTX 3090 GPU.
Under these constraints, only YOLOv3, YOLOv5-s, YOLOv5-Lite, YOLOX-Tiny, and YOLOV3-Tiny meet real-time detection requirements. After comprehensive consideration of mAP, model size, and FPS, it is concluded that YOLOv5-s (mAP: 0.880, FPS: 588, model size: 13.7 MB) is most suitable for practical metro deployment, offering: (1) Reliable detection under varying conditions; (2) Feasible deployment on commercial hardware; (3) Acceptable maintenance and operational costs; (4) Sufficient processing speed for real-time operation.
-
This study systematically investigates the application of deep learning in metro FOD systems. Through collaboration with Guangzhou Metro Group Co., Ltd., the first large-scale metro FOD dataset has been established and comprehensive experiments have been conducted comparing both large and lightweight models. The present findings demonstrate that lightweight neural networks, particularly YOLOv5-s, are more suitable for metro environments due to their balanced performance in accuracy, speed, and resource efficiency.
The practical implications of the present findings are significant for metro operations. While larger models achieve marginally higher detection accuracy (YOLOv5-x: 0.894 mAP), lightweight models like YOLOv5-s (0.880 mAP) offer substantially better deployment value. Specifically, when implemented on commercially viable hardware (RTX 2070), YOLOv5-s maintains real-time detection capability while requiring minimal infrastructure modification. This makes system-wide deployment feasible from both technical and economic perspectives.
The practical deployment analysis also reveals several implementation challenges that shape future research directions. First, model optimization should focus on enhancing detection reliability for metro-specific objects while maintaining computational efficiency. Second, hardware integration requires careful consideration of power consumption, maintenance requirements, and compatibility with existing security infrastructure. Finally, as these systems directly impact passenger safety, future development must prioritize model interpretability to build operator confidence and facilitate system maintenance. These practical considerations, rather than purely technical metrics should guide the continued development of metro FOD systems.
This work was supported by the Hunan Provincial Department of Education (24C0066). Our deepest gratitude goes to the editors and anonymous reviewers for their careful work and thoughtful suggestions that have helped improve this paper substantially.
-
The authors confirm contributions to the paper as follows: study conception and design: Dai Y, Xie W; data collection: Dai Y, Xie W; analysis and interpretation of result, draft manuscript preparation: Dai Y. Both authors reviewed the results and approved the final version of the manuscript.
-
The dataset used to support the results of this paper was collected by the researcher and will be available from the corresponding author upon request.
-
The authors declare that they have no conflict of interest.
- Copyright: © 2025 by the author(s). Published by Maximum Academic Press, Fayetteville, GA. This article is an open access article distributed under Creative Commons Attribution License (CC BY 4.0), visit https://creativecommons.org/licenses/by/4.0/.
-
About this article
Cite this article
Dai Y, Xie W. 2025. Is larger always better? A comprehensive evaluation of deep learning models for foreign object detection in metro systems. Digital Transportation and Safety 4(2): 80−88 doi: 10.48130/dts-0024-0025 

Is larger always better? A comprehensive evaluation of deep learning models for foreign object detection in metro systems
- Received: 28 August 2024
- Revised: 29 October 2024
- Accepted: 13 November 2024
- Published online: 27 June 2025
Abstract: Efficient and automatic foreign object detection (FOD) between platform screen doors (PSDs) and metro doors is crucial for intelligent metro operations. While deep learning has demonstrated exceptional performance in object detection tasks, the deployment of large models in metro systems presents significant practical challenges due to their computational demands. This study investigates the optimal balance between detection performance and operational feasibility in metro FOD applications. A systematic analysis of FOD challenges in metro environments is first conducted, identifying key issues including detection uncertainty, data constraints, and computational limitations. Through collaboration with Guangzhou Metro Group Co., Ltd., (Guangzhou, China) the first large-scale metro FOD dataset was established, comprising 5,854 images with diverse foreign objects from real operational scenarios. Then, 36 different object detection algorithms were evaluated, ranging from large-scale models to lightweight architectures, focusing on their practical deployment capabilities. The comprehensive experiments reveal that lightweight neural networks, particularly YOLOv5-s, achieve superior practical performance in metro environments. While larger models demonstrate marginally higher detection accuracy (YOLOv5-x: 0.894 mAP), lightweight alternatives offer substantially better deployment value through balanced accuracy (YOLOv5-s: 0.880 mAP), real-time processing capability (588 FPS), and efficient resource utilization (13.7 MB). These findings provide valuable guidance for implementing deep learning-based FOD systems in real-world metro operations.