


-
With rapid urbanization, growing travel demands, and increasing environmental concerns, reliance on public transportation has intensified. Urban rail transit (URT), valued for its efficiency, environmental friendliness, and high capacity, has experienced substantial growth in passenger demands. However, this increase poses challenges such as uneven station demand and severe crowding. During peak hours, passenger demand at certain stations often exceeds train capacity, leaving many passengers stranded on platforms and raising safety risks. In extreme cases, overcrowding can lead to incidents like trampling, falling, and door collisions injuries. Thus, optimizing operation plans are essential for reducing station congestion more effectively and quickly.
Recent studies have focused on optimizing timetable and operation plans by exploring flexible routes or stopping plans. The skip-stop plan allows trains to bypass certain stations without additional infrastructure. Implementing a flexible stopping plan can adjust service frequencies according to station demand, with higher frequencies at busy stations and lower frequencies at low-demand stations. The flexible skip-stop plan enhances resource efficiency, balances the number of stranded passengers across stations, and alleviates congestion more effectively. Skipping low-demand stations can reduce average operation time, thereby lessening total operation costs[1]. However, the skip-stop plan has potential downsides, such as increased waiting time for passengers at skipped stations, which may impact satisfaction. Additionally, the dynamic nature of passenger flows can lead to deviations from planned outcomes[2]. Addressing these issues requires careful consideration of factors such as passenger demand, operation costs, train capacity, station congestion, and skip frequency when designing a stopping plan. Since adjustments in the stopping plan inevitably affect the timetable, integrated optimization of both the timetable and stopping plan is essential for improving safety and operation efficiency in URT systems.
-
Some studies have developed optimization models for the skip-stop plan, aiming to minimize passenger travel time or train operation time, often employing heuristic or refinement algorithms to accommodate large-scale URT networks[3−6]. Oliveira & Zhang[7] presented the 'non-stop' design, featuring trains with locomotives that couple and uncouple during operation, effectively reducing the total travel time. Xu et al.[8] tackled a multi-commodity space-time network flow problem by integrating train schedules, skip-stop decisions, and platform selection to improve operation efficiency. Motvallian et al.[9] proposed a model that jointly optimized skip-stop plans and schedules, minimizing waiting and travel time while maximizing the number of passengers reaching their destination. Regarding service fairness, Zhao et al.[10] proposed a model balancing fairness and resource utilization by integrating scheduling and circulation. Dong et al.[11] examined skip-stop plans in oversaturated rail networks, applying ALNS algorithms to reduce downstream waiting time disparities. Shao et al.[12] developed a multi-objective mixed-integer linear programming model that reduced travel time and improved equity by minimizing variance in travel utility. Wu et al.[13] proposed an approximate model that considered passenger aggregation and reduced disparities in waiting time. Shang et al.[14] reformulated the equity optimization problem as a multi-commodity flow model, analyzing passenger distribution within the space-time network based on the number of missed trains. Some studies focused on the impact of dynamic passenger flow, considering real-time changes in passenger demand and uncertain conditions. These studies also discussed the potential crowding caused by dynamic passenger flow and proposed station congestion indicators to assess passenger service quality[15]. Cao & Ceder[16] proposed a pattern based on real-time passenger demand that reduced both total travel time and the number of shuttles required, solved by a binary variable iteration genetic algorithm. Yuan et al.[17] proposed a dynamic demand model that improved boarding rates and train capacity to reduce congestion. Farrando et al.[18] developed a dual-service skip-stop strategy with variable stop times and analyzed the effects on passengers with different travel distances. Shang et al.[19] constructed a timetable optimization model that minimized total passenger travel time, employing an S-shaped cumulative demand function to capture dynamic passenger flow characterization. Barrena et al.[20] took dynamic demand into account, focusing on minimizing average waiting time, and developed three progressively improved schemes. In analyzing the impact of uncertainty on skip-stop strategy, most research primarily focused on specific scenarios of demand variability, enhancing the model's adaptability to diverse conditions and reducing delays, total travel time, and operation costs for affected passengers[21,22]. Chen et al.[23] introduced a robust optimization model using information gap decision theory, coordinating skip-stop plans and passenger flow control strategies. Yuan et al.[24] utilized a decomposition and approximate dynamic programming approach, reducing waiting time and congestion. Zhang et al.[25] developed nonlinear non-convex programming models optimizing total travel time and train capacity by considering stop times. Shi et al.[26] tackled oversaturated lines with a coordinated optimization model, reducing waiting time and congestion, solved by local search techniques and CPLEX solver.
Most research prioritized minimizing travel time or train operation time, often focusing on overall station equity along the line but paying less attention to congestion issues at downstream stations. Based on the above literature, this paper aims to optimize train departure headways and skip-stop plans based on passenger demand. Compared to existing research, this study makes two main contributions. First, it considers multiple factors, including waiting time, train operation time, station congestion, and skip-stop frequencies. Second, it emphasizes reducing congestion at downstream stations, enhancing passenger travel satisfaction and train operation effectiveness, while balancing and lowering congestion levels across all stations.
-
This study focuses on the operation of a unidirectional URT line. Stations along the line are numbered sequentially from 1 to N, with the station index represented by i, as shown in Fig. 1. Trains are numbered according to their departure order, from 1 to |K|, with the train index denoted by k. All trains start operation at station 1 and terminate at station N. In this model, the time when the first train arrives at station 1 is designated as time 0.
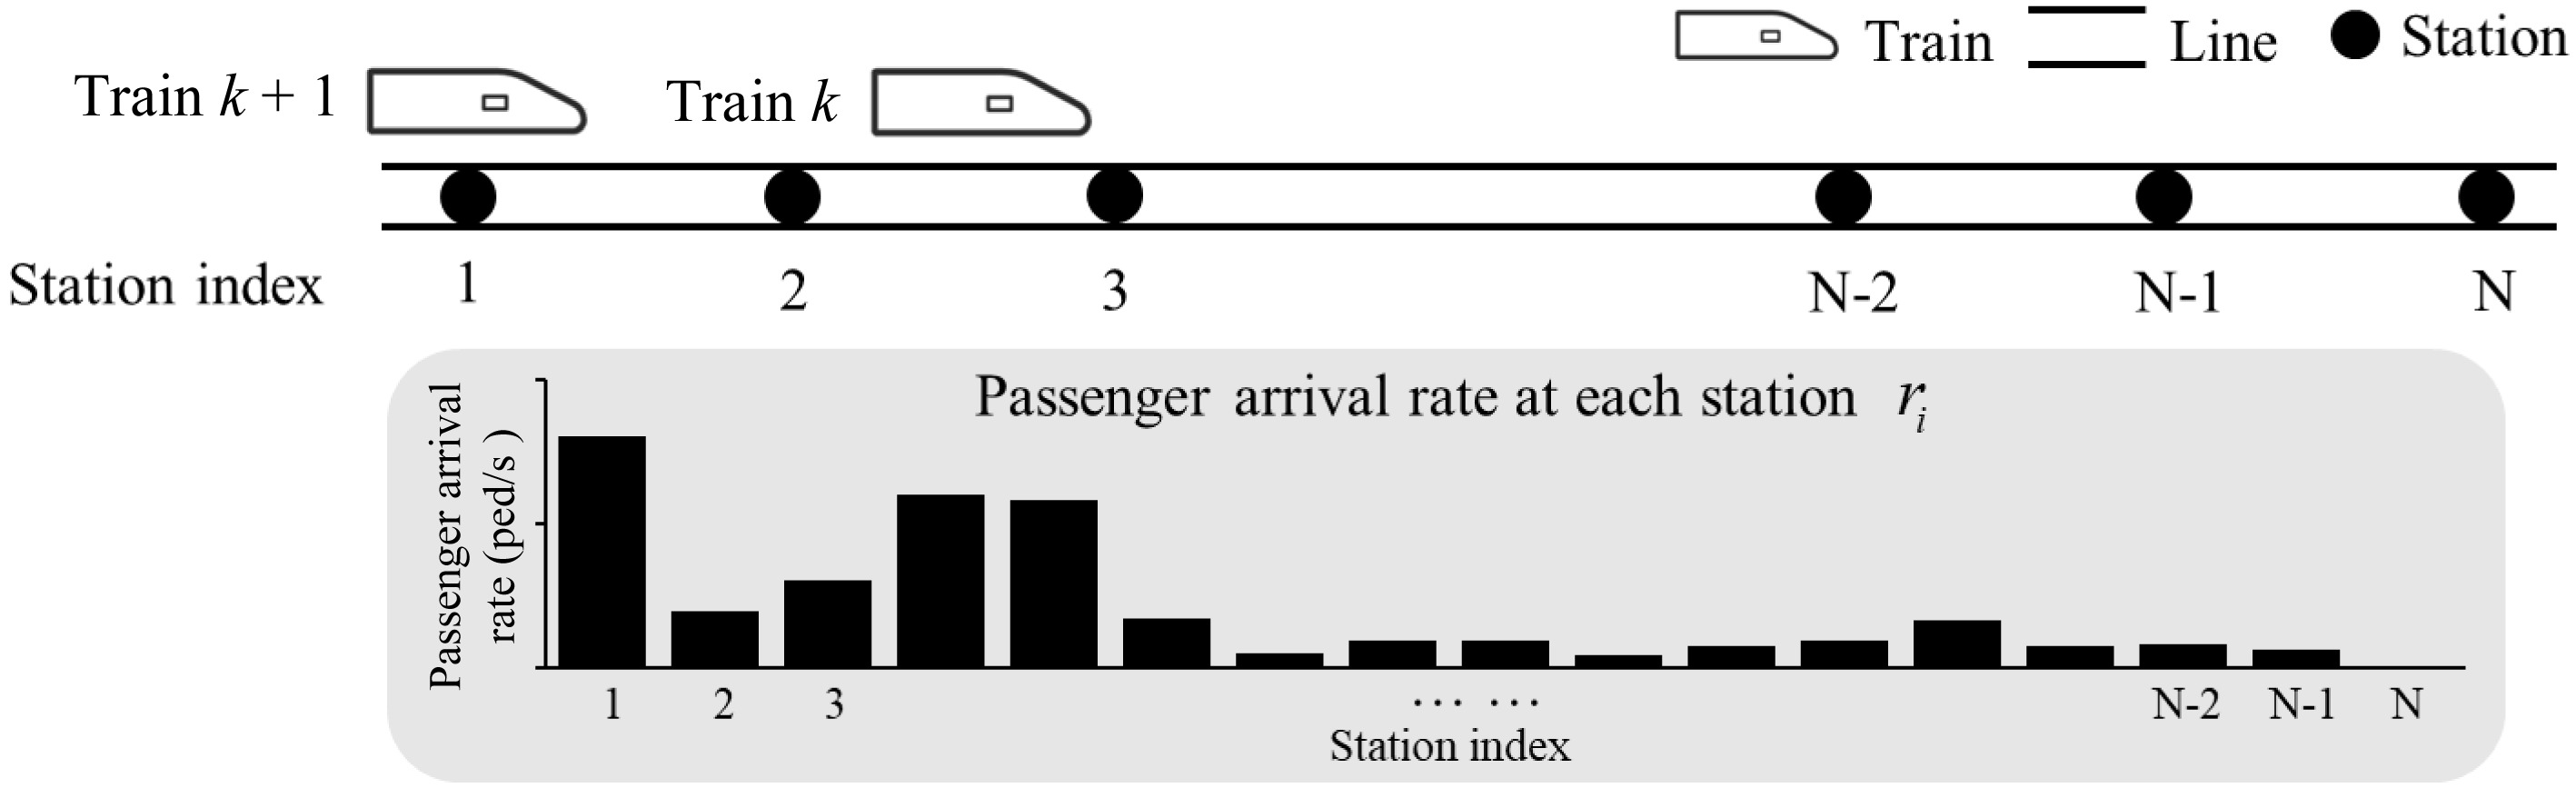
Figure 1.
Operation of a unidirectional URT line.
As shown in Fig. 1, on a URT line, certain upstream stations, such as stations 1, 4, and 5, may experience heavy crowding. As shown in Fig. 2, taking a unidirectional URT line with nine stations as an example, stations 1 and 4 with high passenger demand are congested stations. Under the traditional all-stop plan, by the time the train reaches station 4, passengers from upstream stations have already occupied much of its capacity, leaving limited space for additional passengers. Meanwhile, station 4 has a high arrival rate, causing a sharp increase in crowding, as shown in Fig. 2a.
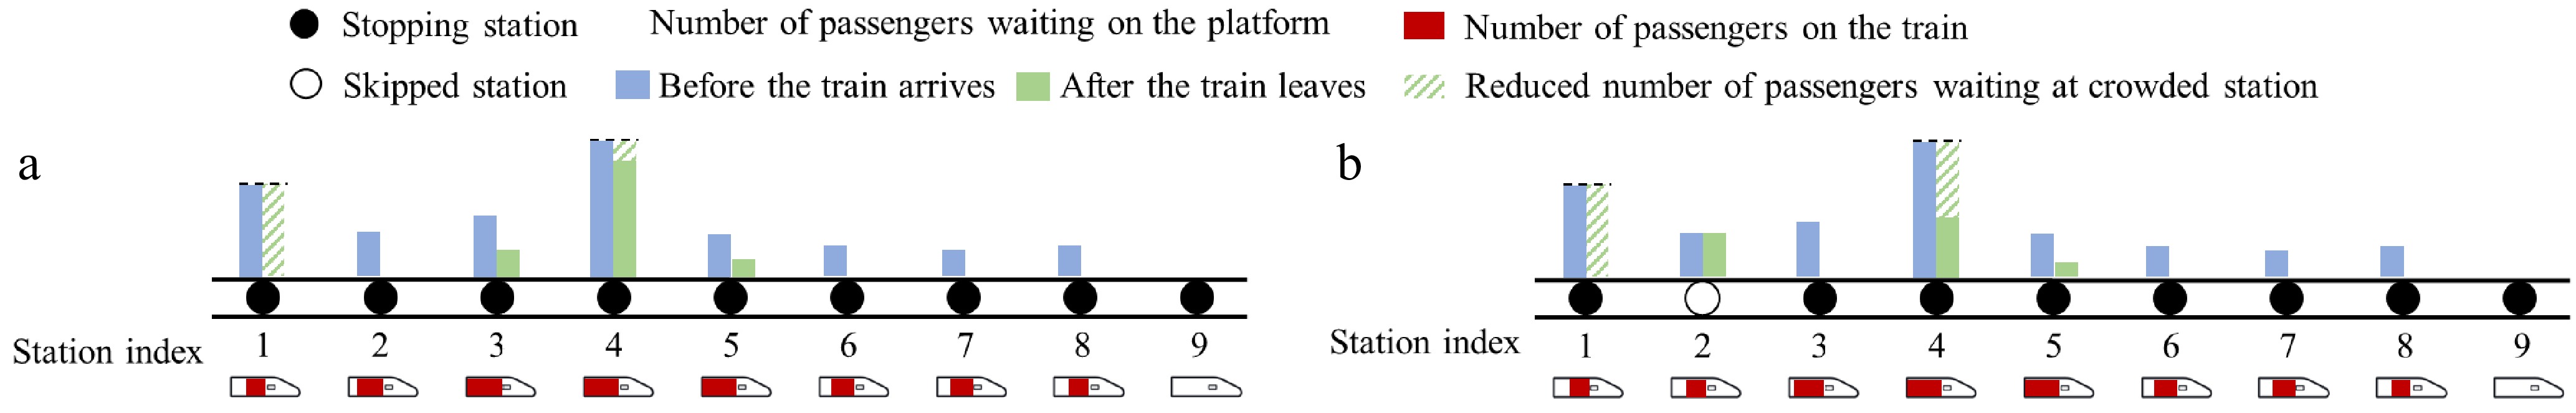
Figure 2.
All-stop and skip-stop plan. (a) All-stop, (b) skip-stop.
In contrast, a flexible skip-stop plan, which bypasses upstream station 2, reserves capacity for station 4. Although this plan may increase the waiting time for some passengers at station 2, it significantly alleviates crowding at station 4, and effectively balances congestion levels across stations, as illustrated in Fig. 2b. However, determining which trains should skip specific stations, while adjusting the timetable accordingly, is a complex task. This process must carefully consider uneven passenger flows across stations and balance operation efficiency with passenger satisfaction. To address these challenges, we develop a mixed-integer nonlinear programming (MINLP) model in the following section, aiming to achieve an integrated optimization of the stopping plan and timetabling. This model not only mitigates congestion at overcrowding stations but also enhances the overall performance of the URT system.
-
To formulate a rigorous mathematical optimization model, this study introduces the following fundamental assumptions:
(1) Passenger arrivals at each station follow a uniform distribution with a known arrival rate;
(2) The travel time between any two stations is fixed and the same for all trains;
(3) All trains must stop at the final station, meaning skip-stop operation is not permitted at the last station.
Parameters and variables
-
The relevant symbols and their corresponding meanings involved in the model development are presented in Table 1. The decision variables in the model are:
Table 1. Parameters and symbols.
Parameters Meanings I Set of stations, I = {1, 2, 3, ..., N} I' Set of skipped stations, $ \ I' \subset I $ K Set of trains, K = {1, 2, 3, ..., |K|} i Station index, $ \forall i \in I $ j Skipped station index, $ \forall j \in I' $ k Train index, $ \forall k \in K $ ak,i Arrival time of train k at station i dk,i Departure time of train k from station i λk,i Number of waiting passengers at station i when train k arrives $ \lambda'_{k,i} $ Number of waiting passengers at station i when train k departs ηk,i Actual number of passengers on train k upon its arrival at station i $ f_{k,i}^a $ Number of passengers alighting from train k at station i $ f_{k,i}^b $ Number of passengers boarding train k at station i hmin Minimum safe headway ρk,i Passenger density at station i when train k arrives at station i $ \rho'_{k,i} $ Passenger density at station i when train k departs from station i Wk,i Total waiting time when train k arrives at station i $ {\bar \rho '_j} $ Average waiting density for each train leaving station j D Train stopping time Si Platform area of station i C Train rated capacity Nmax Maximum number of skipped stations ri Passenger arrival rates at station i rk,i Proportion of passengers alighting from train k at station i ni Initial number of waiting passengers at station i ti Train running time between station i and i+1 tmin Minimum headway tmax Maximum headway Evaluation indicators $ \bar t $ Average train operation time q Total stop density during operation $ {\tilde \rho '_j} $ Density variance of waiting passengers when each train depart from station j β Passenger carrying capacity per second during the operation W Average waiting time during operation $ x_{k,i}=\left\{\begin{array}{*{20}{c}}1, & \text{Train }k\text{ stops at station }i \\ 0, & \mathrm{\rm{else}}\end{array}\right. $ where, hk is a positive integer variable representing the departure headways between train k and train k + 1.
Mathematical model
Objective function
-
The present optimization model has two main objectives. First, we consider efficiently alleviating overcrowding by frequently stopping at high-density stations, the first objective is to maximize total stop density q, ensuring trains prioritize stops at high-density stations, as shown in Eqn (1). Additionally, we consider reducing the combined costs for passengers and operators through a skip-stop plan, that is, minimizing the linear combination of average train operation time
$ \bar t $ $ \max q $ (1) $ \min {\omega _1}\bar t + {\omega _2}{d_{\left| K \right|,N}} + {\omega _3}W $ (2) Among them, ω1, ω2, ω3 are the weight coefficients for each evaluation indicator.
Based on the above objectives, we further consider congestion balancing along the line. When multiple stations have high initial passenger volumes and high arrival rates, trains will consume a large amount of capacity at crowded upstream stations, reducing their available capacity as they approach downstream stations. This limits the ability to accommodate passengers at subsequent crowded stations, further increasing congestion. In this study, a certain crowded station near the terminal is designated as the key crowded station and indexed by j. To balance and alleviate crowding across stations, objective (1) is revised as shown in Eqn (3).
$ \max {\omega _4}q - {\omega _5}{\tilde{ \rho}}'_j $ (3) where, q represents the total stop density, defined as the passenger density at station i when train k arrives at station i, consistent with its meaning in Eqn (1).
$ {\tilde \rho}'_j $ Firstly, the average operation time, denoted as
$ \bar t $ $ \bar t = \dfrac{{\sum\nolimits_{k = 1}^{\left| K \right|} {({d_{k,N}} - {a_{k,1}})} }}{{\left| K \right|}} $ (4) where, ak,i and dk,i are the arrival time and departure time of train k at station i, respectively, as shown in Eqns (5) and (6). Specifically, we provide additional definitions of t0 = 0, h0 = 0, and xk,0 = 0.
$ a_{k,i}=\sum\limits_{l=0}^{k-1}h_l+\sum\limits_{l=0}^{i-1}(x_{k,l}D+t_l),\ \ \ \ \ \forall k\in K,\ i\in I $ (5) $ d_{k,i}=x_{k,i}D+a_{k,i}\ ,\ \ \ \ \ \forall k\in K,\ i\in I $ (6) The second indicator,
$ \tilde \rho '_j $ $ \tilde \rho '_j = \dfrac{{\sum\nolimits_{k = 1}^{\left| K \right|} {{{({{\bar \rho '_{k,j}}} - {{\rho '_{k,j}})}}^2}} }}{{\left| K \right|}} $ (7) where,
$ {\rho '_{k,j}} $ $ {\bar \rho '_{k,j}} $ $ {\rho '_{k,j}} $ $ \rho '_{k,i} = \dfrac{{\lambda '_{k,i}}}{{{S_i}}},\;\forall k \in K,\;i \in I $ (8) The symbol
$ \lambda '_{k,i} $ $ \lambda '_{k,i} = \lambda _{k,i} - f_{k,i}^b{x_{k,i}},\;\forall k \in K,i \in I $ (9) $ \lambda_{k,i}=\left\{\begin{array}{l} n_i+r_i\cdot a_{1,i} \;\;\;\; k\ =\ 1 \\ \lambda'_{k-1,i}+r_i(a_{k,i}-d_{k-1,i}) \;\;\; 1 \lt \ k\ \leqslant\ \left|K\right|\end{array},\right.\ \ \ \forall k\in K,\ \ i\in I $ (10) The symbols
$ f_{k,i}^b $ $ f_{k,i}^a $ $ f_{k,i}^b=min\left\{\begin{array}{*{20}{c}}\lambda_{k,i}^{ }x_{k,i}, & x_{k,i}(C-\eta_{k,i}^{ }-f_{k,i}^a)\end{array}\right\},\ \ \ \ \forall k\in K,i\in I $ (11) $ f_{k,i}^a=\eta_{k,i}r_{k,i}^{ }x_{k,i},\ \ \forall k\in K,\ \ i\in I $ (12) The first term in Eqn (11) represents the theoretical number of passengers boarding train k at station i, and the second term represents the practical number of passengers boarding train k at station i. The symbol ηk,i represents the actual number of passengers on train k upon its arrival at station i, can be calculated as Eqn (13).
$ \eta_{k,i}^{ }=\left\{\begin{array}{*{20}{c}}0 & i=1 \\ \sum\limits_{g=1}^{i-1}(f_{k,g}^b-f_{k,g}^ax_{k,g}) & 1 \lt i\leqslant N\end{array}\right.,\ \ \ \forall k\in K,\ \ \ i\in I $ (13) When each train arrives at station 1, all trains are empty, meaning ηk,1 = 0. The number of passengers on the train at other stations is related to the cumulative number of passengers boarding and alighting at each station.
Another important indicator, the total stop density q, can be calculated as Eqn (14). The symbol ρk,i represents passenger density at station i when train k arrives at station i, which can be calculated as Eqn (15), similar to Eqn (8).
$ q = \sum\limits_{k = 1}^{\left| K \right|} {\sum\limits_{i = 1}^N {{x_{k,i}}\rho _{k,i}^{}} } $ (14) $ \rho_{k,i}^{ }=\dfrac{\lambda_{k,i}^{ }}{S_i},\; \ \ \forall k\in K,\; i\in I $ (15) The average waiting time
$ W $ $ W = \dfrac{{\sum\nolimits_{k = 1}^{\left| K \right|} {\sum\nolimits_{i = 1}^N {W_{k,i}^{}} } }}{{\sum\nolimits_{k = 1}^{\left| K \right|} {\sum\nolimits_{i = 1}^N {f_{k,i}^b} } }} $ (16) $ W_{k,i}^{} = \left\{ {\begin{array}{*{20}{c}} {\sum\nolimits_{g = 1}^{{a_{k,i}}} {({n_i} + g{r_i})} }&{k = 1} \\ {\sum\nolimits_{g = 1}^{{a_{k,i}} - {d_{k - 1,i}}} {({{\lambda '}_{k - 1,i}} + g{r_i})} }&{1 \lt k \leqslant \left| K \right|} \end{array}} \right.,\forall k \in K,i \in I $ (17) Equation (17) means that the total waiting time at stations on the arrival of train 1 is independent of other trains and depends solely on the initial number of waiting passengers at the station ni, and the passenger arrival rate ri. For subsequent trains, the number of waiting passengers on the platform is determined by the number of passengers left when the previous train departed,
$ \lambda '_{k - 1,i} $ Constraints
Train safety headway constraint
-
To ensure the safe operation of trains, the headways between the departure and arrival times of two consecutive trains at the same station must not be less than the minimum safe headway, as shown in Inequality (18).
$ a_{k,i}-d_{k-1,i}\ \geqslant\ h_{min}\ ,\ \ \forall k\in K\backslash\left\{1\right\},\ i\in I $ (18) Train skip-stop constraint
-
To meet the passenger demand at each station, it is required that for any set of three consecutive trains, at least one train must stop at the station, as shown in Inequality (19).
$ \sum\limits_{l=k-2}^kx_{l,i}\ \geqslant\ 1,\ \ \forall k\in K\backslash\left\{1,2\right\},\ i\in I $ (19) To ensure that all passengers onboard can alight at the terminal station, each train must stop at station N.
$ x_{k,N}=1,\ \ \forall k\in K $ (20) To prevent excessive skip-stop, the number of skipped stations for each train must not exceed the maximum allowed skipped stations count Nmax.
$ \sum\limits_{i=1}^N(1-x_{k,i})\ \leqslant\ N_{max}\ ,\ \ \forall k\in K $ (21) Train departure headways constraint
-
The train departure headway is constrained by both minimum and maximum headways.
$ {t_{\min }} \leqslant {h_k} \leqslant {t_{\max }},\forall k \in K\backslash \left\{ {\left| K \right|} \right\} $ (22) Based on the above model and analysis, the optimization model for the stopping plan and timetable, considering station crowding balance, can be summarized as follows:
$ \left\{\begin{gathered}\max\omega_4q-\omega_5\tilde{\rho}'_{k,j} \\ \min\omega_1\overline{t}+\omega_2d_{\left|K\right|,N}+\omega_3W \\ \begin{array}{*{20}{c}}\rm{s.t.} & \mathrm{Eqn\text{s }}(18)-(22)\end{array} \\ \end{gathered}\right. $ (23) -
Taking a certain URT line as an example, the line has 17 stations, and the passenger arrival distribution at each station between 8:00 a.m. and 8:30 a.m. is shown in Fig. 3. This study analyzes smart data to track passengers' entries and exits at each station during the study period, and assume a uniform distribution of passenger arrivals with fixed rates at each station[27]. The total number of entering passengers at each station is calculated and averaged over the study period to determine the arrival rate. It can be seen that the initial number of passengers and arrival rates at stations 1, 4, and 5 are relatively high, which can easily lead to passenger congestion. Therefore, the set of crowded stations is defined as I' = {1,4,5}, with station 5 designated as the key crowded station.
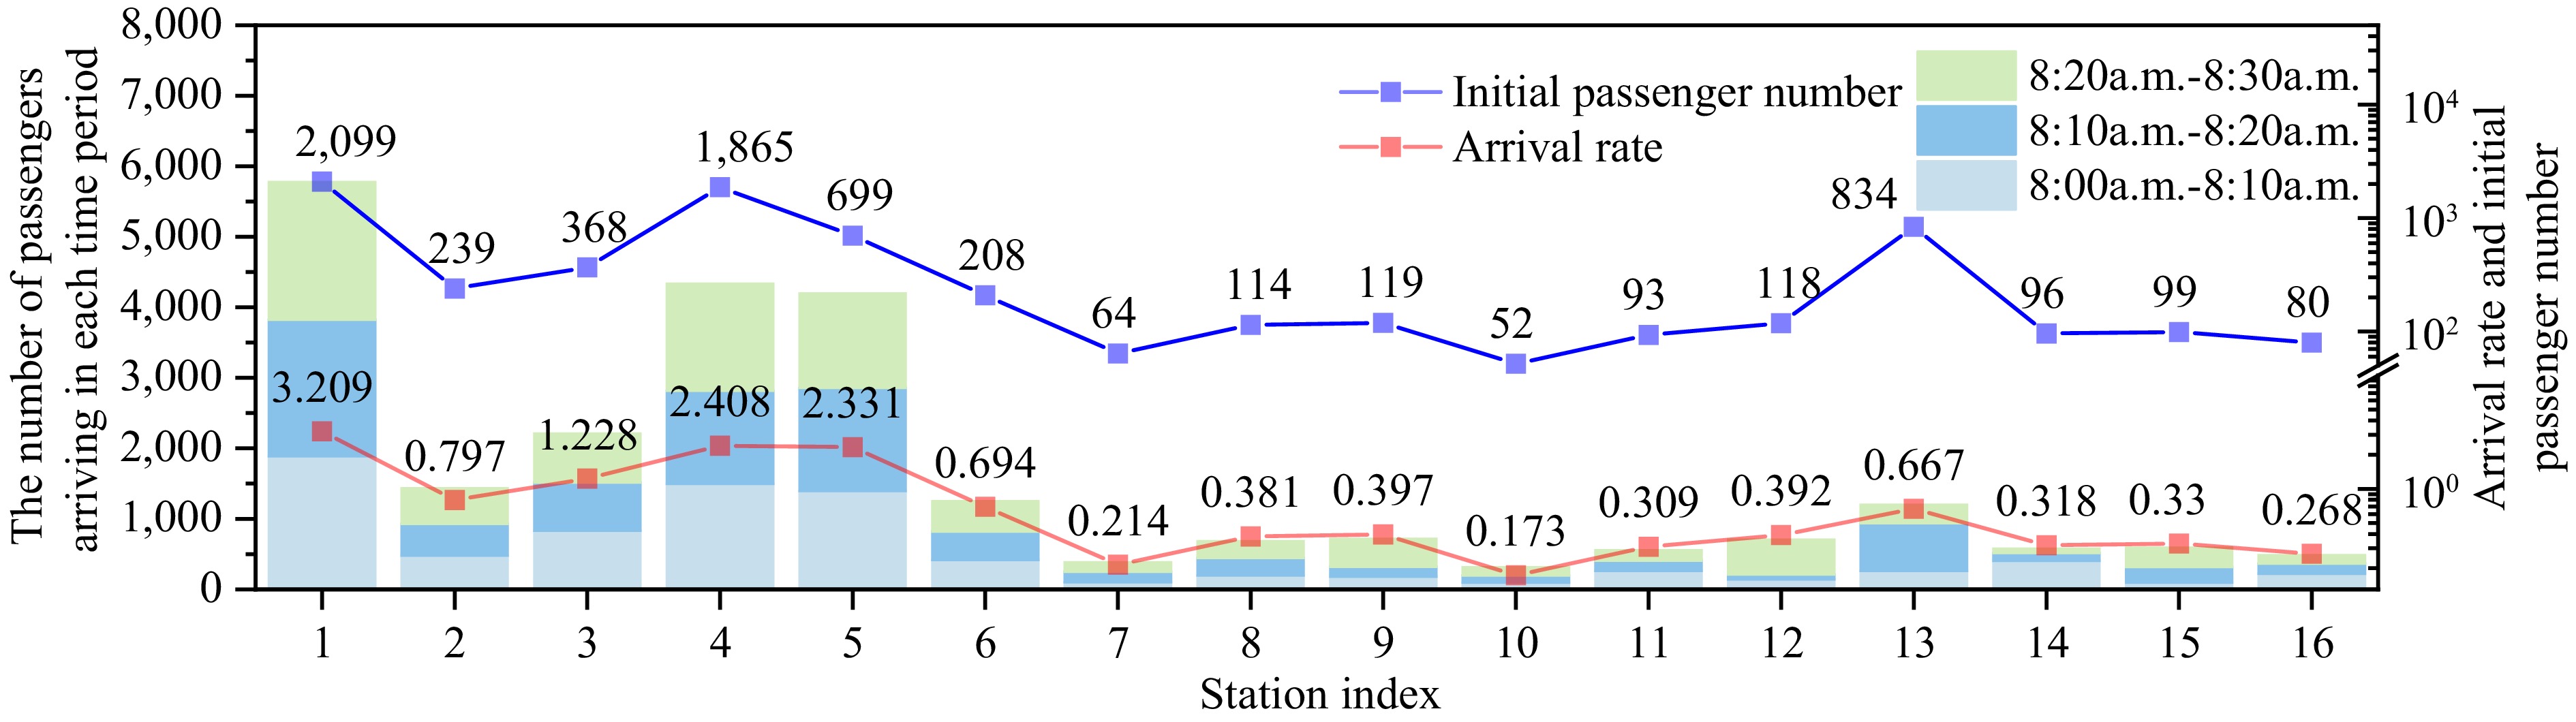
Figure 3.
Passenger arrival distribution.
This study considers 10 trains running during peak periods, i.e., |K| = 10, with each train having a capacity of 1,600 passengers. The minimum and maximum headways are set to 90 and 180 s, respectively, and the maximum allowable number of skipped stations is five. For simplification, the platform area at each station is set to 1,400 m², and the dwell time at each station is 30 s. The specific travel time between stations ti, the initial number of passengers at each station ni, the passenger arrival rate ri, and the alighting ratio rk,i are provided in Table 2.
Table 2. Parameter settings.
Parameters Value ti [158.00, 112.00, 158.10, 109.00, 145.00, 92.00, 121.00, 114.00, 109.10, 105.00, 164.00, 125.00, 146.00, 138.00, 107.00, 132.00] ni [2209, 239, 368, 1865, 699, 208, 64, 114, 119, 52, 93, 118, 834, 96, 99, 80, 0] ri [3.209, 0.797, 1.228, 2.408, 2.331, 0.694, 0.214, 0.381, 0.397, 0.173, 0.309, 0.392, 0.667, 0.318, 0.330, 0.268, 0.000] rk,i [0.000, 0.110, 0.120, 0.130, 0.140, 0.116, 0.192, 0.163, 0.125, 0.064, 0.199, 0.194, 0.522, 0.312, 0.224, 0.266, 1.000] Optimization results and analysis
Optimization scheme setting
-
A conventional stopping plan and an optimized plan that does not consider station crowding balance are selected as control groups to verify the effectiveness and rationality of the proposed plans. The specific settings for the plans are shown in Table 3.
Table 3. Optimize plans settings.
Stopping mode Plan Objective function Weight settings All-stop A − − Skip-stop Without considering station crowding balance B1 Eqns (1), (2) ω1 = 0.01, ω2 = 0.01, ω3 = 0.98 Considering station crowding balance B2 Eqns (2), (3) ω1 = 0.01, ω2 = 0.01, ω3 = 0.98, ω4 = 0.01, ω5 = 0.99, j = 5 For Plan A, trains stop at every station, with departure headways set to 180 s.
Analysis of scheme optimization effect
Evaluation index analysis
-
To evaluate train carrying capacity during the operation period, the carrying capacity per second β is calculated. Passenger turnover is defined as the product of passenger numbers and distance traveled. For simplicity, the number of stations serves as a proxy for distance, resulting in an average passenger turnover over the total operation period, as shown below:
$ \beta = \dfrac{{\sum\nolimits_{k = 1}^{\left| K \right|} {\eta _{k,i}^{}} }}{{{d_{\left| K \right|,N}}}} $ (24) The effects of the optimization plans on average train operation time
$ \bar t $ 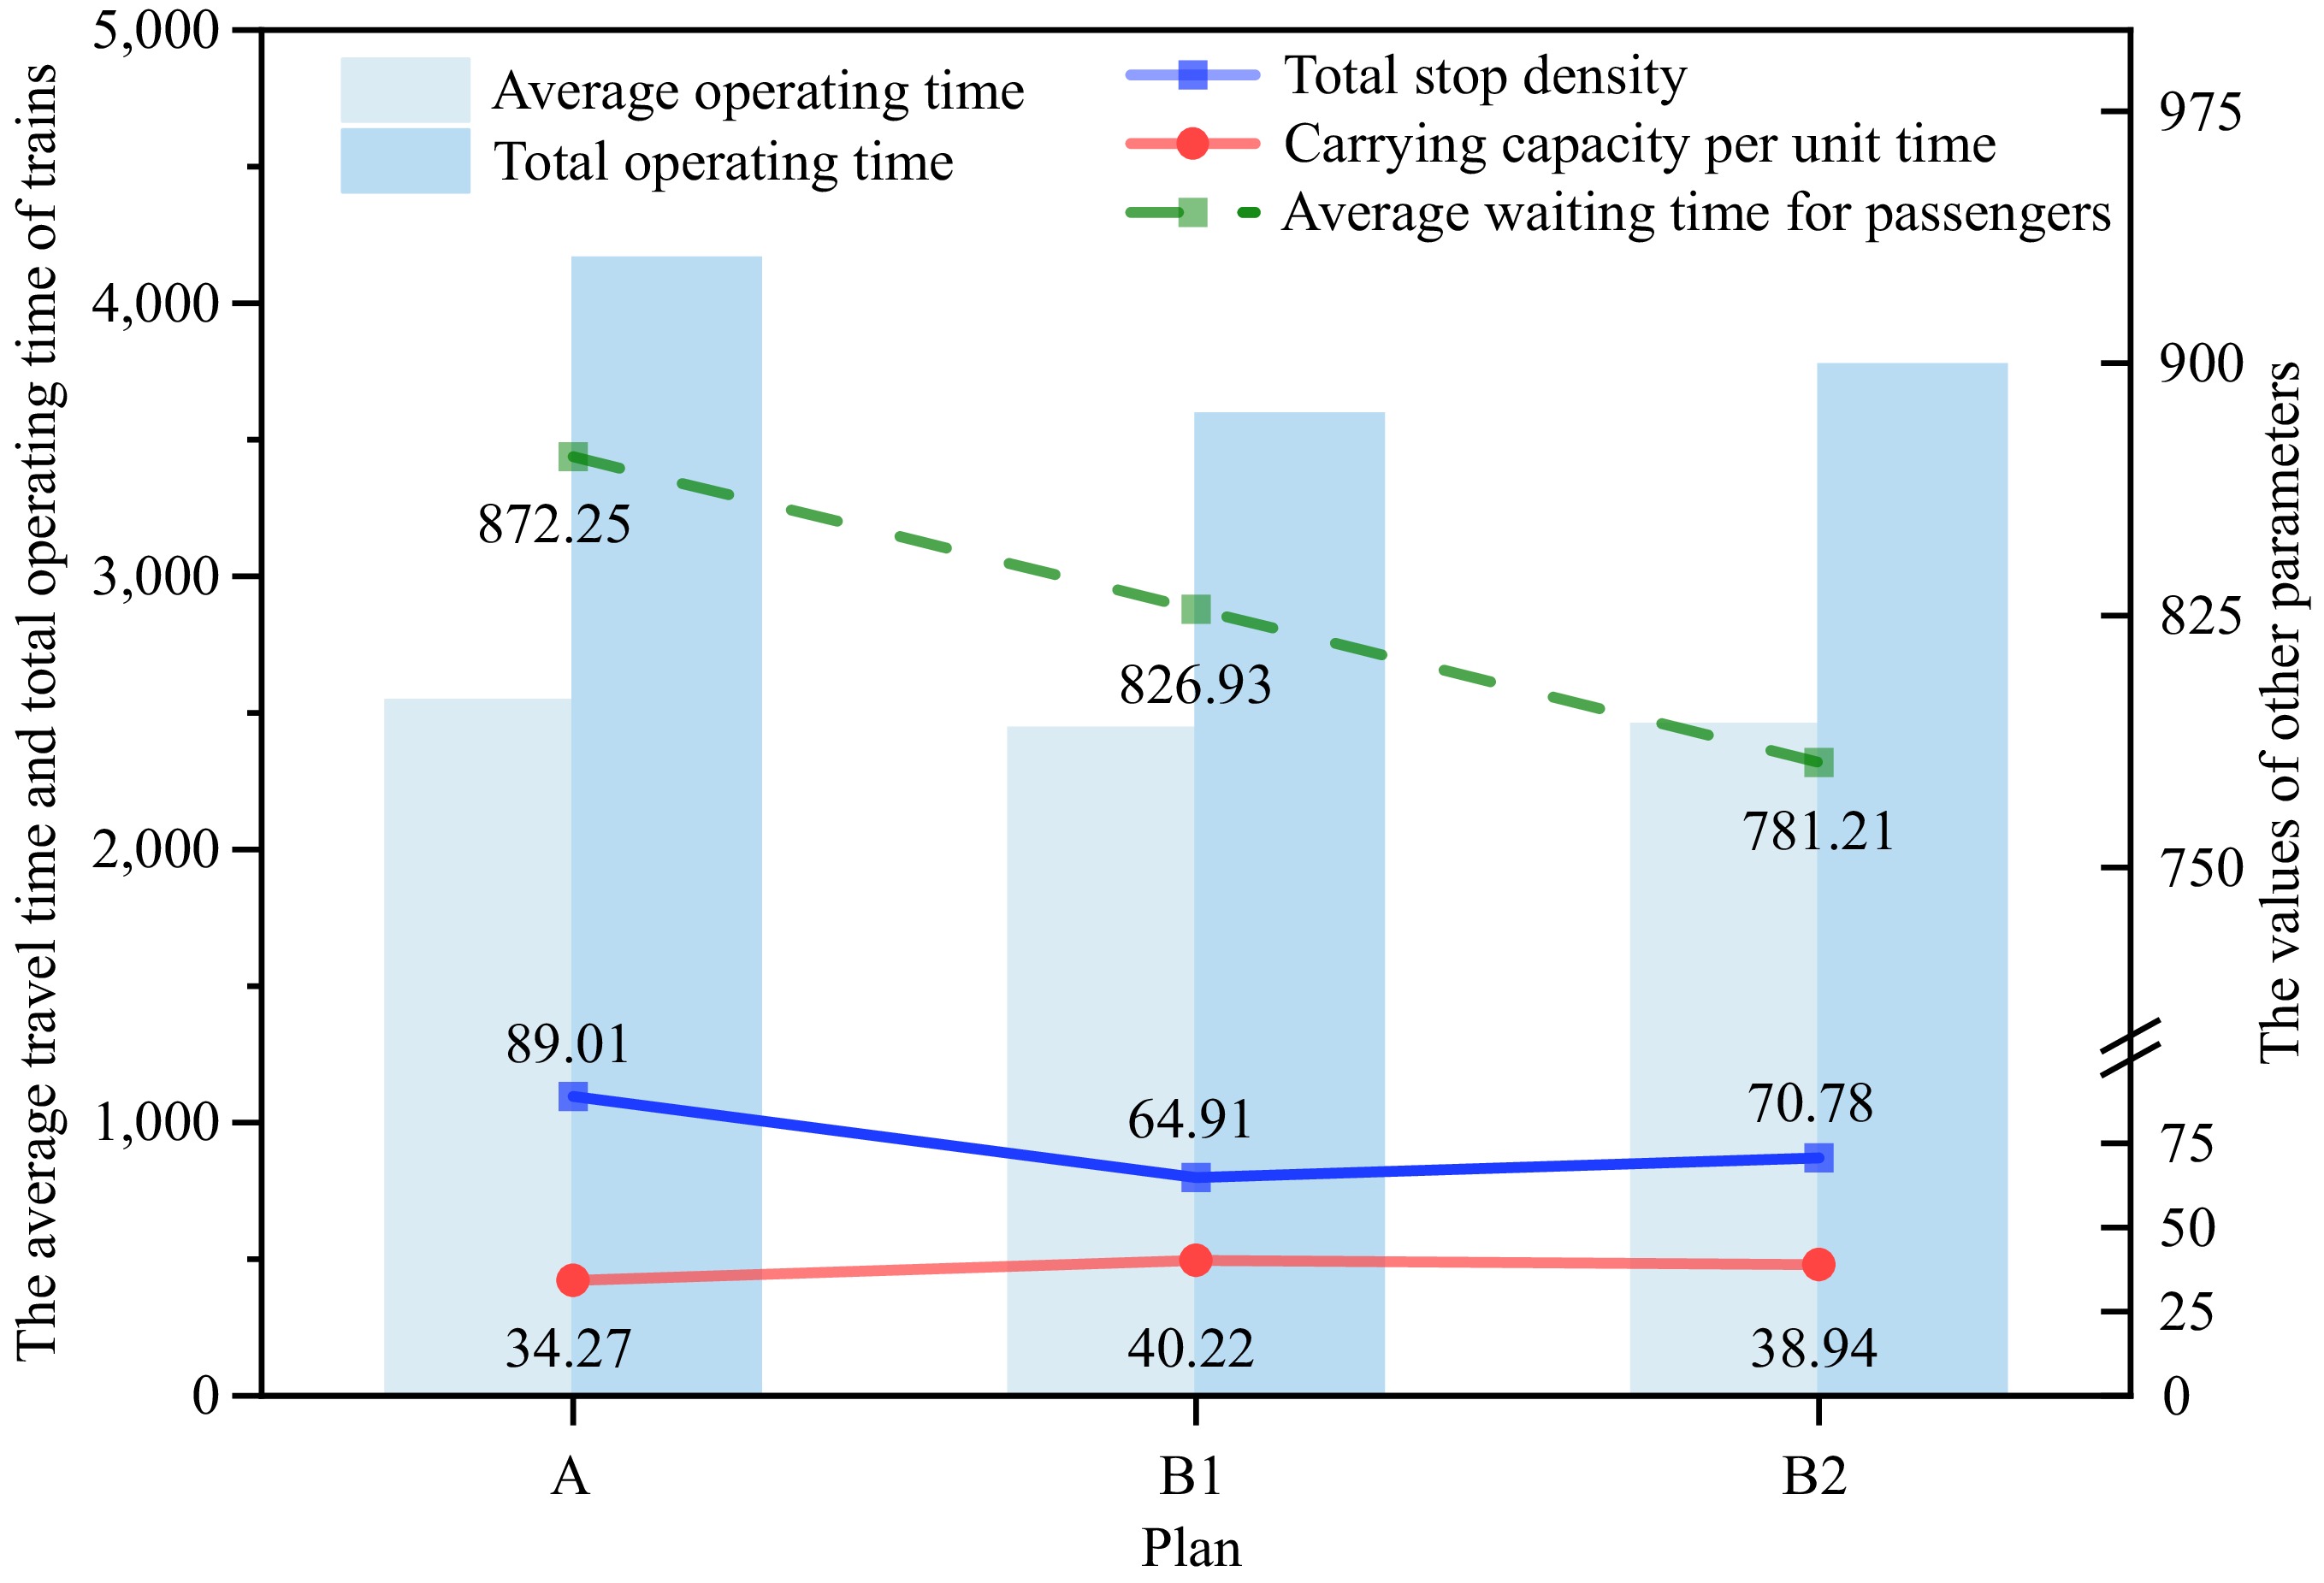
Figure 4.
Optimization results of evaluation indicators for each plan.
As shown in Fig. 4, Plan B1, which does not account for station crowding balance, reduces the average operation time, total operation time, and average waiting time compared to the traditional all-stop Plan A, while increasing the train's carrying capacity per second. Plan B1 improves performance indicators by 4.01%, 13.71%, 5.20%, and 17.36% compared to Plan A. Plan B2, incorporating station crowding balance, performs better than Plan A. It improves average train operation time by 3.42%, total operation time by 9.40%, average waiting time by 10.44%, and carrying capacity per second by 13.63%. While Plan B2 reduced the average waiting time by 5.24% compared to Plan B1, it increased the average train operation time by 0.61%, suggesting that Plan B2 is more passenger-friendly.
Passenger density distribution analysis
-
To evaluate the effectiveness of the optimization plan in reducing crowding and congestion variance across stations, Fig. 5 compares the passenger density distributions at stations after implementing different plans.
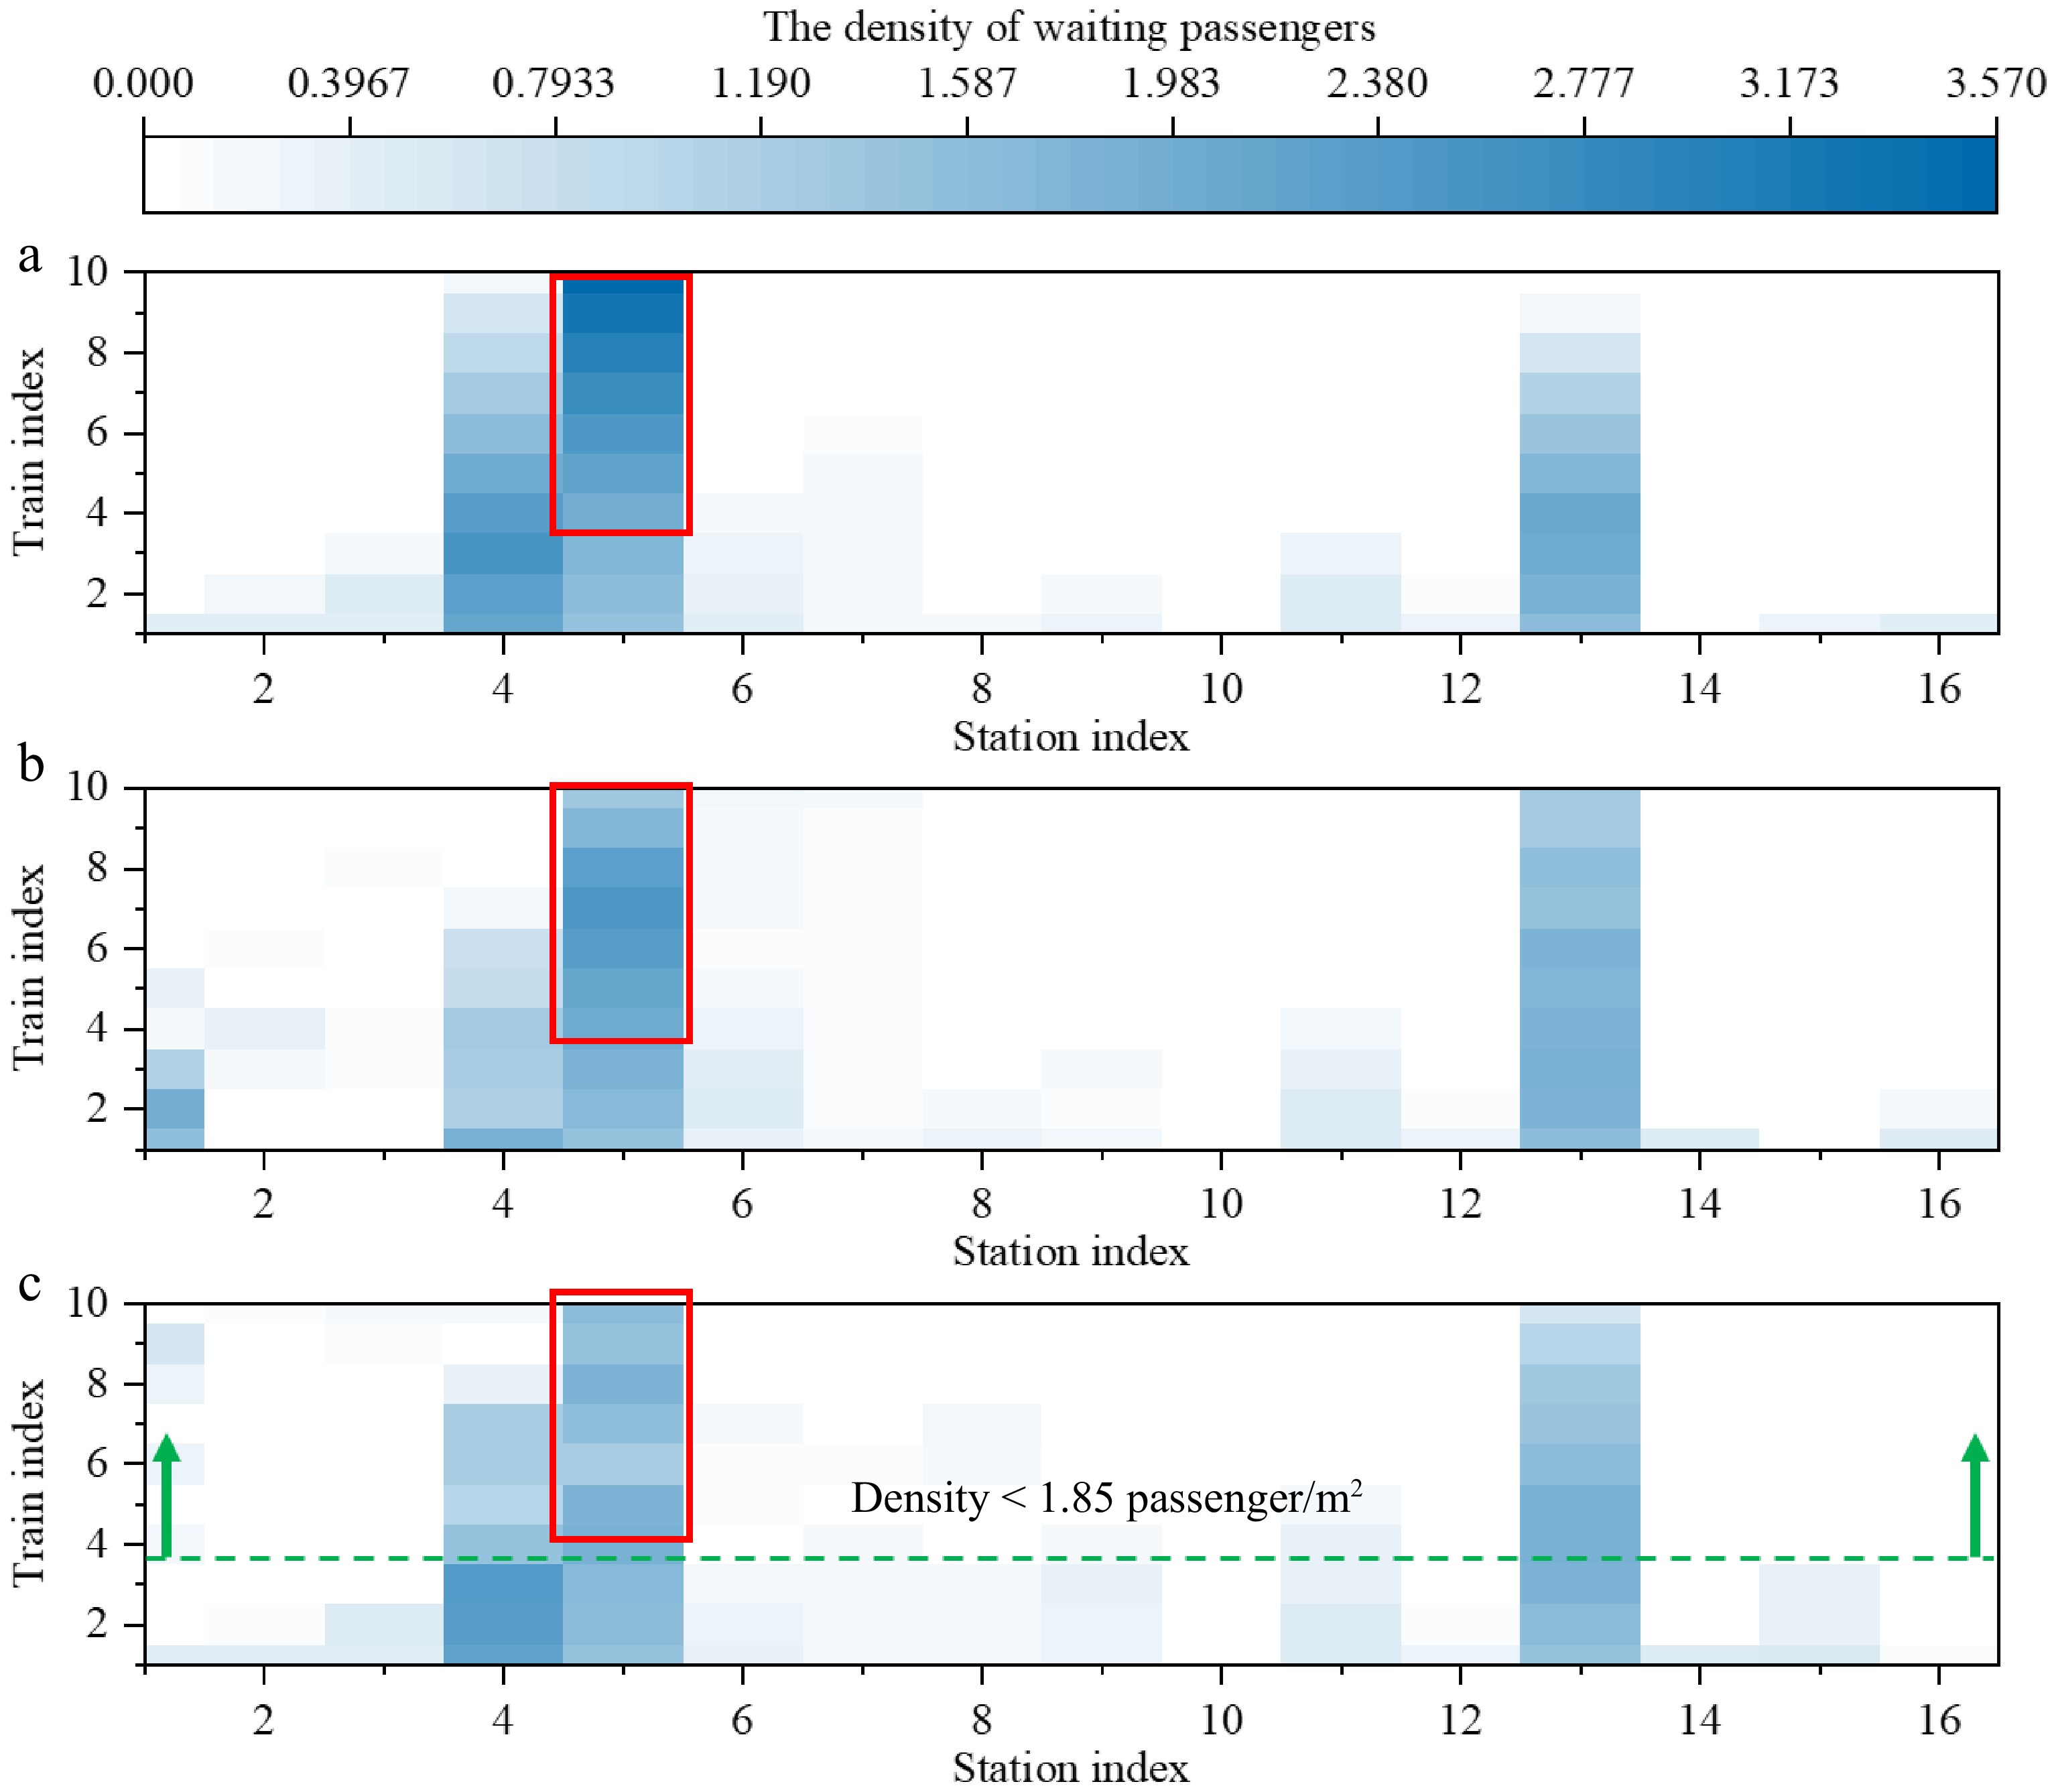
Figure 5.
Distribution of waiting density by scenario. (a) Plan A, (b) Plan B1, and (c) Plan B2.
As shown in Fig. 5, the passenger density distribution in Plan B1 shows significant improvement compared to Plan A, particularly in reducing peak passenger density at station 4 during the early operation phase and at station 5 in the later phase. However, Plan B1 also leads to increased crowding at station 13, and the crowding level at station 5 in the later phase remains relatively high, with no significant improvement in operation progress. In contrast, the passenger density distribution in Plan B2 demonstrates significant improvements in reducing extreme congestion and overall crowding levels compared to both Plans A and B1. After the operation of train 4, the passenger density at all stations remains below 1.85 passengers/m2 and is more evenly distributed, as shown by the green dashed line in Fig. 5. This effectively alleviates platform crowding in a shorter time. Additionally, the high crowding level at station 5 in the later phase is also resolved, reducing the probability of accidents due to overcrowding, specifically, as highlighted in the red outline in Fig. 5.
The stopping plan and departure headways for Plan B2 are shown in Tables 4 & 5.
Table 4. Decision-making variables for Plan B2.
Train Station 1 2 3 4 5 6 7 8 9 10 11 12 13 14 15 16 17 1 1 1 1 0 1 1 1 1 1 1 1 1 0 1 0 1 1 2 1 1 1 1 1 1 1 0 0 1 0 1 1 1 1 1 1 3 1 1 1 1 1 1 0 1 0 1 1 1 1 1 0 1 1 4 0 1 1 1 1 1 1 1 1 0 1 0 1 0 1 1 1 5 1 1 1 1 1 0 1 1 1 1 1 1 1 0 0 1 1 6 0 1 1 0 1 0 0 1 1 1 1 1 1 1 1 1 1 7 1 1 1 1 0 1 1 0 1 1 1 1 1 1 1 1 1 8 0 1 1 1 1 1 1 1 1 1 1 0 1 1 0 1 1 9 0 1 0 1 1 1 1 1 1 1 1 1 1 0 1 1 1 10 1 0 1 1 1 1 1 1 1 1 1 1 1 1 1 1 1 Table 5. Departure headways variables for Plan B2.
Adjacent train number 1−2 2−3 3−4 4−5 5−6 6−7 7−8 8−9 9−10 Departure interval (s) 151 128 131 93 164 149 149 150 142 The train operation diagram corresponding to Plan B2 is shown in Fig. 6.
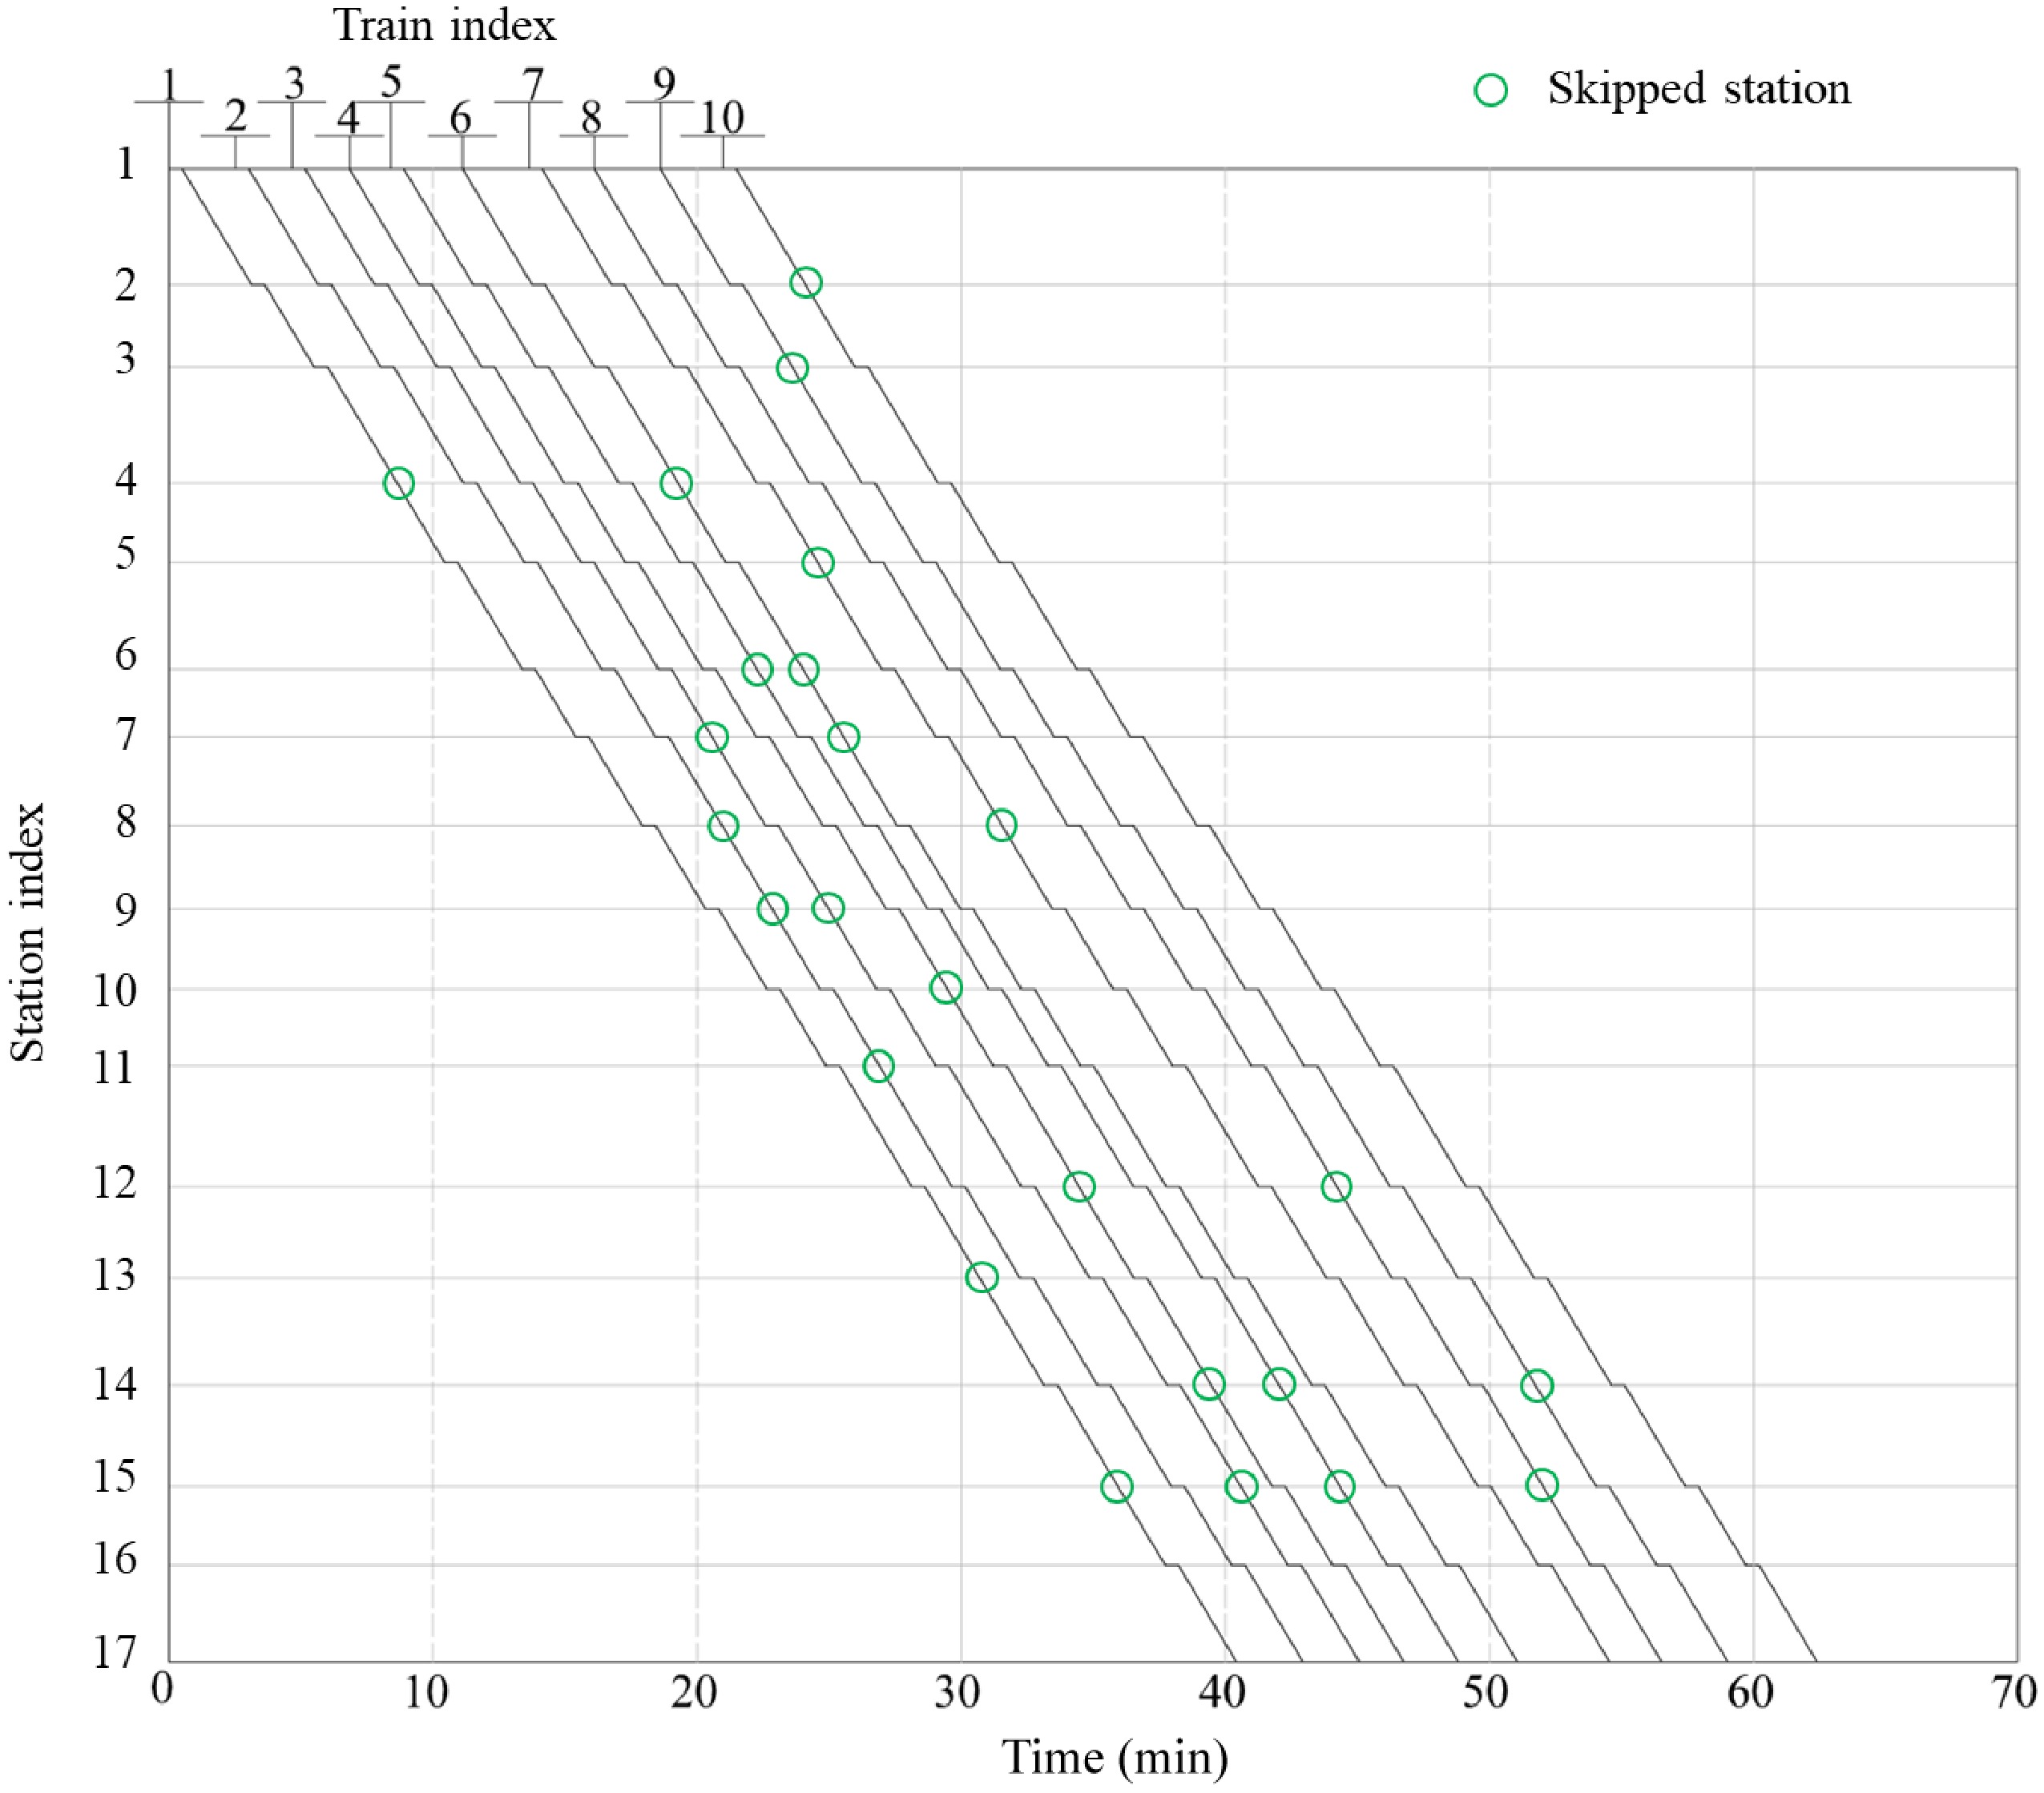
Figure 6.
Train timetable for Plan B2.
Sensitivity analysis
-
To observe how each evaluation index changes with the maximum number of skipped stations Nmax for each train, plan B2's parameter settings were used, while keeping other input parameters fixed. Nmax was progressively increased from 3 to 7. As shown in Fig. 7, both the average waiting time and the train's carrying capacity per second, two key evaluation indicators, show a trend of first improving and then worsening, reaching the optimal point when Nmax = 5. At this point, the optimal average waiting time is 781.21 s, and the optimal carrying capacity is 38.94 per·km/s.
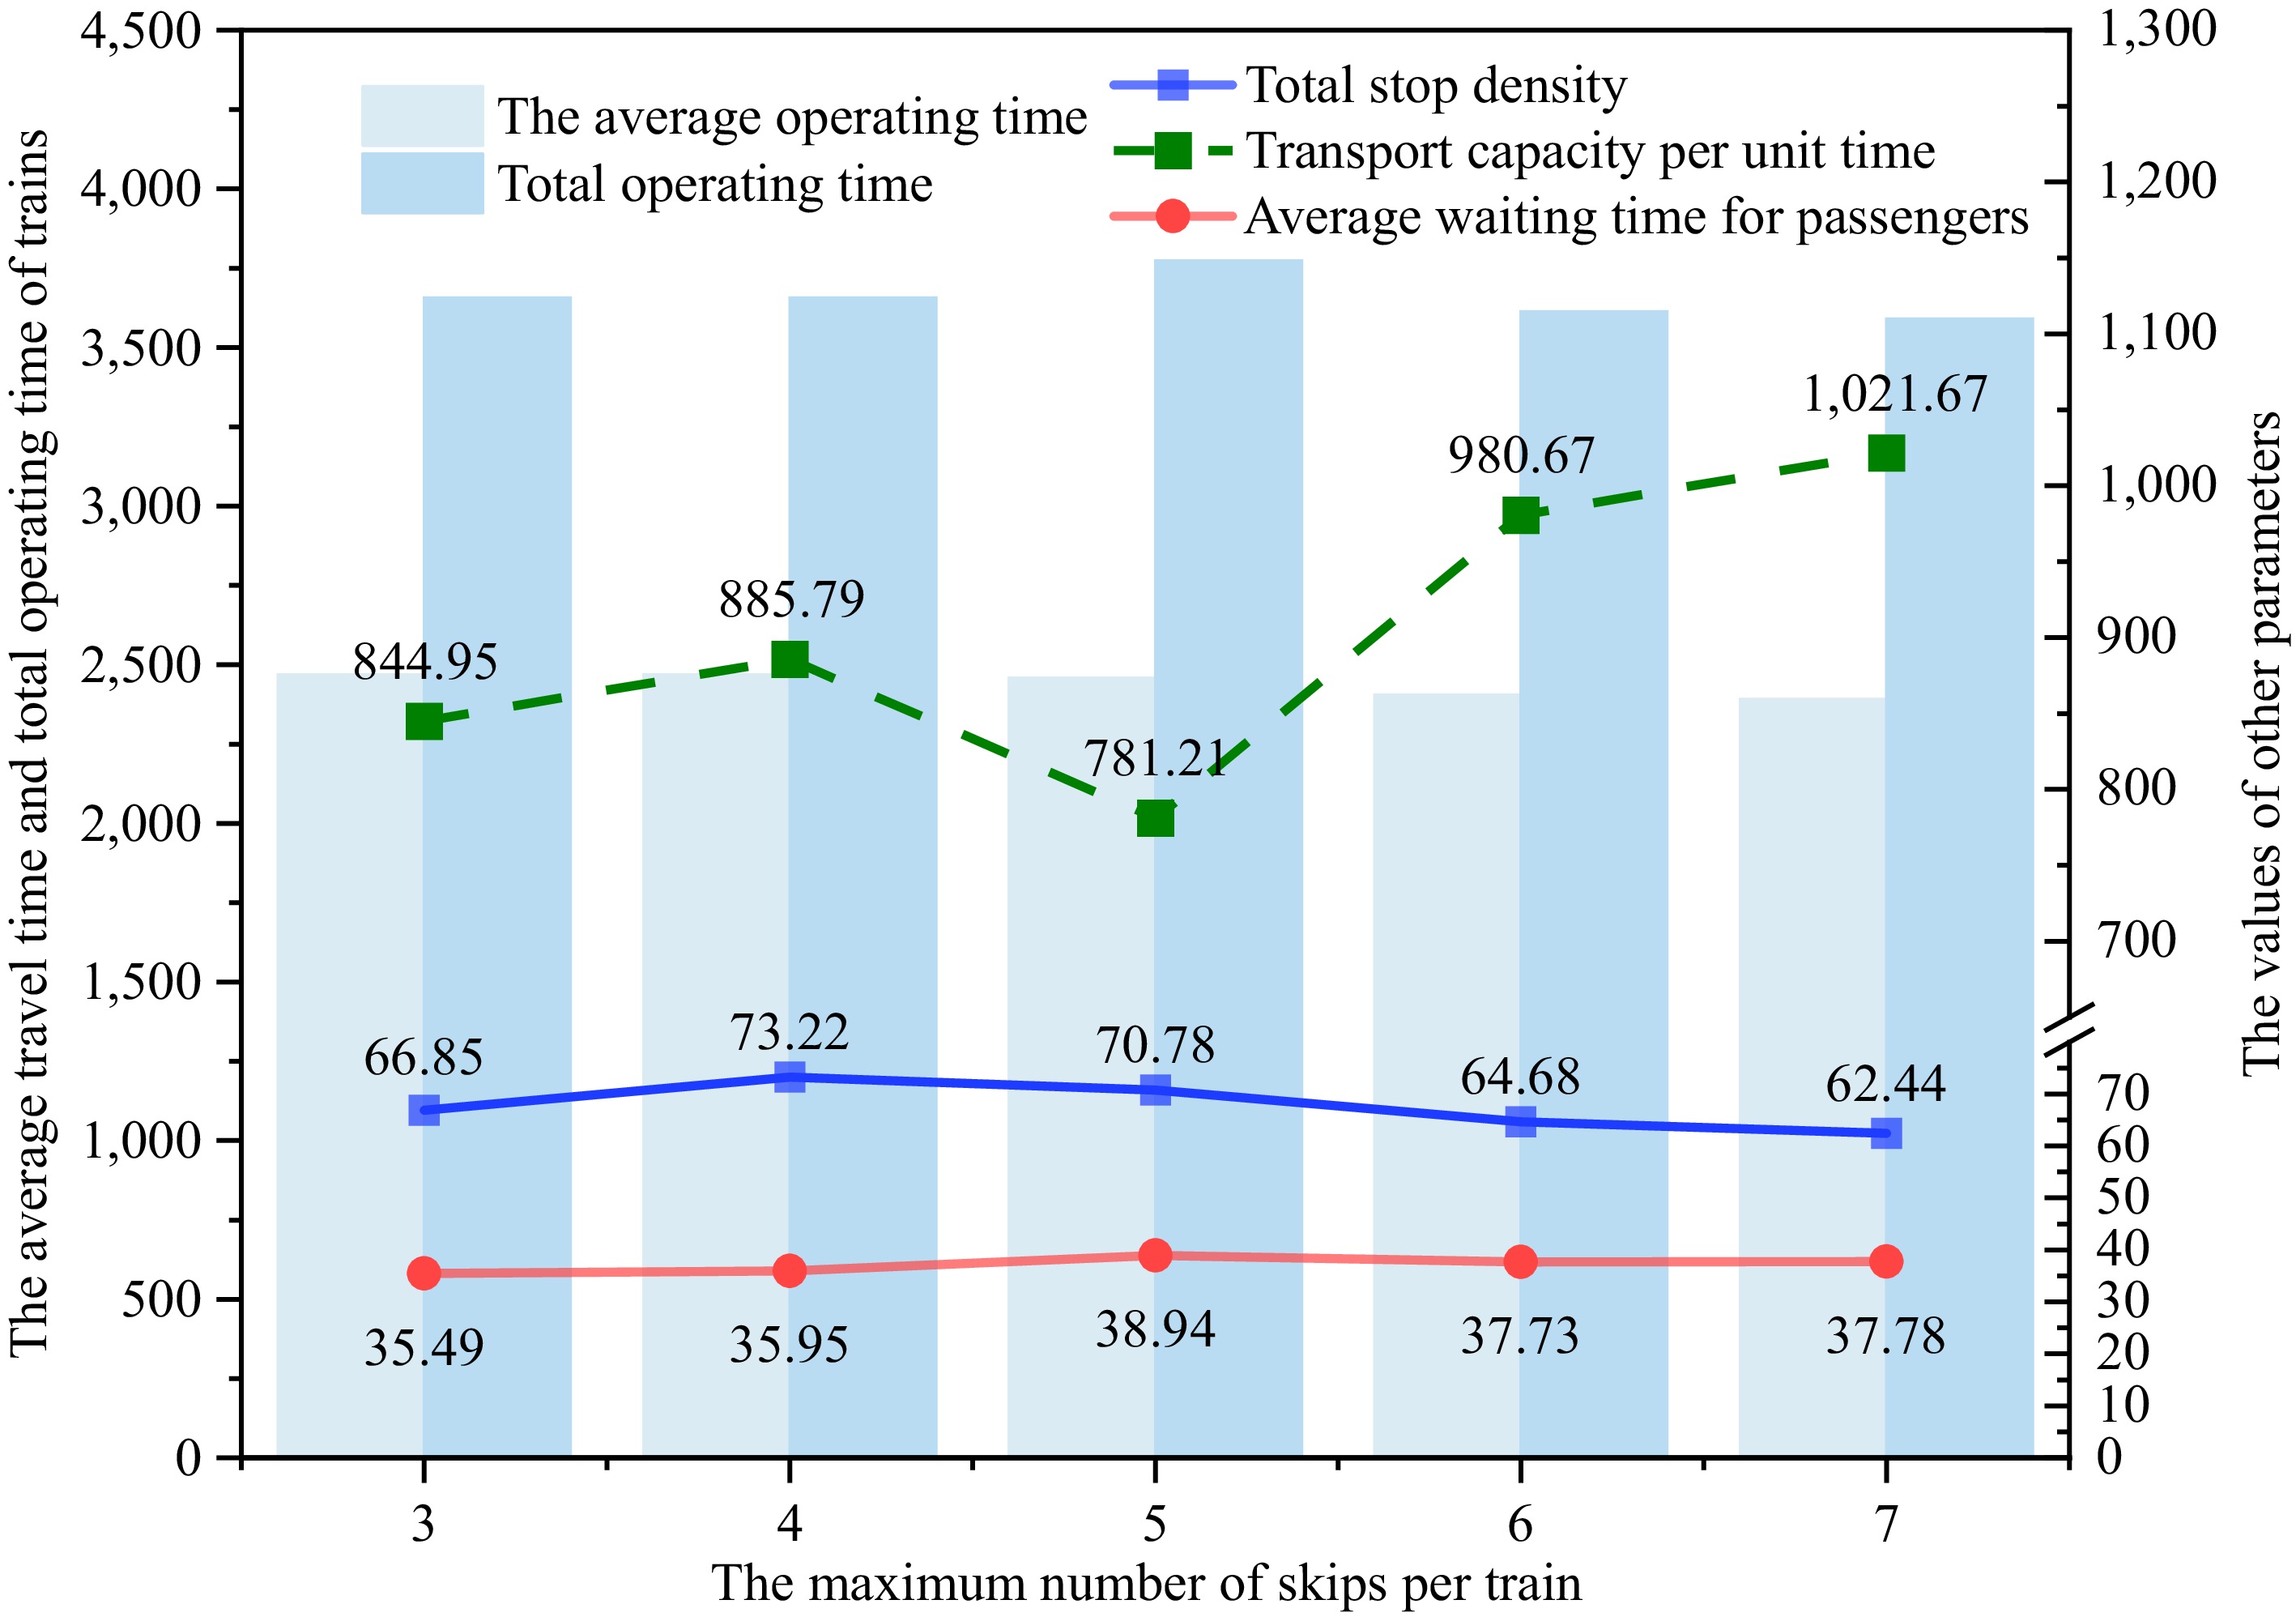
Figure 7.
Sensitivity analysis of maximum number of skipped stations.
-
To address the uneven spatial distribution of dynamic passenger flow, this study proposes a coordinated optimization plan for train stopping and scheduling that incorporates station crowding balance. The goal is to optimize train stop density, station crowding balance, train operation time, and average waiting time while considering constraints such as operational safety and passenger demand. A nonlinear integer programming model is developed to achieve these objectives. The case study using real-world data shows that the optimized plan reduced average waiting time by 10.44% and increased the train's carrying capacity per second by 13.63%, compared to the all-stop plan. Additionally, compared to the traditional stopping plan, which does not account for station crowding balance, the optimized plan reduced average waiting time by 5.24% and more effectively balanced passenger density across stations.
Future work is outlined from two perspectives. First, for global optimization of URT lines, it is essential to extend the study of skip-stop and schedule co-optimization from a single line to a broader network level. Moreover, to better account for passenger satisfaction in a multi-line transfer context, factors like crowding, transfer failures, and travel time costs could be included as penalties in satisfaction calculations.
This work was supported by the National Natural Science Foundation of China (Grant Nos 72331001 and 72071015) and the 111 Center (Grant No. B20071).
-
The authors confirm contribution to the paper as follows: study conception and design: Han J; data collection: Xue Q, Yuan Y; analysis and interpretation of results: Yang X, Wu J; draft manuscript preparation: Han J, Xue Q. All authors reviewed the results and approved the final version of the manuscript.
-
The datasets generated during and/or analyzed during the current study are available from the corresponding author on reasonable request.
-
The authors declare that they have no conflict of interest. Xin Yang and Jianjun Wu are the Editorial Board members of Digital Transportation and Safety who were blinded from reviewing or making decisions on the manuscript. The article was subject to the journal's standard procedures, with peer-review handled independently of these Editorial Board members and the research groups
- Copyright: © 2025 by the author(s). Published by Maximum Academic Press, Fayetteville, GA. This article is an open access article distributed under Creative Commons Attribution License (CC BY 4.0), visit https://creativecommons.org/licenses/by/4.0/.
-
About this article
Cite this article
Han J, Xue Q, Yuan Y, Yang X, Wu J. 2025. Integrated optimization of train stopping plans and timetabling for urban rail transit based on dynamic demand. Digital Transportation and Safety 4(1): 42−49 doi: 10.48130/dts-0025-0001 

Integrated optimization of train stopping plans and timetabling for urban rail transit based on dynamic demand
- Received: 07 November 2024
- Revised: 28 November 2024
- Accepted: 29 November 2024
- Published online: 31 March 2025
Abstract: This study addresses the higher demand of passengers during peak hours in urban rail transit by proposing an integrated optimization of train stopping plans and timetabling to reduce overcrowding and the total waiting time. A nonlinear integer programming model is developed, incorporating passenger demand, operation costs, train capacity, and station congestion levels. The decision variables include the stopping plan and departure headways. The objective is to minimize total operation time, average operation time, and waiting time, while reducing congestion variance across stations. A case study using the NSGA-II algorithm shows that the optimized solution significantly alleviates station congestion compared to the all-stop plan. Additionally, it reduces average operation time, total operation time, and waiting time by 3.42%, 9.40%, and 10.44%, respectively, demonstrating the model's feasibility and effectiveness.