


-
With the rapid increase in demand for freeway freight turnover, five-axle and six-axle articulated trucks have become the main vehicle types for freight transportation in China. In 2018, semi-trailer trucks accounted for 86.32% of freeway freight turnover[1], with six-axle articulated trucks, particularly 6 × 4 tractor units paired with three-axle semi-trailers, handling most of this freight[2]. The average tonnage of freight vehicles on national freeways continues to rise, indicating a trend toward larger trucks. These large vehicles often exhibit lower speeds on long uphill grades due to insufficient power performance. When lane capacity is limited and the number of large freight vehicles is high, this can disrupt the normal flow of traffic, increasing the risk of congestion and accidents. Current regulations regarding the maximum gradient and slope lengths of freeways are derived from the 'Design Specification for Highway Alignment' (China) and the 'Technical Standard for Highway Engineering' (China). These standards are based on the climbing performance of a 12-ton truck with a specific power of 9.3 kW/t on various gradients[3]. However, this specification does not align with the actual performance capabilities of contemporary articulated trucks widely used in China, which generally have lower climbing speeds. To mitigate the impact of heavily loaded trucks on traffic, especially on uphill sections, additional climbing lanes may need to be established. Therefore, it is crucial to reevaluate the maximum gradient and slope lengths of freeways in China based on the specific power of current mainstream freight vehicle models. This adjustment is essential for enhancing road safety and operational efficiency.
The power-to-weight ratio is the ratio of the maximum output power of an engine to the maximum total mass of a vehicle. It is an important indicator for measuring the power performance of a car, which indicates that a higher power-to-weight ratio represents better power performance of the vehicle. Therefore, the power-to-weight ratio is widely used in road longitudinal section design. Yu[4] discussed the influence of various factors such as power-to-weight ratio, tire type, road surface type, and road alignment on the climbing performance curve of heavy vehicles, concluding that the power-to-weight ratio is the most significant factor affecting the climbing performance of heavy trucks. Glennon & Joyner[5] studied the impact of road longitudinal slope, power-to-weight ratio, and other factors on the climbing performance of large vehicles, suggesting the need for climbing lanes when the speed reduction reaches 10 mph. Xu[6] investigated data from 6-axle trucks on steep sections of multiple freeways in Zhejiang Province (China), determining the power-to-weight ratio range of the dominant vehicle type on Zhejiang freeways to be 7.04 to 8.43 kW/t, and providing a recommended power-to-weight ratio for the dominant vehicle type. Zhuang[7] established the dominant vehicle type for freeway longitudinal slope design based on the 15th percentile power-to-weight ratio value and provided conditions for setting critical slope lengths and climbing lanes on mountainous freeways under different speed reduction amounts based on vehicle climbing performance curves. Zhang[8] used Trucksim software to establish a 'human-vehicle-road' road model for six-axle heavy semi-trailers, with simulation results showing that for every 1 kW/t increase in the vehicle's power-to-weight ratio, the minimum travel speed of the vehicle during uphill travel increases by nearly 10 km/h. Lin et al.[9] through analyzing the distribution of vehicle loads on the G5 Jingkun Expressway and the incidence of traffic accidents stated that the low power-to-weight ratio of large trucks is a major cause of frequent traffic accidents.
Many researchers have a consistent approach to studying the maximum longitudinal slope and critical slope length of freeways. They select one or more design vehicle types, conduct real vehicle experiments or use computer simulations, and determine the maximum longitudinal slope and critical slope length of the freeway based on the climbing performance curves of the selected design vehicles. The Freeway Capacity Manual (HCM) in the United States analyzed the setting of climbing lanes based on the climbing performance curves of heavy trucks with a specific power of 120 kg/kW. Lan & Menendez[10] supplemented climbing performance curves for vehicles with specific powers other than 120 kg/kW and determined the critical slope length indicators for climbing lanes. Rakha & Yu[11] analyzed the impact of vehicle tires and aerodynamic auxiliary equipment on vehicle climbing performance, establishing the conditions for setting up truck climbing lanes and revising the truck climbing performance curves in the HCM manual. Hristov[12] conducted real vehicle experiments on the unrestricted speed sections of the German A72 freeway. The results indicated that the longitudinal gradient of uphill sections significantly affects vehicle speed and the speed difference between the bottom and top of the slope. On sections with gradients larger than 4%, vehicle speeds significantly decreased, and speed differences increased significantly. Zhao et al.[13] studied the climbing performance of vehicles with a specific power of 5−8 kW/t, developed a vehicle longitudinal slope model, and found that when the longitudinal slope is less than 3%, there is no need to set a critical slope length. However, when the slope exceeds 3%, some vehicle types experience climbing difficulties, necessitating the setting of climbing lanes.
Zhang[14] investigated the distribution of large truck types on the Wuqi Expressway, using the Dongfeng EQ5208XXY2 box-type cargo truck as the experimental vehicle type, and determined the average longitudinal slope and slope length limits on the high-speed desert freeways under non-auxiliary braking conditions. Xu et al.[15] selected cars with specific power of 120 kg/kW for real-world experiments at different altitudes. They found that under similar gradients, the equilibrium speed of typical cars decreased by 4−7 km/h at an altitude of 4,300 m compared to 3,200 m, with a range of 100−200 m for stable slope length reduction. Xu et al.[16] et al. derived a model for calculating truck speeds at any position on continuous ramps, using this model to compute the distance vehicles travel when accelerating/decelerating to a specific speed, thereby obtaining critical slope length values at different speeds. Peng et al.[17] used Trucksim simulation software to establish a climbing simulation model for heavy vehicles on uphill sections, discovering that the stable speed of vehicles is independent of the initial climbing speed. When the initial speed is less than 70 km/h, the longitudinal slope is less than 5%, and the total mass is less than 35 t, the speed reduction for heavy-load vehicles during climbing is relatively small.
Research abroad has determined the climbing performance of heavy-duty trucks under various working conditions using experimental and theoretical methods. However, the power performance of foreign vehicles differs significantly from that of domestic vehicles, making it inappropriate to directly apply their findings on slope length/slope gradient. Domestic studies on the maximum gradient/slope length on highways primarily use real vehicle experiments and theoretical methods, with relatively fewer simulation studies. The combinations of working conditions in real vehicle experiments are limited, and the experimental models are often singular, resulting in insufficient representativeness of the experimental results. To address these issues, this paper integrates the latest power-to-weight ratio data of articulated trains in China, selecting the 15th and 50th percentiles of power-to-weight ratios as parameters for the simulation model. The primary reason for this selection is that if the hill-climbing performance of vehicles with a power ratio at the 15th percentile can satisfy the current slope/length restrictions, then the hill-climbing performance of the remaining 85% of vehicles will also be met. The secondary reason is that the 50th percentile of specific power encompasses a greater number of samples, which can be compared with the simulation data of the 15th percentile of specific power, thereby enhancing the credibility of the simulation experiment.
-
This study sourced data from the Truck Home website, selecting 147 popular models from 35 tractor brands including Jiefang, Dongfeng, and Foton. Parameters collected included maximum engine output power, curb weight, gross towing weight, number of driving axles, maximum torque, and maximum horsepower of the tractors. Since five- and six-axle articulated trucks are composed of combinations of two-axle and three-axle tractors with three-axle semi-trailers respectively, this study used the collected curb weight of the tractors plus their maximum gross towing weight to represent the maximum gross weight of the final five- and six-axle articulated trucks. The specific power of the tractor's engine output divided by the maximum gross weight represents the specific power of the five- and six-axle articulated trucks.
The total sample capacity of tractor units is 1,758, including 369 two-axle tractor units, all with a 4 × 2 drive configuration; and 1,389 three-axle tractor units, consisting of 57 units with a 6 × 2 drive, 11 units with a 6 × 2R drive, 1,317 units with a 6 × 4 drive, and four units with a 6 × 6 drive. Figure 1 illustrates the types of tractor units. From the collected data on tractor units, it can be observed that the number of available three-axle tractor models far exceeds that of two-axle tractor models, with a ratio of approximately 4:1. Among these, three-axle tractor units with a 6 × 4 drive configuration dominate, accounting for as much as 92.78%. The high proportion of three-axle tractor units is due to the new regulations in the 2016 release of 'Limits of dimensions, axle load and masses for motor vehicles, trailers, and combination vehicles' (GB1589-2016), which stipulates a maximum allowable total mass limit of 49 tonnes for six-axle articulated vehicles, compared to only 43 tonnes for five-axle articulated vehicles. Greater payload capacity translates to higher economic benefits, leading drivers to prefer six-axle articulated vehicles with the maximum allowable mass limit from an economic standpoint. Consequently, the number of available three-axle tractor models far exceeds that of two-axle tractor models, and freeway cross-section design reference vehicles should also select six-axle articulated vehicles.
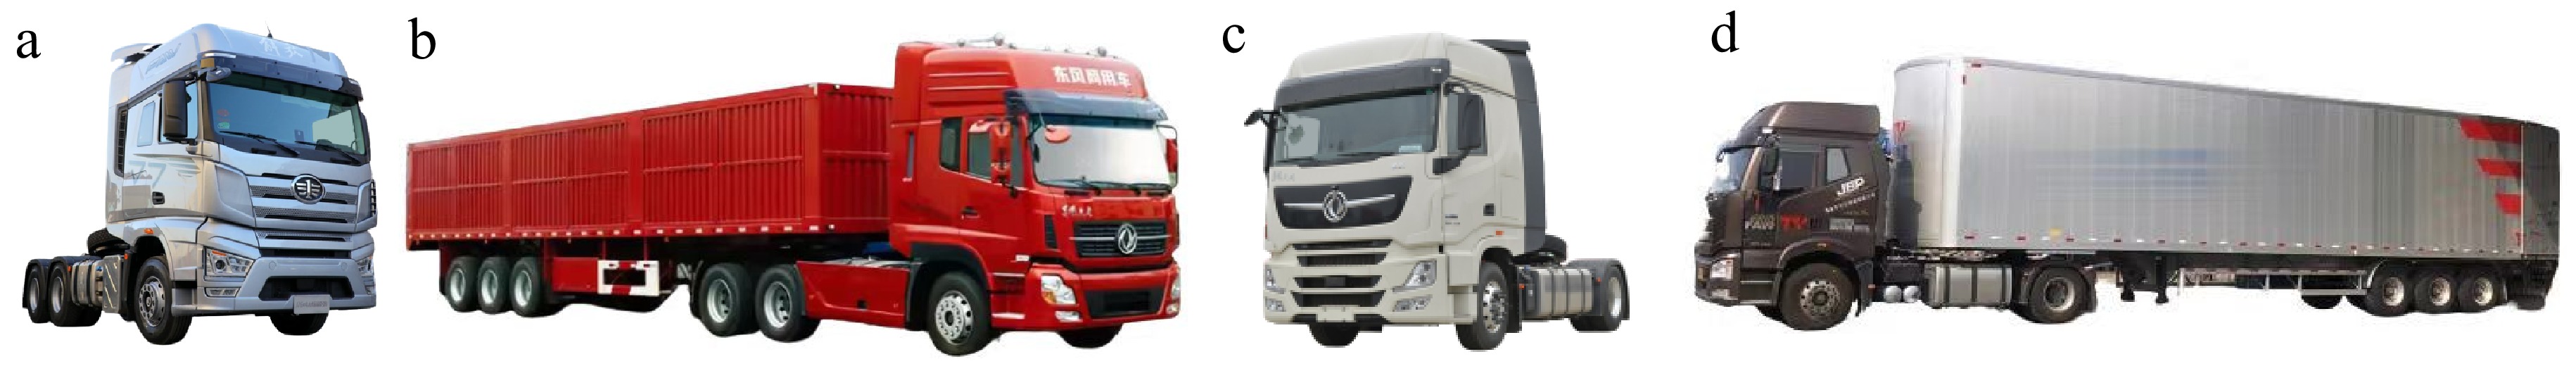
Figure 1.
Tractor cars with different axle types and articulated trains. (a) Three-axle tractor. (b) Six-axle articulated vehicle. (c)Two-axle tractor. (d) Five-axle articulated vehicle.
To ensure the accuracy of the collected data, a stratified sampling method was used to select 10% of the samples for comparison with official vehicle data. The comparison results are shown in Table 1.
Table 1. Verification of vehicle data accuracy.
Vehicle type Number of sample drawings Data accuracy (%) Two-axle tractor 37 100 Three-axle tractor 140 100 Semi-trailer 35 100 Vehicle simulation model
-
In Trucksim software, simulated vehicles' dimensions, body weight, power systems, suspension systems, and other parameters can be meticulously adjusted as needed. Due to the distinct structure of articulated trucks, parameters must be individually configured for the tractor unit, semitrailer, and cargo. Figure 2 depicts various parts of the articulated truck model, while Table 2 provides the parameter settings for simulated vehicle types. Parameters not specified in Table 2 should remain at their default values.
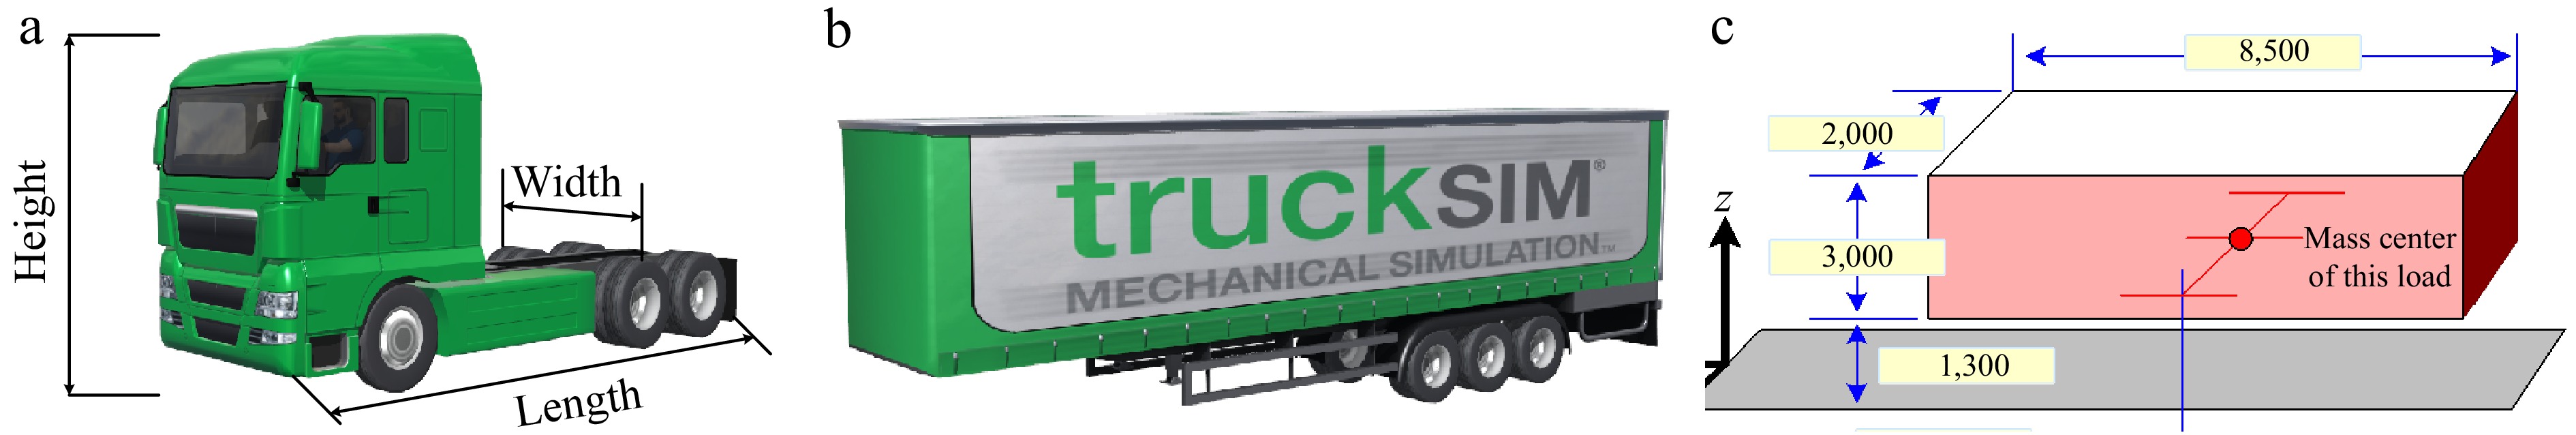
Figure 2.
Simulate vehicle models. (a) Tractor model. (b) Semi-trailer model. (c) Load model.
Table 2. Simulated parameter settings of the car model.
Parameter Tractor Semi-trailer Load Mass (kg) 11,560 5,500 30,408/26,167 Height (mm) 3,680 3,068 3,000 Length (mm) 7,110 11,896 8,500 Width (mm) 2,530 2,565 2,000 Power (kW) 300 / / Specific power (kW/t) 6.32/6.94 / / Road simulation model
-
A four-lane road model was created in the Trucksim software, featuring a lane width of 3.75 m, a left hard shoulder width of 1.5 m, and a right hard shoulder width of 3 m. This model simulates a one-sided driving scenario with four lanes in each direction on the expressway. The road model includes horizontal sections, vertical curves, and longitudinal slope sections, with the parameters of the vertical curves meeting the requirements specified in the code. Figure 3a illustrates a schematic diagram of the simulated road model with a 3% longitudinal slope, while Fig. 3b displays the actual road model effect in the Trucksim software.
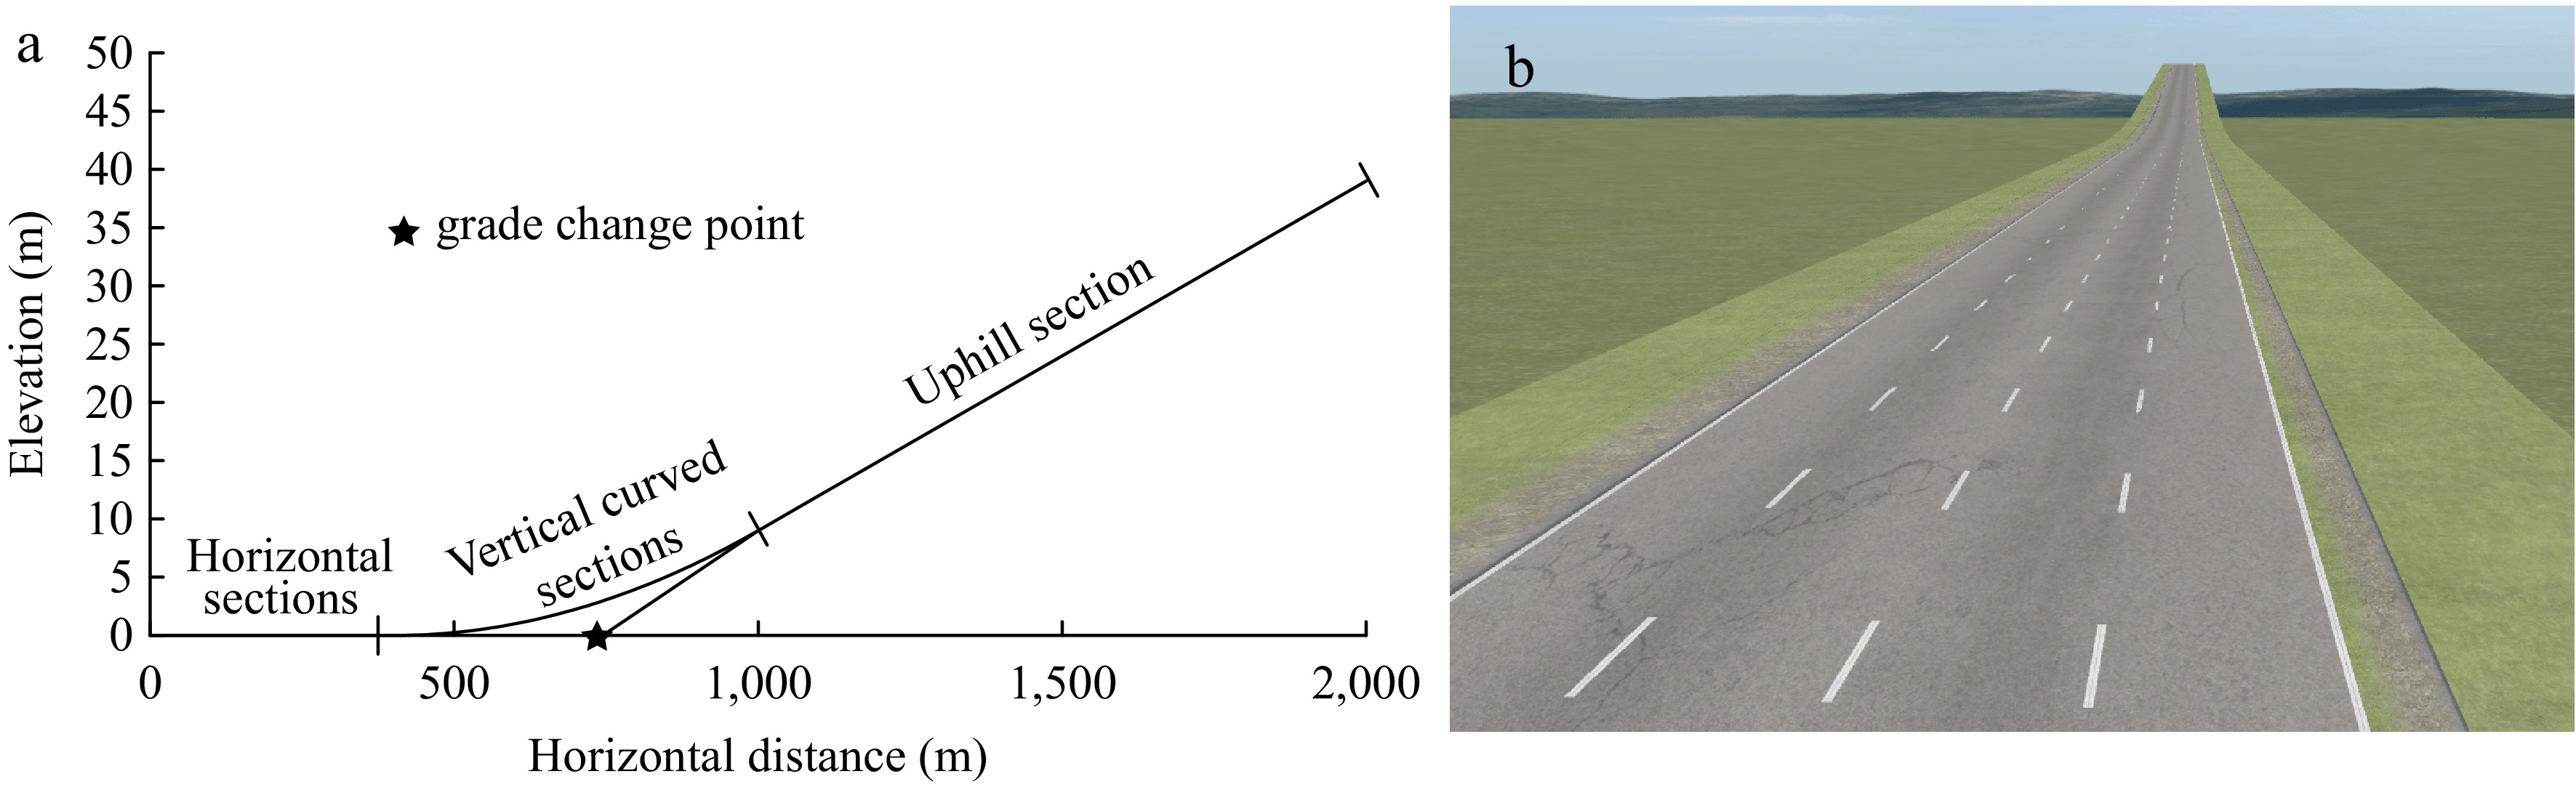
Figure 3.
Profile of the road model and its simulation effect. (a) Road profile. (b) Road simulation model.
-
The power-to-weight ratio in trucks is a measure of truck performance, calculated as the engine output power of the tractor unit divided by the total mass of the truck. A higher power-to-weight ratio indicates better uphill climbing performance. Five-axle and six-axle articulated trucks exhibit significant differences in power-to-weight ratio due to variations in engine power and maximum permissible total mass. Clearly defining the distribution of power-to-weight ratios for five-axle and six-axle heavy-duty articulated trucks is crucial for selecting the predominant vehicle type in road profile design.
Specific power distribution characteristics
-
The power-to-weight ratio is determined by the engine output power and the total mass of trucks. Therefore, frequency distribution histograms and cumulative frequency curves were created for the data of 1,758 tractor units, focusing on engine output power, maximum total mass, and power-to-weight ratio, as shown in Fig. 4.
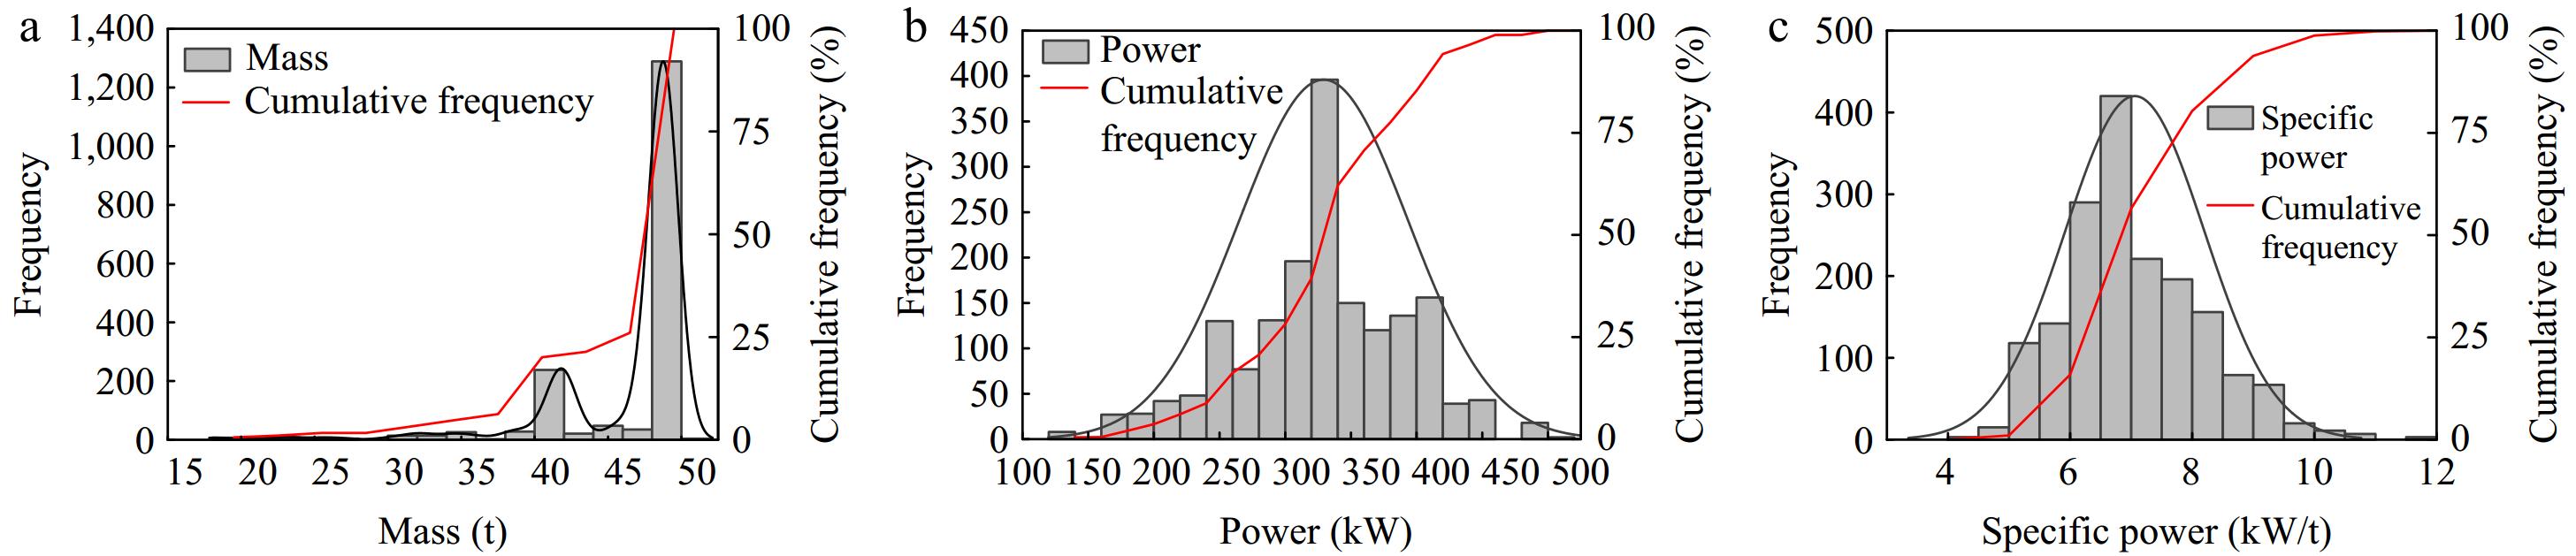
Figure 4.
Distribution of mass, power, and specific power. (a) Mass distribution. (b) Power distribution. (c) Specific power distribution.
From Fig. 4a, it can be observed that the maximum total mass of five-axle and six-axle articulated trucks exhibits a bimodal distribution, primarily concentrated in two intervals: 39~43 t and 48~49 t. Specifically, tractor units in the 39~43 t range constitute 14.9%, while those in the 48~49 t range make up 69.2%. This distribution arises because according to 'Limits of dimensions, axle load and masses for motor vehicles, trailers and combination vehicles' (GB1589-2016), the maximum total weight limit is set at 43 t for five-axle articulated trucks and 49 t for six-axle articulated trucks. To maximize transport efficiency, vehicles approaching these maximum weight limits are more favored in the market. Additionally, three-axle tractor units are far more prevalent than two-axle units, hence the higher proportion in the 48~49 t range.
From Fig. 4b, it can be seen that the overall distribution of power for five-axle and six-axle articulated trucks forms a 'mountain' shape. The minimum value is 121 kW, found in two-axle tractor units, while the maximum value is 500 kW, observed in three-axle tractor units. Approximately 65% of the data falls within the 280 to 400 kW range, with the 300 to 320 kW interval accounting for 22.68% of the distribution.
Although the mass distribution of five-axle and six-axle articulated trucks is uneven, according to Fig. 4c, the specific power distribution of these trucks is quite concentrated. Approximately 82.9% of the specific power data falls within the range of 6 to 9 kW/t. Samples with specific power above 9 kW/t are limited to 108, accounting for only 6.17% of the total. The standards and regulations are based on the climbing performance of overloaded trucks with a specific power of 9.3 kW/t as the basis for designing road longitudinal sections. There exists a certain gap between the specific power of current five-axle and six-axle articulated trucks and this standard, necessitating a reevaluation of road longitudinal section design criteria based on the specific power data of models currently dominating the market.
From the data in Table 3, it is evident that currently, 85% of the five-axle and six-axle articulated trucks in the domestic market have a specific power below 8.29 kW/t, with an average of only 7.05 kW/t. The 85th percentile value for the specific power of domestic trucks (8.29 kW/t) is even slightly lower than the 15th percentile value for the specific power of European and American trucks (8.82 kW/t), indicating significant differences in climbing performance between them.
Table 3. Total mass, power, and specific power characteristic quantile.
Indicators Area 15th 25th 50th 75th 85th Average Mass (t) China 41.81 47.72 48.80 48.81 48.87 46.54 Europe and America 38.03 39.51 42.01 45.00 45.01 42.09 Power (kW) China 257.00 294.00 338.00 368.00 397.00 329.25 Europe and America 364.15 368.00 411.50 473.75 522.70 427.50 Specific power (kW/t) China 5.94 6.32 6.94 7.81 8.29 7.05 Europe and America 8.82 9.11 9.83 10.53 11.73 10.12 The Kolmogorov-Smirnov test (K-S test) is a non-parametric method used to determine if there is a significant difference between the overall distributions of two independent samples, without assuming knowledge of the underlying distribution of the population. To investigate whether there is a significant difference in specific power between five-axle and six-axle articulated trucks, the specific power data of these trucks were subjected to a K-S test with a significance level of 0.05. The test results are shown in Table 4. From the results in Table 4, it is evident that there is a significant difference in specific power between five-axle and six-axle articulated trucks. The specific power of each type of truck will be further analyzed in the following sections.
Table 4. K-S test of specific power of five-axle and six-axle articulated trucks.
Vehicle type D Z Asymptotic significance Five-axle articulated truck 0.36704 6.20021 5.829 × 10⁻³⁴ Six-axle articulated truck Comparison of specific power distribution characteristics
-
Figure 5 shows a comparison of the total mass, power, and specific power distribution between five-axle articulated trucks and six-axle articulated trucks. Observing Fig. 5a, it can be seen that there is a partial overlap in the total mass between the two types of vehicles within the range of 33.5 to 44 t. Compared to six-axle articulated trucks, the total mass distribution of five-axle articulated trucks has a broader range, spanning from 18 to 43.62 t. Approximately 66% of the dataset is concentrated between 39 to 41 t, closely approaching the maximum total mass of 43 t specified for five-axle articulated trucks in 'Limits of dimensions, axle load, and masses for motor vehicles, trailers, and combination vehicles' (GB1589-2016). There is one sample with a specific power exceeding the 43-t limit at 43.62 t, while only seven samples are below 20 t, accounting for approximately 1.9% of the total samples. The distribution of maximum total mass for six-axle articulated trucks is highly concentrated, with an overall range of 33.5 to 50.3 t. Approximately 87.1% of the data falls between 48 to 49 t, which complies with the maximum weight limit of 49 t specified for six-axle articulated trucks. Samples ranging from 33.5 to 48 t (excluding 48 t) amount to 96, representing only 6.9% of the total samples for six-axle articulated trucks.
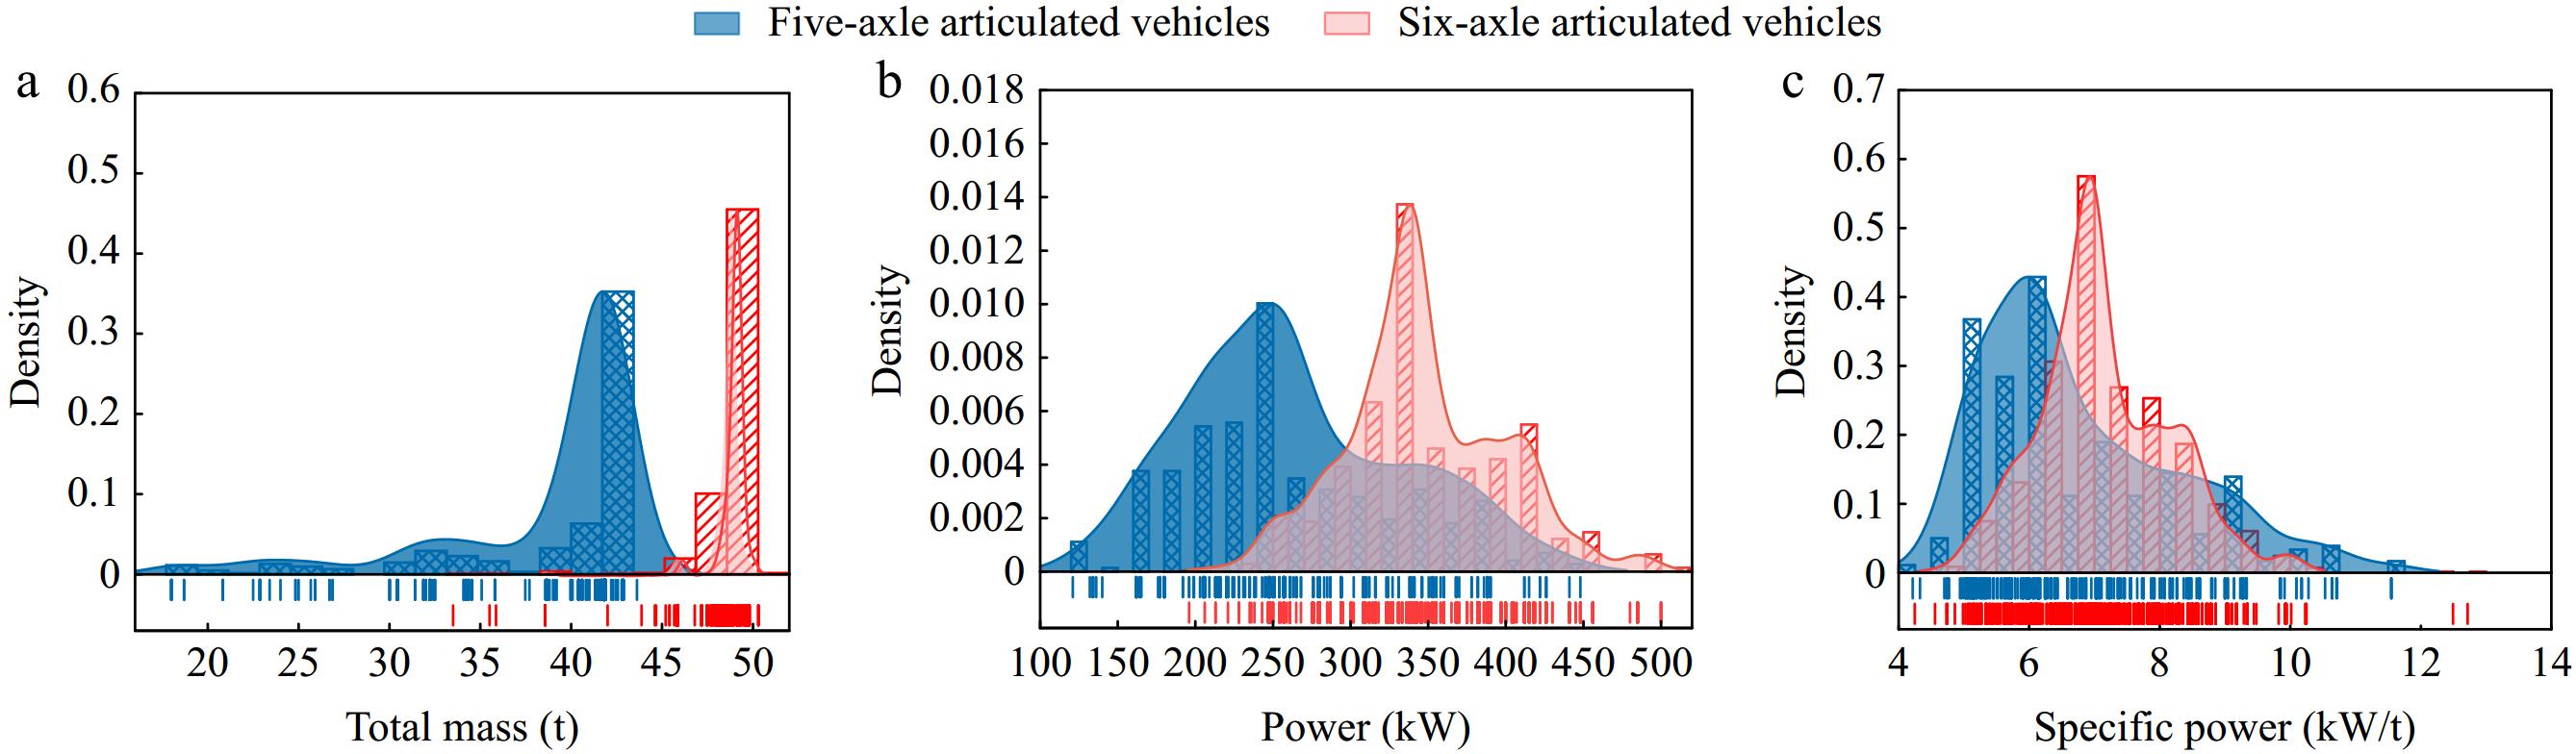
Figure 5.
Comparison of mass, power, and specific power distributions of five-axle and six-axle articulated trains. The higher the specific power, the better the climbing performance. (a) Total mass. (b) Power. (c) Specific power.
Figure 5b is a comparative graph of engine output power between five-axle and six-axle articulated trucks. Due to the absence of regulations similar to maximum total mass limits, the distribution of engine output power is not highly concentrated within specific intervals. For five-axle articulated trucks, the minimum engine output power is 121 kW, and the maximum is 448 kW. The engine output power is most frequently observed in the range of 240 to 260 kW, with 72 samples, accounting for 20.1% of the total five-axle articulated truck samples. The engine output power distribution range for six-axle articulated trucks generally exceeds that of five-axle trucks, ranging from a minimum of 196 kW (equal to the 15th percentile of five-axle truck engine output power) to a maximum of 500 kW. The mode distribution interval is between 320 and 340 kW, with 382 samples, comprising 27.5% of the total six-axle articulated truck samples.
Figure 5c is a comparative graph of the power-to-weight ratio between five-axle and six-axle articulated trucks. Compared to the distribution of total mass and engine output power, the power-to-weight ratio distribution in both vehicle types is most concentrated. The power-to-weight ratio range for five-axle articulated trucks is broader than that of six-axle trucks, with a minimum of 4.21 kW/t and a maximum of 11.5 kW/t. Approximately 50.7% of the data for five-axle articulated trucks' power-to-weight ratios are concentrated between 5 to 7.5 kW/t, with the highest number of samples in the 5 to 5.5 kW/t and 6 to 6.5 kW/t intervals, each accounting for 18.4% and 21.4%, respectively. For six-axle articulated trucks, the power-to-weight ratio ranges from a minimum of 4.24 kW/t to a maximum of 12.71 kW/t. Approximately 54.9% of the data falls within the 6 to 8 kW/t range, with the interval of 6.5 to 7 kW/t containing 400 samples, accounting for 28.8% of the total. Overall, although the mode and mean of the power-to-weight ratio for five-axle articulated trucks are lower than those for six-axle trucks, the number of samples with a power-to-weight ratio above 10 kW/t is slightly higher for five-axle trucks than for six-axle trucks.
Engine brand and specific power
-
The power output performance of engines varies between different engine manufacturers and many automobile manufacturers also differ in designing the maximum gross vehicle weight and maximum towing weight for different tractor units. This leads to varying specific power outputs for five-axle and six-axle articulated trucks using different engines. Among the 1,758 tractor unit samples collected in this study, engine brands include Weichai, Xichai, Yuchai, Shangchai, CNHTC (China Heavy Duty Truck Group Co., Ltd), Dongfeng Cummins, Foton Cummins. Specifically, there are 684 models with Weichai engines, 134 with Xichai engines, 115 with Yuchai engines, 131 with CNHTC engines, 112 with Dongfeng Cummins engines, and 145 with Foton Cummins engines. Tractor units equipped with these six engine brands account for 75.14% of the collected tractor units. Their specific power data can represent the climbing ability of mainstream tractor units in the market. Due to the smaller sample sizes of tractor units with other engine brands, the analysis focuses solely on the specific power of tractor units equipped with engines from the aforementioned six engine brands.
Figure 6 shows the specific power boxplot distribution of 1,321 tractor units equipped with engines from six aforementioned brands, sorted in ascending order of median values, with box data ranging from the 25th to the 75th percentiles. From Fig. 6a, it can be observed that tractor units with Weichai engines have the largest number of samples, and their specific power distribution interval is also the most concentrated, with a boxplot range of 6.46 to 7.35 kW/t. The median (6.92 kW/t) and mean (6.94 kW/t) specific power values of tractor units with Weichai engines are relatively low, ranking fourth among the six engine brands, but they have the highest number of samples exceeding 10 kW/t specific power. Tractor units equipped with Xichai engines have the widest specific power distribution interval, with a boxplot range of 6.25 to 8.49 kW/t. The specific power distribution ranges for other brands are as follows: Yuchai, 5.90 to 6.94 kW/t; CNHTC, 5.65 to 7.23 kW/t; Dongfeng Cummins, 7.28 to 8.56 kW/t; Foton Cummins, 7.09 to 8.44 kW/t. Considering the specific power data above, even the tractor units with Dongfeng Cummins engines, which have the highest median (8.442 kW/t) and mean (8.004 kW/t) specific power values, do not exceed 9.3 kW/t. Further determination of the maximum slope length and gradient on freeways will depend on the actual climbing capabilities of heavily loaded vehicles.
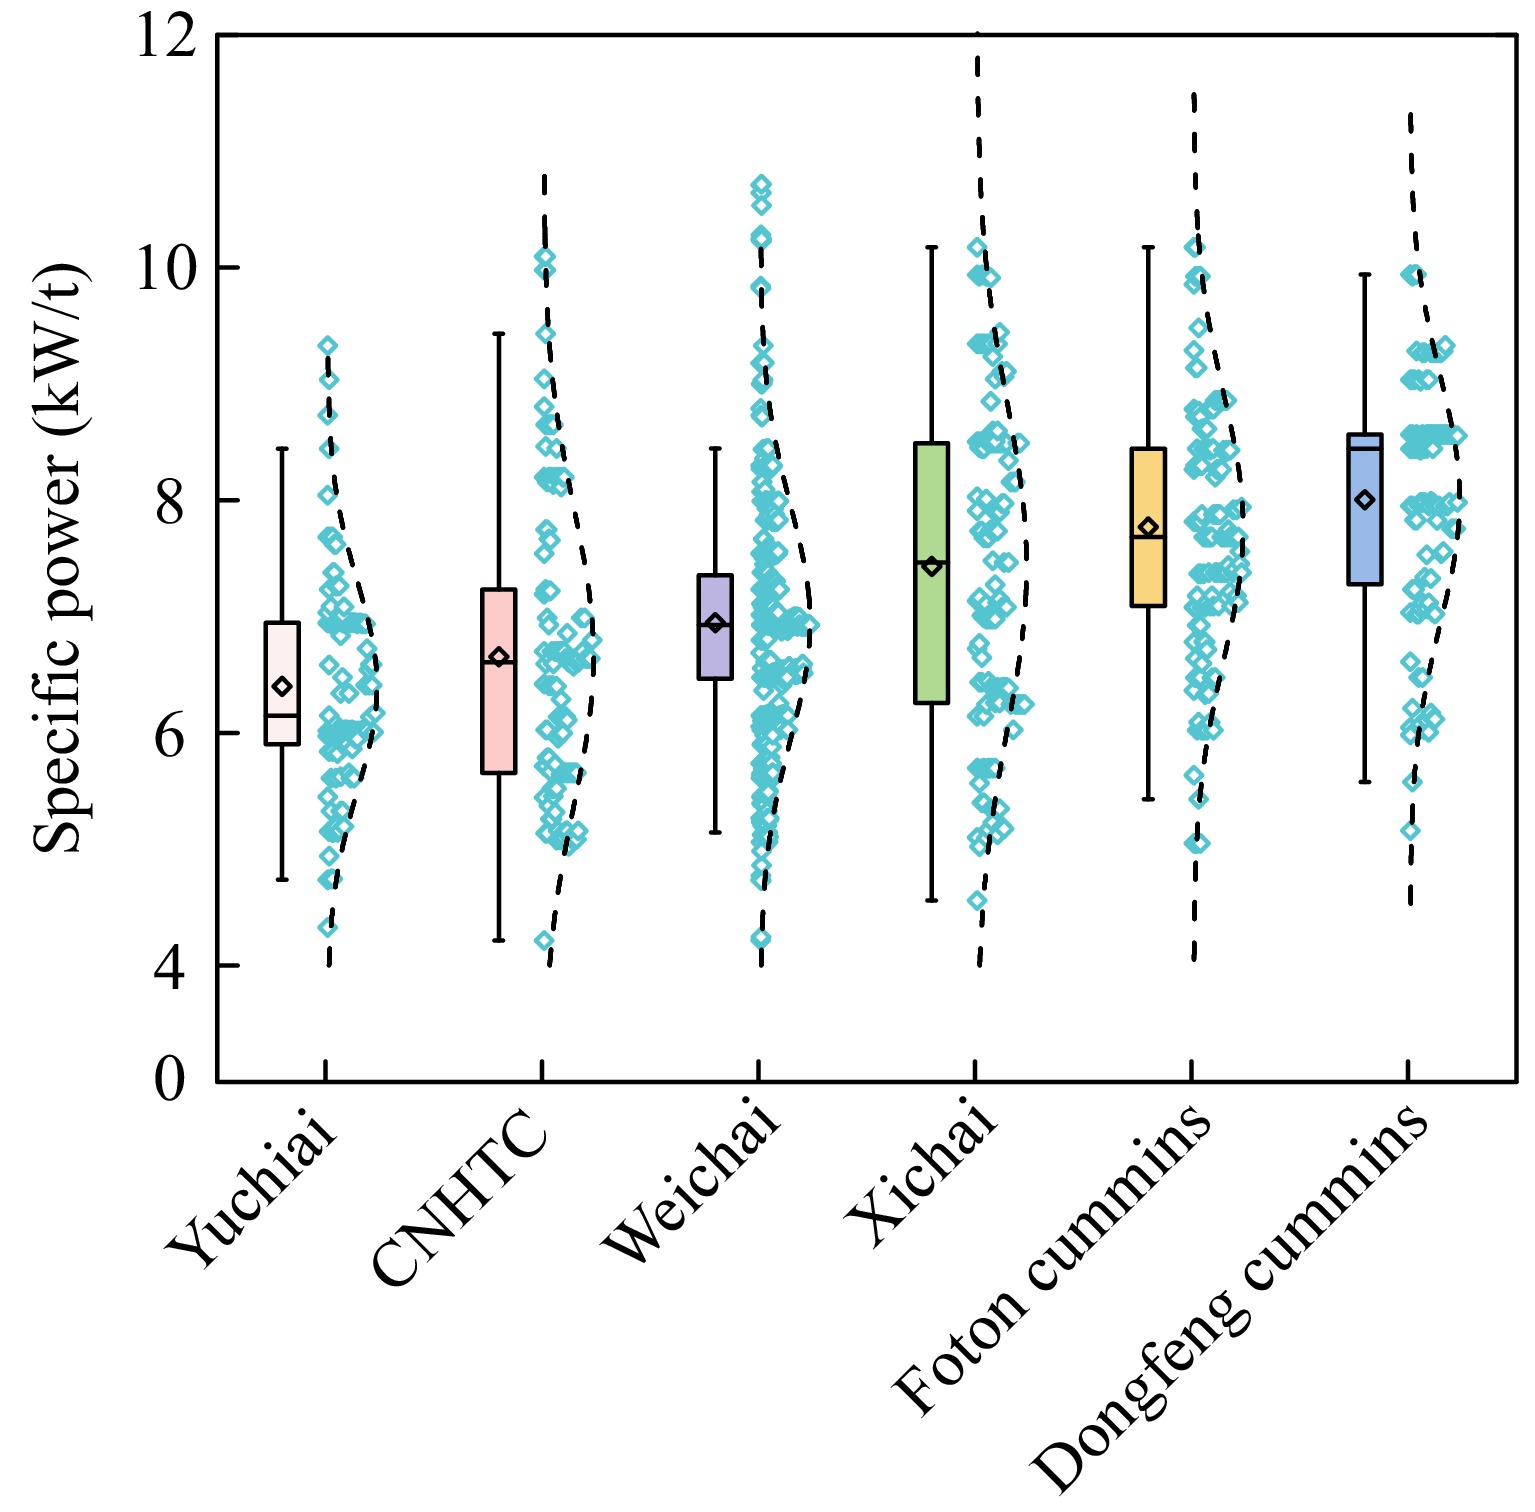
Figure 6.
Specific power boxplot and distribution characteristics.
Tractor drive form and specific power
-
From Fig. 7, it can be observed that the sample size of three-axle tractor units with a 6 × 4 drive configuration is significantly higher than the other two drive configurations. The average (7.15 kW/t) and median (6.94 kW/t) specific power values of 6 × 4 tractor units are higher than those of the other two drive configurations. Although the engine output power of 6 × 2 tractor units is higher than that of 4 × 2 tractor units, the maximum permissible total mass of 46 t for 6 × 2 tractor units is higher than the 43 t for 4 × 2 tractor units. This difference in maximum total mass results in lower average (6.13 kW/t) and median (5.79 kW/t) specific power values for 6 × 2 tractor units compared to the average (6.76 kW/t) and median (6.24 kW/t) specific power values of 4 × 2 tractor units.
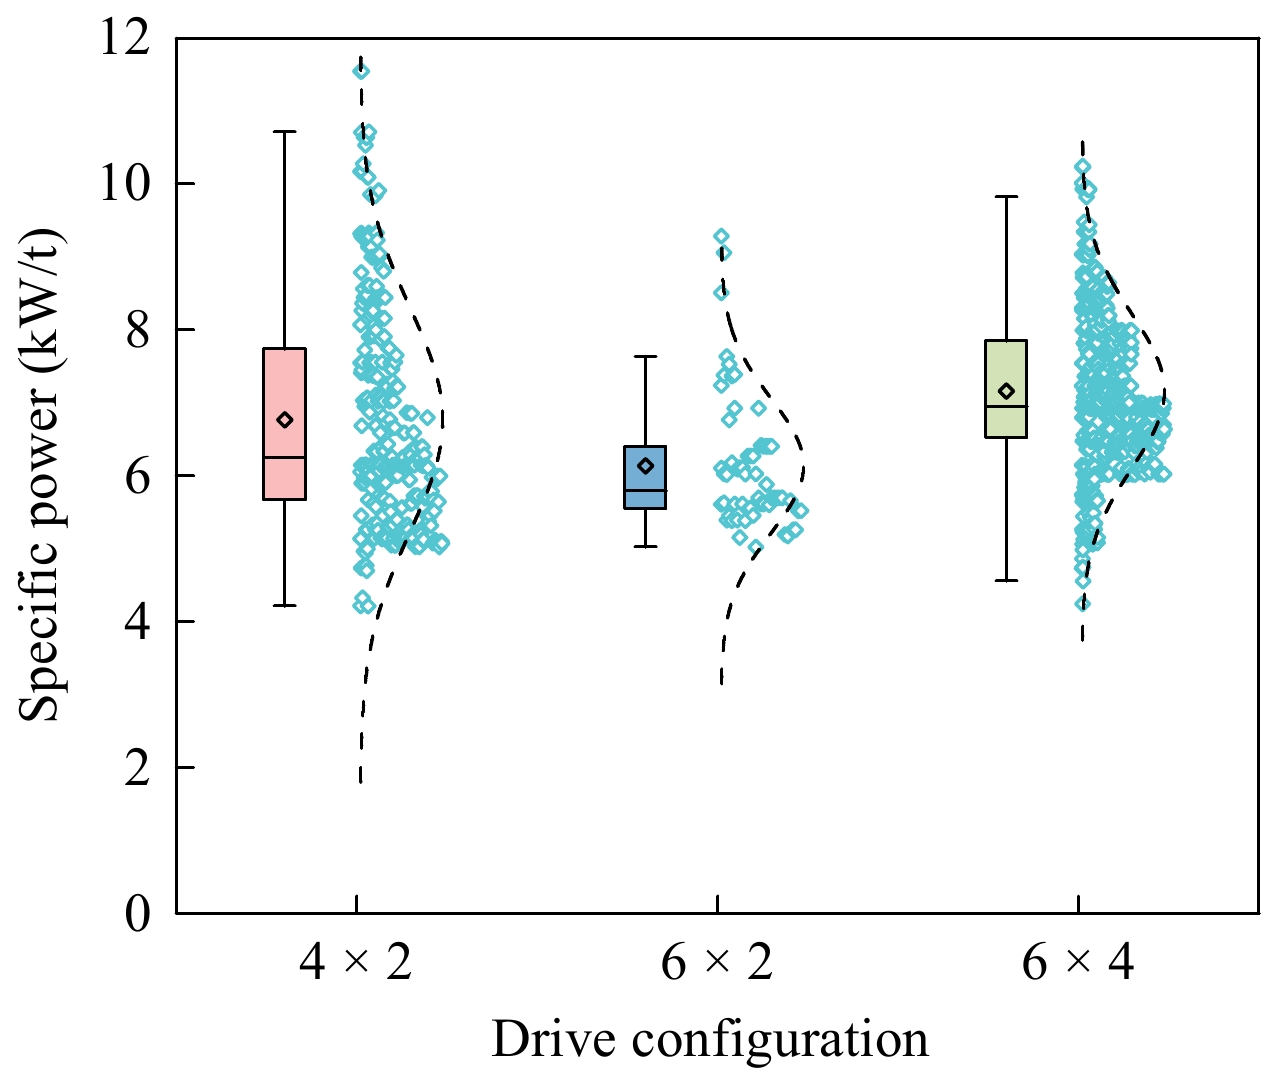
Figure 7.
Tractor drive configuration and specific power distribution of tractor vehicles.
-
According to the preceding analysis of specific power distribution characteristics, currently, the specific power of domestic five-axis and six-axis articulated trucks is relatively low. It is necessary to redefine the design criteria for freeway longitudinal sections by combining the specific power data of models available on the market[18]. The six-axis articulated truck composed of a 6 × 4 tractor matched with a three-axle semi-trailer is the main type of vehicle for freeway freight transportation. Its proportion far exceeds the six-axis articulated trucks with drive forms of 4 × 2 and 6 × 2. By considering the research on maximum longitudinal slope and maximum slope length of freeways in the past, the research idea of selecting specific design models is proposed. The six-axis articulated truck with a drive form of 6 × 4 is chosen as the simulation model. A single longitudinal slope simulation scenario is built using Trucksim software, with the specific power of simulated vehicles set at 6.32 kW/t (15th percentile) and 6.94 kW/t (50th percentile). The balance speed and speed reduction amount of the simulated vehicle on different slopes are used as the control criteria for the maximum longitudinal slope and maximum slope length.
Maximum longitudinal slope of unlimited length
-
The maximum longitudinal grade without length limitation refers to the maximum slope that articulated trucks can continuously traverse at an overcoming speed. The balanced climbing speed of the simulation vehicle on different grades can be compared with the minimum acceptable speeds specified in the 'Specification' for roads designed at different design speeds, serving as the basis for setting the maximum longitudinal grade. Table 5 details specific simulation conditions, and Fig. 6 depicts the speed degradation curve of the simulation vehicle climbing slopes at initial speeds of 80 km/h on different grades.
Table 5. Equilibrium speed simulation conditions.
Tractor axle type Specific power (kW/t) Initial velocity (km/h) Gradient 6 × 4 6.32, 6.94 80 2.0%, 2.5%, 3.0%, 3.5%, 4.0%, 4.5%, 5.0%, 5.5%, 6.0% Observing Fig. 8, it is evident that as the longitudinal grade increases from 2% to 4%, the balanced speed of the vehicle on different grades significantly decreases. As the grade continues to increase, the differences in balanced speeds between different grades gradually reduce. Figure 9 extracts the balanced climbing speeds of the simulation vehicle on various grades, with the minimum acceptable climbing speeds at different design speeds derived from the specifications. From Fig. 9, it can be seen that the decline in balanced speed of the simulation vehicle with increasing grade is not uniform. Specifically, the simulation vehicle with a power-to-weight ratio of 6.94 kW/t exhibits higher balanced speeds at each grade compared to the vehicle with a power-to-weight ratio of 6.32 kW/t. In Fig. 9, Vi represents the minimum permissible climbing speed for uphill travel at a design speed of i km/h.
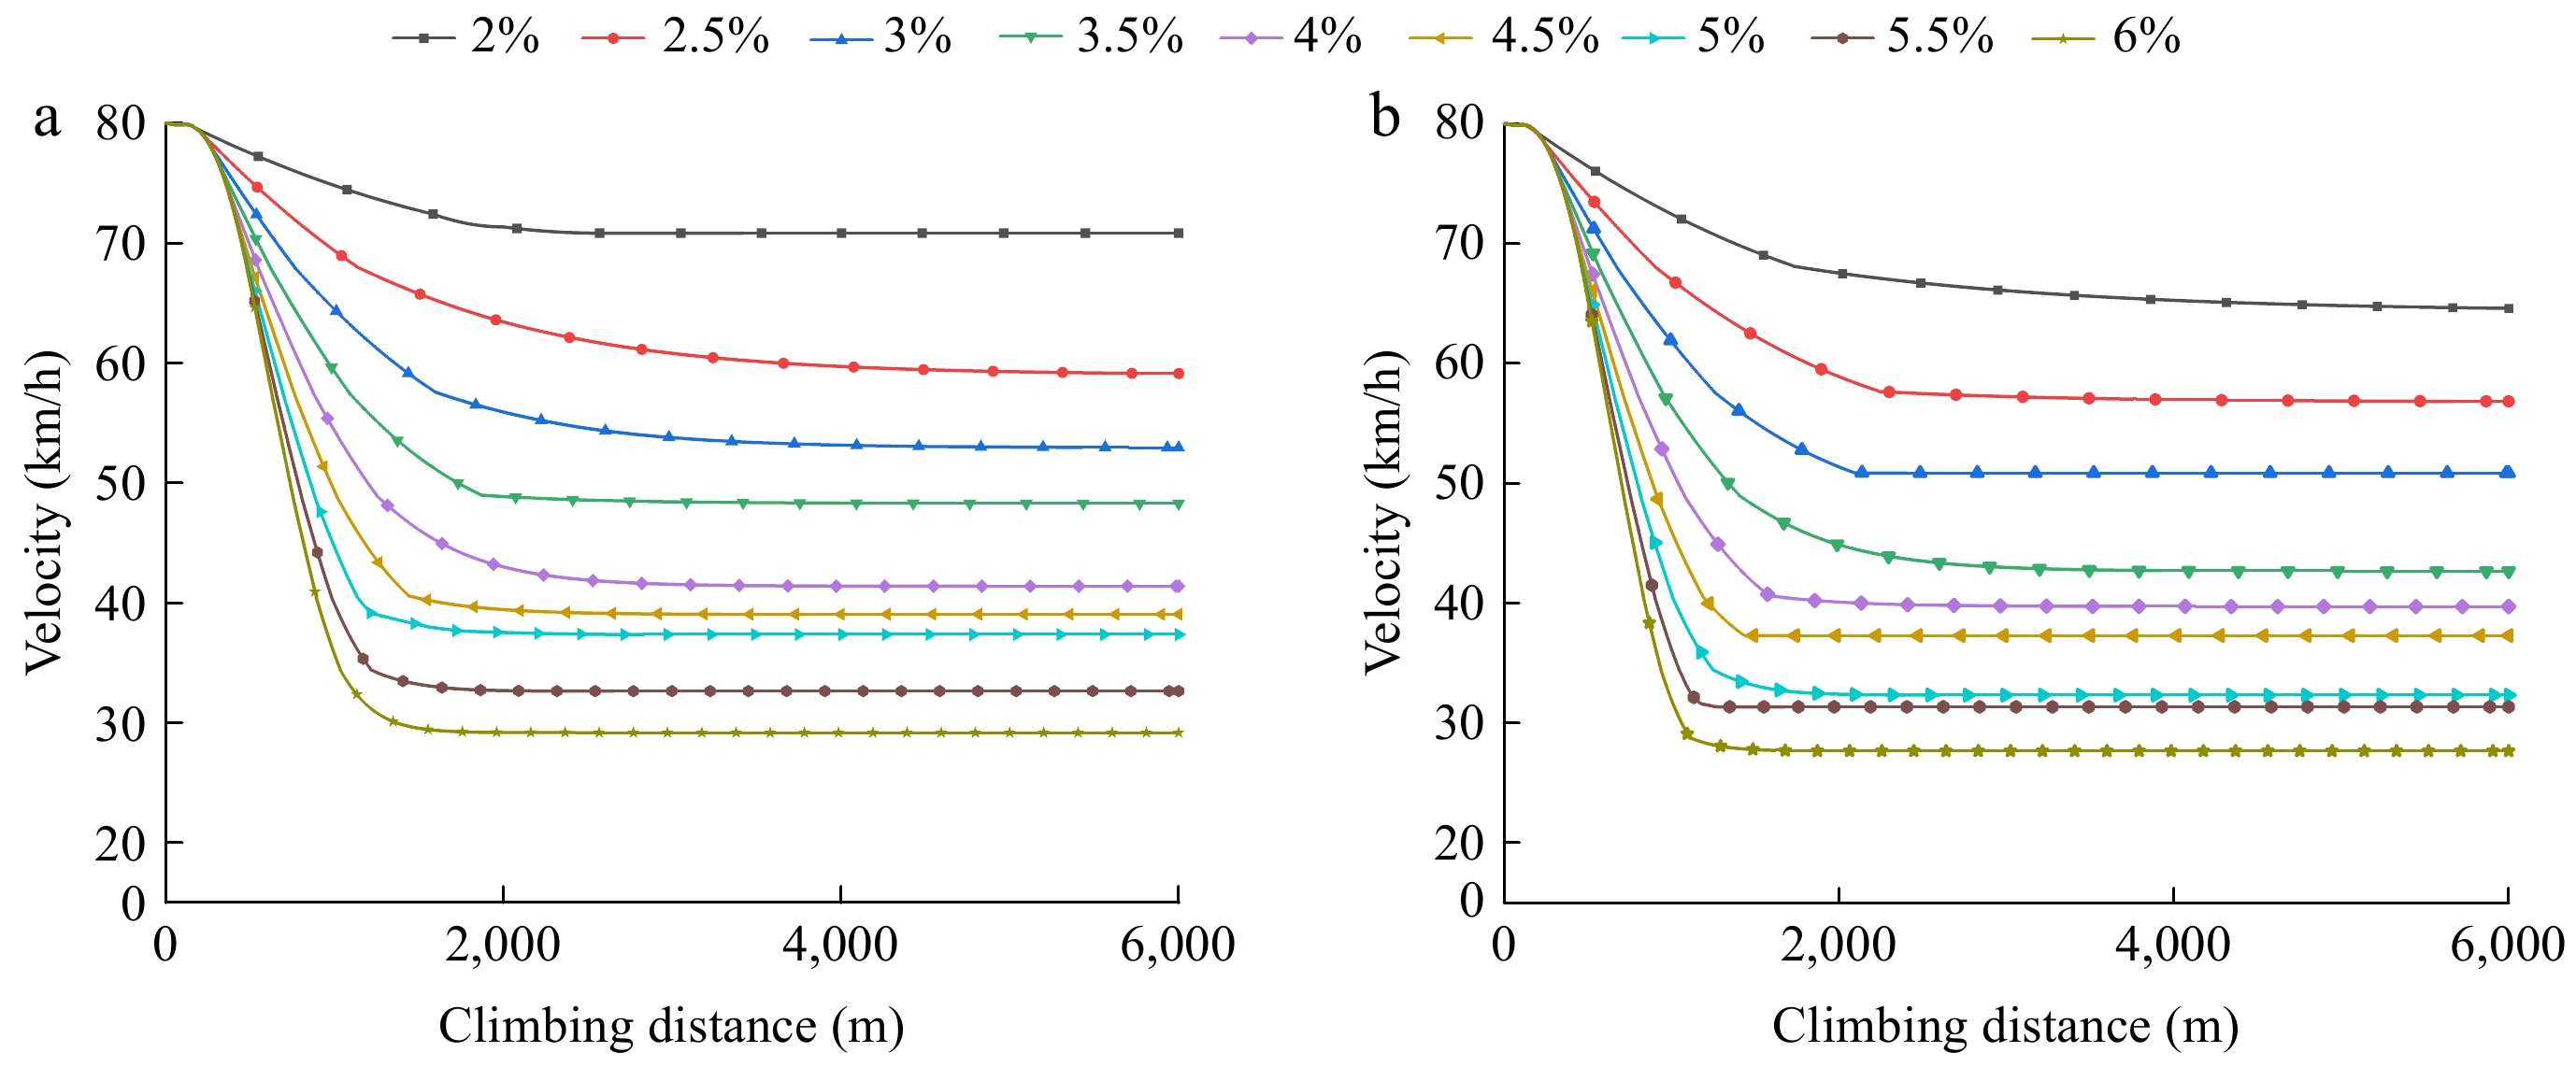
Figure 8.
Velocity decay curves for different longitudinal slope gradients. Specific power: (a) 6.94 kW/t, (b) 6.32 kW/t.
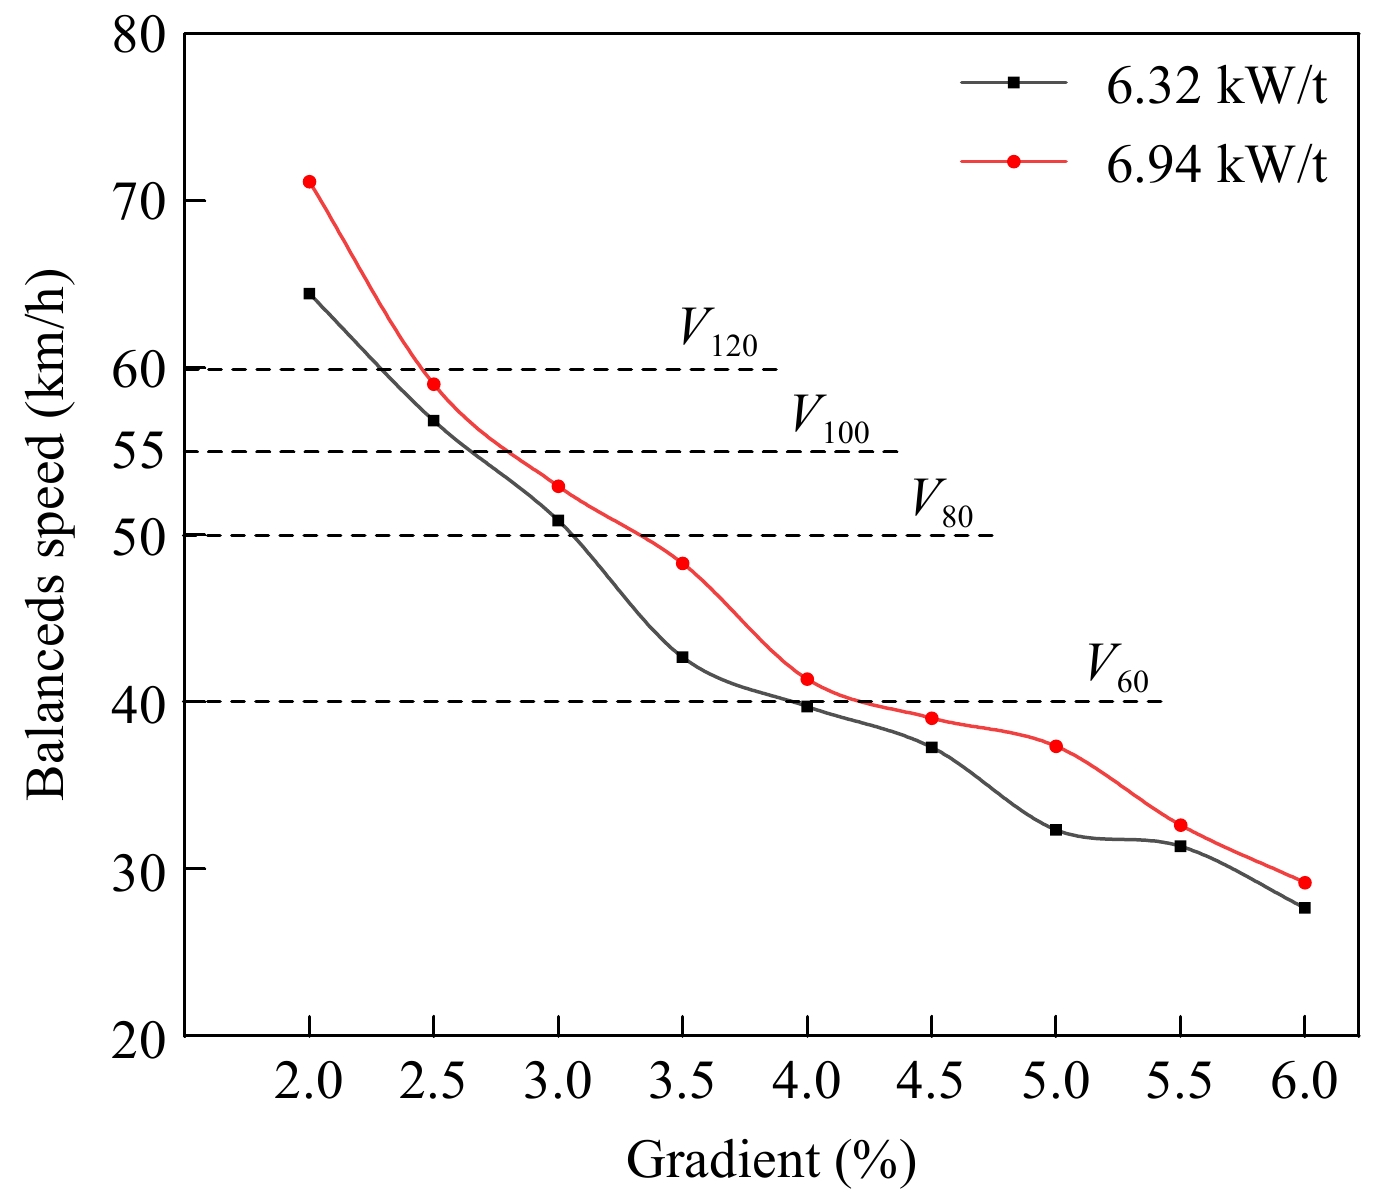
Figure 9.
Equilibrium speed with different specific powers and minimum allowable speed of vehicles.
Under the commonly encountered longitudinal gradients of 2% to 3% on Chinese freeways, the simulated climbing equilibrium speeds for vehicle models range from 50 to 72 km/h. At gradients of 2.5% and 3%, these speeds approximate the minimum permissible climbing speeds designed for 100 and 80 km/h respectively. However, at 3.5% gradients, both simulated vehicles with power-to-weight ratios of 6.32 and 6.94 kW/t have equilibrium speeds below the minimum permissible climbing speed of 50 km/h on freeways designed with an 80 km/h speed limit. In conclusion, the current climbing performance of articulated six-axle trucks available in the domestic market is relatively weak, highlighting a structural contradiction with the continuous longitudinal gradient conditions on Chinese freeways.
Based on the comparison of simulated vehicle equilibrium speeds from Fig. 9 with the minimum permissible speeds at different design velocities, the relationship between design speed and maximum longitudinal gradient can be seen in Table 6. The term 'code' refers to normative values.
Table 6. Maximum longitudinal slopes for different design speeds.
Design speed (km/h) Maximum longitudinal grade (%) 120 Simulative 2.0 Code 3.0 100 Simulative 2.5 Code 4.0 80 Simulative 3.0 Code 5.0 60 Simulative 3.5 Code 6.0 Maximal slope length
-
Combining the previous section's specific power distribution of the six-axle articulated freight truck and the climbing performance curves of the simulation model at different longitudinal slope gradients, it can be concluded that the road longitudinal profile design criteria proposed in the specifications are not suitable for most current six-axle articulated truck models on the market. The maximum longitudinal gradient alone cannot serve as an independent longitudinal profile design control criterion. It needs to be combined with the speed reduction amount of simulated vehicle models at different design speeds to further determine the controlled value of maximum grade length. The vehicle speed at the bottom of the slope refers to previous relevant studies[19,20]. This study adopts a speed reduction amount of 20 km/h as the maximum grade length control condition for uphill sections[21]. If the difference between the initial climbing speed and the minimum permissible speed at the design speed is less than 20 km/h, then this difference is used as the speed reduction amount for that condition. The power-to-weight ratios of the simulated vehicle models remain at 6.32 and 6.94 kW/t, and Table 7 provides the simulated operational parameters for maximum grade length.
Table 7. Simulation conditions for maximum slope length.
Design speed (km/h) Bottom slope velocity (km/h) Speed reduction (km/h) Gradient (%) 120 98 20 2~4 100 85 20 2~5 80 70 20 2~6 60 55 15 2~6 Figure 10 is a scatter plot that illustrates the relationship between longitudinal slope gradient and grade length at different design speeds, derived from simulations using Trucksim software under various conditions specified in Table 7. Grade length is determined by subtracting the distance traveled by the simulated vehicle from the position of the gradient change point, where the vehicle's speed decreases by 20 or 15 km/h during uphill climbing. For example, at a design speed of 100 km/h, a six-axle articulated truck with a specific power of 6.94 kW/t enters a 3% longitudinal slope at an initial speed of 85 km/h and climbs uphill, with the climbing distance being 1,000 m when the speed reduction reaches 20 km/h. Under a 4% slope condition with the same speed reduction of 20 km/h, the climbing distance decreases to 600 m. When the design speed is 80 km/h and the longitudinal slope is less than 3%, if the simulated vehicle reduces speed from an initial 70 km/h to the equilibrium speed without a reduction of 20 km/h, and the vehicle speed does not drop below the minimum permissible speed, there is no need to restrict the grade length, thus this scenario is not plotted in Fig. 10.
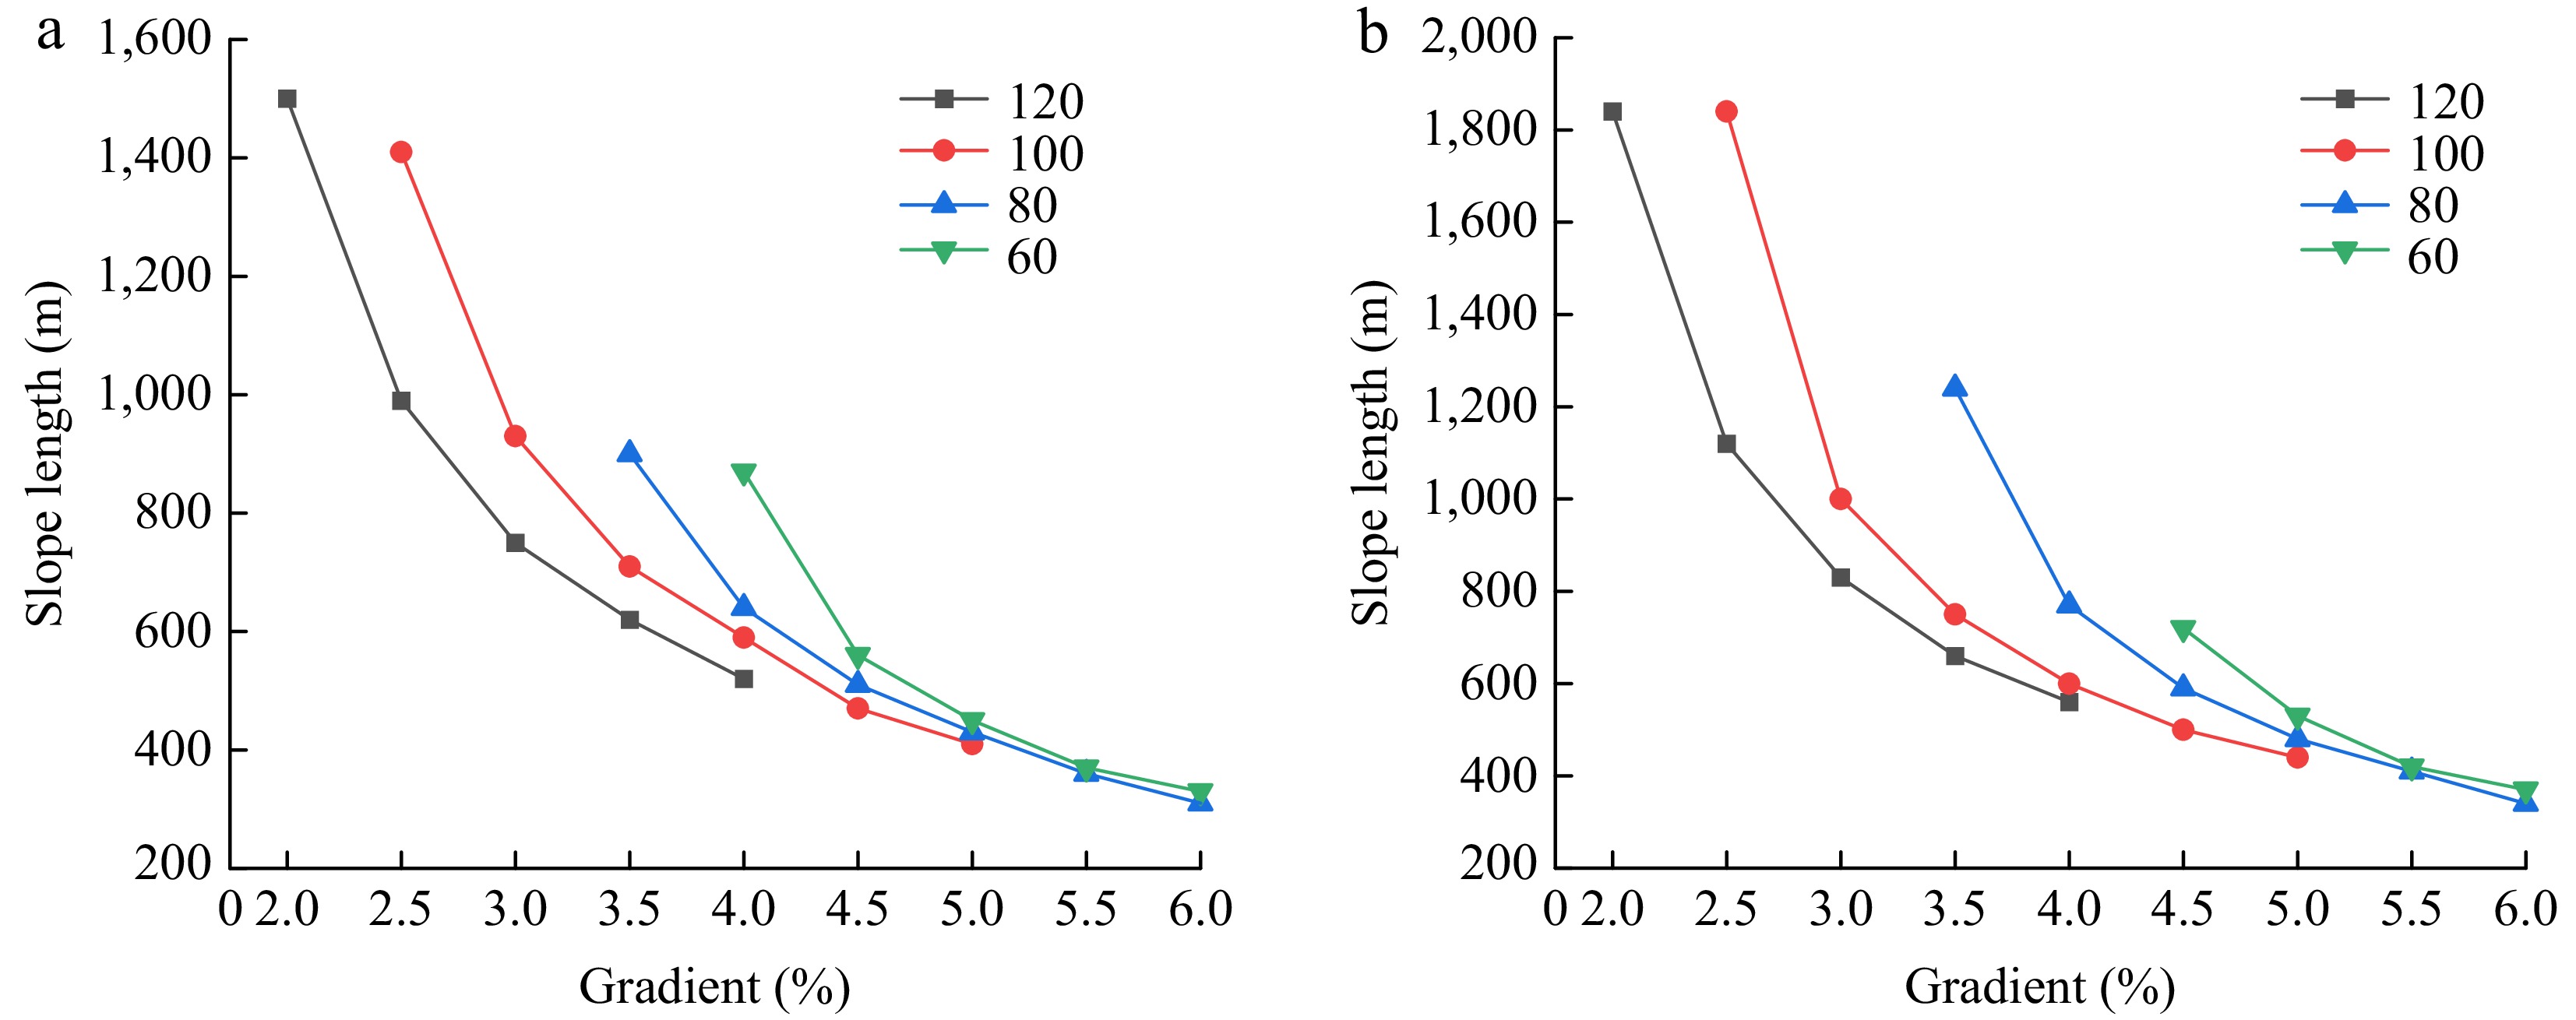
Figure 10.
The uphill slope length that simulated vehicles with different power ratios traverse when reaching speed attenuation at different design speeds and slopes. (a) 6.32 kW/t. (b) 6.94 kW/t.
According to the specific power analysis results, Fig. 5, the group with a median specific power of 6.94 kW/t has 400 samples, accounting for 28.8% of the total samples. The group with a 15th percentile specific power of 6.32 kW/t comprises 213 samples, representing 15.3% of the total. Therefore, the maximum grade length determined by vehicles with a specific power of 6.94 kW/t is considered more representative. Based on the relationship between longitudinal slope gradient and grade length shown in Fig. 10, the maximum grade length control values under different design speeds can be determined, as shown in Table 8.
Table 8. Maximum slope lengths corresponding to different design speeds and longitudinal slopes.
Gradient (%) Grade length control values under different design speeds (m) 120 km/h 100 km/h 80 km/h 60 km/h Simulative Code Simulative Code Simulative Code Simulative Code 2.0 1,840 / Not limited / Not limited / Not limited / 3.0 830 900 1,000 1,000 Not limited 1,100 Not limited 1,200 4.0 560 700 600 800 770 900 Not limited 1,000 5.0 / / 440 600 480 700 530 800 6.0 / / / / 340 500 370 600 -
This article analyzed a total of 1,758 sets of tractor data to examine the specific power differences between five-axle and six-axle articulated trucks. A simulation model for climbing performance was selected and tested using Trucksim simulation software to verify maximum gradients and grade lengths on freeways. The main conclusions are as follows:
(1) The climbing performance of both five-axle and six-axle articulated trucks is generally poor, showing a notable gap compared to the design model's specific power of 9.3 kW/t specified in freeway design criteria.
(2) There is a significant difference in specific power distribution between the two truck types. For five-axle articulated trucks, specific power primarily ranges from 5 to 7.5 kW/t, accounting for about 50.7%. For six-axle trucks, the range is 6 to 8 kW/t, comprising around 54.9%. The mode (6.13 kW/t) and mean (6.77 kW/t) specific power of five-axle trucks are lower than those of six-axle trucks, which have a mode of 6.92 kW/t and a mean of 7.13 kW/t.
(3) The average and median specific power rankings of articulated trucks with different drive configurations are as follows: 6 × 4 (7.15, 6.94 kW/t) > 4 × 2 (6.76, 6.24 kW/t) > 6 × 2 (6.13, 5.79 kW/t).
(4) The simulation outcomes for the maximum longitudinal grades show decreases relative to the prescribed values. For freeways designed for speeds of 120, 100, 80, and 60 km/h, the unrestricted maximum grades are 2.0%, 2.5%, 3.0%, and 3.5%, respectively. Moreover, under scenarios with length restrictions, the suggested slope lengths in the simulations are notably shorter than the standard guidelines, with reductions reaching as high as 33.75%. In future highway construction, the values for the maximum longitudinal grade and slope length can be appropriately reduced.
(5) Research limitations: In the simulation experiment of maximum slope length, the selection of initial velocity is based on previous research content. We did not consider that in actual driving, due to different driving habits of drivers, the initial speed of the vehicle on the slope may be different, and the speed attenuation curve of the vehicle may also be different, resulting in differences in the final control value of the maximum slope length. The simulated vehicles in this article are all fully loaded, but in actual situations, many vehicles may experience overloading. When the vehicle is overloaded, the specific power will decrease, the climbing performance will weaken, and the maximum slope/slope length that the vehicle can adapt to will be reduced to a certain extent. Subsequent research should continue to improve on the above issues.
This research was sponsored by the Chongqing Transportation Science and Technology Project, China (Grant No. CQJT-2023CZ32-2); Chongqing Municipality University Innovation Research Group Project: 'Intelligent Cooperative Vehicle-Road Interaction and Major Risk Prevention for Mountainous Roads (CXQT21022).
-
The authors confirm contribution to the paper as follows: study conception and design: Xu J; analysis and interpretation of results: Mu J, Wang C, Yu Z, Zhu X, Yi G; draft manuscript preparation: Mu J, Wang C, Yu Z, Zhu X, Yi G. All authors reviewed the results and approved the final version of the manuscript.
-
Data sharing not applicable to this article as no datasets were generated or analyzed during the current study.
-
The authors declare that they have no conflict of interest.
- Copyright: © 2025 by the author(s). Published by Maximum Academic Press, Fayetteville, GA. This article is an open access article distributed under Creative Commons Attribution License (CC BY 4.0), visit https://creativecommons.org/licenses/by/4.0/.
-
About this article
Cite this article
Mu J, Wang C, Yu Z, Zhu X, Yi G, et al. 2025. Optimizing freeway maximum gradient and slope length using specific power analysis of five- and six-axle articulated vehicles. Digital Transportation and Safety 4(1): 50−58 doi: 10.48130/dts-0025-0002 

Optimizing freeway maximum gradient and slope length using specific power analysis of five- and six-axle articulated vehicles
- Received: 12 July 2024
- Revised: 26 November 2024
- Accepted: 29 November 2024
- Published online: 31 March 2025
Abstract: Currently, six-axle articulated trucks on Chinese freeways exhibit lower climbing performance than the design vehicle specified in the 'Design Specification for Highway Alignment' (China). A simulative vehicle model for freeway longitudinal section design criteria was developed using specific power data collected from 1,758 tractor units listed on the Truck Home website. This study established a simulation scene using Trucksim software to model climbing on a single longitudinal slope section, it helped determine control values for the maximum longitudinal slope gradient/length based on equilibrium speed, and speed reduction. The research results show that 82.9% of tractor specific power data is concentrated between 6 to 9 kW/t, recommending the selection of a six-axle articulated truck with a specific power of 6.94 kW/t as the representative model for freeway longitudinal section design; there is a significant difference in specific power distribution between five-axle and six-axle articulated trucks, with the mode (6.14 kW/t) and mean (6.77 kW/t) specific power of five-axle articulated trucks both lower than the mode (6.92 kW/t) and mean (7.13 kW/t) specific power of six-axle articulated trucks. For freeways with design speeds of 120, 100, 80, and 60 km/h corresponding to unlimited lengths, the maximum longitudinal slopes are 2.0%, 2.5%, 3.0%, and 3.5% respectively. Except for the simulation condition with no limit on slope length, the recommended slope lengths for the other simulation conditions are reduced to varying degrees compared to the standard values, with the highest reduction reaching up to 33.75%.