


-
Biological treatment of wastewater is a core technology for water resource recycling. The management of municipal sludge (MS) generated during this process has become a major challenge for global environmental governance. Due to population growth and accelerating urbanization, the discharge of industrial and municipal wastewater continues to increase, leading to a sharp rise in MS production, which is expected to surpass 9 × 10⁷ tons by the end of 2025 in China. Due to high cost, low efficiency, severe pollution, and resource wastage, conventional treatment methods for MS can no longer meet the demands of coordinated development between economic growth, environmental protection, and energy utilization. Therefore, it is urgent to develop a new technique for high-value utilization of MS.
Hydrothermal liquefaction (HTL) is regarded as a promising technology for wet biomass treatment, as it eliminates the energy-consuming drying step. In direct HTL (D-HTL), the feedstock is directly treated in a water environment, and undergoes a series of organic chemical reactions including dehydration, decarboxylation, deamination, cyclization, recombination, condensation, and repolymerization at moderate temperatures (200–350 °C) and pressures (8–20 MPa) within short residence times (10–60 min), yielding bio-oil, aqueous phase, gas fraction and solid residue. As the primary product, bio-oil exhibits the potential to replace traditional fossil fuels and be used as a transportation fuel. Therefore, HTL holds promise for achieving the harmless disposal and resource utilization of MS.
Qian et al.[1] investigated the product distribution of MS under fast and isothermal HTL at different severities. The results showed that the highest bio-oil yield of 20.1–30.9 wt.% was obtained, and about 32% and 63% of the nitrogen in sludge transferred into the bio-oil and aqueous phase products, respectively. Vardon et al.[2] explored the properties and physico-chemical characteristics of HTL bio-oil derived from Spirulina algae, swine manure, and digested MS. They found significant differences in bio-oil yields (32.6 wt.%, 30.2 wt.%, and 9.4 wt.%, respectively), but the higher heating values (HHV) were similar (32.0–34.7 MJ/kg) with the nitrogen content reaching up to 6.5 wt.%. It is noteworthy that a common issue of MS HTL is the high nitrogen content in the oil-phase products, which results in catalyst deactivation and inhibits the hydrodenitrogenation. As a result, it is essential to produce low-nitrogen bio-oil for industrial production. Several strategies are thus reported to reduce the nitrogen content in bio-oil, including supercritical fluid extraction[3] and catalytic hydrogenation[4,5]. However, the above methods tend to be operated under harsh conditions or require the addition of expensive reagents.
Recently, two-stage hydrothermal liquefaction (T-HTL), which involves a low-temperature pre-treatment stage and a high-temperature HTL stage, has attracted significant attention. Long et al.[6] found that bio-oil derived from swine manure via T-HTL contained a higher proportion of fatty acids and a lower proportion of nitrogenous compounds compared to D-HTL (280 °C). Similarly, Costanzo et al.[7] reported that T-HTL could reduce the nitrogen heteroatom content in algae bio-oil by 26–28 wt.%, thereby improving the bio-oil quality. Jazrawi et al.[8] observed that the nitrogen content in Chlorella bio-oil decreased by 55% after T-HTL compared to D-HTL. However, the bio-oil yield reduced from 24.7 wt.% to 12.7 wt.%. In summary, T-HTL can effectively reduce the nitrogen content in bio-oil under appropriate operating conditions, but may lead to a decline in oil yield. Besides, the overall hydrothermal conversion efficiency varies depending on the separation procedure halfway. Separated T-HTL (ST-HTL) containing the separation procedure halfway normally results in better bio-oil quality compared to consecutive T-HTL (CT-HTL) without the separation step. There is little information about the systematic comparison of two T-HTL processes (CT-HTL and ST-HTL) with D-HTL of MS. Moreover, studies on the formation and migration pathways of nitrogen in the T-HTL product of MS are lacking.
This work used dried and sieved MS as the feedstock to comprehensively investigate the product characteristics under three HTL processes, including D-HTL, CT-HTL, and ST-HTL. The influences of key reaction parameters on product distribution and chemical compositions were examined at different temperatures and time groups. Elemental composition analysis and gas chromatography-mass spectrometer (GC-MS) analysis of bio-oil samples were conducted. Elemental composition analysis, proximate analysis, and X-ray photoelectron spectroscopy (XPS) tests of solid products were performed. TN and TOC contents of the aqueous phase were determined. Based on these results, the compound forms and distribution of nitrogen were clarified. Furthermore, the migration and evolution mechanism of nitrogen during the ST-HTL process of MS was revealed. This work can provide an economical approach for obtaining low-nitrogen bio-oil from MS via HTL, and is believed to promote the development and application of HTL technology.
-
Primary digested MS was used as feedstock, which was collected from Xi'an Dengjiacun Wastewater Treatment Plant in Shaanxi Province. Its basic properties were listed in Table 1. The original wet MS was dried in an oven at 105 °C for 24 h, and subsequently crushed and sieved to 80 mesh. Dichloromethane (analytical pure) was employed for the extraction of oil-phase products, and ethanol (analytical pure) was applied to clean residual oil stains on the reaction apparatus and glassware surfaces. The consumables for TN tests (LH-HTL and LH-YNT) were purchased from Beijing Lian-hua Tech. Co., Ltd for measuring the total nitrogen concentration in the aqueous phase product.
Table 1. Basic properties of MS
Feedstock MS Elemental analysisa (wt.%) C 45.84 H 7.51 N 7.22 S 0.81 Ob 38.62 Proximate analysis (wt.%) Ash 51.79 VM 45.10 FCc 3.11 Moisture (wt.%) 82.70 Higher heating value (MJ/kg) 19.40 a Dry ash-free basis; b O% = 100% − C% − H% − N% − S%; c FC% = 100% − Ash% − VM%. HTL experiments
-
A certain amount of MS powders and deionized water, with the solid-to-liquid ratio consistently set at 1:10, were blended and added to the autoclave, which was sealed using six bolts. The heating program was initiated, and the stirrer operated at a speed of 180 rpm to ensure thorough contact between MS and solvent. Nitrogen purging was performed to remove residual air in the autoclave. The autoclave was then pressurized to approximately 1 MPa, and was maintained at this pressure for 5 min to verify the good airtightness of the system.
D-HTL involves only one reaction stage, whereas CT-HTL and ST-HTL both consist of two reaction stages. For CT-HTL, its two stages are consecutive, meaning that after the primary reaction program is completed, the temperature is directly raised to proceed with the secondary stage. In contrast, for ST-HTL, the secondary stage uses all dried solid products obtained from the primary stage as the feedstock for another liquefaction reaction. The HTL reaction parameters used in this work are listed in Table 2. For D-HTL, the temperature and residence time were set as 200 °C/50 min (denoted as D1) and 325 °C/50 min (denoted as D2), respectively. For CT-HTL, the reaction condition was selected as 200 °C/20 min followed by 325 °C/30 min (denoted as C). The reaction conditions of the primary stage for ST-HTL were 200 °C/10 min (denoted as S1-I) and 200 °C/20 min (denoted as S2-I), with the corresponding conditions of the secondary stage being 325 °C/40 min (denoted as S1-II) and 325 °C/30 min (denoted as S2-II), respectively. The combination of S1-I and S1-II constitutes one complete ST-HTL process, denoted as S1. Similarly, the combination of S2-I and S2-II is denoted as S2. All experiments were repeated three times, and the mean values along with standard deviations were recorded to minimize experimental error.
Table 2. The experimental parameters for HTL of MS used in this work
HTL process Label Temperature
(°C)Pressure
(MPa)Residence
time (min)D-HTL D1 200 12 50 D2 325 12 50 CT-HTL C 200/325 12 20/30 ST-HTL S1 200(I)/325(II) 12 10(I)/40(II) S2 200(I)/325(II) 12 20(I)/30(II) The product separation procedure is illustrated in Fig. 1, which includes six steps: (1) After the reaction was completed, the exhaust valve was opened to release all gases. (2) The remaining products (solid and liquid phases) in the autoclave were transferred into a funnel by repeatedly using a small amount of dichloromethane (DCM) for vacuum filtration until the filtrate appeared light yellow, so that the maximum recovery of the bio-oil can be obtained. (3) The solid products were dried in a vacuum oven at 110 °C for 24 h, and then weighed to calculate the yield. (4) The liquid phase (oil and aqueous phases) was transferred into the centrifuge tubes and centrifuged at 3,500 r/min for 10 min to achieve effective separation of the oil and water. (5) The upper liquid phase was extracted using a glass pipette and stored in a transparent glass bottle at 4 °C for subsequent analysis. (6) The centrifuge tubes containing the mixture of DCM and bio-oil were placed in a fume hood to accelerate the evaporation of DCM. In this case, the bio-oil was obtained and weighed to calculate its yield.
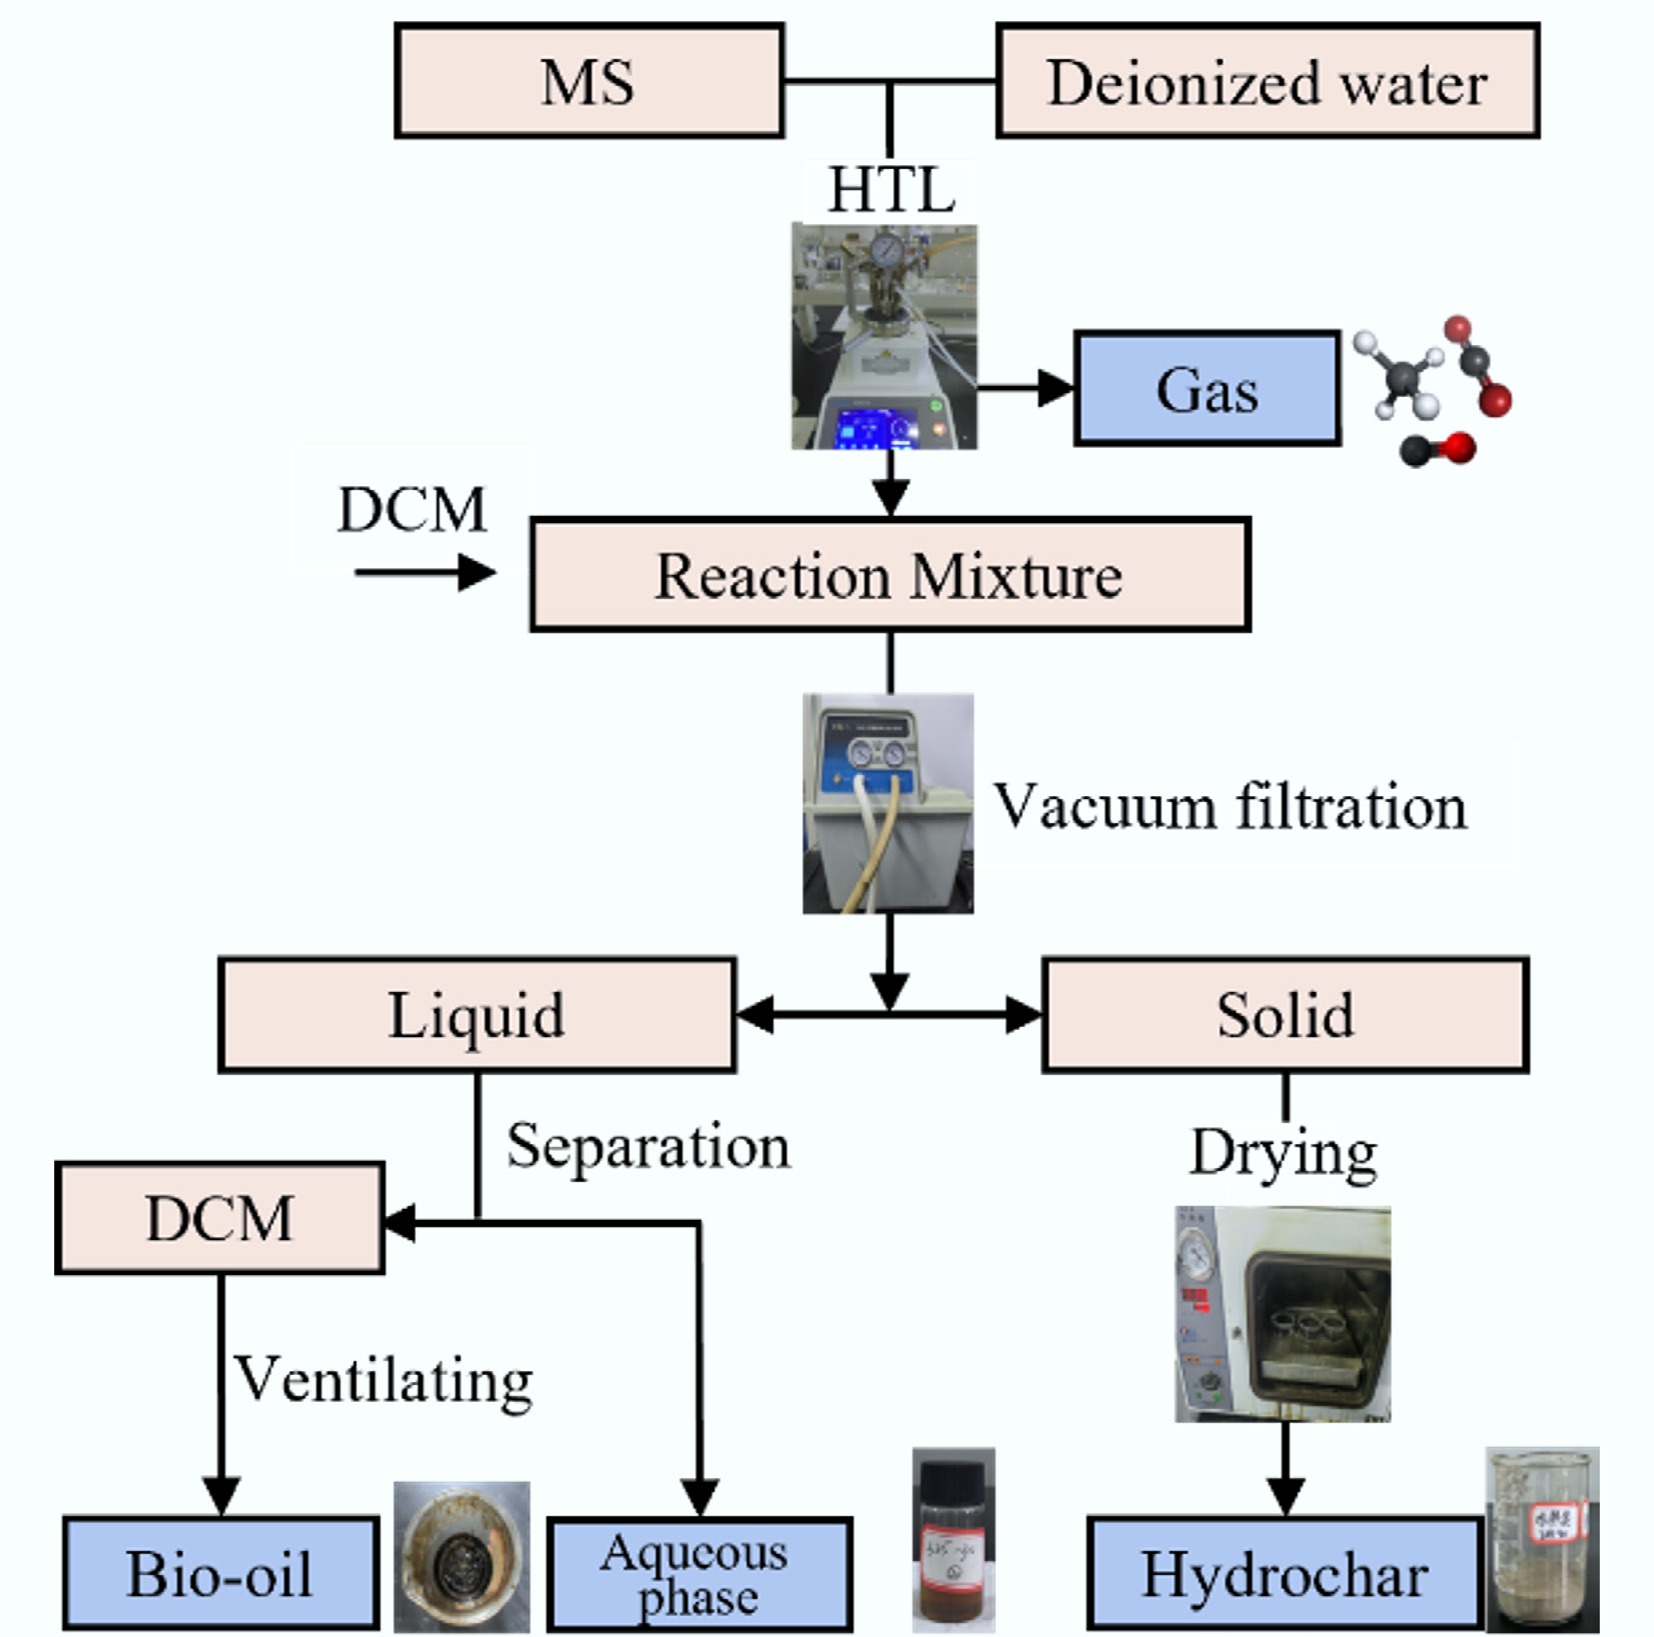
Figure 1.
Product separation procedure of HTL process.
Analytic methods
-
The ash and volatile matter content in the sludge and solid products were analyzed by using a muffle furnace (SX2-4-10). The fixed carbon content was calculated by the difference method. The carbon, hydrogen, nitrogen, and sulfur content in the oil and solid products were determined via an element analyzer (EA3000), and the oxygen content was then calculated by the difference method.
A certain amount of bio-oil was dissolved in DCM, and the concentration of each sample was kept at 0.015 g/mL. After being filtered through an organic filter membrane of 0.45 μm, the oil sample with a volume of 1–1.5 mL was aspirated into a GC-MS (Agilent 8890-5977B) equipped with an HP-5ms capillary column (30 m × 250 μm × 0.25 μm) for qualitative and quantitative analysis of the compounds. Helium was applied as the carrier gas, the purge temperature was set at 300 °C, and the split ratio was 10:1.
The N1s spectrum of the solid product was obtained via XPS (ESCALAB Xi+) with a monochromatic Al-Kα as the X-ray source and an energy resolution of 20 eV. Qualitative and quantitative analysis of the compounds in the aqueous phase products was conducted on a GC-MS (Agilent 19091S-433) equipped with an HP-5ms column (30 m × 250 μm × 0.25 μm). Helium was used as the carrier gas with a purge rate of 3 mL/min and a split ratio of 2. The TN concentration in the aqueous phase was determined using an intelligent multi-parameter digestion instrument (LH-25A) and an ultraviolet multi-parameter water test kit (LH-3BA), which were both provided by Beijing Lian-hua Tech. Co., Ltd.
Calculation methods
-
The higher heating value of MS (dry ash-free basis) and bio-oil was calculated based on the Dulong formula as in Eq. (1)[9], where HHV is higher heating value (MJ/kg), C is the content of carbon element in MS (wt.%), H is the content of hydrogen element in MS (wt.%), O is the content of oxygen element in MS (wt.%), and S is the content of sulfur element in MS (wt.%).
$ H H V=0.338 C+1.428(H-O / 8)+0.095 S $ (1) The yields of bio-oil and solid products (dry ash-free basis hydrochar) were calculated through Eq. (2), where Yoil/hydrochar represents the yield of bio-oil or hydrochar (wt.%), moil/hydrochar represents the mass of bio-oil or hydrochar (g), MMS represents the mass of MS (g), and AshMS represents the ash content of MS (wt.%).
$ Y_{oil/hydrochar}=\dfrac{m_{oil/hydrochar}}{M_{MS}(1-Ash_{MS})}\times 100{\text{%}} $ (2) The total yield of gas and aqueous phases was calculated according to Eq. (3), where Yaq+gas means the total yield of gas and aqueous phases (wt.%), Yoil means the yield of bio-oil (wt.%), and Ychar means the yield of solid products (dry ash-free basis hydrochar, wt.%).
$ Y_{aq+gas}=1-Y_{oil}-Y_{char} $ (3) The formula for the calculation of energy recovery rate is shown in Eq. (4), where ER denotes energy recovery rate (wt.%), Yoil denotes the yield of bio-oil (wt.%), HHVoil denotes the higher heating value of bio-oil (MJ/kg), and HHVMS denotes the higher heating value of MS (MJ/kg).
$ ER=\dfrac{Y_{oil}\times HHV_{oil}}{HHV_{MS}}\times 100{\text{%}} $ (4) The nitrogen distribution of bio-oil and solid products (dry ash-free basis hydrochar) was calculated based on Eq. (5), where Doil/char is the nitrogen distribution of bio-oil or hydrochar (wt.%), Noil/char is the content of nitrogen element in bio-oil or hydrochar (wt.%), NMS is the content of nitrogen element in MS (wt.%), and Yoil/char is the yield of bio-oil or hydrochar (wt.%).
$ D_{oil/char}=\dfrac{N_{oil/char}}{N_{MS}}\times Y_{oil/char} $ (5) The nitrogen distribution of aqueous phase can be calculated through Eq. (6), where Daq is the nitrogen distribution of aqueous phase (wt.%), TN is the total nitrogen concentration of aqueous phase (mg/L), V is the volume of water used for HTL conversion (mL), and NMS is the content of nitrogen element in MS (wt.%).
$ D_{aq}=\dfrac{TN \times V}{N_{MS}}\times 100{\text{%}} $ (6) -
The product yields derived from D-HTL, CT-HTL, and ST-HTL are shown in Fig. 2. Reaction temperature and residence time were found to have a significant impact on product distribution. For D-HTL, the bio-oil yield was only 5.38 wt.% at 200 °C. This is mainly because the macromolecular polymers in the feedstock were not sufficiently degraded at such a low temperature, which also led to a high solid yield of 37.12 wt.%. As the reaction temperature rose from 180 to 325 °C, the bio-oil yield increased to 17.37 wt.%, while the solid yield decreased to 17.71 wt.%. Moreover, the total yield of the aqueous phase and gaseous fraction increased from 57.50 wt.% to 64.92 wt.%. These changes are primarily attributed to the advanced decomposition of solid macromolecules at higher temperatures.
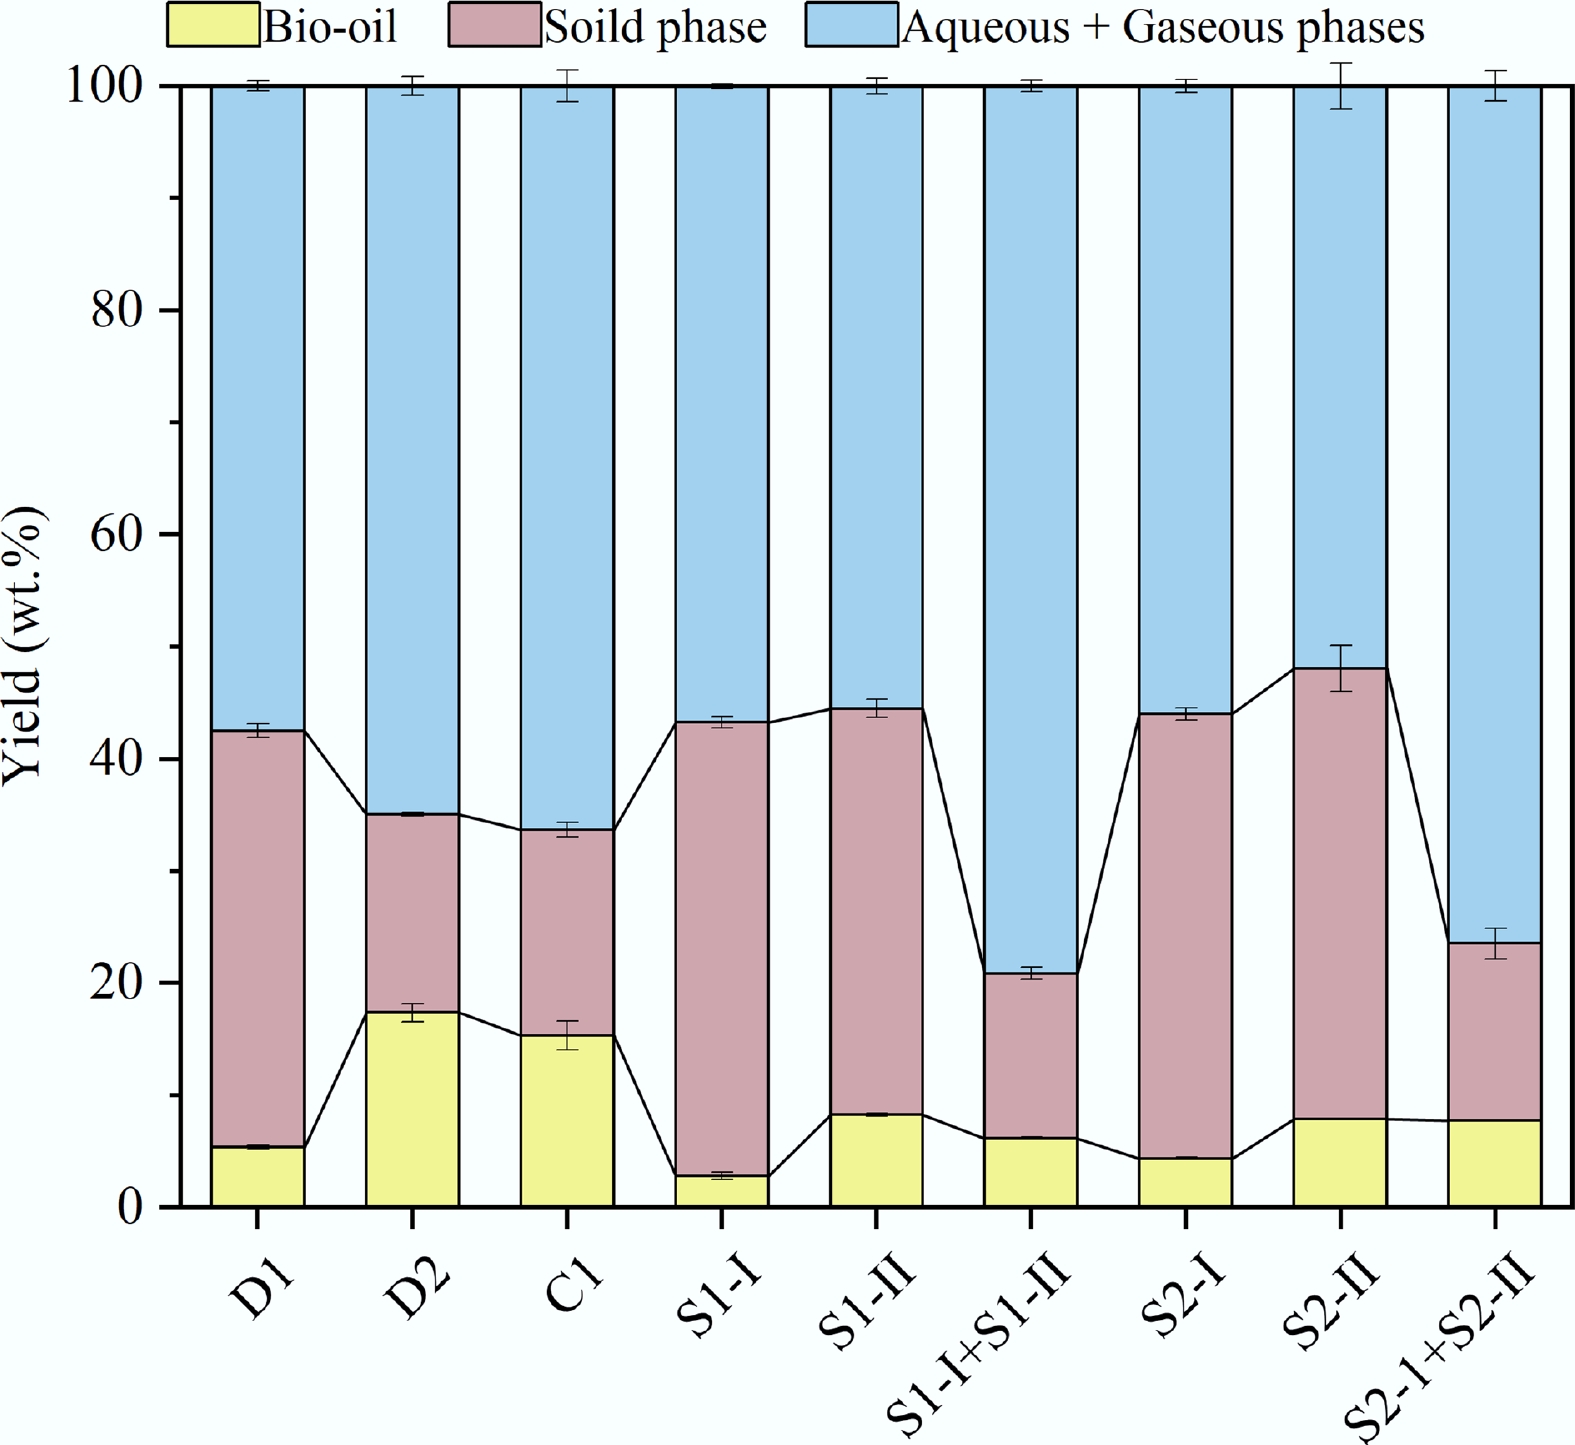
Figure 2.
Product distributions under different HTL processes.
For CT-HTL, the short residence time of the high-temperature stage resulted in incomplete degradation of organic matter, so the bio-oil yield was slightly lower than that of D-HTL, while the solid yield was slightly higher. For ST-HTL, the extension of residence time of the low-temperature pre-treatment stage increased the bio-oil yield of S1-I and S2-I, which were 2.82 wt.% and 55.78%, respectively. Moreover, the yield of the solid product increased, accompanied by a decrease in the total yield of aqueous and gaseous phases. The prolonging of residence time of the high-temperature stage had little influence on the bio-oil yield for S1-II and S2-II, which remained around 8 wt.%. In this case, the products were mainly distributed among the solid, aqueous, and gas phases. The total bio-oil yield obtained under two different residence time periods of ST-HTL was lower than that of D-HTL and CT-HTL at 325 °C. This result aligns with the findings of Jazrawi et al.[8]. In their work, the bio-oil yield decreased from 24.7 wt.% to 12.7 wt.% when the HTL process switched from ST-HTL to D-HTL.
Analysis of bio-oil samples
Elemental compositions and heating value
-
Elemental analysis of the bio-oil samples obtained from different HTL processes was conducted, and atomic ratios, heating values, and energy recovery rates were calculated. The results are listed in Table 3. Overall, the contents of C, H, N, S, and O of all bio-oil samples ranged 69.48–75.51 wt.%, 8.60–10.08 wt.%, 3.36–5.50 wt.%, 0.78–1.26 wt.%, and 9.36–15.95 wt.%, respectively. The heating values fluctuated between 34.45 and 37.18 MJ/kg, while the energy recovery rates varied significantly, with a range of 5.10%–32.20%. For D-HTL, the increase in reaction temperature led to higher C, N, and S contents but lower H and O contents. Compared to the bio-oil produced by D1, the O content of the bio-oil obtained from D2 decreased by 33.5%. This is because oxygen-containing compounds undergo decarboxylation at higher temperatures and produce gaseous products (e.g., CO2), which are then released. Proteins decompose into amino acids and further react with saccharides via the Maillard reaction to form nitrogen-containing heterocyclic compounds. As a consequence, it was observed that the content of N increased by 30%.
Table 3. Elemental compositions, atomic ratios, higher heating values and energy recovery rates of bio-oil obtained via different HTL processes
HTL process Elemental composition (wt.%) Atomic ratio Higher heating
value (MJ/kg)Energy recovery
rate (%)C H N S Oa H/C O/C N/C D1 70.24 9.61 4.10 1.17 14.88 1.642 0.159 0.050 34.92 9.68 D2 74.99 8.60 5.33 1.19 9.89 1.376 0.099 0.061 35.98 32.20 C1 74.93 8.95 5.50 1.26 9.36 1.433 0.094 0.063 36.56 28.90 S1-I 69.48 10.08 3.71 0.78 15.95 1.741 0.172 0.046 35.11 5.10 S1-II 72.60 9.52 3.36 0.98 13.54 1.574 0.140 0.040 35.81 15.27 S2-I 69.58 9.55 4.18 0.99 15.70 1.647 0.169 0.052 34.45 7.80 S2-II 75.51 9.45 3.42 0.88 10.74 1.502 0.107 0.039 37.18 15.15 a Calculated by difference method: O% = 100% – C% – H% – N% – S%. The elemental compositions and heating value of the bio-oil obtained via CT-HTL were similar to those from D-HTL, while the energy recovery rate was lower at 28.90%. For ST-HTL, the prolonging of the reaction time of the first stage slightly increased the C, N, and S contents but reduced the H and O contents. On the contrary, the prolonging of reaction time during the second stage significantly decreased the C content and increased the O content of oil. This phenomenon indicates that the change of reaction time had a more pronounced impact on the second stage than on the first stage. When the residence time of the second stage was 30 min, the bio-oil achieved the highest heating value of 37.18 MJ/kg. Notably, regardless of the stage for ST-HTL, the N and S contents were lower than those in the other two HTL processes. To be specific, the N content was 3.36 wt.% and 3.42 wt.% for S1-II and S2-II, respectively, which decreased by 37% and 35.83% compared to D2. Due to the decline of product yield, low energy recovery rates were observed for the bio-oil samples from CT-HTL and ST-HTL.
The H/C, O/C, and N/C ratios of raw MS were 1.9656, 0.6319, and 0.1350, respectively. The corresponding values of all bio-oil samples fell within the ranges of 1.3762–1.7409, 0.0937–0.1722, and 0.0388–0.0629, respectively. Based on these data, Van Krevelen diagrams for MS and bio-oil were plotted, which are provided in Fig. 3. As can be seen from Fig. 3a, the O/C and H/C ratios of bio-oil obtained by ST-HTL were higher than those from CT-HTL and D2. This suggests the presence of more oxygen-containing compounds, which can reduce the stability of bio-oil. A higher H/C ratio indicates that bio-oil exhibits an obvious aliphatic character, thus contributing to the improvement of its combustion characteristics and energy density. The N/C ratio of the ST-HTL bio-oil was significantly lower than that under other HTL conditions (see Fig. 3b). This is because low-temperature treatment of the first stage transfers most nitrogen-containing substances to the aqueous phase, resulting in reduced allocation of nitrogen to the oil product derived from the first stage. The nitrogen migration process also provides a solid feedstock with low nitrogen content for the second stage, so the nitrogen content in the oil-phase product of the second stage decreased, which can substantially reduce the emission of nitrogen oxides during combustion.
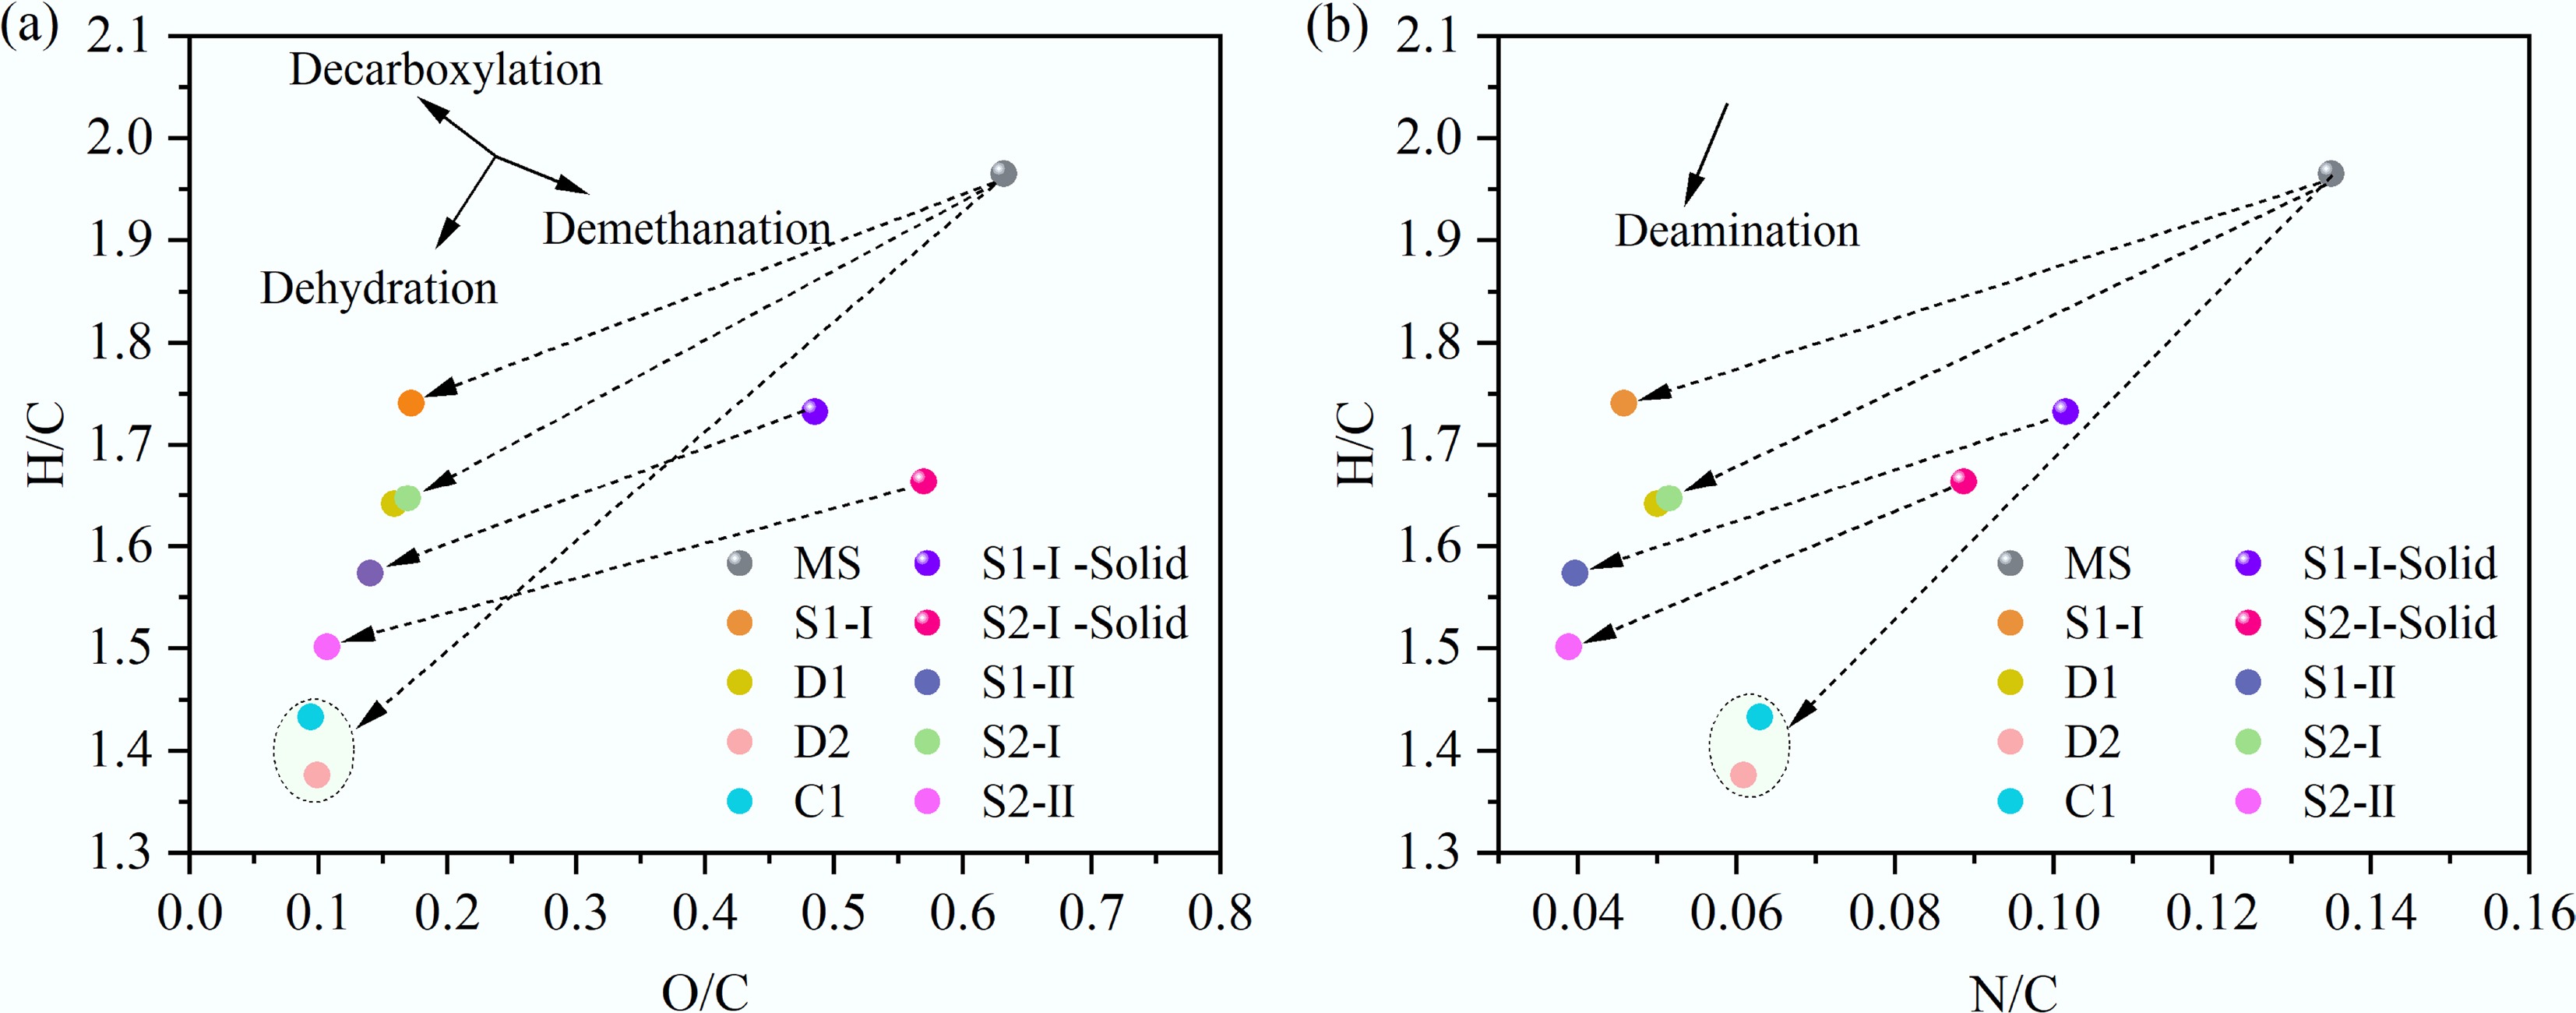
Figure 3.
Van Krevelen diagrams for (a) MS and (b) bio-oil.
The Van Krevelen diagram helps to visualize the evolution pathways of MS and its products intuitively. In Fig. 3a, the transformation directions of H2O, CO2, and CH4 are marked, which correspond to dehydration, decarboxylation, and demethanation reactions, respectively. Starting from the feedstock and ending at the product, the slopes of straight lines for these reactions were 2, –1, and –0.5, respectively. All connecting lines between the starting and ending points in Fig. 3a have slopes between 2 and –1, suggesting that dehydration and decarboxylation dominate the HTL treatment. Decarboxylation removed COO and C=O groups by producing CO2 and CO gases. This transformation led to higher H/C and lower O/C ratios of the product. As temperature and time increased, the slope of the line gradually approached 2, indicating that dehydration became the predominant reaction, and thus, lower H/C and O/C ratios can be explained. Under severe reaction conditions, decarboxylation may weaken while demethanation strengthens. Figure 3b shows the transformation direction of NH3, which matches the deamination reaction with a slope of 3. Higher temperatures and longer residence times enhanced deamination, as confirmed by the comparison of the slopes of D1 and D2, as well as S1-I and S2-I. However, S1-II and S2-II did not follow this trend. This difference is related to the fact that their feedstock, which came from the solid products obtained by the first stage, was produced under different operating conditions.
CG-MS analysis
-
The bio-oi derived from D2, C, S1-I, and S1-II were characterized by GC-MS. Compounds with the relative content greater than 0.5% are listed in Supplementary Table S1 based on the calculation results of the peak area percentage. The bio-oil contains hundreds of compounds, including hydrocarbons, alcohols, esters, acids, phenols, aldehyde ketones, nitrogen-containing compounds, and other oxygen-containing compounds. Their distribution characteristics are depicted in Fig. 4a. Nitrogen-containing compounds with a relative content of 32.45%–42.46% were the main component of the bio-oil. The bio-oil of group C was observed to have the highest proportion of nitrogen-containing compounds, which may be attributed to the enhanced migration of inorganic nitrogen (inorganic-N) from the solid phase to the liquid phase. The concentration of nitrogen-containing compounds in the bio-oil produced by ST-HTL was lower than that by D-HTL. Specifically, the proportion of nitrogen-containing compounds in S1-I and S1-II decreased by 7.94% and 20.45%, respectively, which aligns well with the result of elemental analysis. It is learned from Fig. 4b that nitrogen-containing compounds primarily consisted of heterocyclic-N, amine-N, and amide-N. Due to accelerated acylation reactions between fatty acids and ammonia, the relative content of amides was higher under the mild conditions of 200 °C and 10 min. Notably, CT-HTL and ST-HTL both promoted the formation of heterocyclic-N, implying that the Maillard reaction between monosaccharides (such as glucose and fructose) and amino acids was the dominant pathway for HTL conversion of MS.
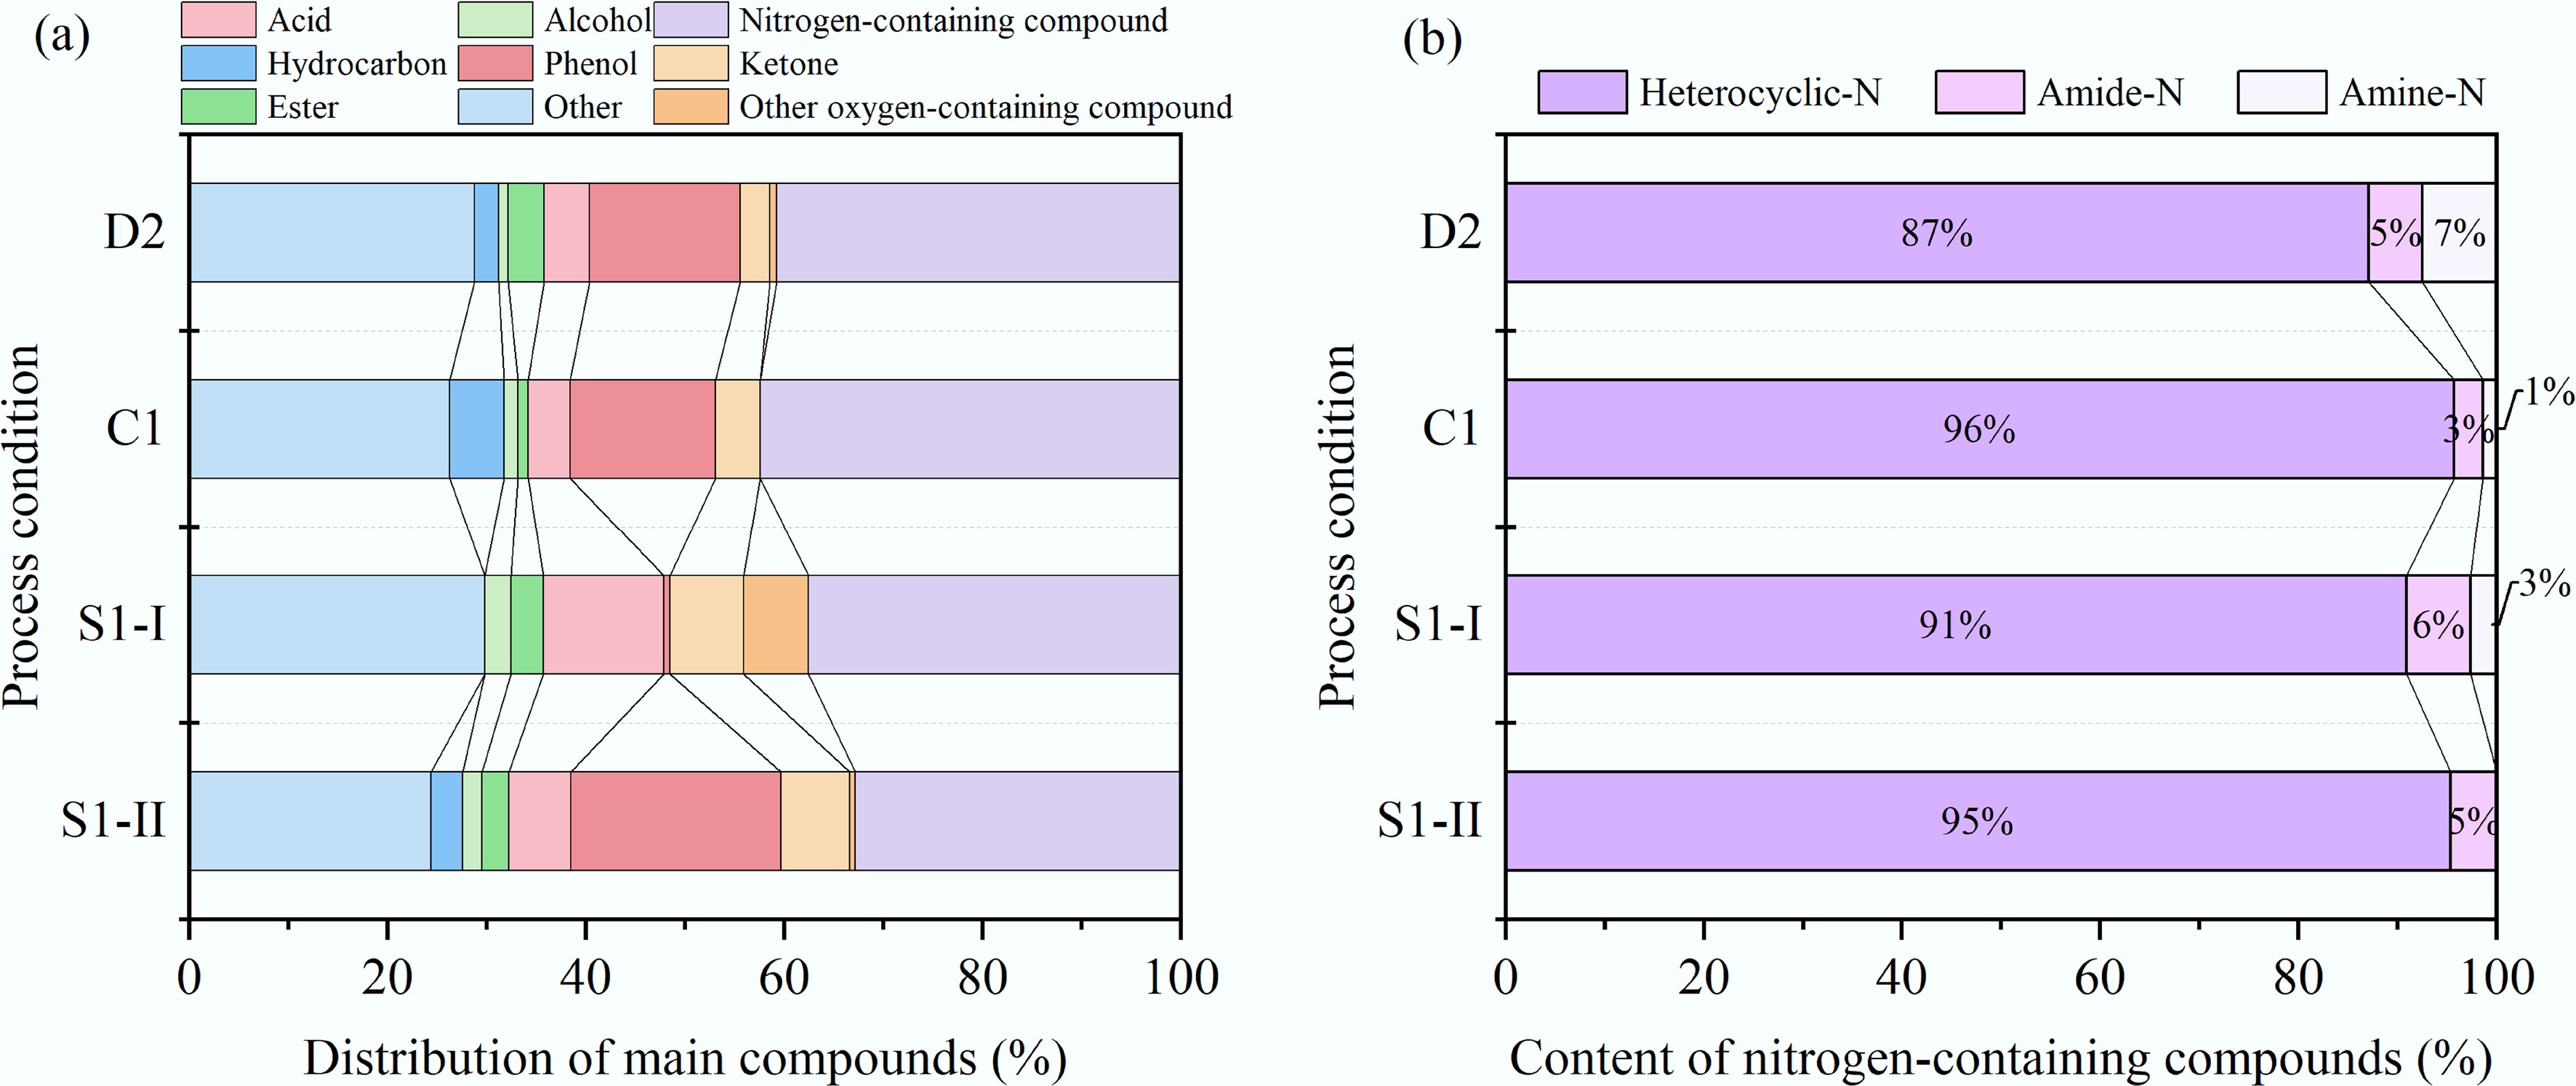
Figure 4.
Compounds contained in bio-oil obtained by different HTL processes. (a) Distribution of main compounds. (b) Content of nitrogen-containing compounds.
In addition, the phenol content derived from C nearly remained unchanged when compared to D2, while the contents of hydrocarbons and alcohols increased, and the ester content decreased. This indicates that CT-HTL promotes the hydrolysis of esters to form alcohols and acids, with the acids further undergoing decarboxylation to produce hydrocarbons. The acid content of S1-I was the highest at 12.12% and it comprises a lot of types of fatty acids such as n-Hexadecanoic acid, dodecanoic acid, hexanoic acid, and cis-13-Octadecenoic acid. These compounds mainly originated from the hydrolysis of lipids in MS. The phenol content was almost negligible. S1-II showed a larger proportion of phenolic compounds, suggesting that ST-HTL contributes to the formation of phenols through dehydration of furfurals or dehydrogenation of acids. In summary, ST-HTL improves the bio-oil quality by increasing the total content of desirable products such as hydrocarbons, alcohols, and esters, along with reducing the proportion of nitrogen-containing compounds. However, all bio-oil samples still contained a large amount of nitrogen- and oxygen-containing substances (such as indole and 2-pyrrolidinone), and their carbon chain lengths were generally above C10, even reaching up to C27 (e.g., cholestane, cholest-2-ene). Therefore, it is necessary to adopt catalytic hydrogenation to enhance cracking, deoxygenation, and denitrogenation for bio-oil upgrading.
Analysis of solid products
Elemental compositions and proximate analysis
-
Table 4 lists elemental compositions and proximate analysis results of solid products from D-HTL, CT-HTL, and ST-HTL. The C content of solid products of D1, S1-I and S2-I was 15.27 wt.%, 15.03 wt.%, and 13.92 wt.%, respectively. Because the operating conditions were mild, the HTL conversion was primarily controlled by dehydration. As the reaction temperature increased to the second stage, the C content decreased significantly. D2 exhibited a reduction of 30.58 wt.% compared to D1. S1-II decreased by 47.57 wt.% compared to S1-I, and S2-II decreased by 39.15 wt.% compared to S2-I. During this process, more organic solids and water-soluble products were transformed into the oil and gas phases. The changing trends of O and N contents were similar to the trend of C, indicating the occurrence of dehydration, decarboxylation, and deamination. Based on the variation in atomic ratios, the first stage of D-HTL, CT-HTL, and ST-HTL is dominated by dehydration and decarboxylation, whereas the second stage primarily shifts to dehydration and demethylation.
Table 4. Elemental compositions, atomic ratios and proximate analysis results of solid products from different HTL processes
HTL process Elemental composition (wt.%) Atomic ratio Proximate analysis (wt.%) C H N S Oa H/C O/C N/C Ash VM FCb D1 15.27 2.08 1.72 0.21 7.90 1.6346 0.3880 0.0965 72.82 26.19 0.99 D2 10.6 1.91 0.95 0.23 1.53 2.1623 0.1083 0.0768 84.78 14.63 0.59 C 9.94 1.14 0.9 0.28 3.02 1.3763 0.2279 0.0776 84.72 14.80 0.48 S1-I 15.03 2.17 1.78 0.23 9.72 1.7325 0.4850 0.1015 71.07 28.28 0.65 S1-II 7.88 1.05 0.71 0.08 3.94 1.5990 0.3750 0.0772 86.34 13.34 0.32 S2-I 13.92 1.93 1.44 0.28 10.58 1.6638 0.5700 0.0887 71.85 28.05 0.10 S2-II 8.47 1.16 0.65 0.23 3.74 1.6434 0.3312 0.0658 85.75 14.20 0.05 a O% = 100% – C% – H% – N% – S% – Ash%; b FC% = 100% – Ash% – VM%. The proximate analysis results suggest that with increasing reaction temperature and prolonged residence time, the ash content increased, while the volatile matter and fixed carbon contents decreased. During D-HTL, the ash content contained in the solid product from D1 was higher at 84.78 wt.%, while the volatile matter and fixed carbon contents were low at 14.63 wt.% and 0.59 wt.%, respectively. For solid products obtained by the two ST-HTL groups, the ash content increased from 71.07 wt.% (S1-I) to 71.85 wt.% (S2-I), and from 85.75 wt.% (S2-II) to 86.34 wt.% (S1-II). Furthermore, the ash content of the solids from the second stage was higher than that from the first stage. The changes in volatile matter and fixed carbon content showed opposite trends. The increase in ash content is related to the precipitation of minerals. The decline in volatile matter content indicates the occurrence of dehydration and decarboxylation reactions. The decrease in fixed carbon content may be due to the formation of gaseous products, e.g., CO2[10].
XPS of nitrogen in solid products
-
XPS was employed to identify the nitrogen-containing functional groups in the solid residues obtained under different HTL processes, and their relative contents were calculated. The results are shown in Fig. 5 and Table 5. The peaks located at 402.3, 399.8, 400.5, 398.5, and 401.4 eV corresponded to inorganic-N, ammonia nitrogen (ammonia-N), pyrrolic nitrogen (pyrrole-N), pyridinic nitrogen (pyridine-N), and quaternary nitrogen (quaternary-N), respectively[11−13]. It can be seen that nitrogen in MS primarily exists in the form of inorganic-N and ammonia-N, with the latter accounting for a high proportion of 93.7%. No inorganic-N was detected in the solid residues after HTL, indicating that inorganic-N species such as nitrate and ammonium ions were completely dissolved into the aqueous phase. The relative content of ammonia-N decreased to 13.6%–41.1%. This suggests that ammonia-N undergoes a series of chemical reactions under high-temperature conditions, such as decomposition, cyclization, and polymerization, thus forming pyrrolic, pyridinic, and quaternary-N.
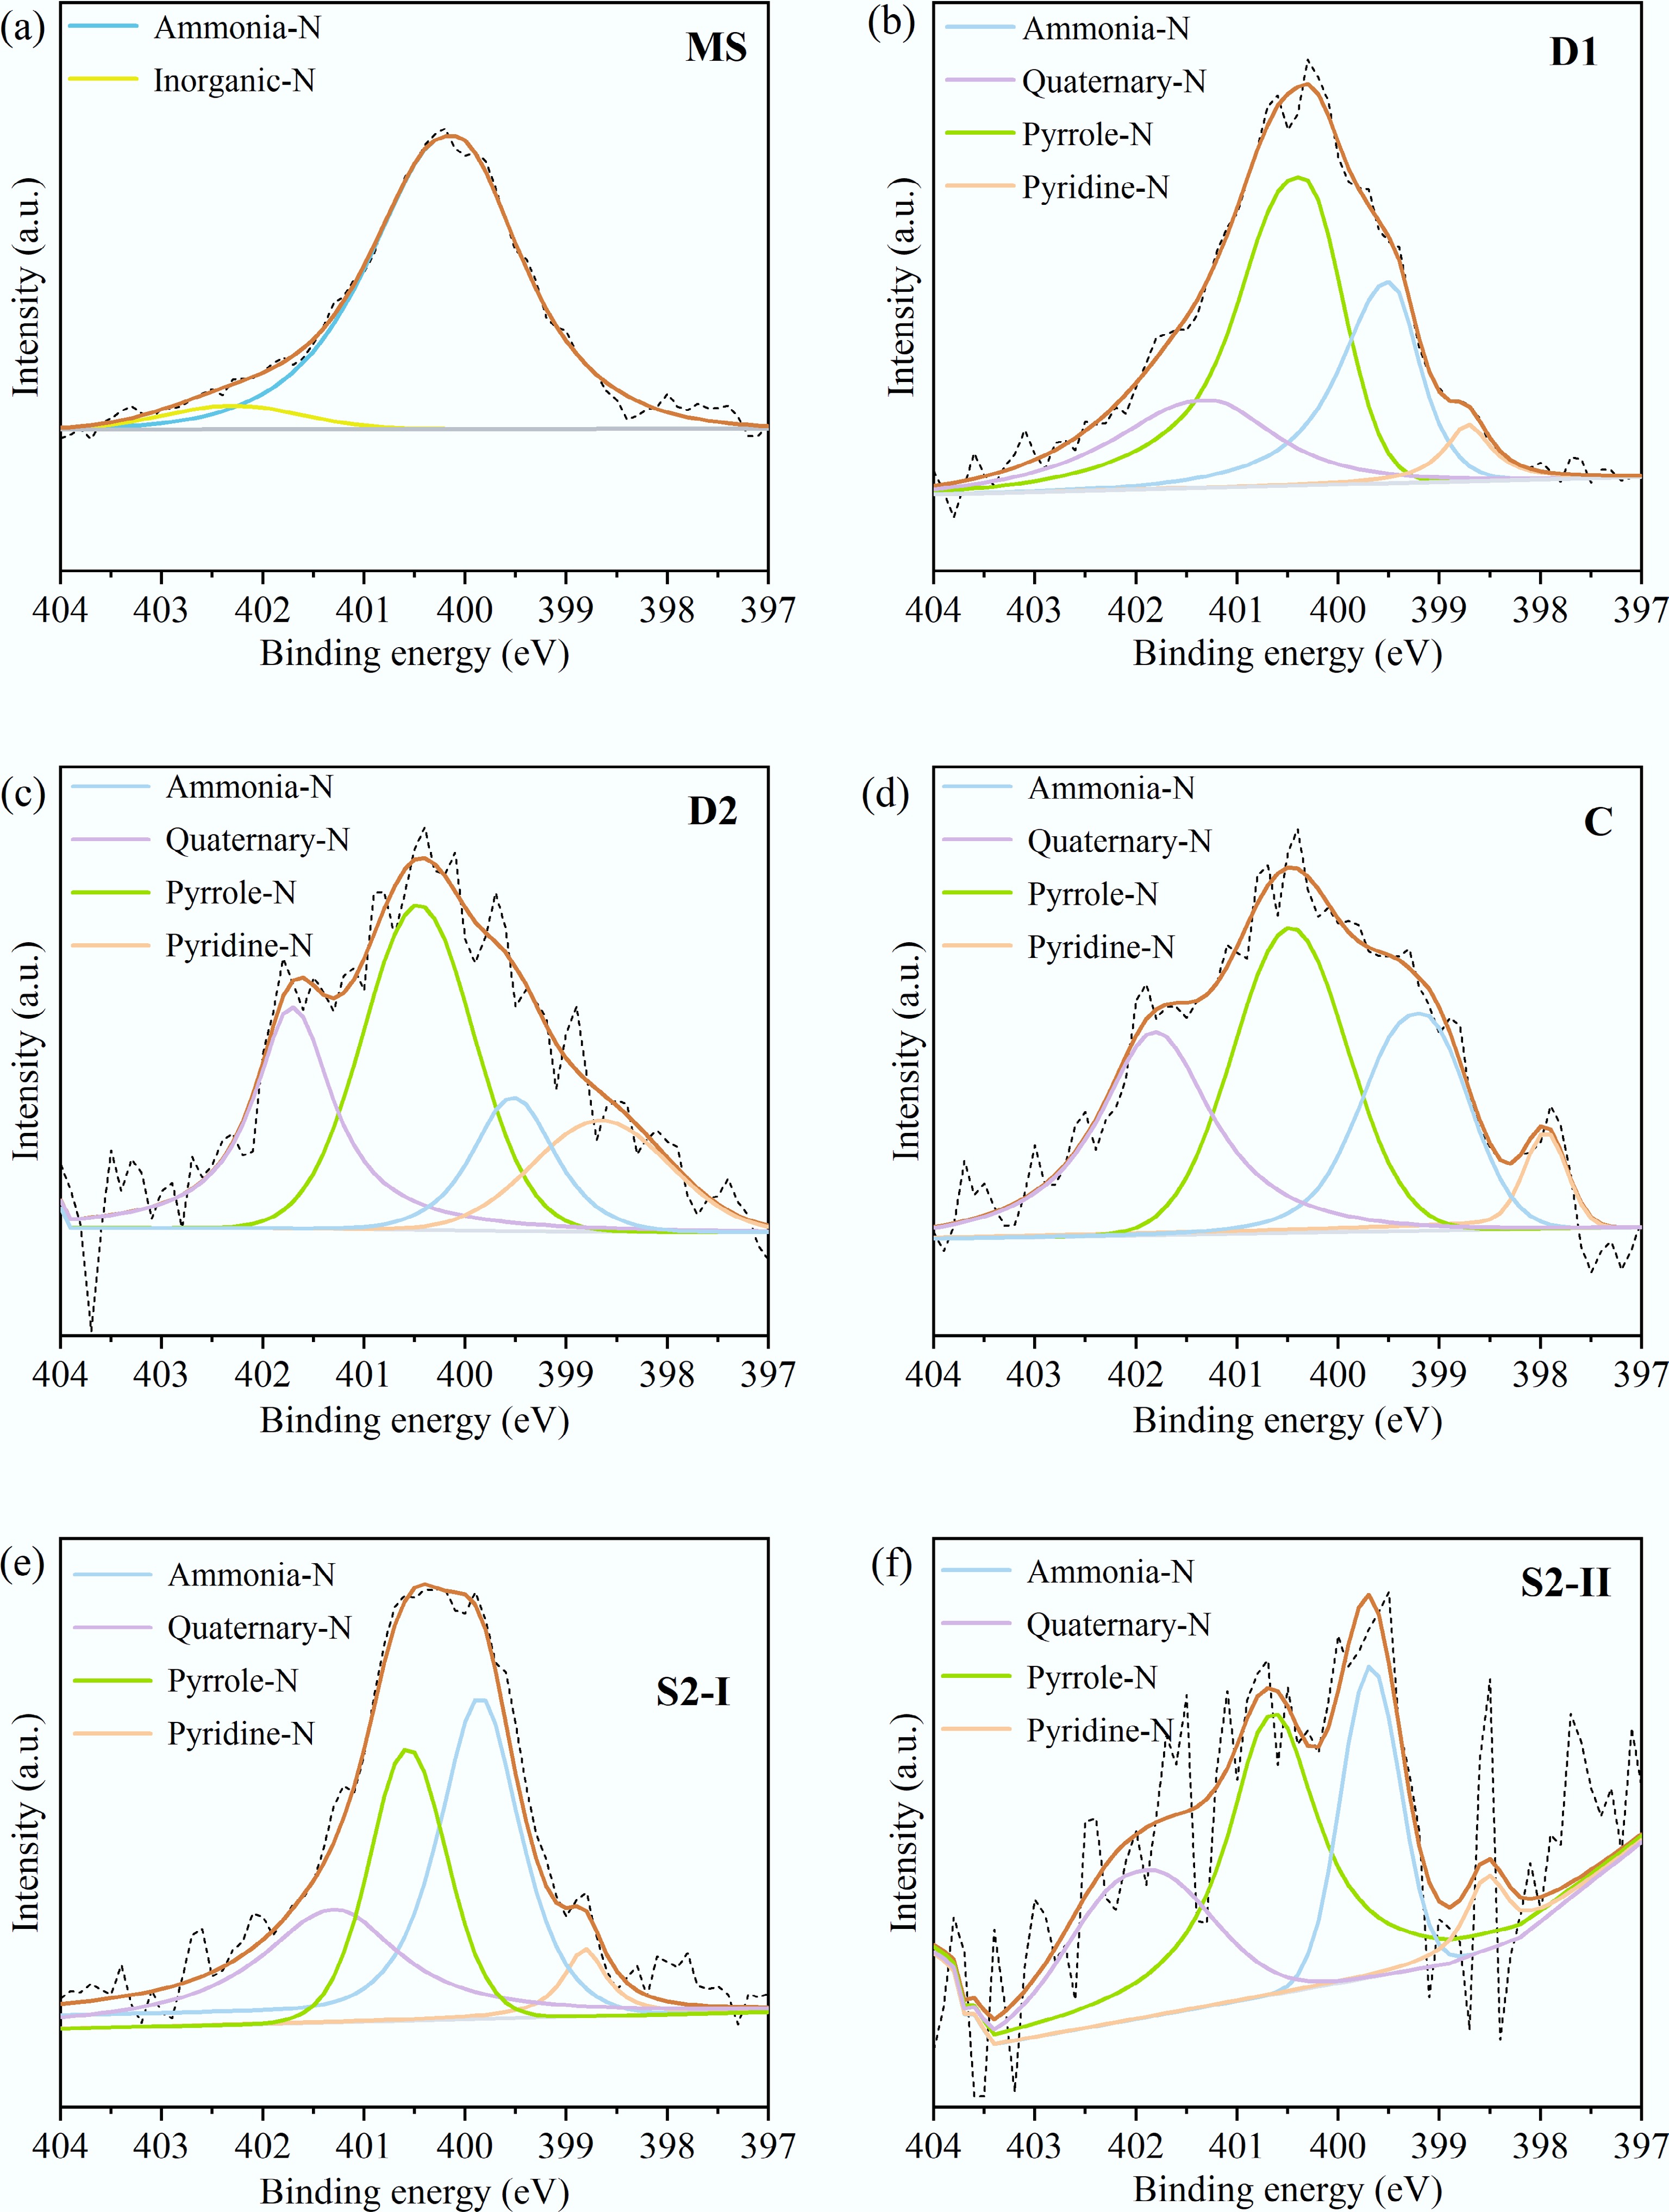
Figure 5.
XPS spectra of N1s in the solid product from (a) MS, (b) D1, (c) D2, (d) C, (e) S2-I, and (f) S2-II.
Table 5. Relative contents of nitrogen-containing functional groups in ms and solid products under different conditions
N species MS D1 D2 C S2-I S2-II Inorganic-N 6.3% − − − − − Ammonia-N 93.7% 25.2% 13.6% 25.7% 41.1% 23.6% Quaternary-N − 21.0% 27.1% 30.1% 26.0% 26.4% Pyrrole-N − 48.8% 41.8% 38.0% 27.6% 44.3% Pyridine-N − 5.0% 17.5% 6.2% 5.2% 5.7% For D-HTL, when the temperature changed from 200 to 325 °C, the relative contents of quaternary-N and pyridine-N increased from 21.0% to 27.1%, and 5.0% to 17.5%, respectively, while the trends for ammonia-N and pyrrole-N were the opposite. This difference implies that pyrrole-N can be converted into quaternary or pyridine-N in addition to ammonia-N[12]. Compared to D-HTL, CT-HTL contained a higher content of quaternary-N and a lower content of pyridine-N. This can be attributed to the enhanced cyclic condensation and polymerization of pyridine-N, leading to the formation of more quaternary-N[14]. For ST-HTL, the relative contents of ammonia-N, quaternary-N, pyrrole-N, and pyridine-N in the solid residue derived from the first stage were 41.1%, 26.0%, 27.6%, and 5.2%, respectively. In the solid product obtained from the second stage, the corresponding contents were 23.6%, 26.4%, 44.3%, and 5.7%. It is evident that the contents of quaternary and pyridine-N nearly achieved a balance, while ammonia-N underwent varying degrees of cyclization and polymerization.
Analysis of aqueous phase products
GC-MS analysis
-
Aqueous phase samples obtained from three HTL processes (D2, C, S1) were analyzed by GC-MS. The contained compounds were categorized into alcohols, esters, acids, phenols, ketones, other oxygen-containing compounds, nitrogen-containing compounds, and the remaining compounds. Compounds with a relative peak area greater than 0.5% were selected, and their distribution is shown in Fig. 6. Nitrogen-containing compounds dominated all aqueous samples at 63.52%–65.09%, accompanied by certain amounts of ketones at 1.20%–9.79%, esters at 1.98%–27.47%, phenols at 0%–6.07%, acids at 0%–7.5%, and minor amounts of alcohols at 0%–3.47% as well as other oxygen-containing compounds at 0%–3.91%. Hydrocarbons were not detected due to their low solubility in water, which is consistent with the findings reported by Zhang et al.[15]. The nitrogen-containing compounds primarily consisted of nitrogen-containing heterocycles, including pyrroles, pyridines, pyrazines, piperazines, and pyrrolidine derivatives, along with minor amounts of amines and amides. Compounds like 2-pyrrolidinone and 1-methyl-2-pyrrolidinone can be formed via the Maillard reaction between amino acids (from protein hydrolysis) and reducing saccharides (from carbohydrate hydrolysis). The 13-Docosenamide might result from the ammonolysis of fatty acids. The proportion of nitrogen-containing compounds in the aqueous phase from S1-I was 65.08%, which is comparable to or even higher than that in other aqueous samples. This indicates that a significant portion of nitrogen can be transferred to the aqueous phase even under relatively short residence times and lower temperatures, thereby achieving a considerable nitrogen removal effect. Cyclic ketones were formed through the dehydration, isomerization, and cyclization of monosaccharides[16]. Phenolic compounds mainly originate from the cleavage of ether bonds in lignin, but the reaction typically occurs above 250 °C[17]. Therefore, no phenols were detected in the aqueous phase of S1-I.
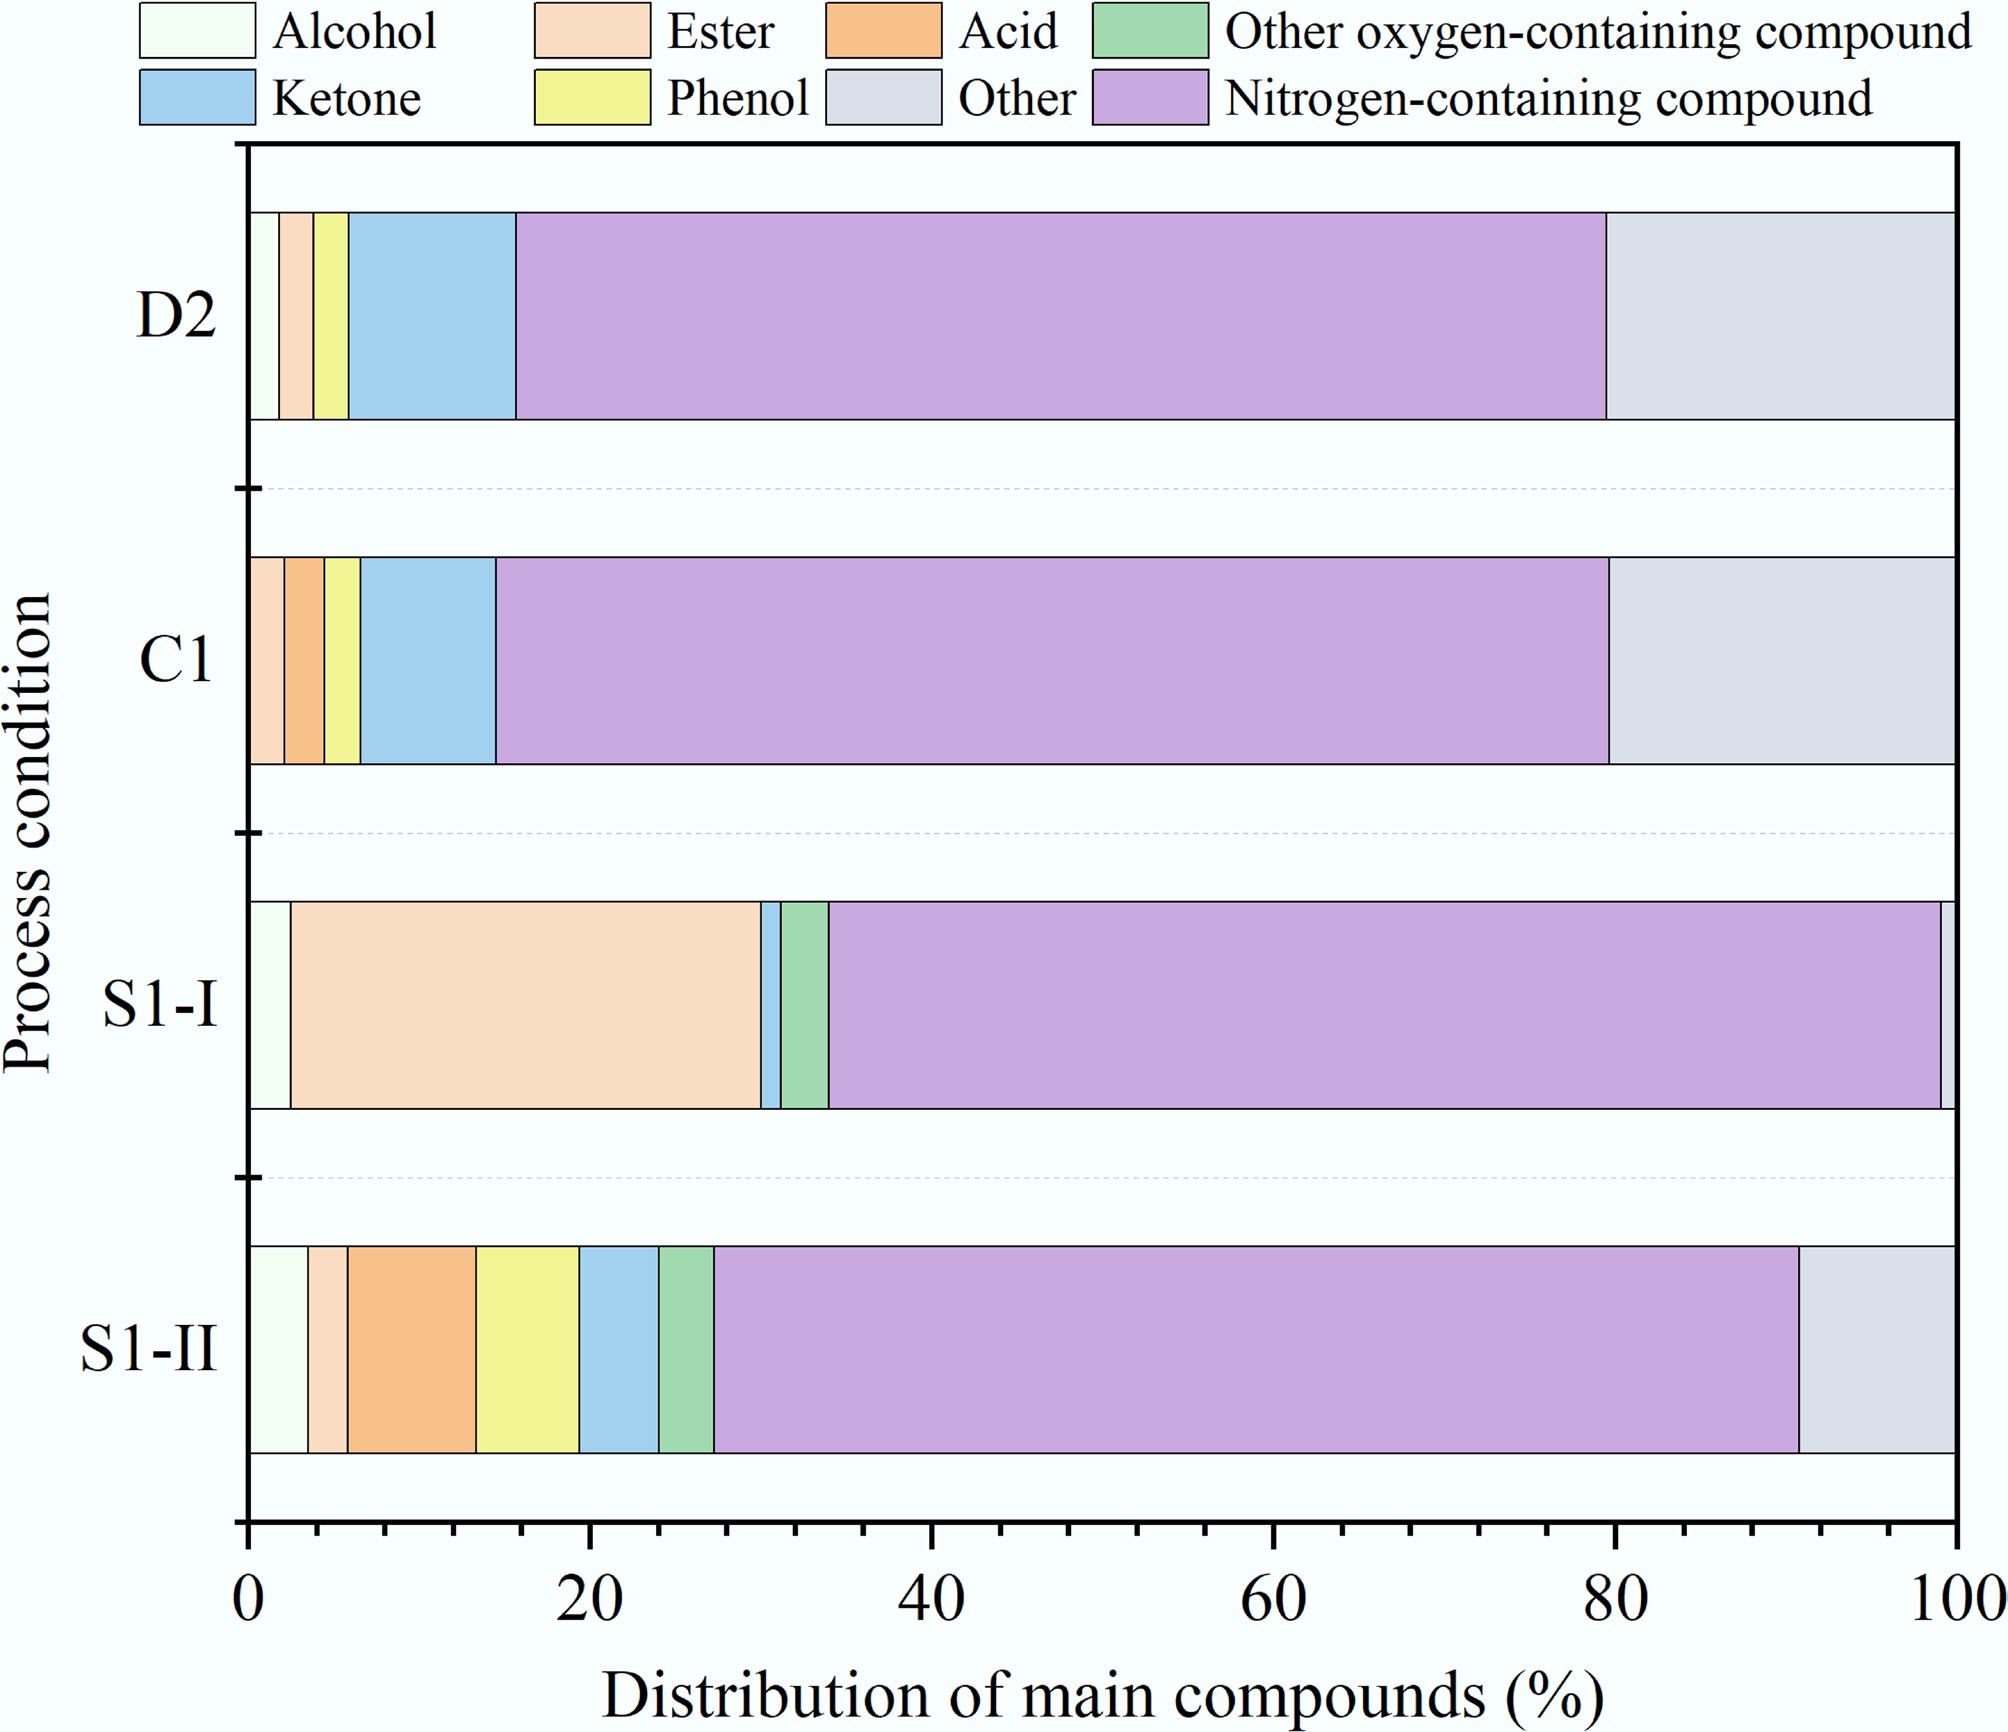
Figure 6.
Distribution of main compounds in aqueous phase products from different HTL processes.
TN and TOC analysis of aqueous phase products
-
TN and TOC analysis data of the aqueous phase products from all HTL conditions are presented in Fig. 7. For D1, S1-I, and S2-I, the TN and TOC concentrations were 2,840 and 25,031, 2,850 and 32,950, and 790 and 37,460 mg/L, respectively. Compared to other conditions, these two indicators reached a relatively high level. This is because lipids, proteins, and carbohydrates were primarily incorporated into the aqueous phase through hydrolysis[6]. Under D2 and C, TOC significantly decreased, and TN also showed a descending trend. This indicates that high temperatures (> 300 °C) promote the repolymerization of organic compounds in the aqueous phase to form large nitrogen-containing molecules, which further migrate to the oil phase or decompose into the gas phase[18,19]. The TN concentrations of S1-II and S2-II were the lowest among all aqueous phase samples, with the values at 995 and 833.5 mg/L, respectively. Since the nitrogen content in the oil and solid phase products under S1-II and S2-II was also the lowest (see Sections 'Elemental compositions and proximate analysis' and 'GC-MS analysis'), nitrogen is effectively removed during the low-temperature pretreatment stage of ST-HTL based on the law of conservation of mass.
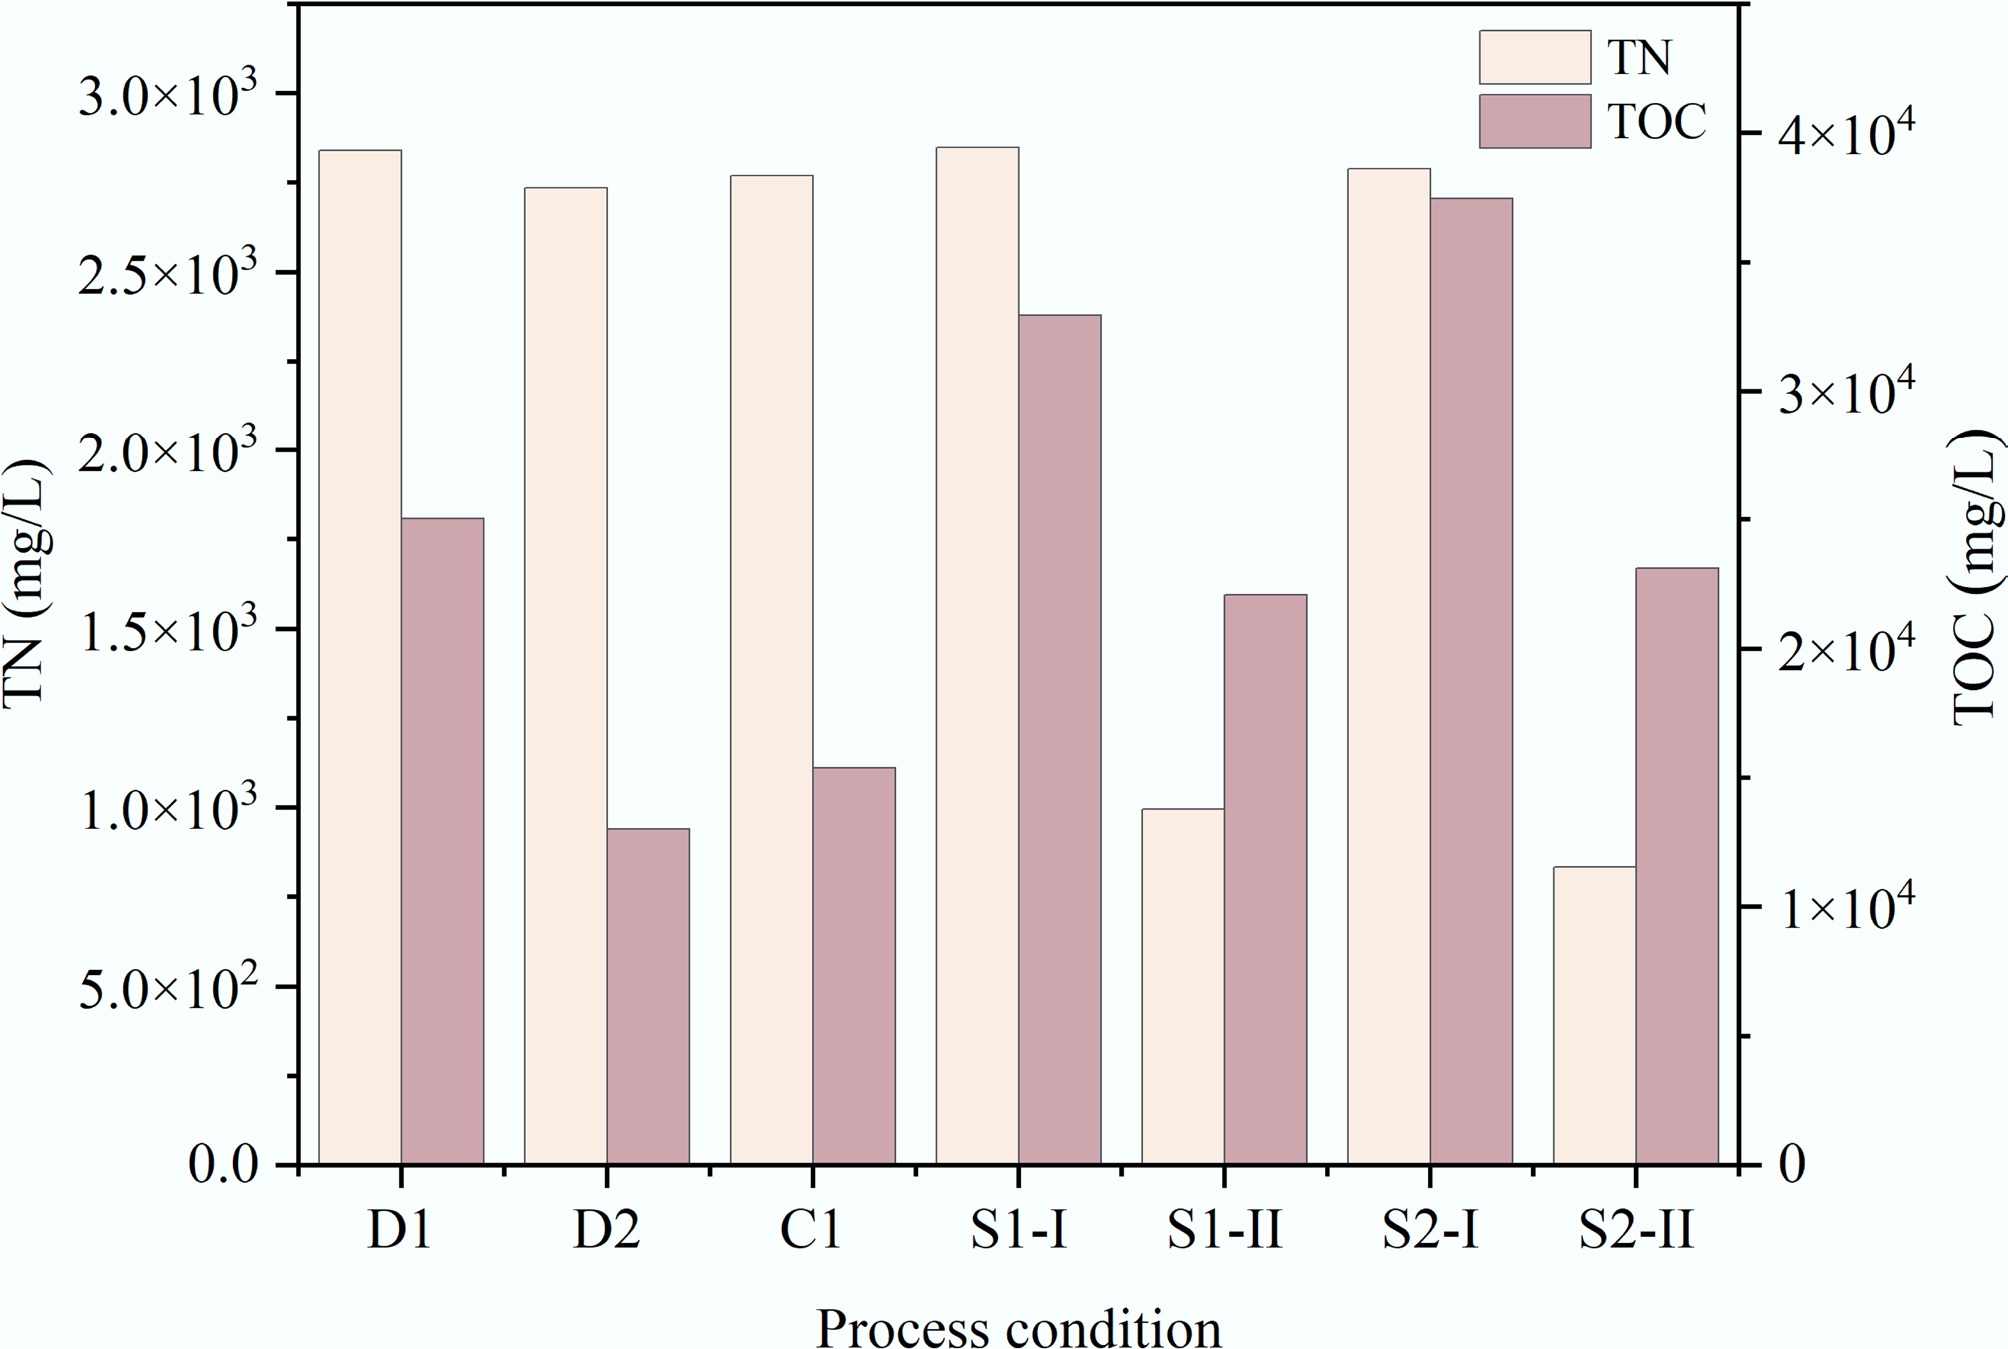
Figure 7.
TN and TOC concentrations of aqueous phase products from different HTL processes.
Nitrogen distribution
-
Figure 8 depicts the distribution of nitrogen in the oil-, solid-, and aqueous phase products from three HTL processes. The nitrogen in MS primarily existed in the form of inorganic and organic nitrogen. After HTL treatment, over half of the nitrogen was recovered in the aqueous phase with the content of 57.88–90.32 wt.%, followed by the solid phase, while the distribution of N in the bio-oil was the lowest. The increase in temperature tended to make nitrogen migrate towards the oil phase. When the reaction temperature increased from 200 °C of D1 to 325 °C of D2, the distribution of nitrogen in the solid phase decreased from 28.37 wt.% to 11.88 wt.%, that in the aqueous phase decreased from 75.73 wt.% to 72.93 wt.%, and that in the oil phase increased from 3.34 wt.% to 15.34 wt.%. The residence time of CT-HTL was the same as D-HTL, and it included low-temperature and high-temperature stages, which could somewhat hinder the migration of nitrogen from MS to the oil phase in theory, but the experimental results showed that the distribution of nitrogen in the oil phase of CT-HTL was slightly higher (16.14 wt.%) than that of D-HTL. This may be due to the long transition time from the low-temperature stage to the high-temperature stage, which facilitated the conversion of N to the oil phase. The increase in residence time also promoted the conversion of nitrogen-containing organic matter from MS into bio-oil. The nitrogen in the oil phase of S2-I increased by 36% compared to S1-I, while the N in the oil phase of S2-II decreased by 42% compared to S1-II, indicating that changes in the duration of the high-temperature stage have a more significant impact on the HTL process. The lowest distribution of nitrogen, at 4.60 wt.% in the oil phase, was obtained from S1, followed by S2 (5.47 wt.%). Therefore, ST-HTL is the ideal choice for producing bio-oil with low nitrogen content.
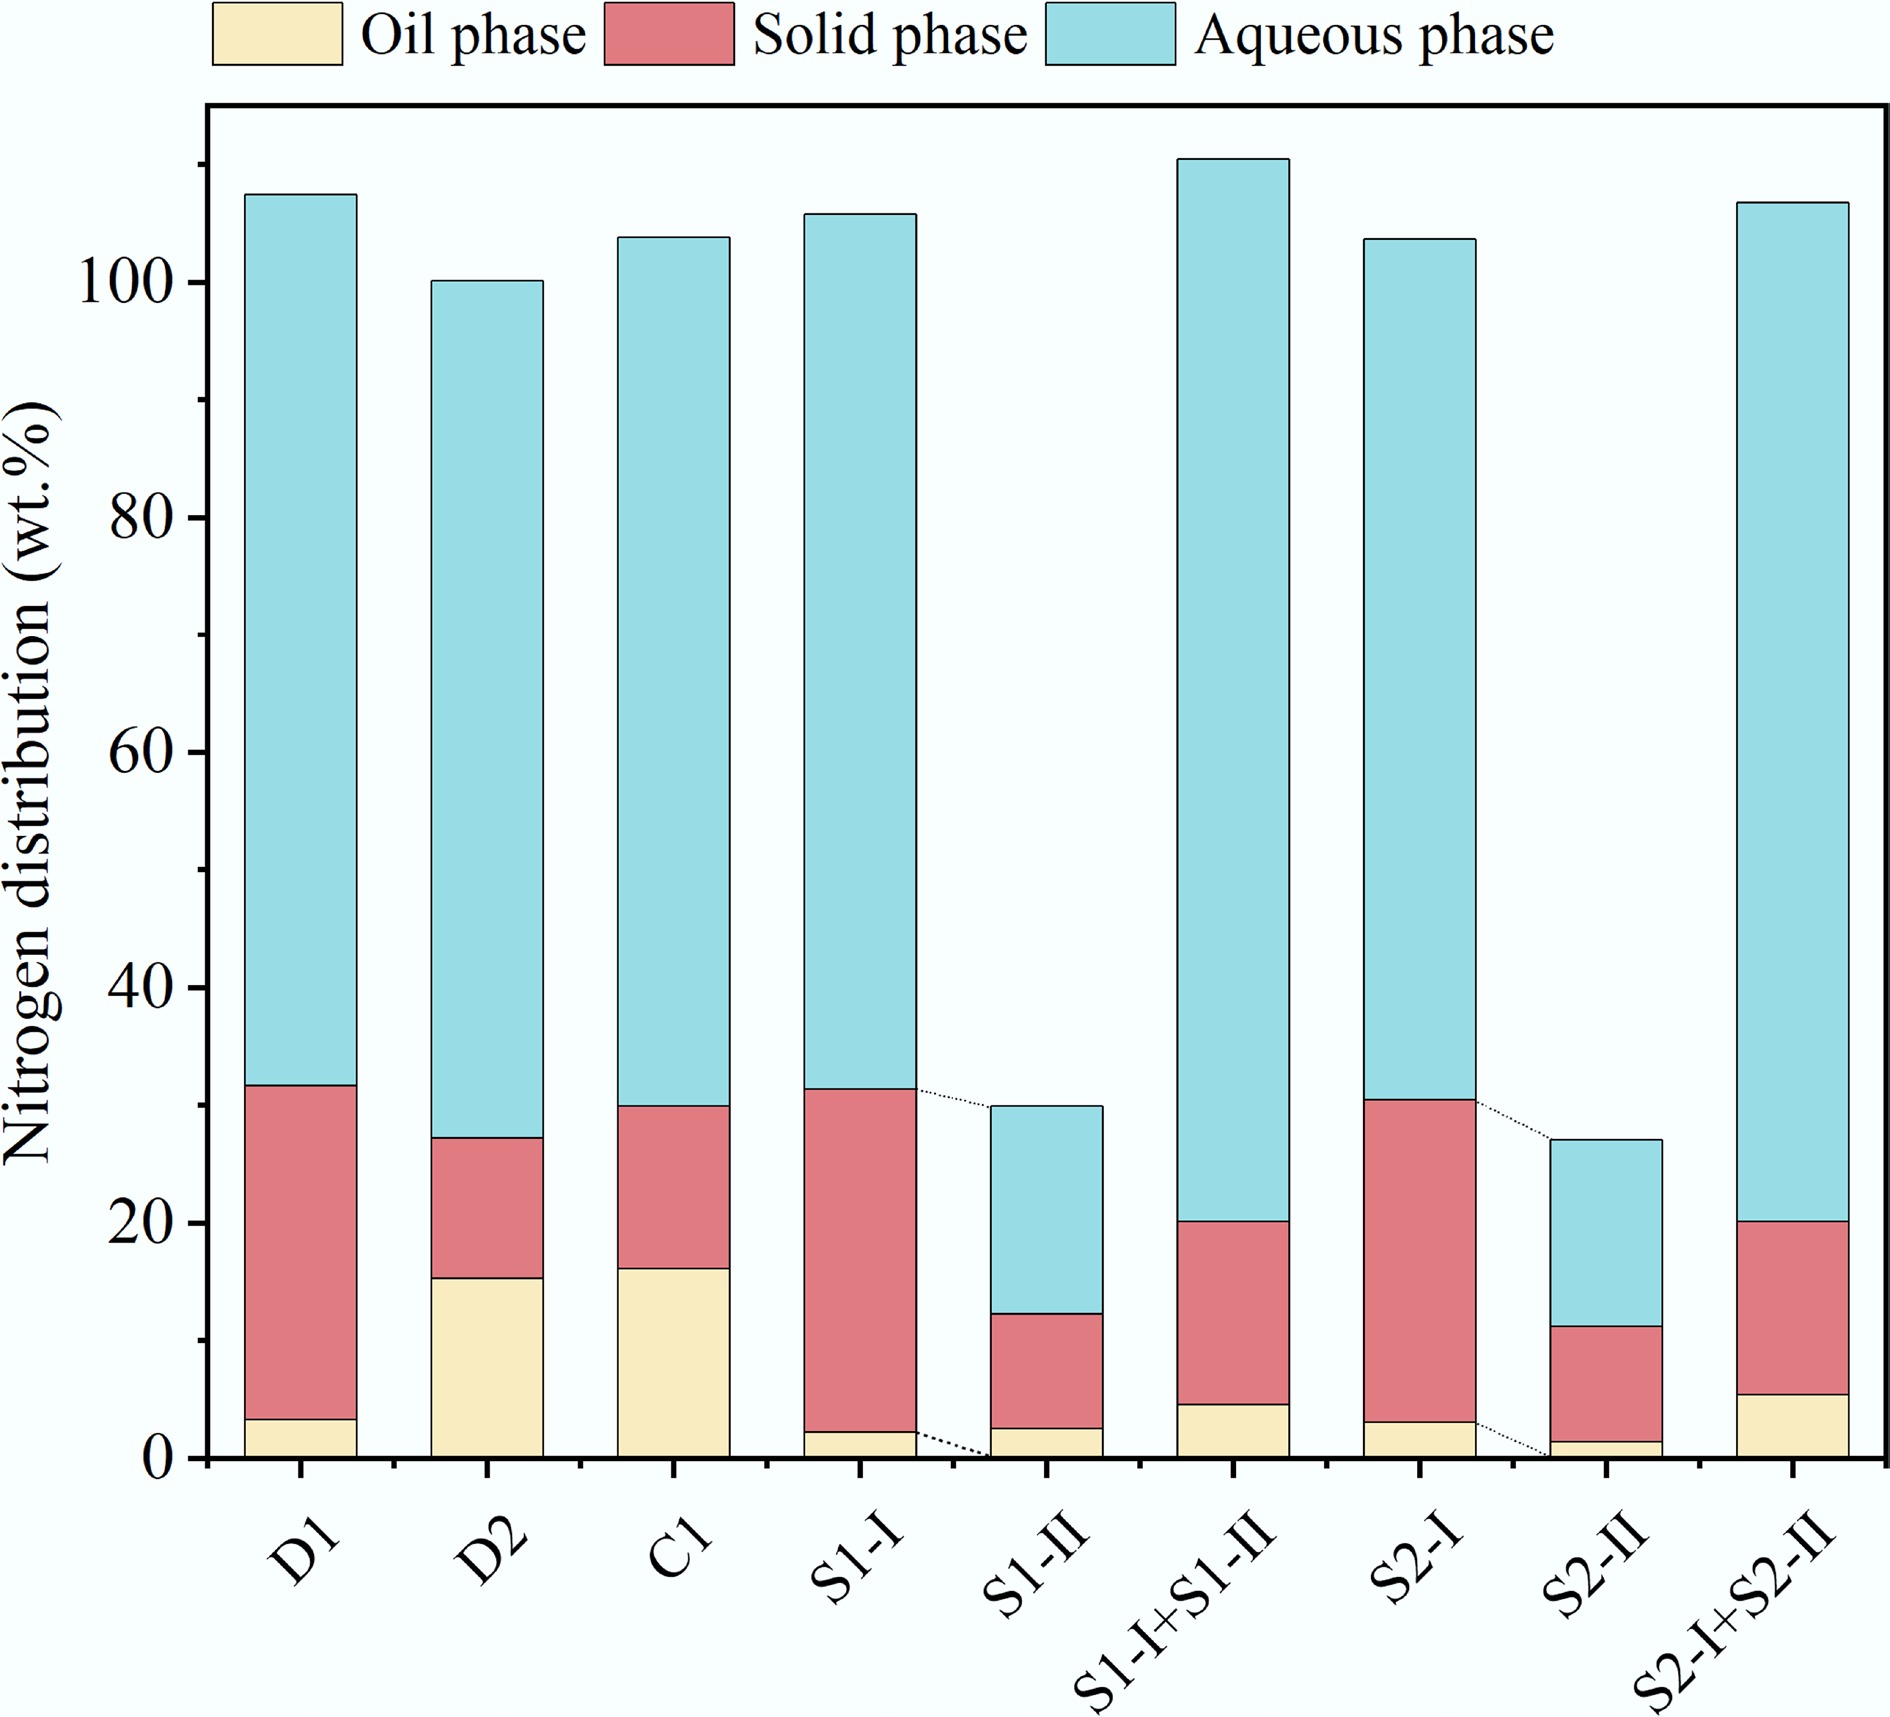
Figure 8.
Nitrogen distribution of HTL products.
Nitrogen migration and evolution pathways
-
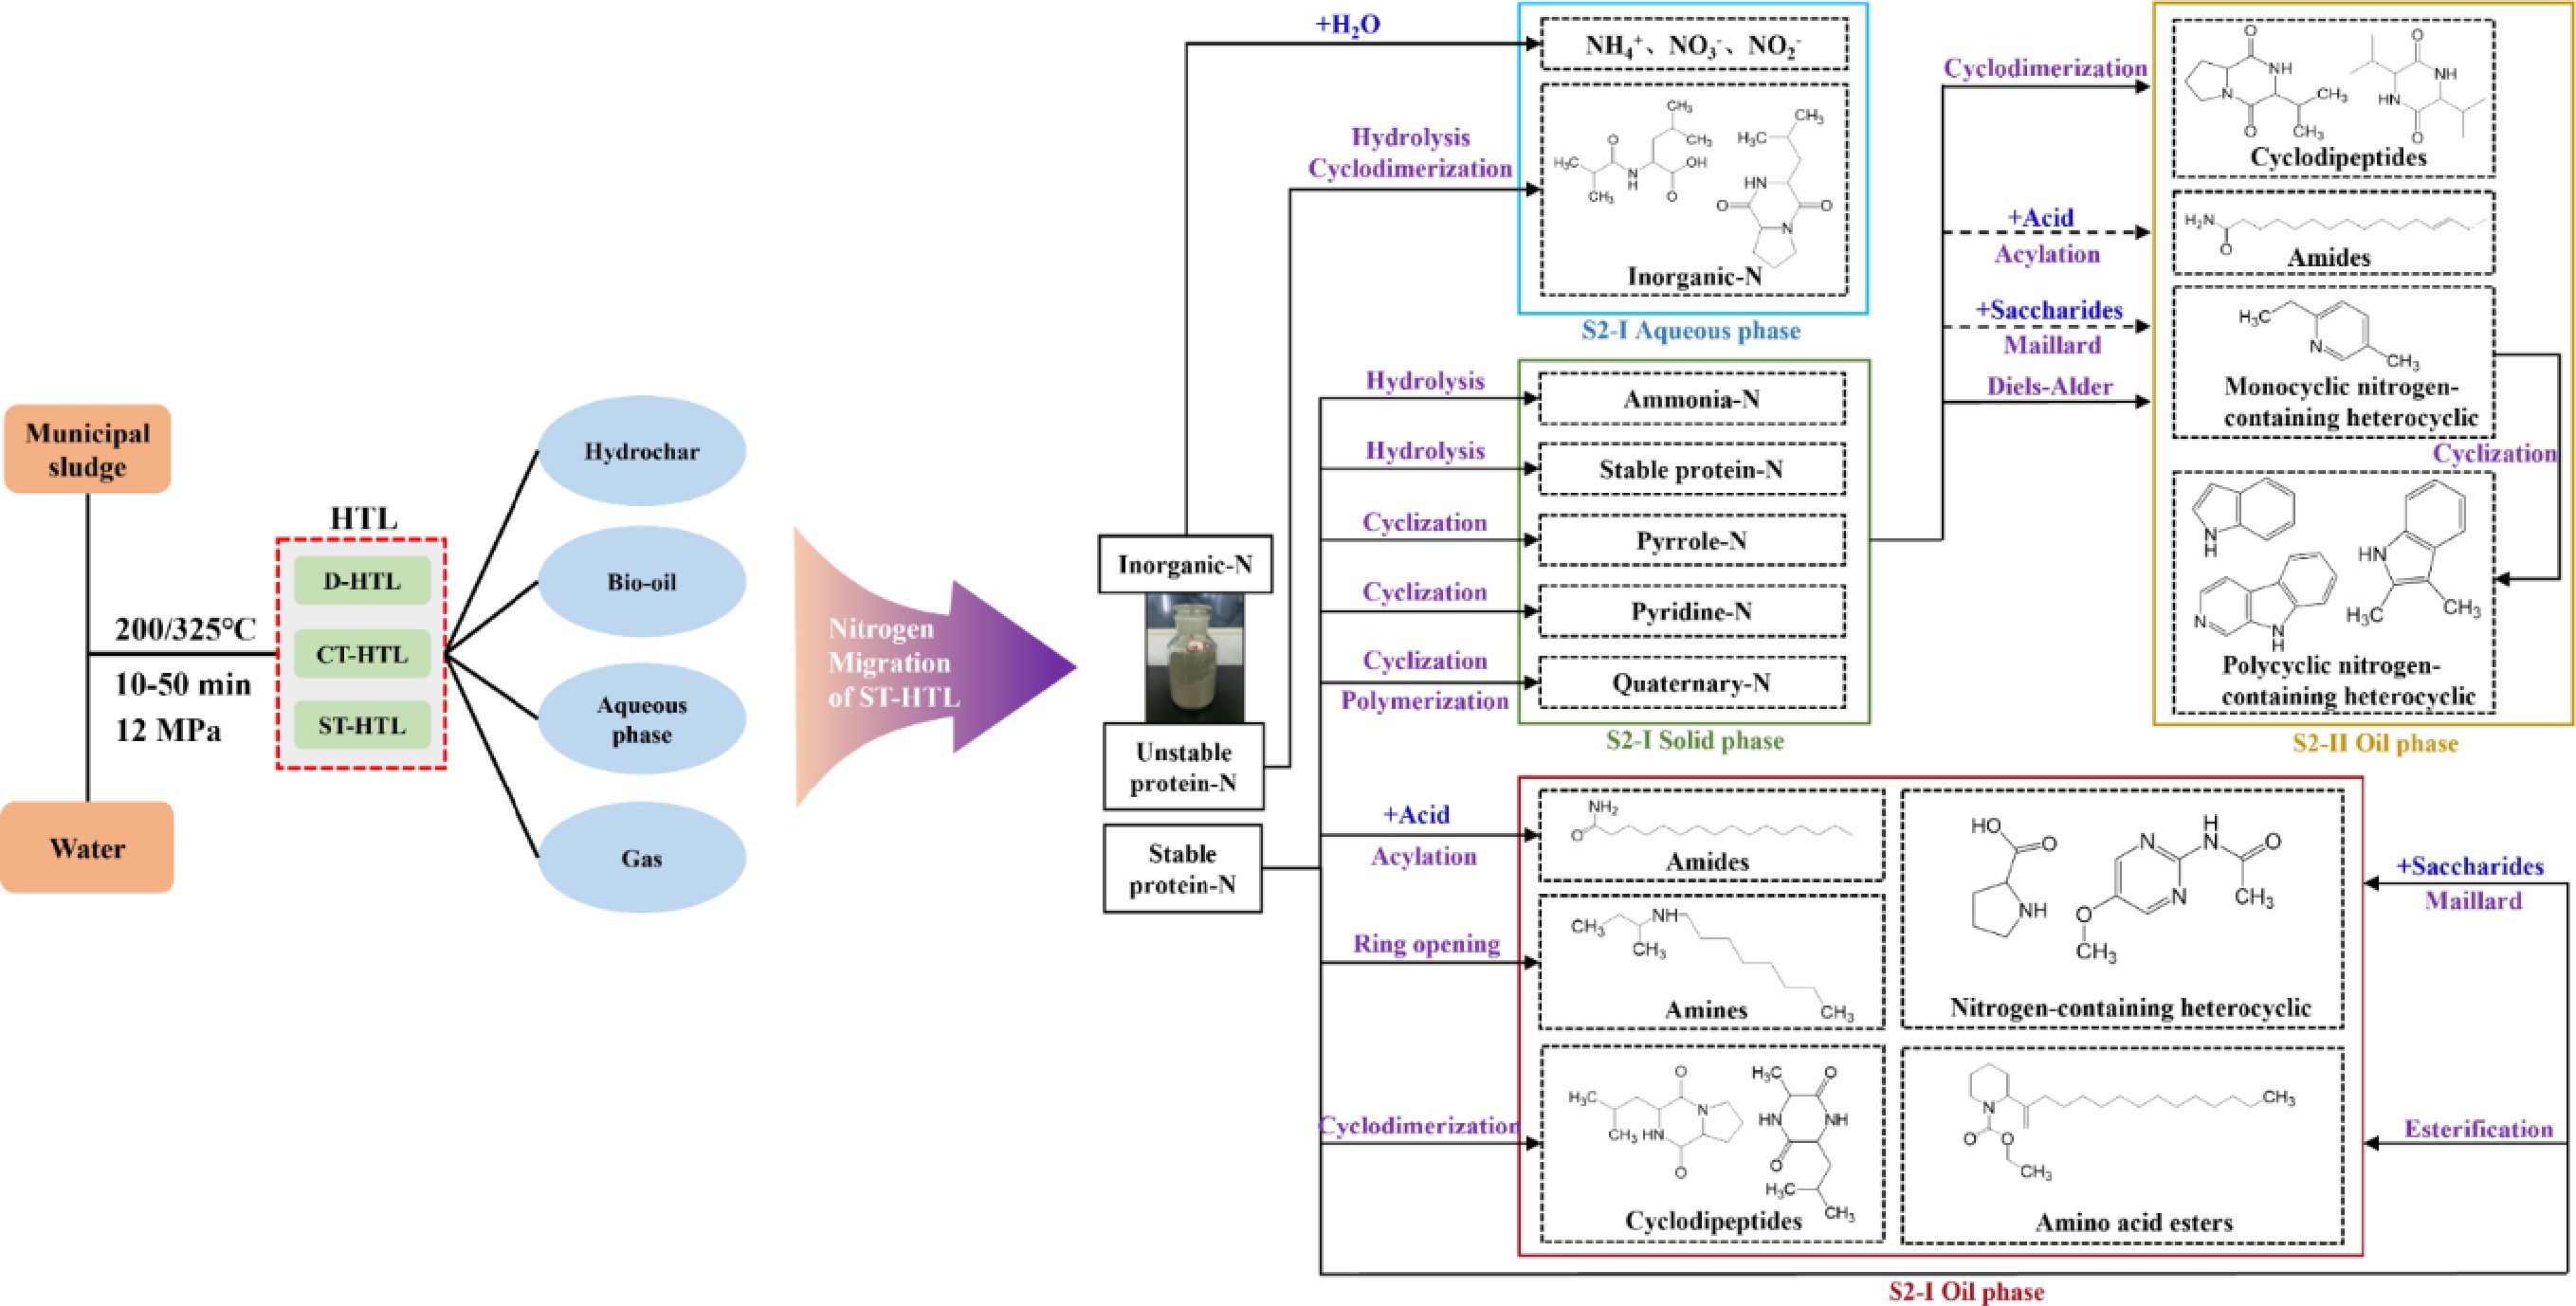
Based on the above results, the migration and evolution pathways of nitrogen during the two-stage HTL process were proposed. As shown in Fig. 9, nitrogen in MS mainly exists in the forms of amino-N (93.7%) and inorganic-N (6.3%) due to the existence of organic macromolecules connected by peptide bonds. Among them, ammonia-N consists of stable protein-N and unstable protein-N.
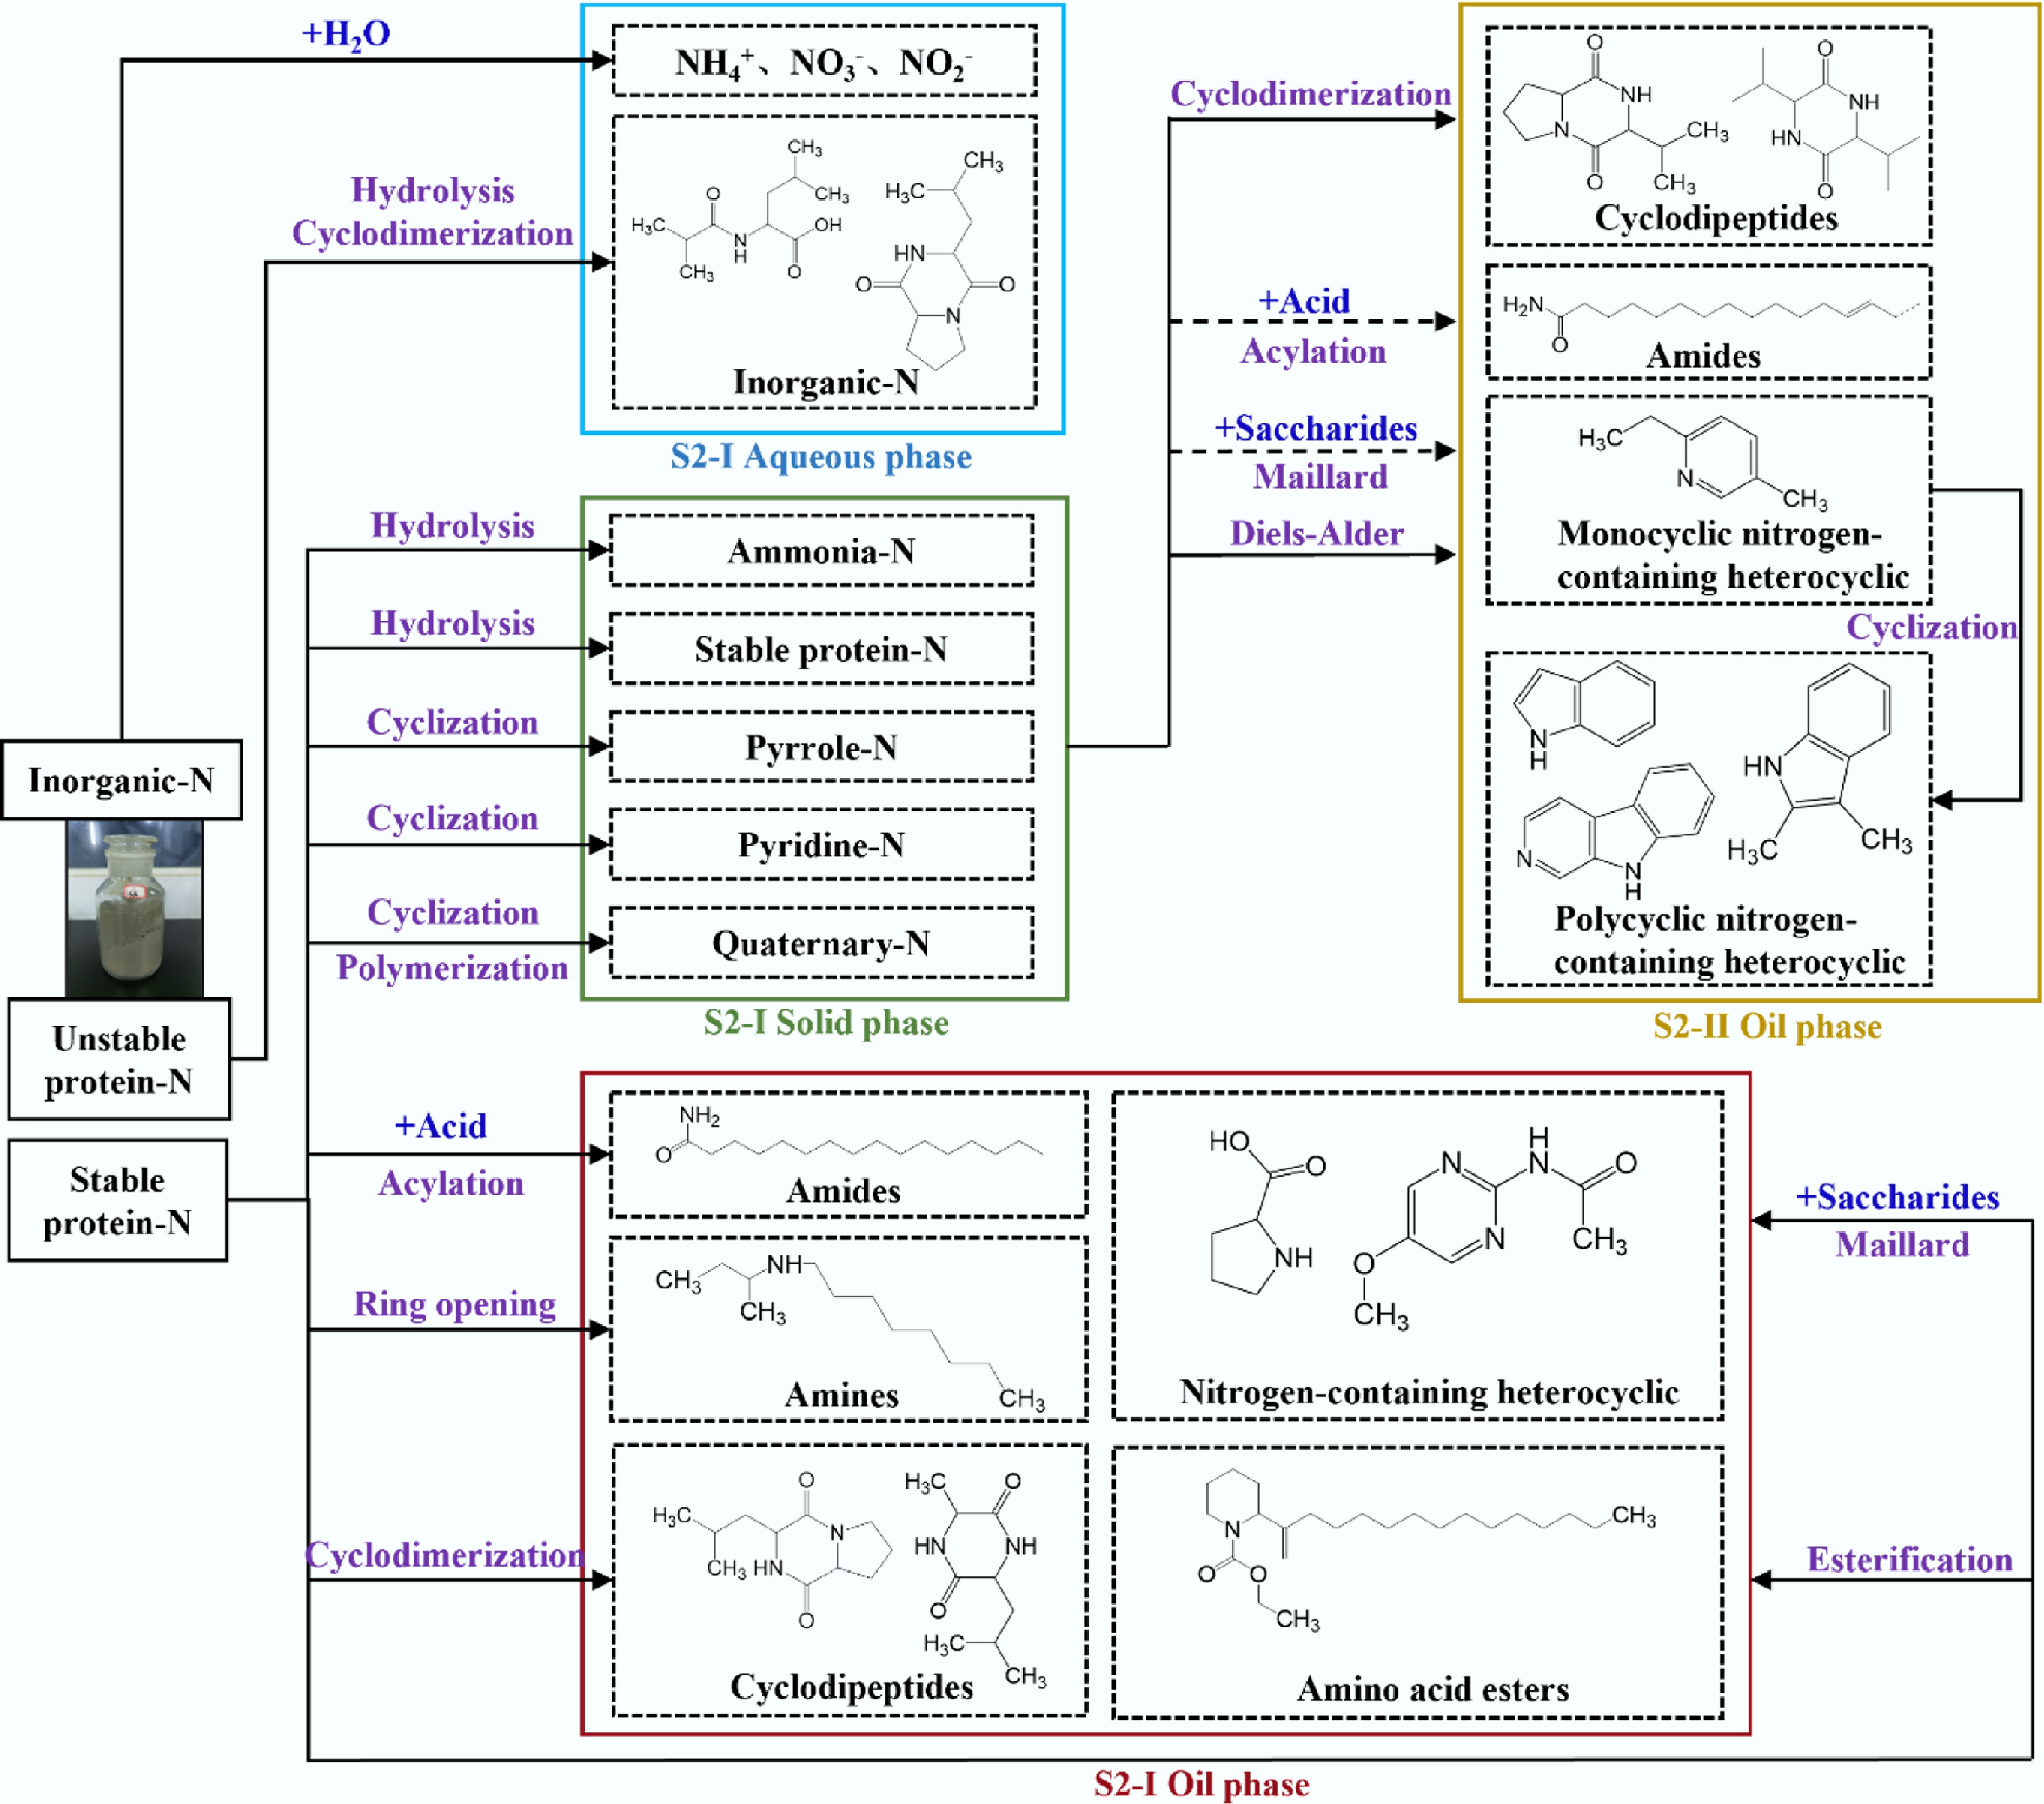
Figure 9.
Nitrogen migration and evolution pathways of ST-HTL (black arrows indicate the reaction pathway of the first stage, yellow arrows indicate the reaction pathway of the second stage, and dashed lines indicate the weakening of the reaction).
At low temperatures, inorganic-N is prone to decomposition to generate NH4+, NO3−, and NO2−. Among these, NO2− is easily oxidized to NO3−, which then migrates to the aqueous phase. In addition to nitrogen-containing ions, organic nitrogen in the aqueous phase originates from the hydrolysis of unstable protein-N and subsequent cyclodimerization reactions. Pyrrolic, quaternary, and a small amount of pyridine-N in the solid product are mainly derived from cyclization and polymerization of stable protein nitrogen. Nitrogen-containing compounds in the oil-phase products include cyclodipeptides, nitrogen-containing heterocycles, amides, and amines. Specifically, cyclodipeptides (e.g., pyrazinedione) are formed by the cyclodimerization of ammonia-N. Nitrogen-containing heterocyclic compounds (e.g., pyrrolidine, pyrrolidone, pyrimidine, pyrazine, imidazole) are produced via the Maillard reaction between ammonia-N and reducing saccharides. Amides are generated through the acylation reaction of NH3 (derived from the decomposition of ammonia-N) with fatty acids, and amines can be formed by the ring-opening reaction of stable fractions in ammonia-N.
After S2-I, 73.26% of the nitrogen in MS transferred to the aqueous phase, 27.38% transferred to the solid phase, and only 3.08% transferred to the oil phase. The solid product from S2-I is used as the feedstock for S2-II, and it degrades under higher temperatures. As a consequence, the proportions of ammonia-N, pyrrole-N, quaternary-N, and pyridine-N in the S2-I solid product are redistributed with the occurrence of deeper reactions.
As the temperature increases, cyclodipeptides are gradually decomposed to some small-molecule substances, which then dissolve into the aqueous phase. At higher temperatures (280–340 °C), the monocyclic nitrogen-containing heterocyclic compounds generated via Maillard reaction and Diels-Alder reaction undergo condensation to form polycyclic nitrogen-containing heterocyclic compounds such as indole and quinoline.
After S2-II, only 1.45% of the nitrogen migrated to the oil phase. The decline of nitrogen-containing compounds in the oil phase at this stage may be closely related to the weakening of the Maillard reaction and acylation reaction.
-
Three HTL processes (D-HTL, CT-HTL, and ST-HTL) were employed for HTL of MS. Two-stage HTL produced lower bio-oil yield than conventional hydrothermal liquefaction (D-HTL), but higher nitrogen removal. For two-stage HTL, the increase in reaction temperature and residence time improved the bio-oil yield. D2 exhibited the highest bio-oil yield at 17.37 wt.%, which was 229.18% higher than that of D1, slightly higher than C, and more than twice that of S1 and S2. The H/C ratio in the bio-oil derived from ST-HTL significantly increased, while the N/C ratio remarkably decreased. The N/C ratio in the bio-oil from S2-II was the lowest at 0.04, and the H/C ratio was 1.50, which helped to effectively elevate the combustion performance of bio-oil. Compared with D-HTL, both CT-HTL and ST-HTL could increase the content of desirable products such as hydrocarbons and alcohols. CT-HTL enhanced the cyclic polycondensation reaction of pyridine-N, thus leading to a high content of quaternary-N in the solid product. The first-stage treatment of ST-HTL promoted the migration of nitrogen to the aqueous phase. According to GC-MS analysis results, nitrogen-containing compounds accounted for up to 65.08% of the aqueous phase product from S1-I, which was the highest among all HTL processes. Low nitrogen content in the bio-oil obtained from ST-HTL may be related to the weakened Maillard reaction and acylation reaction.
-
It accompanies this paper at: https://doi.org/10.48130/een-0025-0017.
-
The authors confirm contribution to the paper as follows: Guanyu Jiang contributed to framework construction, information collection and manuscript writing. Mingxin Xu and Mingyi Guo helped to retrieve relevant literatures, integrate information and process data. Shiming Niu and Pan Wang helped to draw pictures and proofread manuscript. Zhiyong Duan, Chenming Li, Krzysztof Kapusta, and Pavel Aleksandrovich Strizhak gave many useful advices about experiment development and manuscript writing. Donghai Xu contributed to framework construction, information collection and manuscript writing. All authors reviewed the results and approved the final version of the manuscript.
-
The datasets generated during and/or analyzed during the current study are available from the corresponding author on reasonable request.
-
This work was supported by the Projects from National Natural Science Foundation of China (Grant No. 52576227), the Fundamental Research Funds for the Central Universities (Grant No. ND6J018), and the National Key Research and Development Program of China (Grant No. 2021YFE0104900).
-
There are no known competing financial interests or personal relationships that influence this work publication.
-
Two-stage hydrothermal liquefaction (T-HTL) produced lower bio-oil yield but achieved higher nitrogen removal than conventional hydrothermal liquefaction (D-HTL).
Two-stage hydrothermal liquefaction (T-HTL) could increase the content of hydrocarbons and alcohols in bio-oil.
Consecutive two-stage hydrothermal liquefaction (CT-HTL) converted nitrogen into solid products via cyclic polycondensation reaction.
Nitrogen migration into aqueous phases of separated two-stage hydrothermal liquefaction (ST-HTL) mainly occurred in the first-stage.
Low nitrogen content of the separated two-stage hydrothermal liquefaction (ST-HTL) bio-oil is attributed to the weakening of Maillard reaction and acylation reaction.
-
Full list of author information is available at the end of the article.
- The supplementary files can be downloaded from here.
- Copyright: © 2026 by the author(s). Published by Maximum Academic Press, Fayetteville, GA. This article is an open access article distributed under Creative Commons Attribution License (CC BY 4.0), visit https://creativecommons.org/licenses/by/4.0/.
-
About this article
Cite this article
Jiang G, Xu M, Guo M, Niu S, Wang P, et al. 2026. Product characteristics and nitrogen evolution pathways of two-stage hydrothermal liquefaction of municipal sludge. Energy & Environment Nexus 2: e004 doi: 10.48130/een-0025-0017 

Product characteristics and nitrogen evolution pathways of two-stage hydrothermal liquefaction of municipal sludge
- Received: 11 November 2025
- Revised: 02 December 2025
- Accepted: 15 December 2025
- Published online: 16 January 2026
Abstract: Hydrothermal liquefaction (HTL) is an effective method for converting municipal sludge (MS) into biocrude oil. However, the high nitrogen (N) content in the bio-oil produced by conventional HTL (namely, direct HTL [D-HTL]) is a big drawback that limits its application as a biofuel. Two-stage hydrothermal liquefaction (T-HTL) shows promise for efficient nitrogen removal. In this study, the product distribution and properties of MS treated by D-HTL, consecutive T-HTL (CT-HTL), and separated T-HTL (ST-HTL) under different temperatures and reaction durations were investigated. The advantages and disadvantages of ST-HTL were examined, with a focus on the distribution and migration of nitrogen. Furthermore, the migration and transformation pathways of nitrogen during ST-HTL were revealed. The results showed that although ST-HTL produced the lowest bio-oil yield, it significantly reduced the nitrogen and sulfur contents in the oil. Especially for the second stage, the nitrogen content decreased by up to 37%. Moreover, ST-HTL improved the total content of desirable products such as hydrocarbons, alcohols, and esters, while reducing the proportion of N-containing compounds. After the first stage of ST-HTL, the aqueous phase contained the highest proportion of nitrogen-containing compounds (65.08%) and the highest total nitrogen (TN) concentration (2,850 mg/L), indicating that most nitrogen-containing substances were transferred to the aqueous phase.
-
Key words:
- Municipal sludge /
- Two-stage hydrothermal liquefaction /
- Bio-oil /
- Nitrogen migration