


-
In recent years, transitioning from conventional energy generation to cleaner ones has gained global interest due to the negative impacts of climate change. Mitigating climate change can be partially achieved by reducing the carbon emissions associated with electricity generation through the adoption of renewable energy generation (REG). Thus, the hybrid residential microgrid (HRM) with distributed energy resources (DERs) represents a key aspect of renewable energy generation designed to meet energy requirements in residential and commercial buildings. However, it faces challenges related to stability and reliability due to the intermittent nature of these renewable energy resources and fluctuating load demands. Therefore, to ensure a reliable and economical energy supply within a hybrid residential microgrid, an efficient energy management strategy and optimal configuration of the DERs are required[1], which must meet specific optimal criteria. Various studies have been conducted on modeling, optimization, implementation, and design of hybrid microgrids using different optimization techniques. For instance, DIgSILENT PowerFactory was utilized[2] to assess a grid-connected suburban microgrid integrating battery storage, and Electric Vehicle (EV) loads during planned grid outages. That research highlighted the importance of detailed power system modeling, coordinated dispatch, and storage utilization for reliability enhancement during grid interruptions, although optimization techniques were not deeply explored. To demonstrate the impact of economic indicators like Net Present Cost (NPC), and levelized costs of energy under regional tariff structures, a techno-economic feasibility study of a grid-connected hybrid system was conducted[3]. The study demonstrated the economic viability of hybrid configurations when appropriate sizing and tariff structures are applied, although it ignored economically comprehensive, multi-source hybrid systems and advanced dispatch strategies. To address advanced optimization and energy coordination in hybrid power systems, a novel Twin Fang algorithm for hybrid power systems was proposed[4]. The results showed improved convergence and cost minimization compared to conventional metaheuristics. An intelligent control and PQ droop strategy for a nuclear-PV-biogas hybrid microgrid with EV charging was proposed[5], emphasizing voltage regulation and stability, and demonstrating improved voltage regulation and dynamic response. Constant voltage and reactive power control strategies for renewable-integrated EV charging were evaluated[6]. The study highlighted the critical role of reactive power management in maintaining grid stability and operational robustness. An optimal configuration of DERs in a microgrid using distributed low-carbon energy technology was conducted with the objective of minimizing total cost and emissions[7], using losses and voltage profiles as local distribution network constraints. However, the reliability of the microgrid was not investigated. To discover a minimal fuzzy rule, set in fuzzy logic controller (FLC) capable of performing decision-making in microgrids, De Santis et al.[8] employed a hierarchical genetic algorithm (HGA) to tune the rule base of a fuzzy inference system (FIS). To investigate the use of a reinforced learning (RL) approach for online scheduling of a residential microgrid (RM), that does not require a forecast model to predict the future PV/wind and load power sequence in residential microgrids, Shuai & He[9] used online scheduling of a residential microgrid via Monte Carlo tree search and a learned model. A multi-objective optimization approach to address economic dispatch in microgrids, balancing cost and reliability, was employed[10], but further study is required to integrate renewable energy variability and storage considerations into the optimization framework. A distributed convex optimization framework for energy trading among multiple islanded microgrids[11] using a sub-gradient-based cost minimization algorithm was proposed; the algorithm achieved efficient energy exchange between microgrids, enhancing overall system reliability and cost-effectiveness, but requires further investigation into its scalability and performance in larger, more complex microgrid networks. Insights into the trade-offs between operational costs and emissions were provided[12], which aid in the development of balanced energy management strategies for microgrids with renewable energy resources and demand responses. Tooryan et al.[13] employed the Particle Swarm Optimization algorithm (PSO) to reduce the operational cost of a hybrid residential microgrid with DERs, although further research is needed to validate the approach under varying load conditions and to explore the integration of real-time data for dynamic optimization. In a study by Kamarposhti et al.[14], Artificial Bee Colony (ABC) methodology was adopted to minimize costs and environmental pollution in microgrids by providing the microgrid with optimal power production from distributed generation; however, a comparison of the ABC algorithm performance against other algorithms in dynamic, large-scale microgrid environments is needed to demonstrate its effectiveness. Another study[15] developed a hybrid analysis-heuristic solution method called Jaya-IPM to solve the minimization of user cost and microgrid operational cost under a real-time electricity pricing environment for isolated microgrids with considerations of multi-stakeholders, using a bi-level scheduling model. Askarzadeh et al.[16] employed a hybrid Grey Wolf and Cuckoo search optimization algorithm to determine the optimal sizing of a grid-connected microgrid comprising Wind, Solar PV, Biomass, and Battery Energy Storage, although further validation in diverse geographical and climate conditions is necessary to generalize the algorithm application. Vaish et al.[17] employed a Random Forest model (RF) to address the complex challenges of optimizing DER-based microgrids while considering multiple objectives, but the integration of real-time data and comparison with traditional optimization algorithms could provide deeper insights. In a study by Saravanakumar et al.[18] a multi-objective optimization strategy integrating a demand response program into a Mixed-Integer Linear Programming (MILP) model for managing a microgrid with hybrid energy sources was developed. Kaabeche et al.[19] employed electrochemical storage devices to establish rules and tools for energy management optimization, and the sizing of an autonomous Wind and Solar production system, with results demonstrating the supremacy of the proposed algorithm over the others. Ant colony optimization with PSO was employed in the study by Kasi et al.[20] to enhance power efficiency and perform sensitivity analysis on economic and technological parameters for the sizing and optimization of hybrid renewable energy sources for micro distributed generation system; however, the computational complexity of the hybrid algorithm warrants further research into simplifying the approach for practical applications. An integrated energy management system (EMS) that simultaneously manages electrical and thermal supply/demand sides was implemented in a study by Emrani-Rahaghi et al.[21] with the aim to mitigate voltage limit violations, providing a novel approach to voltage control in microgrids, which enhances cost reduction and satisfaction of voltage constraints; however, further study is required to assess the scalability of the proposed EMS in larger and more complex microgrid networks. PSO was utilized in order to minimize the total NPC of a grid-connected hybrid PV and BESS for commercial buildings in Malaysia[22] with the aim of providing a cost-effective sizing strategy for hybrid PV-BES systems, demonstrating PSO's applicability in commercial energy planning, although further research is required to incorporate uncertainties in renewable energy generation and load demand into the optimization process. To effectively plan and allocate load for consumption so that the user defined priority is conserved, Ogunjuyigbe et al.[23] proposed a mixed integer linear programming (MILP) model that takes into consideration the user's financial status, and the results showed the effectiveness of the model in allocating loads using the available solar resource, while maintaining user priority. Ogunjuyigbe et al.[24] proposed a modified mild intrusive genetic algorithm (MMIGA); the load management algorithm was capable of optimizing load allocation in real time during both sufficient and insufficient energy supply, with outcomes showing the proposed algorithm to be smart, cost-effective, simple, and applicable to different load profiles. A novel hybrid imperialist competitive algorithm for cost-effective energy management in multi-source residential microgrids was conducted by Charadi et al.[25], where authors compared ICA-PSO against standalone ICA, PSO, and GA using 24-h load forecasting and tariff/weather data to optimize cost and renewable participation, assuming a perfect forecast without considering real-time variability and uncertainties.
The literature reveals recent advances in microgrid optimization, focusing primarily on the application of different kinds of optimization techniques to optimize microgrid economics, providing insights into trade-offs between meta-heuristic algorithms, and the others, or between meta-heuristic algorithms and traditional optimization techniques, detailed power systems and control analysis, or techno-economic feasibility under specific configurations. However, these studies rarely compare commercial optimization platforms (like HOMER) with meta-heuristic optimization techniques under unified hybrid microgrid frameworks that incorporate renewable generation, battery storage, and conventional backup generation. Thus, motivated by the above gap, this study aims to contribute to existing works by establishing an effective energy management strategy for managing energy generation and distribution within a hybrid residential microgrid, and by providing valuable trade-offs between the PSO-based optimization model (a custom optimization model) and HOMER (a commercial simulation tool).
-
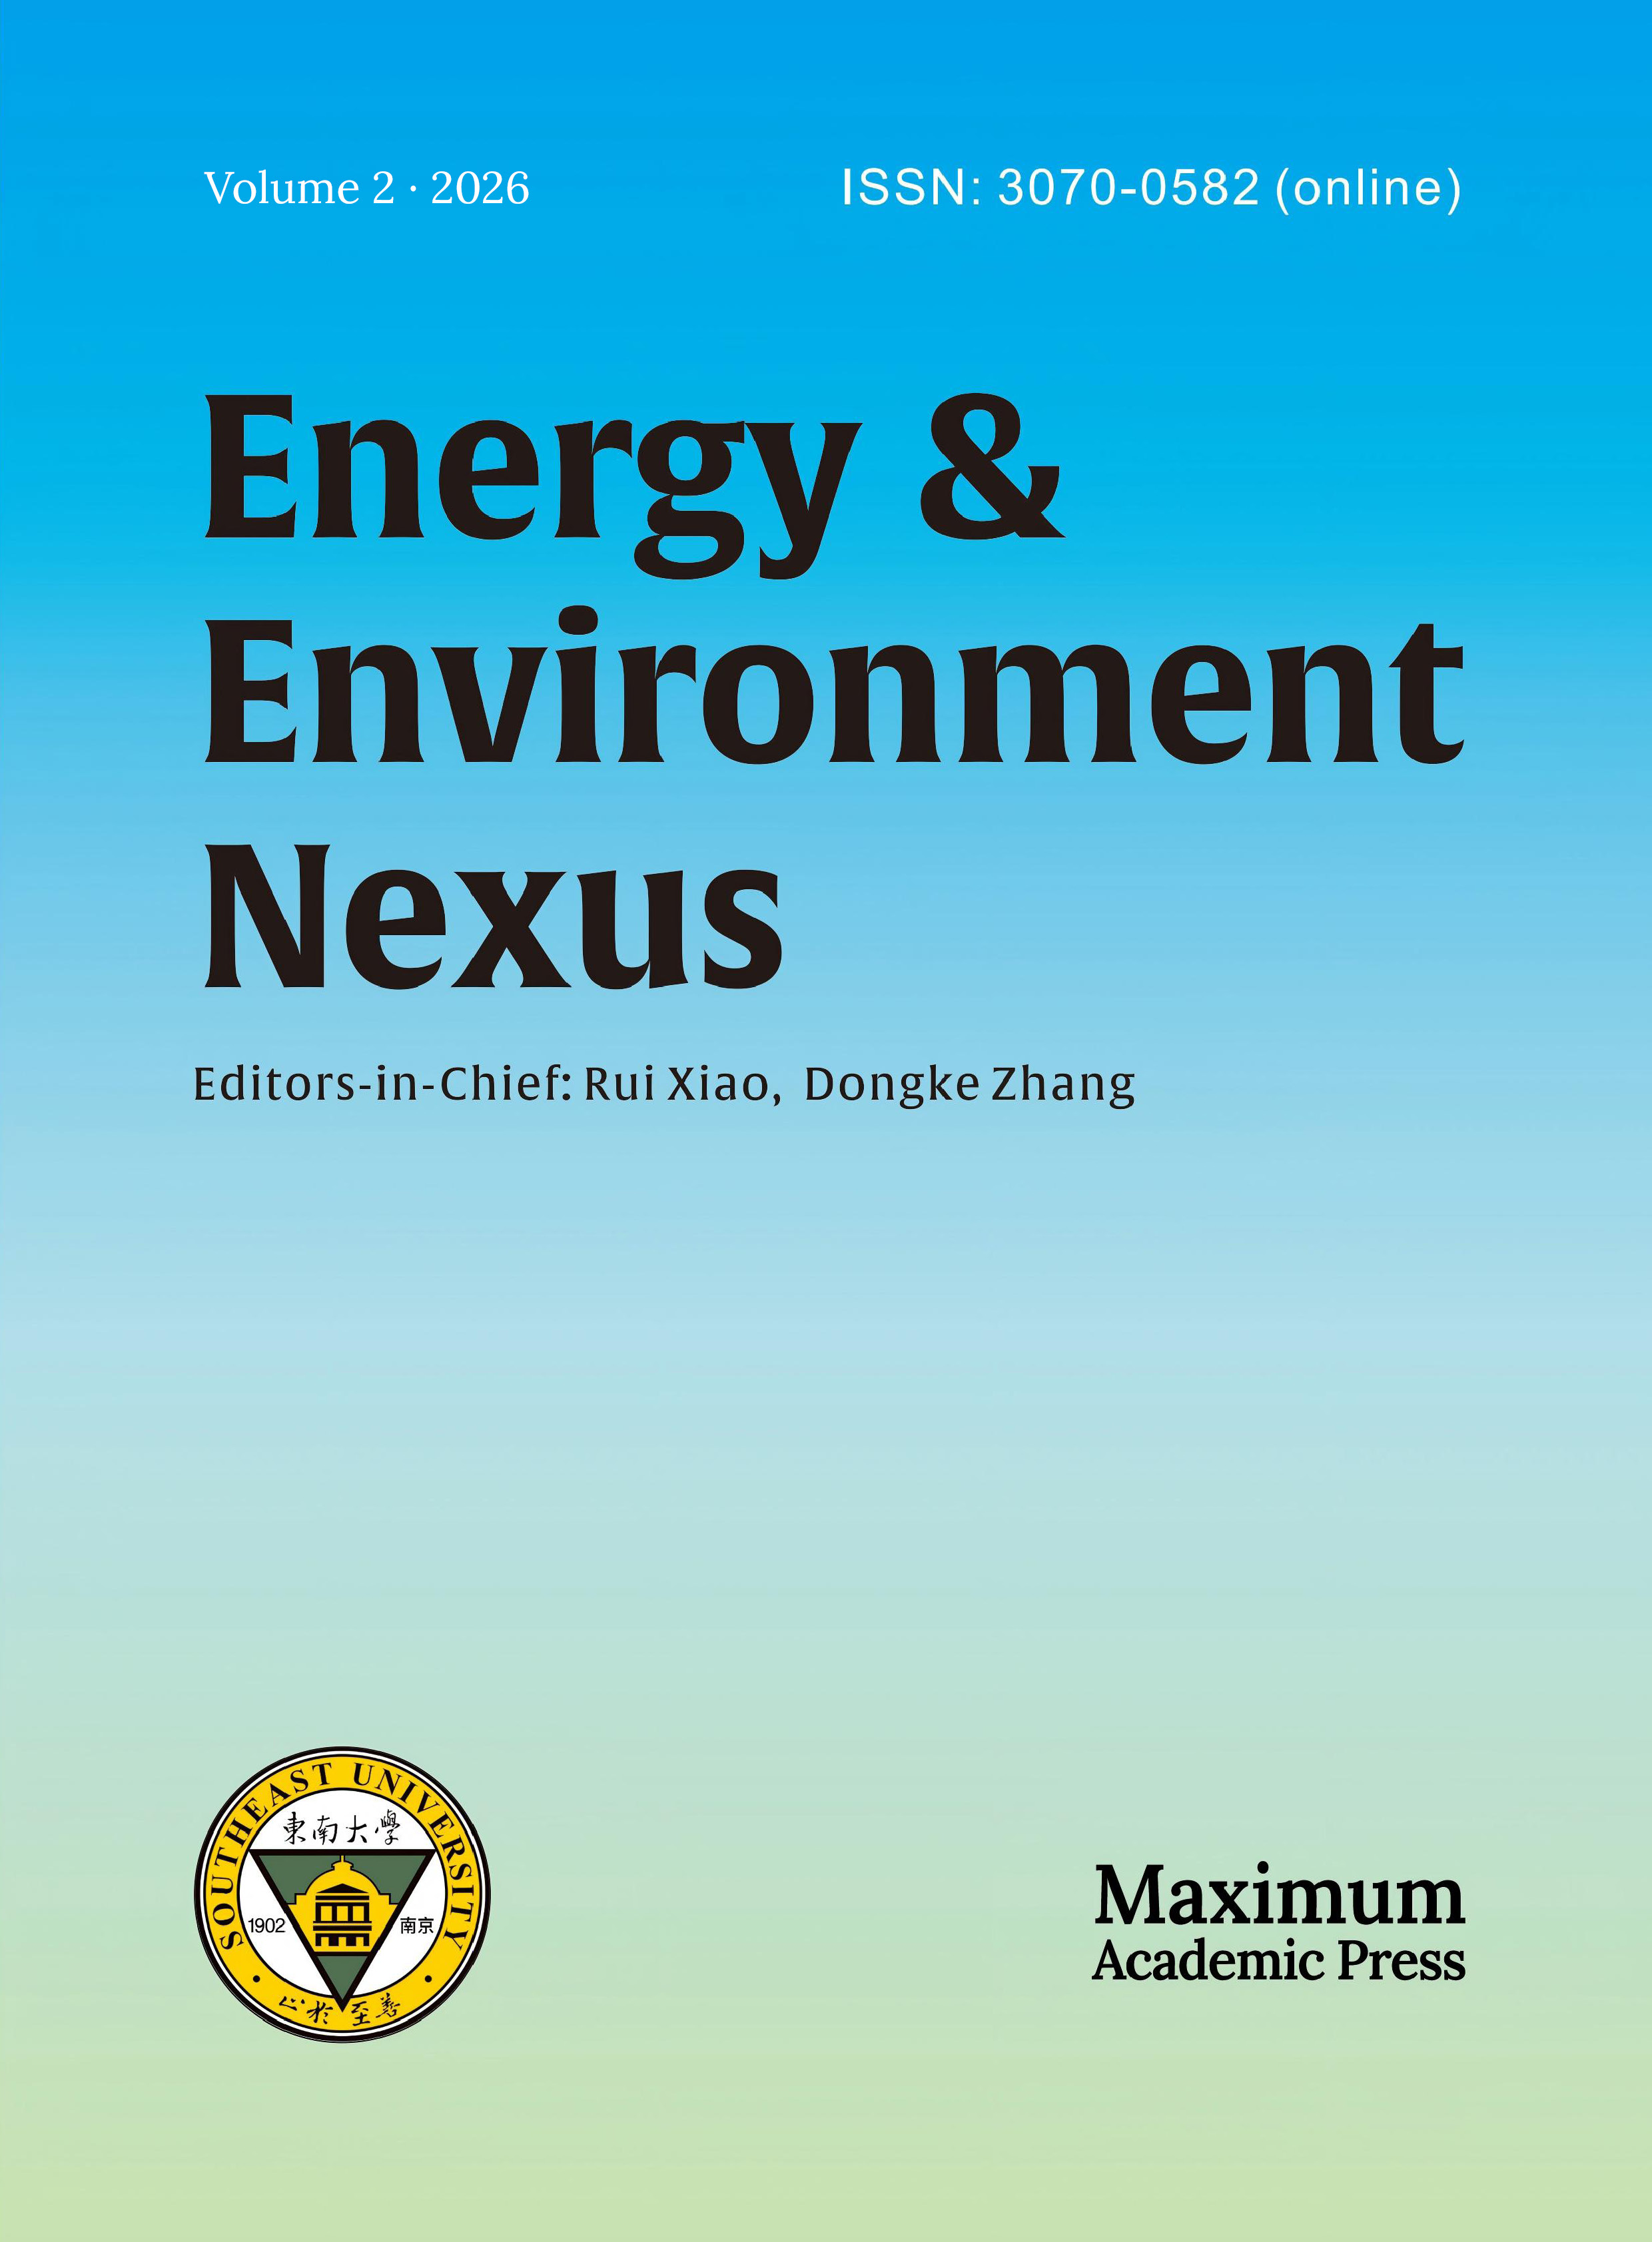
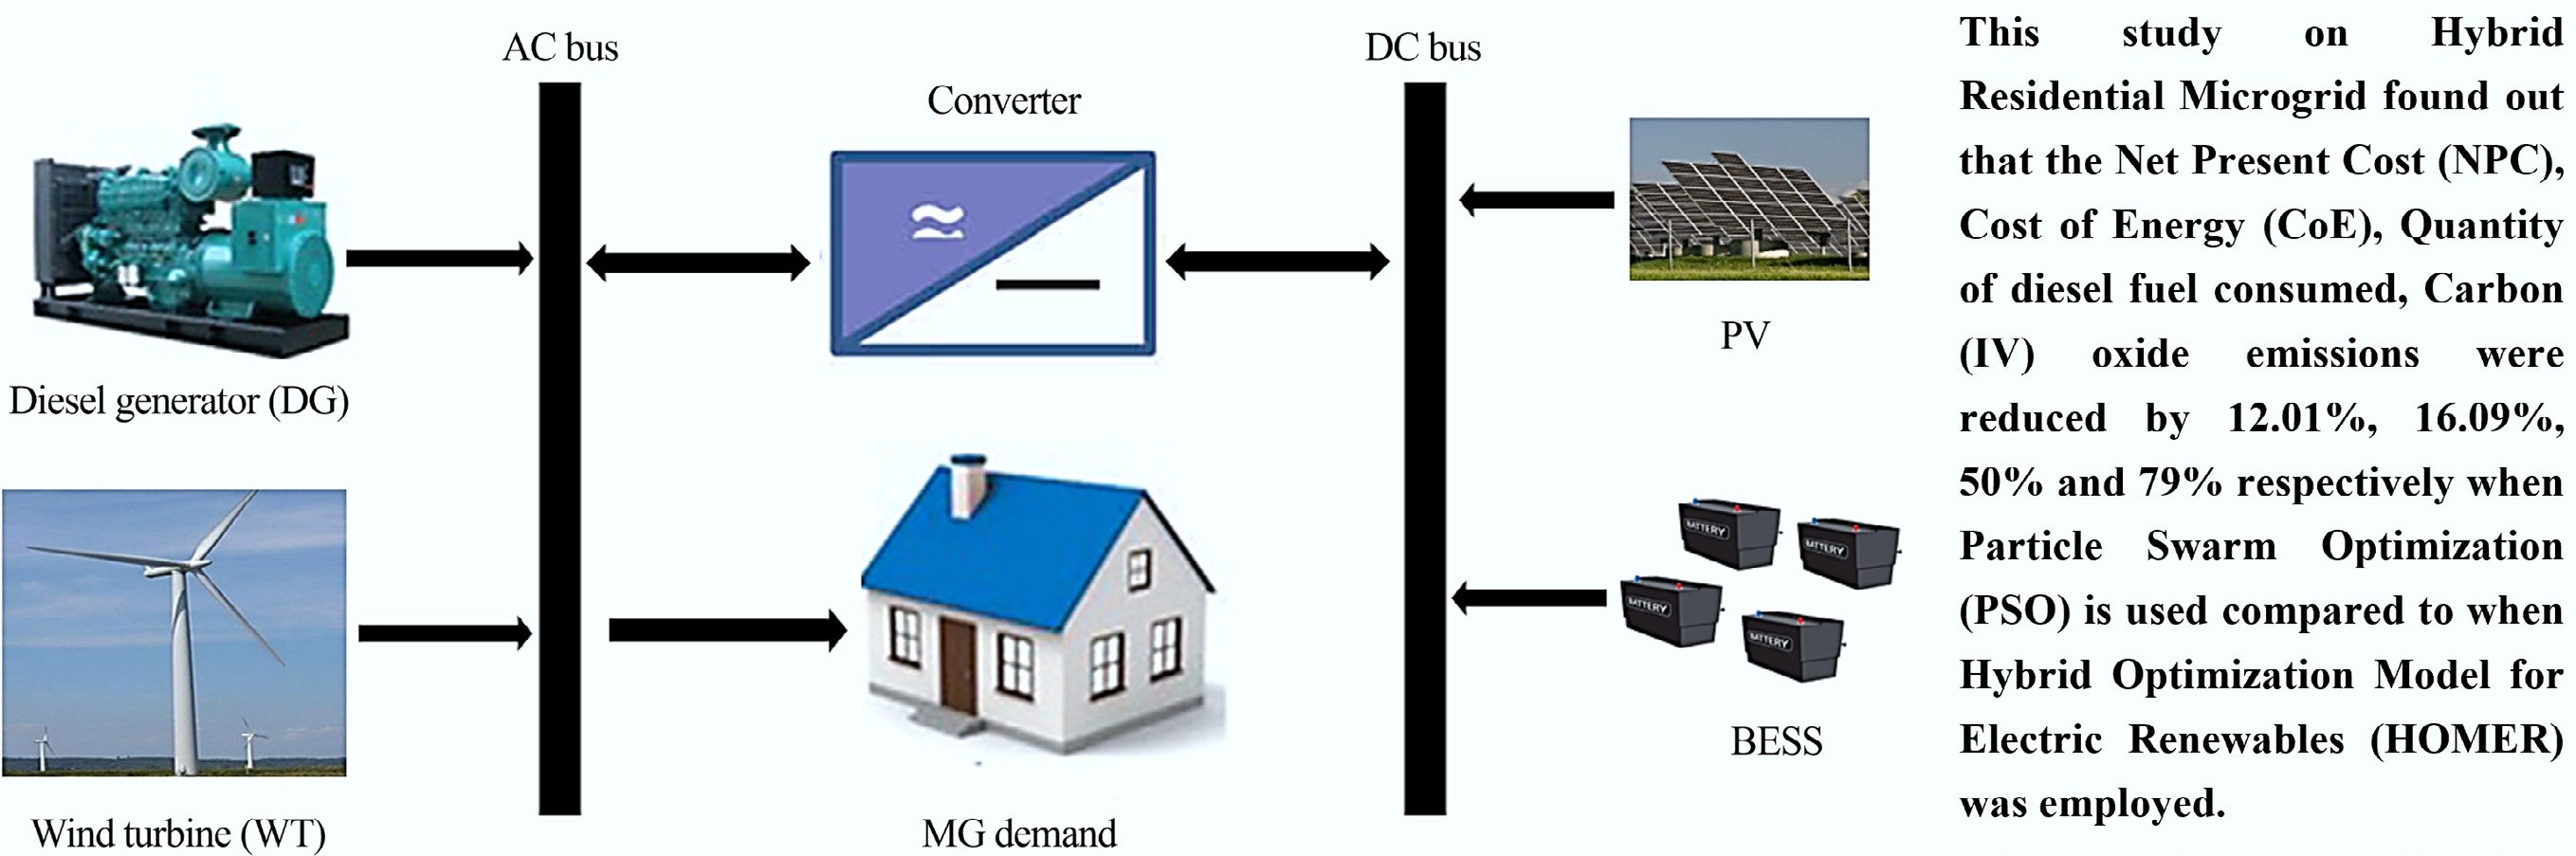
This section deals with the mathematical representation of each component constituting the hybrid system. The schematic diagram of the hybrid residential microgrid (MG) under consideration is shown in Fig. 1.
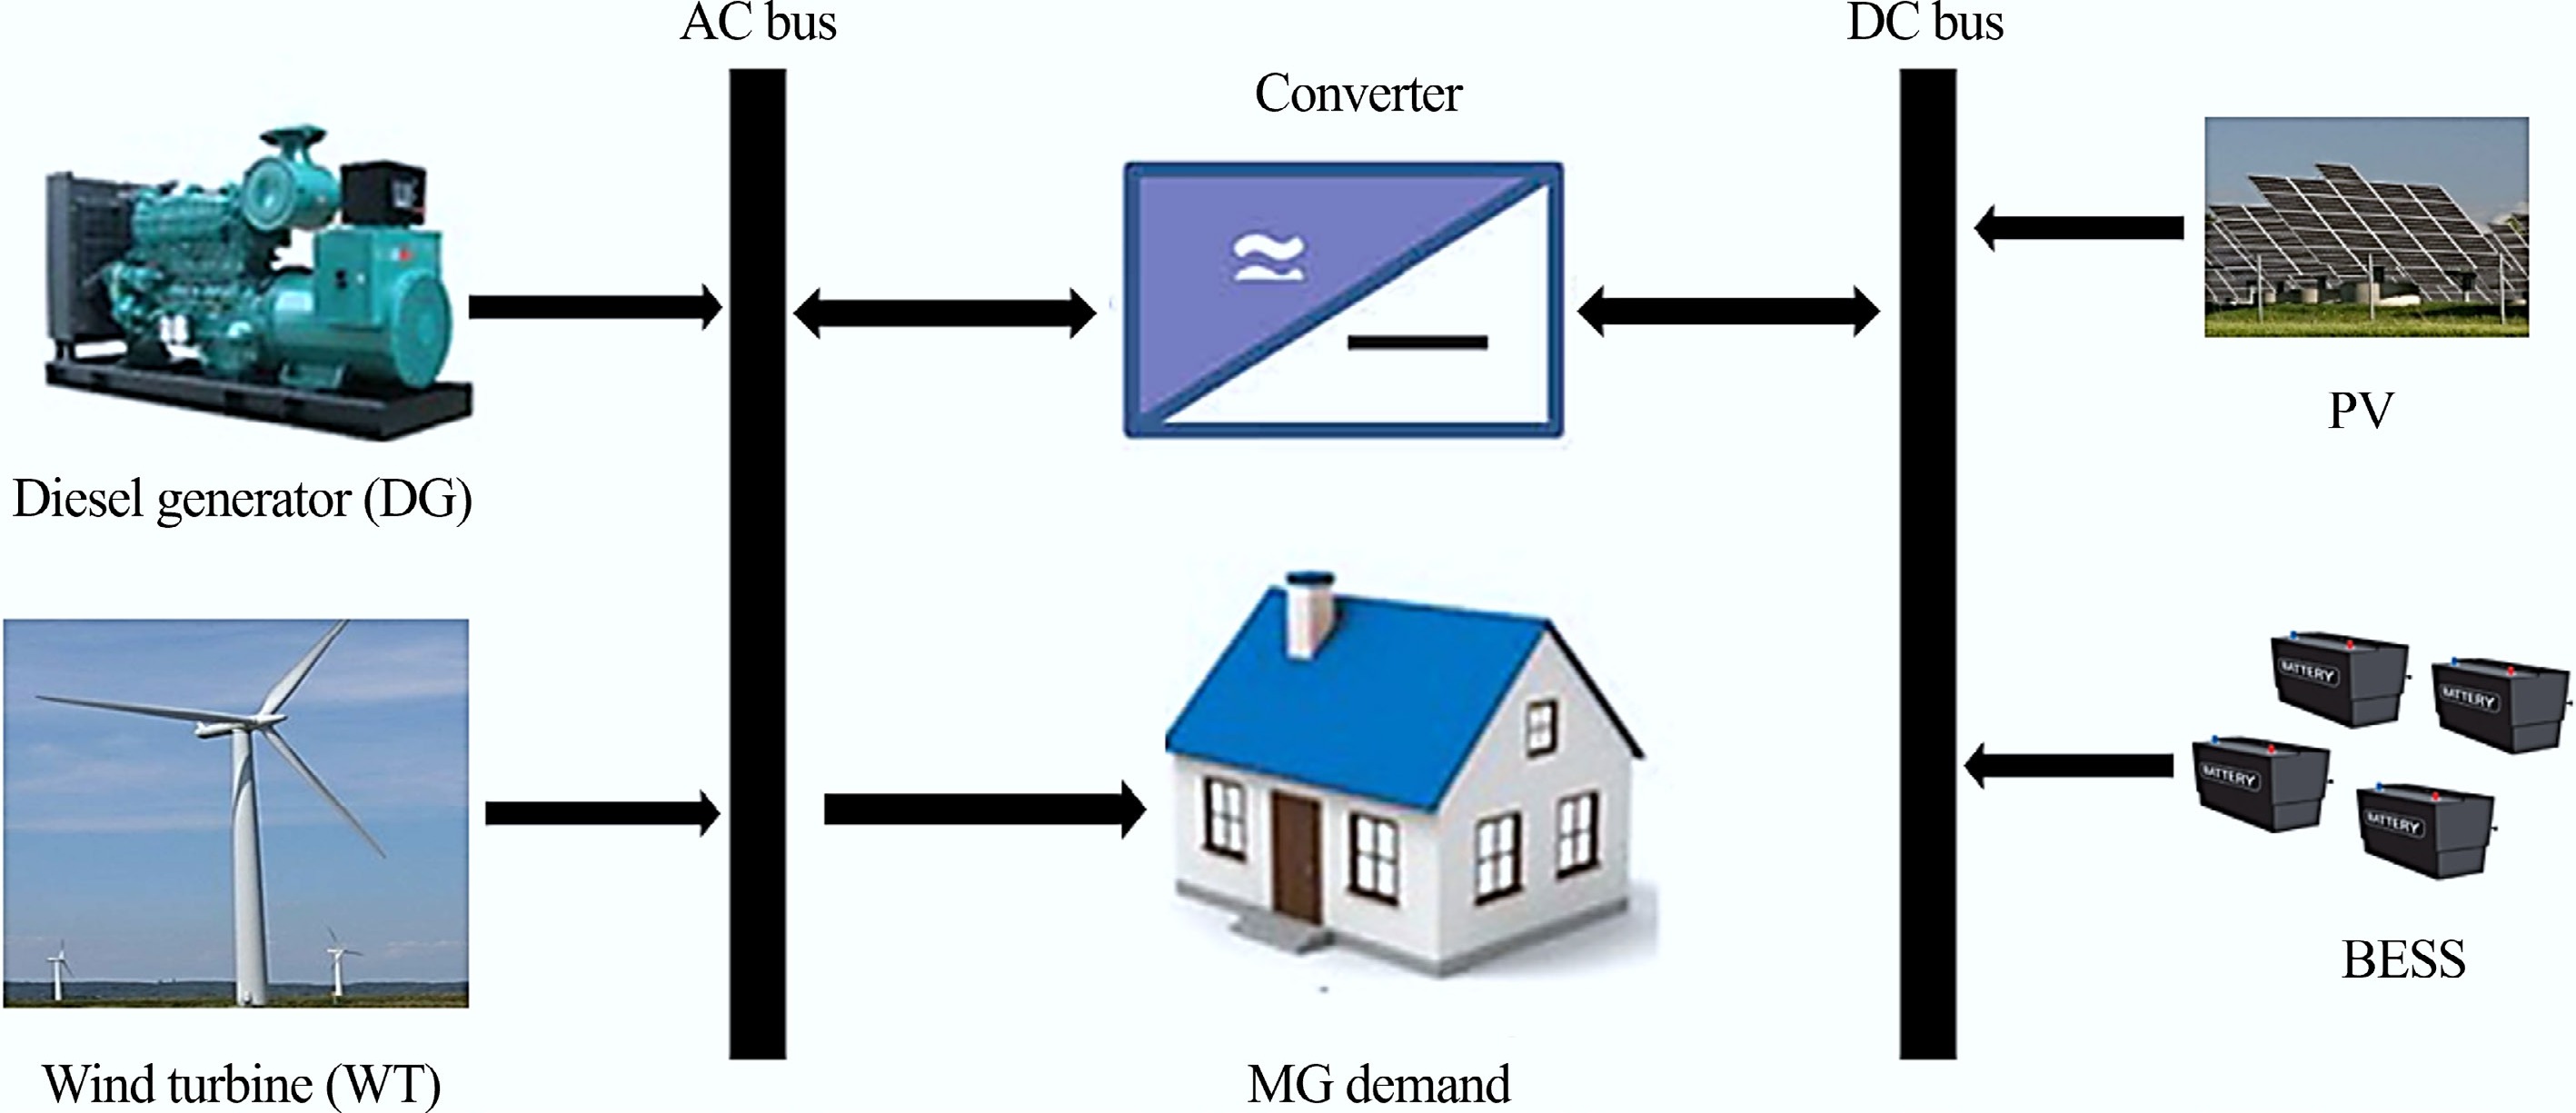
Figure 1.
Hybrid residential microgrid under consideration.
The wind turbine (WT)
-
The wind turbine operates by converting the kinetic energy of the air into mechanical energy, which is further converted into electrical energy. The power output of the wind turbine is AC[26], and it can be computed using the power curve equation as given in Eq. (1):
$ {P}_{wind\left(t\right)}=\left\{\begin{array}{ll} 0 & V \lt {V}_{ci},V \gt {V}_{co}\\ {P}_{WG}{\left(\dfrac{V-{V}_{Ci}}{{V}_{rated}-{V}_{Ci}}\right)}^{3},&{V}_{ci}\leqslant V \lt {V}_{rated}\\ {P}_{rated},&{V}_{rated}\leqslant V\leqslant {V}_{co} \end{array}\right. $ (1) The WT has four operating regions as depicted in Eq. (1): the region where the wind speed is less than the cut-in wind speed; the region where the wind speed is greater than the cut-in wind speed, but less than the WT's rated speed; the region where the wind speed is greater than the WT's rated speed, but less than the cut-out wind speed, and the region where the wind speed is greater than the WT's cut-out speed.
The photovoltaic (PV) array
-
The PV is renewable and highly intermittent in nature. The output power of the PV array is dependent on the solar irradiance, the surface area of the solar PV exposed to solar irradiation, and the PV tilt angle. This can be computed using Eq. (2)[13].
$ P_{pv}=\eta_{_{PV}}\times\mathrm{N}\times P_{mpv}\times\dfrac{G_t}{G_{STC}} $ (2) Here, Ppv, ηPV, N, Pmpv, Gt, and GSTC represent the power output of the PV arrays (W), the PV modules' efficiency, the rated power of each PV array (W), the optimal size of the PV unit, the global solar irradiance, and the standard incident radiation (1,000 W/m2), respectively.
The diesel generator (DG)
-
The diesel generator serves as a backup to complement the power generated by the renewable energy resources (WT and PV arrays). The DG is usually modelled using its fuel consumption pattern as given in Eq. (3).[13]
$ {F}_{C(t)}={\alpha }_{0}\times {P}_{t}+{\alpha }_{1}\times {P}_{r} $ (3) where, FC(t), Pt, and Pr are the fuel consumed by the DG at any point in time, the power generated, and the rated power of the DG, respectively, while α0 and α1 represent the coefficients of fuel consumption curve. The ratio of electrical energy output to the input fuel is referred to as the generator's efficiency and is given in Eq. (4)
$ {\eta}_{DG}=\dfrac{3.6{P}_{t}}{{m}_{fuel}\times {\text{LHV}}_{fuel}} $ (4) where, ηDG is the DG efficiency, mfuel is the fuel's mass flow rate (kg/hr), LHVfuel is the fuel's Lower Heating Value, which is a measure of energy content (MJ/kg), and 3.6 is a factor determined by 1 kWh = 3.6 MJ[26].
Battery energy storage system (BESS)
-
The surplus energy generated during the renewable energy resources (RER) peak hours is stored in the BESS, and then dispatched when energy generated by these RERs is insufficient to satisfy the MG demand. The energy stored in the BESS at any point in time can be obtained using Eq. (5)[16]:
$ {E}_{bat\left(t\right)}={E}_{bat\left(t-1\right)}+\left[{E}_{RES(t)}-\dfrac{{E}_{L(t)}}{{\eta}_{converter}}\right]\times {\eta}_{charge} $ (5) where, Ebat(t) and Ebat(t−1) denote the stored energy in the battery at time t and time (t – 1), ERES(t) denotes the total energy generated by the RER at time t, EL(t) represents the energy demand of the MG at time t, ηconverter denotes the converter efficiency, and ηcharge denotes the battery efficiency during the battery charging and discharging process.
-
In engineering, the design process is composed of analysis and optimization. The optimization aspect of the engineering design process is a systematic process where the designer applies design constraints and criteria in order to locate the optimal solution for the design. In the engineering design approach, both analysis and optimization are employed before any prototype work is started[27].
The proposed system considers a hybrid residential MG with DERs comprising Solar PV arrays, DG's, WT's, and BESS. The PSO algorithm is applied to optimize the energy management and energy distribution within the hybrid residential microgrid, with the primary objective to minimize the total NPC of the system while reducing environmental emissions without compromising the reliability of power supply to the microgrid demand.
The approach for this research study is as follows:
(1) System modeling
The hybrid residential microgrid is modeled considering four DERs: WT, Solar PV arrays, DG, and BESS. Each DER unit is modeled using standard mathematical formulations and constraints, relating their output power to their input variables.
(2) Load and resource data syntheses
The hourly load profile of a typical residential microgrid and environmental data, such as solar irradiance and wind speed, were generated using standard stochastic models (such as normal probability density function, the Weibull distribution, and the normal distribution function), to produce statistically representative but non-site-specific operating conditions which depict the characteristics of these resources. The generated profiles preserve realistic temporal variability while avoiding dependence on a particular geographical location. As such, the results are intended to demonstrate methodological performance and comparative trends rather than precise location-specific outcomes.
(3) Formulation of objective function
A multi-objective function seeking to minimize both the total NPC and the environmental emissions is formulated. The NPC includes capital cost, operational and maintenance cost (O&M), replacement cost, and the cost of emissions over the project's lifespan. Emissions from the diesel generator, mainly carbon dioxide (CO2), are quantified using emission factors in kg/L of diesel consumed.
(4) Optimization using Particle Swarm Optimization (PSO) algorithm
The Particle Swarm Optimization (PSO) algorithm is employed to find the optimal configuration of the DERs that minimizes the objective function. The choice of PSO for this study is due to its effectiveness in handling complex, non-linear, and multi-modal optimization problems common in hybrid microgrids.
(5) Performance evaluation
The optimization process was performed in six scenarios in order to demonstrate the effectiveness of the proposed system. The optimal configuration obtained from the PSO algorithm was evaluated in terms of NPC, COE, quantity of diesel fuel consumed, and environmental emissions. Furthermore, the results obtained from the proposed PSO-based methodology were compared with those obtained from HOMER in terms of NPC, COE, greenhouse gas emissions, and quantity of diesel fuel consumed. Figure 2 depicts the flow chart of the proposed methodology.
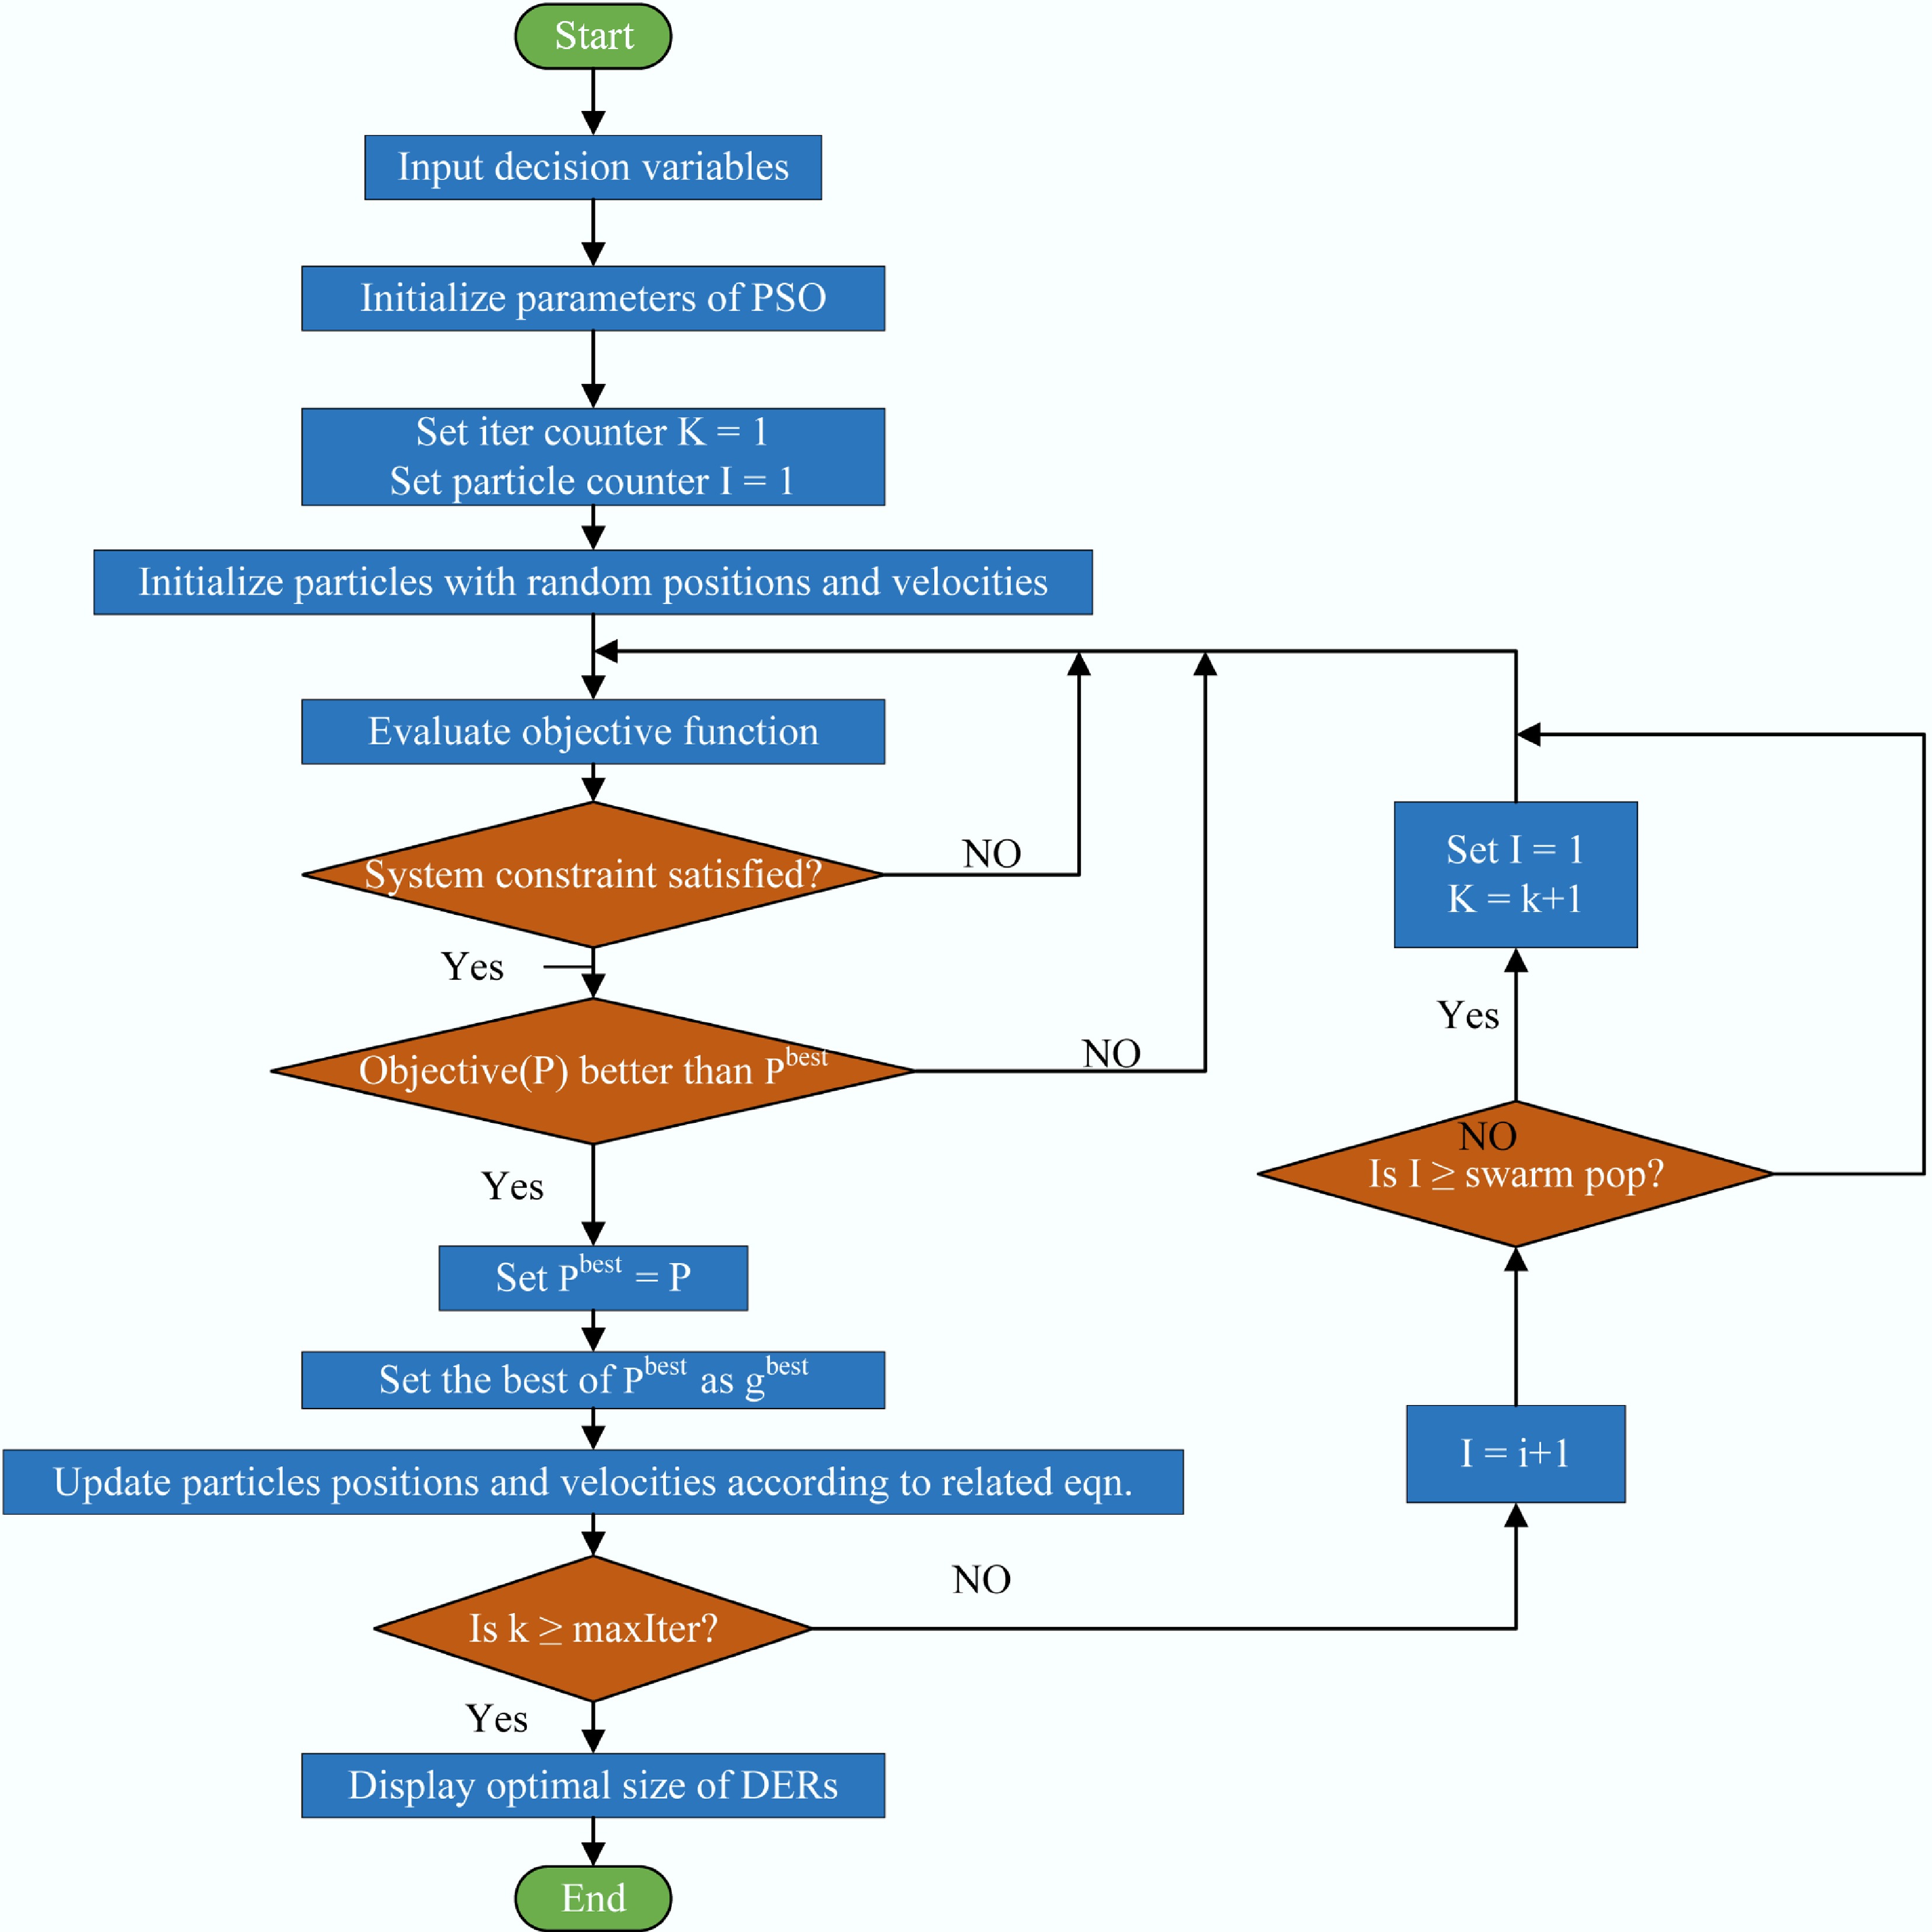
Figure 2.
Flowchart of the proposed methodology.
Particle swarm optimization (PSO)
-
The PSO algorithm is employed as a robust meta-heuristic algorithm technique to optimize the energy management and energy distribution of the DERs within the hybrid residential microgrid. The PSO is an intelligent optimizer that belongs to a class of optimization algorithm called 'meta-heuristics', and is based on the paradigm of swarm intelligence, which is inspired by the social behavior of animals such as birds, ants, and fish. PSO was introduced initially by James Kennedy (a social psychologist), and Russel C Eberhart (an electrical engineer) in 1995 with the intention of developing a model to describe the social behavior of animals such as flocks of birds and schools of fish; however, they realized that the model was capable of performing an optimization test[28]. PSO is a swarm intelligence method, and it uses intelligence agents called particles to reach an upper level of intelligence which is absolutely unreachable for any of the particles in the swarm. The algorithm is implemented using MATLAB. Initially, particles with random positions and velocities are generated to represent the size of each DER in the search space of the optimization problem. Each particle in the swarm has a memory of its own best position called personal best (Pbest), as well as the common or global best position (gbest). The algorithm then searches for the size of the DERs that satisfies the microgrid (MG) demand, and then evaluates the objective function accordingly. The optimal size of each DER is obtained after the algorithm reaches the maximum number of iterations.
The velocity and position of each particle in the swarm are updated using Eqs (6) and (7), respectively.
$ {v}_{ij\left(t+1\right)}={wv}_{ij\left(t\right)}+{c}_{1}\left({p}_{ij\left(t\right)}-{x}_{ij\left(t\right)}\right)+{c}_{2}\left({g}_{ij\left(t\right)}-{x}_{ij\left(t\right)}\right) $ (6) $ {x}_{ij\left(t+1\right)}={x}_{ij\left(t\right)}+{v}_{ij\left(t+1\right)} $ (7) where, vij(t) and vij(t + 1) are the initial and new velocities of the ith particle with the jth component, w is the inertial weight of the particles in the swarm, c1 and c2 are the personal and social learning accelerations, pij and gij are the personal and global best positions of each particle in the swarm with the ith and jth components, and xij(t) and xij(t+1) are the initial and new positions of the ith particle with the jth component in the swarm. The parameters employed in the PSO process are listed in Table 1 below.
Table 1. Parameters of PSO
Parameter Value Swarm size 50 Number of iterations 1,000 Inertia weight (w) 0.5 Personal learning factor (c1) 1.5 Social learning factor (c2) 2.0 Velocity limit 15% Formulation of objective function
-
In this study, the objective function is the minimization of the total NPC of the system, which includes the fuel cost of the DG, O&M cost, emission cost, and a penalty for unmet load. The objective function is therefore given in Eq. (8):
$ \begin{split}{min}_{u\left[t\right]}\mathrm{NPC}=\;&\sum \nolimits_{t=1}^{T}({NPC}_{PV},{NPC}_{WT},{NPC}_{DG,}{NPC}_{BESS,}\\&{NPC}_{emission,}{NPC}_{unmate},{NPC}_{fuel}) \end{split}$ (8) where, minu[t], NPCPV, NPCWT, NPCDG, NPCBESS, NPCemission, NPCunmate_load, and NPCfuel are the minimized total NPC of the system, NPC of PV, NPC of the wind turbine, NPC of the DG, NPC BESS, NPC CO2 emissions, NPC unmet load demand, and the NPC fuel consumption, respectively. The NPC of each distributed energy resource (DER) is calculated using Eq. (9)[16]:
$ {NPC}_{DER}={OP}_{DER}\times \left[{C}_{DER}+{R}_{DER}\times K+\left({O\& M}_{DER}\times \dfrac{1}{\mathrm{CRF}( i,N)}\right)\right] $ (9) where, OPDER, CDER, RDER, O&MDER, and CRF(i,N), are the optimal sizes of each DER, initial capital cost of each DER, replacement cost of each DER, operational and maintenance cost of each DERs, N is the lifetime of the project, L is the lifetime of each type of DER unit, and CRF is the capital recovery factor. The factor K is calculated as shown in Eq. (10):
$ K=\sum \nolimits_{n=1}^{y}\dfrac{1}{( 1+ir{)}^{L\times n}} $ (10) The capital recovery factor is a ratio of an annuity to the present value of receiving that annuity for a projects lifetime N[13], and it is calculated by Eq. (11):
$ \mathrm{CRF}( i,N)=\dfrac{i\times ( 1+i{)}^{N}}{(1+ i{)}^{N}-1} $ (11) where, i is the annual interest rate in percentage.
The NPC of diesel fuel consumption is calculated using Eq. (12)[13]:
$ {NPC}_{fuel}=\sum \nolimits_{t=1}^{T}\left[{F}_{(t)}\times {\lambda }_{Fuel}\right]\times \dfrac{1}{\mathrm{CRF}( i,N)} $ (12) where, F(t) is the cost of diesel fuel (US
${\$} $ Table 2 gives the system economics in terms of component cost, and Table 3 provides the systems' project and economic parameters.
Table 2. System economics in terms of component cost[13]
Type of DER unit Capital cost
(US$\boldsymbol{\$} $/kW)O&M cost
(US${\boldsymbol\$} $/kW)Replacement cost
(US${\boldsymbol\$} $/kW)PV 1,200 70 1,200 WT 8,200 100 5,400 BESS 1,500 15 1,500 DG 3,000 0.04 (US${\$} $/h) 3,000 Table 3. Project and economic parameters
Parameter HOMER PSO Project lifespan (years) 25 25 Discount rate (%) 8 8 DG lifespan (years) 15 15 WT lifespan (years) 20 20 BESS lifespan (years) 10 10 The amount of CO2 that is emitted for any quantity of diesel fuel consumed and the Net Present Cost is calculated using Eqs (13) and (14) respectively:
$ {Emission}_{(t)}={S}_{\left(e\right)}\times {F}_{(t)} $ (13) where, S(e) is the Specific emission of CO2 with a value of 2.68 kg/L, and F(t) is the cost of diesel fuel (US
${\$} $ $ {NPC}_{CO_2}=\sum \nolimits_{t=1}^{T}\left[{Emission}_{(t)}\times {\lambda }_{E}\right]\times \dfrac{1}{\mathrm{CRF}( i,N)} $ (14) where, λE (US
${\$} $ Energy management strategy (EMS)
-
To ensure an efficient and effective supply of energy, it is necessary to manage the energy distribution within the residential microgrid. Figure 3 gives the flow chart of the EMS employed in this study to manage the energy generation and distribution within the hybrid residential microgrid. In this strategy, priority is given to the renewable energy resources, where the microgrid demand is first met using energy generated from the renewable resources. The operational strategies adopted for this study are implemented by the following rules:
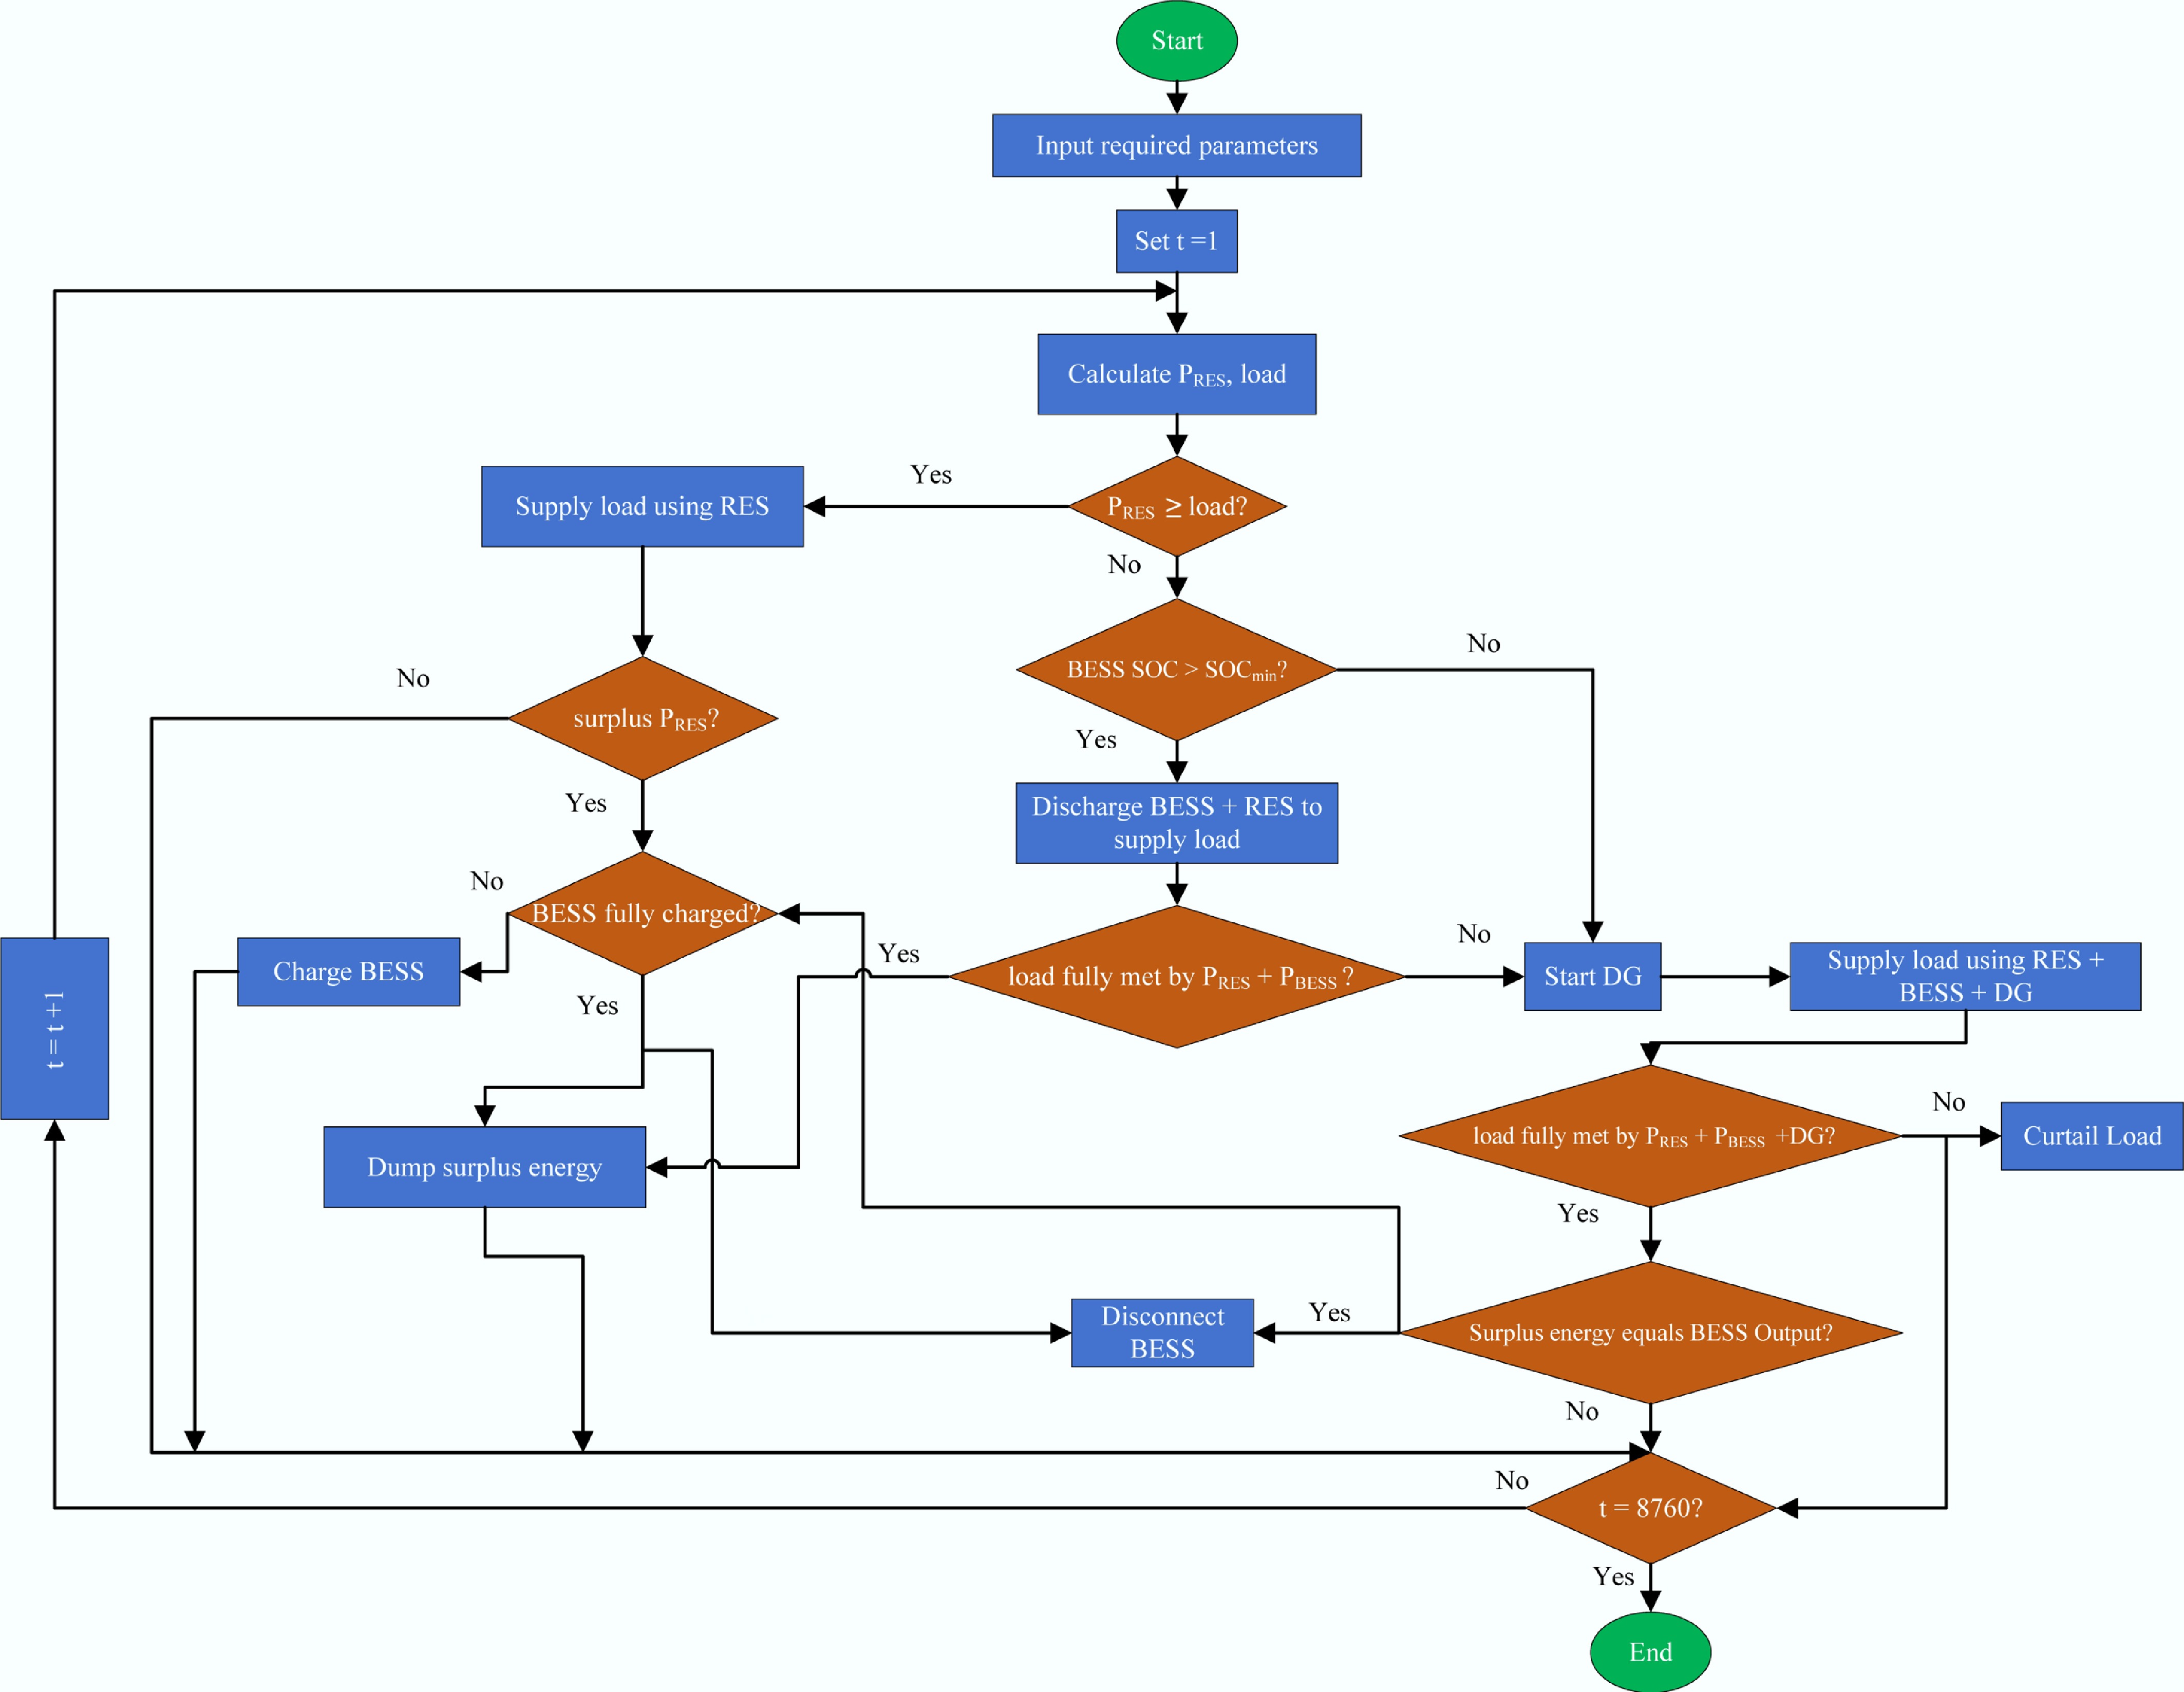
Figure 3.
Flowchart of the proposed energy management strategy.
(1) Renewable energy generation must be prioritized at all times. This ensures that the MG demand is always supplied using power generated from the renewable energy sources (wind and PV arrays). This is part (a) of the first rule. When the MG demand at any point in time exceeds the energy supplied by the renewable sources, and if the state of charge (SoC) of the BESS exceeds its minimum allowable depth of discharge (DoD), the deficit is supplied jointly by the BESS and the renewable sources within their rated capacities. When the supply from the renewable energy sources is greater than the MG demand, and if the BESS is not fully charged, the surplus energy is used to charge the BESS to its rated capacities before dumping the remaining surplus power. This is part (b) of the first rule.
(2) The diesel generator is activated only when the power supplied from both the BESS and the renewable energy sources is insufficient to meet the microgrid demand. At any point in time, if the surplus energy produced by the combination of all the sources is equal to the energy supplied by the battery, the battery must be disconnected, allowing only the RES and DG to supply the MG demand.
(3) The BESS is charged only when there is a surplus supply of energy from the renewable energy sources or a combination of the renewable resources and the DG (i.e., in situations where the surplus energy produced by the combination of all sources equals the energy supplied by the battery, and the BESS is disconnected).
(4) Load curtailment is not allowed when the total power generated by the distributed energy resources is sufficient to satisfy the demand.
(5) Energy dumping is not allowed when the BESS is not fully charged.
(6) Dumping of energy is not allowed when there is still an unmet demand.
(7) No battery in the system can be charged when other batteries are discharging, and vice versa.
The above energy management strategies are implemented using the following constraints.
$ P_{t}^{RES}=P_{t}^{{MG}_{demand}}\quad\forall t $ (15) $ BESS_{dch}^t\leqslant BESS_{Rt}^t.\ (E_{RES}\leqslant P_t^{MG_{demand}})\quad\forall t $ (16) $ P_{t}^{DG}\leqslant \mathrm{max} (0,P_{t}^{{MG}_{demand}}-P_{t}^{RES}-BESS_{t}^{dch} ) $ (17) $ BESS_{ch}^t.\ (E_{RES}\leqslant P_t^{MG_{demand}})=0 $ (18) $ BESS_{ch}^t\leqslant BESS_{Rt}^t,\ BESS_{dch}^t\leqslant BESS_{Rt}^t\quad\forall t $ (19) $ \left(\sum \nolimits_{t}BESS_{t}^{ch} \lt 1\right).\sum \nolimits_{t}P_{t}^{dump} = 0 $ (20) $ MGdemand_{t}^{curt}=0 : if P_{t}^{RES}+P_{t}^{DG}+BESS_{t}^{dch}\geqslant P_{t}^{{MG}_{demand}} $ (21) $ \sum \nolimits_{t}BESS_{t}^{ch}.\sum \nolimits_{t}BESS_{t}^{dch}=0 $ (22) Equation (15) enforces part (a) of rule i, ensuring that renewable energy generation is always prioritized at every point in time. This prevents the hybrid system from unnecessary usage of the energy stored in the BESS and DG, which may lead to premature degradation of the BESS and environmental emissions from the hybrid system.
Equation (16) enforces part (b) of rule i, ensuring that the BESS is dispatched within its rated capacity when it is able to do so, and only when the energy generated by the renewable resources is unable to satisfy the microgrid demand.
Equation (17) enforces rule (ii). This ensures that the DG is activated only when the energy jointly supplied by the renewable energy sources and the BESS is insufficient to satisfy the microgrid's demand. This prevents unnecessary diesel fuel consumption which could result in environmental pollution.
Equation (18) enforces rule (iii), preventing the BESS from charging when there is no surplus energy generation from the renewable energy resources. This ensures that the total energy generated by the renewable resources is used to satisfy MG demand.
Equation (19) prevents the BESS from charging and discharging (supplying power) beyond its rated capacity. This ensures that the operating limit of the BESS is not violated in terms of power and energy rating.
Equation (20) enforces rule (v), ensuring that the BESS is charged to its full capacity before any surplus energy in the hybrid system is dumped. This ensures efficient energy management in the hybrid system by ensuring that the surplus energy generated by the renewable resources is stored in the BESS for future usage, preventing energy wastage.
Equation (21) enforces rule (vi), preventing load curtailment at any point in time when the generated power of the DERs is sufficient to meet the microgrid's demand.
Equation (22) enforces rule (vii), preventing simultaneous charging and discharging among batteries. This constraint ensures that there is no arbitrary energy exchange between batteries which may result in unjustified energy loss in the system.
In order to find the optimal configuration of DERs that minimizes the objective function, six different configurations (scenarios) of the DERs are considered. The six scenarios are as follows:
(1) DG Only (Scenario 1): In this scenario, the microgrid's demand is met using a DG alone.
(2) DG and WT (Scenario 2): Under this scenario, the microgrid's demand is met using supply from both the DG and the WT. The DG is used as a backup to complement the WT during periods of low wind profile.
(3) DG and PV (Scenario 3): In this scenario, the MG demand is met using supply from both the DG and the PV.
(4) WT and BESS (Scenario 4): Under this scenario, supply from both the WT and the BESS is used to satisfy the MG demand.
(5) PV and BESS (Scenario 5): Under this scenario, power generated from both the PV and the energy stored in the BESS is used to satisfy the MG demand.
(6) PV, WT, DG, and BESS (Scenario 6): Under this scenario, the microgrid's demand is met using all the DERs that constitute the hybrid residential microgrid.
-
The energy management and optimization problem of the hybrid residential microgrid was solved using six different scenarios to obtain the optimum configuration of the DERs that minimizes the objective function. The results obtained from the proposed PSO-based methodology were compared with those obtained from HOMER, with respect to the NPC, COE, greenhouse gas emissions, and quantity of diesel fuel consumed. The greenhouse gas emissions, COE, and quantity of diesel fuel consumed in each of the six different scenarios were evaluated and compared.
MG load demand
-
The load demand on the microgrid is depicted in Fig. 4. This figure shows a seasonal daily average load consumption characterized by varying consumption patterns. It is a variable load profile with a mixture of different load types. The load profile is non-uniform, with pronounced fluctuations across the 24-h period. These variations must be carefully matched with energy generation and storage to ensure reliability and efficiency of supply to the microgrid.
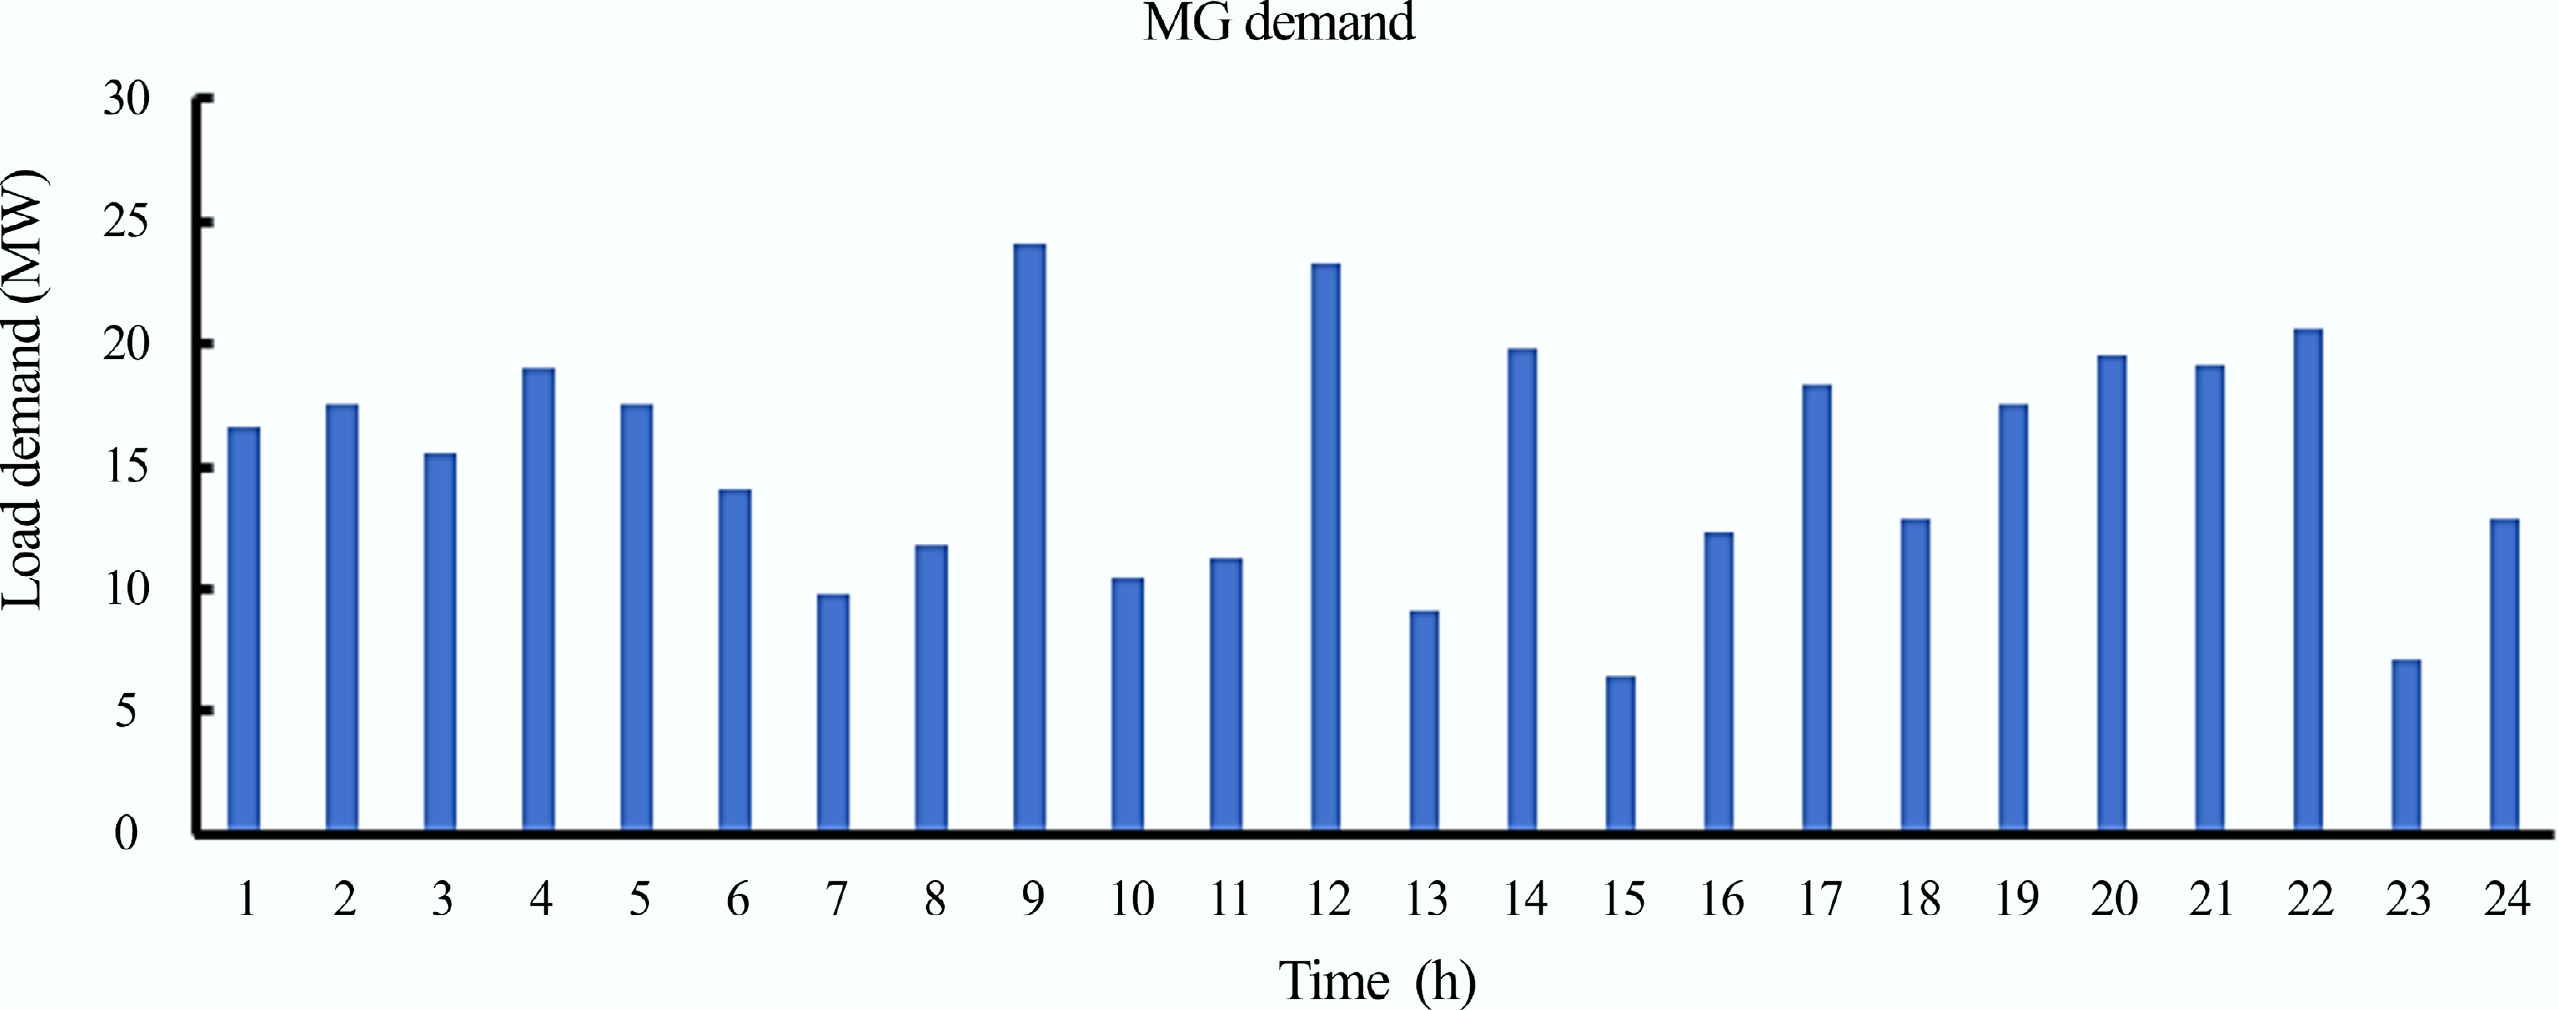
Figure 4.
Hourly load demand (MW) over a 24 h period.
Solar PV profile and energy generation
-
The solar irradiance and the energy produced by the PV over a 24-h period are shown in Fig. 5. From the figure, it is evident that the PV is only able to generate power during the daytime, and as a result, it cannot be used alone to meet the microgrid's demand, especially during nighttime, or periods of low solar profile, without storage due to its intermittent nature.
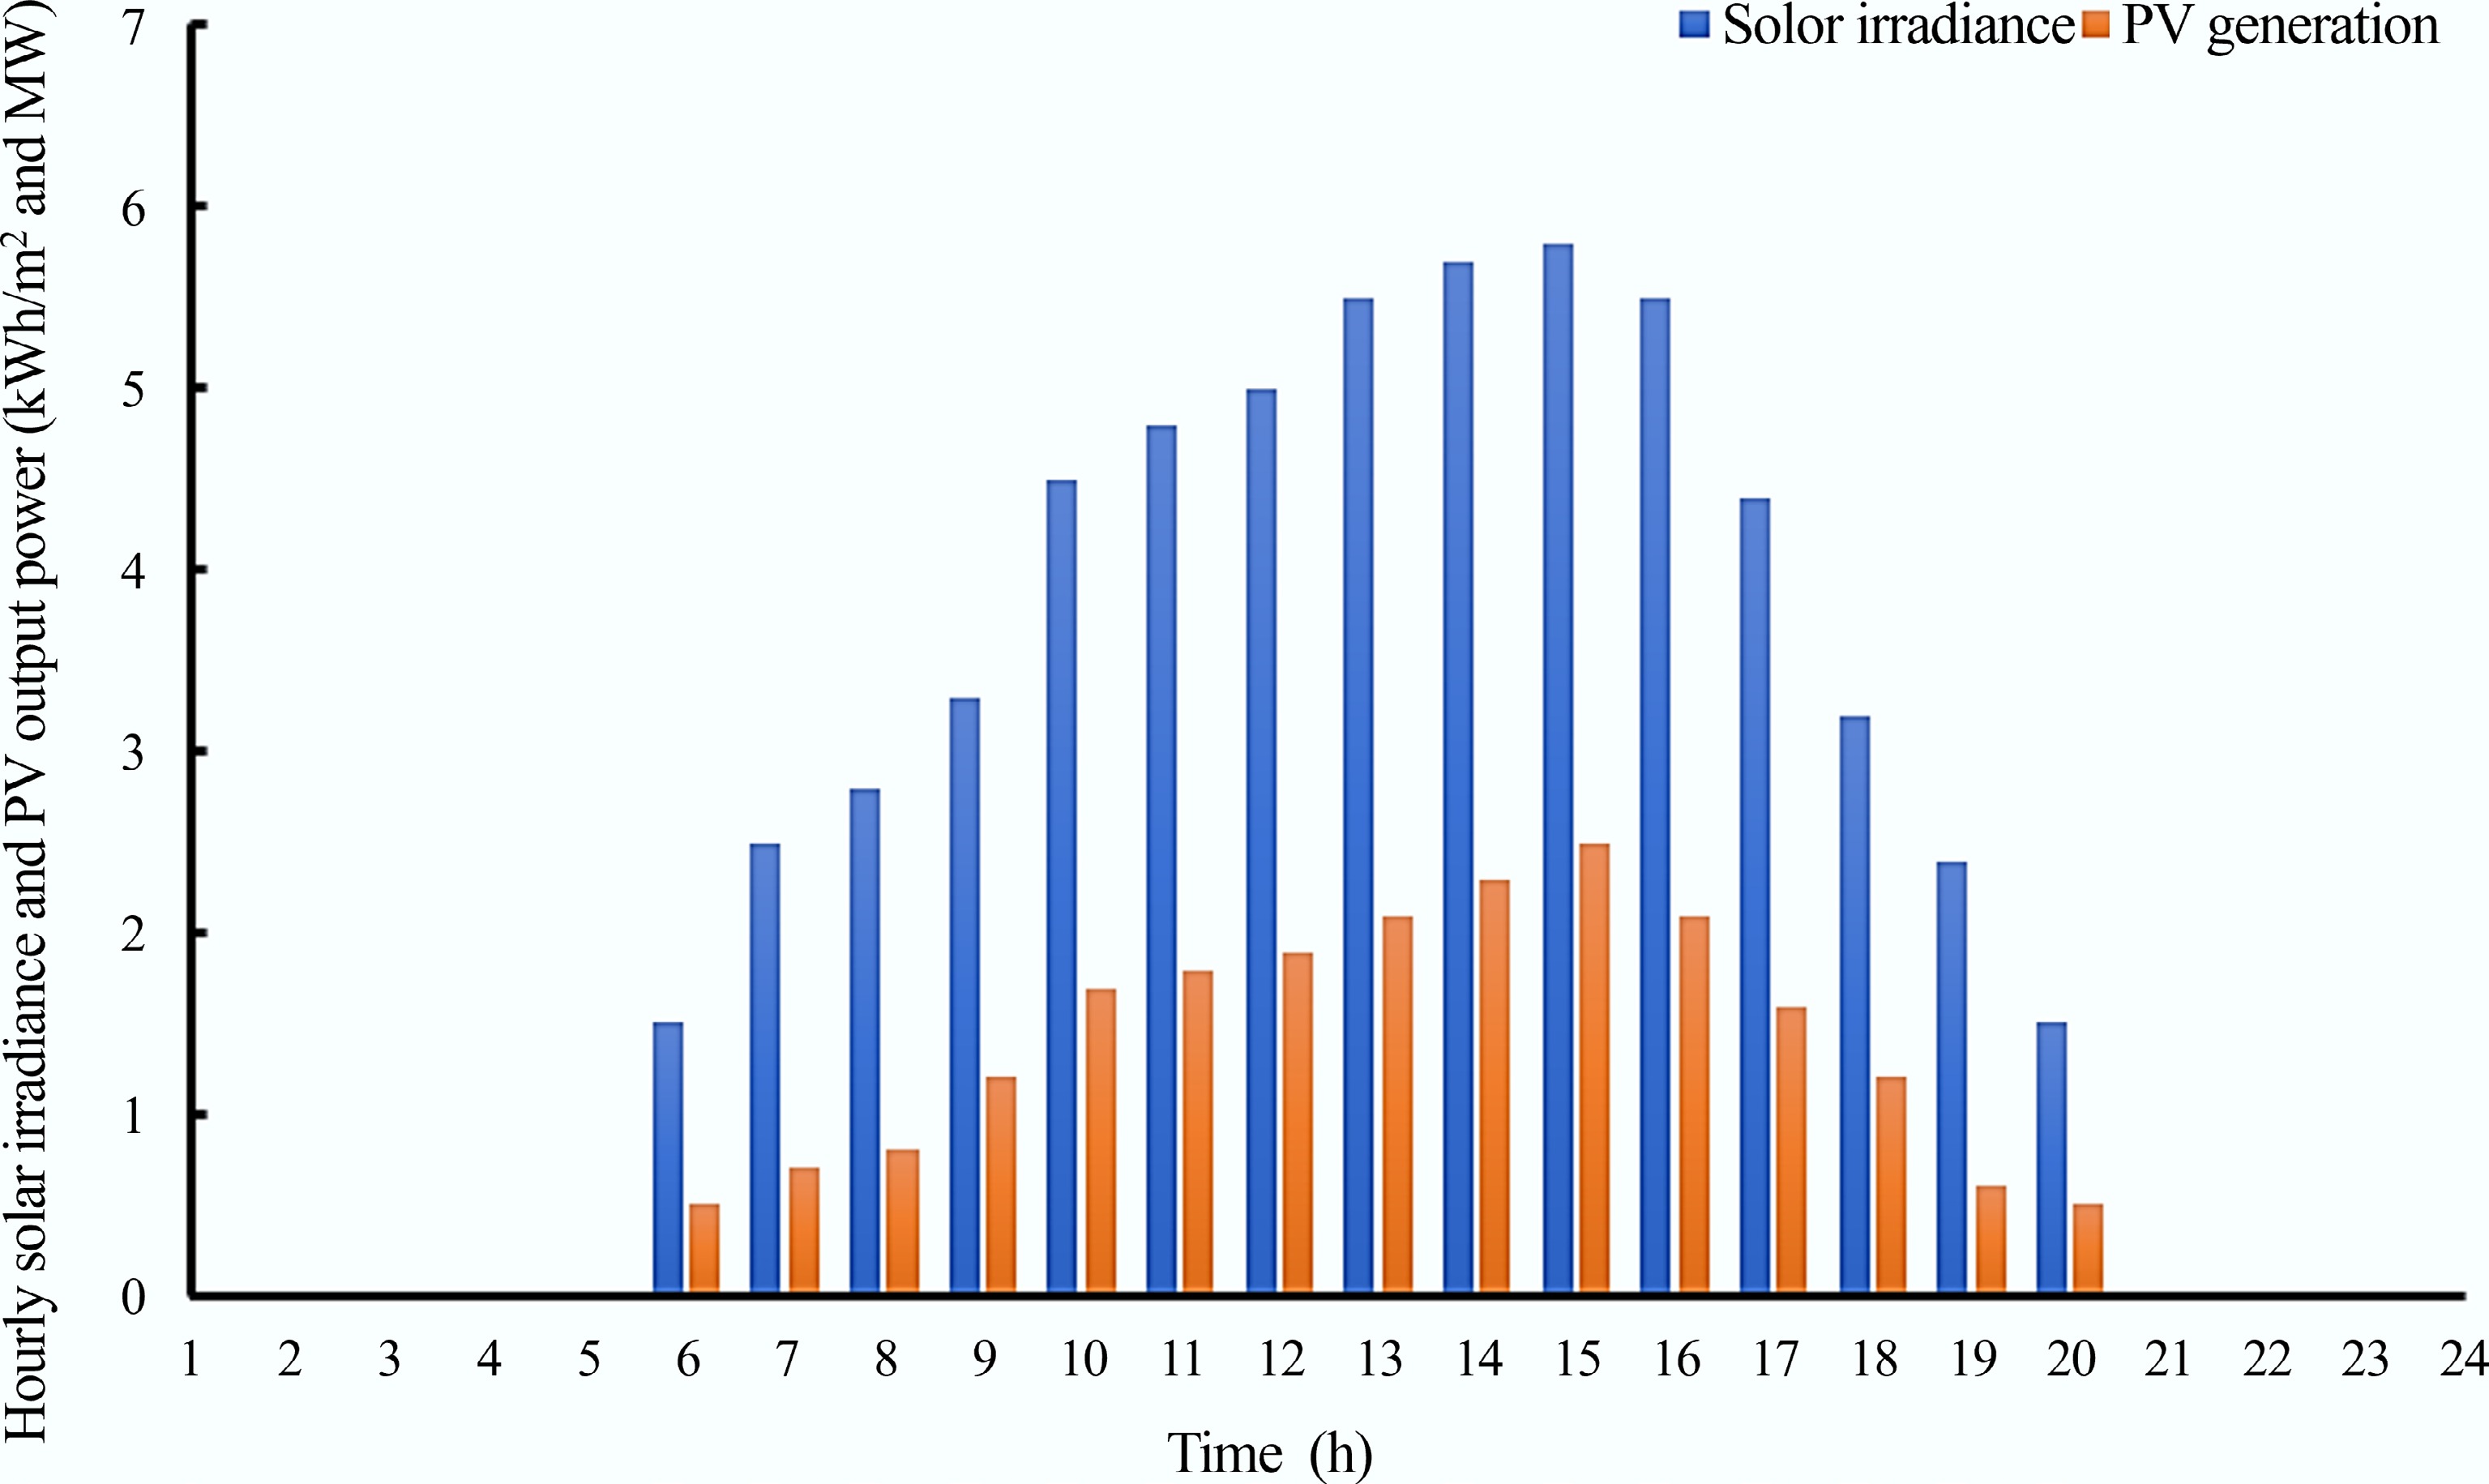
Figure 5.
Hourly solar irradiance (kWh/m2), and PV power generation (MW) over a 24 h period.
Wind profile and WT energy generation
-
The energy generated by the WT and the wind profile for a 24-h period are depicted in Fig. 6. At low wind speeds, the energy production is minimal, while at moderate and stable wind speeds, the WT operates efficiently. However, during very high wind speeds, protection mechanisms operate to stop generation in order to protect the WT from damage.
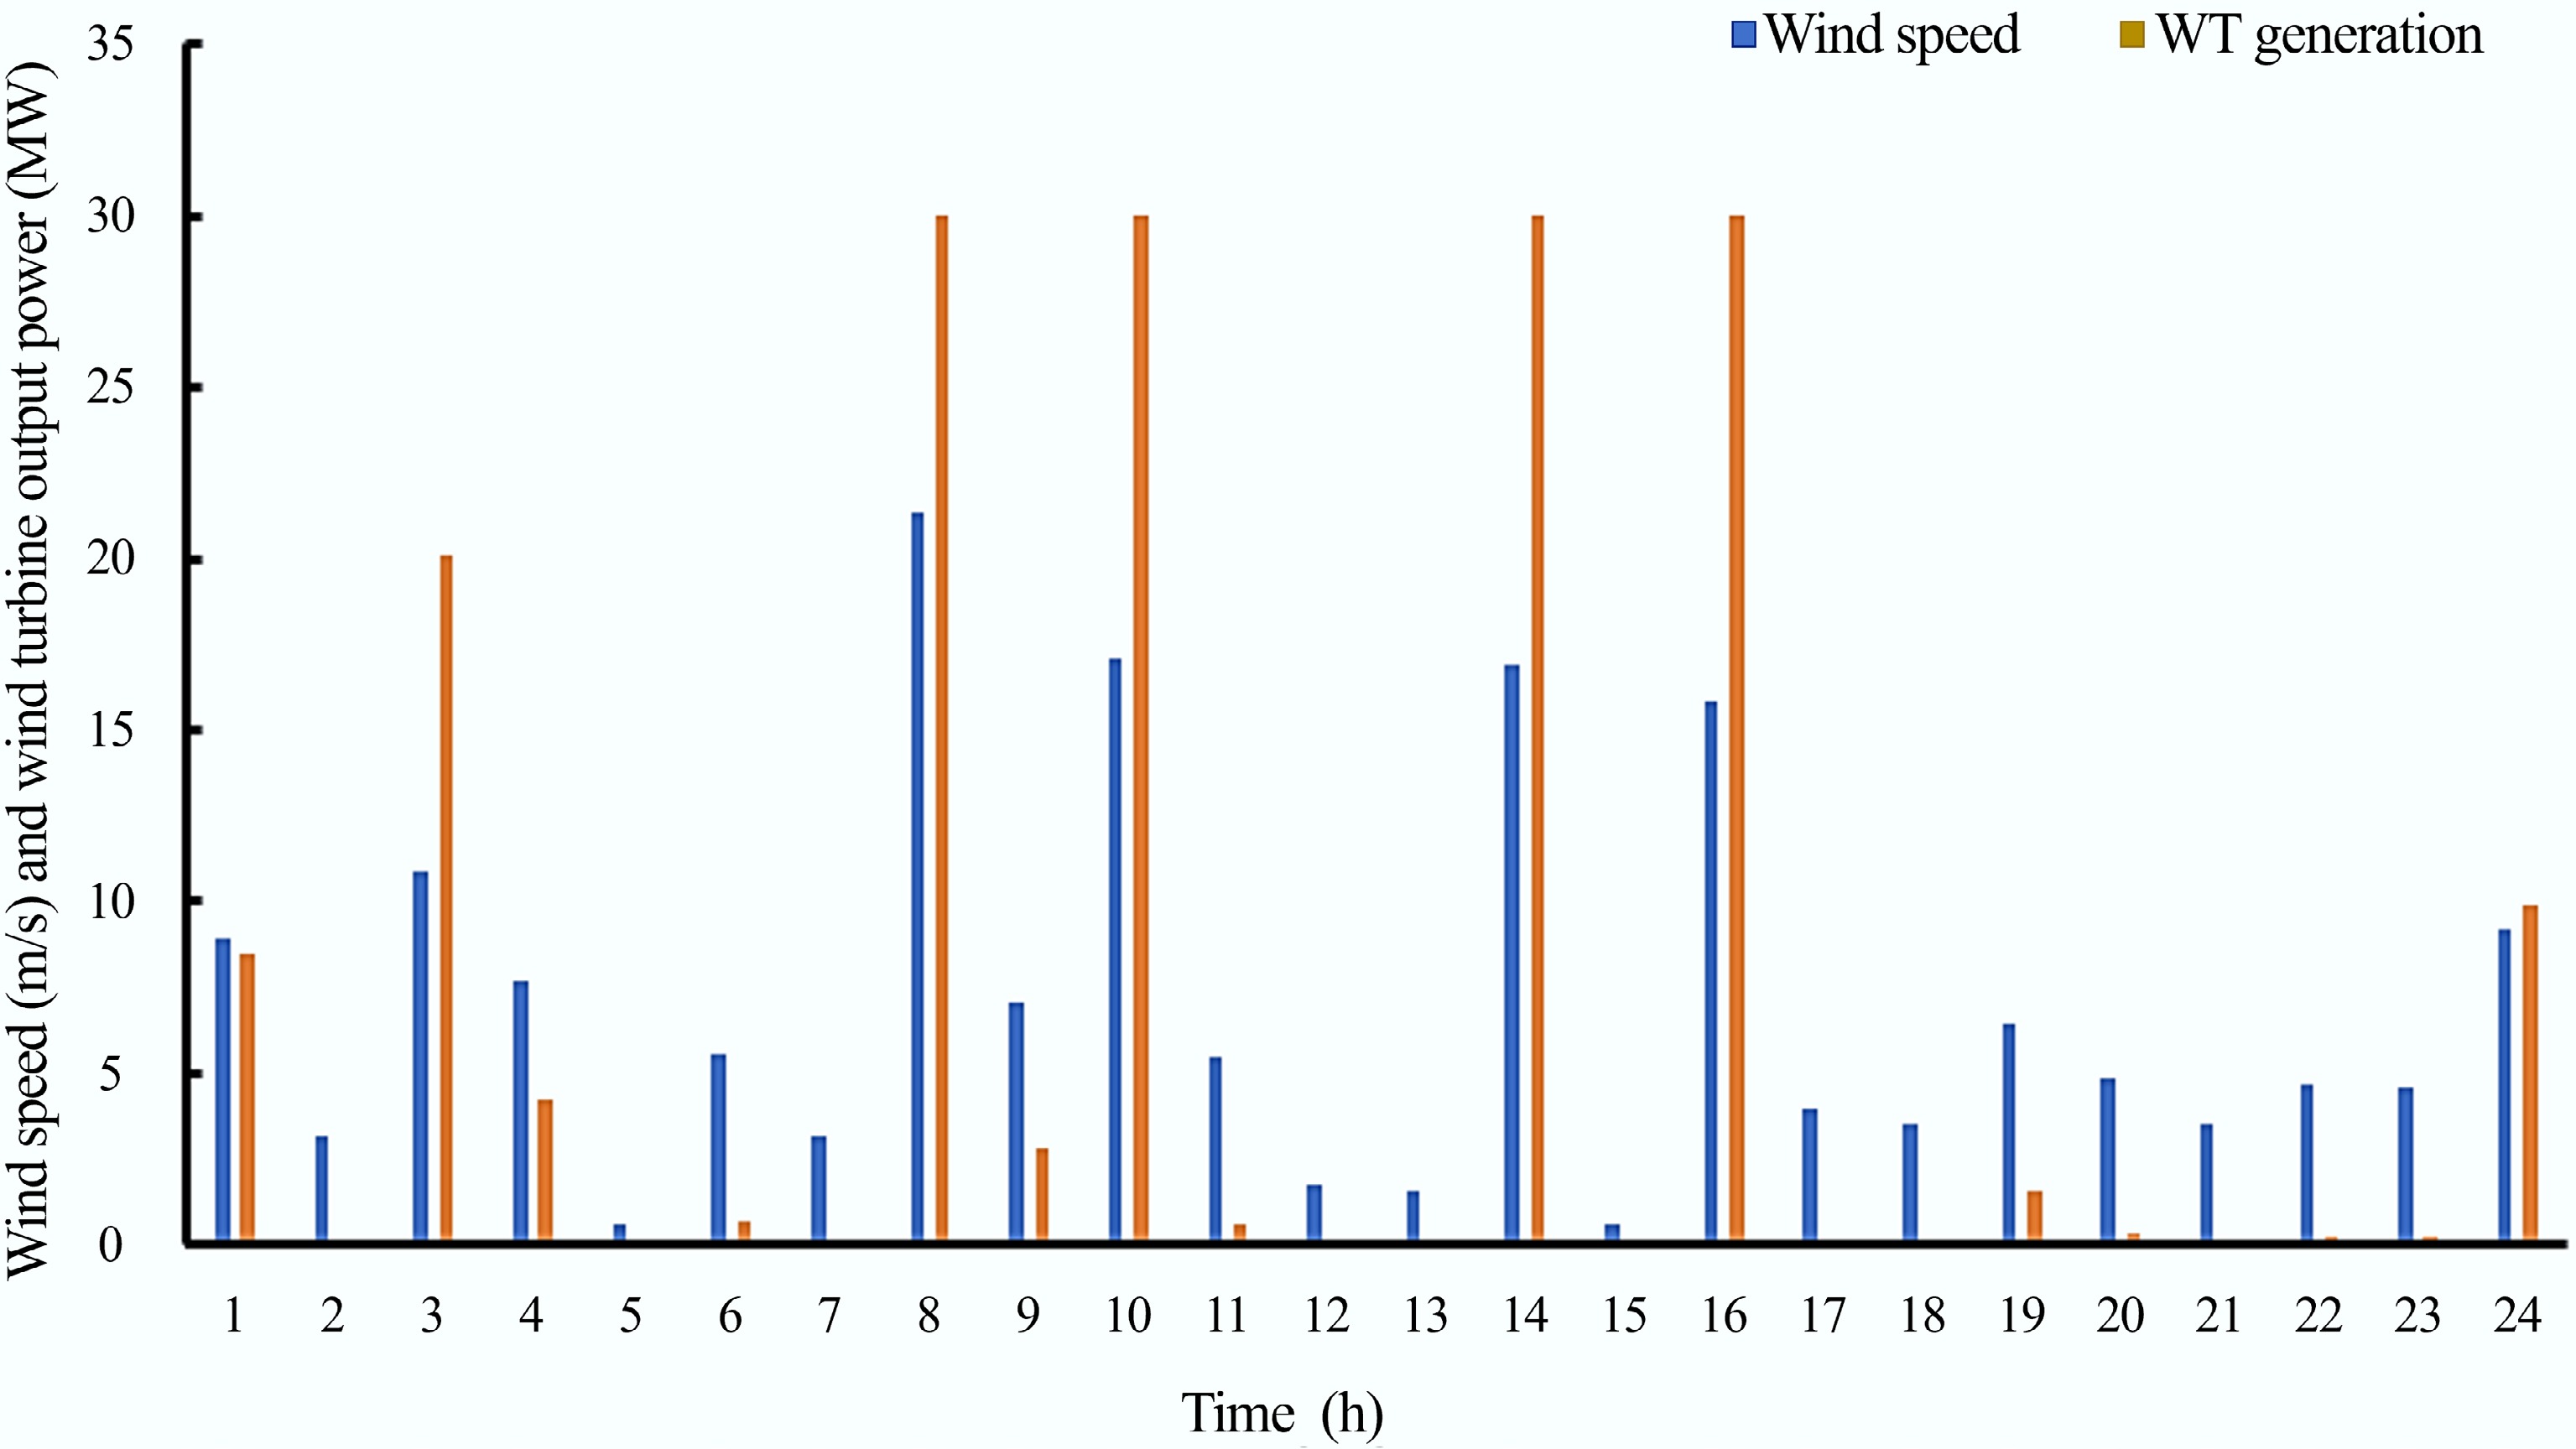
Figure 6.
Wind speed (m/s), and the wind turbine power generation (MW) over a 24 h period.
Renewable energy generation vs MG demand
-
The energy generated by the renewable energy resources (WT and PV) against microgrid's demand is shown in Fig. 7. The integration of both WT and PV into the hybrid system enhances the reliability of the microgrid by exploiting the complementary nature of these renewable resources. The PV can only generate power during daylight hours, and is also unable to generate power during cloudy conditions. On the other hand, the WT can generate both during the daytime and at night. This complementary generation pattern smooths the overall energy supply, reduces dependence on the DG, and improves the utilization of the BESS.
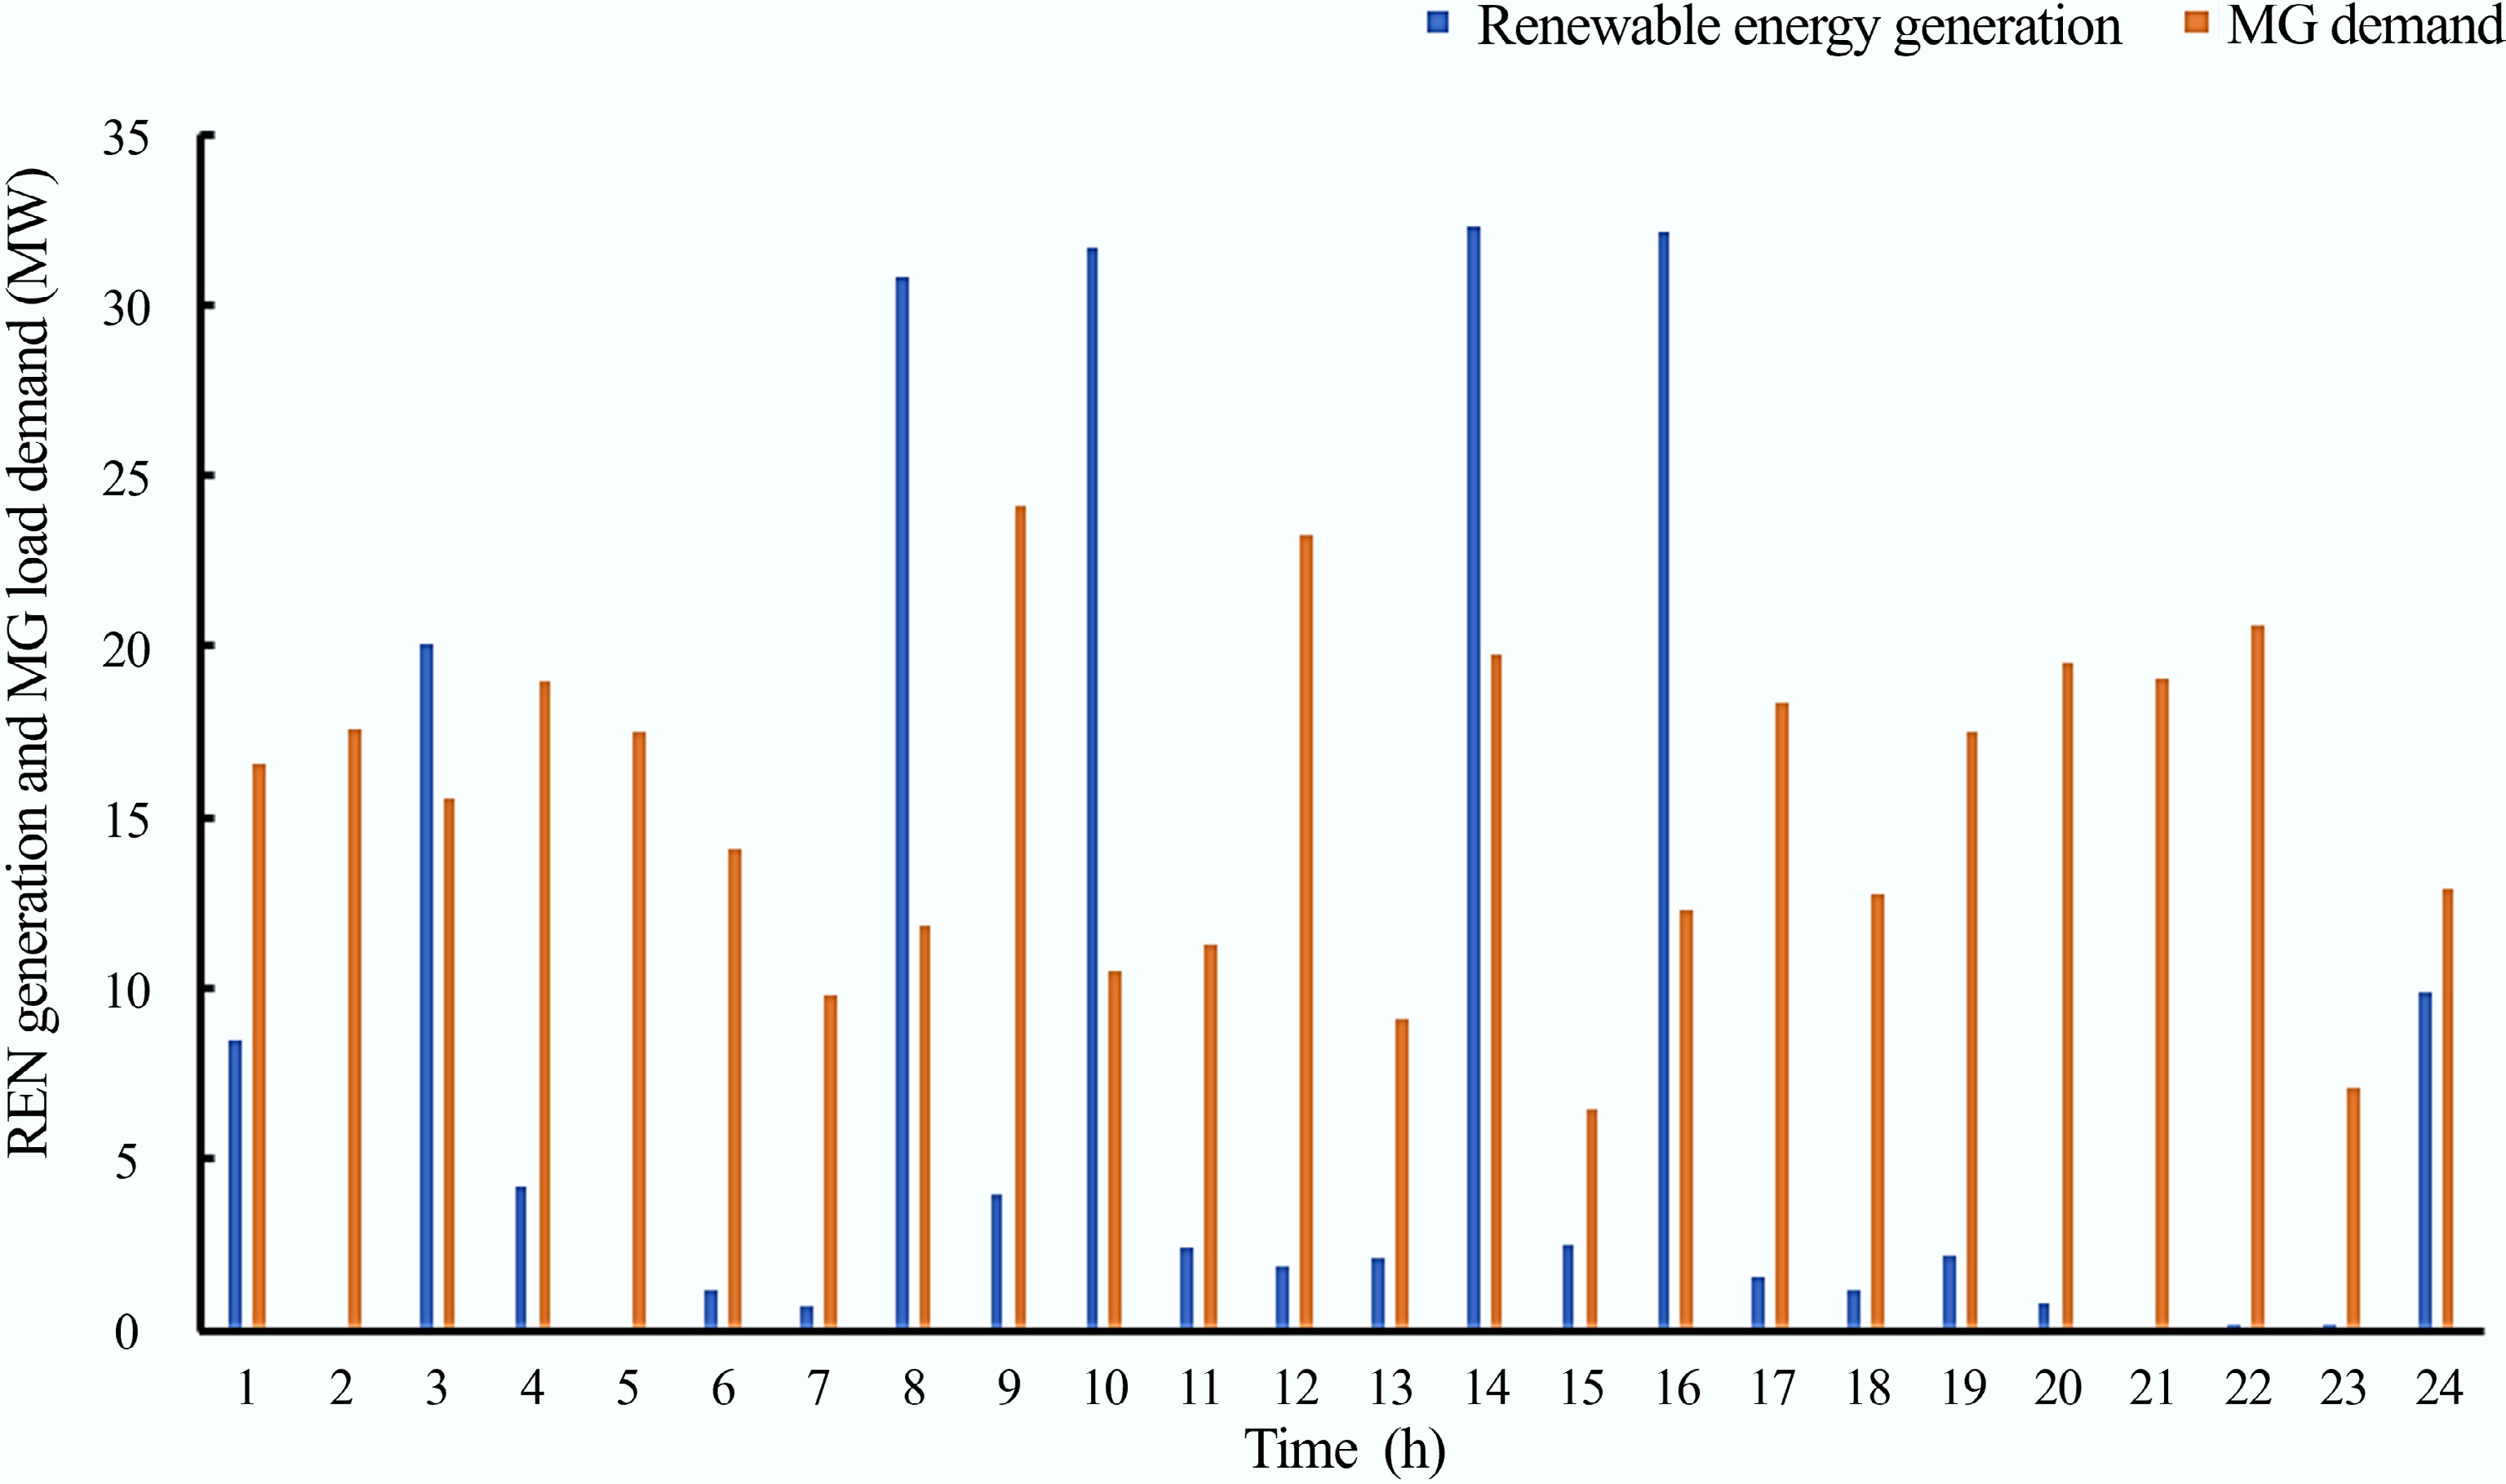
Figure 7.
Renewable energy generation against MG load demand over a 24 h period.
From Fig. 7, it can be seen that during hours 3, 8, 10, 14, and 16, excess energy is generated by the renewable energy sources, i.e., the energy generated exceeds the hourly demand on the microgrid. This excess energy is stored in the BESS. During hours 1, 2, 4–7, 9, 11–13, 15, and 17–24, the microgrid's demand exceeds the total energy generation of the renewable energy sources. This power deficit is met using either the energy stored in the BESS, the DG, or a combination of both.
DG operation and BESS dispatch
-
In the setup above (the hybrid residential microgrid under consideration), the dispatch logic is designed to ensure reliability of supply as well as to maximize renewable energy utilization, and reduce diesel fuel consumption and its associated emissions. The DG and the BESS play a crucial role in ensuring that the microgrid's demand is always met. The DG and BESS are always deactivated when the available renewable power is sufficient to supply the load. Under this condition, the entire load is fully supplied by the renewable sources, and any available surplus renewable power is used to charge the BESS to its rated capacities. Figure 8 depicts the unmet hourly load demand by the renewable sources. From Fig. 8, it can be seen that in order to satisfy this unmet load demand, the BESS, DG, or a combination of both BESS and DG has to be dispatched. When the generation from the renewable resources alone is inadequate to satisfy the load demand, as seen in Fig. 7, the BESS is dispatched to compensate for the power deficit between renewable generation and load demand, and the DG remains offline as long as the combined output of the renewable sources and the BESS is able to satisfy the load demand.
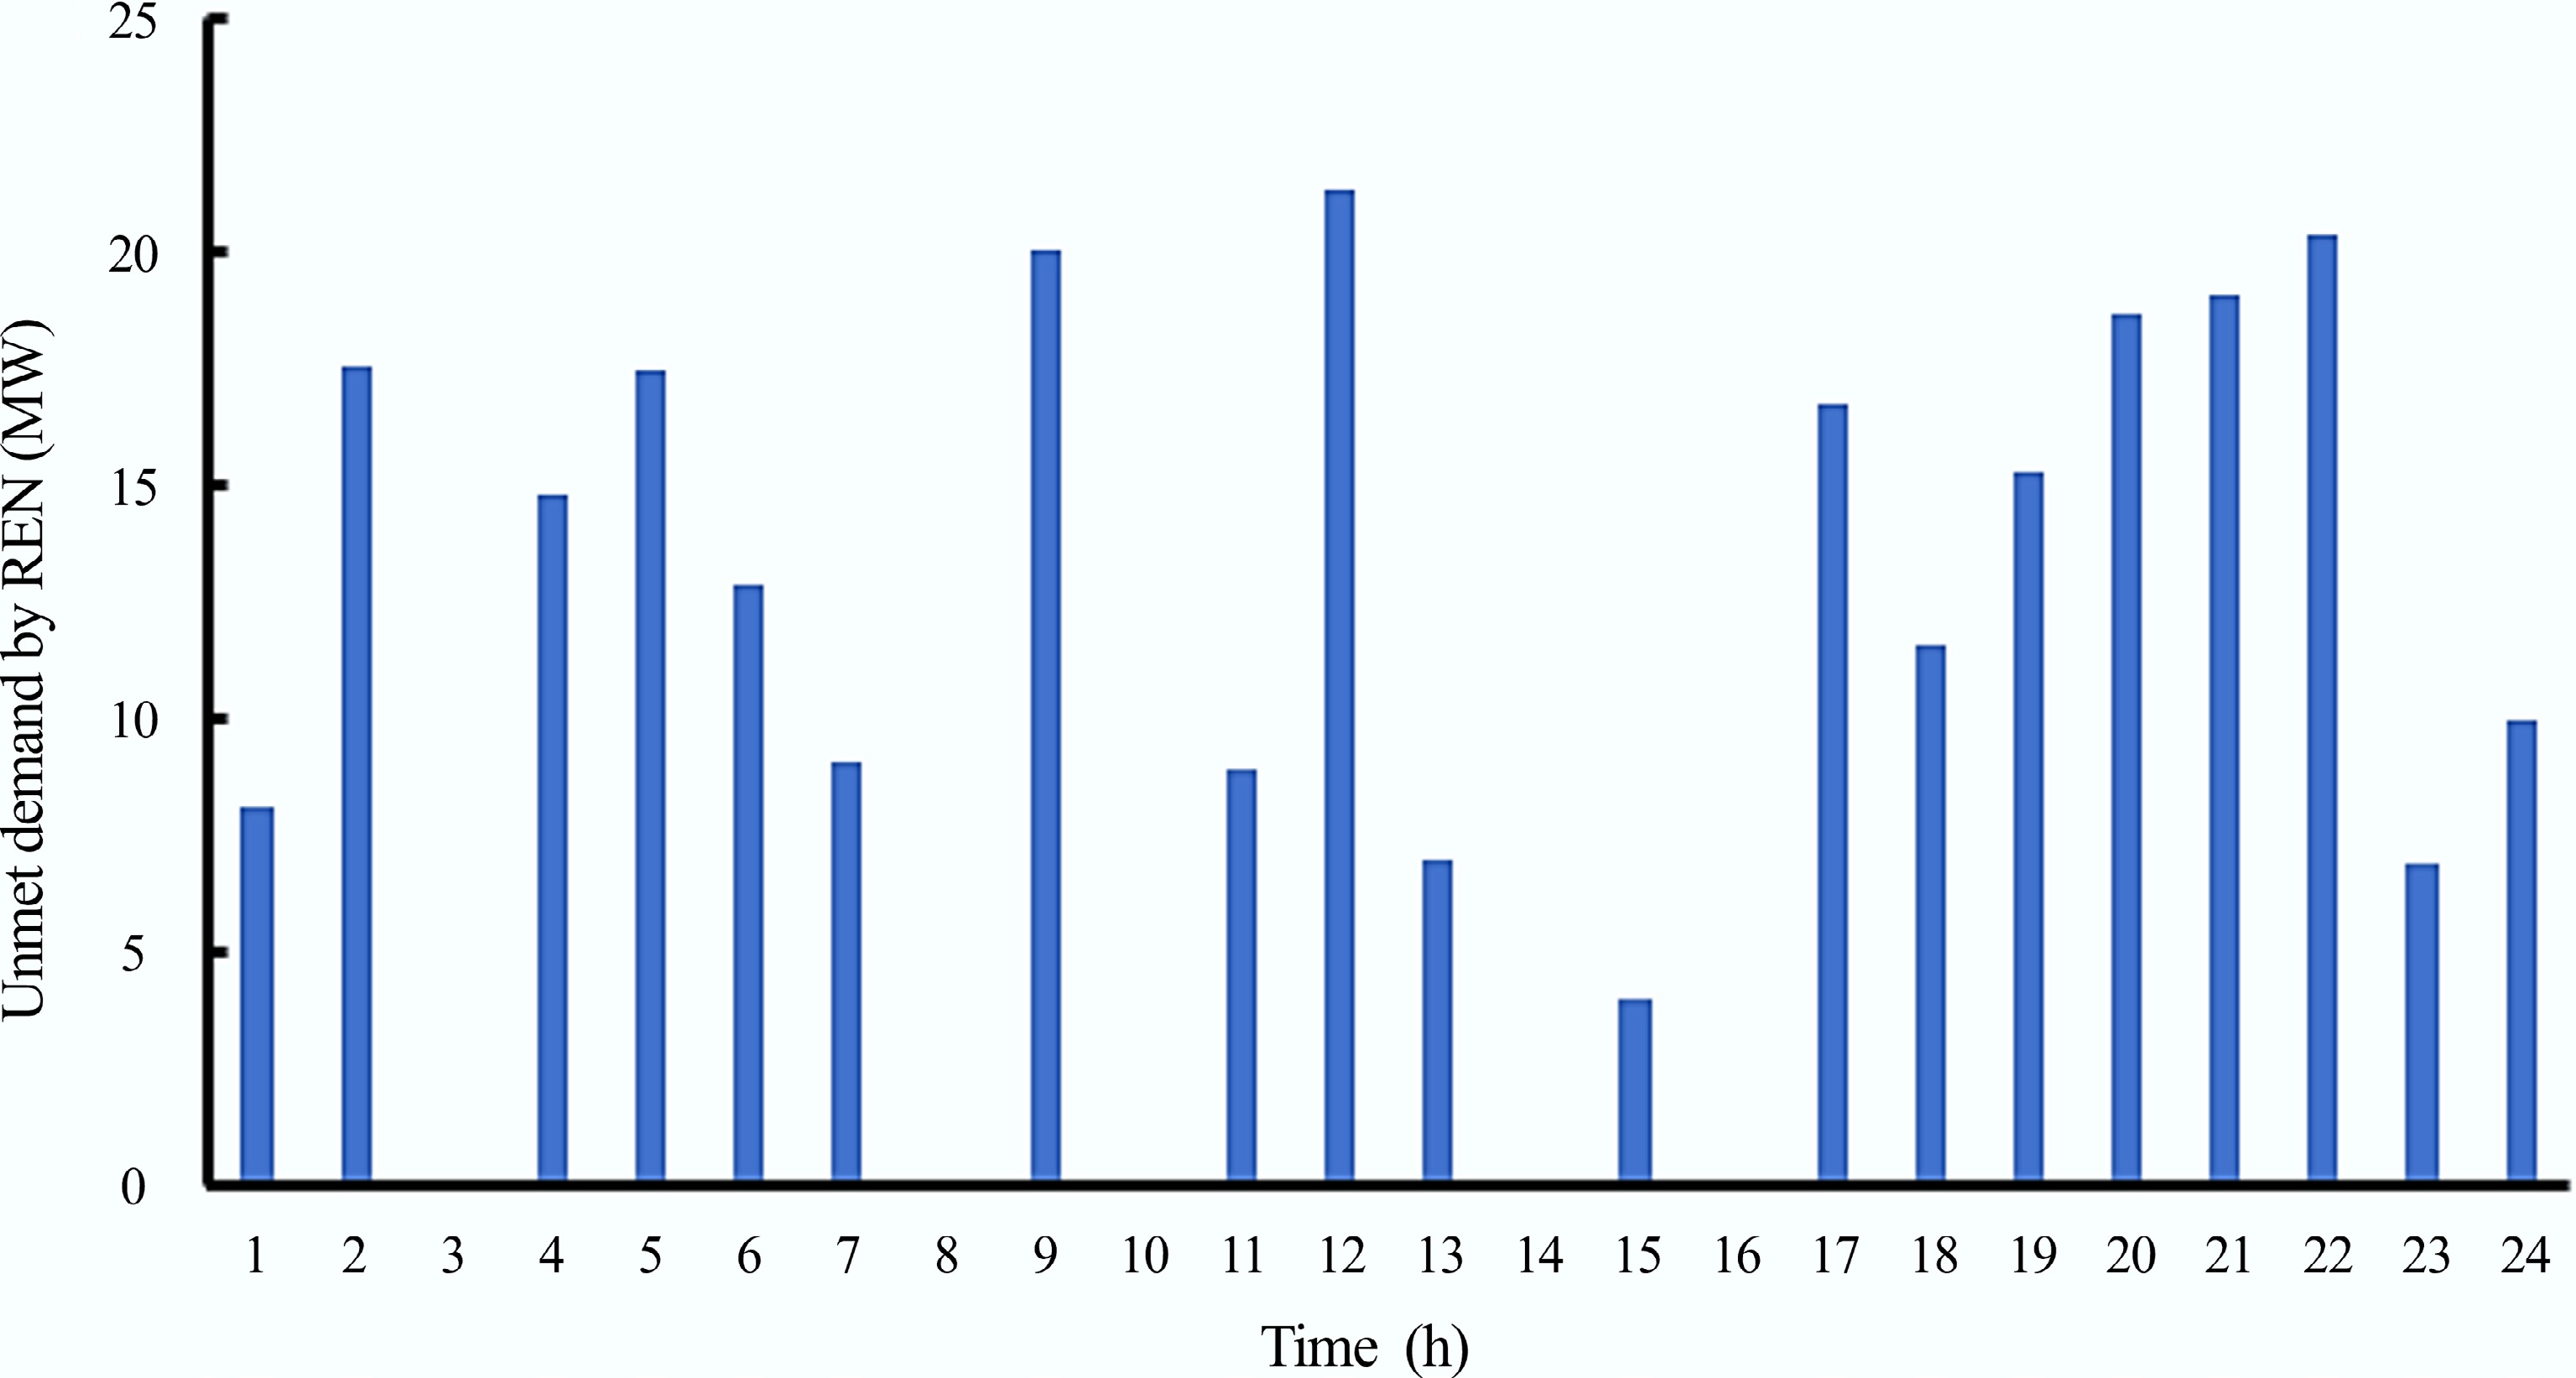
Figure 8.
MG unmet demand by RES over a 24 h period.
In situations where the combined generation of the renewable sources and the BESS is insufficient to meet the load demand, the DG is dispatched to supply the remaining unmet load, while the renewable sources and the BESS continue to operating within their respective limits as seen in Fig. 9.
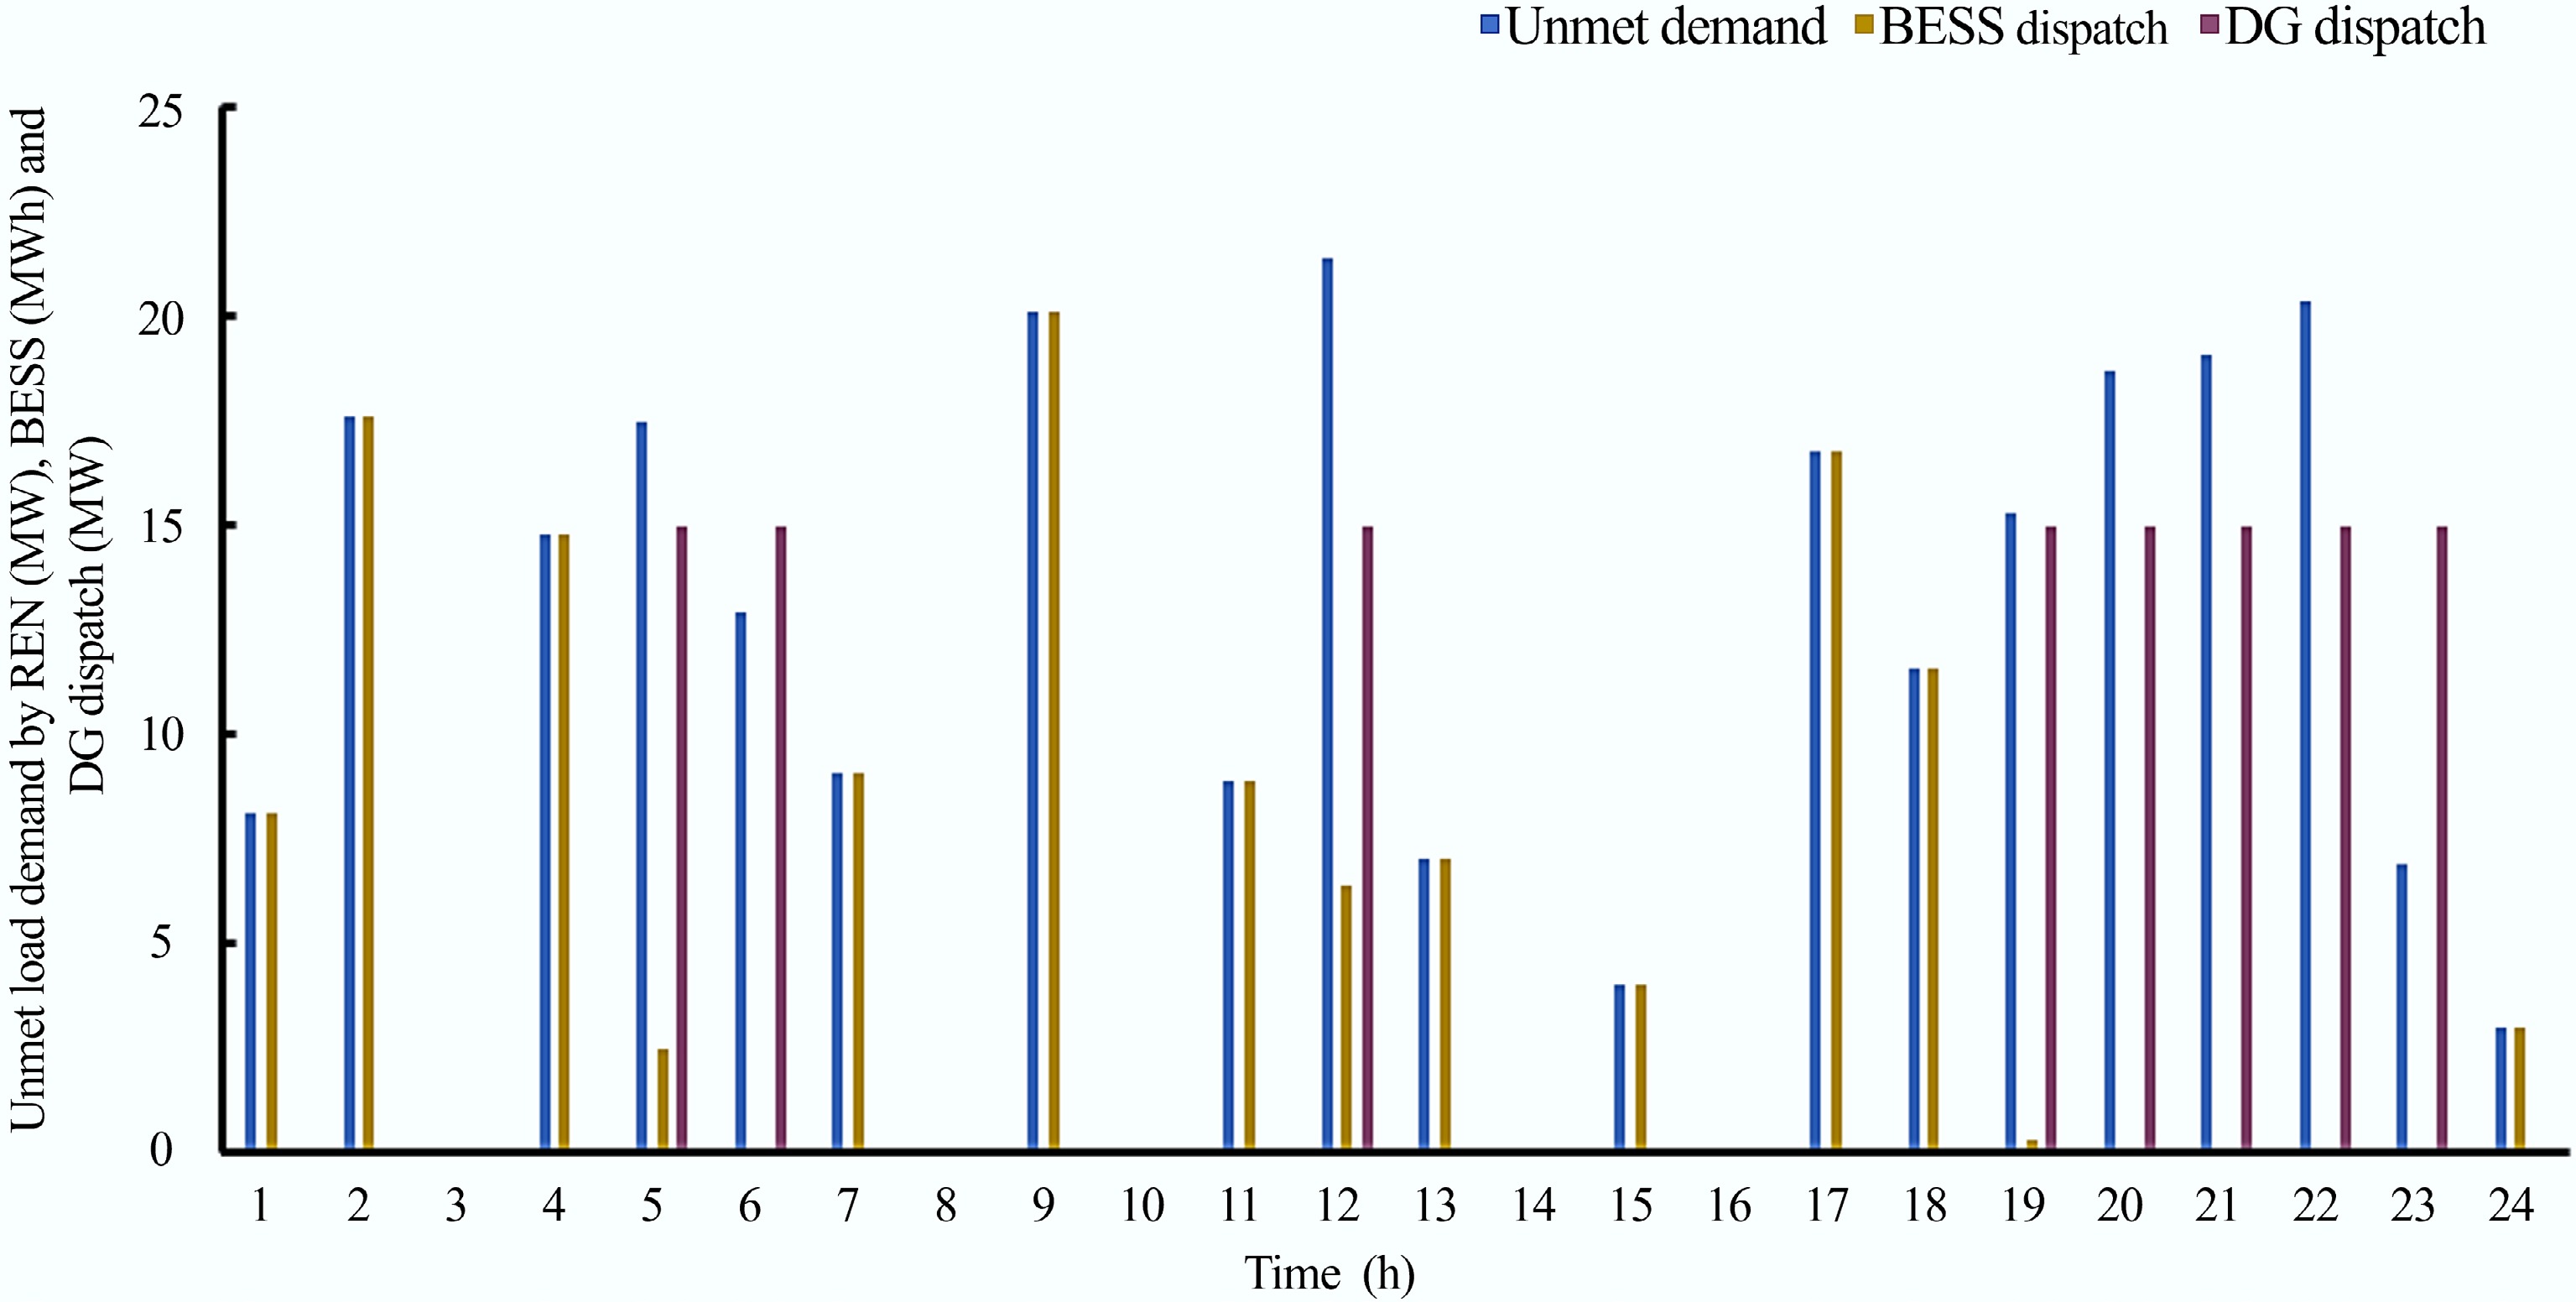
Figure 9.
Unmet demand by Ren Generation (MW), BESS (MWh), and DG Dispatch (MW) over a 24 h period.
Performance of the microgrid under different DER configurations
-
As stated earlier, the optimization and energy management problems of the hybrid residential microgrid can be solved using six different DER configurations in order to determine the optimum configuration and size of the DERs that minimize the objective function. In each scenario, the PSO algorithm was employed to optimize the sizing of the DER components. The algorithm searches for the optimal size of each DER that minimizes the objective function, which accounts for the capital, O&M, fuel, and replacement costs over the project lifespan, which is projected to be 25 years, with an 8% interest rate. The operational efficiency of the BESS is considered to be 95%, and is constrained within an allowable state of charge (SoC) limit. Table 4 shows the performance of the microgrid under different configurations of the DERs in terms of NPC, COE, quantity of fuel consumed, and quantity of CO2 emissions.
Table 4. Simulation results of the different scenarios
Scenarios Fuel
(million L)Emission
(million kg/yr)COE
(US${\boldsymbol\$} $/kWh)NPC (US${\boldsymbol\$} $) DG 9.2 24.6 1.92 123,048,558.97 DG/WT 6.7 17.9 1.08 98,042,498.96 DG/PV 8.8 22.1 1.74 116,729,972.92 WT/BESS 0 0 0.99 110,167,373.27 PV/BESS 0 0 1.09 104,354,936,54 PV/WT/DG/BESS 2.1 8.4 0.73 85,542,372.16 From Table 4, Scenario 1 (where only the DG is used to meet the MG's demand) has the highest NPC, highest quantity of fuel consumed, highest COE, and highest environmental emissions, which is a result of the high quantity of diesel fuel consumed by the DG. Although this configuration is technically feasible, simple, and dispatchable, it is inefficient due to its negative impact on the system economics in terms of NPC, COE, fuel cost, and the environmental pollution associated with it. For Scenario 2 (where DG and WT are used to satisfy the MG), there is a significant reduction in DG runtime, and the quantity of diesel fuel consumed. However, it is characterized by excessive energy wastage due to the non-availability of an energy storage device to store the excess energy generated by the WT during periods of high wind profile. More so, the configuration is also associated with high NPC, COE, and CO2 emissions (though somewhat lower than that of Scenario 1), making it inefficient. Scenario 3 (which combines both DG and PV), has the second highest NPC, COE, quantity of diesel fuel consumed, greenhouse gas emissions, and lacks an energy storage system, which limits its economic performance, making it inefficient. In Scenario 4, WT and BESS are used to meet the demand of the MG. This configuration is advantageous due to the fact that the excess energy generated by the WT during periods of high winds is stored in the BESS which can later be dispatched during calm wind periods, or when the MG's demand exceeds the energy generated by the wind turbine; thus, greatly managing the WT's variability. However, the NPC and COE for this configuration are somewhat high compared to those of Scenarios 2, 5, and 6. Scenario 5 combines both PV and BESS to meet the demand of the MG. Although this configuration is characterized by zero emissions, zero diesel fuel consumption, and low maintenance costs, a large-sized BESS is required to account for the PV's high intermittency, leading to high NPC and COE, thus making the configuration ineffective and inefficient for the hybrid system. Scenario 6, which integrates all four DER components, is considered the optimal DER configuration. In this configuration, the BESS is used to store the excess energy generated by the renewable energy sources during their peak periods and to manage the high variability associated with them, while the DG serves as a backup, generating only when there is a power deficit in the system. This configuration achieved the lowest NPC, COE, quantity of diesel fuel consumption, and greenhouse gas emissions, as shown in Table 4. It combines the reliability of the DG with the cost-effectiveness and environmental benefits of solar and wind, while BESS enables load balancing and further minimizes diesel dependency. The configuration provides the best synergy between renewable energy resources and dispatchable backup, ensuring power availability at all times. Figure 10 shows the optimized size of each DER for the optimal system configuration.
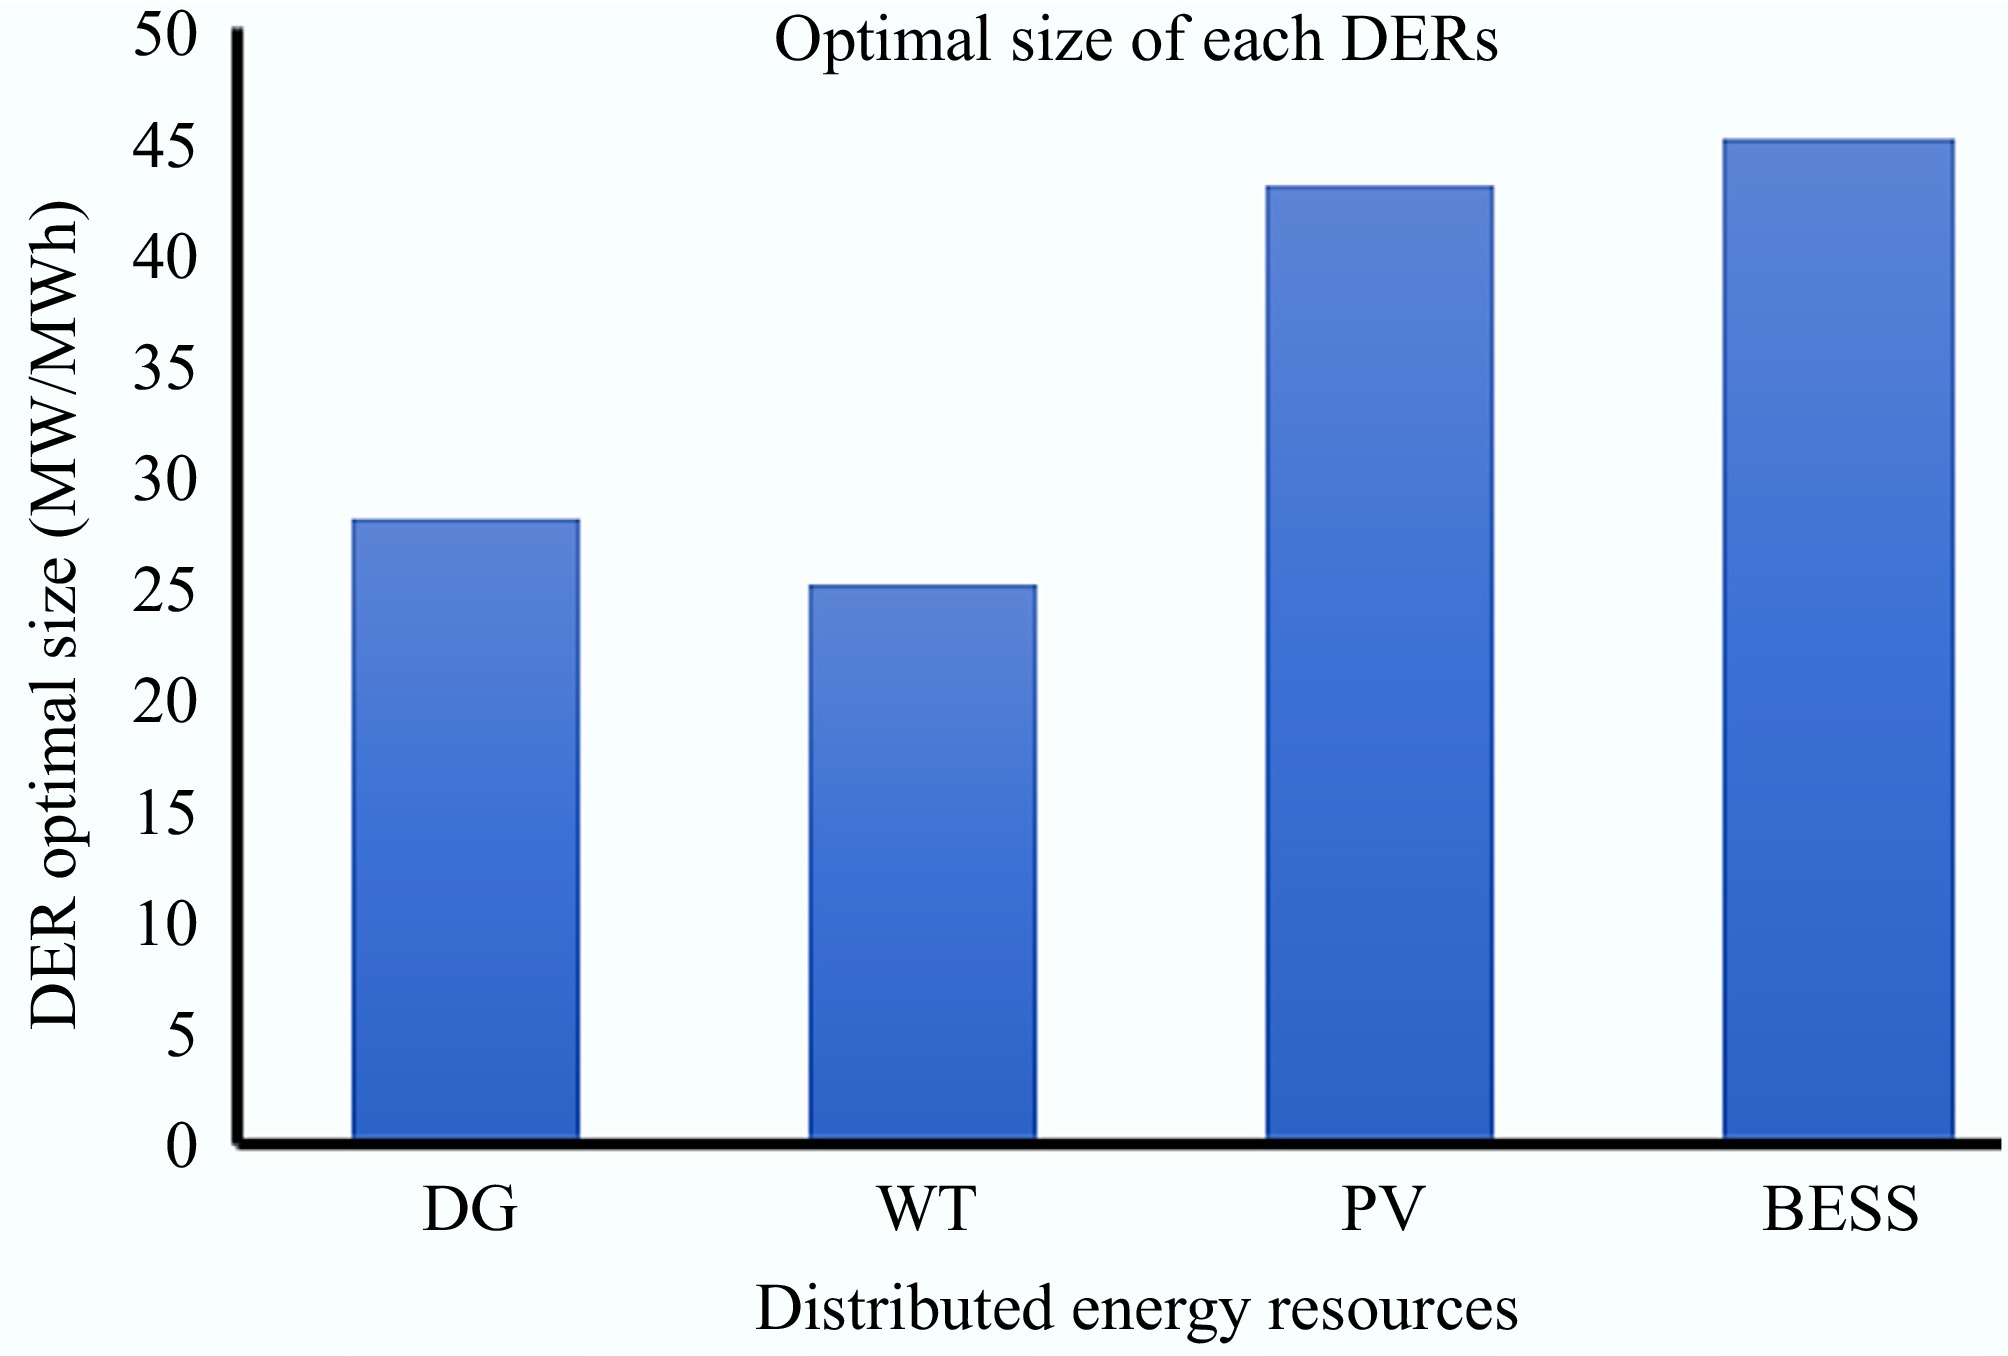
Figure 10.
Optimal size of each DER for the optimum configuration.
Effect of BESS on the MG performance
-
Since the renewable energy resources (WT and PV) suffer high variability, and since the microgrid's demand is fluctuating in nature, the performance of the microgrid is greatly affected by these resources. In this section, the effect of the BESS on the MG performance in terms of quantity of diesel fuel consumed, COE, and quantity of CO2 emitted is analyzed. The quantity of CO2 emitted by each scenario is depicted in Fig. 11.
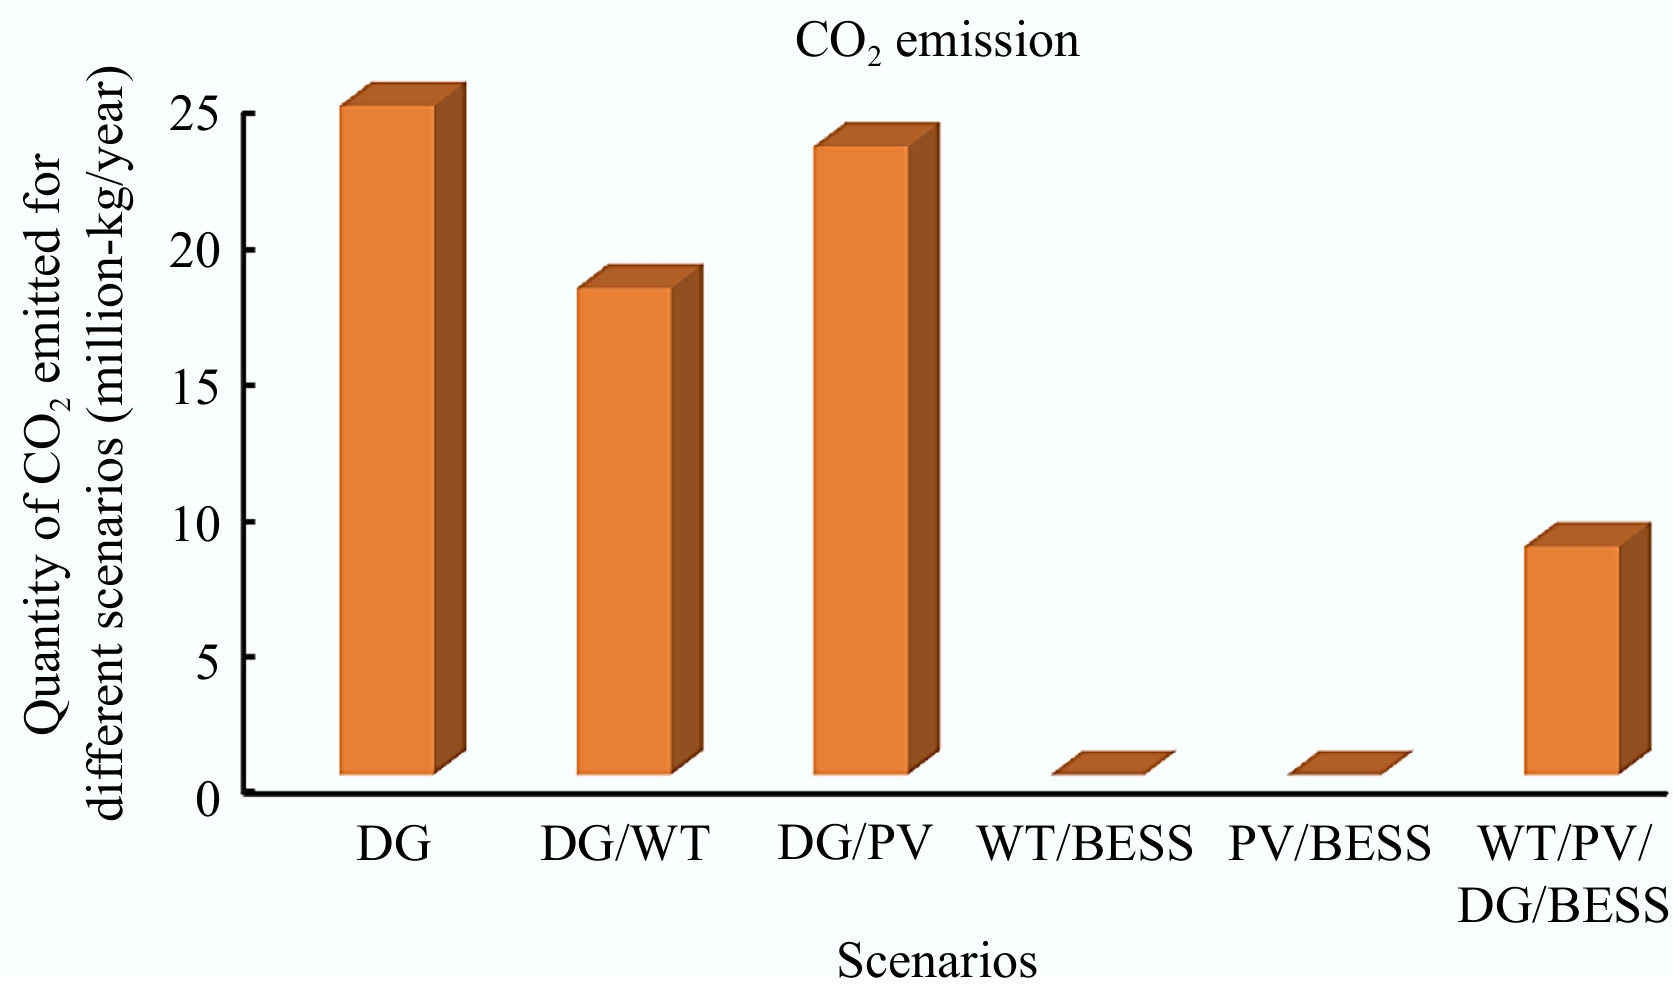
Figure 11.
Quantity of CO2 emitted by the different scenarios.
Figure 11 shows the effect of the BESS on the MG performance in terms of the quantity of CO2 emitted. It is evident from Fig. 11 that there is a significant reduction in the quantity of CO2 emitted for Scenarios 4, 5, and 6 where the BESS was used. In Scenarios 4 and 5, the quantity of CO2 emitted is zero, and for Scenario 6, there is an approximately 80.81% reduction in the quantity of CO2 emitted, which makes these configurations environmentally friendly.
Furthermore, the effect of the BESS on the MG can be viewed in terms of the quantity of fuel consumed. Figure 12 depicts the quantity of diesel fuel usage in the MG for the six different DER configurations. From Fig. 12, it can be concluded that in Scenarios 4 and 5, the quantity of diesel fuel consumed is zero and in Scenario 6, there is a 74.44% reduction in diesel fuel consumed compared to Scenario 1.
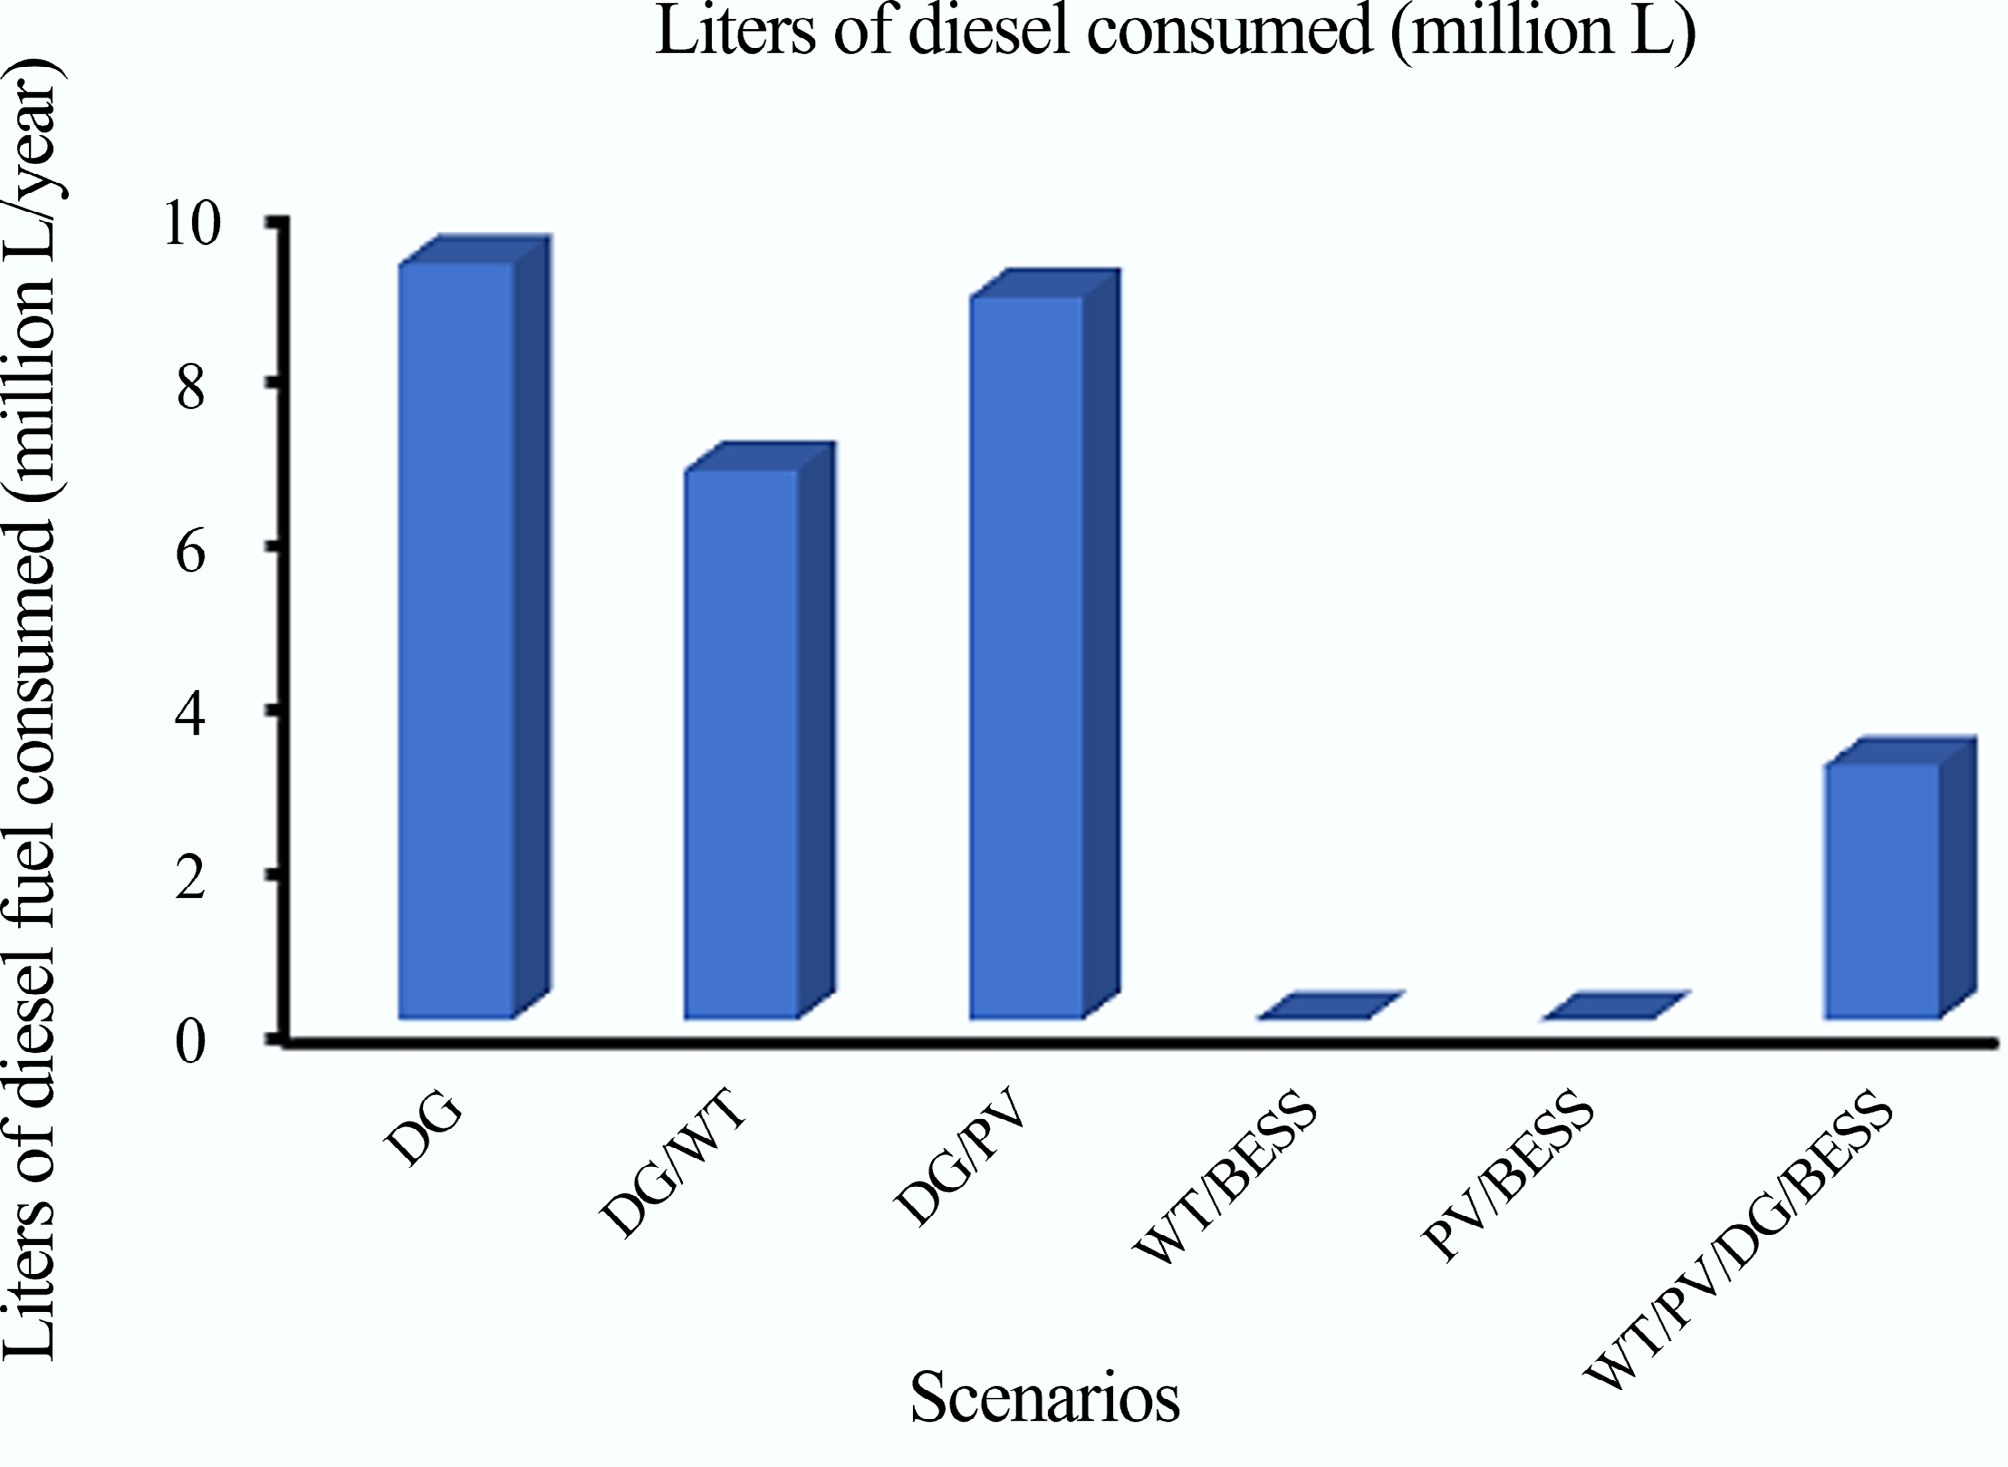
Figure 12.
Fuel consumption under different scenarios.
The cost of energy for the different scenarios is also given in Fig. 13. From Fig. 13, it can be seen that there is a significant reduction in the cost of energy for the scenarios where the BESS is implemented except for the DG/WT configuration. In the optimum configuration, it is evident that there is an approximately 46.34% reduction in the cost of energy compared to Scenario 1.
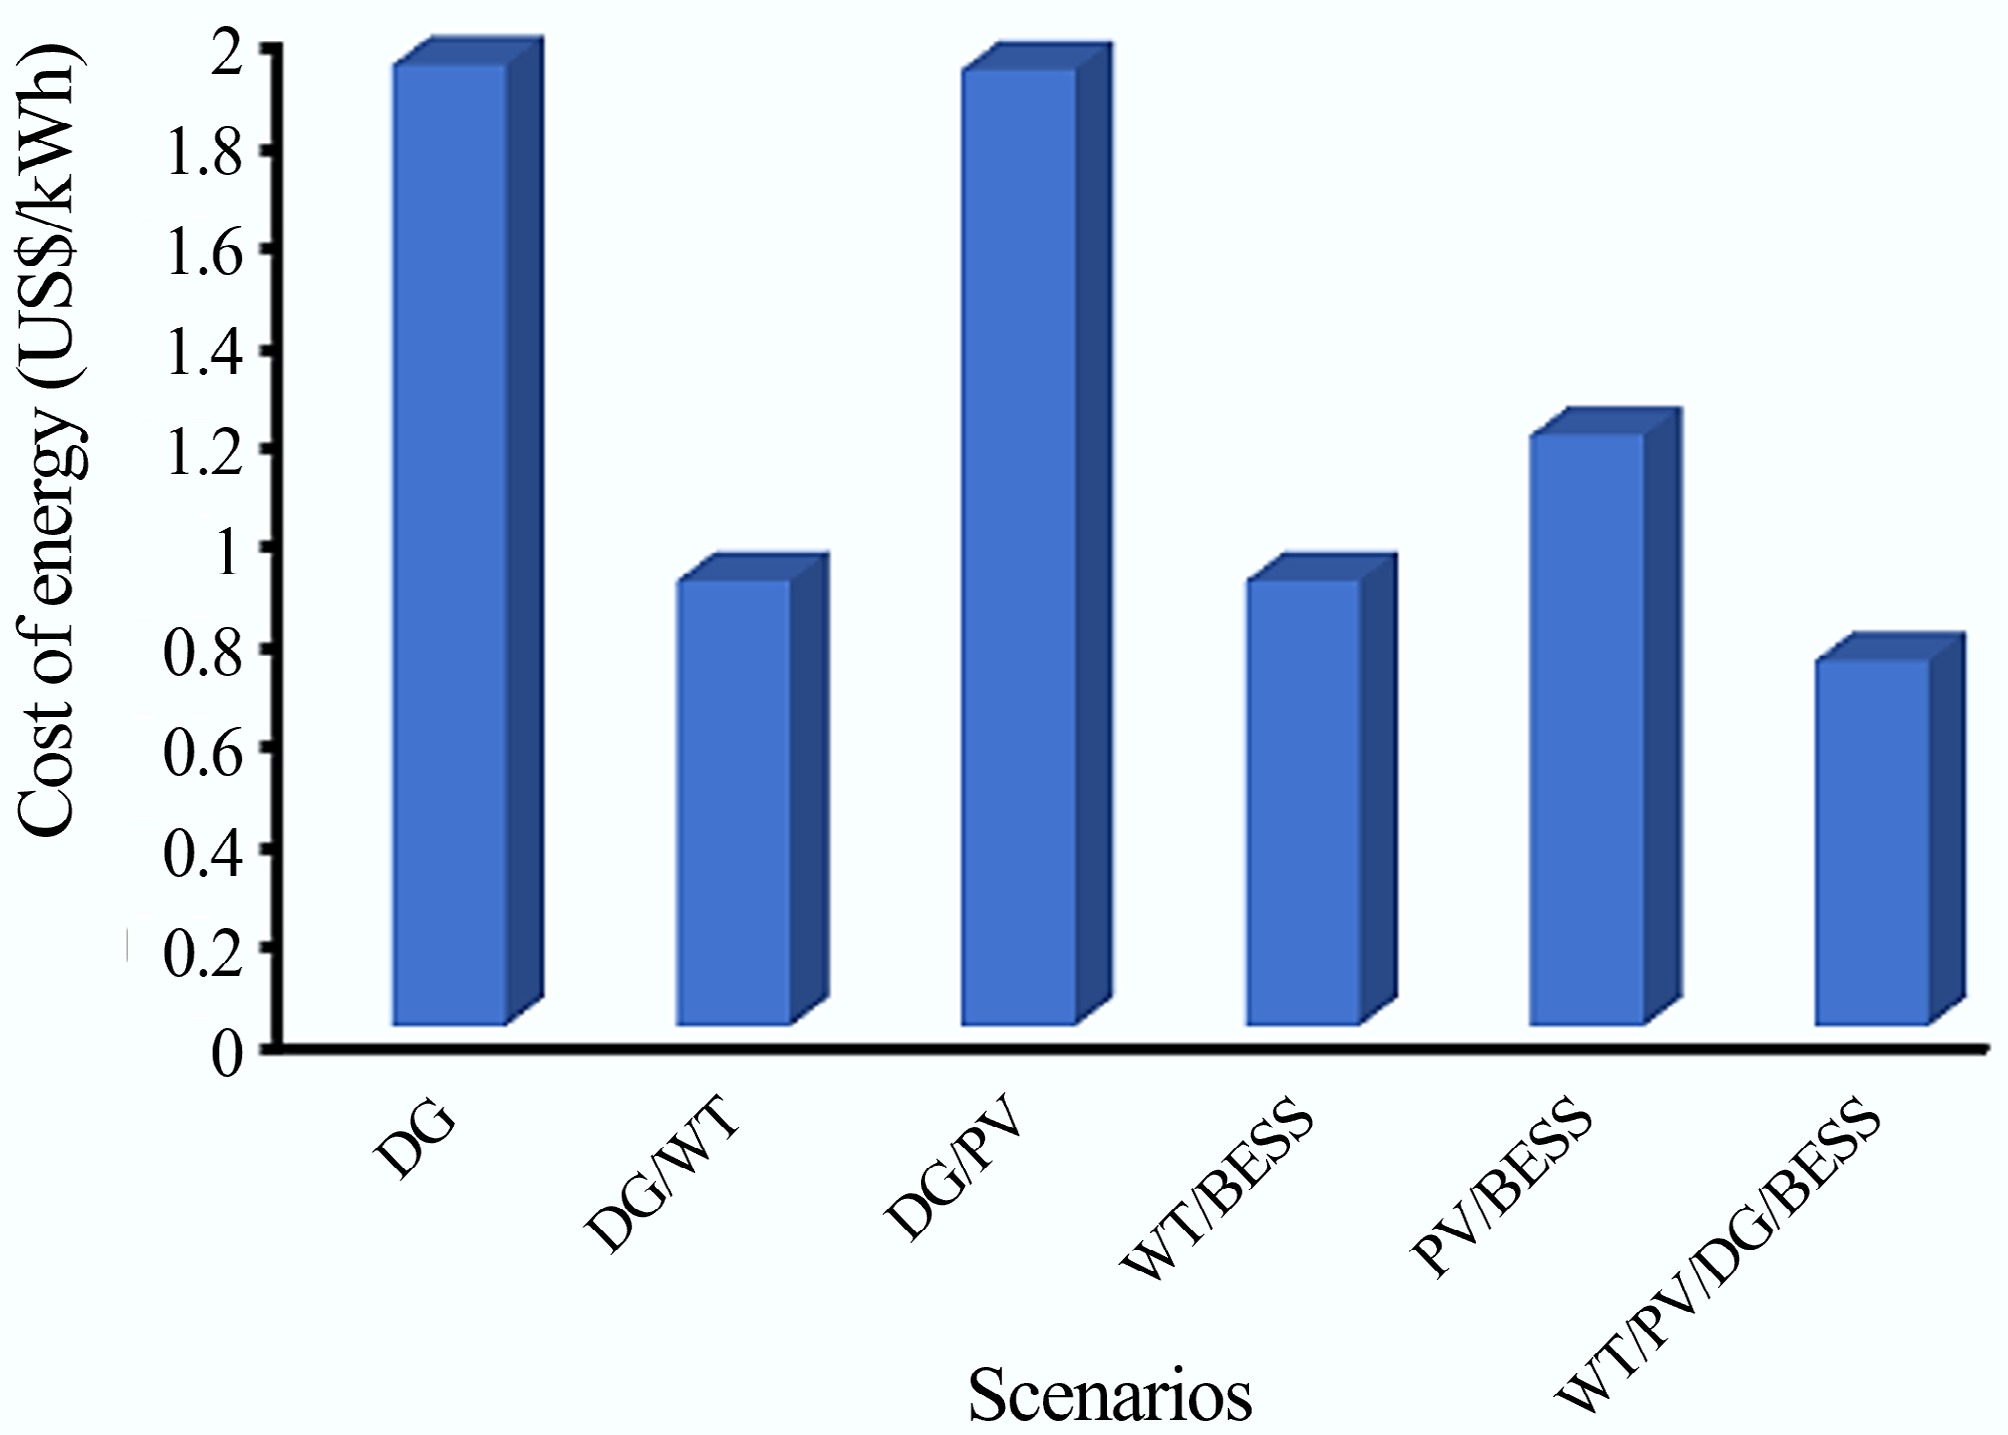
Figure 13.
Cost of energy for the different scenarios.
Effect of the BESS in MG energy management
-
The effect of the BESS on the MG energy management can be studied using Figs 9 and 14. From Fig. 9, it can be seen that during hour 1, 2, 4, 5, 9, 11, 12, 15, 17, and 18, the energy stored in the BESS was dispatched to meet part of the microgrid's demand that the renewable resources were unable to meet, reducing the DG runtime and diesel fuel consumption. In Fig. 14, it is evident that in hour 3, 8, 10, 14, and 16, the surplus energy produced by the renewable energy resources was used to charge the BESS, reducing energy wastage in the microgrid.
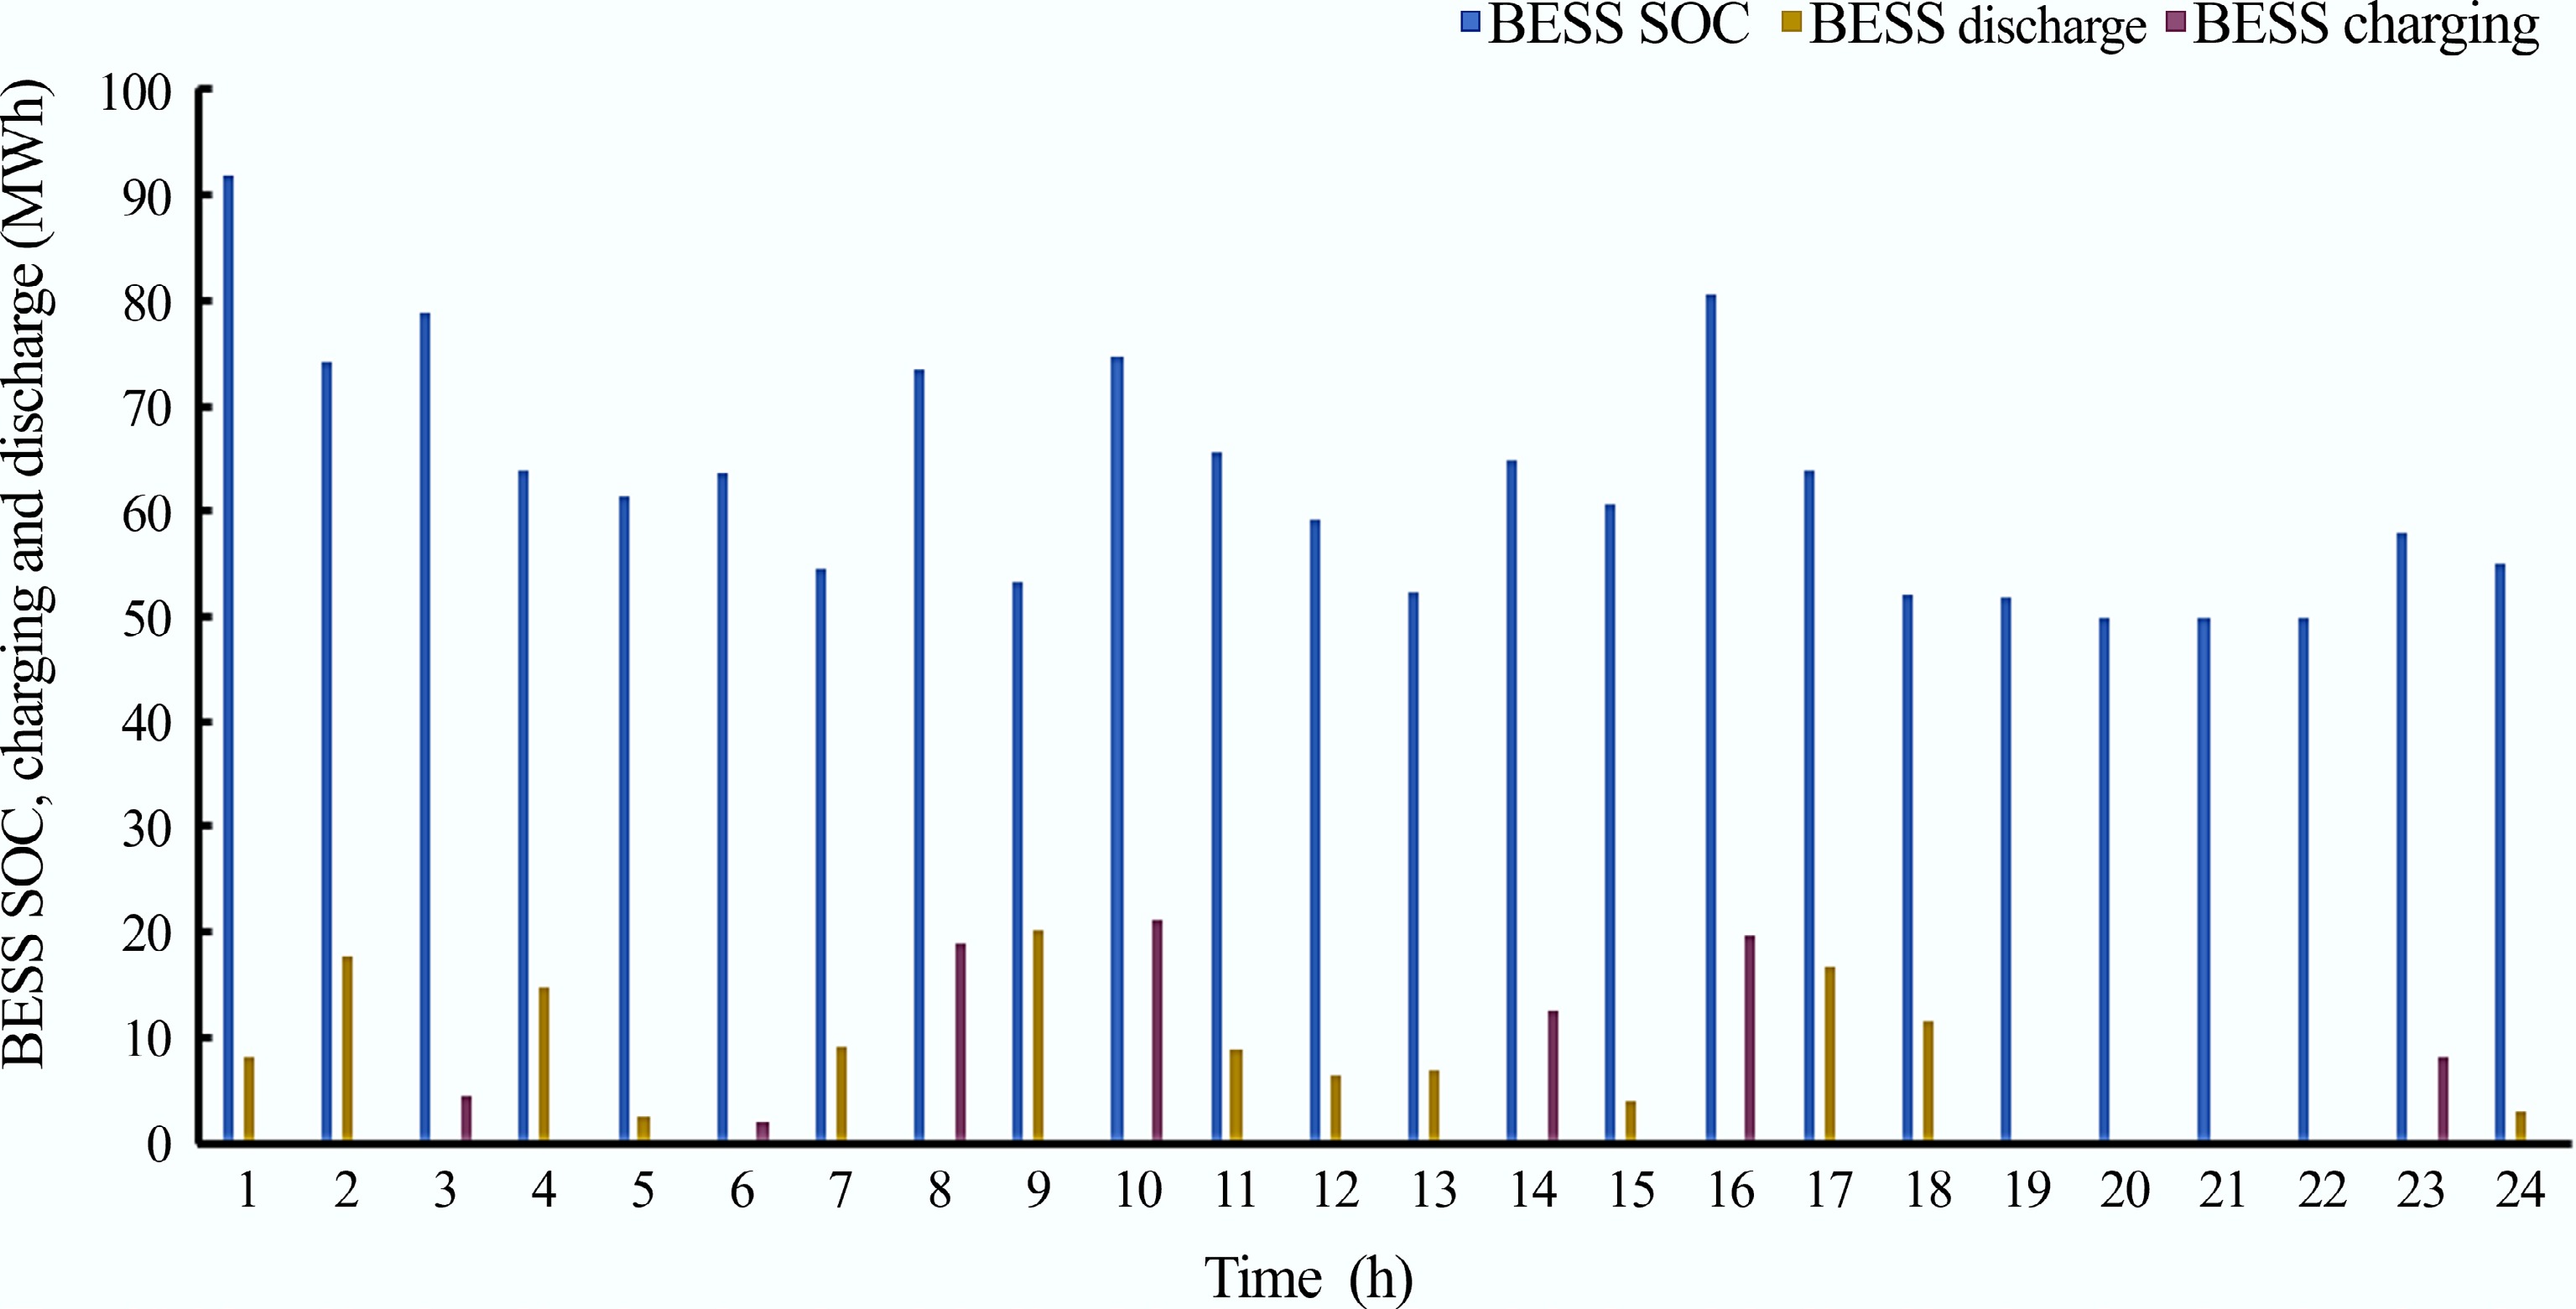
Figure 14.
BESS SoC, charging and discharging (MWh) characteristics.
Performance of the PSO-based algorithm against HOMER
-
The performance of the proposed PSO-based algorithm against the HOMER optimizer was studied using four major criteria: NPC, COE, greenhouse gas emissions, and quantity of diesel fuel consumed. Table 5 gives a detailed comparison of the two algorithms. From Table 5, it can be seen that in terms of NPC, the proposed PSO-based methodology achieved a lower value of US
${\$} $ ${\$} $ ${\$} $ ${\$} $ Table 5. A comparison of the proposed PSO-based methodology against HOMER
Metric PSO HOMER Optimal system PV/WT/DG/BESS PV/WT/DG/BESS NPC US${\$} $85,542,372.16 US${\$} $122,318,750 COE 0.73 0.87 CO2 emission (million kg/yr) 8.4 10.2 Liters of diesel fuel consumed (million L/yr) 2.1 4.2 Computation time Moderately high, depending on iterations Moderately low -
In this study, the optimization and energy management of a hybrid WT/PV/DG/BESS residential microgrid was performed to minimize the total NPC of the system while simultaneously reducing environmental emissions from the MG. The PSO algorithm was used to solve the study's objective function and was implemented using MATLAB software. The proposed methodology achieved reductions of 46.34%, 74.44%, and 80.81% in the COE, quantity of diesel fuel consumed, and CO2 emissions, respectively. A comparison of the results obtained using the proposed PSO-based algorithm with the equivalent results obtained using HOMER simulation platform revealed that the proposed PSO-based algorithm is superior to HOMER in optimizing hybrid MG economics and emissions. It was also found that using the BESS together with other generation resources greatly improves MG performance by reducing diesel fuel consumption, CO2 emissions, COE, and energy wastage.
The authors gratefully acknowledge the management of the University of Ibadan for providing the enabling environment provided to carry out this research.
-
Not applicable.
-
The authors confirm their contributions to the paper as follows: all authors contributed to the study conception and design; the first draft of the manuscript was written by Dickson IJ; supervision, editorial work, review and writing was performed by Ayodele TR and Ogunjuyigbe ASO; literature review, editorial work, review, and writing final draft preparation was done by Olarewaju RO. All authors reviewed the results and approved the final version of the manuscript.
-
The datasets used or analyzed during the current study are available from the corresponding author on reasonable request.
-
The authors did not receive any support from any organization for the submitted work.
-
The authors declare that they have no known competing financial interests or personal relationships that could have appeared to influence the work reported in this paper.
-
Full list of author information is available at the end of the article.
- Copyright: © 2026 by the author(s). Published by Maximum Academic Press, Fayetteville, GA. This article is an open access article distributed under Creative Commons Attribution License (CC BY 4.0), visit https://creativecommons.org/licenses/by/4.0/.
-
About this article
Cite this article
Ayodele TR, Ogunjuyigbe ASO, Dickson IJ, Olarewaju RO. 2026. Optimal energy management of distributed energy resources for a hybrid residential microgrid. Energy & Environment Nexus 2: e012 doi: 10.48130/een-0026-0005 

Optimal energy management of distributed energy resources for a hybrid residential microgrid
- Received: 07 November 2025
- Revised: 03 January 2026
- Accepted: 30 January 2026
- Published online: 10 April 2026
Abstract: In this study, a comprehensive optimization and energy management strategy to minimize the total Net Present Cost (NPC) of a typical hybrid residential microgrid with distributed energy resources (DERs), comprising a Wind Turbine (WT), Solar Photovoltaic (PV) array, Diesel Generator (DG) and a Battery Energy Storage System (BESS) is presented, using a Particle Swarm Optimization (PSO) algorithm. Energy management strategies are developed to optimally schedule the operation of all components, ensuring efficient power supply under variable load and resource conditions. Compared with equivalent results obtained using the HOMER simulation platform, the PSO-based methodology reduced the NPC, cost of energy (COE), quantity of diesel fuel consumed, and CO2 emissions by 12.01%, 16.09%, 50%, and 17.65%, respectively, demonstrating its superiority in optimizing hybrid residential microgrid economics and emissions. Furthermore, implementing the BESS reduced the quantity of diesel fuel consumed, CO2 emissions, and COE by 74.44%, 80.81%, and 46.34%, respectively, which demonstrates the effectiveness of the BESS in enhancing microgrid performance.
-
Key words:
- Energy management /
- HOMER /
- PSO /
- BESS /
- Renewable energy