


-
The high organic matter content of food waste (FW) makes it a suitable substrate for methane production via anaerobic digestion (AD)[1−4]. To overcome the rate-limiting hydrolysis step in AD, hydrothermal pretreatment can be applied to FW, thereby disrupting the macromolecular structure of organic matter in advance and shortening the AD cycle[5−7]. However, although high hydrothermal temperatures can enhance the hydrolysis of organic matter, they lead to a significant reduction in subsequent methane yield. This phenomenon is generally attributed to the fact that Maillard reaction products (melanoidins) can inhibit the methanogenic potential of FW during AD[8−11]. Therefore, an in-depth investigation into the formation and biological effects of melanoidins is of great significance for optimizing the integrated hydrothermal pretreatment-AD process of FW.
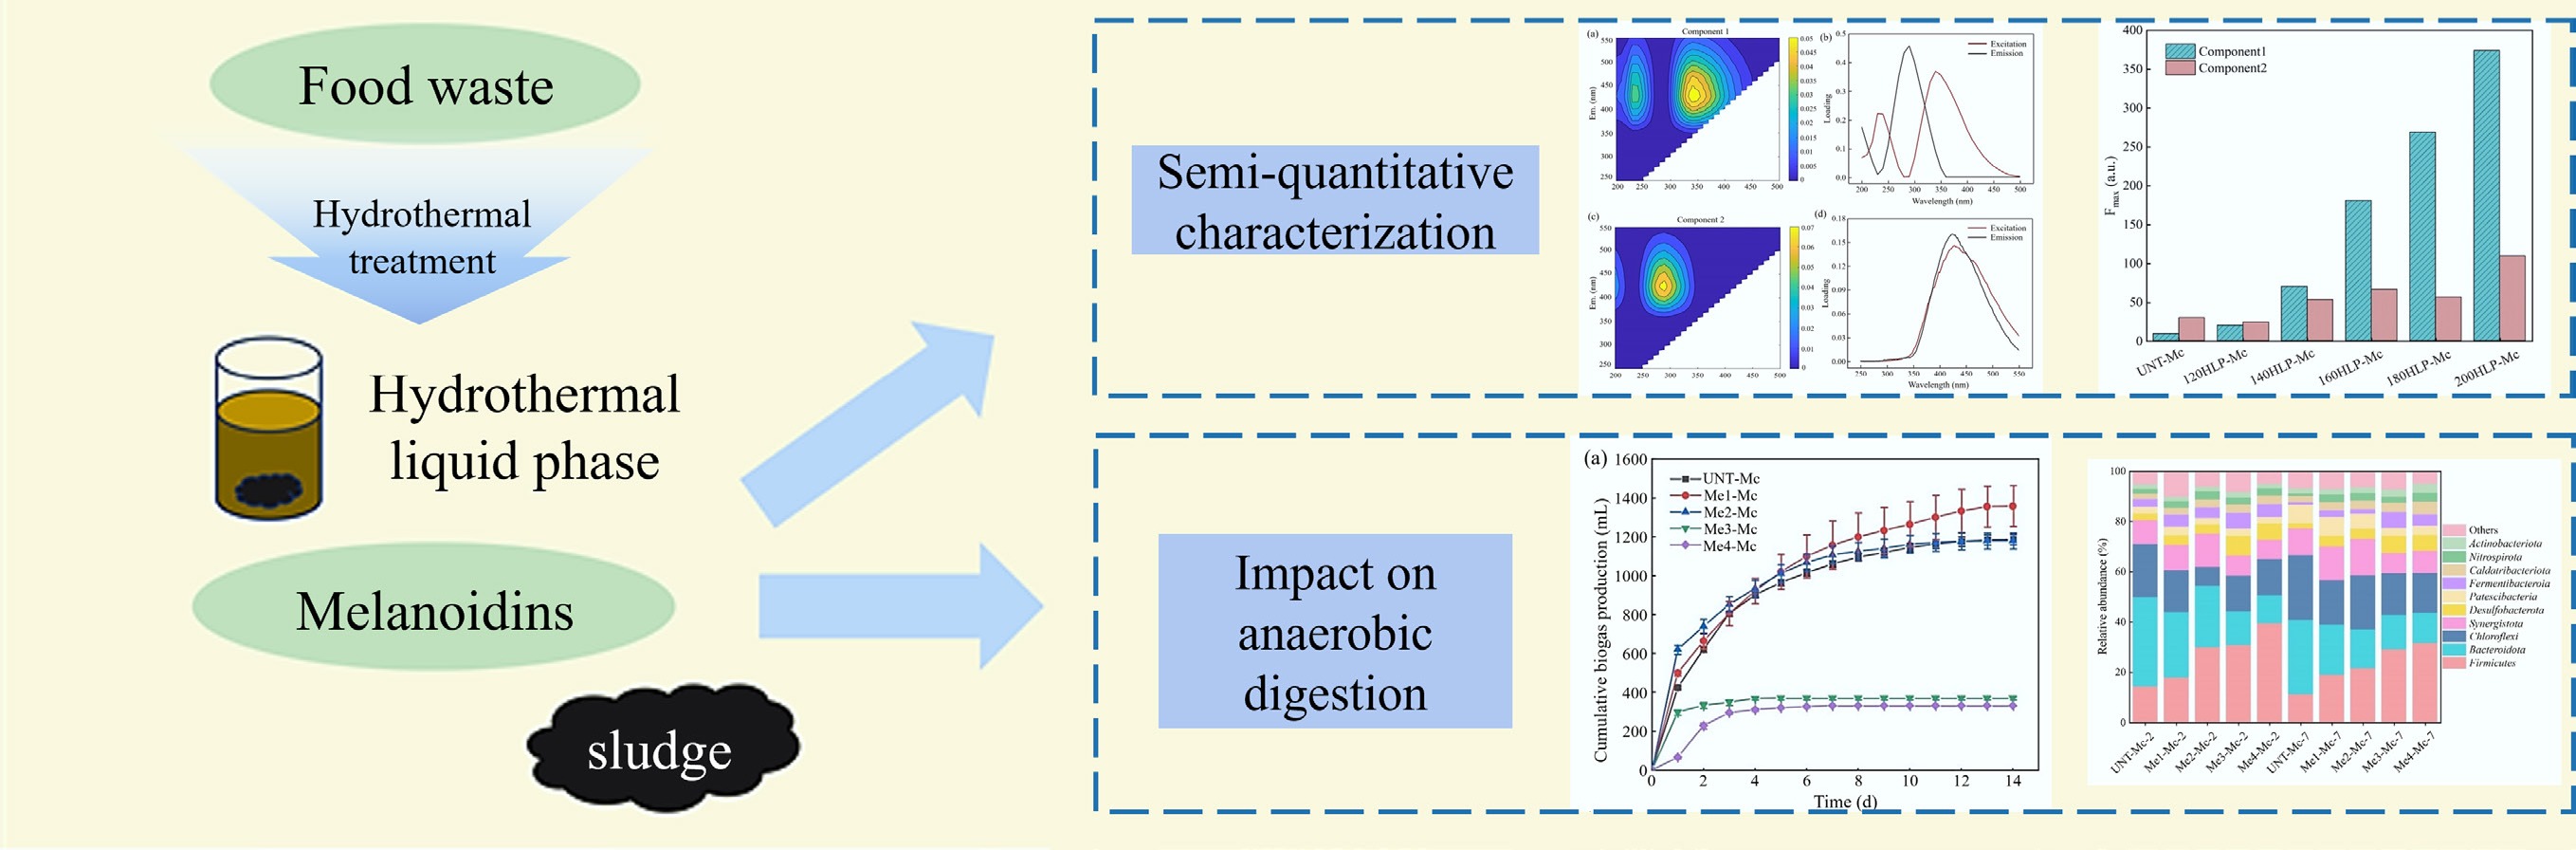
Melanoidins are heterogeneous macromolecular mixtures formed in the final stage of the Maillard reaction. Their intricate formation mechanisms and inherent heterogeneity have resulted in a lack of standard reference compounds, and their isolation and purification remain challenging. Therefore, establishing a reliable semi-quantitative method is crucial for investigating the effects of melanoidins on AD[12,13]. Existing studies mainly adopt indirect chemical parameters (such as color[14], chemical oxygen demand (COD), and the ratios of dissolved organic carbon (DOC) to dissolved organic nitrogen (DON)[1]) and spectroscopic approaches for the semi-quantitative analysis of melanoidins. The ultraviolet-visible (UV-Vis) spectroscopy method employs SUVA254 to characterize the relative content of melanoidins[15]. SUVA254 measures the ratio of ultraviolet absorbance at 254 nm (Abs254) to the concentration of DOC in water[16]. A higher SUVA254 value signifies a greater proportion of aromatic or unsaturated bonds in organic matter. Fluorescence excitation-emission matrix (EEM) spectroscopy allows for qualitative characterization of dissolved organic matter[17]. To further realize semi-quantitative analysis, the fluorescence regional integration (FRI) method or parallel factor analysis (PARAFAC) is commonly used to integrate the area under the fluorescence spectrum[17]. Among these techniques, PARAFAC is particularly suitable for analyzing the fluorescence spectra of complex systems containing multiple fluorescent substances, effectively addressing spectral overlap issues and revealing the composition and concentration of fluorescent components in samples[18].
The effect of melanoidins on AD exhibits a complex dose-dependent pattern. Most studies have demonstrated that high-dose melanoidins exert an inhibitory effect on acid and gas production during AD[8,19−21]. For instance, Wang et al.[20] discovered that melanoidins mainly consist of nitrogen-containing and humic acid-like refractory organic compounds, and their formation at temperatures above 160 °C notably reduces methane production (by 49.1%–89.8%). This occurs because they inhibit the activity of proteases, acid-producing bacteria, and acetoclastic methanogens. However, the effects of low-dose melanoidins remain inconsistent; several studies have observed that low doses exert no significant impact on acidogenesis or even promote acid production over the short term. Yin et al.[9] reported that low-dose melanoidins had no notable effect on volatile fatty acid (VFA) production, whereas high doses inhibited the solubilization and degradation of proteins. Additionally, melanoidins can further affect the performance of AD by altering the structure of microbial communities[19,22,23], and shifts in dominant microbial populations play a decisive role in the substrate decomposition and biogas quality.
At present, research on characterizing the effect of temperature on melanoidin formation during hydrothermal processes via semi-quantitative methods remains inadequate. Meanwhile, the impact of melanoidin dosage on AD and its inhibitory effect on microbial communities still requires further in-depth investigation. To address these knowledge gaps, this study employs semi-quantitative approaches to explore the formation characteristics of melanoidins under different hydrothermal temperatures. By setting up a gradient of melanoidin dosage, this study further investigates the inhibitory effect of melanoidins on the methane production potential of FW, and additionally elucidates the influence of melanoidins' introduction on the community structures of bacteria and archaea during AD. The findings of this study are expected to provide a theoretical basis for the regulation of the melanoidins and the optimization of hydrothermal coupling AD processes in the resource utilization of FW, thereby improving the overall efficiency of energy recovery.
-
To avoid potential interference from complex components (e.g., salts, oils) present in real FW during melanoidin-related experiments, this study employed simulated FW as the feedstock. The composition was formulated based on the per capita consumption of major food items published by the National Bureau of Statistics of China (Table 1[24]), consisting of 35% cooked rice, 20% pork, and 45% cabbage (mass fractions based on volatile solids [VS]). After preparation, the feedstock was stored at –20 °C until use, and transferred to a 4 °C refrigerator prior to experiments.
Table 1. Nationwide per capita consumption of major foods (kg)
Category Indicator Data Total Starchy substances Cereals 120.60 134.40
(~35%)Tubers 2.80 Legumes 10.90 Protein substances Meat 39.80 80.40
(~20%)Poultry 12.40 Eggs 15.00 Dairy products 13.20 Cellulosic substances Vegetables and edible fungi 113.60 174.40
(~45%)Fruits 60.80 The inoculum sludge was collected from an anaerobic reactor at a sewage treatment plant operated by Shandong Liboyuan Environmental Protection Materials Co., Ltd in Zibo City, Shandong Province, China. The main parameters of the sludge included a total solids (TS) content of 16.65%, a VS content of 15.28%, and a pH of 7.25. After 7 d of static storage, the sludge's methane production capacity was 7.63 mL CH4·g−1 VS. This baseline methane production was subtracted from the total gas yield in all subsequent batch experiments to isolate the methane attributable solely to the added substrates.
Hydrothermal treatment and AD
-
In this study, a temperature gradient experiment (120, 140, 160, 180, and 200 °C) was designed to systematically investigate the effect of hydrothermal temperature on organic matter transformation and melanoidins formation during FW treatment. The selected temperature range covers the typical key intervals for melanoidins generation to examine their potential transformation behavior[17].
Hydrothermal treatment was conducted using a multi-functional reactor (YZ500, Shanghai Yanzheng Experimental Instrument Co., Ltd, Shanghai, China). The process involved placing an appropriate amount of FW into a 500 mL quartz crucible, which was then inserted into the reactor. To create an inert atmosphere, the reactor was purged with Ar three times, each cycle lasting 3 min. The mixture was heated to target temperatures (120, 140, 160, 180, and 200 °C), held at each temperature for 1 h, then cooled naturally to room temperature. Reactor parameters included magnetic stirring at 300 RPM, maintaining a temperature deviation of ± 2 °C during the holding time, and self-tuning the PID settings to adjust for temperature rise before starting the experiment. The hydrothermal products were filtered through a 0.45 μm filter to extract the hydrothermal liquid product (HLP). Samples were labeled according to the format Temperature-Product-Component. For example, '160HLP-Mc' indicated the liquid-phase product from the hydrothermal process of FW at 160 °C in this study.
The AD experiment employed a MultiTalent automatic methane potential test system (Nova Skantek Co. Ltd, Beijing, China). The total volume of the experimental fermenter was 500 mL, with a working volume of 250 mL maintained to allow sufficient headspace for gas collection. Magnetic stirring was employed during the experiment, and the water bath temperature was maintained at 37 °C. The procedure involved mixing FW and sludge at a ratio of 1:5 based on VS. The pH was adjusted to between 6.8 and 7.2 using 5 mol·L−1 NaOH and 5 mol·L−1 H2SO4, and nitrogen gas (N2) was purged for 10 min to create an anaerobic environment. The biogas produced passed through a CO2 absorption device containing a 3 mol·L−1 NaOH solution mixed with 0.4% thymolphthalein before entering the micro gas measurement unit. The methane content was analyzed using a gas chromatograph (GC, Agilent 990). The experimental fermentation period lasted 14 d.
Melanoidins experiment
-
Samples for microbial analysis were collected from the anaerobic fermenters. Specifically, 5 mL of biogas slurry was sampled on days 2 and 7, transferred into centrifuge tubes, and immediately flash-frozen in liquid nitrogen for storage prior to analysis. The samples were labeled following the naming convention: melanoidins dosage–component–sampling time. For example, Me3-Mc-2 represents the sample taken on day 2 from the experimental group receiving 75 mL of melanoidin solution in the mixed food-waste fraction, while UNT-Mc-7 denotes the control group (without melanoidin addition) sampled on day 7.
Preparation of melanoidins
-
Based on the protocols described in published literature[25,26], this study prepared melanoidins using the self-prepared FW as a raw material matrix. A total of 325 g of FW (moisture content: ~90%) was subjected to hydrothermal treatment at 180 °C. The hydrothermal liquid was filtered, and proteins were removed using Sevage solution (chloroform : 1-butanol = 4:1, v/v). This process was repeated three to four times until no noticeable solid residue remained in the middle layer. Then, dialysis was performed with a dialysis bag (1,000 Da), and pure water was replaced every 6–8 h over 48 h. This step was repeated three times. After mixing (a volume of approximately 250 mL), the soluble chemical oxygen demand (SCOD) of the melanoidins liquid phase was determined to be 20.80 ± 0.08 g·L−1.
180 °C represents a typical thermal severity for the hydrothermal pretreatment of organic solid wastes, promoting intense Maillard reactions to yield a representative profile of melanoidins[27,28]. Furthermore, because food-derived melanoidins are highly complex, heterogeneous biopolymers whose specific cross-linked structures are highly dependent on formation conditions[26], utilizing a single, standardized preparation temperature prevents the introduction of structural variations.
Dosage design of melanoidins
-
To investigate the effects of melanoidins on the AD of FW, this study added melanoidins at multiple levels relative to the FW volume (approximately 25 mL). The additions were 1× (25 mL, 2.08 mg·mL−1, SCOD), 2× (50 mL, 4.16 mg·mL−1), 3× (75 mL, 6.24 mg·mL−1), and 4× (100 mL, 8.32 mg·mL−1). Each sample was labeled following the format 'Melanoidins Addition Multiple-Component'. For example, 'Me3-Mc' and 'UNT-Mc' represented the experimental group with 75 mL of melanoidin solution added to the FW mixture, and the control group without melanoidins, respectively.
Semi-quantitative characterization of melanoidins
-
Given the complex formation mechanism of melanoidins, there is currently no standard model compound available for their absolute quantification. Therefore, this study adopted ultraviolet-visible (UV-Vis) absorption spectroscopy and fluorescence spectroscopy for semi-quantitative characterization, and applied parallel factor analysis (PARAFAC) to resolve the fluorescent components.
The absorbance was measured using a UV-Vis spectrophotometer (UV3200S, Shanghai Jingke Industrial Co., Ltd, Shanghai, China). Fluorescence measurements were performed on a fluorescence spectrophotometer (Cary Eclipse, Varian Instruments Inc., USA) with the following parameters: excitation scanning range of 200–500 nm, emission scanning range of 250–550 nm, scanning speed of 1,200 nm·min−1, and data interval of 2 nm. PARAFAC was employed to analyze and quantify the fluorescence characteristics and contributions of each component in the system. The analysis was implemented on the MATLAB platform with the aid of the DOMFluor toolbox, which served to identify and quantify the relative contributions of the major fluorescent components.
The maximum fluorescence intensity of components obtained by PARAFAC and the calculated spectral parameters (e.g., SUVA254) reflected the relative content differences of melanoidin components among different treatment groups. Due to the lack of melanoidin standard reference materials and corresponding absolute quantitative calibration curves, this analysis was classified as semi-quantitative, and the obtained values did not represent the absolute mass concentrations of the target compounds.
Microbial diversity analysis
Total DNA extraction from microbiome
-
Total genomic DNA samples were extracted using the OMEGA Soil DNA Kit (M5635-02, Omega Bio-Tek, Norcross, GA, USA) following the manufacturer's instructions and stored at −20 °C for future use. A NanoDrop NC2000 spectrophotometer (Thermo Fisher Scientific, Waltham, MA, USA) and agarose gel electrophoresis were employed to assess the quantity and quality of the extracted DNA.
PCR amplification and sequencing of target fragments
-
PCR amplification of the V3–V4 region of the bacterial 16S rRNA gene was carried out using forward primers (ACTCCTACGGGAGGCAGCA) and reverse primers (GGACTACHVGGGTWTCTAAT). Sample-specific barcodes were incorporated into the primers for multiplex sequencing. Additionally, PCR amplification of the V4–V5 region of the archaeal 16S rRNA gene was performed using forward primers (GTGCCAGCMGCCGCGGTAA) and reverse primers (CCGTCAATTCMTTTRAGTTT). The PCR mix included 5 μL of 5× buffer, 0.25 μL of Fast pfu DNA polymerase (5 U·μL−1), 2 μL of dNTPs (2.5 mM), 1 μL each of forward and reverse primers (10 μM), 1 μL of DNA template, and 14.75 μL of ddH2O. The thermal program involved an initial denaturation at 98 °C for 5 min, followed by 25 cycles of denaturation at 98 °C for 30 s, annealing at 53 °C for 30 s, and extension at 72 °C for 45 s, ending with a final extension of 5 min. PCR products were purified using Vazyme VAHTSTM DNA Clean Beads (Vazyme, Nanjing, China), quantified fluorometrically with the Quant-iT PicoGreen dsDNA Assay Kit (Invitrogen, Carlsbad, CA, USA), and equal amounts of amplicons were pooled. The sequencing library was prepared using the Illumina TruSeq Nano DNA LT Library Prep Kit. Final fragment size selection and purification were performed on the library. Qualified libraries, featuring non-repetitive index sequences, were serially diluted and mixed in appropriate proportions according to the desired sequencing volume. The sequencing range was 200–450 bp, and sequencing was performed on the instrument.
Other analysis
-
The pH value was measured with a pen-type pH meter (ASONE, AS600). The SCOD was determined using a Hach DR 5000 spectrometer (Hach, Loveland, CO, USA).
-
DOC mainly originates from humus within dissolved organic matter (DOM) and is commonly used to evaluate the level of organic pollution in water bodies. In this study, DOC resulted from the breakdown of FW during hydrothermal processes, and variations in its value can indicate the concentration of organic matter in the HLP. As shown in Fig. 1a, in the hydrothermal temperature range (120–200 °C), DOC content increased and then decreased, reaching 36.98 g·L−1 at 160 °C. This indicates that as the temperature rose to 160 °C, macromolecular organic matter such as starch and proteins underwent hydrolysis, producing oligosaccharides, monosaccharides, amino acids[29,30], and other soluble products that entered the liquid phase, leading to an increase in DOC. However, when the temperature further increased to 180–200 °C, the DOC concentration decreased sharply. This was mainly because high temperatures promoted polymerization and condensation reactions among the dissolved organic compounds, forming large molecular polymers. These polymers exhibited low solubility and, upon reaching supersaturation, precipitated from the liquid phase through nucleation, growth, and agglomeration, ultimately forming macroscopic hydrochar particles. This transformation process transferred a substantial amount of organic carbon from the liquid to the solid phase, directly causing the observed decrease in DOC. According to the study by Yang et al.[31], under hydrothermal conditions at 200 °C, highly reactive intermediates such as 5-HMF can participate in polymerization reactions, such as aldol condensation[32], to form larger molecular products.
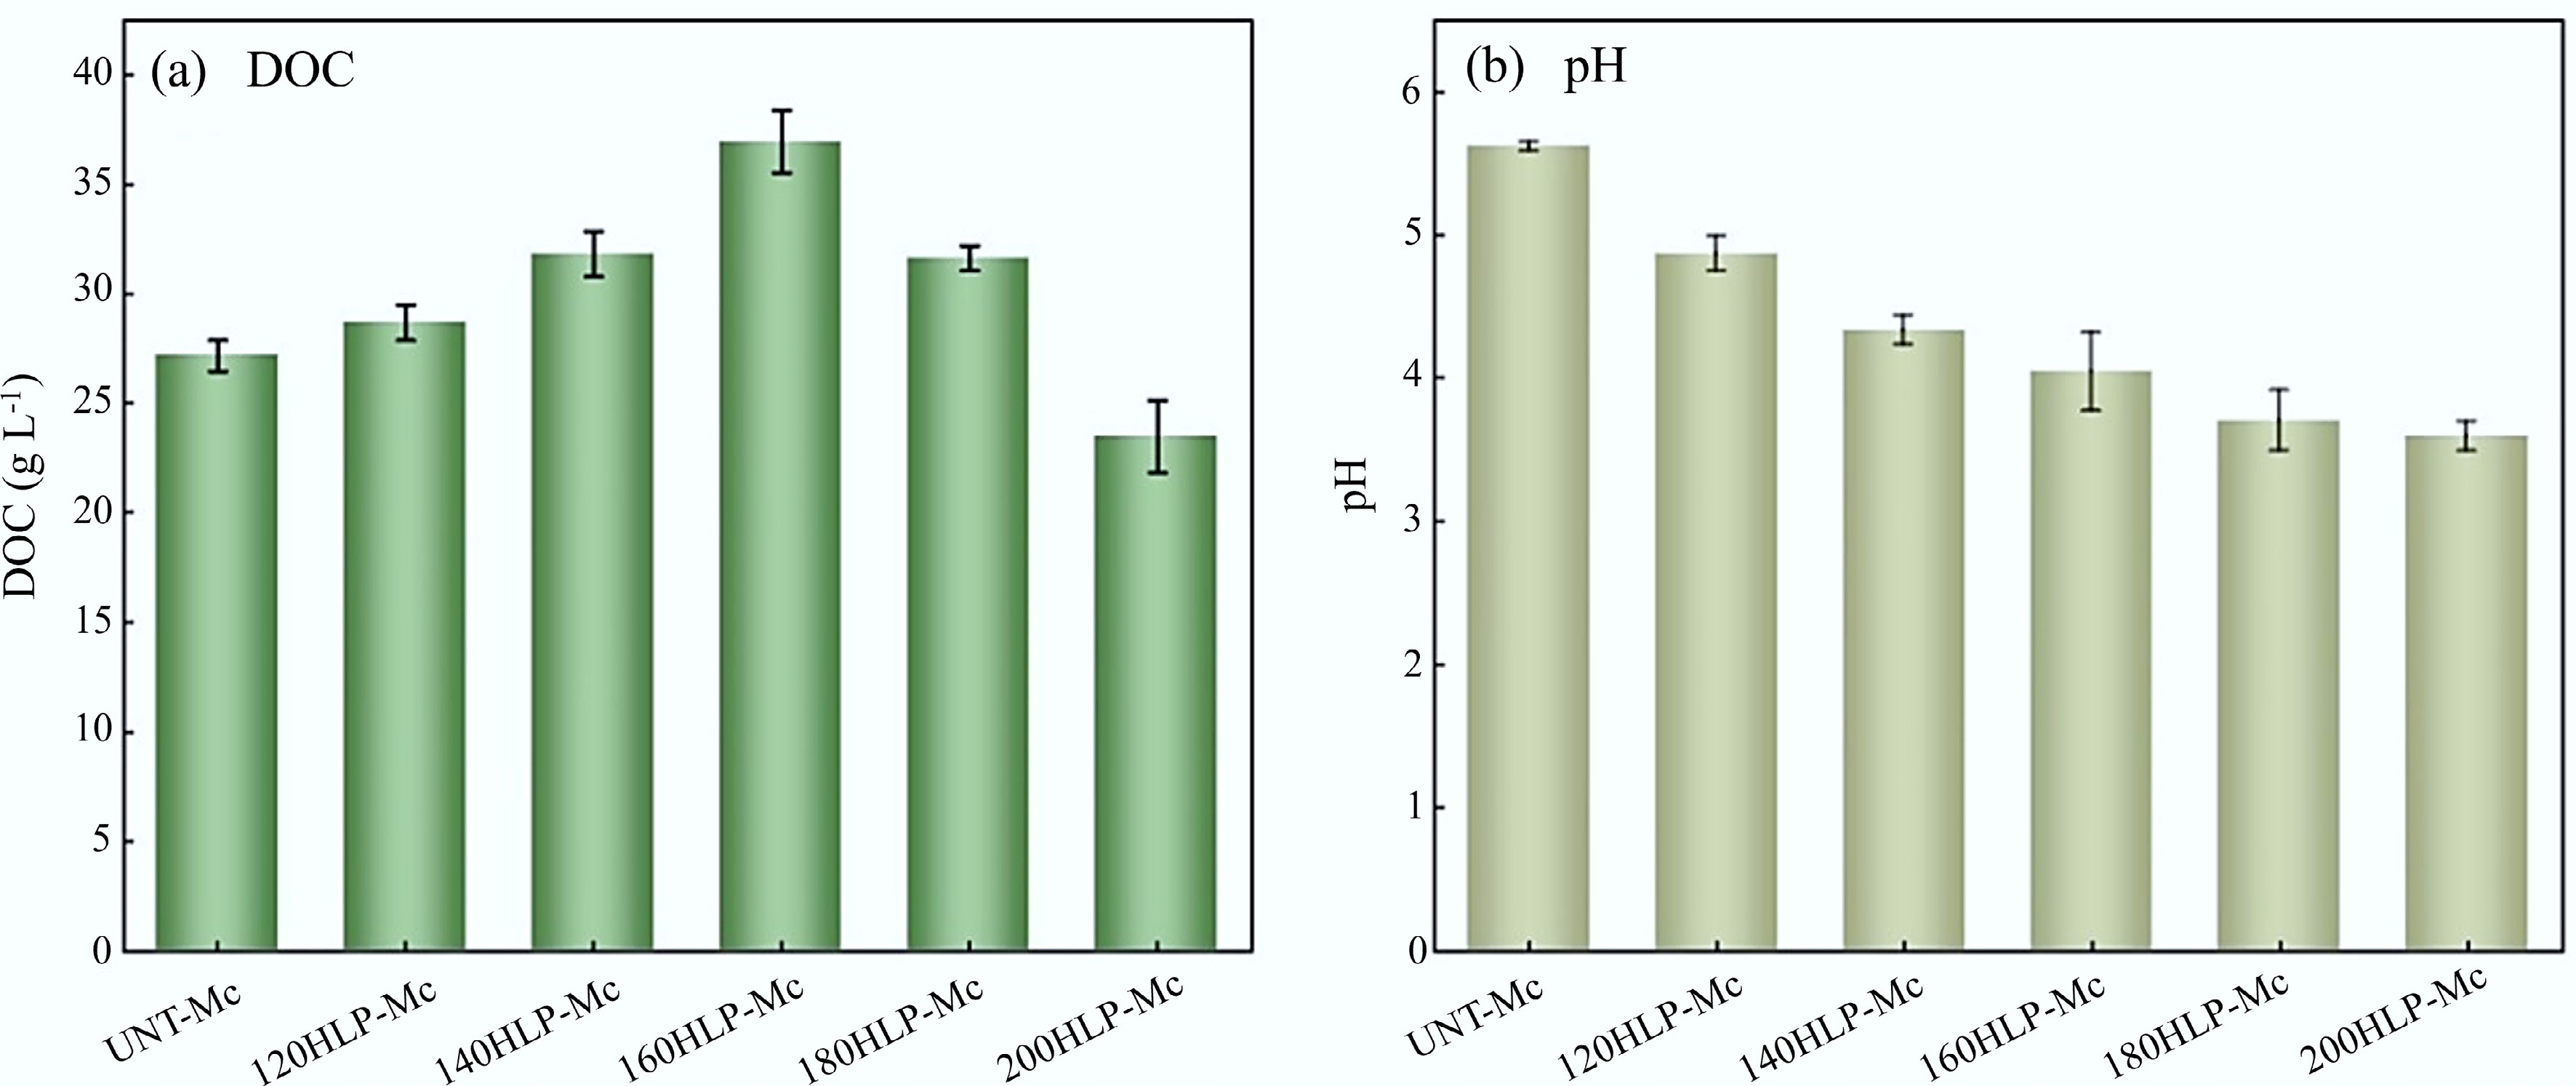
Figure 1.
Changes of DOC and pH in the HLP of FW.
During the hydrothermal process of FW, its macromolecular components (e.g., polysaccharides, proteins) first underwent hydrolysis: chemical bonds cleaved, generating small-molecule intermediates[30]. These intermediates further reacted with water to form compounds bearing acidic functional groups (e.g., carboxyl, carbonyl). Among them, short-chain organic acids (formic acid, acetic acid, lactic acid, etc.) dissolved into the liquid phase, causing system acidification[33,34]. As shown in Fig. 1b, the pH of the hydrothermal products decreased as the temperature increased, dropping from 5.62 to 3.59. This indicates that higher hydrothermal temperatures promote the hydrolysis of organic matter and subsequent acidification. Under subcritical conditions, the self-ionized hydrogen ions of water intensified the hydrolysis of refractory organic matter in FW, and the acids formed caused a continuous decrease in the system's pH.
The absorption parameters of the HLP obtained from the UV-Vis absorption spectrum are shown in Fig. 2. The color intensity of melanoidins is correlated with the conjugated double bonds in their molecular structures[16]. SUVA254 is derived from the ratio of ultraviolet absorbance at 254 nm (Abs254) to DOC and serves as a quantitative index for the unsaturated bonds and aromaticity of dissolved organic matter[35]. Therefore, it can effectively characterize the relative content of melanoidins[15]. As shown in Fig. 2a, the hydrothermal temperature significantly affected the value of SUVA254. When the temperature exceeded 140 °C, SUVA254 increased markedly, indicating a notable rise in melanoidin content during hydrothermal treatment of FW at temperatures of 140 °C or higher. Additionally, it has been demonstrated[36] that when SUVA254 > 4 L·(mg·m)−1, the DOM is mainly composed of hydrophobic substances, such as aromatic compounds; when SUVA254 < 3 L·(mg·m)−1, the DOM predominantly consists of hydrophilic substances. In the FW hydrothermal system, when the temperature was below 140 °C, SUVA254 ranged from 0.81 to 2.35 L·(mg·m)−1; at temperatures between 160 and 200 °C, it varied from 4.69 to 10.49 L·(mg·m)−1. This suggested that higher temperatures increased the aromaticity of the system. The absorbance at 350 nm (denoted as a350) reflects the light absorption capacity of organic matter in the solution. This corresponds to melanoidins absorbing photons at longer wavelengths through various transitions, resulting in a brown coloration. The colored property of melanoidins relates to their molecular weight and structure, with higher molecular weight or conjugated structures enhancing light absorption at longer wavelengths. Figure 2b shows that a350 increased with rising hydrothermal temperature, which was attributed to promoting melanoidins formation at higher temperatures. This effect became more pronounced when the temperature exceeded 140 °C.
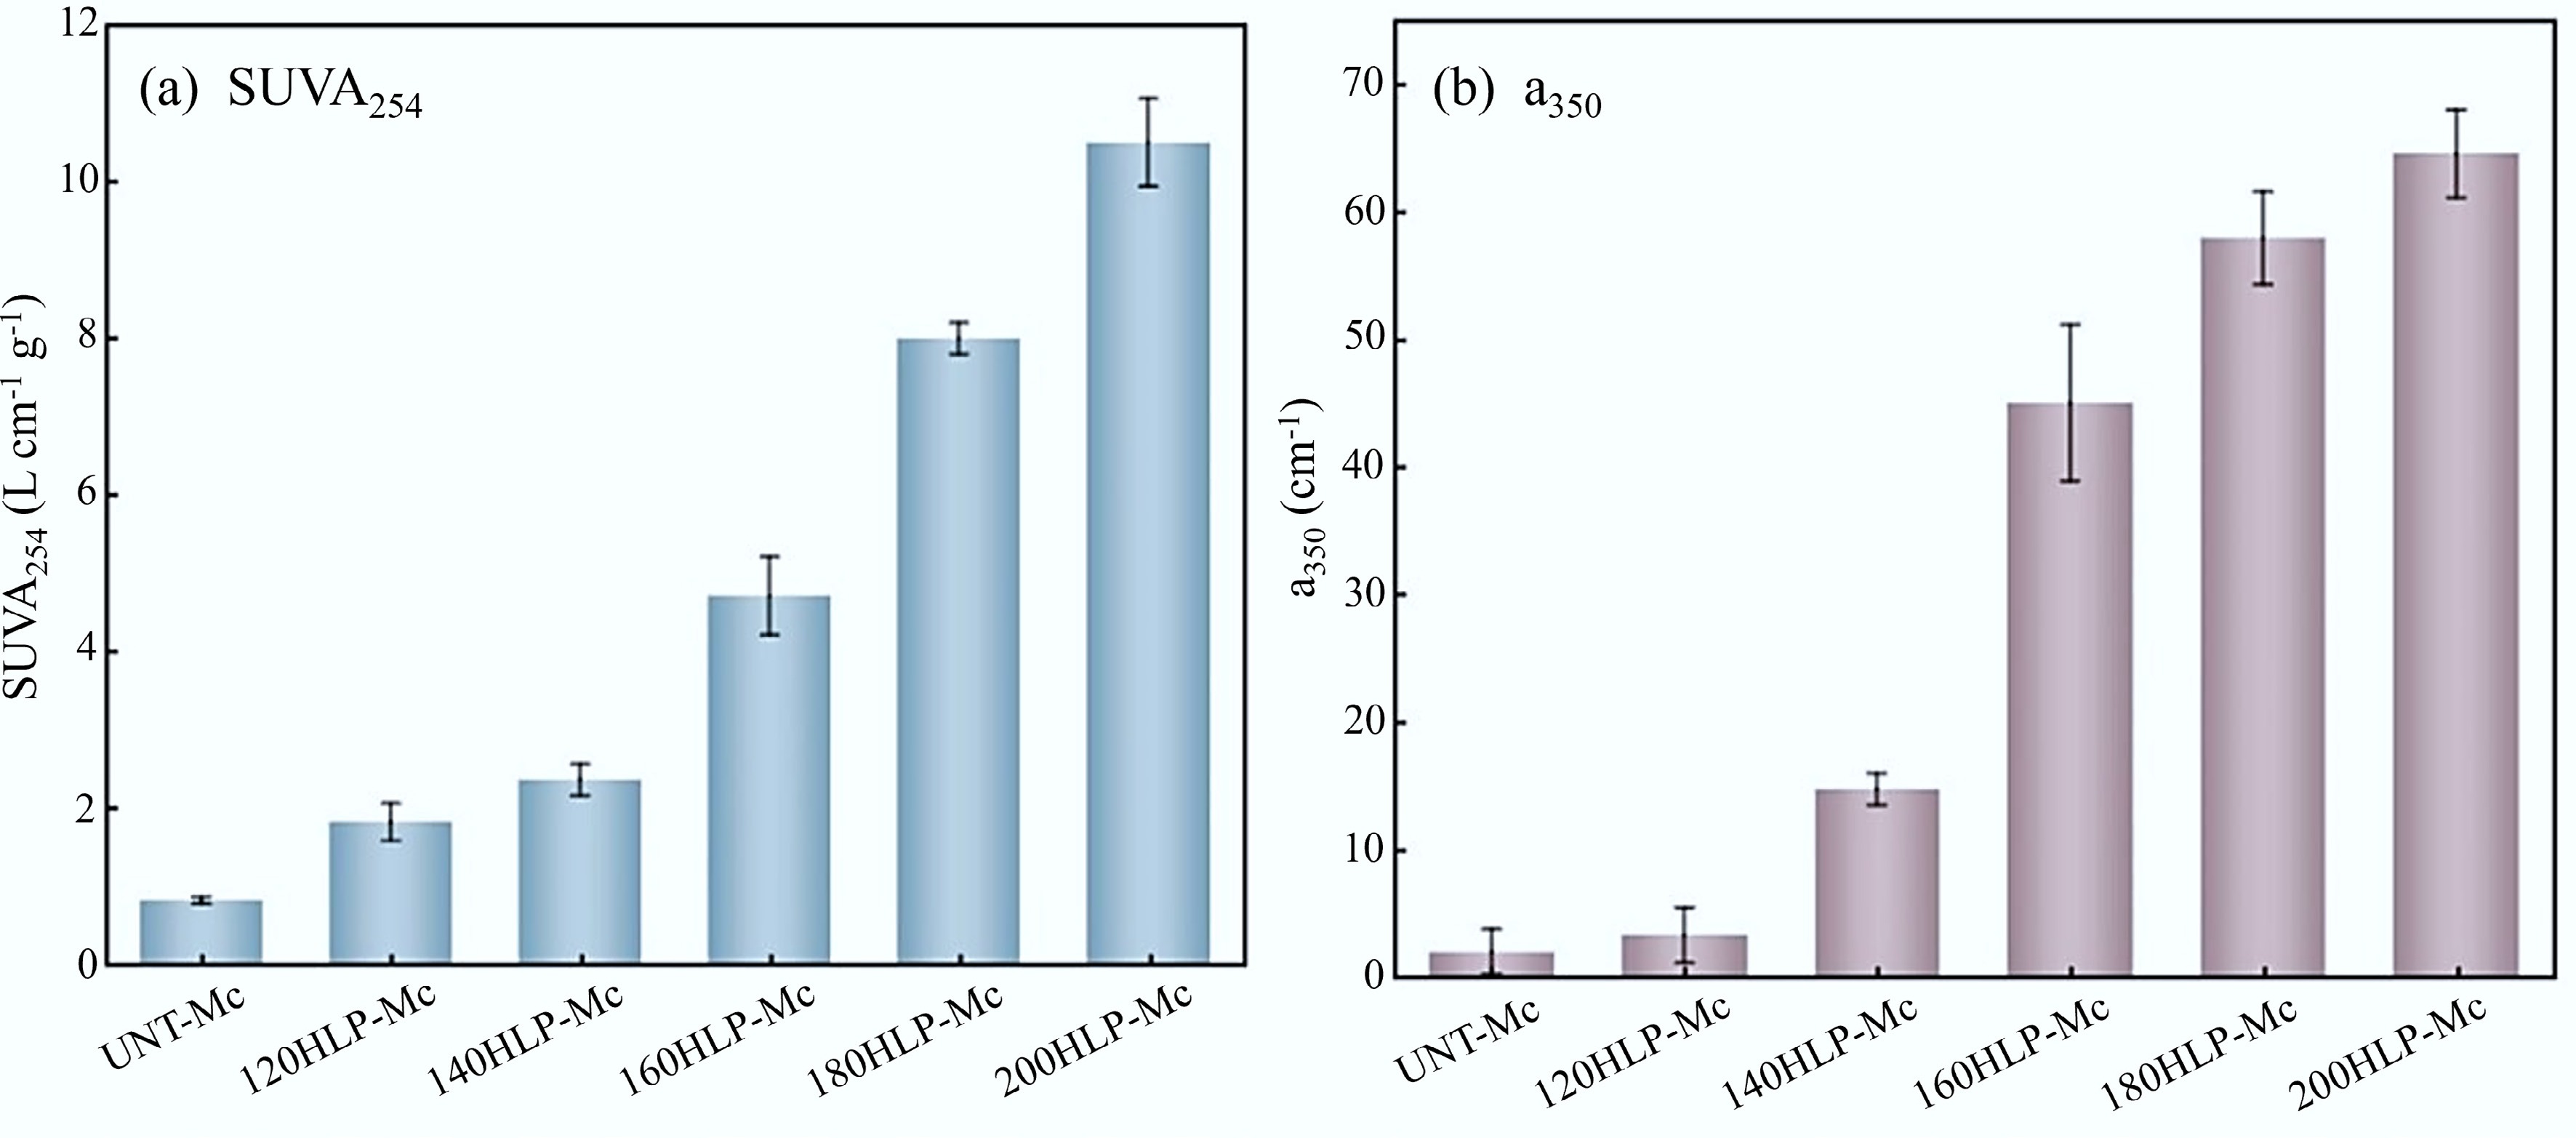
Figure 2.
Change of absorption parameters in HLP.
Semi-quantitative characterization based on parallel factor analysis
-
PARAFAC is used to analyze and quantify each component's fluorescence properties and contributions in complex mixed systems. The excitation/emission (Ex/Em) peak positions of fluorescent components are closely related to their chemical structure and origin: protein-like substances typically exhibit fluorescence at lower wavelengths (e.g., Ex/Em = 220 (280)/340 nm[37,38]), while recalcitrant humic-like substances fluoresce at longer wavelength ranges (e.g., Ex/Em = (225–360)/(400–500) nm[38,39]). As a type of recalcitrant aromatic polymer, melanoidins are characterized by Ex/Em values that are generally higher than those of other synthetic or isolated humic compounds. For instance, Dwyer et al.[15] reported a synthetic melanoidin peak at Ex/Em = 360/440 nm, and Gao et al.[40] identified melanoidins in sludge with peaks at Ex/Em = 250/440 nm and Ex/Em = 350/440 nm.
The initial data were reduced in dimension and deconvoluted using the DOMFluor toolbox in MATLAB. The separated components represented the identified components in the DOM, and relevant information, such as their abundances and types, was further extracted. Based on outlier testing and split-half validation analysis, the two-component model was optimal. The PARAFAC analysis ultimately identified two fluorescent components in the HLP: melanoidins (Component 1) and humic-like substances (Component 2). The contour plots of these two components are shown in Fig. 3, and excitation and emission loading plots were created based on the model results. Component 1 had two fluorescence peaks: Ex/Em = 340/428 nm and Ex/Em = 240/430 nm. Based on the fluorescence characteristics of melanoidins from the model and the three-dimensional fluorescence spectra of the FW HLP, Component 1 was identified as primarily melanoidins, as previously shown by Dwyer et al.[39,41], where fluorescence peak coordinates of melanoidins are significantly higher than those of other natural or synthetic humic substances. Component 2 showed a single fluorescence peak at Ex/Em = 290/426 nm. As this spectral signature falls outside the characteristic excitation-emission range reported for melanoidins in the literature[1], it was classified as other humic-like substances in this study.
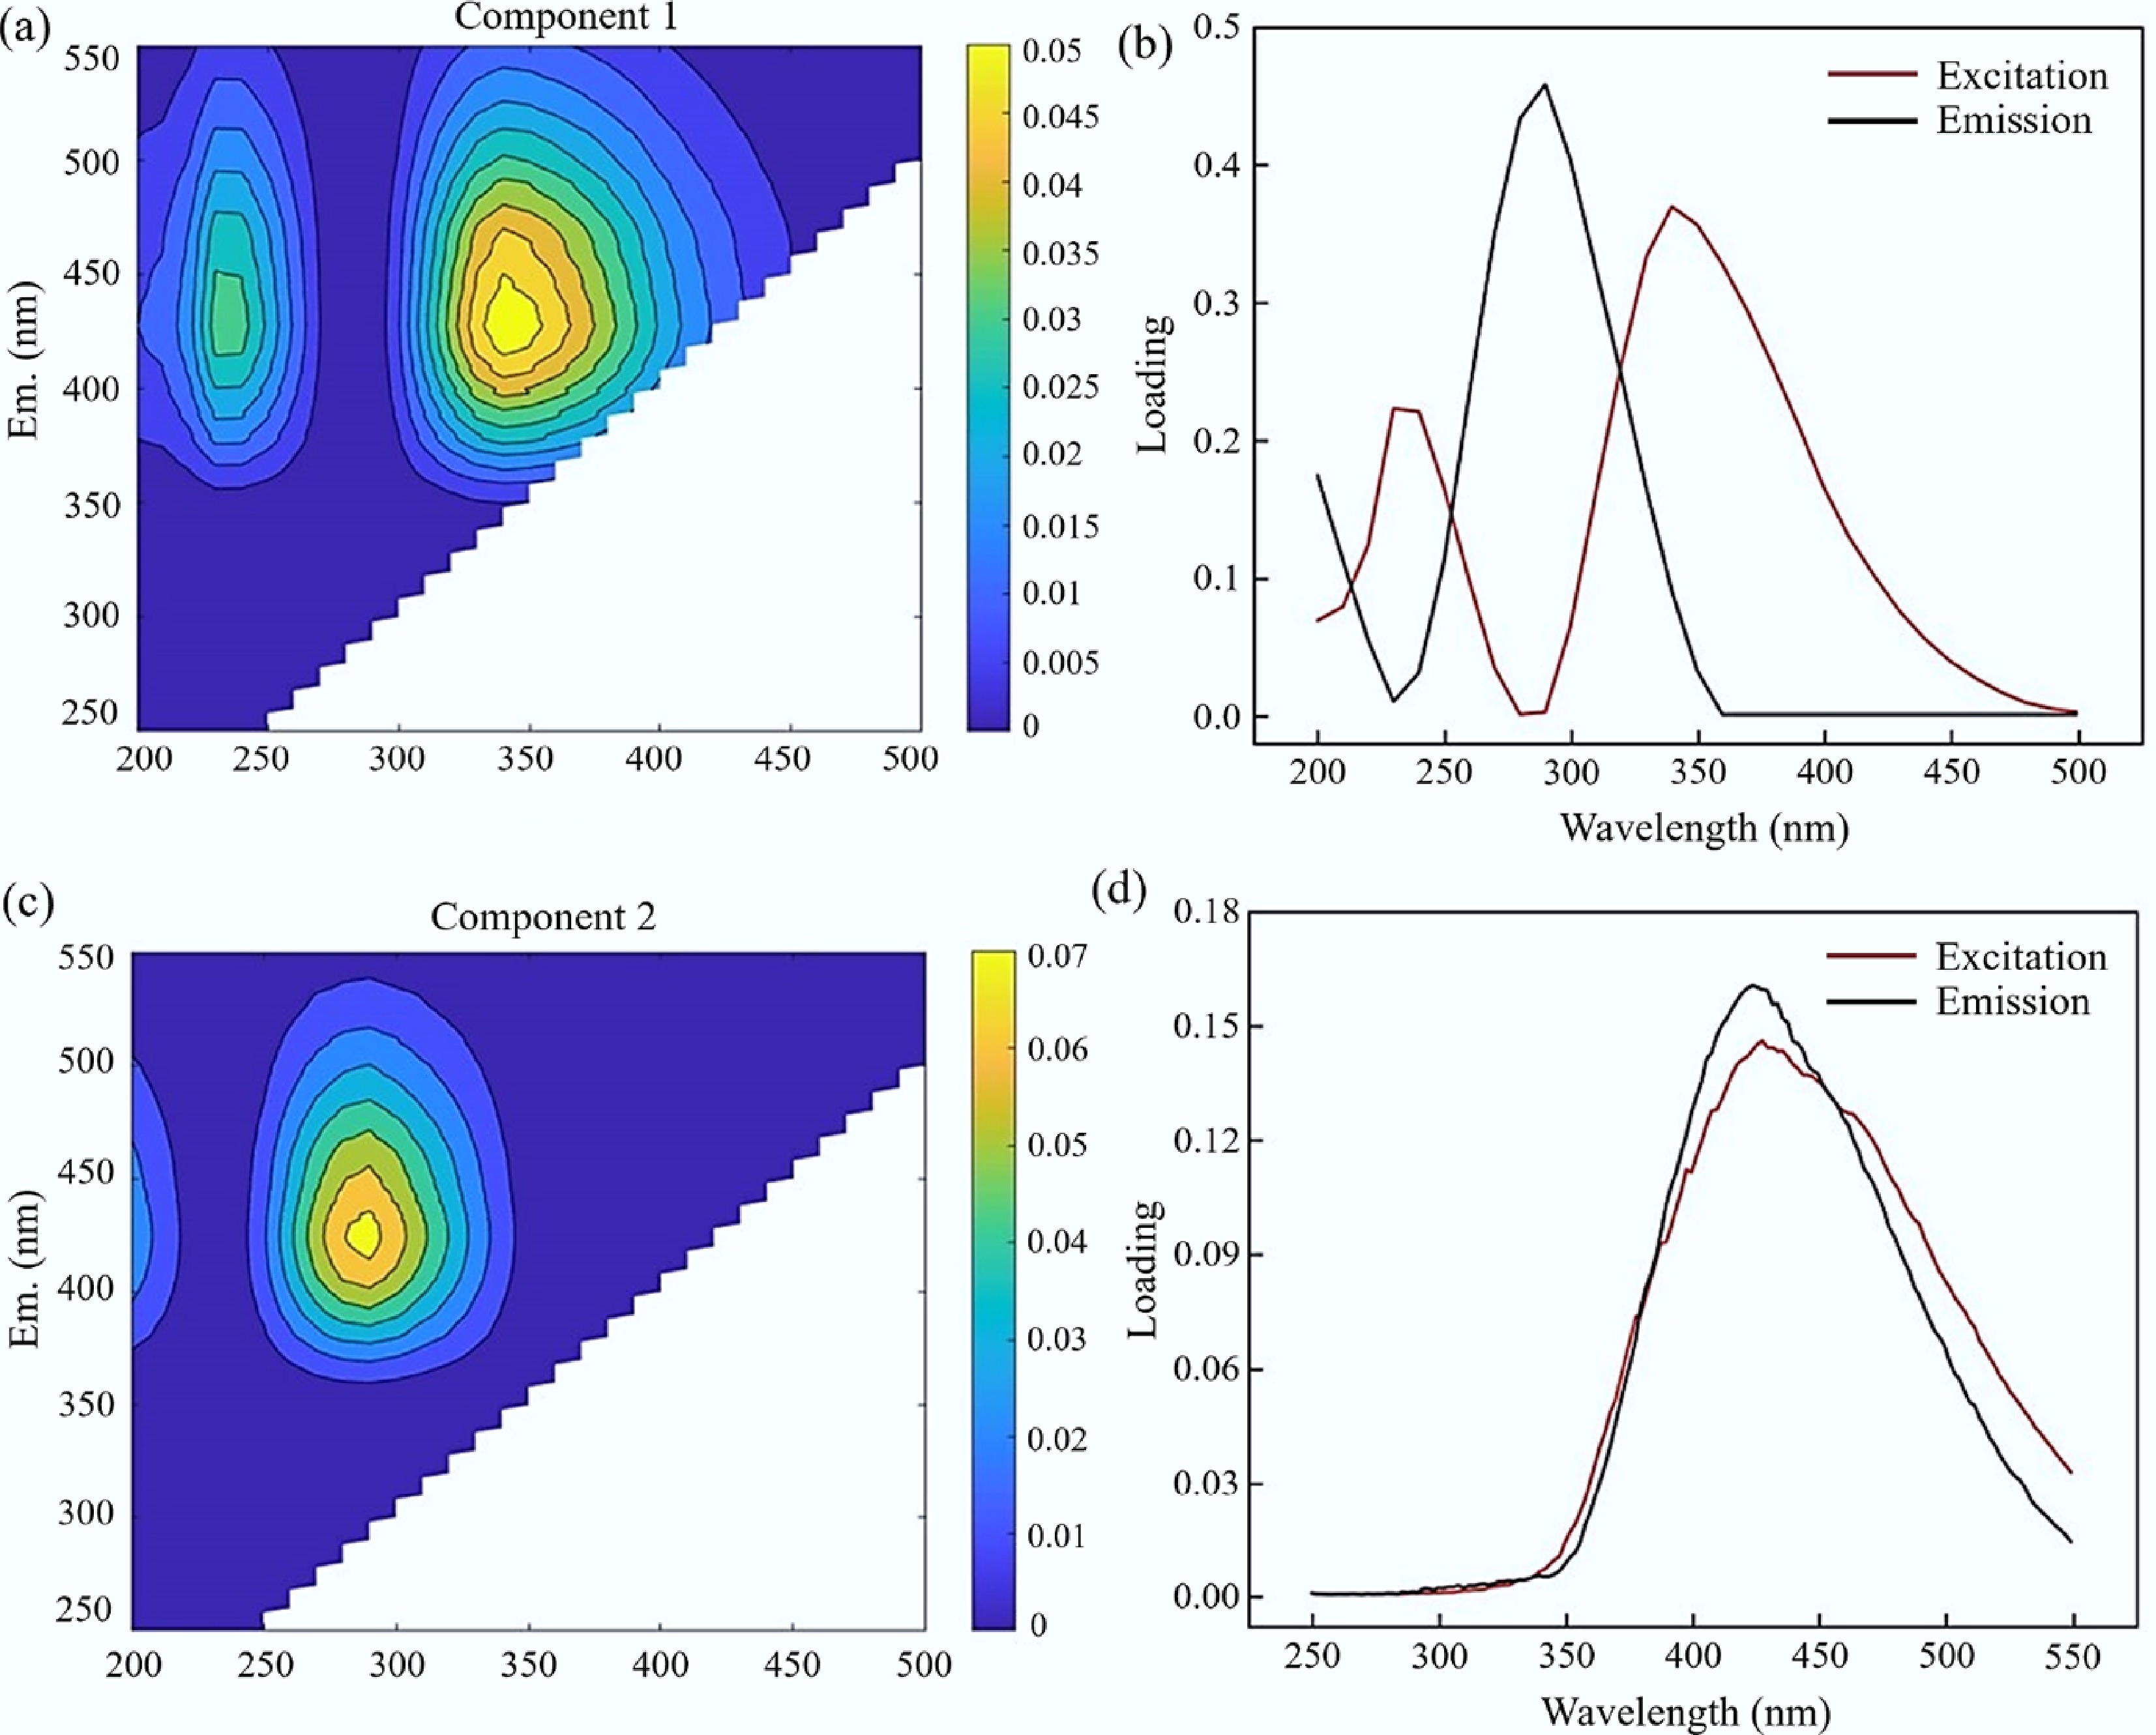
Figure 3.
Two-component PARAFAC model generated from FW HLP. (a), (b) Contour plots of the spectral shapes. (c), (d) Excitation and emission load diagrams.
Based on this, the maximum fluorescence intensity index (Fmax) was chosen as a semi-quantitative measure to assess the melanoidins content in each group. Figure 4 shows each component's Fmax in the two-component model. Component 2 was not analyzed as a melanoidin in this study. The Fmax of Component 1 steadily increased as the hydrothermal temperature rose. At 200 °C, the Fmax reached 374.14 (a.u.), significantly higher than the 9.35 (a.u.) observed in the untreated group. This suggested that melanoidins were rapidly produced during the hydrothermal process. A similar conclusion was supported by the earlier methods: within a specific temperature range (120–200 °C), the melanoidin content consistently increased with temperature.
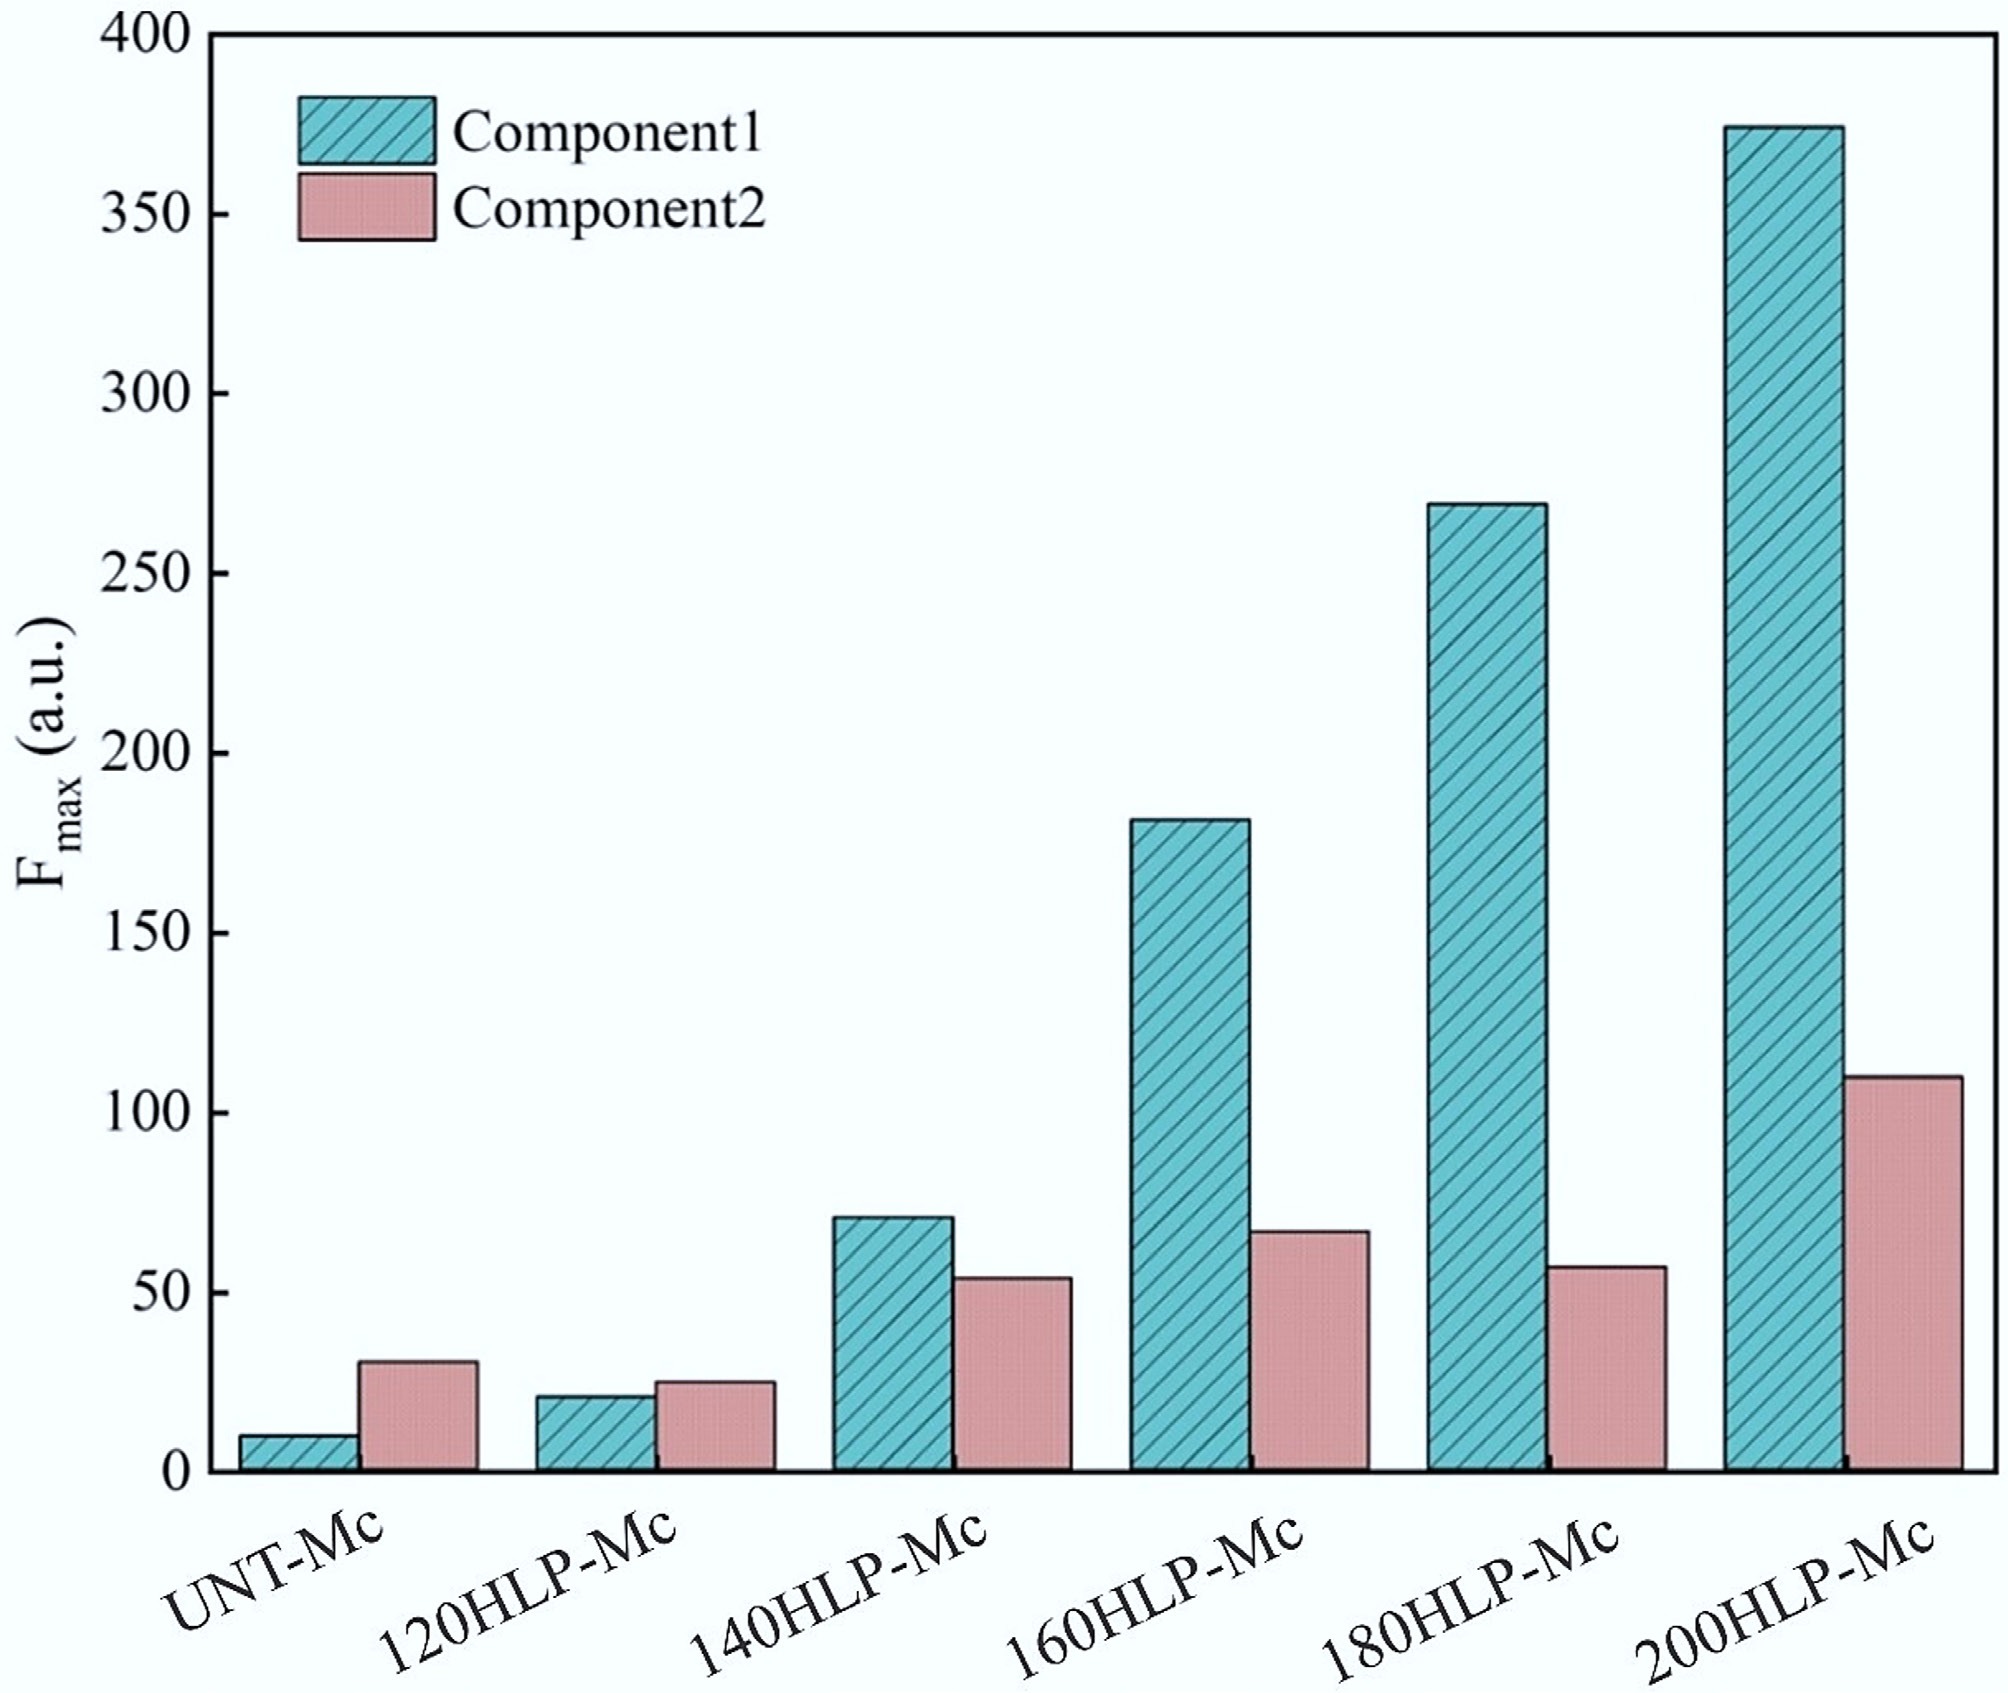
Figure 4.
The maximum fluorescence intensity of each component in the two-component model.
In summary, PARAFAC can provide a relatively comprehensive view of fluorescence data, including identifying fluorescence peaks and sources of melanoidins. It also uncovers the transformation process between protein-like substances and melanoidins in the HLP and shows the trend of melanoidin content increasing with higher hydrothermal temperatures.
The effect of melanoidins on AD of FW
-
There is a consensus among relevant researchers that[8,11] hydrothermal treatment of FW negatively affects the methane production performance of AD systems. Both the consumption of organic matter during melanoidin formation and the biological toxicity of melanoidins can influence the metabolic activity of microorganisms. This study used FW to prepare melanoidins, aiming to explore their effects on the methane production potential of the FW system and the expression of functional genes in related microorganisms. After adding different doses of melanoidins aqueous solutions to the system (with an effective AD volume of 250 mL), the biogas production results were shown in Fig. 5.
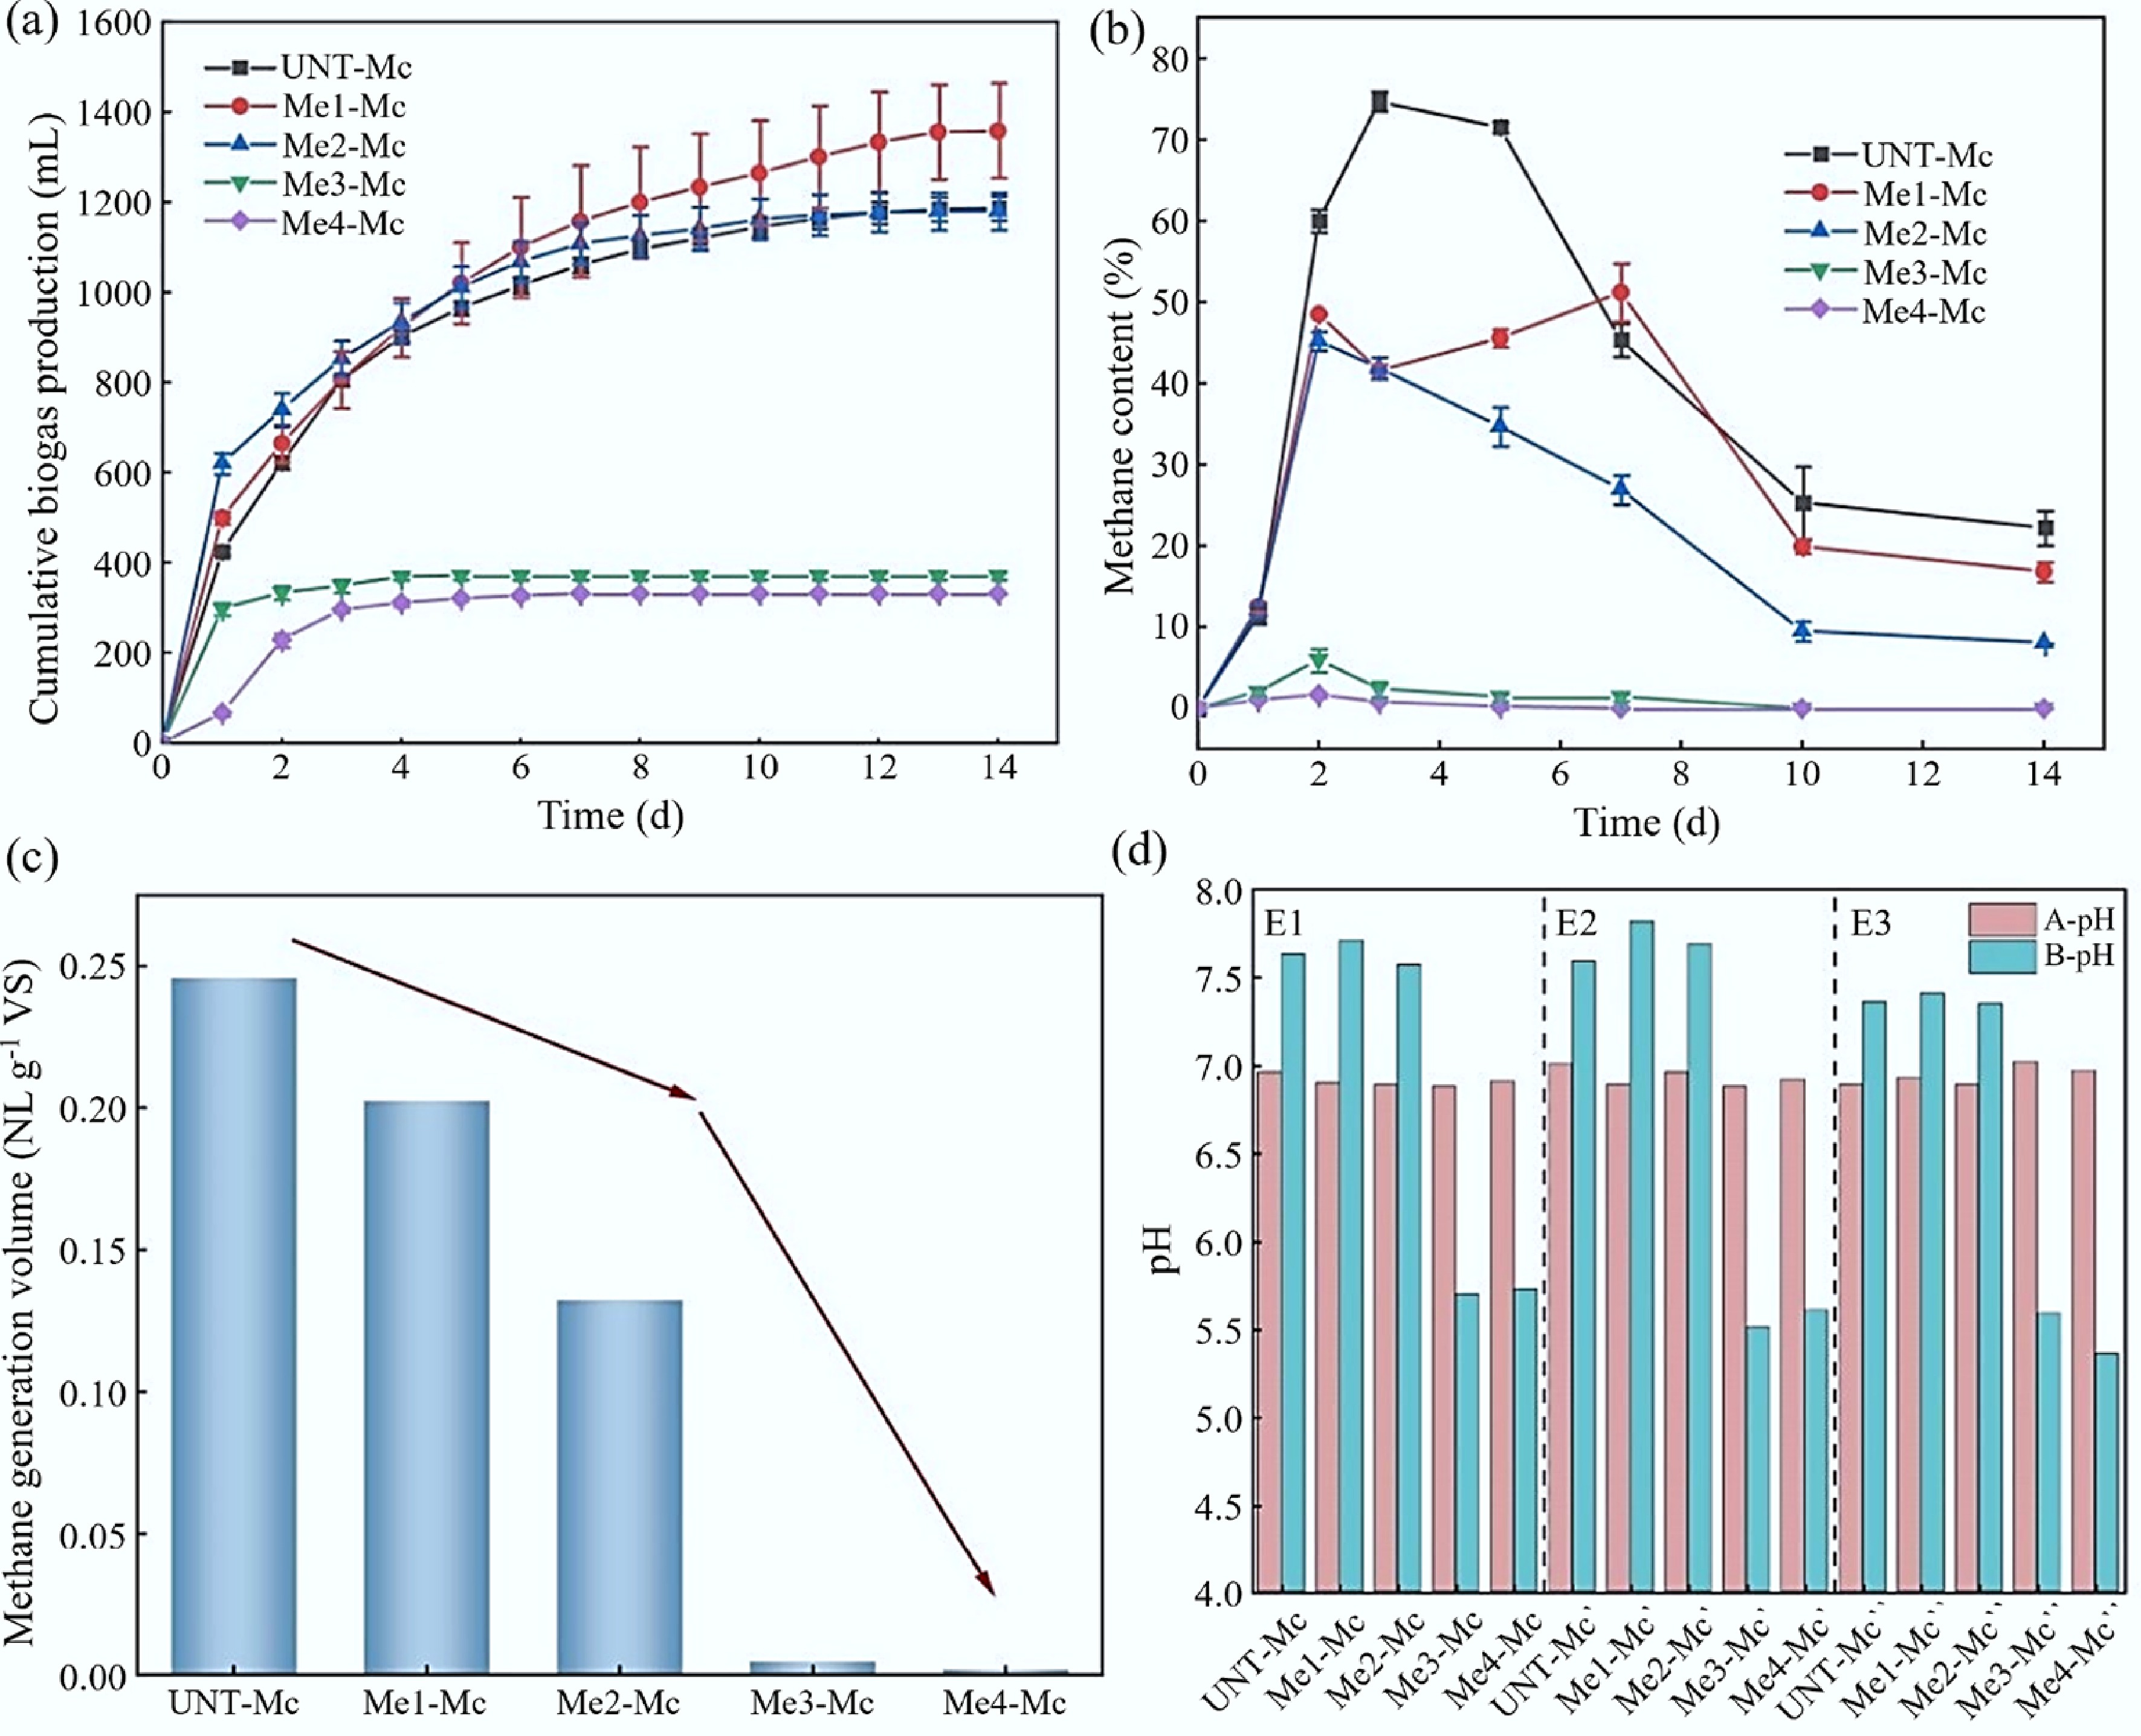
Figure 5.
AD results of FW after the addition of melanoidins. (a) Cumulative biogas production. (b) Methane content. (c) Methane production per unit VS. (d) pH values before and after AD (A: Before start-up; B: After start-up).
When the amount of melanoidins added reached three or four times that of the substrate, methane production decreased sharply by 98.15% (4.54 mL CH4·g−1 VS) and 99.24% (1.86 mL CH4·g−1 VS), respectively, compared to the control group. The Me3-Mc and Me4-Mc groups showed a stagnation trend in gas production by the third day, with methane content dropping below 10%. This indicated that a high concentration of melanoidins could induce near-complete inhibition of methanogenesis, effectively terminating the AD process at an early stage. After the experiment, the pH values of the samples ranged from 5.36 to 5.73, significantly lower than the optimal range (6.50–7.80) for methanogens. This indicated that 'acidification failure' occurred during AD. Melanoidins did not inhibit acid-producing bacteria but impeded the expression of functional genes in methanogens. When acid accumulation caused the system's self-buffering capacity to fail, methanogen activity was further suppressed, leading to system collapse. Additionally, a small amount of H2 was detected in the Me4-Mc group during gas analysis (Day 1: ~0.28%; Day 2: ~1.03%; Day 3: ~0.10%; Day 5: ~0.00%), suggesting that hydrogen partial pressure may also play a role in inhibiting methanogen activity. There was no significant difference in biogas production between the Me1-Mc and Me2-Mc groups. However, the reduction in methane content indicated that melanoidins impaired biogas quality. On the third day, methane content in the Me1-Mc and Me2-Mc groups decreased by 44.34% (methane content: 41.55%) and 43.89% (methane content: 41.88%), respectively, compared to the UNT-Mc group. The pH at the end of the experiment confirmed that 'acidification failure' did not occur. This suggested that melanoidins affected the metabolic pathways of methanogens, reducing their activity. The correlation between high melanoidin concentration, low pH, and complete system failure suggested a threshold where melanoidins overwhelmed microbial resilience, potentially through direct interference with microbial function, exacerbated by acidity. Thus, low doses (2.08 and 4.16 mg·mL−1) inhibited AD performance, while high doses (6.24 and 8.32 mg·mL−1), coupled with a significant pH decrease, led to the AD system collapse.
In our previous study[42], we analyzed the structural features of food waste-derived melanoidins using gel permeation chromatography (GPC) and Fourier transform infrared spectroscopy (FTIR). The GPC results showed a large weight-average molecular weight (Mw = 2,317 Da). This large size can physically cover the microbial cells and limit the transfer of nutrients. At the same time, the FTIR results showed strong amide bands (1,670–1,620 and 1,550–1,510 cm−1) and oxygen-containing groups. These structures form a complex network that is hard for anaerobic enzymes to break down.
The effect of melanoidins on microbial community structure
Bacterial community relative abundance composition in the melanoidins group
-
The negative impact of melanoidins on AD is reflected in a decrease in methane production potential. The activity of related microorganisms is a key factor in analyzing this effect, and the enrichment and synergy of dominant bacterial species at each stage are closely associated with the start-up and stability of AD. Samples were collected on the second and seventh days from groups with different melanoidins doses. Figure 6 illustrates the effect of varying melanoidin doses on the bacterial community structure at the phylum level (focusing on the top ten species by relative abundance). The typical phyla in these groups were Firmicutes, Bacteroidota, Chloroflexi, Synergistota, and other phyla. These microorganisms decomposed organic matter and produced organic acids through synergistic effects. Firmicutes and Synergistota have hydrogen-producing and acetate-producing abilities, while Chloroflexi and Bacteroidota generally do not directly participate in or mediate hydrogen and acetate production.
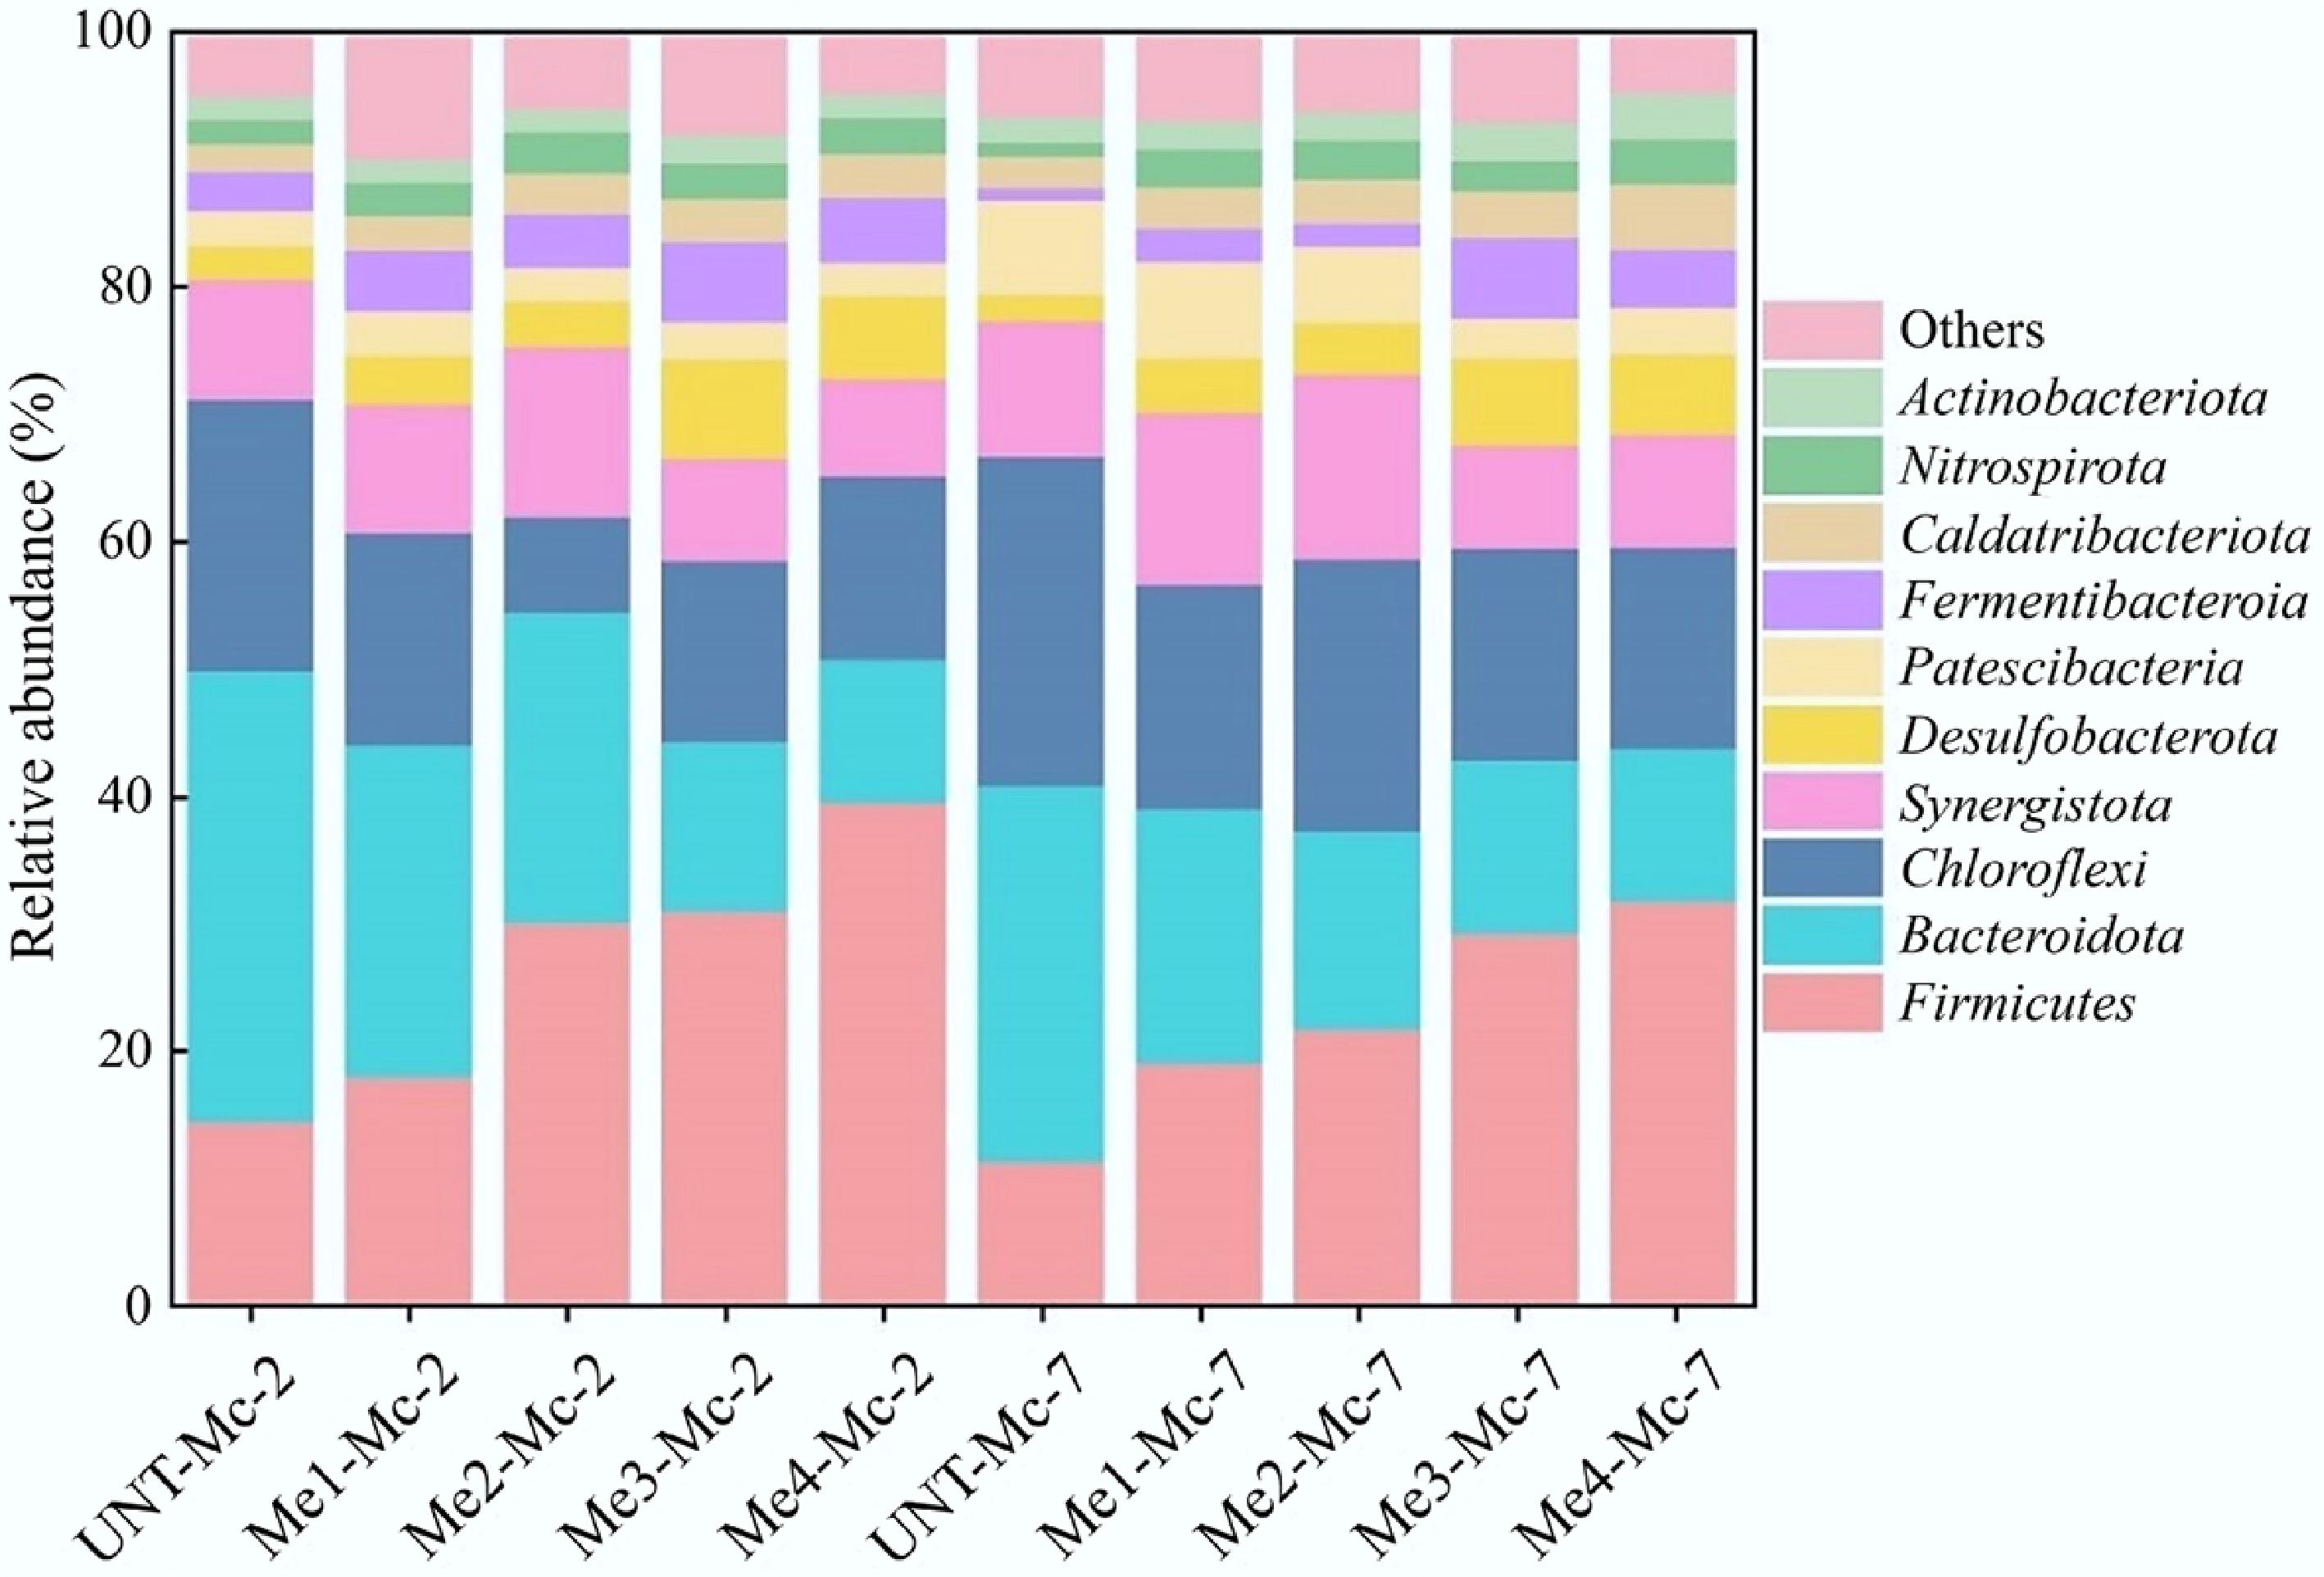
Figure 6.
Relative abundance of bacterial communities at the phylum level across different doses of melanoidins.
The abundance of Firmicutes increased with higher melanoidin dosage, whereas that of Bacteroidota decreased correspondingly, demonstrating an opposite response to the additive. Firmicutes contributed to system stability through the hydrolysis of organic matter and promoted carbon cycling via hydrogen and acetate production[43,44]. These roles underscore its status as one of the key bacterial groups involved in the AD of complex substrates. The syntrophic relationship between Firmicutes and methanogens, along with the regulation of system pH, facilitated methane production during AD. At high melanoidin doses, the relative abundance of Firmicutes increased significantly. In the Me4-Mc-2 and Me4-Mc-7 groups, the relative abundance of Firmicutes was 176.60% and 183.72% higher than that in the UNT-Mc-2 (14.23%) and UNT-Mc-7 (11.12%) groups, respectively. However, methane output in these high-dose melanoidin groups was significantly lower, indicating that the microbial pathways critical for methanogenesis were blocked, preventing the effective use of acetate or H2/CO2. The accumulation of systematic acids lowered the pH, further inhibiting methanogen activity. When the acetate concentration produced by Firmicutes increased, or the hydrogen partial pressure rose, the reactions producing hydrogen and acetate could not proceed normally. The activity of Synergistota was also influenced by the hydrogen partial pressure, explaining why its relative abundance decreased significantly in high-dose melanoidin groups. Bacteroidota were typical in the hydrolysis and acidification stages, producing volatile fatty acids (VFAs), which are then utilized by bacteria such as Firmicutes to produce acetic acid and H2, supporting the subsequent reactions. The relative abundance of Bacteroidota declined steadily as melanoidin dosage increased, aligning with the trend seen in Chloroflexi relative abundance.
The addition of melanoidins changed the bacterial community composition, leading to Firmicutes becoming the dominant bacterial phylum. Overall analysis revealed that the relative abundances of the four main bacterial phyla decreased to different extents compared to the non-addition group. Yet, they still maintained a relative abundance exceeding 65%. This suggested that melanoidins did not significantly impact the target products of the 'acid fermentation' stage but instead affected gene expression by altering bacterial metabolic pathways.
The effects of melanoidin dosage on the microbial richness and diversity indices within the samples were presented in Table 2. No consistent pattern was observed in the changes of Observed_species and Chao1 indices across samples. However, a notable decreasing trend was identified in both the Me4-Mc-2 and Me4-Mc-7 groups, which might be attributed to the biotoxicity of melanoidins. The variation in the Shannon index reflected the combined influence of melanoidin addition and fermentation time on microbial diversity. On day 2, the decrease in Shannon index indicated a reduction in microbial diversity. The introduction of melanoidins likely inhibited the growth of certain microorganisms in the early stage of AD, leading to decreased evenness, rapid proliferation of dominant genera, and a decline in other species. For instance, the enrichment of acidogenic bacteria during the 'acid fermentation' phase, coupled with a continuous drop in system pH, created a suitable environment for acid producers, while the activity of methanogenic archaea was suppressed. By day 7, the increase in the Shannon index suggested that the system underwent adaptation and rebalancing following melanoidins perturbation. Nevertheless, AD performance results demonstrated that the presence of melanoidins impaired the efficient metabolic functions of the microbial community, as observed across all experimental groups with melanoidins addition. This corresponded to the decline in biogas quality and the stagnation of methane production in the later stages.
Table 2. Richness index and diversity index of melanoidins samples
Sample Observed_species Chao1 Shannon UNT-Mc-2 1,357 1,369.44 7.42 Me1-Mc-2 1,332 1,371.99 7.31 Me2-Mc-2 1,367 1,385.99 7.15 Me3-Mc-2 1,369 1,402.32 7.11 Me4-Mc-2 1,227 1,242.25 7.11 UNT-Mc-7 1,402 1,448.60 7.23 Me1-Mc-7 1,435 1,475.43 7.54 Me2-Mc-7 1,389 1,407.86 7.53 Me3-Mc-7 1,392 1,414.44 7.45 Me4-Mc-7 1,280 1,290.23 7.42 Venn diagrams are commonly used to analyze species differences and visually identify shared and unique species among different samples. In this study, the numbers in the Venn diagram represented the count of ASVs, as shown in Fig. 7. Overall analysis revealed that the experimental groups with different melanoidin dosages and the untreated control group shared 247 ASVs. The proportion of unique ASVs in each sample was higher than that of the shared ASVs, indicating low similarity among the samples. The addition of melanoidins, along with the progression of fermentation time, altered the microbial community structure of the system.
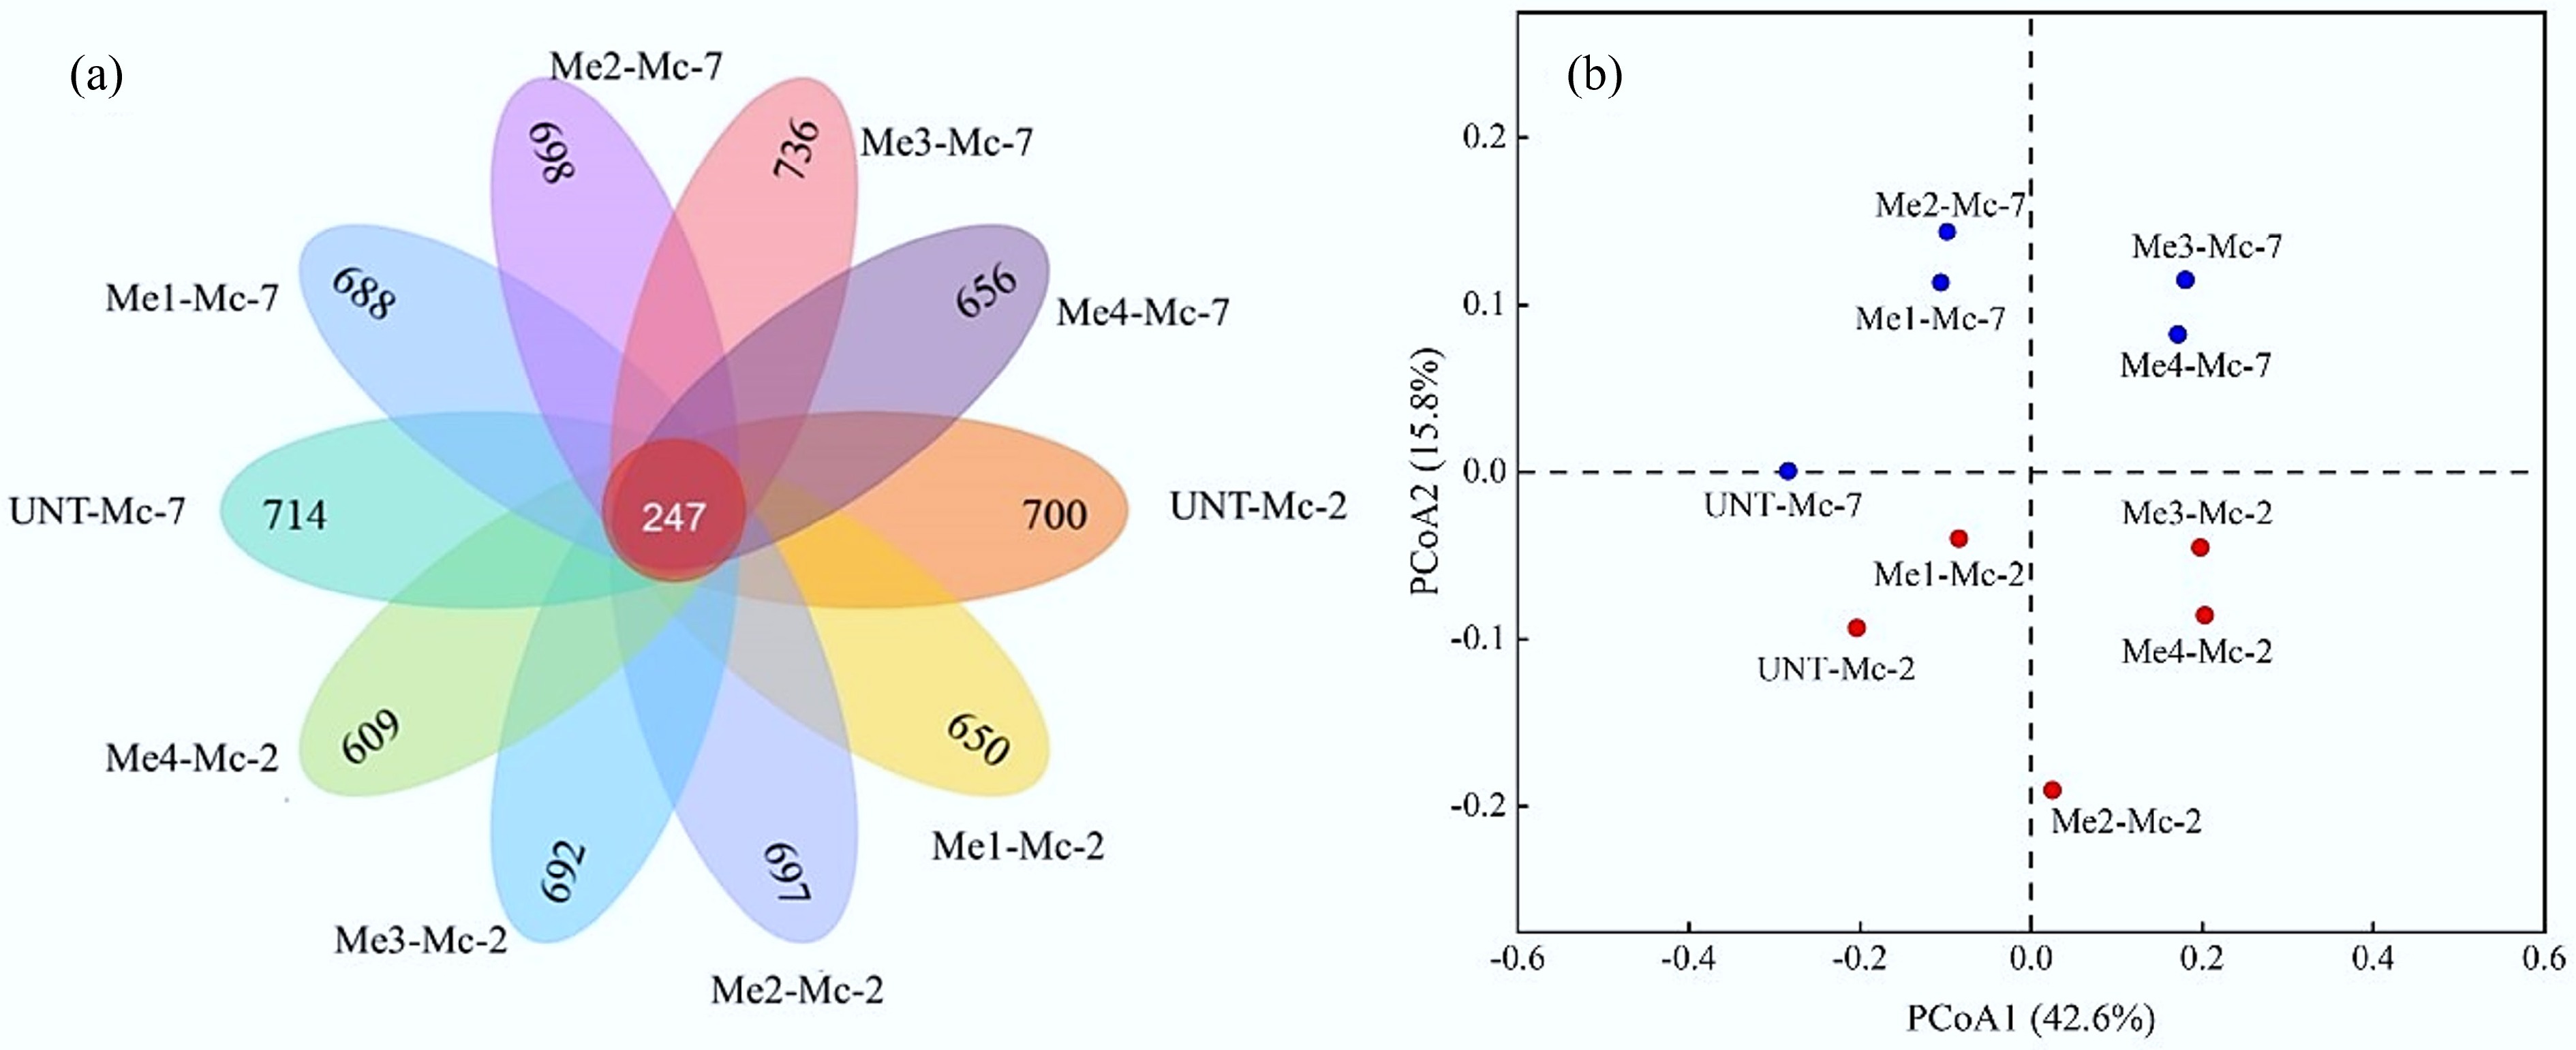
Figure 7.
Beta diversity analysis of bacterial communities. (a) Venn diagram of bacterial distribution based on ASV profiles. (b) PCoA analysis of bacterial communities under different melanoidins dosages.
Beta diversity analysis was further conducted on the ten samples to assess bacterial community differences, as shown in Fig. 7b. The addition of melanoidins significantly influenced the bacterial community structure within the system. This effect was more pronounced in the high-dose melanoidin groups, particularly evident from the greater distance between sample points of the Me3-Mc-2 and Me4-Mc-2 groups and the UNT-Mc-2 control point. As fermentation progressed, the distance between sample points of the high-dose groups and the UNT-Mc-7 control point further increased, indicating significant divergence in microbial community structure over time.
Archaeal community relative abundance composition in the melanoidins group
-
The impact of melanoidins on archaeal community structure is essential for understanding methane production performance. All samples were analyzed on the seventh day of the experiment, when the AD process of the Me3-Mc-7 and Me4-Mc-7 samples was nearly halted (Fig. 5). The results were presented in a clustered heatmap, as shown in Fig. 8. This study focused on four main types of archaea: Micrarchaeales, Methanosaeta, Methanomassiliicoccus, and Methanomethylovorans. As obligate anaerobes, Micrarchaeales played a key role in acetate metabolism. Additionally, Micrarchaeales were part of ultra-small archaea with limited metabolic abilities. Methanomassiliicoccus and Methanomethylovorans produced methane by consuming methyl compounds such as methanol and methylamine. They were commonly found in environments containing complex substrates like the FW, which could help reduce the buildup of toxic substances.
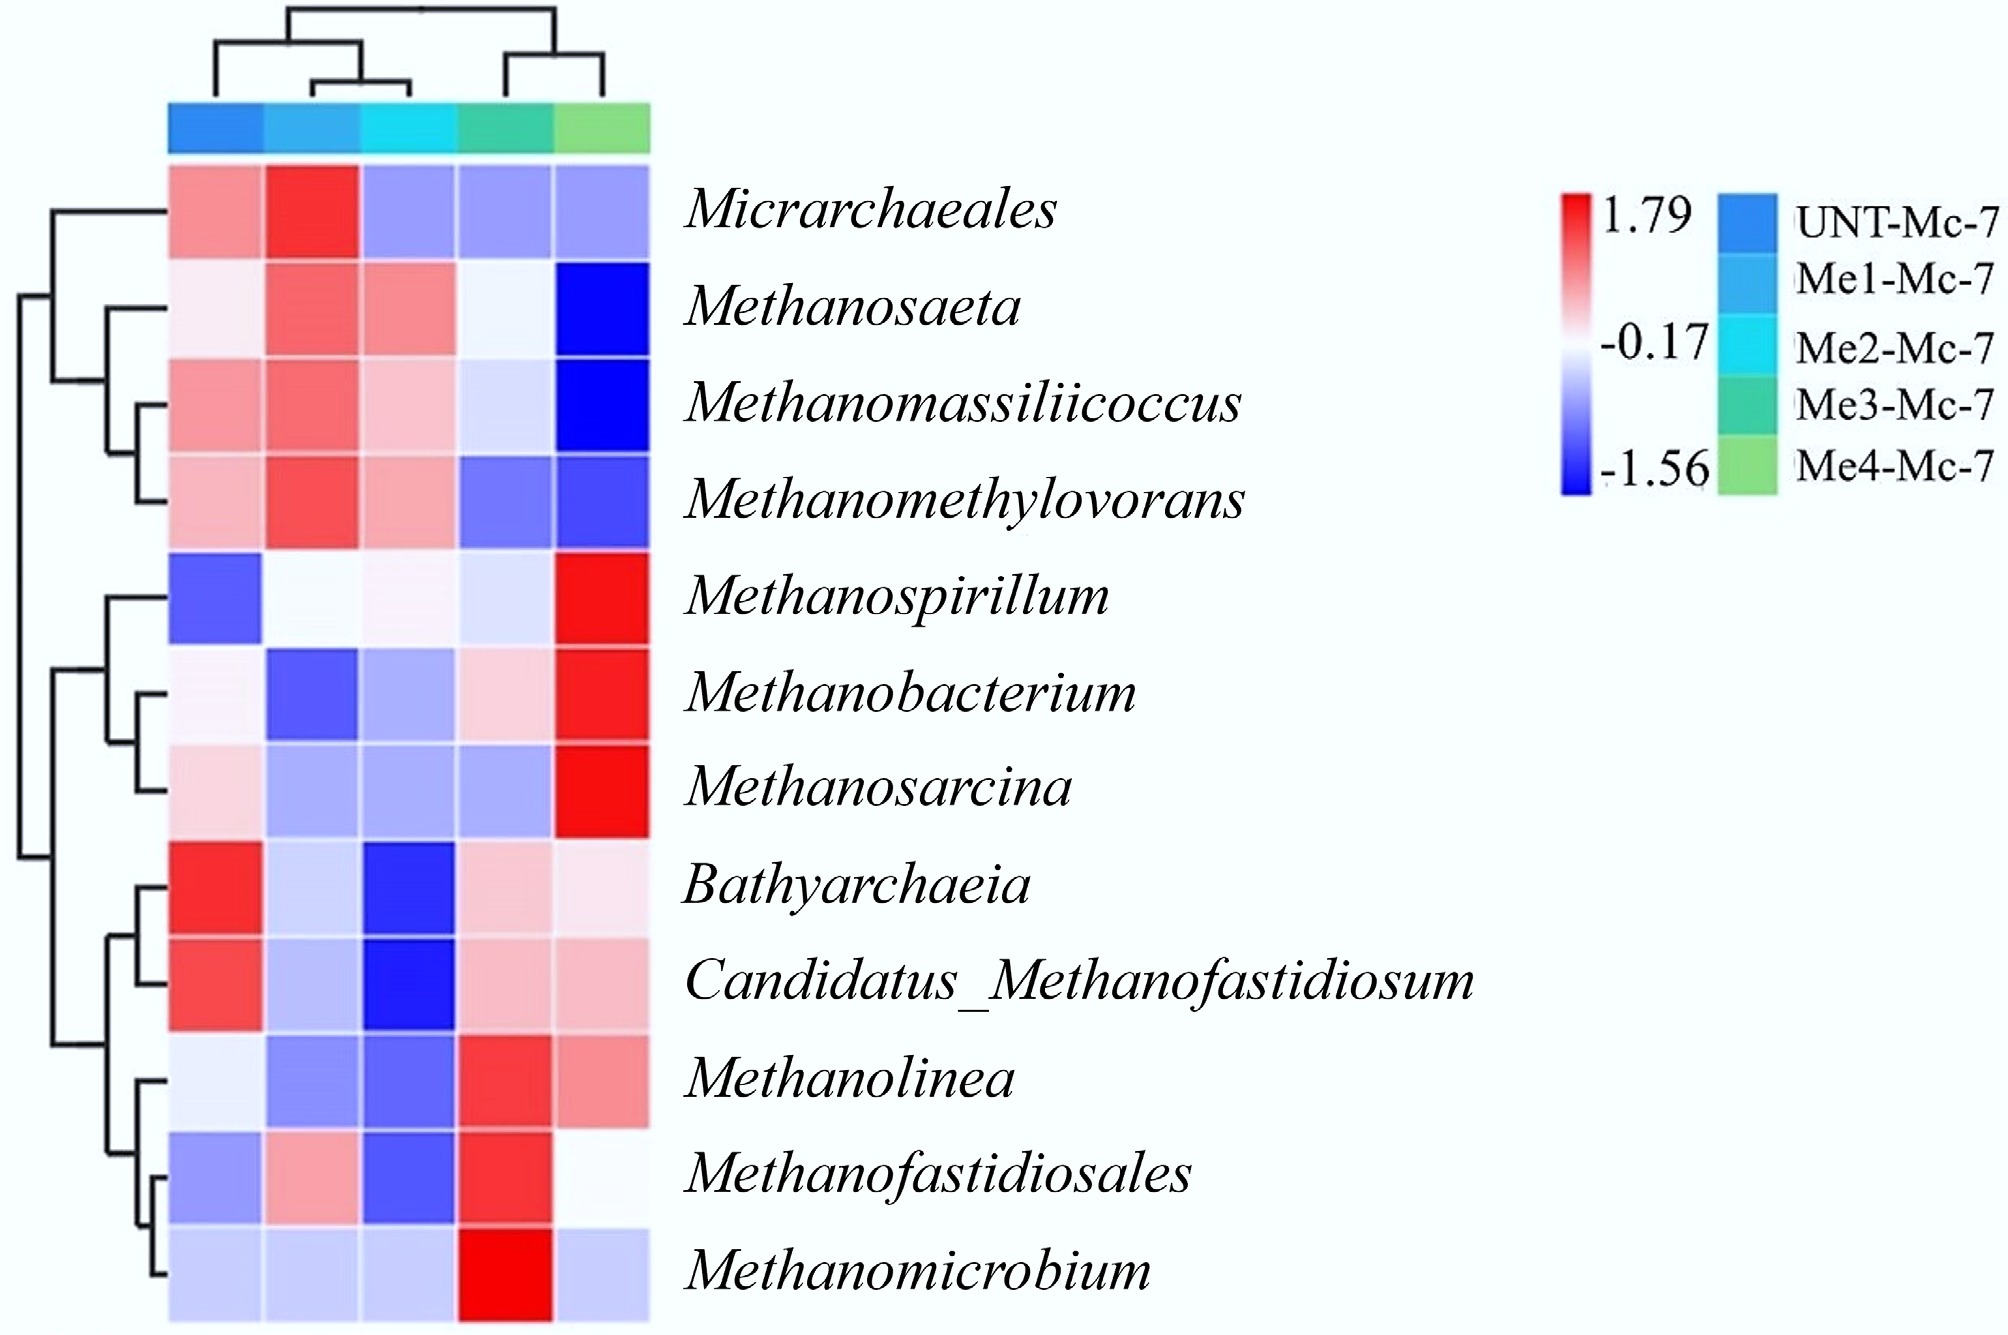
Figure 8.
Effect of melanoidins on the relative abundance of the archaeal communities at the genus level.
The main body of the heatmap illustrated the overall changes in expression levels of 12 archaeal taxa across five samples. Four of these archaeal taxa showed high expression in the three samples of UNT-Mc-7, Me1-Mc-7, and Me2-Mc-7, while displaying low expression in the Me3-Mc-7 and Me4-Mc-7 samples. When considering the methane production performance of all sample groups on day 7, it could be inferred that these four archaeal taxa collectively formed a methanogenic network during the methanogenic stage of the AD process, with a synergistic and complementary relationship. The addition of melanoidins influenced the metabolic functions of methanogenic archaea, and experimental results indicated biological toxicity. The clustering analysis of archaeal relative abundance among samples (upper dendrogram) revealed that Me3-Mc-7 and Me4-Mc-7 (high-dose) samples were similar in archaeal relative abundance levels. In contrast, Me1-Mc-7 and Me2-Mc-7 (low-dose) samples showed similarity in archaeal functional expression. Moreover, the UNT-Mc-7 sample was closer to the low-dose groups in the clustering, suggesting these two groups shared similar archaeal community structures. Additionally, there were significant differences in how low- and high-dose melanoidins affected the archaeal community during the AD process, which was clearly reflected in the methane production performance of the respective experimental groups. This further supported the reliability of the samples. The clustering results of archaea (left dendrogram) indicated that Micrarchaeales, Methanosaeta, Methanomassiliicoccus, and Methanomethylovorans shared similar relative abundance distribution patterns across all samples.
Table 3 presents the richness and diversity indices for the five samples. Overall, with the possible exception of the Me3-Mc-7 group, which showed an anomaly potentially due to operational error, all other groups with added melanoidins exhibited a declining trend in both richness and diversity. This trend became more pronounced with increasing melanoidin dosage. The data indicated that the addition of melanoidins likely inhibited or eliminated certain archaea that were unable to adapt to the AD environment. Concurrently, a decrease in evenness was observed, alongside the growth of dominant species with specialized functional expression. However, based on the final methane production results, this functional expression appeared unrelated to the methane cycle.
Table 3. Richness index and diversity index of archaea in the melanoidins samples
Sample Observed_species Chao1 Shannon UNT-Mc-7 127 127.35 1.76 Me1-Mc-7 111 111.00 1.74 Me2-Mc-7 89 90.88 1.65 Me3-Mc-7 129 129.00 1.80 Me4-Mc-7 88 89.67 1.62 Further beta diversity analysis was conducted on day 7 samples from the melanoidins-treated groups, with the results presented in Fig. 9. PCoA1 and PCoA2 together explained 96.80% of the variation in archaeal community composition. The distribution of sample points indicated that melanoidins addition significantly altered the archaeal community structure. The proximity of points in the low-dose groups suggested a degree of similarity among them. In contrast, the greater separation observed between the high-dose groups indicated that while both groups exhibited a similar level of inhibition on methanogenic performance, the underlying archaeal communities responsible for this effect were distinctly different.
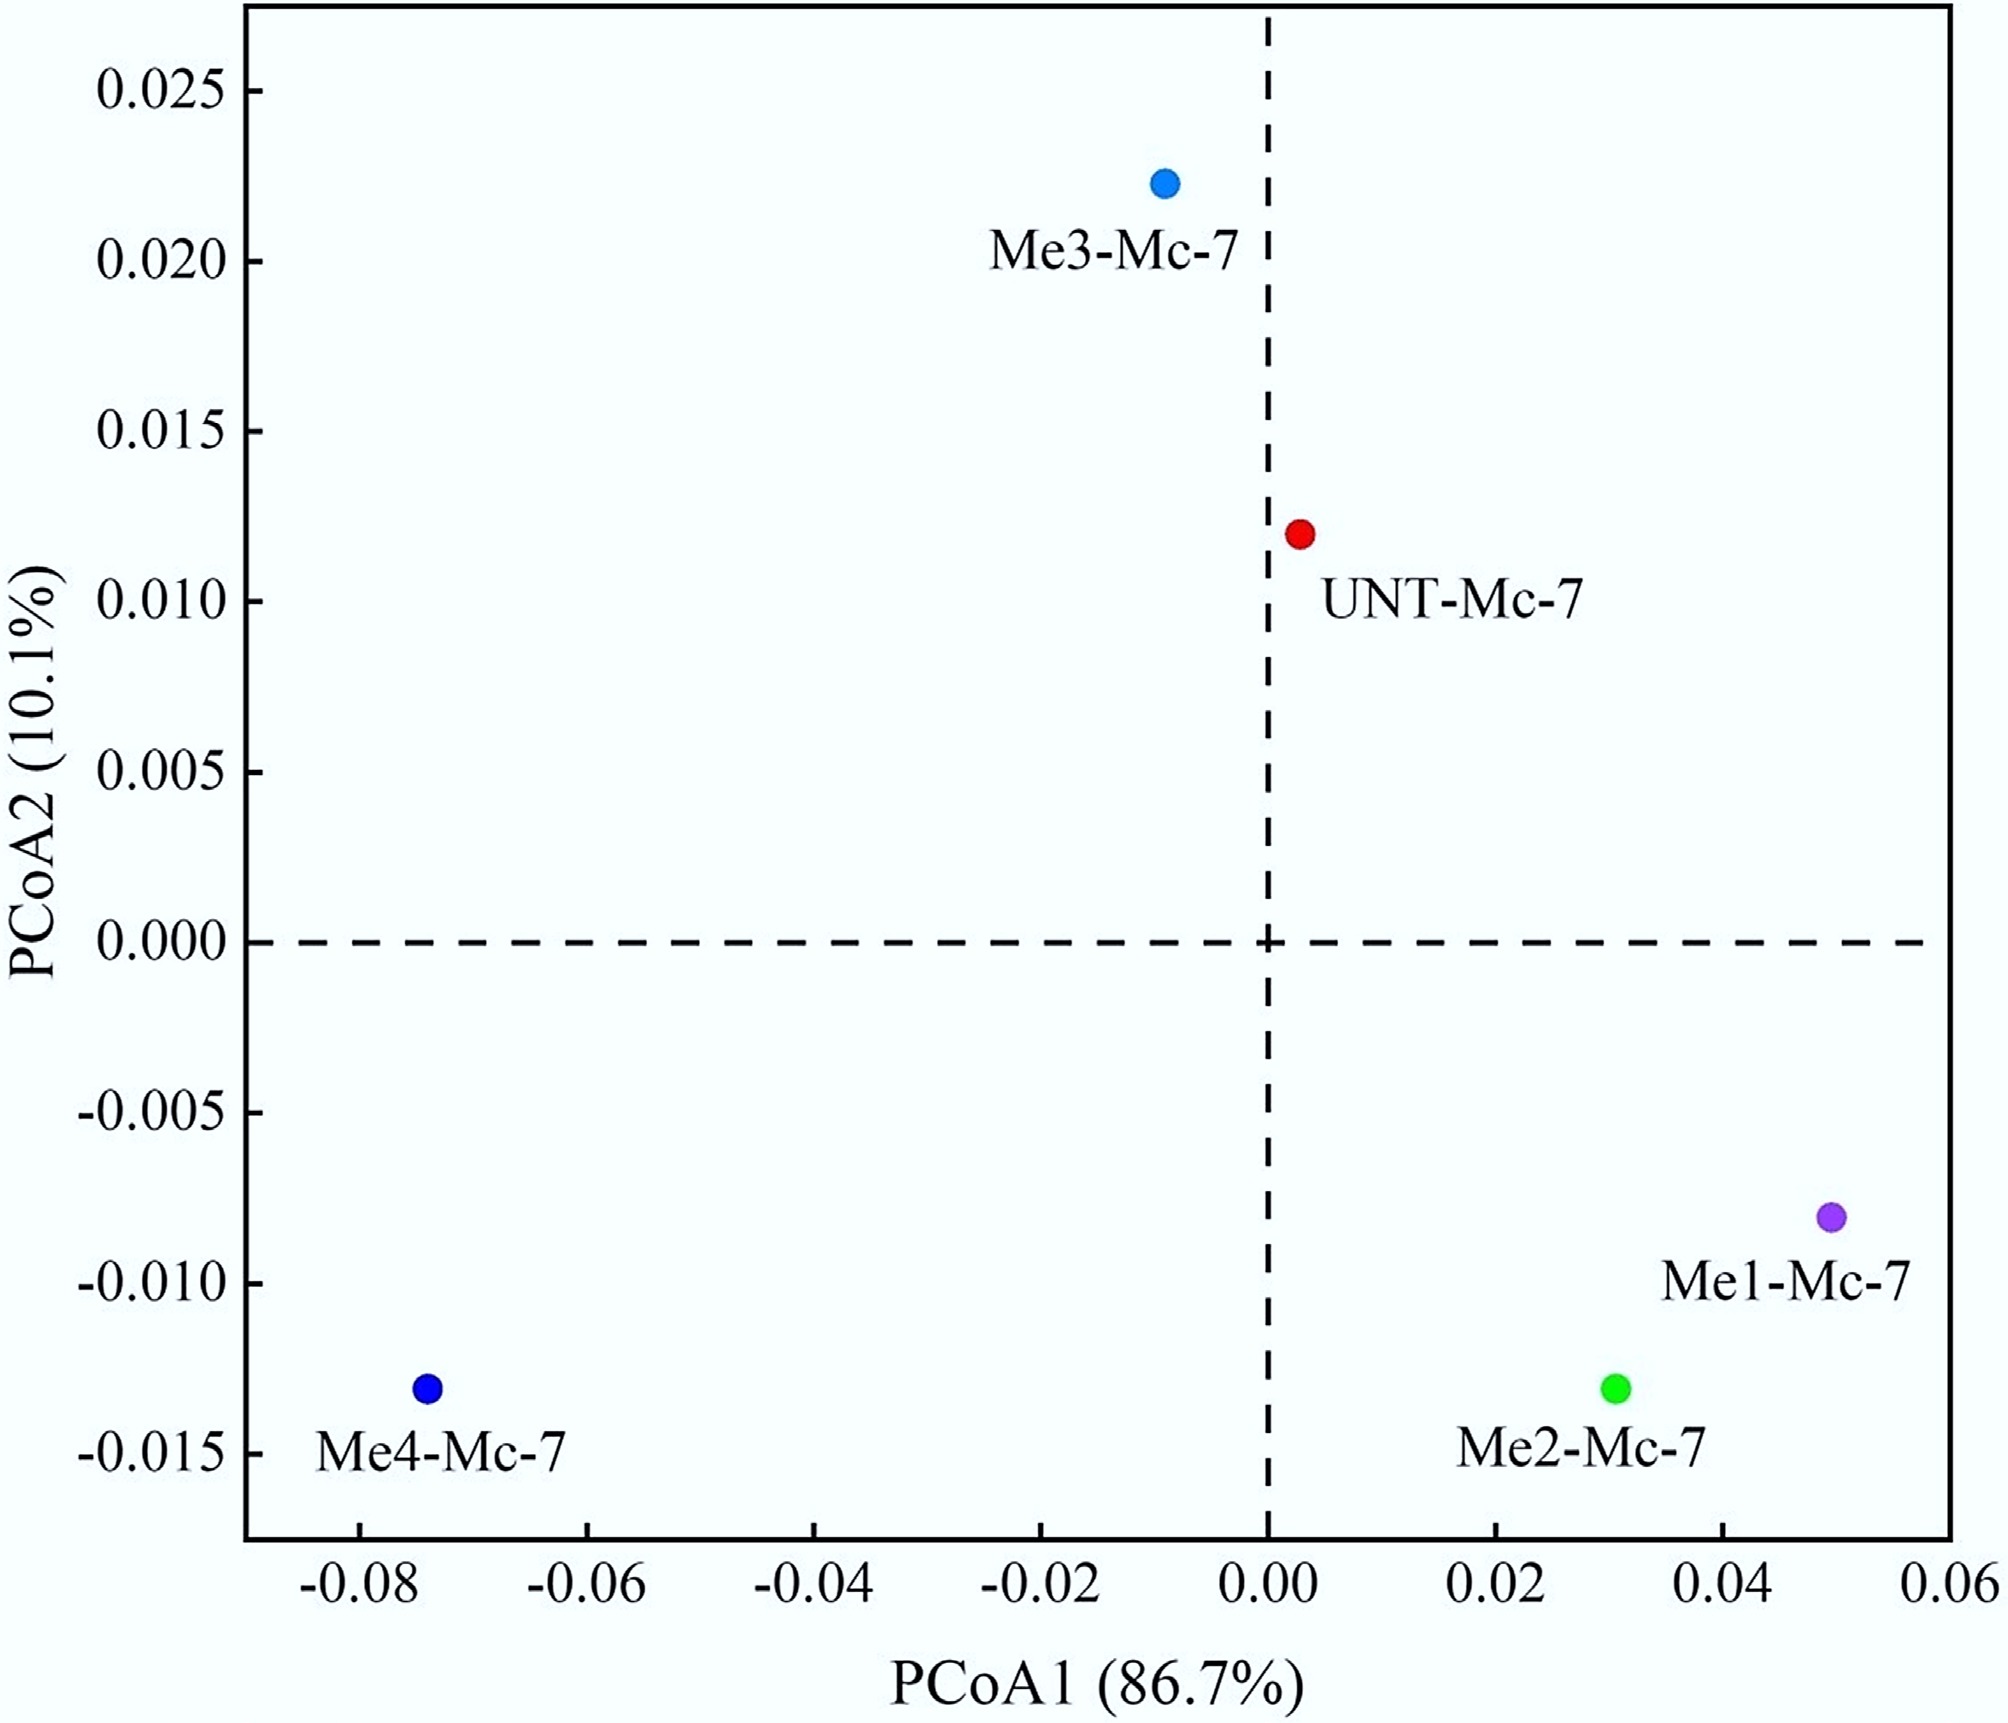
Figure 9.
PCoA analysis of archaea under different doses of melanoidins.
-
This study characterized melanoidins formed during hydrothermal FW treatment and explored their dose-dependent effects on AD. Key findings showed that higher hydrothermal temperatures increased organic matter concentration and aromaticity. Melanoidins content, semi-quantified by maximum fluorescence intensity, rose continuously from 120 to 200 °C. In digestion tests, low-dose melanoidins inhibited methane production, while high doses caused system collapse. Although acid fermentation was unaffected, melanoidins exhibited clear biotoxicity toward methanogenic archaea, suppressing their metabolic activity.
-
The authors confirm their contributions to the paper as follows: Xingyu Niu, Mingming Yang: study conception and design, data analysis, interpretation of results, draft manuscript preparation; Lu Ding: study conception and design; Yan Gong, Qinghua Guo: study conception and design, data collection; Douglas Hungwe, Su Shiung Lam, Guangsuo Yu: study conception and design, manuscript revision. All authors reviewed the results and approved the final version of the manuscript.
-
All data needed to evaluate the conclusions in the paper are present in the paper. Additional data related to this paper are available from the authors on reasonable request.
-
This work was supported by the project of the National Key Research and Development Program of China (Grant No. 2022YFC3902404), and the National Natural Science Foundation of China (Grant No. 22278142).
-
The authors declare that they have no known competing financial interests or personal relationships that could have appeared to influence the work reported in this paper.
-
# Authors contributed equally: Xingyu Niu, Mingming Yang
Full list of author information is available at the end of the article. - Copyright: © 2026 by the author(s). Published by Maximum Academic Press, Fayetteville, GA. This article is an open access article distributed under Creative Commons Attribution License (CC BY 4.0), visit https://creativecommons.org/licenses/by/4.0/.
-
About this article
Cite this article
Niu X, Yang M, Ding L, Hungwe D, Gong Y, et al. 2026. Semi-quantitative characterization of melanoidins during hydrothermal treatment of food waste and their impact on anaerobic digestion. Energy & Environment Nexus 2: e013 doi: 10.48130/een-0026-0008 

Semi-quantitative characterization of melanoidins during hydrothermal treatment of food waste and their impact on anaerobic digestion
- Received: 11 November 2025
- Revised: 22 February 2026
- Accepted: 27 March 2026
- Published online: 21 April 2026
Abstract: Melanoidins, the Maillard reaction products generated during food waste (FW) hydrothermal treatment, are difficult to quantify accurately due to their complex structures. Moreover, their dose-dependent inhibitory effects on anaerobic digestion (AD) and associated microbial impacts remain unclear. To address these issues, this study integrated ultraviolet-visible (UV-Vis) and three-dimensional excitation-emission matrix (3DEEM) spectroscopy to establish a multi-dimensional semi-quantitative characterization method for melanoidins. Combined with dosage experiments and microbial community analysis, this study systematically revealed the key action mechanisms of melanoidins in FW AD. The results showed that melanoidins accumulated continuously at hydrothermal temperatures of 120–200 °C, with their content positively correlated with temperature. Melanoidins exhibited a significant dose-dependent inhibitory effect on methane production potential: low doses (2.08 and 4.16 mg·mL−1) inhibited AD system activity, whereas high doses (6.24 and 8.32 mg·mL−1) induced system collapse. From a microbial ecological perspective, this study further clarified that melanoidins drive the AD system failure by significantly altering bacterial and archaeal community structures and inhibiting the metabolic functions of methanogenic archaea. For the first time, this work comprehensively elucidated the dose-effect relationship and microbial ecological responses of melanoidins in the FW system, providing novel insights into FW resource utilization.
-
Key words:
- Hydrothermal treatment /
- Melanoidins /
- Parallel factor analysis /
- Methane /
- Microbial analysis