


-
As a staple solid waste from the coal mining process, the amount of coal gangue (CG) has accumulated to 7 billion tons in China and is expected to increase steadily[1]. Considering its inherent nature, thermal conversion of CG, for example, combustion[2,3], offers a promising means to reduce its volume while recovering the contained heat energy[4]. However, direct combustion of CG still faces technical challenges due to its low volatile matter and high ash content[5]. Such challenges could be alleviated by co-combustion with those fuels or solid wastes comprising high volatile matter. For instance, sewage sludge (SS) is a by-product from wastewater treatment, which is enriched in organic compounds such as proteins, carbohydrates, and lipids of high volatility[6,7]. The co-combustion of CG and SS not only reduces waste volume and promotes the decomposition of organic matter[8], but also enables the effective recovery of thermal energy released during combustion[9]. Therefore, a thorough investigation of the co-combustion mechanisms of CG and SS is of great importance for advancing waste-to-energy technologies and achieving sustainable solid waste management.
Many scholars have studied the combustion characteristics of CG, SS, and their blends by thermogravimetric analysis (TGA)[10−12]. Wang et al.[12] found that adding SS, characterized by low ignition temperature and the burnout temperatures and rapid volatile release, significantly improves the ignition behavior and burnout efficiency of CG, while pressure and heating-rate conditions further modulate sludge reactivity and overall combustion kinetics. Kinetic analyses revealed that increasing the sludge blending ratio consistently reduces the activation energy of the mixed fuel, demonstrating enhanced reaction activity and a clear catalytic-like effect of sludge on CG combustion. Deep learning has been increasingly applied in the CG combustion field mainly as a data-driven modeling tool, where artificial neural networks (ANNs) are used to predict thermogravimetric (TG) and combustion behaviors under different mixing ratios, temperatures, and heating rates[13]. However, current studies remain limited in scope, with deep learning largely serving as a supplementary predictive method rather than being fully integrated with combustion mechanisms or multi-scale physicochemical interpretations. Yang et al.[14] found that SS ignites and burns at significantly lower temperatures than coal due to its abundant low-grade volatile matter, enabling rapid initial devolatilization and combustion. Its combustion proceeds through chemically controlled volatile burning, followed by diffusion-controlled burnout of residual volatiles and char, suggesting that blending sludge with coal can enhance overall ignition and burnout performance. Yan et al.[15] investigated the co-combustion behavior of CG and SS, and indicated that SS was conducive to the improvement of CG fuel reactivity, and when the SS blending ratio was greater than 60%, the ignition temperature and burnout temperature of co-combustion decreased, and the comprehensive combustion index increased. Although previous studies have reported the non-isothermal combustion characteristics of CG and SS using TGA, this technique primarily elucidates the intrinsic chemical reactions of the two fuels. However, in practical industrial applications, CG and SS are mostly combusted under isothermal conditions. This process does not rule out the influence of diffusion on the combustion process. At present, the isothermal combustion and interaction of CG and SS have not been reported or compared systematically. In addition, the deep learning approach may be one of the effective means to predict the co-combustion characteristics of mixed fuels in the future. Therefore, it is highly important to study the isothermal combustion behavior of CG and SS and to compare it with non-isothermal combustion for industrial utilization.
The present contribution systematically investigates the co-combustion behavior of CG and SS under both isothermal and non-isothermal conditions. Experiments were conducted using a sliding tube furnace and a simultaneous TG-differential scanning calorimetry (DSC) system. The influence of the blending ratio on the co-combustion characteristics of CG and SS was comprehensively evaluated. In addition, the kinetic behavior of the co-combustion process was analyzed using both model-fitting and model-free approaches. To further elucidate the underlying mechanisms, the interplay between CG and SS components during isothermal co-combustion was examined in detail. Moreover, an ANN model was developed to predict the co-combustion characteristics of CG-SS blends. Overall, this work provides new insights into the isothermal co-combustion behavior of CG and SS and offers valuable data for their efficient utilization in circulating fluidized bed combustion (CFBC) power plants.
-
In this study, samples of CG and SS from Shanxi Pingshuo Coal Gangue Power Plant and Yangquan Municipal Sewage Treatment Plant, respectively, were used as the experimental material. Both of them were dried in an oven at 105 °C for 48 h before utilization. The dried samples were then crushed and sieved into particles within 75–150 μm in size. Table 1 gives their proximate and ultimate analysis results, as well as their heating values and ash chemical composition, in accordance with Chinese Standards GB/T 212-2008, GB/T 31391-2015, GB/T 213-2008, and GB/T 1574-2007. It can be seen that the CG sample exhibits a relatively high content of ash and fixed carbon, accompanied by a low volatile matter content. In contrast, the SS sample also shows a high ash content but possesses a significantly higher volatile matter fraction (approximately 35%), indicating a stronger potential for combustion reactivity. Elemental analysis reveals that both CG and SS are enriched in carbon (C) and oxygen (O). However, the carbon content in CG (33.70 wt%) is considerably higher than that in SS (21.65 wt%), resulting in a notably greater calorific value for CG (14.17 MJ/kg), compared with SS (9.29 MJ/kg).
Table 1. Proximate, ultimate analysis, and ash chemistry of CG and SS samples
Sample Proximate analysis (wt%) Ultimate analysis (wt%) LHV (MJ/kg) Ash composition (wt%) Mad Ad Vd FCd Cd Hd Obd Nd Sd Q SiO2 Al2O3 Fe2O3 MgO CaO P2O5 K2O SO3 TiO2 Na2O CG 1.00 50.40 19.83 29.77 33.70 2.88 9.71 0.67 2.64 14.17 46.4 46.2 2.8 0.3 0.5 0.7 0.5 0.5 1.8 0.1 SS 4.00 56.25 35.00 8.75 21.65 3.36 12.37 2.68 3.69 9.29 29.5 16.5 22.1 2.3 8.4 13.6 2.2 1.8 0.7 1.2 Abbreviations: ad: air dry basis; d: dry basis; M: moisture; A: ash yield; V: volatile matter; FC: fixed carbon; LHV: lower heating value; b: by difference. Regarding inorganic components, CG is primarily composed of silicon and aluminum, whereas SS mainly contains silicon and iron, with the Fe2O3 content reaching as high as 22.1%. This indicates a pronounced enrichment of iron-bearing minerals in SS. Overall, the distinct differences in organic and inorganic compositions between CG and SS provide a fundamental basis for understanding their co-combustion characteristics.
To comprehend their co-combustion behavior, blends of CG and SS on a weight basis were prepared. The mass fractions of SS in the samples varied from 0%, 30%, 50%, 70%, and 100%, and are denoted subsequently as CG, 3SS7CG, 5SS5CG, 7SS3CG, and SS for simplicity.
Combustion experimentations
Isothermal and non-isothermal combustion experiments
-
The isothermal combustion experiments of CG and SS were carried out in a sliding tube furnace reaction system, as shown in Fig. 1. The experimental system consists of a gas distribution system, a combustion reaction system, and an exhaust gas treatment system. The gas distribution system was composed of O2 and N2, and the gas flow rate was controlled at 1 L/min. For each experiment, an accurately weighed 0.5 g of sample was evenly spread in a quartz boat, which was placed in the to-be-heated area of the furnace tube. When the furnace chamber reached the set temperature, the furnace body was quickly slid to the location of the sample to initiate the combustion reaction. After the reaction, the furnace body was moved to the other side, and the quartz boat was cooled and removed for weighing. Samples were taken and weighed at different combustion time intervals before the sample mass became constant. To ensure the accuracy of the experimental results, at least two repeated experiments were carried out under each specific working condition.
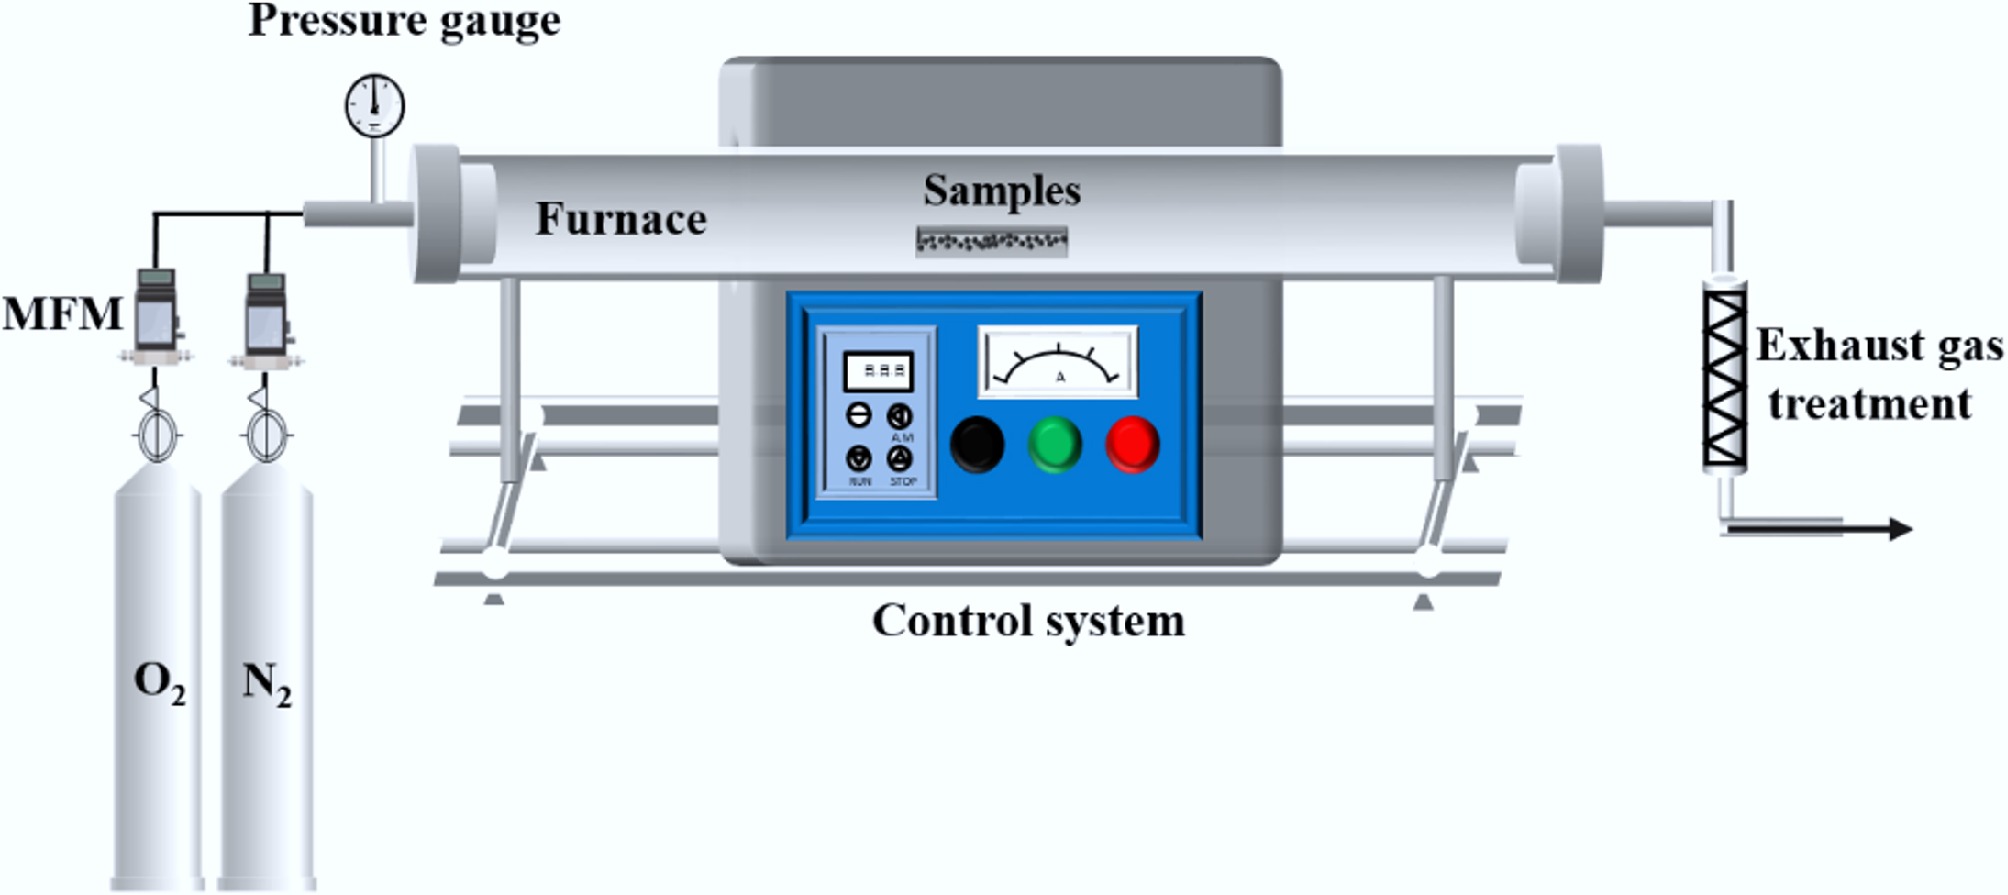
Figure 1.
Tube furnace combustion system.
The non-isothermal co-combustion behavior of CG and SS was studied using a TG and DSC instrument (METTLER TOLEDO, Swiss). During the TGA runs, a constant gas flow rate of 100 mL/min was used for each of the different atmospheres (21% O2/79% N2, N2) employed. The initial mass of the sample was 10 ± 0.5 mg. The sample was heated from 30 to 100 °C at a heating rate of 10 °C/min, and held at this temperature for 10 min to complete the removal of free water, and then further heated to 1,000 °C. To eliminate the system error, a blank test was performed before the experiment to provide a baseline, and was repeated to ensure the accuracy of the results.
Analysis of combustion characterization and interaction
-
To better compare the combustion rate under isothermal and non-isothermal combustion conditions, the average combustion rate r of the isothermal reaction of CG and SS was defined as Eq. (1):
$ \mathrm{r}\mathrm{_{i\sim j}}=\dfrac{\text{TG}_{\text{i}}-\text{TG}_{\text{j}}}{\text{j}-\text{i}} $ (1) where, ri~j is the average burning rate in i~j min (%/min); TGi and TGj are the weight loss of the sample at i and j min, respectively (%).
Combustion characteristic temperatures, including ignition temperature (Ti, °C), burnout temperature (Tb, °C), and peak temperature (Tp, °C), were important parameters for evaluating the combustion characteristics of fuels, which can be obtained from TG curves and first-order derivative thermogravimetric (DTG) curves. The TG curve separation method was used to determine the ignition temperature Ti of the samples, i.e. the temperature point at which the TG curves of the samples in the oxidation and pyrolysis experiments started to separate[16]. The end point of the mass loss rate of 1%/min was identified as the burnout temperature Tb[17]; the point of maximum mass loss rate was the peak temperature Tp, and Tp1, Tp2, and Tp3 corresponded to the temperatures of the first, second, and third main peaks in the DTG curve, respectively[18]. The comprehensive combustion characteristic index S[19] (%2/[min2·°C3]) was used to quantify the co-combustion characteristics of the blend, and S was calculated from Eq. (2):
$ \mathrm{S}=\dfrac{{\text{DTG}}_{\max }{\text{DTG}}_{\text{mean}}}{\mathrm{T}_{\mathrm{i}}^{2}{\mathrm{T}}_{\mathrm{b}}} $ (2) where, DTGmax is the maximum rate of weight loss (%/min); DTGmean is the average rate of weight loss (%/min); Ti and Tb are the ignition temperature and the burnout temperature (°C), respectively.
To track mass evolution during isothermal combustion, the quartz boat was periodically removed and weighed until the sample mass stabilized; the weight loss was then calculated using Eq. (3):
$ {\text{TG}}_{\text{i}}=\dfrac{{\text{w}}_{\text{i}}-{\text{w}}_{\text{1}}}{{\text{w}}_{\text{0}}}\text{×100} $ (3) where, i is the combustion time (min); wi is the total mass of the sample and the quartz boat after burning for i min (g); wl is the mass of quartz boat (g); w0 is the initial mass of the sample (g).
To evaluate the interactions between CG and SS, the theoretical TG and DTG values of the blends were compared. A greater deviation between the experimental and theoretical TG and DTG curves indicated a stronger interaction between CG and SS. The theoretical TG and DTG values for the co-combustion of CG and SS (TGC and DTGC) were calculated using Eqs (4) and (5), respectively:
$ {\text{TG}}_{\text{C}}={\text{µ}}_{\text{CG}}{\text{TG}}_{\text{CG}}+{\text{µ}}_{\text{SS}}{\text{TG}}_{\text{SS}} $ (4) $ {\text{DTG}}_{\text{C}}={\text{µ}}_{\text{CG}}{\text{DTG}}_{\text{CG}}+{\text{µ}}_{\text{SS}}{\text{DTG}}_{\text{SS}} $ (5) where, TGC (DTGC) represents the theoretical TG (DTG) values of the mixture (% and %/min, respectively); µCG and µSS denote the mass fractions of CG and SS in the mixture (%); TGCG (DTGCG) and TGSS (DTGSS) are the experimental TG (DTG) values of CG and SS, respectively (% and %/min).
Analysis of combustion kinetics
-
To further understand the co-combustion process, a combustion kinetics analysis was performed on CG, SS, and their blends. The kinetic parameters of the reactions in the isothermal and non-isothermal combustion processes of CG/SS mixtures were obtained using the model-fitting method, and the model-free method, respectively[20]. The two kinetic analysis methods are described below:
The basic rate equation used in the kinetic analysis is shown in Eq. (6)[21]:
$ \dfrac{\text{d}\alpha}{\text{dt}}=\mathrm{k(T)}\mathrm{f}\left(\alpha\right) $ (6) where, α is the conversion rate; t is the reaction time; k is the reaction rate constant; f(α) is the differential form of the reaction mechanism function.
The conversion rate α can be calculated by Eq. (7):
$ \alpha =\dfrac{{\text{m}}_{\text{0}}-{\text{m}}_{\text{t}}}{{\text{m}}_{\text{0}}-{\text{m}}_{\text{∞}}} $ (7) where, m0 is the initial mass of the sample (mg); mt is the mass of the sample at time t (mg); m∞ is the final mass of the sample (mg).
The relationship between k and the reaction temperature T is expressed by the Arrhenius equation (Eq. [8]) :
$ {\text{k}}={\mathrm{Aexp}}({-\text{E}}_{\text{a}}/\text{RT)} $ (8) where, A is the pre-exponential factor (s−1); Ea is the apparent activation energy (kJ/mol); R is the gas constant (8.314 J/[mol·K]).
The model fitting method was used to analyse the co-combustion of CG and SS under isothermal combustion. The reaction rate constant was a fixed constant, so Eq. (6) can be transformed to Eq. (9) (isothermal integral kinetic equation):
$ \dfrac{\text{1}}{\text{f}\left(\alpha\right)}\text{d}\alpha=\mathrm{kdt},\; \mathrm{g}\left(\alpha\right)=\text{kt} $ (9) Taking logarithms on both sides of the equal sign of Eq. (8) yields Eq. (10):
$ \ln {\text{k}}=\ln \left[\text{Aexp}\left(-\dfrac{\text{E}}{\text{RT}}\right)\right]=-\dfrac{\text{E}}{\text{R}}\cdot\dfrac{\text{1}}{\text{T}}+\ln \text{A} $ (10) The time periods of reaction occurrence at different temperatures were selected, and the conversion rate α (0.1–0.9) within the reaction process was substituted into the commonly used kinetic mechanism equations, and the resulting values were fitted to the time t. The effect of the g(α)-t linear fit was evaluated on the basis of the value of the correlation coefficient (R2). The model g(α) with the best linear fit was selected as the optimal reaction mechanism. According to the slope k of the fitted kinetic function curves at different temperatures, a linear relationship of lnk–1/T at each temperature was established, and the apparent activation energy Ea of the isothermal co-combustion of CG and SS can be calculated from the slope of the fitted straight line (−Ea/R).
The model-free method was used to analyse the non-isothermal co-combustion of CG and SS. The isoconversional method is a model-free kinetic method. Its basic assumption is that the apparent activation energy corresponding to the same conversion rate is the same under different heating conditions. The Flynn-Wall-Ozawa method (FWO)[22,23] is one of the representative methods, which can avoid the assumption of the mechanism function and obtain a more realistic apparent activation energy. Therefore, the FWO method was used to calculate the non-isothermal combustion kinetic parameters of CG-SS.
The heating rate was defined as β = dT/dt. Equations (6) and (8) can be transformed into Eq. (11):
$ \dfrac{{\text{d}}\alpha}{{\text{f}}(\alpha)}=\dfrac{\text{A}}{\beta}{\text{exp}}(-\dfrac{{\text{E}}_{\text{a}}}{\text{RT}})\text{dT} $ (11) By integrating α and T between 0 − α and T0 − T, respectively, the integral kinetic equation was obtained as shown in Eq. (12):
$ \text{g}\left(\alpha \right)=\int \nolimits_{\text{0}}^{\alpha }\dfrac{{\text{d}}\alpha}{\text{f}\left(\alpha \right)}=\dfrac{\text{A}}{\beta }\int \nolimits_{{\text{T}}_{\text{0}}}^{\text{T}}\exp (-\dfrac{{\text{E}}_{\text{a}}}{\text{RT}}\text{)dT} $ (12) Let u = E/RT, and Eq. (13) can be obtained from Eq. (12):
$\begin{split} \text{g}\left(\alpha \right)=\;& \dfrac{\text{A}}{\beta }\int \nolimits_{{\text{T}}_{\text{0}}}^{\text{T}}\exp \left(-\dfrac{{\text{E}}_{\text{a}}}{\text{RT}}\right){\text{dT}}\approx\int \nolimits_{\text{0}}^{\text{T}}\exp \left(-\dfrac{{\text{E}}_{\text{a}}}{\text{RT}}\right){\text{dT}}\\ =\;&\dfrac{{\text{AE}}_{\text{a}}}{\beta\text{B}}\int \nolimits_{\infty}^{\text{u}}\left(\dfrac{{\text{e}}^{-\text{u}}}{{\text{u}}^{\text{2}}}\right){\text{du}}=\dfrac{{\text{AE}}_{\text{a}}}{\beta\text{R}}\text{P}\left(\text{u}\right) \end{split}$ (13) where, P(u) is the temperature integral, and there is no analytical solution. The FWO method used the approximate solution proposed by Doyle[24], as shown in Eq. (14):
$ \text{P}\left(\text{u}\right)=0.0048{\text{e}}^{-\text{1.0516u}} $ (14) The general formula of the FWO method can be obtained by combining Eqs (13) and (14), and taking the logarithm of both sides.
$ \ln (\beta)=\ln \left[\dfrac{{\rm A}\cdot{\rm E}}{{\rm R}\cdot{\rm g}\left(\alpha \right)}\right]-\text{5.331}-\text{1.052}\dfrac{\text{E}}{\text{RT}} $ (15) Since ln[A·Ea/R·g(α)] − 5.331 is a constant independent of heating rate (β), the apparent activation energy was obtained from the slope of lnβ – 1⁄T.
Artificial neural network model
-
In this study, a multilayer perceptron (MLP) model was employed and trained using the backpropagation algorithm, commonly referred to as a backpropagation neural network (BPNN), to predict the co-combustion behavior of CG and SS mixtures. The neural network was optimized using the Adam algorithm, which adaptively adjusted the learning rate for each parameter. This approach not only accelerated the training process but also enhanced the stability of the training outcomes. Although the algorithm was relatively memory-intensive, its impact was negligible for regression tasks involving small-scale datasets.
To further improve the model's performance, residual connections were incorporated into the architecture, effectively mitigating the issues of vanishing and exploding gradients during training. For modeling the isothermal and non-isothermal co-combustion of CG and SS, the key influencing factors—mixing ratio, ambient temperature, and reaction time—were selected as input features. The output targets were derived from experimental combustion data.
The activation functions used in the network were configured as follows: LeakyReLU between the input and hidden layers, LeakyReLU between hidden layers, and a purelin function between the final hidden layer and the output layer.
The model's predictive performance was evaluated using classical regression metrics: the coefficient of determination (R2), root mean square error (RMSE), and mean absolute error (MAE), which were calculated using Eqs (16)–(18). A higher R2 value, along with lower RMSE and MAE values, indicated superior predictive accuracy of the model.
$ \text{MAE}=\dfrac{\text{1}}{\text{N}}\left(\sum_{ }^{ }\limits\mathrm{_{i=1}^N}\left|\text{H}_{\text{i}}-\text{H}_{\text{pi}}\right|\right) $ (16) $ \text{RMSE}=\sqrt{\dfrac{\text{1}}{\text{N}}\left(\sum_{ }^{ }\limits\mathrm{_{i=1}^N}\left(\text{H}_{\text{i}}-\text{H}_{\text{pi}}\right)^{\text{2}}\right)} $ (17) $ \text{R}_{\text{2}}=1-\dfrac{\sum_{ }^{ }\limits\mathrm{_{i=1}^N}\left(\text{H}_{\text{i}}-\text{H}_{\text{pi}}\right)^{\text{2}}}{\sum_{ }^{ }\limits\mathrm{_{i=1}^N}\left(\text{H}_{\text{i}}-\overline{\text{H}}\right)} $ (18) -
Figure 2 shows the isothermal weight loss curves of CG and SS at 850 °C under an atmosphere of 21% O2/79% N2. As illustrated in the Fig. 2, the mass of both CG and SS decreased with time. The primary weight loss due to combustion reactions occurred within the first 3 min. With the extension of reaction time, the mass gradually stabilized. The final weight loss stabilized at 49.6% for CG and 55.7% for SS. The average combustion rate of CG exhibited a trend of first increasing and then decreasing (6.9
$ \rightarrow $ $ \rightarrow $ 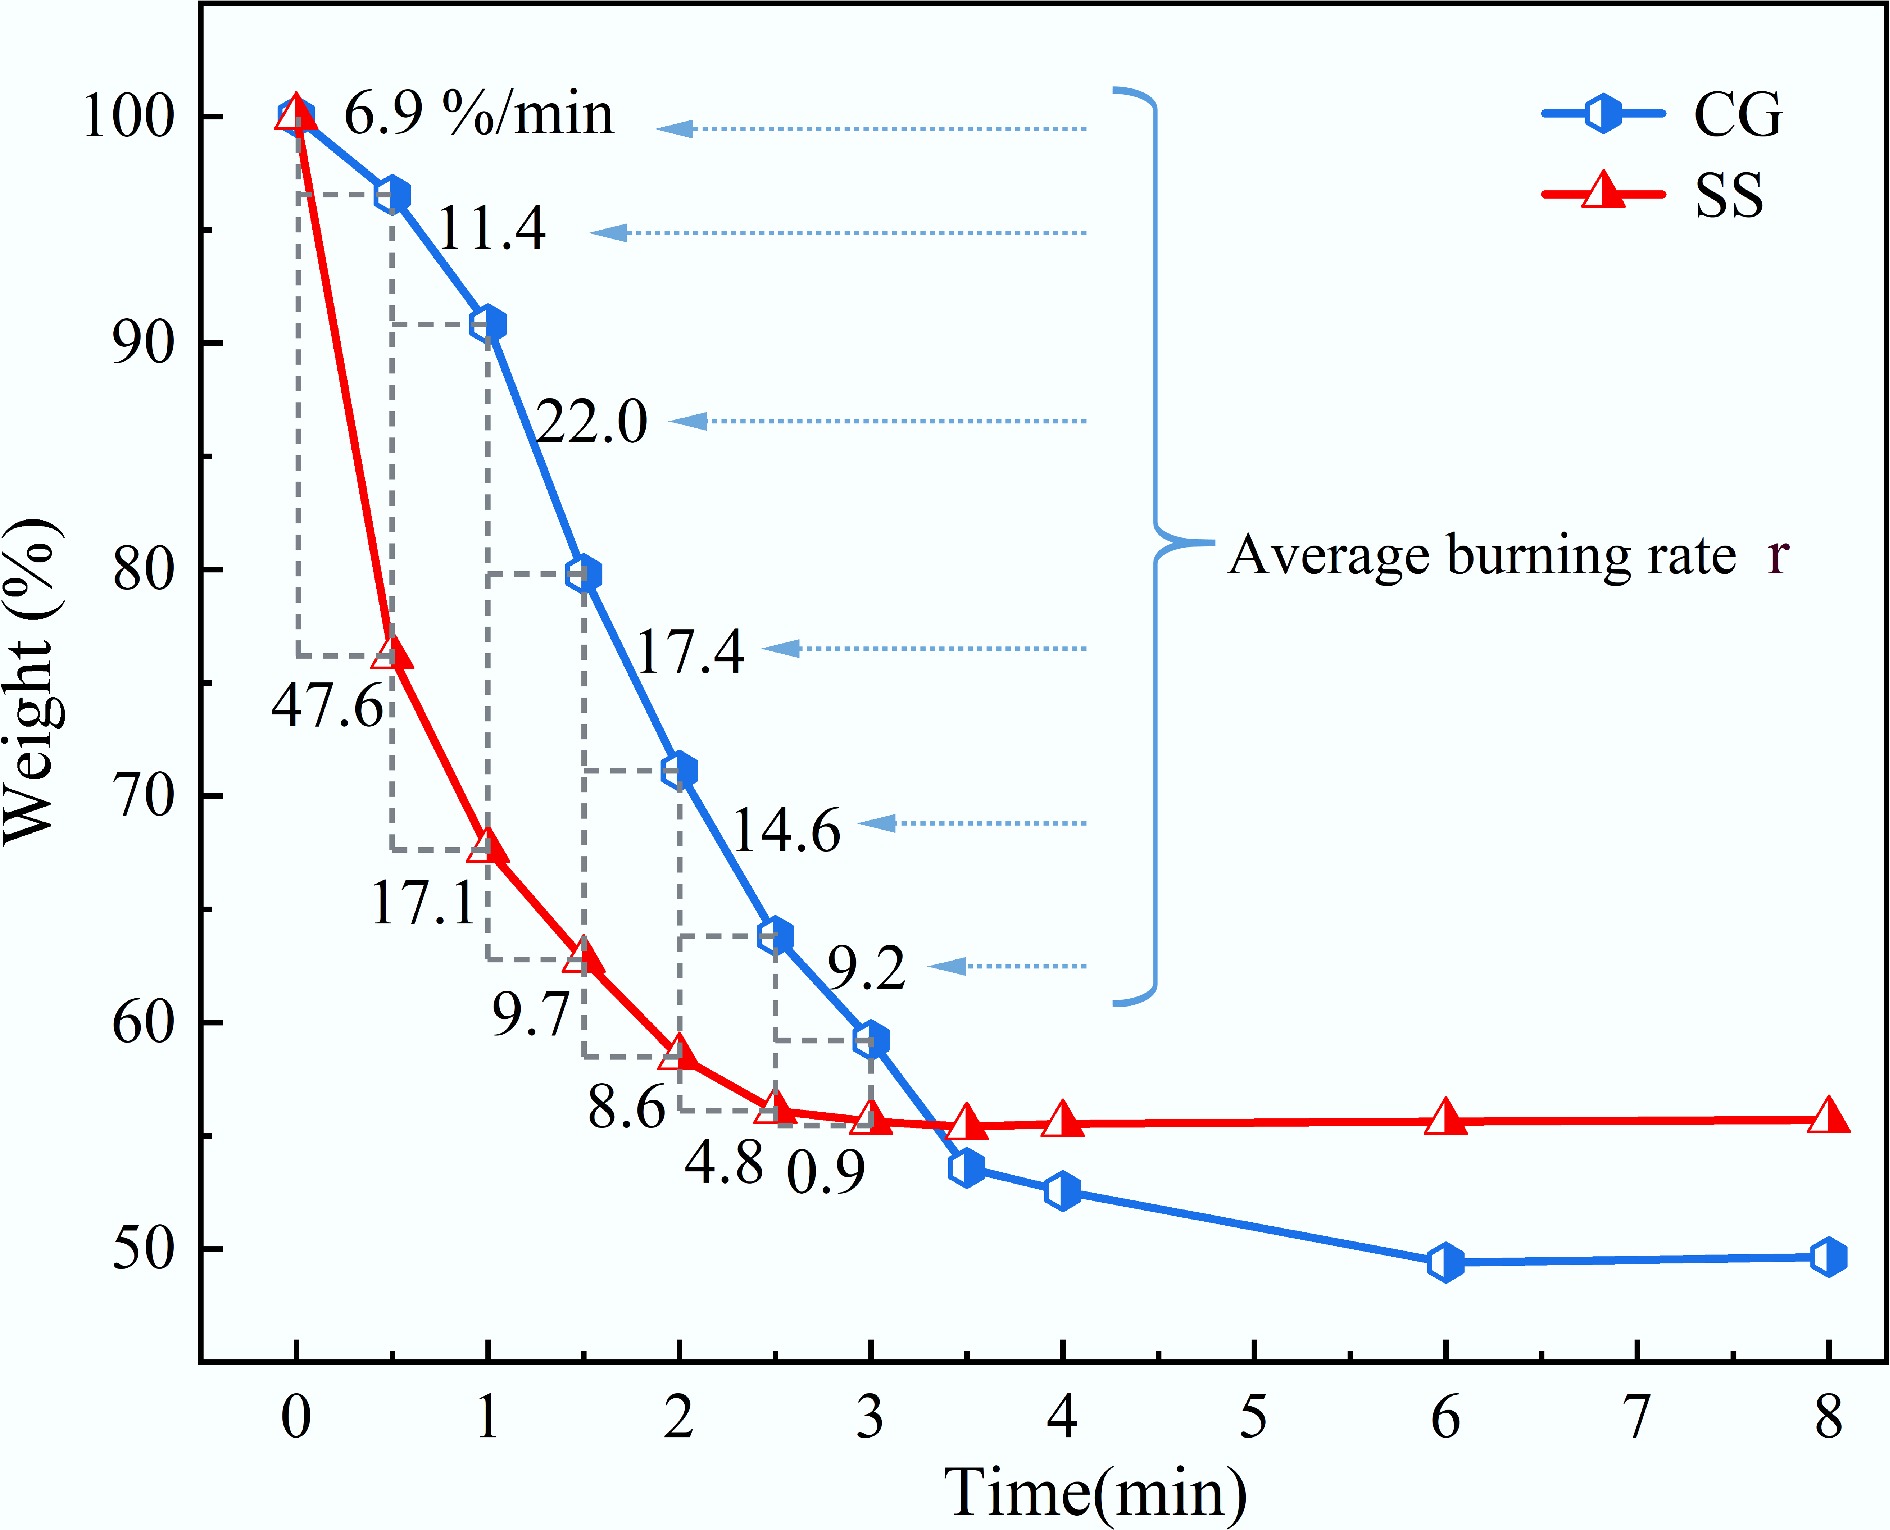
Figure 2.
Isothermal weight loss curves of CG and SS at 850 °C.
Figure 3 presents the non-isothermal TG, DTG, and DSC curves of CG and SS under an atmosphere of 21% O2/79% N2. As shown in the Fig. 3, the TG curve of CG indicated a total mass loss of approximately 51.0%. Compared to SS, CG exhibited a higher combustion reaction temperature, primarily within the range of 284–658 °C. Both the DTG and DSC curves showed a single strong peak, indicating that the release of volatiles and the combustion of fixed carbon occur simultaneously. This phenomenon may be attributed to the low volatile content and slow release rate of CG, resulting in no distinct boundary between volatile and fixed-carbon combustion. In contrast, SS combusted over a broader temperature range from 221 to 682 °C. According to the TG curve, the total mass loss of SS was approximately 42.9%. Based on the DTG inflection points, SS combustion was divided into three distinct stages[25]. The first stage occurred between 221 and 356 °C, followed by a shoulder peak around 356 to 473 °C, constituting the second stage. These two stages were primarily associated with the release and combustion of volatiles and the decomposition of biodegradable organic matter[26]. The third stage, spanning from 473 to 682 °C, corresponded to the burnout of fixed carbon and the combustion of stable, non-biodegradable macromolecular organic compounds[27]. Furthermore, the DTG and DSC curves of SS revealed that the peak corresponding to volatile matter loss and associated exothermic reaction was more intense than that of fixed carbon. This was attributed to the higher volatile content and lower fixed carbon content in SS.
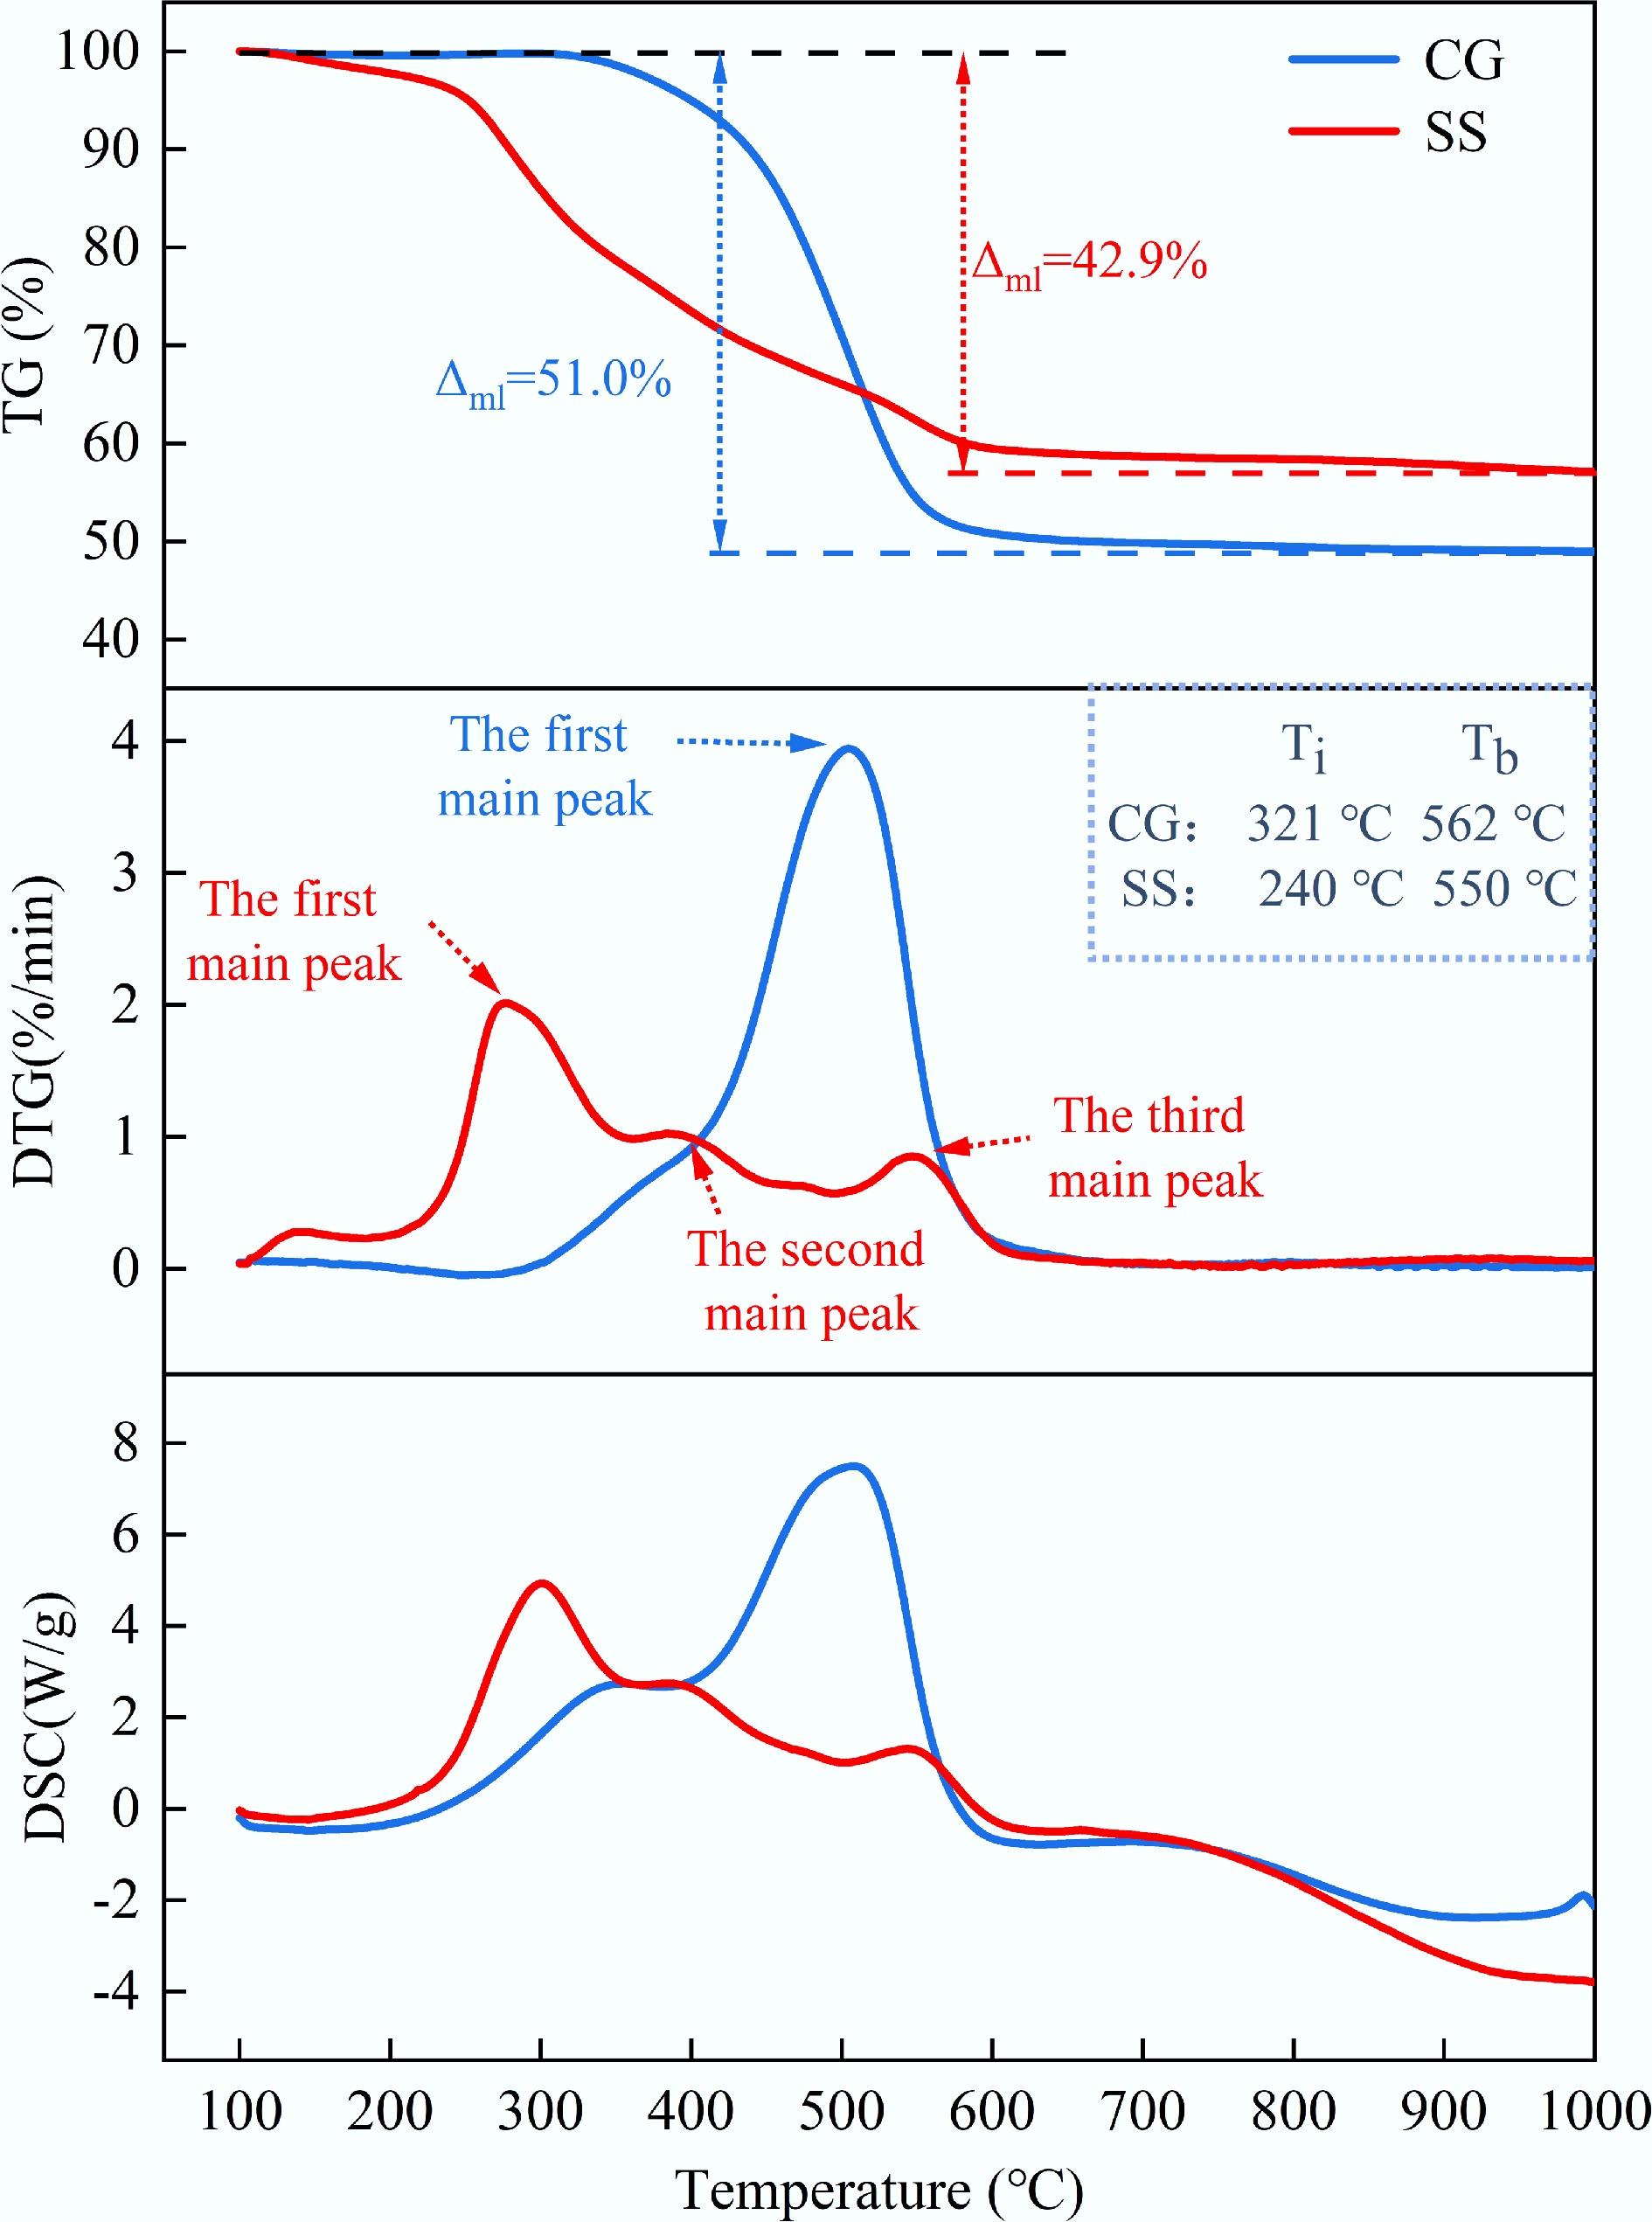
Figure 3.
TG, DTG, and DSC curves of CG and SS (21%O2/79%N2 atmosphere).
Figure 4 illustrates the TG and DTG curves of CG and SS under a N2 atmosphere. As shown in Fig. 4, the TG curve of CG indicated a total mass loss of approximately 19.8% under N2. The DTG curve displayed a single peak at around 514 °C, suggesting that both the release of volatiles and the thermal degradation associated with fixed carbon in CG occurred predominantly at high temperatures. In comparison, the TG curve of SS showed a total mass loss of approximately 38.4% under N2. Compared with combustion in an air atmosphere, the DTG curve of SS exhibited only the first two peaks under N2, which further supported the conclusion that the initial two stages of the combustion process were dominated by the release of volatiles, whereas the third stage corresponded to the burnout of fixed carbon.
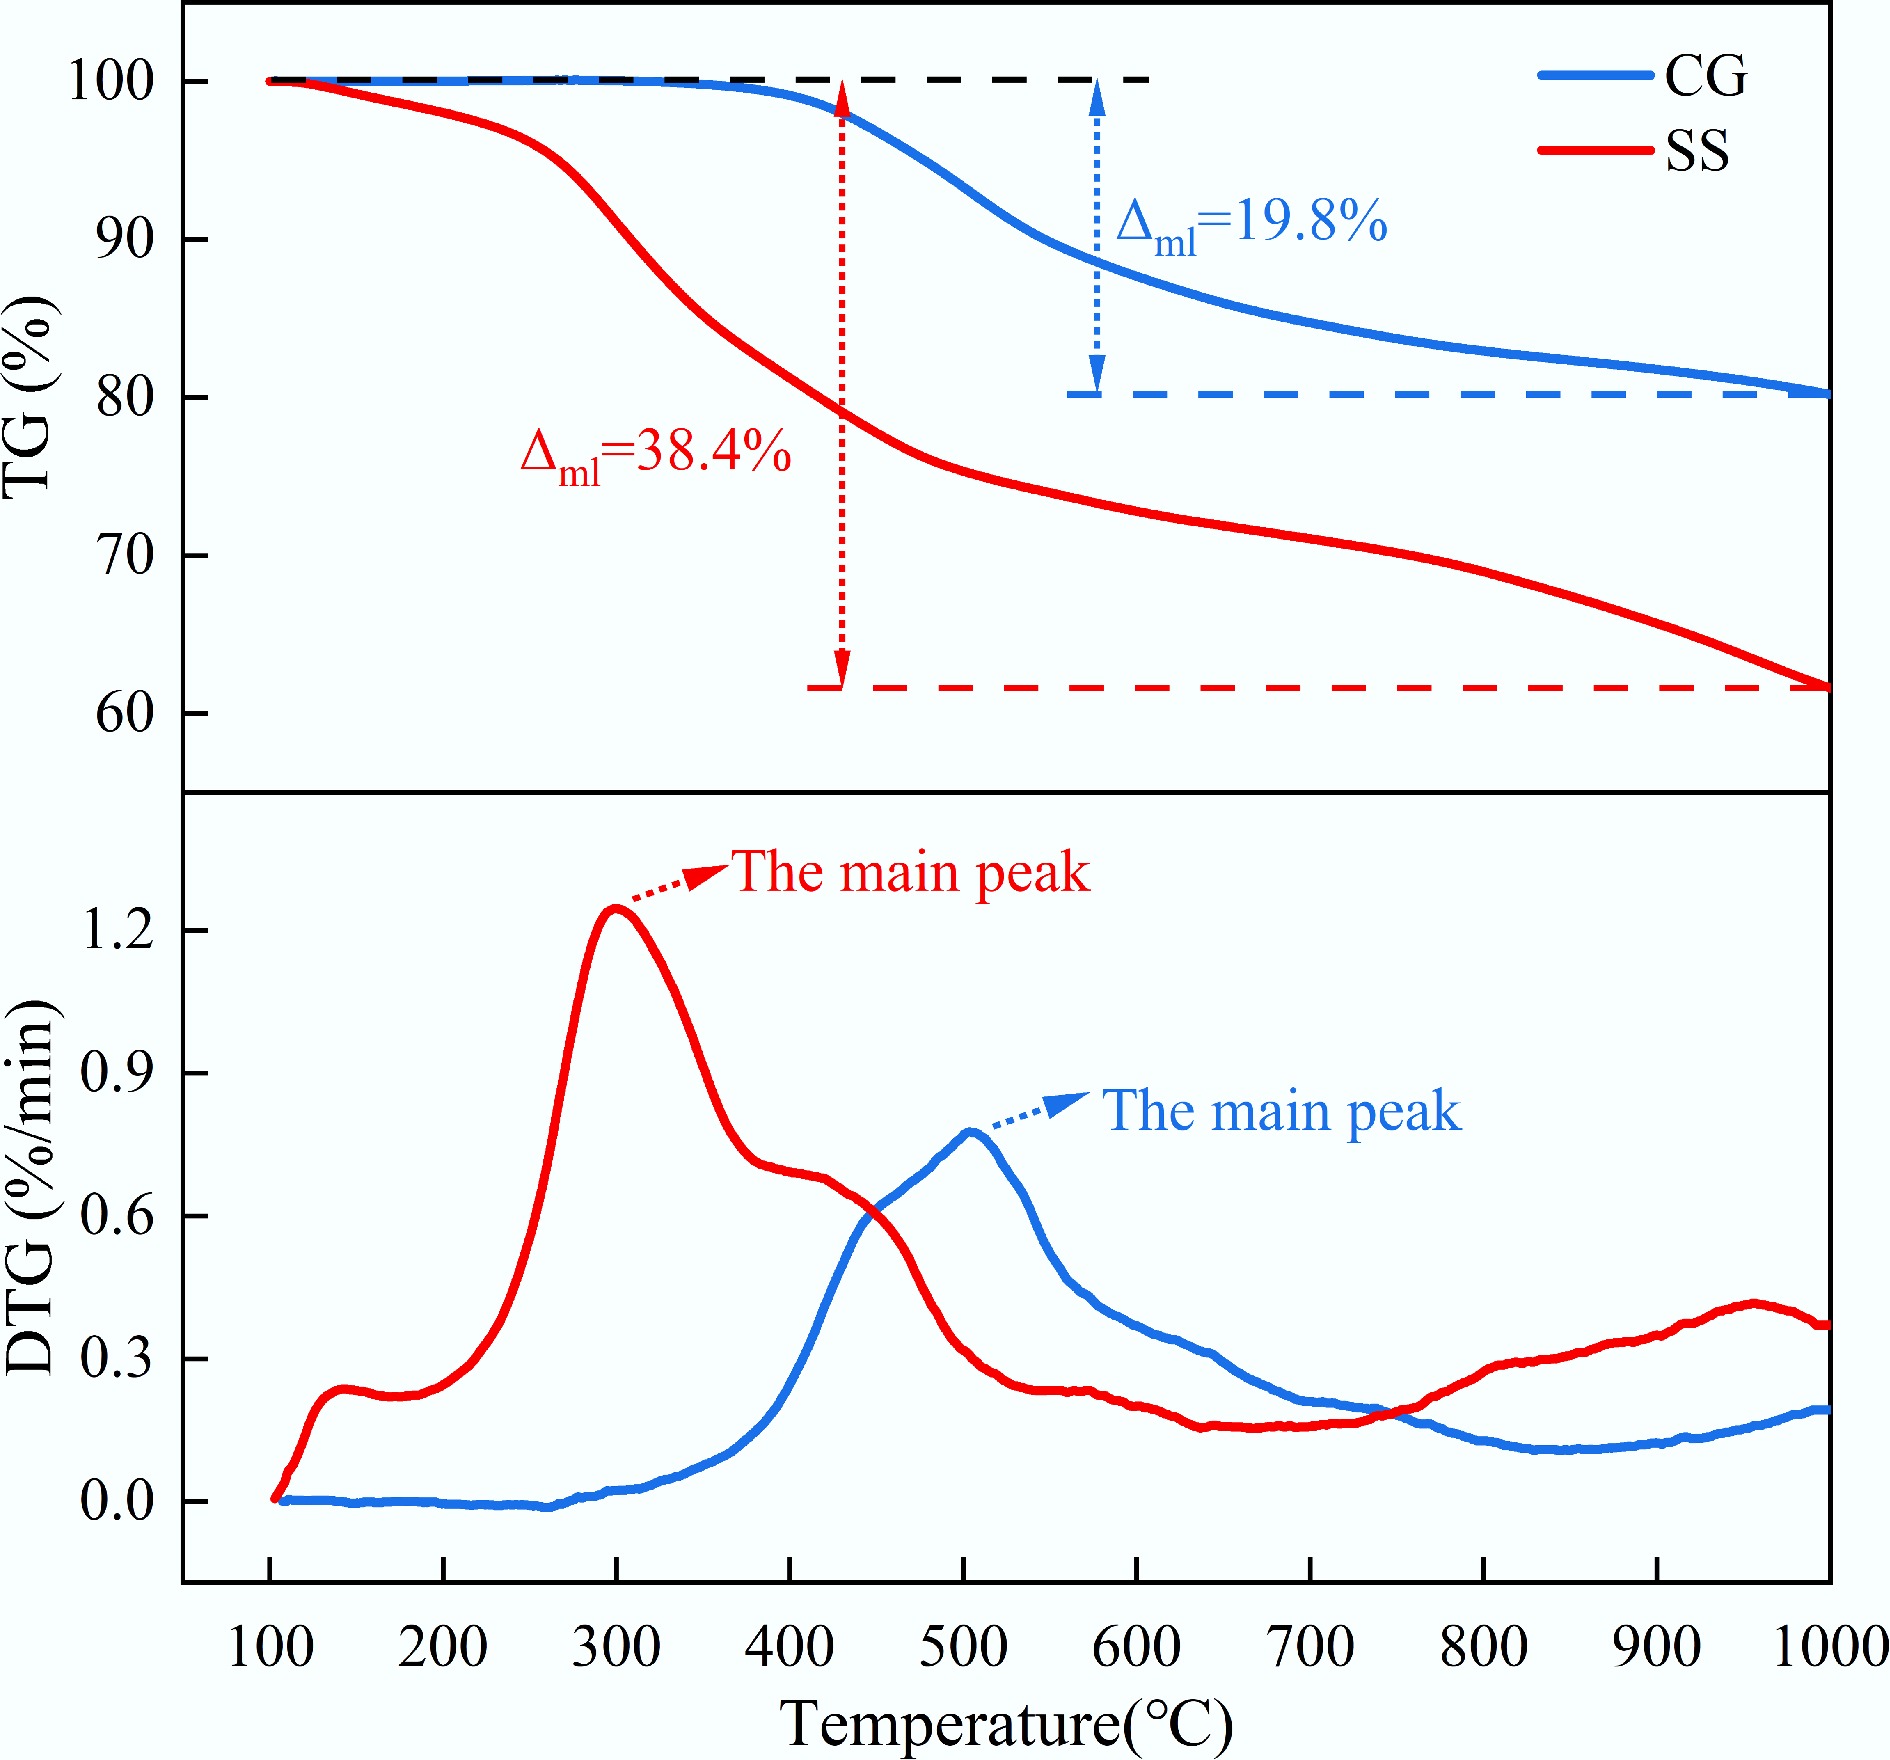
Figure 4.
TG and DTG curves of CG and SS (nitrogen atmosphere).
Based on the results from Figs 3 and 4, the ignition temperature (Ti), and burnout temperature (Tb) of CG were 321 and 562 °C, respectively. In contrast, SS exhibited a lower ignition temperature, with Ti and Tb of 240 and 550 °C, respectively. From Fig. 3, the maximum and average combustion rates during the main weight loss stage of SS were 2.01%/min and 0.46%/min, respectively (both lower than those of CG, which were 3.94%/min and 0.56%/min). These results indicated that SS exhibited higher reactivity than CG in the low-temperature region. In contrast, CG combustion was dominated by fixed carbon, and its reactivity became more pronounced at higher temperatures[27].
Co-combustion of CG and SS
-
Figure 5 shows the isothermal weight loss curves of CG, SS, and their blends at 850 °C in an atmosphere of 21% O2/79% N2. As observed, the weight loss curves of the blends lie between those of pure CG and SS. With increasing SS content in the blends, the residual mass at the end of combustion decreased, indicating enhanced combustibility. As shown in the Fig. 5, the major weight loss of the mixture took place within the initial 4 min of the reaction, after which the mass gradually stabilized. Increasing the proportion of SS accelerated the complete combustion of CG, SS, and their mixtures.
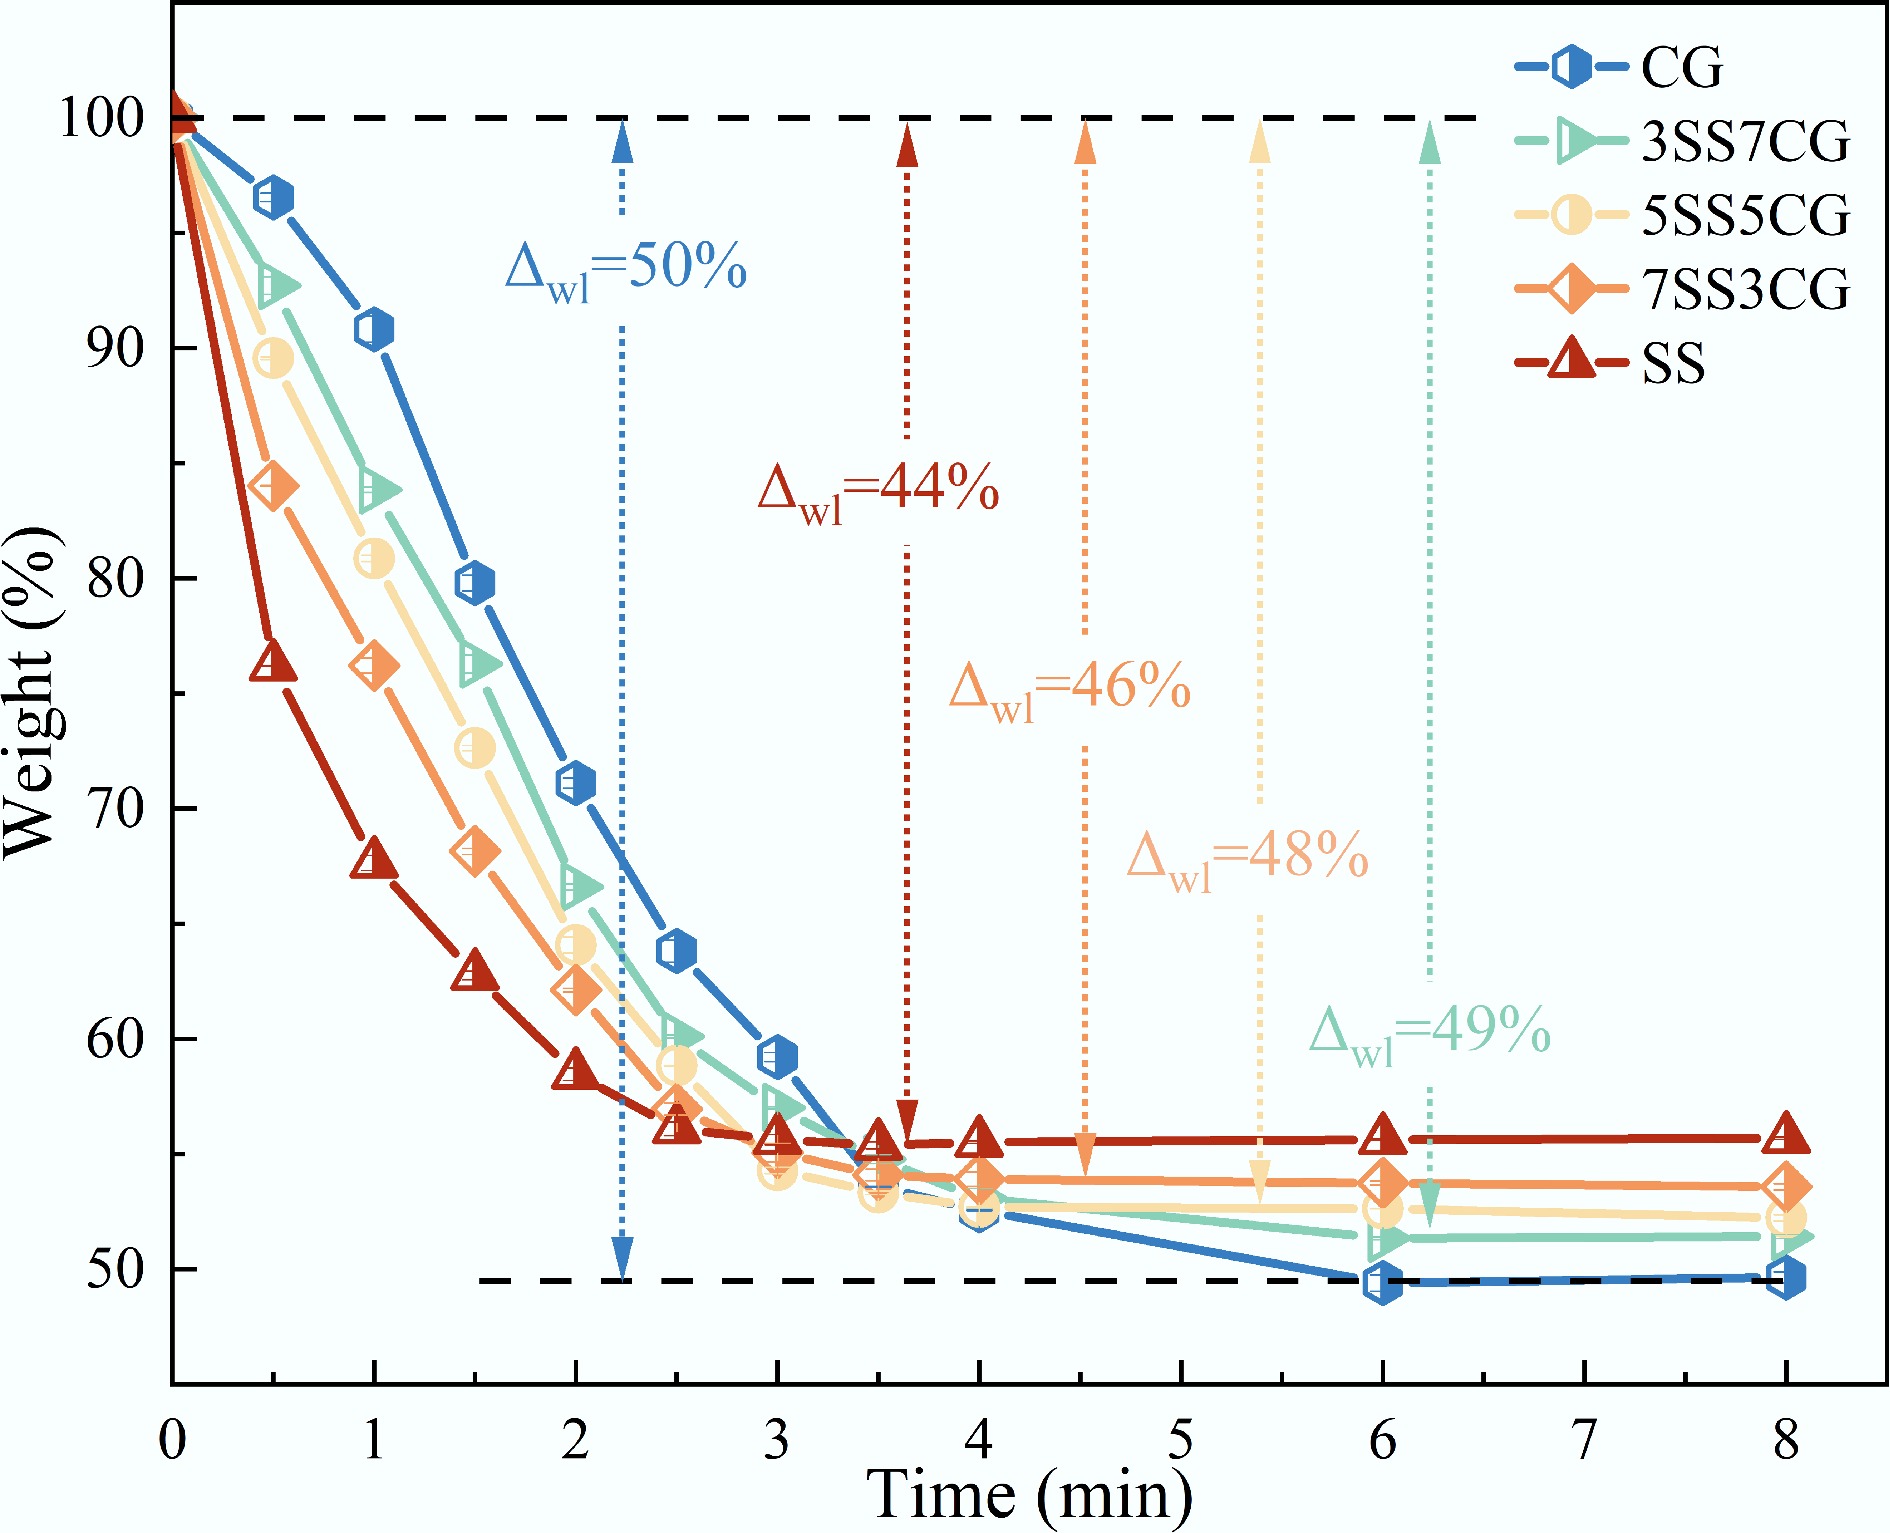
Figure 5.
Isothermal weight loss curves of CG and SS.
Table 2 presents the isothermal average combustion rates of CG, SS, and their blends at 850 °C. As shown in the table, the time at which the maximum combustion rate was reached shifted progressively closer to the initial stage with increasing SS proportion.
Table 2. Isothermal mean burning rate of CG, SS and their blends
Samples r0–0.5 (%/min) r0.5–1.0 (%/min) r1.0–1.5 (%/min) r1.5–2.0 (%/min) r2.0–2.5 (%/min) r2.5–3.0 (%/min) CG 6.9 11.4 22.0 17.4 14.6 9.2 3SS7CG 14.6 17.7 15.1 19.4 13.0 6.2 5SS5CG 20.9 17.4 16.5 17.1 10.5 9.1 7SS3CG 32.0 15.6 16.1 12.1 10.3 3.8 SS 47.6 17.1 9.7 8.6 4.8 0.9 Bold values represent the maximum isothermal mean burning rate among all time intervals. Figure 6 presents the TG, DTG, and DSC curves of CG, SS, and their blends under a 21% O2/79% N2 atmosphere with a heating rate of 10 °C/min. As shown in Fig. 6a, the major weight loss for all blends occurred within the temperature range of 170–600 °C. The TG curves of the blends lie between those of the individual fuels. With increasing SS content in the blend, the residual mass at the end of combustion decreased. Figure 6b shows that the blends exhibited two main peaks in the DTG curves, corresponding to the primary weight loss stages. As the proportion of SS increased, the TG and DTG profiles of the blends progressively shifted toward those of SS. The DTG results indicated that the maximum weight loss rate at higher temperatures increased with higher CG content, suggesting that the reactivity of the blends improved in the high-temperature region while decreasing in the low-temperature region. Additionally, when the proportion of CG reached 50%, the dominant peak of the blend's weight loss rate shifted from the first major peak to the second. This transition implied that the dominant combustion mechanism of the blend changed from volatile combustion to fixed carbon combustion.
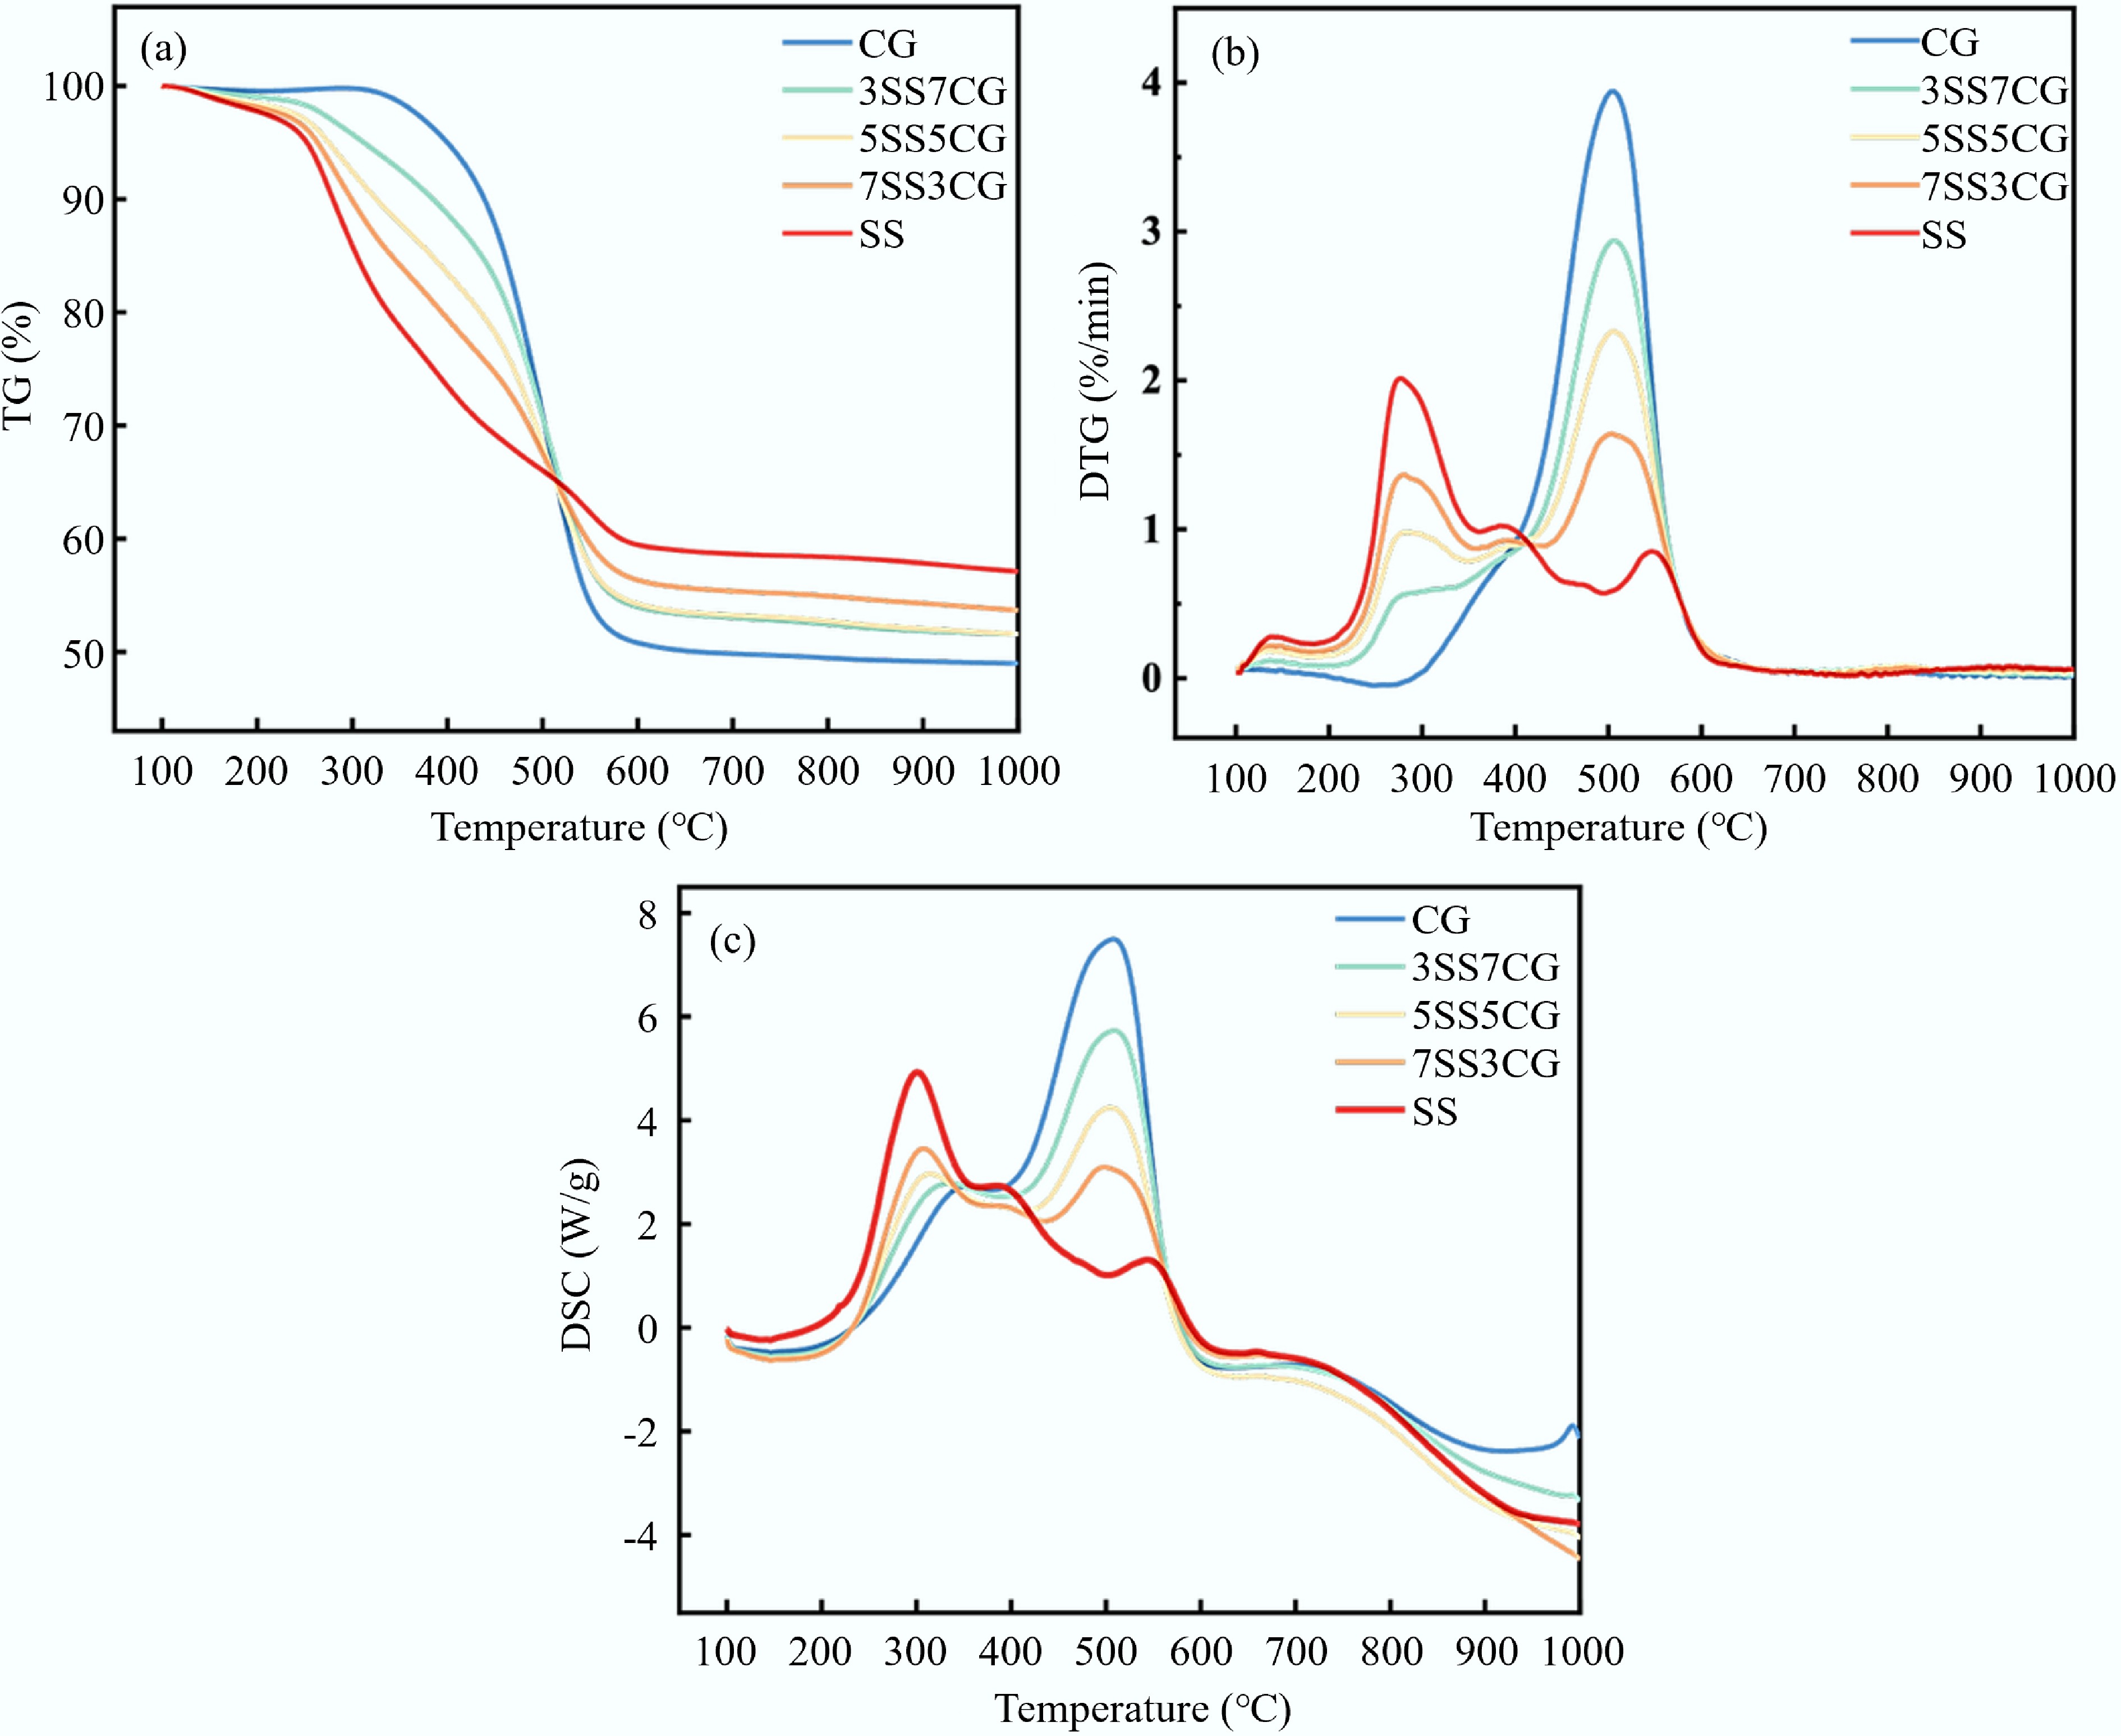
Figure 6.
(a) TG, (b) DTG, and (c) DSC curves of CG, SS, and their blends.
Table 3 presents the non-isothermal combustion characteristic parameters of CG, SS, and their blends. As shown in the table, the ignition temperature (Ti) of the blends decreased progressively with increasing SS content. This trend was primarily attributed to the higher content of low-molecular-weight compounds in SS, which possessed weaker chemical bonds compared to the macromolecular compounds in CG. Consequently, CG was more difficult to ignite than SS[27]. In addition, as the proportion of SS increased, the peak temperatures (Tp) of the combustion stages also increased, indicating a delayed combustion process compared to pure CG. Table 3 also reveals that the addition of CG enhanced the thermal stability of the blends. As the CG content increased, the burnout temperature (Tb) of the blends rose steadily, mainly due to the higher concentration of combustible components in CG at elevated temperatures. Analysis of the DTGmax values in Table 3 further supported these findings. When the CG content increased from 0% to 30%, DTGmax decreased from 2.0%/min to 1.6%/min. However, with further increases in CG content, the DTGmax shifted toward the second main peak and showed an increasing trend, from 1.6%/min to 3.9%/min, indicating enhanced reactivity of the blends in the high-temperature range. Moreover, the comprehensive combustion performance index (S) of CG was higher than that of SS, suggesting that the combustion performance of SS was inferior to that of CG. This was primarily due to the lower fixed carbon content and calorific value of SS[28]. As the CG content increased to 30%, the S value slightly decreased from 2.919 × 10⁻⁸ to 2.446 × 10⁻⁸ %2/(min2·°C3). However, when the CG proportion exceeded 30%, the combustion performance index of the blends surpassed that of pure SS. At a 50% CG mixing ratio, the S value reached its maximum of 3.328 × 10⁻⁸ %2/(min2·°C3), indicating that the addition of CG significantly improved the combustion characteristics of the blend, with the 5SS5CG sample exhibiting the best overall performance.
Table 3. Combustion behavior parameters of CG, SS and their blends (β = 10 °C/min)
Sample Ti (°C) Tp1 (°C) Tp2 (°C) Tp3 (°C) Tb (°C) DTGmax (%/min) DTGmean (%/min) S (%2/[min2·°C3]) CG 321.33 502.33 — — 562.00 3.944 0.558 3.781E–08 3SS7CG 292.00 273.17 506.17 — 558.83 2.937 0.521 3.211E–08 5SS5CG 253.83 277.83 507.17 — 556.17 2.329 0.512 3.328E–08 7SS3CG 243.33 284.17 510.16 — 552.00 1.638 0.488 2.446E–08 SS 240.00 282.33 388.33 548.17 549.50 2.013 0.459 2.919E–08 Synergistic effect of CG and SS during co-combustion
-
Figure 7 illustrates the deviation between theoretical and experimental TG values under isothermal combustion conditions, denoted ΔTG (ΔTG = TGC − TGE). A positive ΔTG value indicated the presence of synergistic effects. As shown in Fig. 7, the interaction between CG and SS during co-combustion at 850 °C primarily occurred within the first 4 min of the combustion process. The deviations were concentrated in two stages: in the first stage (0–1.5 min), ΔTG < 0, indicating that the initial interaction suppressed the mass loss. Among all samples, the 5SS5CG blend exhibited the strongest inhibitory effect, with a maximum suppression at 0.5 min (ΔTG = −2.6%). This may be attributed to the rapid release of large amounts of volatiles from SS during the early phase of isothermal combustion, which consumed a substantial amount of oxygen and reduced the local O2 concentration around the remaining fuel. Additionally, the high ash content of the SS may form a barrier layer on the surface of the mixture, impeding the contact between internal combustible components and oxygen, thereby suppressing the initial combustion rate. In the second stage (2–4 min), ΔTG > 0, suggesting that the interaction promoted the mass loss of the mixture during the later phase of combustion. The 5SS5CG sample showed the most significant promoting effect at 3 min (ΔTG = 2.53%), indicating a more intense combustion process. This suggested that after approximately 2 min, most of the readily volatile components had been exhausted, and the combustion shifted from the surface toward the inner particle layers of the CG-SS mixture. At this point, the combustion was dominated by the fixed carbon in CG, which facilitated the burnout of residual char in the SS, thus enhancing overall combustion performance[29].
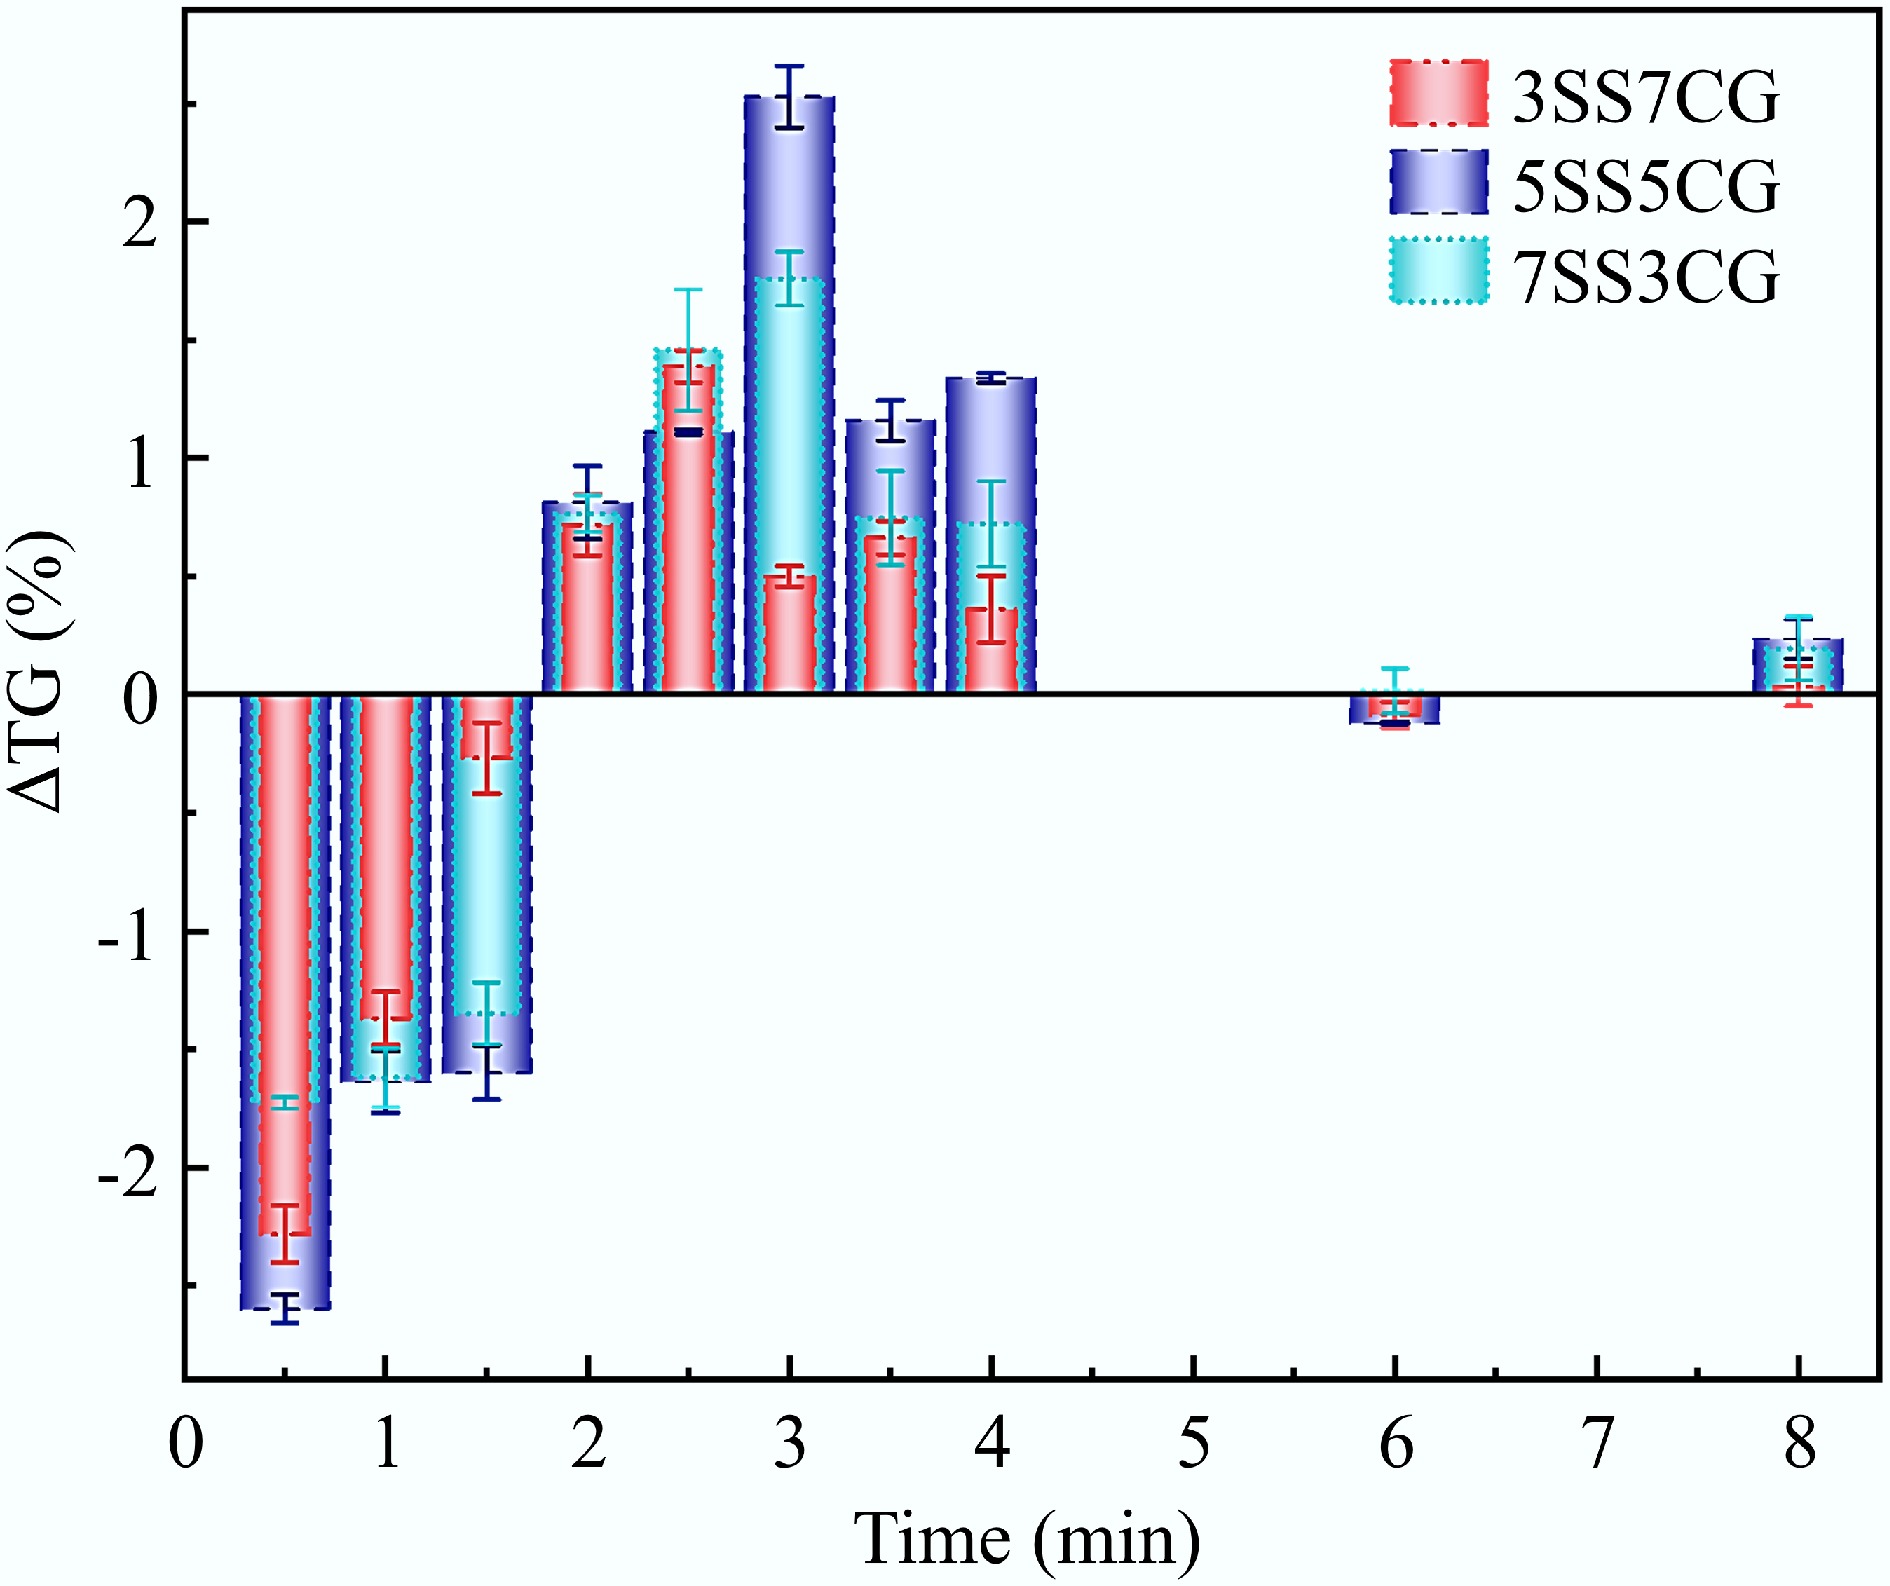
Figure 7.
The interaction between CG and SS in isothermal co-combustion at 850 °C.
To further validate the above hypothesis, the influence of combustion temperature on the interaction between CG and SS during isothermal co-combustion was investigated. Figure 8 presents the interaction behavior of the 5SS5CG sample at different combustion temperatures. As shown in Fig. 8, the effect of temperature on the co-combustion interaction consistently followed a pattern: initial inhibition of the combustion process, followed by a gradual shift towards a promoting effect as the reaction proceeded. At 750 °C, the co-combustion process was inhibited throughout the first 2 min. Over time, the degree of inhibition initially increased and then decreased. This behavior may be attributed to the gradual release and combustion of volatile matter at relatively low temperatures, which continuously consumed oxygen in the early stage and thereby suppressed the combustion of CG. As the release of volatiles approached completion, the inhibitory effect diminished. After 2 min, the interaction transitioned from inhibition to promotion, likely due to the formation of oxygen transport channels within the fuel layer facilitated by volatile release and the catalytic effects of inorganic components present in the SS ash. As the temperature increased, the initial inhibitory phase shortened and shifted earlier, occurring within the first 1.5 min, and the intensity of inhibition diminished. This trend suggests that elevated temperatures accelerated the release of volatiles, causing earlier competition for oxygen and thus shifting the inhibitory interaction to an earlier stage. At a combustion temperature of 950 °C, the release and combustion rate of volatiles significantly increased, and the combustion reactivity of fixed carbon was also enhanced, leading to a more rapid onset of synergistic interactions between CG and SS that promoted the overall combustion process.
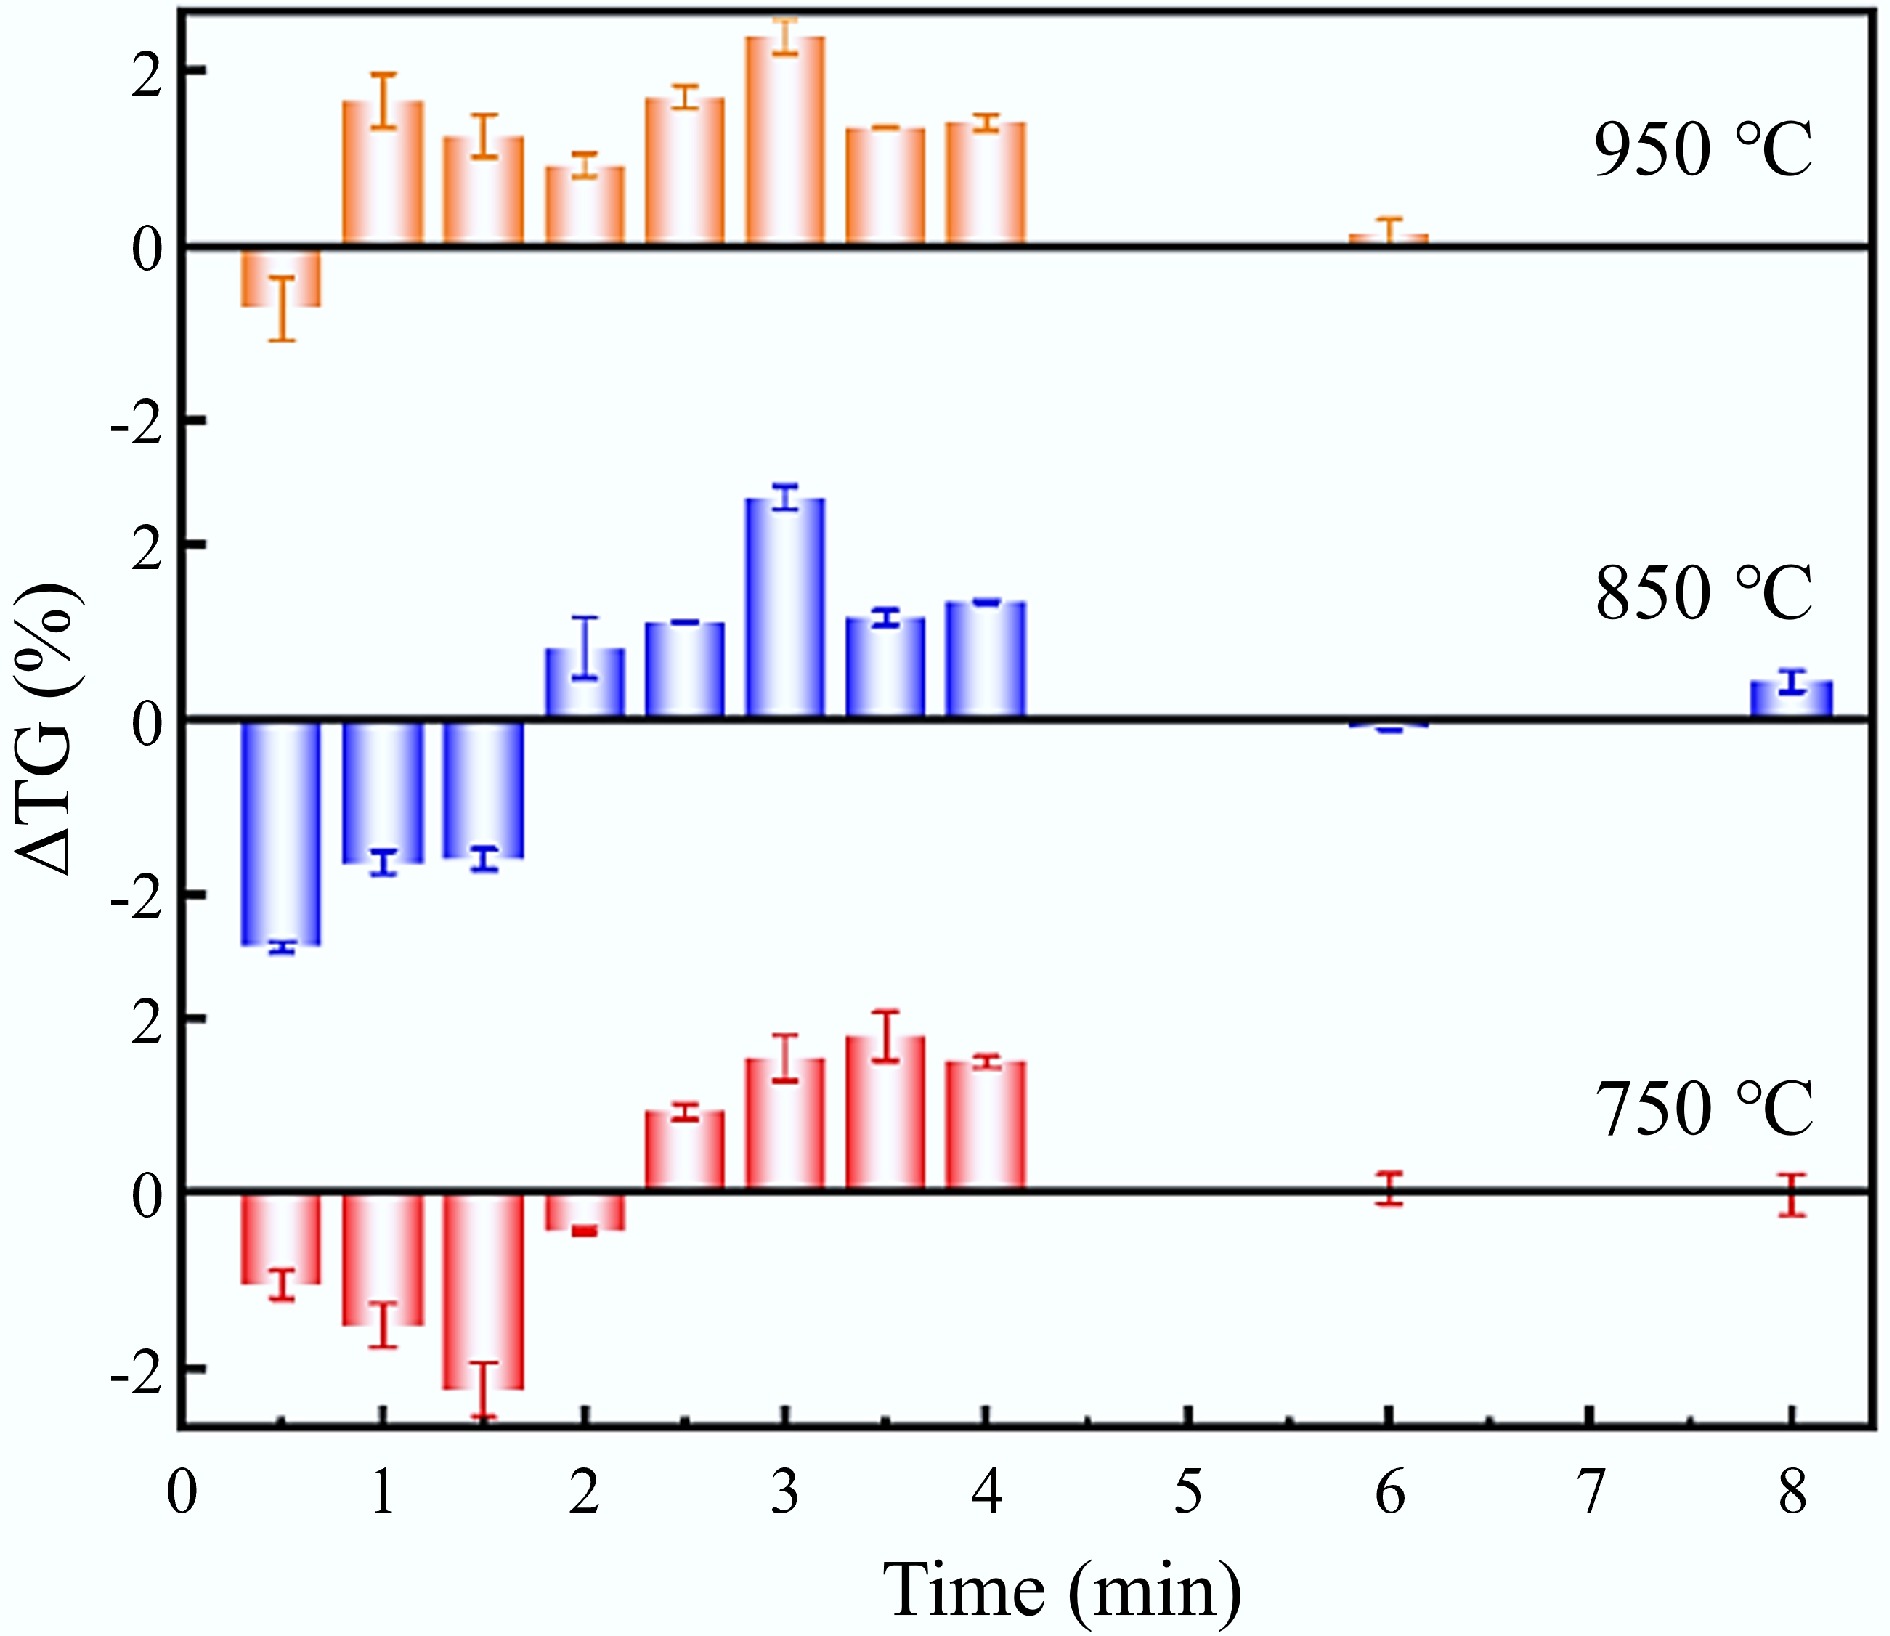
Figure 8.
The interaction of the 5SS5CG combustion process at different temperatures.
Figure 9 illustrates the deviation between theoretical and experimental DTG under non-isothermal combustion conditions, ΔDTG (ΔDTG = DTGC − DTGE), where a positive ΔDTG indicates the presence of synergistic interactions. As shown in Fig. 9, deviations between the theoretical and experimental weight loss rates of the mixtures were primarily observed in three distinct temperature ranges: 280–350, 350–500, and 510–600 °C. In the 280–350 °C range, the light blue area (ΔDTG > 0) suggested that the initial interaction slightly promoted the weight loss of the mixture. This was mainly attributed to the devolatilization and combustion of volatile matter from SS during the first stage, which facilitated the combustion of certain carbonaceous components in the CG, thereby accelerating the overall weight loss rate of the blend. Between 350 and 500 °C, a deep red area emerges, indicating a strong mutual inhibition between CG and SS. In this temperature interval, the experimental weight loss rate was significantly lower than the theoretical prediction, with the strongest inhibition observed when the SS blending ratio was 50% (ΔDTG = −0.27%/min). This inhibition was largely associated with the release of macromolecular gaseous volatiles from the blend and the high ash content of SS. During the co-combustion of CG and SS, excessive ash can hinder the combustion of residual carbon, adversely affecting the subsequent oxidation of CG. In the 510–600 °C range, the observed weight loss rate notably exceeded the theoretical value, indicating a pronounced promoting effect on fixed carbon combustion. The maximum promoting effect was also seen at a 50% SS ratio (ΔDTG = 0.18%/min). This enhancement is primarily linked to the inorganic components present in SS. The adsorption of oxygen by fixed carbon is a critical factor affecting its combustion rate. During the combustion process, metallic and semi-metallic compounds in the SS may capture atmospheric oxygen through pore structures on the SS surface, thereby enhancing oxygen transfer to the surface of fixed carbon. Previous studies have shown that metal oxides and salts such as Fe2O3, MnO2, CuO, ZnO, and BaCO3 can enhance combustion reactivity and reduce characteristic combustion temperatures[30]. Furthermore, Zhang et al.[31] reported that such catalytic effects were the most significant during the fixed carbon combustion stage. Metal oxides in SS ash, such as Fe2O3, CaO, MgO, and K2O, act as catalysts mainly through oxygen transfer and redox cycling, which facilitate char oxidation and lower the reaction energy barrier. In addition, alkali, and alkaline-earth metal oxides can weaken C–C and C–O bonds in the carbon matrix, and promote pore development, increasing the number of active reaction sites. As a result, their catalytic effect becomes most pronounced during the high-temperature fixed carbon combustion stage, consistent with the observed ΔDTG enhancement and reduced apparent activation energy. According to the ash chemical analysis (Table 1), SS contained significantly higher levels of catalytically active species such as Fe2O3, CaO, MgO, and K2O than CG. These components can promote the combustion of CG. Additionally, the heat released by the early-stage volatile combustion of SS enhanced the endothermic process of CG fixed carbon combustion. Simultaneously, the heat generated from CG carbon oxidation accelerates the decomposition of SS residues. The porous structure formed by the release of large amounts of volatiles from SS further facilitates mass and heat transfer during the co-combustion process.
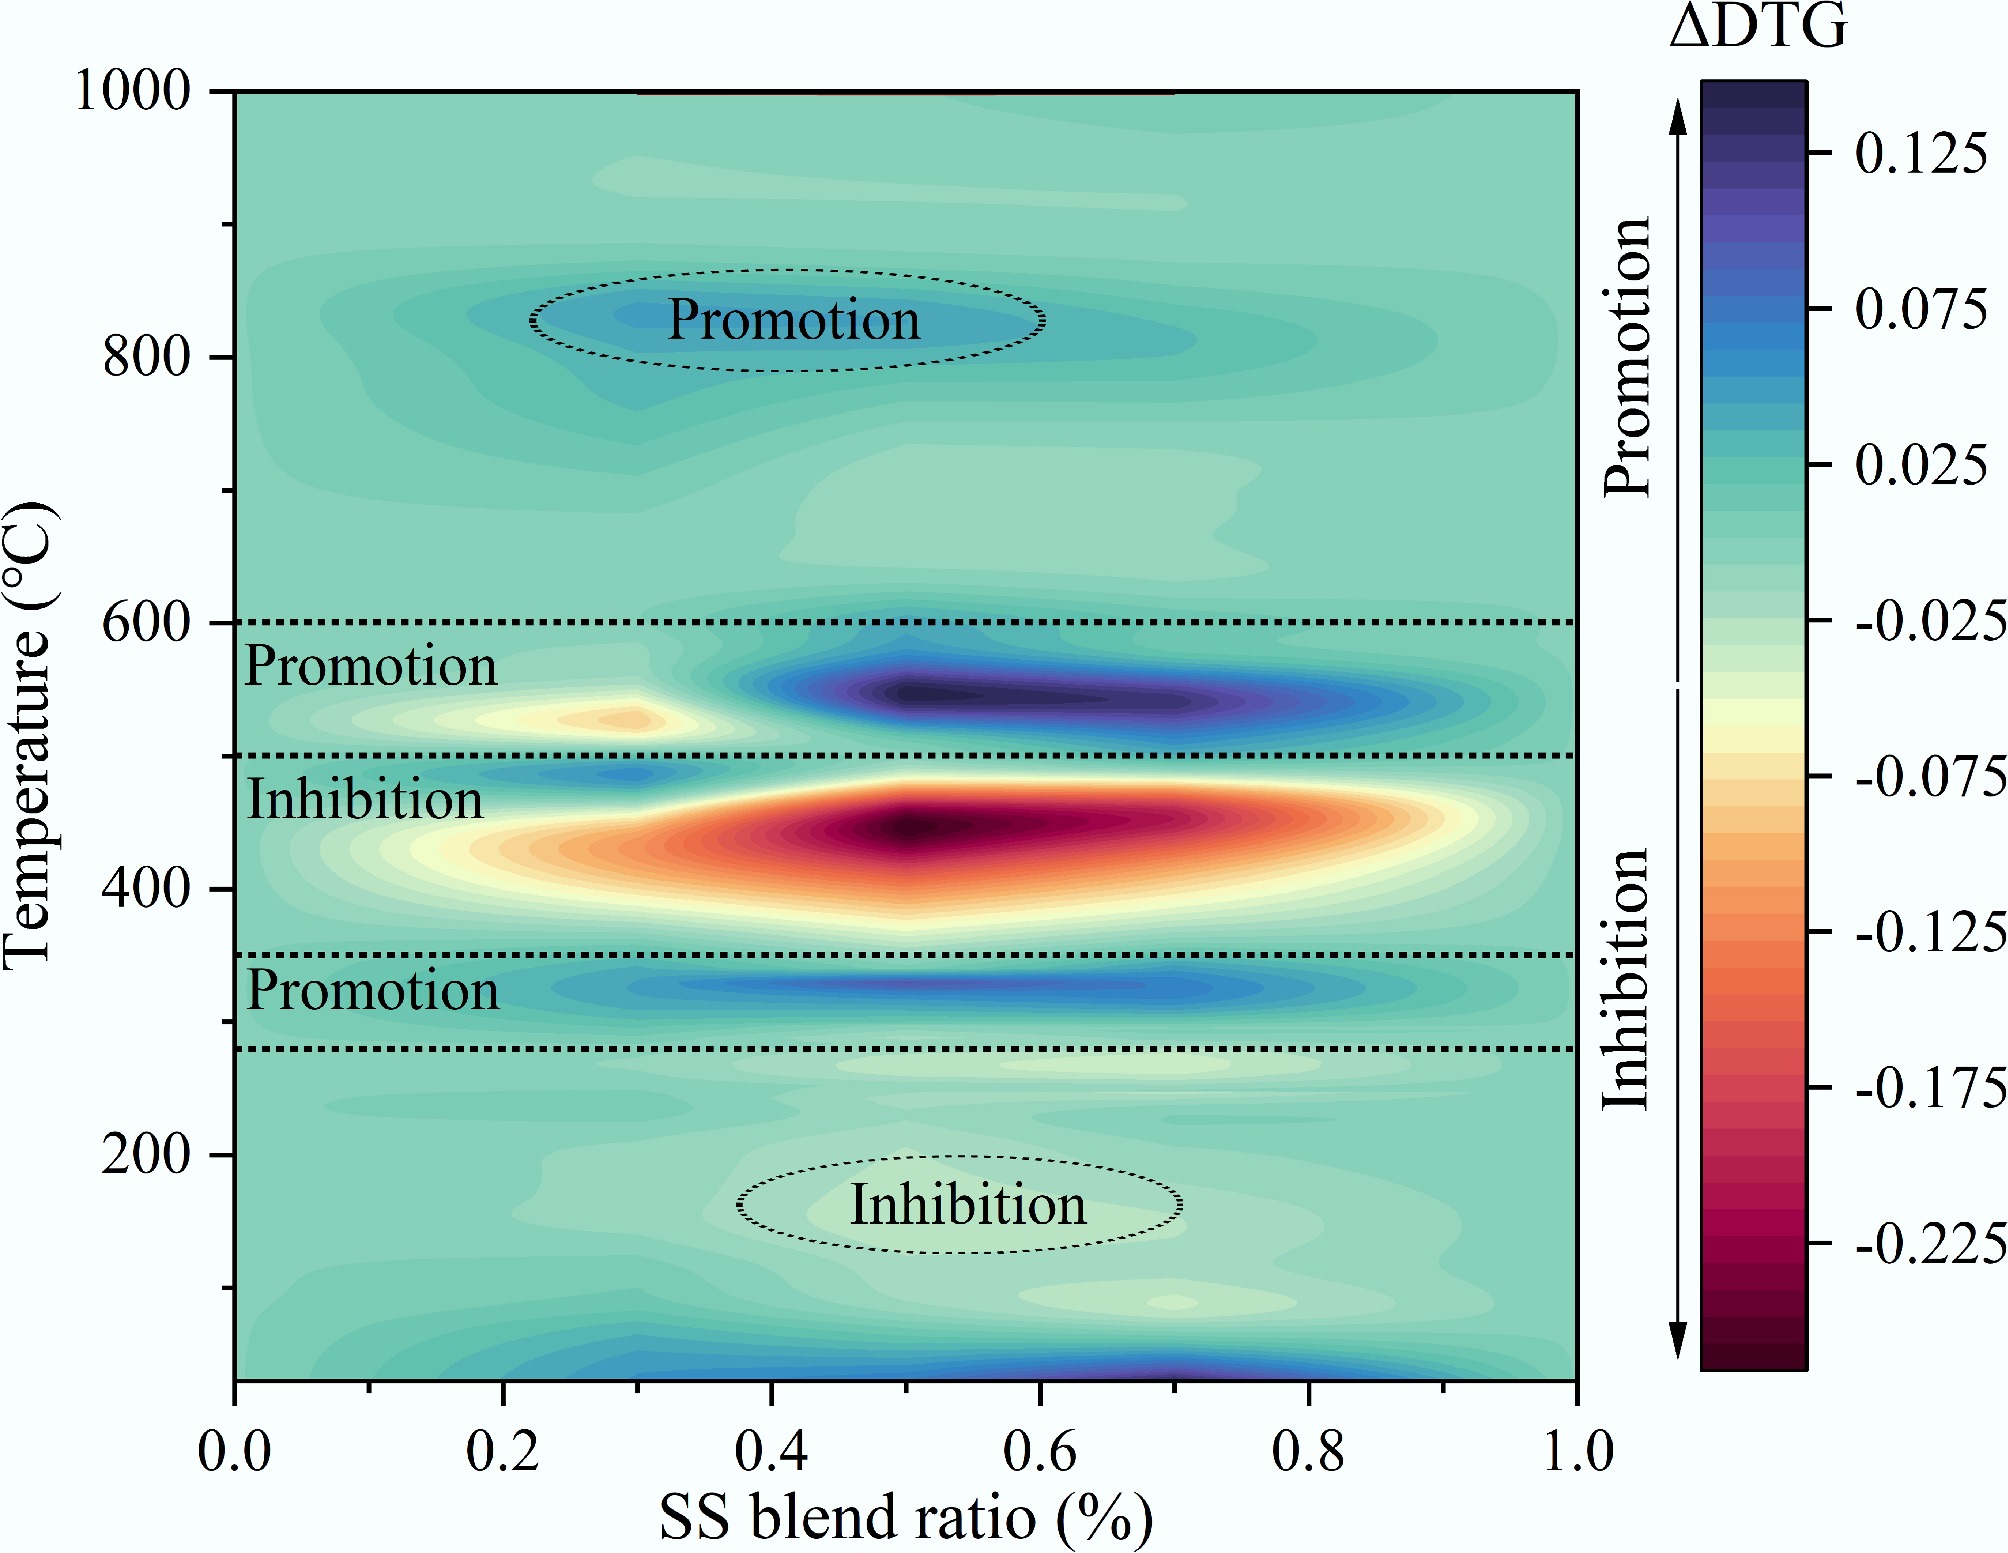
Figure 9.
The interaction between CG and SS in non-isothermal co-combustion.
Kinetics of CG/SS co-combustion
-
The combustion kinetics of CG and SS were investigated through both isothermal and non-isothermal TG experiments. To minimize the errors associated with assumed kinetic models, model-fitting methods were applied to determine the optimal reaction model, and to calculate the kinetic parameters for the isothermal combustion process. For the non-isothermal process, model-free methods were employed to obtain more accurate kinetic parameters.
The isothermal method involved heating the sample at a constant temperature to obtain time-dependent weight loss curves (α−t curves) under different thermal conditions. By analyzing these curves across a range of temperatures, kinetic parameters can be determined. Common model functions used in solid-state kinetic studies included reaction-order models, diffusion-controlled mechanisms, phase-boundary-controlled processes, and nucleation-growth mechanisms[32−34]. Accordingly, the isothermal co-combustion data of CG and SS were fitted to 10 fundamental kinetic models, with the specific model functions listed in Table 4. Based on the kinetic analysis method introduced above, the selected models and experimental data at different temperatures were substituted into Eq. (7) for linear fitting. The results of model selection and the corresponding kinetic parameters for the isothermal co-combustion of CG and SS are provided in Table 5.
Table 4. Commonly used solid dynamics model functions
Mechanism name Code g(α) 2D diffusion model D2 (1 – (1 – α)1/2)1/2 3D diffusion model D3 1 – 2/3α – (1 – α)2/3 First-order reaction F1 –ln(1 – α) Second-order reaction F2 –1 + (1 – α)–1 Third-order reaction F3 [–1 + (1 – α)–1]/2 3D Limiting surface reaction between both phases R3 1 – (1 – α)1/3 Random nucleation and nuclei growth (n = 3) A4 3[1 – (1 – α)1/3] Random nucleation and nuclei growth (n = 1/3) A3 [–ln(1 – α)]1/3 Random nucleation and nuclei growth (n = 2) A2 [–ln(1 – α)]2 Random nucleation and nuclei growth (n = 3/2) A1 [–ln(1 – α)]3/2 Table 5. The kinetic results of CG and SS isothermal co-combustion process
Samples T (°C) Functions R2 slope k of (lnk − 1/T) Ea (kJ/mol) CG 750 F1 0.9918 −1,046.3 8.7 850 0.9967 950 0.9980 3SS7CG 750 F1 0.9845 −1,676.9 13.94 850 0.9945 950 0.9988 5SS5CG 750 F1 0.9873 −1,632.1 13.57 850 0.9958 950 0.9990 7SS3CG 750 F1 0.9967 −1,761.4 14.64 850 0.9996 950 0.9977 SS 750 D3 0.9961 −2,016.7 16.77 850 0.9916 950 0.9881 The experimental data of SS fit best with the reaction mechanism function g(α) = 1− 2/3α − (1 − α)2/3(D3), indicating that the three-dimensional diffusion model (D3) provides an appropriate description of the isothermal combustion process of SS. This is attributed to diffusion being the primary rate-limiting step during isothermal combustion[35]. One possible reason is that a series of polycondensation reactions occurring prior to reaching the target combustion temperature result in an underdeveloped pore structure in the SS matrix[36], thereby increasing the resistance to gas diffusion through the pores to the reaction interface. Under isothermal combustion conditions, CG combustion is dominated by an overall chemically controlled regime because the char-oxygen reaction rate is the controlling step compared with inter-particle diffusion at high temperature. In contrast, compared with CG, SS contains abundant volatile matter and high ash, leading to rapid devolatilization and char formation and combustion at relatively low temperatures. During sludge combustion, the fast consumption of surface reactants and the inter-particle oxygen diffusion are the rate-limiting steps. Therefore, CG follows a chemically controlled model, whereas high-volatile SS is better described by a diffusion model. Upon the addition of CG, the combustion kinetics of the 5SS5CG blends remained dominated by diffusion. Based on the slopes of the fitted lines at different temperatures, the activation energies (Ea) for the isothermal combustion of CG, SS, and 5SS5CG were calculated to be 8.7, 16.77, and 13.57 kJ/mol, respectively. These results suggest that the presence of CG lowered the activation energy of the SS combustion reaction, making the mixed fuel easier to ignite and burn. This effect was mainly due to the lower ash content in the mixture compared to SS alone. As the coke burns, the pore structure becomes more developed, creating pathways for oxygen transport, which promoted the co-combustion process of CG and SS. These findings further confirm the feasibility of co-combusting CG with SS.
The kinetic behavior of the non-isothermal combustion of CG and SS was investigated using the Flynn-Wall-Ozawa (FWO) method, as described by Eq. (13). TG curves of CG, SS, and 5SS5CG were obtained at different heating rates (β = 10, 20, and 30 °C/min). These data were used to calculate the apparent activation energy (Ea) at various conversion rates (α). According to the method described above, the linear fitting results of lnβ − 1/T were obtained, as illustrated in Fig. 10. The plots showed great linearity over the conversion range of α = 0.1–0.9.
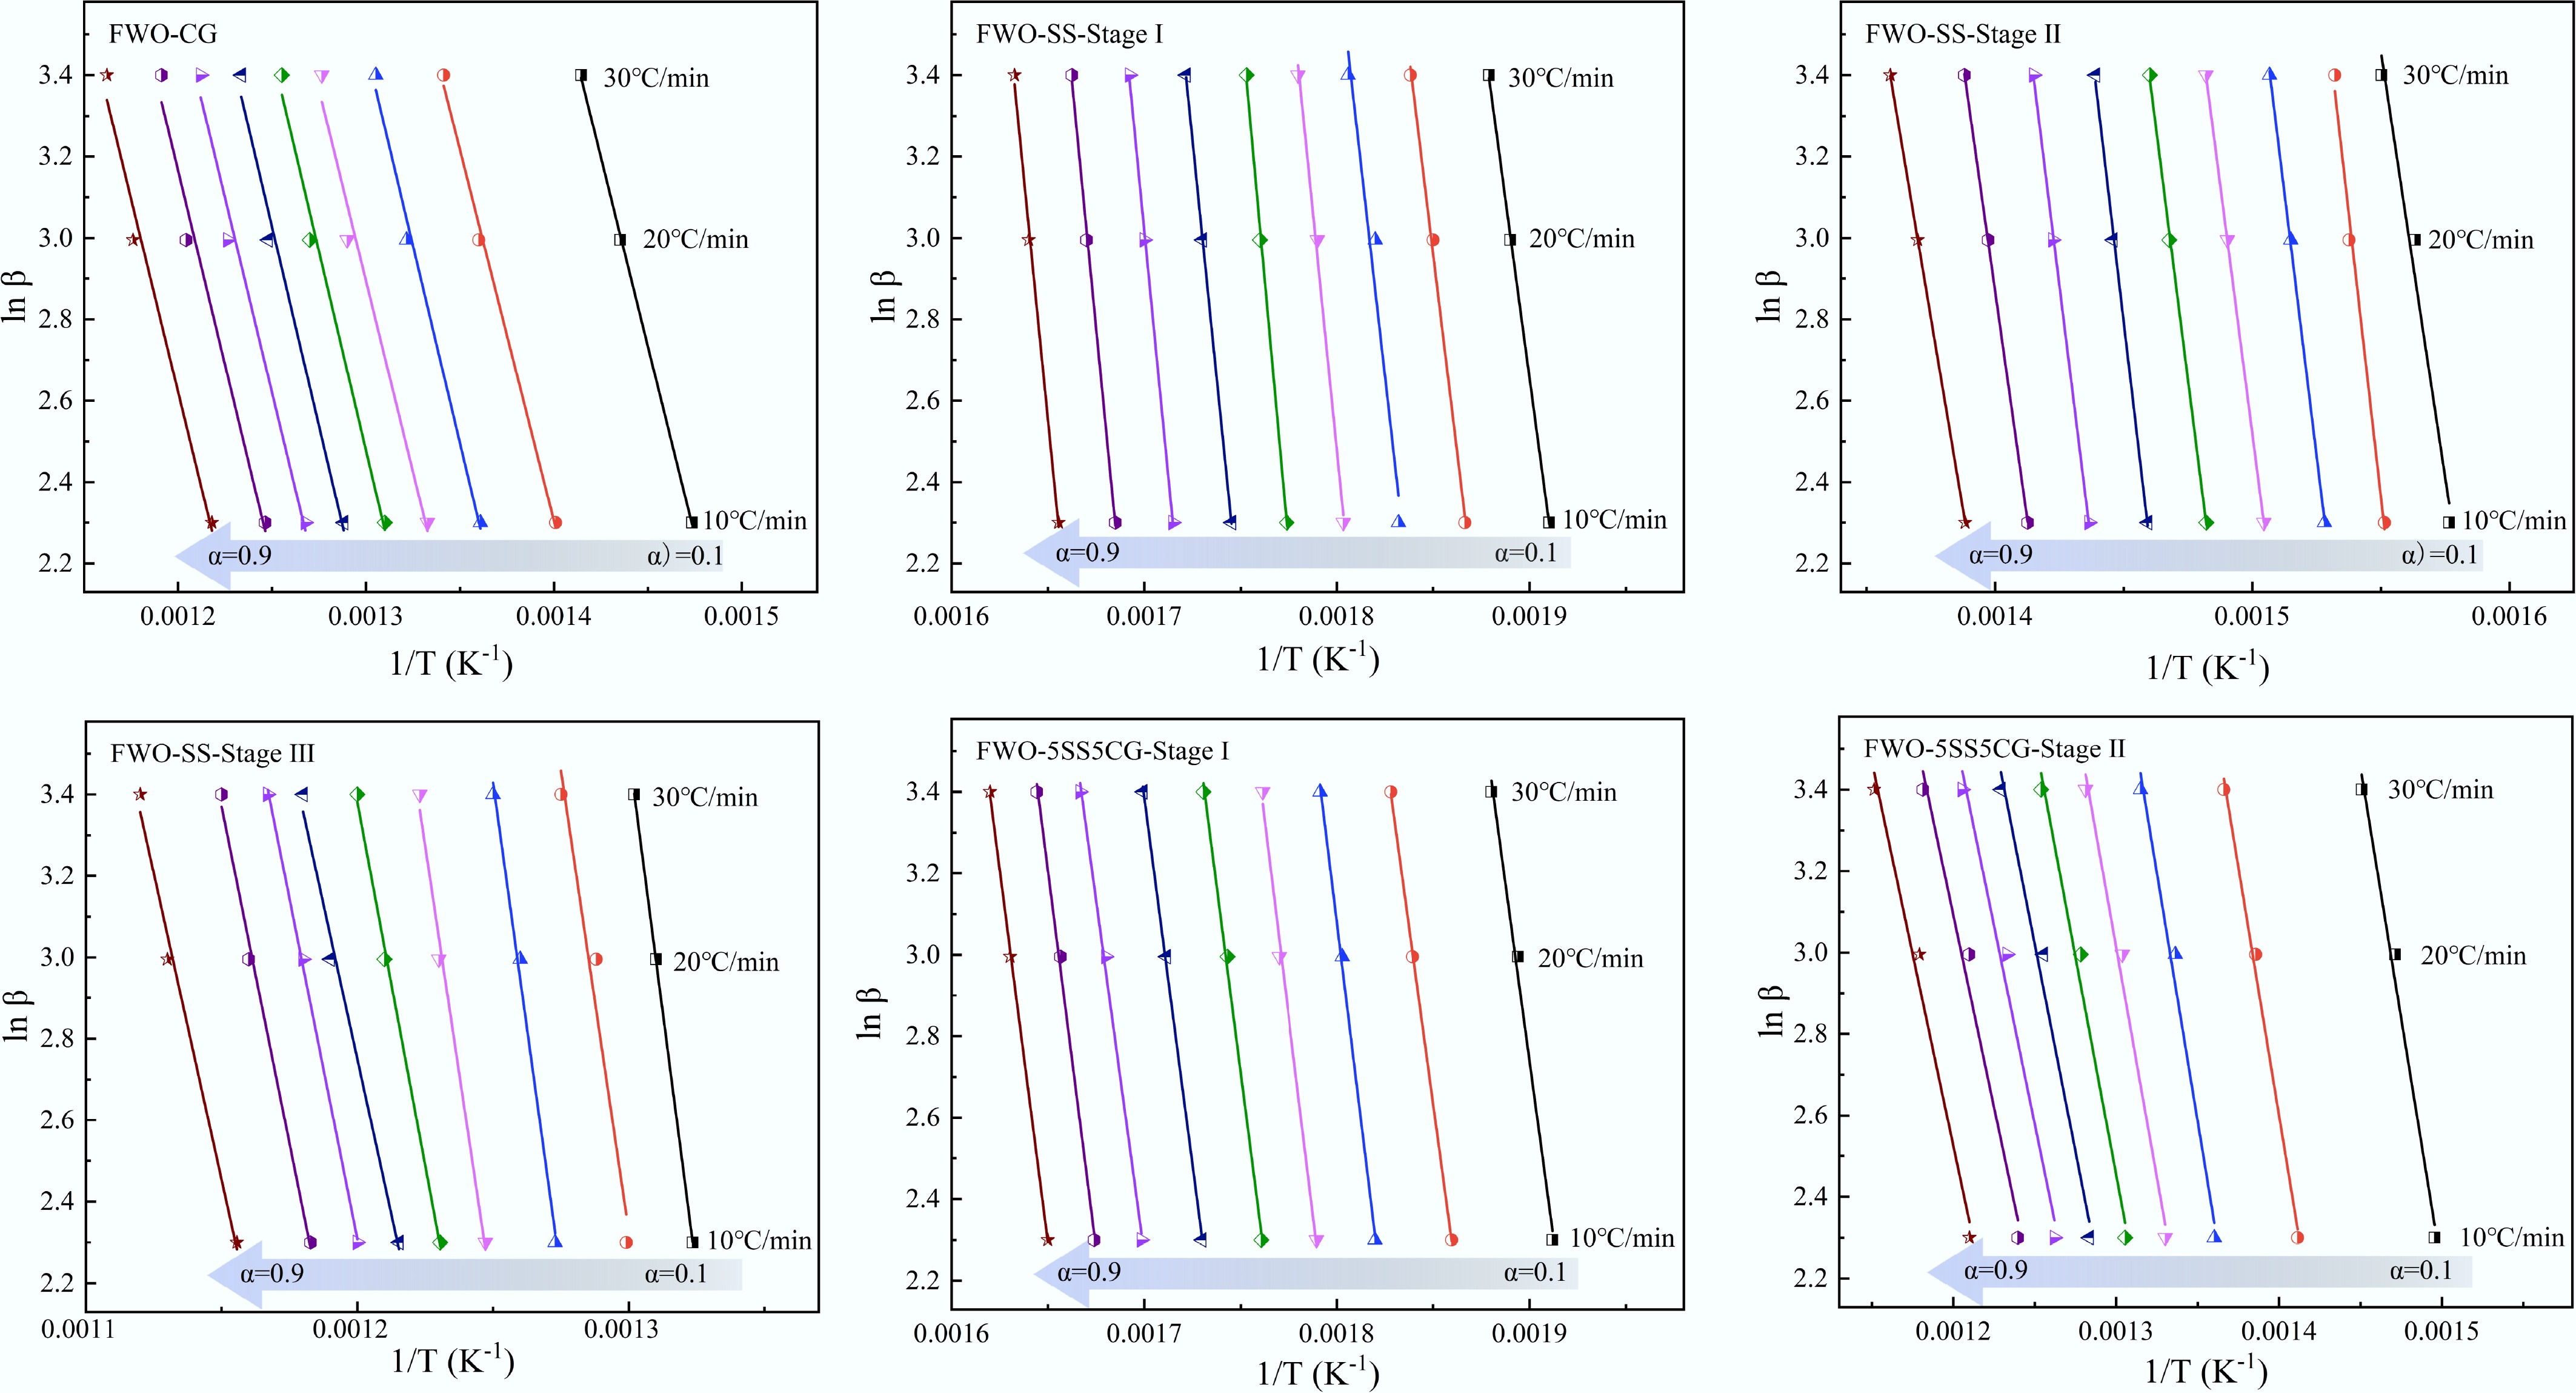
Figure 10.
Kinetic fitting results based on the FWO method.
The apparent activation energy (Ea) results for CG, SS, and 5SS5CG obtained using the Flynn–Wall–Ozawa method are summarized in Tables 6−8. As shown in Tables 6−8, the linear correlation coefficients (R2) are all above 0.9, indicating high reliability of the Ea values within the studied range. The TG results demonstrate that the combustion processes of CG, SS, and their mixtures were all multi-step reactions with complex kinetic characteristics. Figure 11 compares the activation energies of CG and SS under different heating conditions. As illustrated in Fig. 11, the apparent activation energy of CG determined by the FWO method was 150.4 kJ/mol, suggesting that CG exhibited a relatively low activation energy and a simpler kinetic mechanism. In contrast, the combustion of SS involved three kinetically independent stages, with apparent activation energies of 395.7, 382.1, and 313.7 kJ/mol for Stages I, II, and III, respectively. The relatively high Ea values in the first two stages can be attributed to the high ash content in SS and the dominance of volatile release in these phases. A significant reduction in Ea was observed from Stage II to Stage III, which may be due to the heat released in earlier stages and the evolution of the sample's pore structure that positively influenced the reaction kinetics in the third stage. According to Table 8, the apparent activation energies for the two combustion stages of 5SS5CG were 288.5 and 171.4 kJ/mol, respectively. These values were lower than the Ea values observed in all three stages of SS combustion, likely because the addition of CG reduced the ash content of the blended fuel, thereby mitigating its inhibitory effect on the combustion process.
Table 6. Apparent activation energy of SS obtained based on the FWO method
Conversion rates 1st stage (221–356 °C) 2nd stage (356–473 °C) 3rd stage (473–682 °C) Ea (kJ/mol) R2 Ea (kJ/mol) R2 Ea (kJ/mol) R2 0.1 368.3 0.9997 330.9 0.9782 404.6 0.9999 0.2 377.8 0.9969 440.0 0.9923 397.2 0.9199 0.3 409.1 0.9622 408.0 0.9994 382.0 0.9938 0.4 430.1 0.9956 386.2 0.9998 352.7 0.9926 0.5 422.4 0.9985 393.9 0.9991 282.4 0.9980 0.6 411.1 0.9998 424.6 0.9985 240.5 0.9913 0.7 383.5 0.9990 403.1 0.9994 264.4 0.9991 0.8 383.2 0.9987 354.0 0.9998 261.5 0.9952 0.9 375.9 0.9973 298.3 0.9999 238.2 0.9908 Average 395.7 382.1 313.7 Table 7. Apparent activation energy of CG obtained based on the FWO method
Conversion rates 1st stage (284–658 °C) Ea (kJ/mol) R2 0.1 147.0 0.9997 0.2 144.1 0.9963 0.3 153.2 0.9934 0.4 148.3 0.9805 0.5 154.4 0.9888 0.6 154.6 0.9866 0.7 151.2 0.9858 0.8 151.0 0.9801 0.9 149.8 0.9830 Average 150.4 Table 8. Apparent activation energy of 5SS5CG obtained based on the FWO method
Conversion rates 1st stage (221–350 °C) 2nd stage (350–698 °C) Ea (kJ/mol) R2 Ea (kJ/mol) R2 0.1 275.9 0.9940 195.2 0.9889 0.2 275.6 0.9998 193.1 0.9946 0.3 306.7 0.9984 192.6 0.9859 0.4 304.3 0.9954 178.8 0.9885 0.5 290.7 0.9968 169.3 0.9860 0.6 285.2 0.9989 161.0 0.9837 0.7 274.7 0.9966 154.1 0.9816 0.8 293.8 0.9973 149.4 0.9818 0.9 289.4 0.9996 149.1 0.9848 Average 288.5 171.4 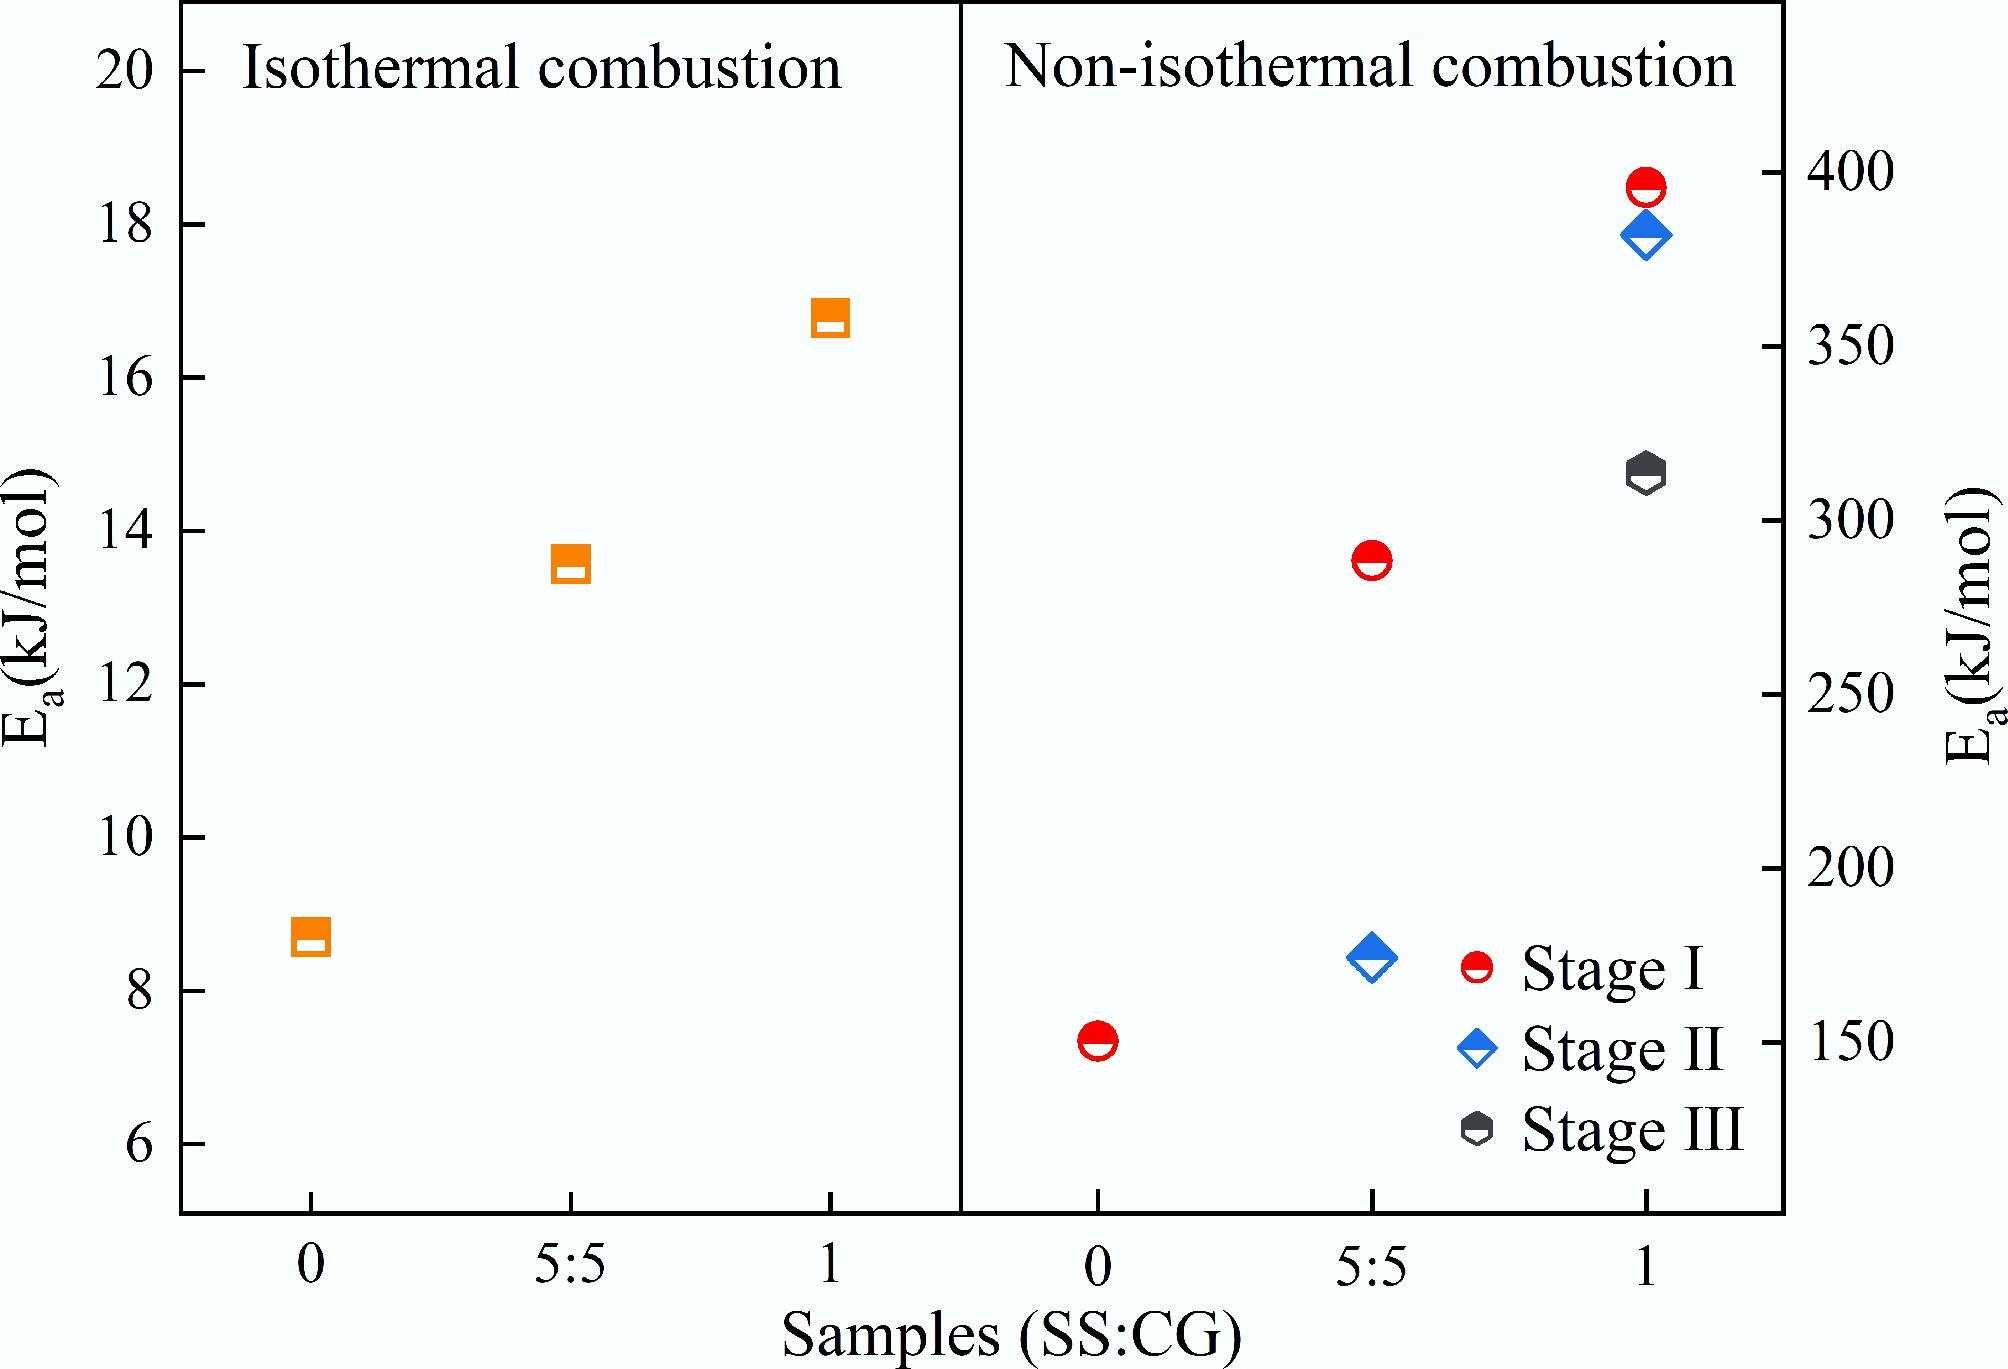
Figure 11.
The reaction activation energy of CG and SS in different heating processes.
Prediction of CG/SS co-combustion
-
During the model training process, all data were divided into three subsets: 75% for training, 10% for validation, and 15% for testing. Tables 9 and 10 summarize the key neural network structures and corresponding performance evaluation metrics for the two models. Prior to model training, all experimental datasets were carefully preprocessed to improve numerical stability and convergence of the neural network. Continuous input variables, including temperature, mixing ratio, and reaction time, were normalized to the range of 0–1 using min-max scaling. This normalization prevents parameters with larger numerical magnitudes from dominating the training process and accelerates gradient-based optimization. Outliers were identified by combining visual inspection of TG/DTG curves with statistical analysis based on the interquartile range (IQR) method. Data points that deviated significantly from the expected TG trends or were associated with experimental instability were excluded to ensure data consistency and physical reliability.
Table 9. Comparison of the performance parameters of 10 ANN-I models
Model Input Output Network topology MAE RMSE Train R2 Testing R2 Validation R2 ANN-1 Time
Temperature
mixture ratioWeight
loss3 × 16 × 16 × 16 × 1 0.00564 0.00746 0.99922 0.99917 0.99928 ANN-2 3 × 16 × 24 × 88 × 1 0.00192 0.00263 0.99991 0.99990 0.99991 ANN-3 3 × 40 × 40 × 24 × 1 0.00134 0.00184 0.99994 0.99995 0.99995 ANN-4 3 × 80 × 16 × 80 × 1 0.00148 0.00184 0.99995 0.99995 0.99995 ANN-5 3 × 80 × 40 × 24 × 1 0.00134 0.00180 0.99995 0.99995 0.99996 ANN-6 3 × 40 × 56 × 56 × 1 0.00146 0.00234 0.99992 0.99992 0.99994 ANN-7 3 × 40 × 64 × 24 × 1 0.00140 0.00194 0.99994 0.99994 0.99994 ANN-8 3 × 16 × 48 × 80 × 1 0.00133 0.00211 0.99994 0.99993 0.99995 ANN-9 3 × 24 × 56 × 32 × 1 0.00191 0.00257 0.99992 0.99990 0.99993 ANN-10 3 × 40 × 32 × 32 × 1 0.00121 0.00156 0.99996 0.99996 0.99996 Bold values represent the best performance. Table 10. Comparison of the performance parameters of 10 ANN-II models
Model Input Output Network topology MAE RMSE Train R2 Testing R2 Validation R2 ANN-11 Temperature
mixture ratioTG
DTG2 × 16 × 16 × 16 × 3 0.00194 0.00265 0.99983 0.99984 0.99985 ANN-12 2 × 48 × 16 × 16 × 3 0.00199 0.00260 0.99986 0.99985 0.99987 ANN-13 DSC 2 × 96 × 16 × 16 × 3 0.00179 0.00242 0.99985 0.99985 0.99986 ANN-14 2 × 32 × 16 × 48 × 3 0.00180 0.00227 0.99989 0.99989 0.99989 ANN-15 2 × 48 × 80 × 48 × 3 0.00151 0.00187 0.99993 0.99993 0.99993 ANN-16 2 × 32 × 48 × 32 × 3 0.00125 0.00173 0.99993 0.99993 0.99994 ANN-17 2 × 48 × 64 × 32 × 3 0.00149 0.00200 0.99991 0.99990 0.99991 ANN-18 2 × 80 × 48 × 96 × 3 0.00153 0.00217 0.99990 0.99989 0.99990 ANN-19 2 × 16 × 80 × 32 × 3 0.00149 0.00207 0.99990 0.99990 0.99991 ANN-20 2 × 80 × 64 × 64 × 3 0.00142 0.00201 0.99991 0.99990 0.99991 Bold values represent the best performance. The input parameters for the ANN model—mixing ratio, temperature, and reaction time—were selected based on both combustion theory and experimental observations. The mixing ratio directly determines the relative contributions of volatile matter, fixed carbon, and ash components, thereby controlling ignition behavior, combustion stages, and synergistic interplay. Temperature is the dominant driving force governing reaction kinetics, devolatilization, and char oxidation, while reaction time represents the dynamic evolution of mass loss under isothermal conditions. Rather than assigning explicit numerical weights to each input, the ANN implicitly learns their relative importance through backpropagation during training. The strong predictive performance indicates that the chosen inputs sufficiently capture the coupled effects governing the co-combustion process.
For the first model, approximately 27,000 data samples were used. The training was conducted over 300 epochs with a batch size of 64, using the efficient Adam optimizer with a lower learning rate of 0.002. The resulting ANN architecture was (2 × 32 × 48 × 32 × 3). The model demonstrated excellent predictive capability on both the training and test sets, with performance metrics as follows: R2 = 0.99993, root mean square error (RMSE) = 0.00173, and mean absolute error (MAE) = 0.00125. Figure 12a, b shows the comparison between the experimental and predicted TG data; Fig. 12c, d corresponds to DTG data; Fig. 12e, f corresponds to DSC data. The results show a high degree of agreement between predicted values and experimental data. Furthermore, Fig. 12g shows that the fitted regression line has a slope of 1.00006 and R2 = 0.99993, indicating excellent consistency with the ideal 1:1 relationship. Overall, this ANN model exhibited outstanding performance in predicting TG, DTG, and DSC data, making it the optimal model in this study.
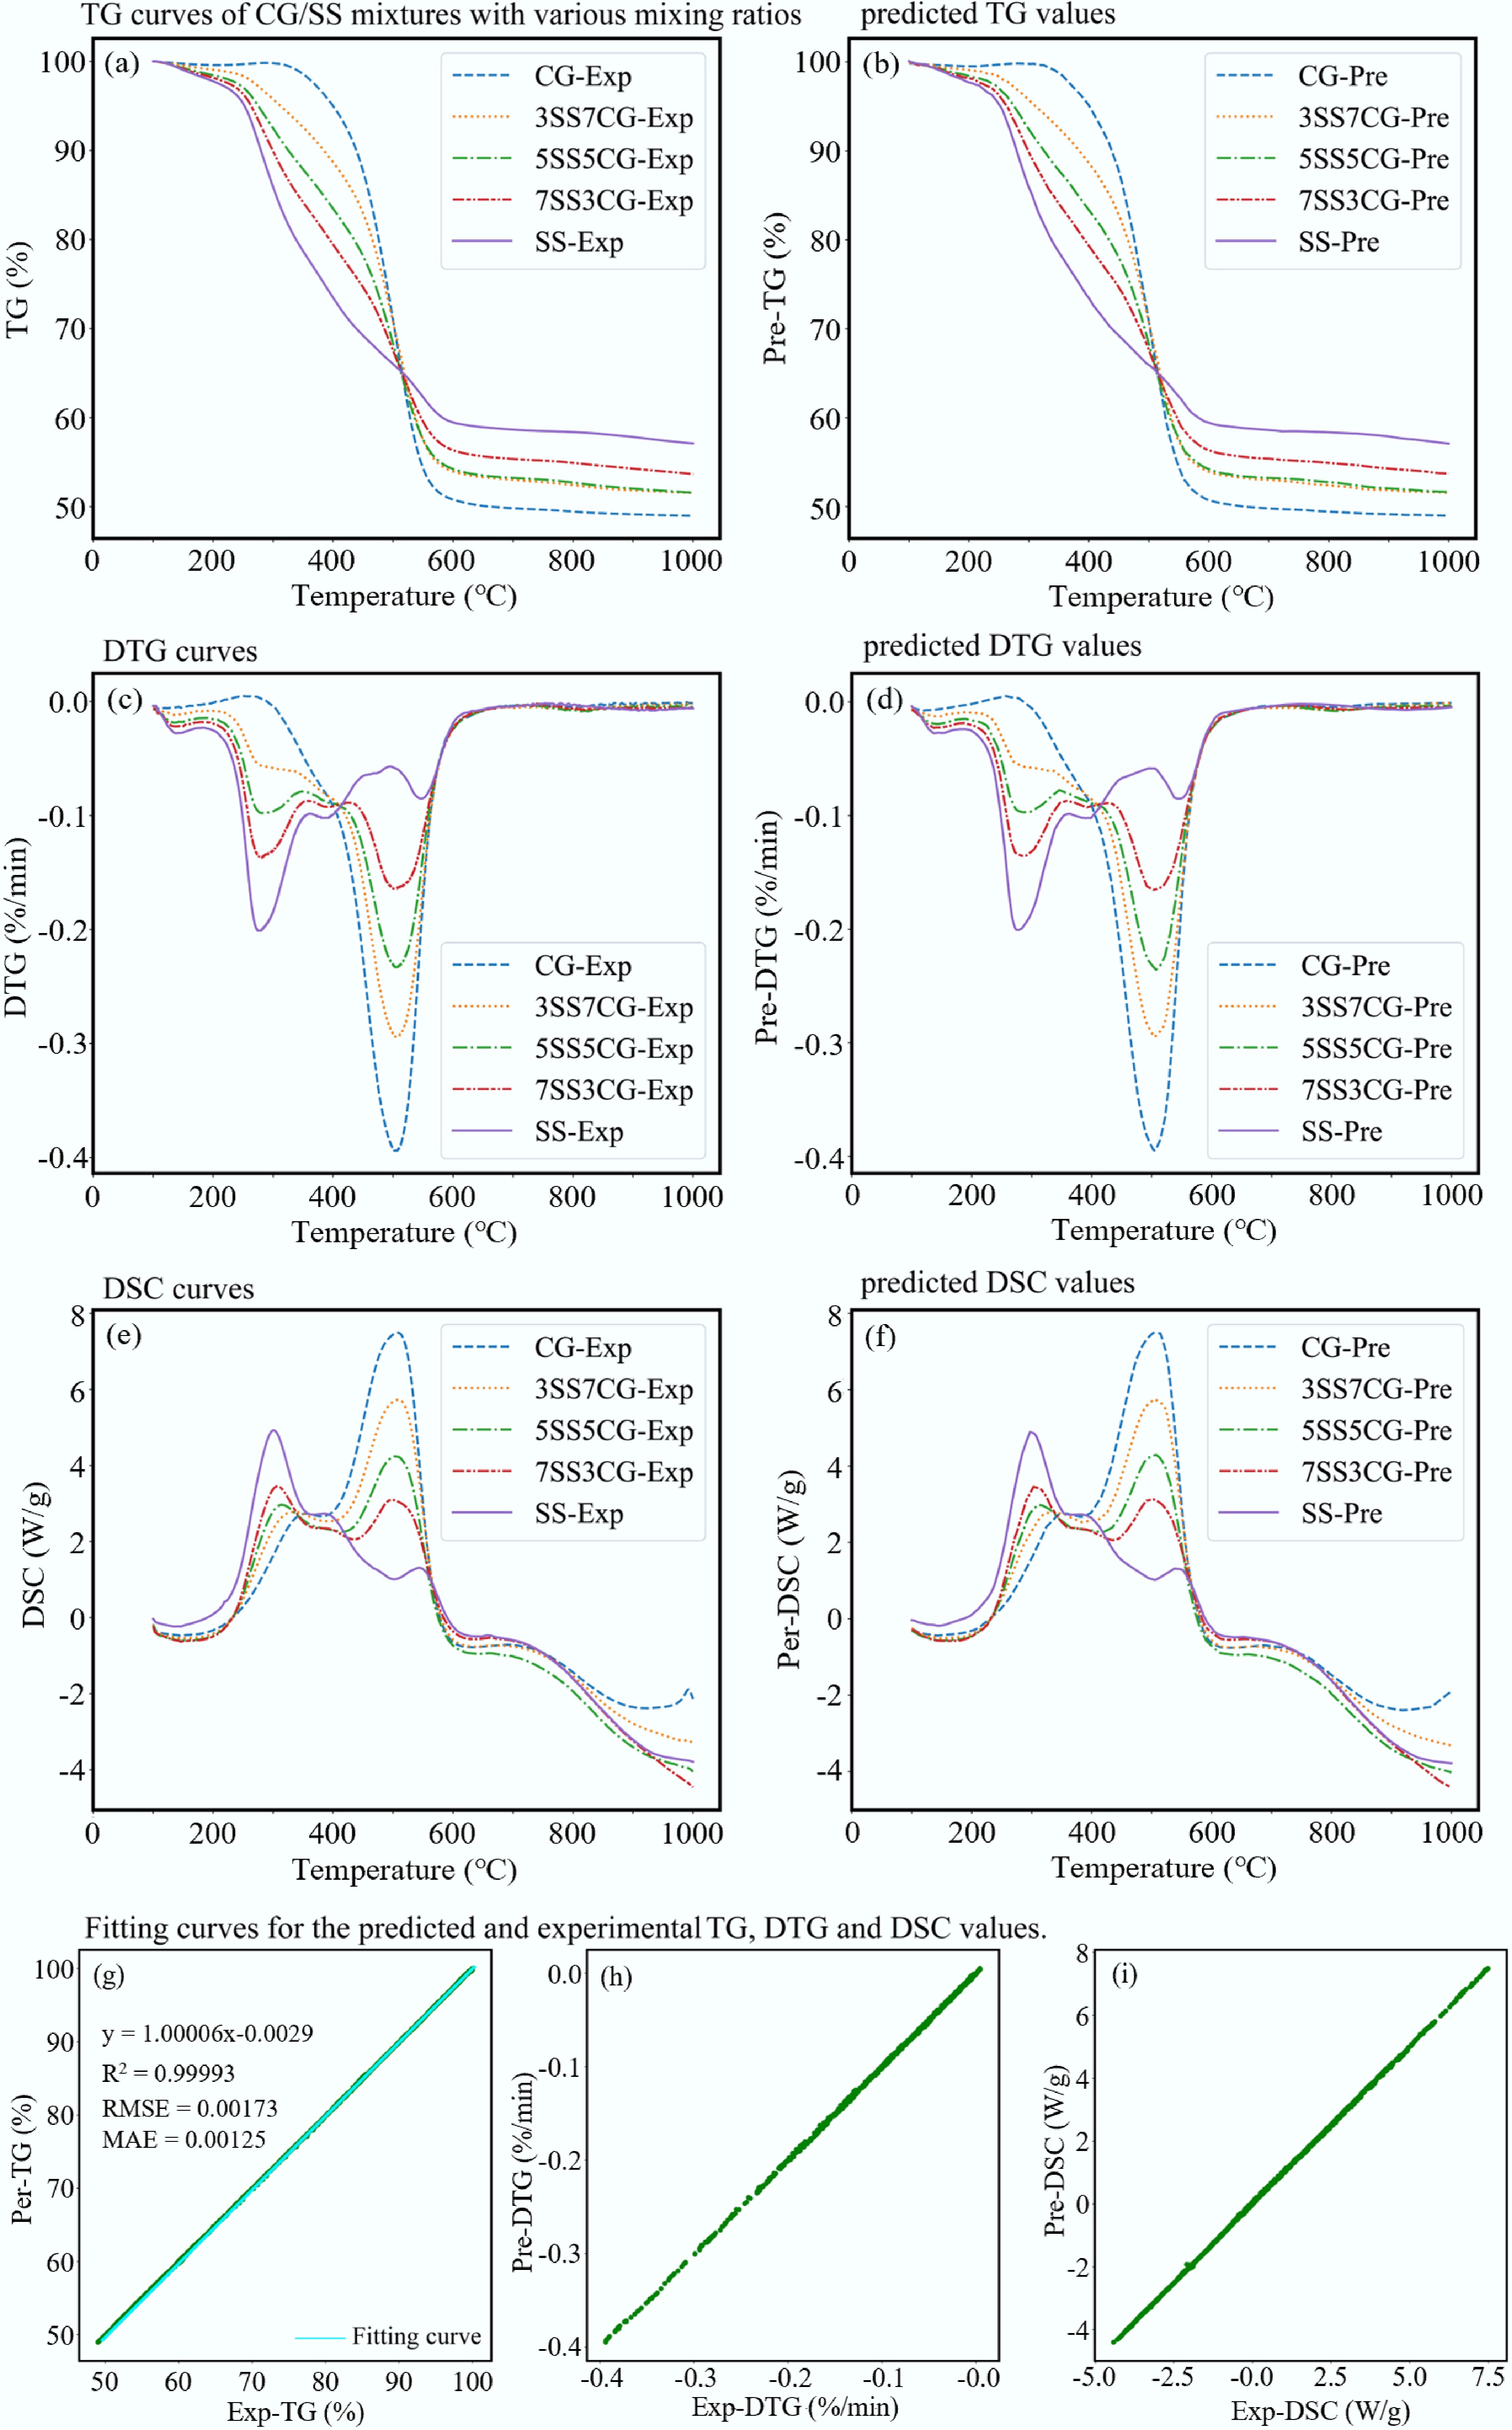
Figure 12.
Prediction of co-combustion under non-isothermal conditions. (a) TG curves of CG/SS mixtures with various mixing ratios. (b) Predicted TG values. (c) DTG curves. (d) Predicted DTG values. (e) DSC curves. (f) Predicted DSC values. (g)−(i) Fitting curves for the predicted and experimental TG, DTG, and DSC values.
For the second model, around 7,200 data samples were used. The model was trained for 240 epochs with a batch size of 32, using the Adam optimizer with a learning rate of 0.0015. The resulting ANN architecture was (3 × 40 × 32 × 32 × 1). The model's performance metrics were: R2 = 0.99996, RMSE = 0.00156, and MAE = 0.00121. Figure 13a, b illustrates the comparison between experimental and predicted mass loss data at a constant temperature of 750 °C, showing excellent agreement. Figure 13c presents a fitted line with a slope of 1.00008 and R2 = 0.99993, demonstrating excellent agreement with the ideal 1:1 relationship. In summary, this ANN model performed optimally in the prediction of mass loss data, demonstrating high accuracy and robustness.
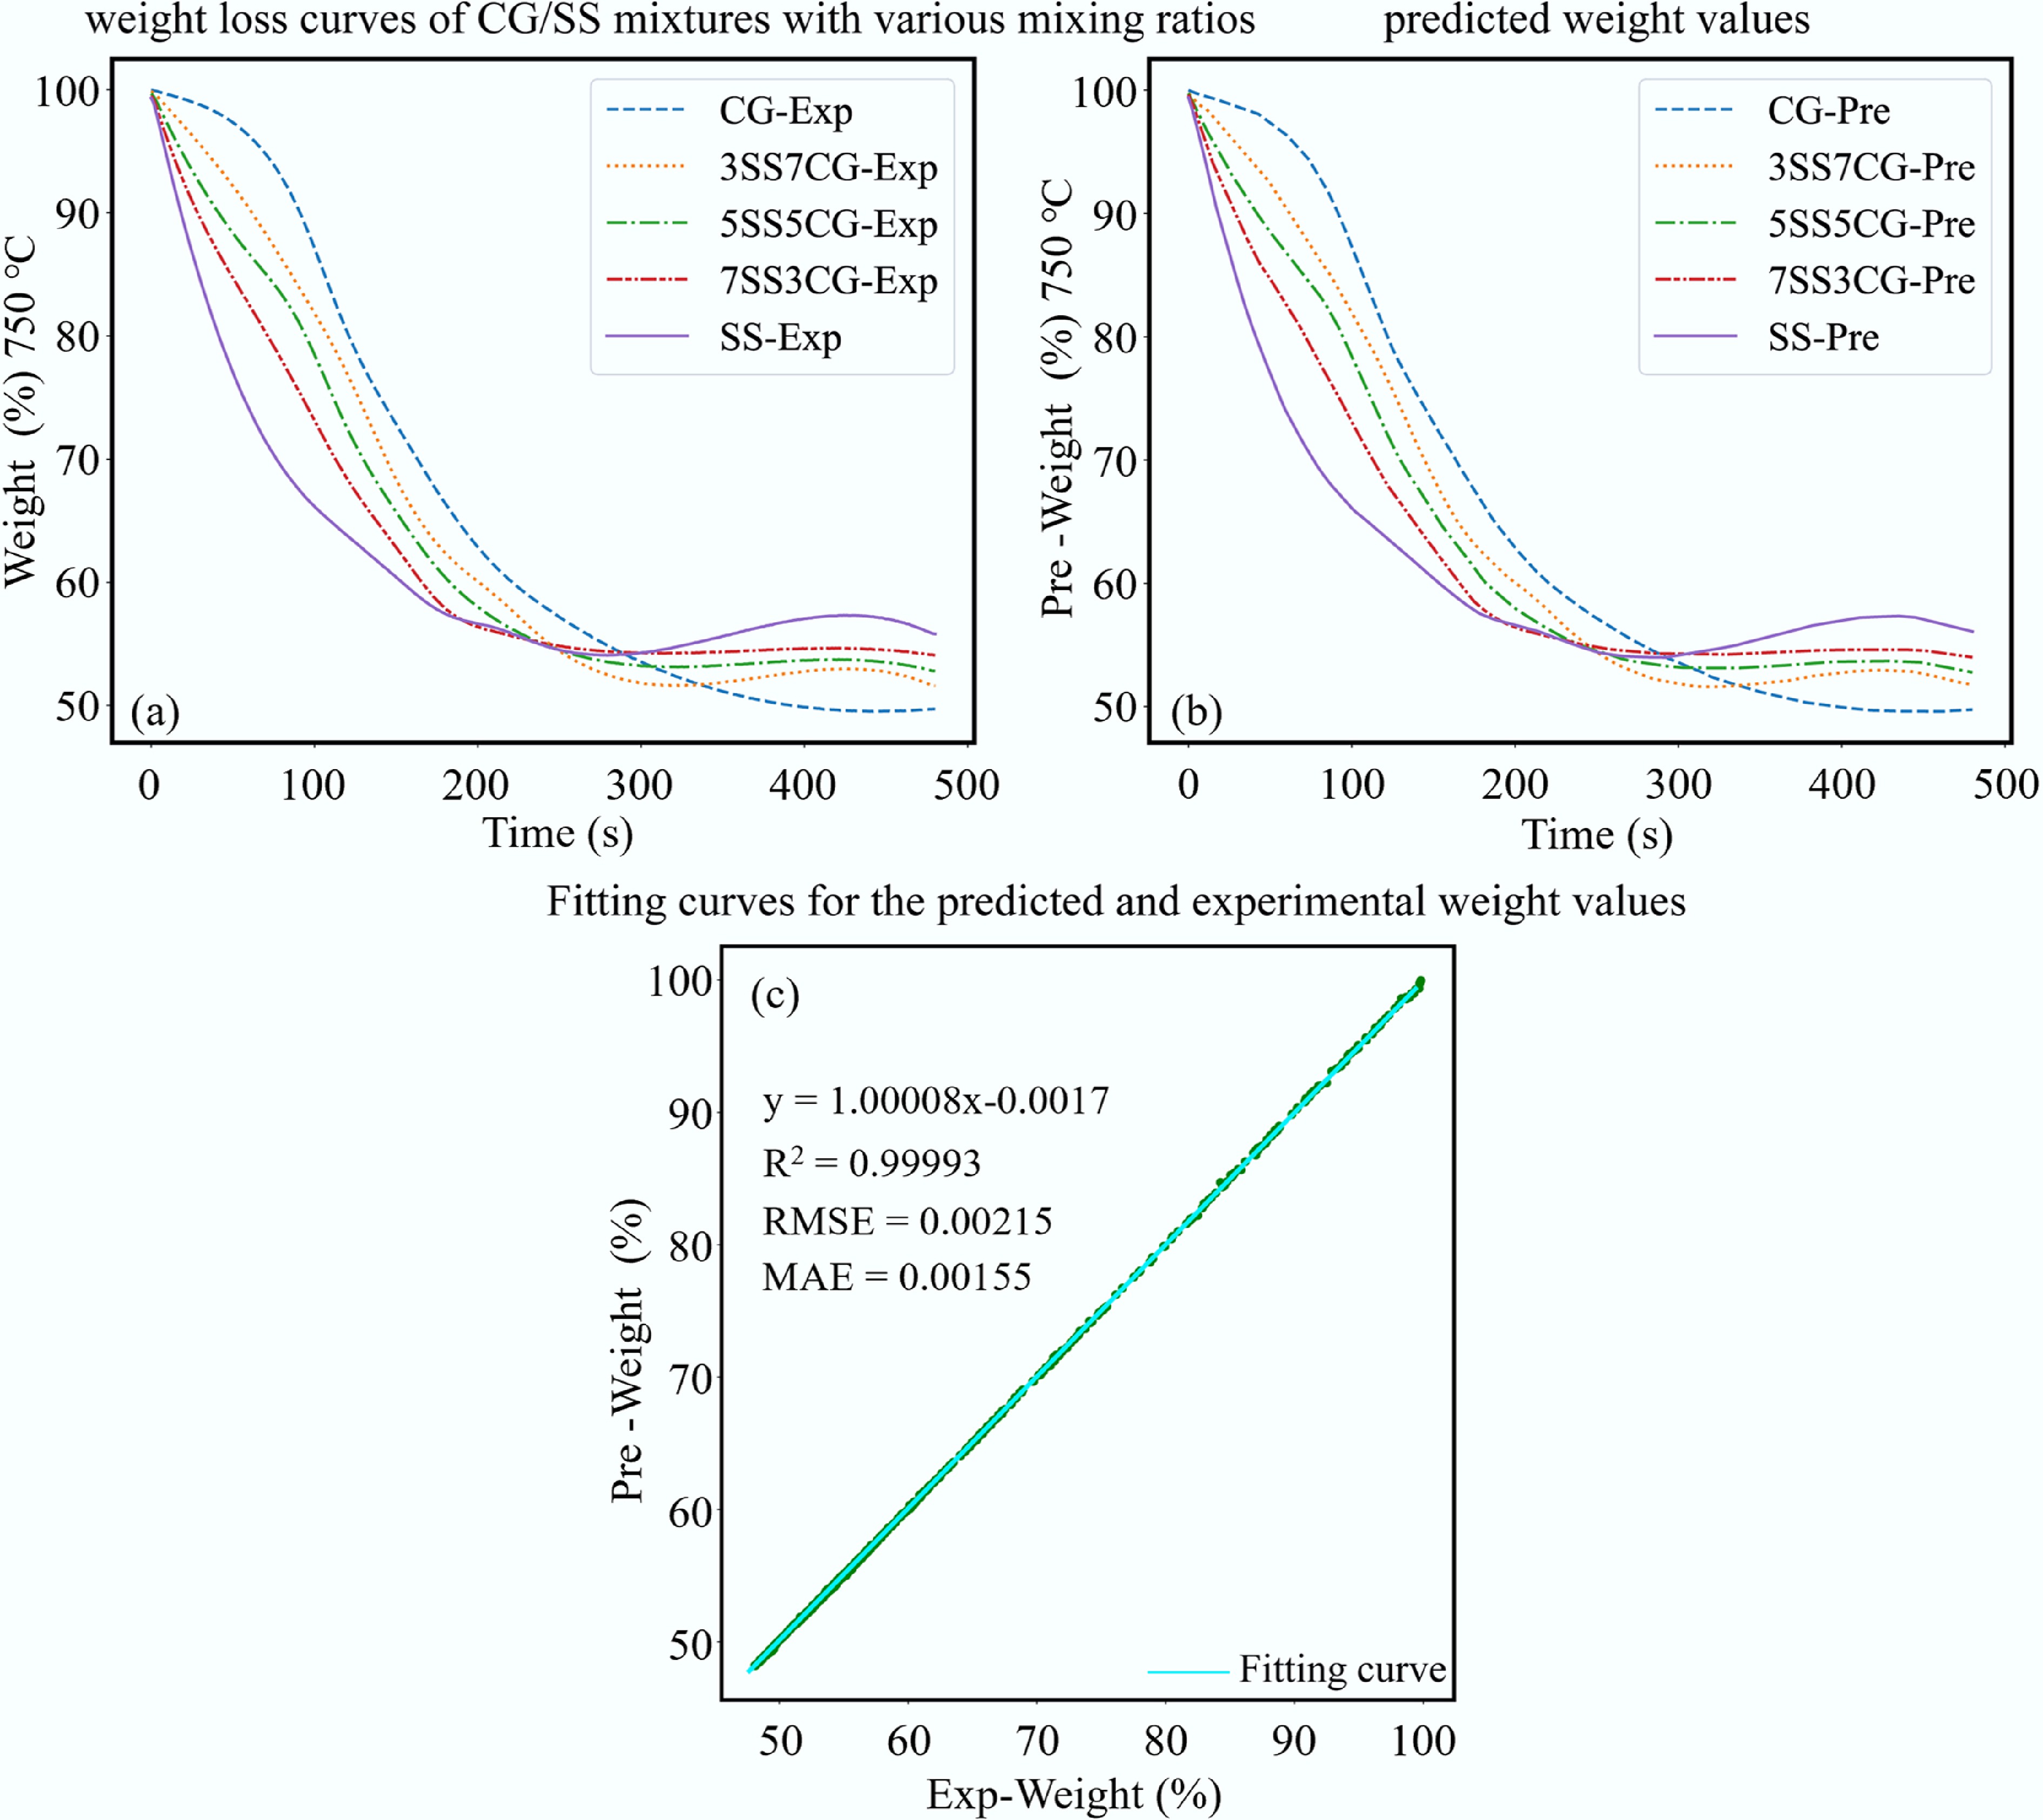
Figure 13.
Prediction of co-combustion under isothermal conditions. (a) Weight loss curves of CG/SS mixtures with various mixing ratios. (b) Predicted weight values. (c) Fitting curves for the predicted and experimental weight values.
To mitigate overfitting, the dataset was divided into independent training, validation, and testing subsets, and model performance was evaluated consistently across all three. In addition, the network was trained using the Adam optimizer with early stopping based on validation loss, and residual connections were introduced to improve generalization stability. The close agreement of R2 values and low errors (RMSE and MAE) across training, validation, and testing sets indicates that the high R2 reflects robust predictive capability rather than overfitting.
-
In this work, the co-combustion behaviors of CG and SS under both isothermal and non-isothermal conditions are studied, and the main conclusions are given below:
(1) Under isothermal combustion conditions, the majority of the weight loss occurred within the first 4 min. An increase in the proportion of SS led to an enhanced combustion rate of the mixture. Under non-isothermal conditions, CG combustion was characterized by a single distinct weight loss stage dominated by fixed carbon oxidation, while SS underwent three combustion stages: the first two corresponding to the release of volatiles, and the third to the burnout of fixed carbon.
(2) During co-combustion, SS enhanced reactivity in the low-temperature range, while CG improved combustion performance in the high-temperature range. The optimal co-combustion performance was achieved at a 50% SS blending ratio, with a comprehensive combustion performance index (S) of 3.328 × 10⁻⁸%2/(min2·°C3).
(3) During isothermal combustion, the initial interactions between CG and SS suppressed weight loss, whereas synergistic effects emerged in the later stages, promoting further combustion. The interaction effects were most pronounced at a 50% SS blending ratio.
(4) During non-isothermal combustion, significant synergistic effects were observed during the fixed carbon combustion stage (510–600 °C), where the deviation between theoretical and experimental DTG (ΔDTG) reached a maximum of 0.18%/min at a 50% SS ratio, indicating strong positive interaction between CG and SS at this stage.
(5) After extensive model training and optimization, two predictive models based on ANN were developed. The constructed ANN architecture was (2 × 32 × 48 × 32 × 3) to predict co-combustion under non-isothermal conditions, achieving excellent performance metrics: a coefficient of determination (R2) of 0.99993, a root mean square error (RMSE) of 0.00173, and a mean absolute error (MAE) of 0.00125. The second ANN model adopted a (3 × 40 × 32 × 32 × 1) structure to predict of co-combustion under isothermal conditions, achieving high predictive accuracy after training, with an R2 of 0.99996, RMSE of 0.00156, and MAE of 0.00121. These results demonstrate the models' excellent fitting precision and predictive capability.
-
All authors contributed to the study conception and design. Binshao Zhang conducted the material characterization and data analysis and wrote the first draft of the manuscript. Tingting Lian conducted the material characterization and data analysis. Wenrui Li designed the research and performed the experiments and wrote the first draft of the manuscript. Zhijian Wan discussed the results and commented on the manuscript. Jiangtao Meng provided guidance throughout the experiments and contributed to the data interpretation. Yu Che provided guidance throughout the experiments and contributed to the data interpretation. Jing Wang provided guidance throughout the experiments and contributed to the data interpretation. Jianbo Li discussed the results and commented on the manuscript. Yuanyuan Zhang designed the research and performed the experiments and discussed the results and commented on the manuscript. Fei Wang discussed the results and commented on the manuscript. All authors reviewed the results and approved the final version of the manuscript.
-
The datasets used or analyzed during the current study are available from the corresponding author on reasonable requests.
-
This research was supported by the National Key Research and Development Program of China (Project Number: 2024YFC3907505), and the Fundamental Research Program of Shanxi Province (Project Number: 202403021222010).
-
The authors declare that they have no known competing financial interests or personal relationships that could have appeared to influence the work reported in this paper.
-
Full list of author information is available at the end of the article.
- Copyright: © 2026 by the author(s). Published by Maximum Academic Press, Fayetteville, GA. This article is an open access article distributed under Creative Commons Attribution License (CC BY 4.0), visit https://creativecommons.org/licenses/by/4.0/.
-
About this article
Cite this article
Zhang B, Lian T, Li W, Wan Z, Meng J, et al. 2026. Comparison and prediction of co-combustion characteristics of coal gangue/sewage sludge mixtures under isothermal and non-isothermal conditions. Energy & Environment Nexus 2: e010 doi: 10.48130/een-0026-0006 

Comparison and prediction of co-combustion characteristics of coal gangue/sewage sludge mixtures under isothermal and non-isothermal conditions
- Received: 21 November 2025
- Revised: 10 January 2026
- Accepted: 02 February 2026
- Published online: 10 March 2026
Abstract: Co-combustion of coal gangue (CG) and sewage sludge (SS) is an effective pathway for the resource recovery and energy utilization of solid wastes. This study provides the first systematic comparison of the co-combustion behavior and kinetics of CG and SS under both isothermal and non-isothermal conditions, revealing distinct rate-controlling mechanisms and synergistic interactions. Moreover, a deep-learning-based artificial neural network framework is developed to accurately predict TG, derivative thermogravimetric (DTG), and differential scanning calorimetry (DSC) behaviors across different combustion regimes, bridging mechanistic analysis with data-driven modeling for mixed solid fuels. Results show that the mass loss of CG and SS mainly occurred within the initial 4 min during isothermal co-combustion, and the combustion rate of the mixture increased with an increasing proportion of SS. Similarly, SS also enhanced the reactivity of the mixture in the low-temperature region under non-isothermal combustion conditions, while CG contributed to improved reactivity in the high-temperature region. The optimal co-combustion performance was achieved at a 50% SS blending ratio, with a comprehensive combustion performance index (S) of 3.328 × 10⁻⁸ %2/(min2·°C3). The optimal combustion performance was observed at a 50% SS blending ratio for CG and SS co-combustion. The kinetic analysis indicated that the isothermal co-combustion of CG and SS was dominated by a three-dimensional diffusion mechanism, whose reaction activation energy was different from that under non-isothermal co-combustion conditions. During the non-isothermal combustion process, a significant synergistic effect on the co-combustion rate was observed in the fixed carbon combustion stage (510–600°C) due to the interplay between CG and SS. The strongest synergistic effect occurred when the sludge mixing ratio was 50%, with a maximum ΔDTG of 0.18%/min. The artificial neural network (ANN) model with an architecture of (2 × 32 × 48 × 32 × 3) demonstrated the best prediction performance for co-combustion behavior when the mixing ratio and final temperature were used as inputs under non-isothermal condition. The ANN model was identified as the most suitable for predicting co-combustion behavior when temperature, mixing ratio, and final time were used as inputs under isothermal conditions.
-
Key words:
- Artificial neural network /
- Coal gangue /
- Co-combustion /
- Isothermal and non-isothermal /
- Sewage sludge