


-
Cultivated strawberry (Fragaria × ananassa) is an economically and culturally important fruit crop, widely valued for its flavor and nutritional benefits. This allo-octoploid species (2n = 8x = 56) emerged about 300 years ago through hybridization between two wild octoploid species, Fragaria virginiana and Fragaria chiloensis[1]. Its complex genome, composed of four subgenomes derived from different diploid progenitors, provides a valuable model for investigating genome evolution, transcriptional regulation, and epigenetic mechanisms underlying agronomic traits[2−5]. Among these regulatory mechanisms, DNA methylation is a well-characterized epigenetic mark involved in transposable element (TE) silencing and genome stability[6−9]. DNA methylation also plays a role in plant development by modulating gene expression. In Arabidopsis, for instance, methylation of the FLOWERING WAGENINGEN suppresses its expression, thereby preventing delayed flowering and ensuring proper floral timing[10]. Similarly, active DNA demethylation of the MEDEA gene is required for normal endosperm and seed development[11]. In tomato, demethylation of the Colorless non-ripening locus is essential for initiating fruit ripening[12]. Similar regulatory functions for DNA methylation have been proposed in strawberry, particularly in genes associated with aroma formation and fruit softening during ripening[13−15].
In plants, DNA methylation occurs in three sequence contexts: CG, CHG, and CHH. Each context is regulated by distinct enzymatic pathways, including METHYLTRANSFERASE1 (MET1) for CG methylation, CHROMOMETHYLASE3 (CMT3) for CHG methylation, and DOMAINS REARRANGED METHYLTRANSFERASE2 (DRM2)-mediated RNA-directed DNA methylation (RdDM) for CHH methylation[16−19]. These pathways work in concert to establish diverse patterns of gene body methylation. Based on these patterns, genes in flowering plants are typically classified into three categories: CG gene body methylated (gbM), TE-like methylated (teM), and unmethylated (UM)[20−23]. gbM genes exhibit methylation exclusively in the CG context, and they are often conserved housekeeping genes with moderate and stable expression across tissues, unlike UM genes that lack methylation. In comparison, teM genes are heavily methylated in all sequence contexts and are frequently located near transposable elements. These genes are generally transcriptionally silenced and are often expressed only in specific tissues[20,21,24−26]. In Arabidopsis accessions, the approximate distribution of gbM, UM, and teM genes is 10%–20%, 73%–86%, and 2%–7%, respectively[23]. However, gene body methylation patterns in the octoploid strawberry genome remain uncharacterized. Population-scale analyses in Arabidopsis have revealed that genebody methylation status can vary across accessions[23], suggesting that similar variability may exist between octoploid strawberry cultivars, but it has not yet been determined.
The octoploid nature of cultivated strawberry provides a unique opportunity to investigate epigenomic variation across its constituent subgenomes. Among the four subgenomes—A, B, C, and D—the A subgenome, derived from Fragaria vesca, exhibits higher gene expression patterns and greater retention of ancestral gene contents. This phenomenon has been described as subgenome dominance in octoploid strawberry[2]. Recent studies of chromatin accessibility further support this pattern by showing that subgenome A contains more accessible regulatory regions than the other subgenomes[27]. However, the underlying epigenetic mechanisms responsible for this subgenome dominance, particularly those related to DNA methylation, remain unknown. Previous methylome studies were limited by the absence of a high-quality octoploid strawberry reference genome, which precluded detailed subgenome-level analyses[13]. Although a recent genome assembly and methylome study is available for the Asian cultivar 'Benihoppe'[28], a comprehensive classification of gene body methylation across the four subgenomes and its relationship with subgenome dominance remains to be further explored.
To address these gaps, we conducted whole-genome bisulfite sequencing (WGBS) and RNA-seq analyses on two genetically and geographically distinct octoploid strawberry cultivars: 'Florida Brilliance' (FB) from the United States and 'Seolhyang' (SH) from South Korea, both of which are leading commercial cultivars in their respective regions[29]. FB and SH not only represent distinct breeding characteristics but also differ in key agronomic traits, most notably fruit firmness and sweetness, with SH producing softer and sweeter fruit, and FB exhibiting greater firmness and lower sweetness. Recent studies in strawberries suggest that DNA methylation dynamics contribute to fruit ripening processes, potentially influencing traits such as firmness, color, and soluble solid content[13,14]. Leveraging the recently completed telomere-to-telomere genome assemblies and subgenome-resolved annotations[30,31], we profiled genome-wide DNA methylation in all three sequence contexts. We then classified genes into gbM, teM, and UM categories, assessed their association with TEs, and compared methylation and expression patterns between cultivars and across subgenomes. Our analyses revealed distinct methylation features linked to subgenome identity and cultivar-specific TE landscapes, offering new insights into the role of DNA methylation in regulating gene expression and subgenome behavior in a complex polyploid fruit crop.
-
Young leaf tissues were harvested from cultivated strawberries 'Florida Brilliance' (FB; Florida, USA) and 'Seolhyang' (SH; South Korea). These samples were utilized for WGBS and RNA-seq datasets. All sequencing data generated in this study has been deposited in the NCBI GEO database under accession number GSE297355. For Fragaria vesca, WGBS, and RNA-seq datasets were obtained from SRR3286267 and SRR6320486, respectively, while for Arabidopsis thaliana, WGBS, and RNA-seq datasets were retrieved from DRR023250 and PRJDB5192, respectively.
Whole-genome resequencing and variant calling
-
Illumina paired-end reads of FB were quality trimmed and filtered using Trimmomatic v0.39[32], then aligned to the Seolhyang reference genome using Minimap2 v2.2.1[33]. The resulting SAM files were converted to BAM format and sorted using SAMtools, followed by post-processing with Picard Tools (
https://broadinstitute.github.io/picard ) to mark duplicates. Variants, including single-nucleotide polymorphisms (SNPs) and InDels, were called using the GATK v4.1 HaplotypeCaller in GVCF mode, followed by joint genotyping across samples. To ensure high-confidence variant calls, only biallelic SNPs with an alternate allele frequency between 0.4 and 0.6 were retained for downstream analyses. Genome-wide variant density was computed from the final VCF using BEDTools within non-overlapping 100-kb windows. To assess the spatial relationship between variants, gene density, and repetitive elements, custom Python and Bash scripts were used to extract gene and Long Terminal Repeat (LTR) densities from the SH annotation. This data was integrated into a multi-track circular ideogram of the 28 SH chromosomes using the R package circlize v0.4.15[34]. This visualization enabled a comparative overview of SNP distribution in the context of gene-rich and repeat-rich genomic regions. Finally, all SNPs were functionally annotated using SnpEff[35].Whole genome bisulfite sequencing library construction
-
Genomic DNA (gDNA) was extracted from the harvested leaf tissues using CTAB protocols, and one sample per cultivar was used for WGBS library preparation. The libraries were prepared and sequenced by Psomagen (Maryland, USA). In brief, gDNA fragmentation was performed using a Covaris sonicator, followed by bisulfite conversion using the EZ DNA Methylation-Gold Kit (Zymo Research). Subsequently, WGBS library preparation and indexing were conducted using the xGen™ Methyl-Seq DNA Prep Kit (IDT). Following library construction, sequencing was performed using the NovaSeq X platform (Illumina), generating 150 bp paired-end reads.
WGBS mapping
-
Raw reads obtained from WGBS were trimmed using Trimmomatic v0.39[32]. Filtered reads from cultivars FB and SH were subsequently mapped to their corresponding reference genomes (FaFB1 genome for FB and Seolhyang genome for SH, respectively) using Bismark v0.24.1[36] with the directional mapping option enabled. In addition, the filtered reads of Fragaria vesca were mapped to the F. vesca v6.0[37] genome using the same parameters and pipeline. After mapping, deduplication, and cytosine calling were performed using Bismark v0.24.1[36]. A binomial test for methylation calls and calculation of bisulfite non-conversion rates was conducted using Methylpy v1.4.6[38], with the lambda phage genome serving as an unmethylated control. Quality control metrics such as bisulfite non-conversion rate, cytosine coverage, mapping ratio, and genome-wide coverage are summarized in Supplementary Table S1.
Analysis of global DNA methylation
-
For the circos plot, genome-wide density maps were generated for DNA methylation, genes, and TEs. Average DNA methylation levels for CG, CHG, and CHH contexts were calculated within non-overlapping 500-kb windows across the genome. Similarly, the number of genes and TEs was counted within the same 500-kb windows to visualize their genomic distribution patterns. For the bar plots showing DNA methylation levels across genomic features, cytosines with a minimum read coverage of five were selected for methylation analysis. For each genomic feature, the number of methylated reads corresponding to these cytosines was counted, and the average methylation level was calculated. These average values were visualized using bar plots to compare methylation levels across features. Additionally, the distribution of methylation levels of cytosines within each genomic feature was illustrated using box plots to represent variability and overall methylation patterns. For the metaplot analysis, genes and TEs, including their 1-kb upstream and downstream flanking regions were divided into 20 equal-sized bins. The average methylation level for each bin was calculated, and the resulting profiles were plotted. Finally, TE-overlapping genes were extracted by intersecting TE annotations with the gene annotation set without flanking extension using BEDTools (v2.30.0). For these TE-overlapping genes, the average DNA methylation levels and expression values were subsequently calculated.
Statistical analysis of genebody DNA methylation
-
Gene body DNA methylation was identified following the approach described by the previous study[39] with minor modifications. Briefly, the methylation percentage for each context (CG, CHG, CHH) was calculated across the coding regions (CDS) of all genes in FB, SH, F. vesca, and A. thaliana, respectively. These genome-wide percentages served as background methylation probabilities, which were used to perform binomial tests for each gene based on the number of methylated and total cytosines within their CDS. The resulting p-values were adjusted using the Benjamini–Hochberg False Discovery Rate (FDR) method to obtain q-values. Based on their methylation profiles, genes were categorized into four groups. Genes were classified as gbM if they contained at least 20 CG sites with sequencing coverage, exhibited a q-value less than 0.05 for mCG, and had q-values greater than 0.05 for both mCHG and mCHH. Genes showing teM were defined as those with at least 20 CHG sites and a q-value less than 0.05 for mCHG. UM genes were those with fewer than three methylated CG sites and q-values greater than 0.05 for all three methylation contexts. Genes that did not meet the criteria for any of the above categories were designated as unclassified. Importantly, the background probabilities for the binomial tests were derived independently from the average methylation levels across the CDS of all genes in each genome. Therefore, the approach is inherently normalized to each dataset, allowing the same classification criteria to be applied consistently to both diploid and polyploid species.
All annotated genes in FB (n = 100,702) and SH (n = 88,214) were classified into gbM, teM, and UM categories based on the criteria described above. The relative proportions of genes in each methylation category for both cultivars are summarized as pie charts. To investigate the divergence of gene body methylation between FB and SH, SynOrths v1.0[40] was used to identify 1:1 orthologous genes based on reciprocal BLASTP and synteny conservation. The resulting syntenic orthologs were defined as a core gene set (n = 64,303) for downstream comparative analysis of methylation and expression.
RNA-seq library construction and data analysis
-
Total RNA was extracted from harvested leaf tissues from three biological replicates per cultivar using the Spectrum™ Plant Total RNA Kit (Sigma-Aldrich) for FB, and the RNeasy® Plant Mini Kit (Qiagen) for SH. RNA-seq libraries were prepared according to the Illumina protocol and sequenced as 150-bp or 101-bp paired-end reads on the NovaSeq 6000 platform. Because different RNA extraction kits and sequencing read lengths were used between cultivars, we explicitly accounted for these potential confounding factors by applying gene length and library size normalization, thereby minimizing technical bias in cross-cultivar comparisons. Raw RNA-seq reads were quality-trimmed using Trimmomatic v0.39[32], and the filtered reads were aligned to cultivar-specific reference genomes using STAR v2.7.11b[41]. Gene-level read counts were obtained with FeatureCounts v2.0.6[42], and transcript abundance was quantified as Transcripts Per Million (TPM). To enable cross-cultivar comparisons, 64,303 core gene pairs between FB and SH were identified using SynOrths v1.0[40]. To account for potential differences in ortholog lengths between the two reference genomes, raw read counts were normalized by gene length using Tximport v1.26.1[43]. These length-normalized counts were further normalized for library size using DESeq2[44], and the resulting values were used to compare gene expression between cultivars in relation to gene body methylation status transitions. Differentially expressed genes (DEGs) were subsequently identified using DESeq2[44], with significant DEGs defined as those having an absolute log2FoldChange greater than 2, and an FDR less than 0.05.
-
Since the emergence of cultivated strawberry (Fragaria × ananassa) through hybridization between F. virginiana and F. chiloensis, the species has spread widely, including into Asia and the United States, where breeders have selected for local adaptation[1,45]. Among these, 'Florida Brilliance' (FB) and 'Seolhyang' (SH) represent the leading commercial cultivars in Florida (United States) and South Korea, respectively. Despite their geographic and genetic divergence[29], the comparative genomic and epigenomic features of these two cultivars have not been explored. To determine these differences, we aligned whole-genome sequencing reads from FB to the SH reference genome and identified a total of 2,088,054 SNPs. Visualization of SNP, gene, and LTR densities across the 28 chromosomes of the octoploid strawberry genome revealed distinct spatial patterns and relationships (Fig. 1a). The outermost ring shows that SNPs were broadly distributed across all subgenomes, but their density was notably reduced in regions with high gene content. The middle ring, representing gene density, indicated that genic regions were concentrated in euchromatic arms, which generally harbored fewer SNPs. Conversely, the innermost ring showed that LTR retrotransposons were predominantly enriched in pericentromeric or intergenic regions, often coinciding with peaks in SNP density. These spatial patterns suggest an inverse relationship between gene-rich and SNP-rich regions, with LTR elements positively associated with SNP accumulation. Most SNPs were located outside annotated gene models, implying that genomic variation between the two cultivars is concentrated in non-coding, possibly TE-associated regions.
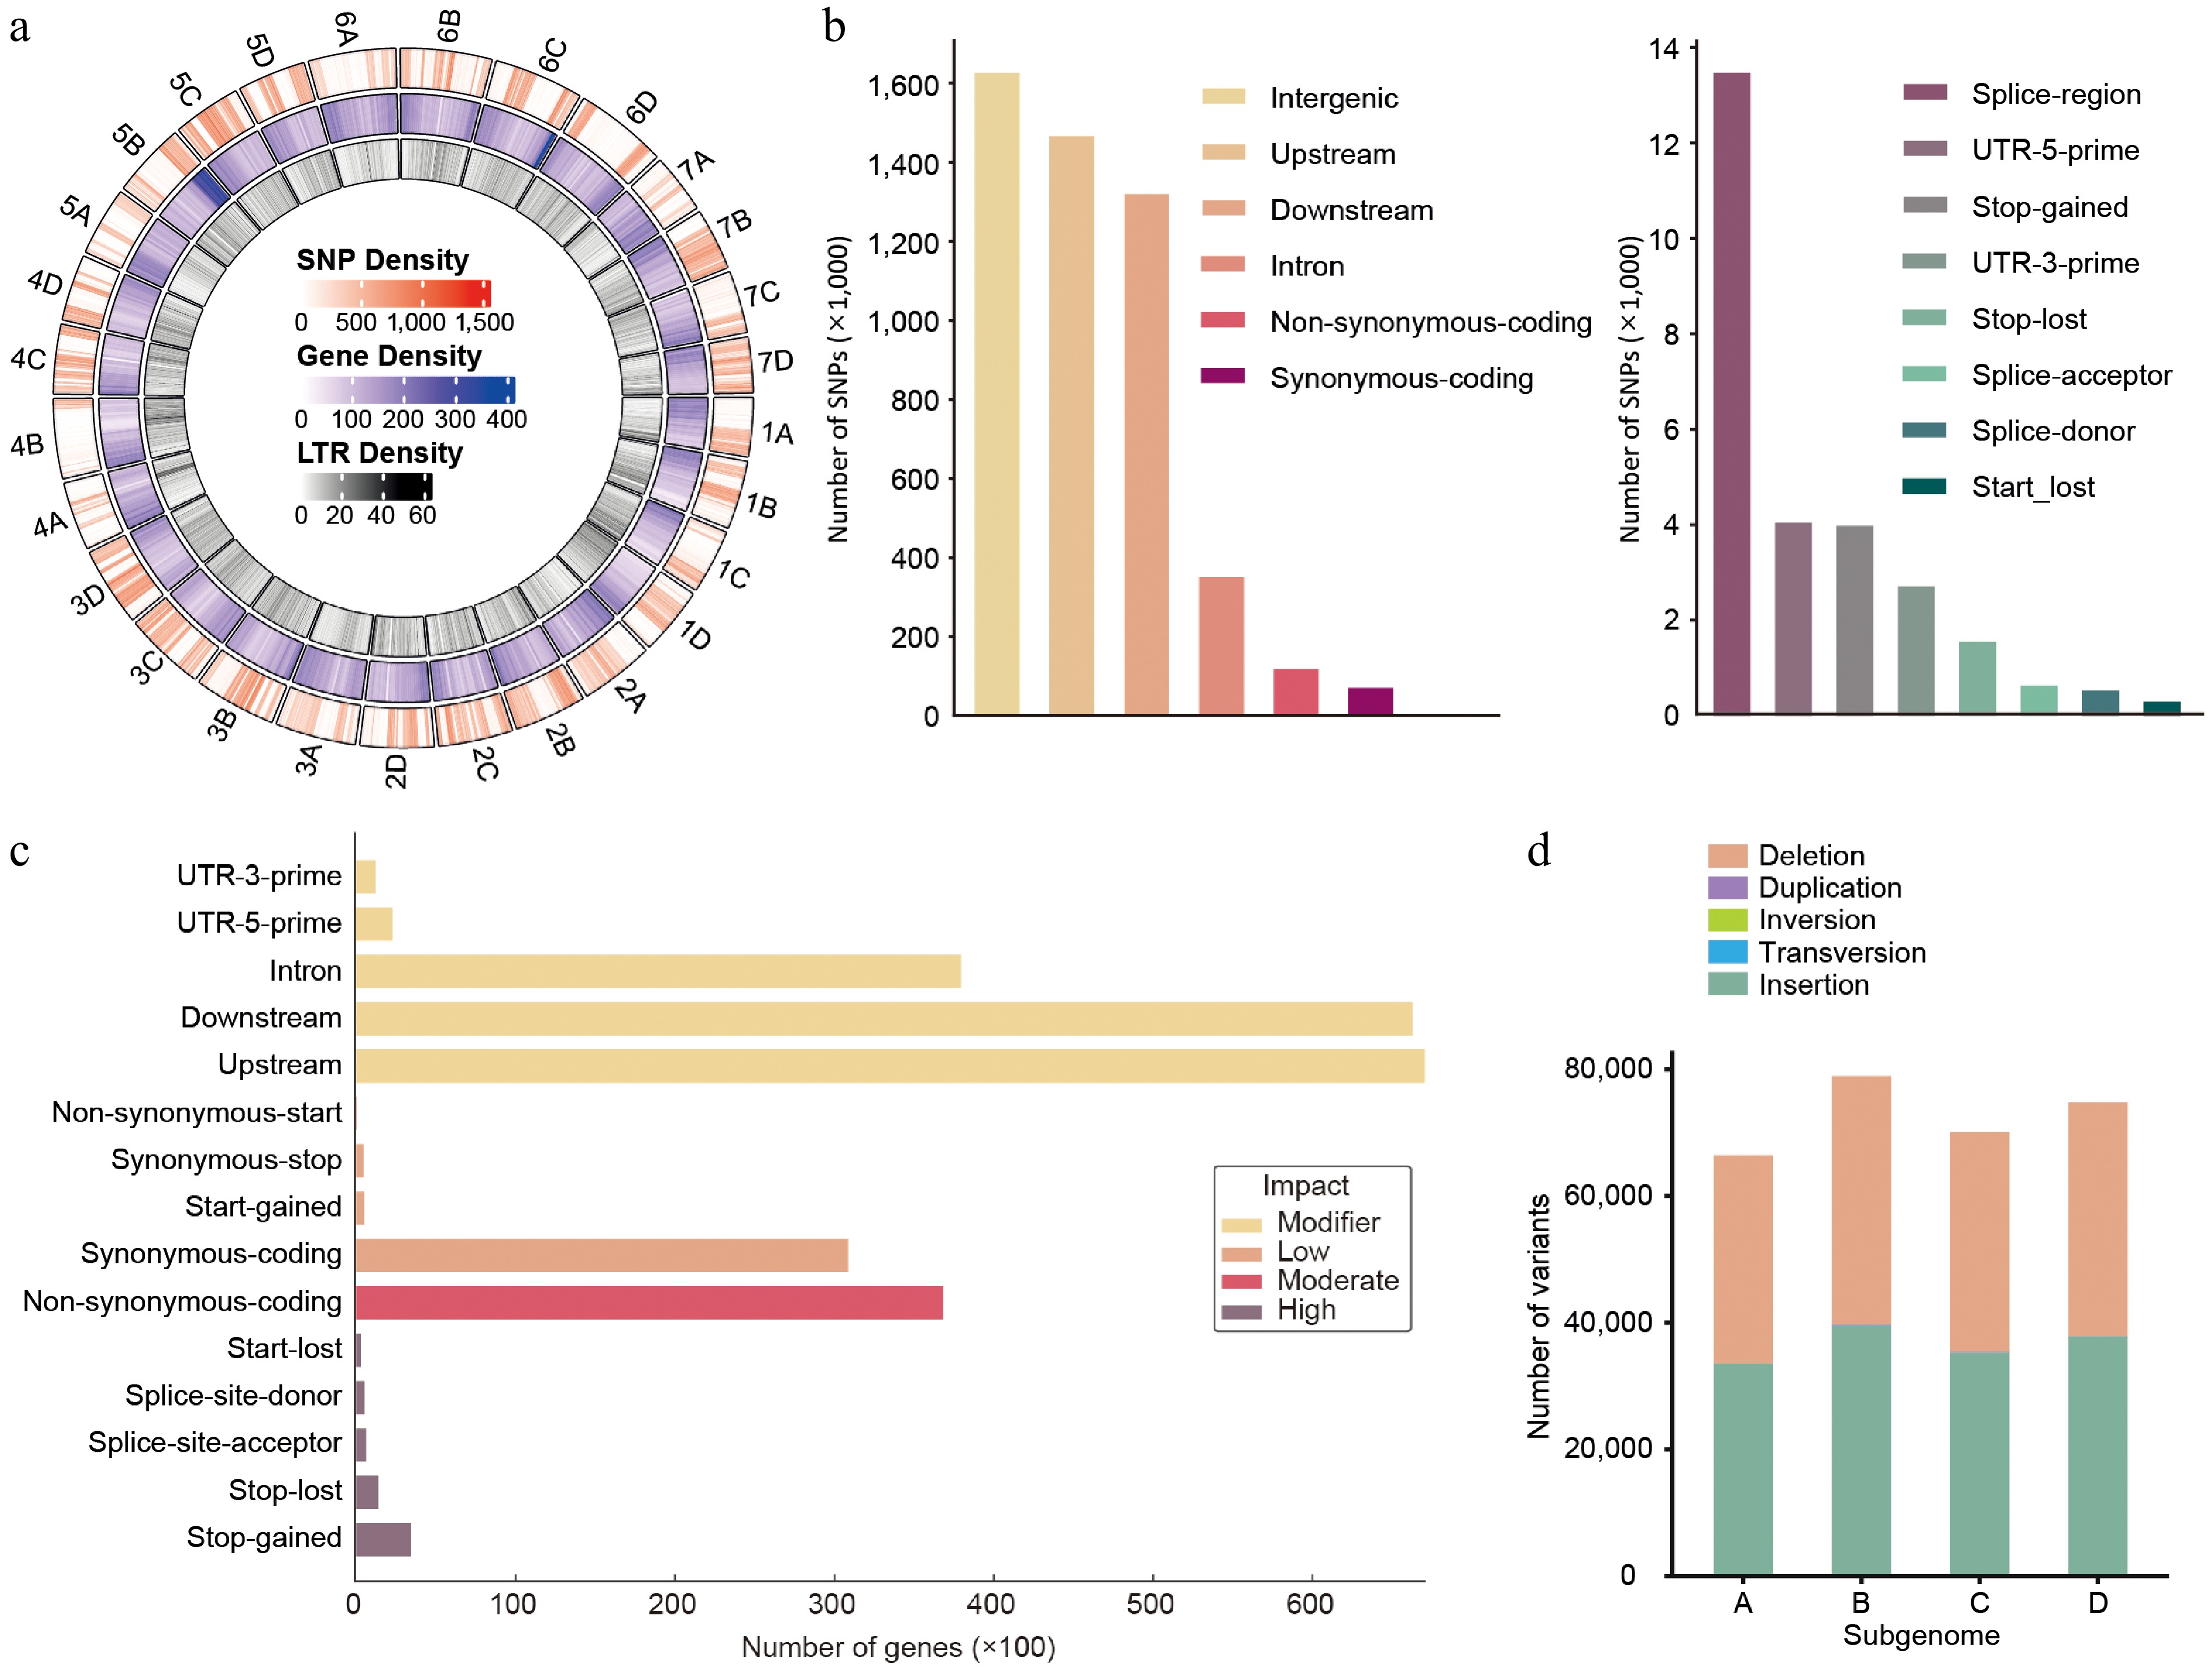
Figure 1.
Genome-wide distribution and annotation of SNPs and structural variants between 'Florida Brilliance' and 'Seolhyang' strawberries. (a) Circos plot showing genome-wide distributions of SNP density (outermost ring, red), gene density (middle ring, blue), and LTR density (innermost ring, green) across the chromosomes of the analyzed Seolhyang reference genome. Whole-genome resequencing (WGS) data of Brilliance was aligned to the Seolhyang reference genome for this analysis. (b) Functional classification of SNPs according to genomic context. Left panel: most SNPs are located in intergenic, upstream, or downstream regions. Right panel: SNPs within coding and regulatory regions, including splice sites and UTRs. (c) The number of genes harboring SNPs, classified based on their predicted functional impact into four categories: modifier, low, moderate, and high. (d) Distribution of structural variants (SVs), including deletions, duplications, inversions, transversions, and insertions across four subgenomes A–D.
To further classify the variants by genomic feature, we quantified SNPs located in specific elements such as intergenic regions, gene upstream and downstream sequences, introns, and coding sequences (Fig. 1b). Although 2,088,054 SNPs were identified, functional annotation predicted 4,964,009 biological effects, as individual SNPs could affect multiple genomic features simultaneously. A large proportion of the predicted biological effects associated with SNPs were distributed in intergenic (32.8%), upstream (29.5%), downstream (26.6%), and intron regions (6.9%), with only a minor fraction affecting exons (3.9%) (Fig. 1b, Supplementary Table S2). These variants are thus expected to have limited impact on gene function. Among exonic SNPs, non-synonymous mutations (2.48%), including missense (2.4%) and nonsense (0.08%), accounted for a relatively small portion. Variants affecting splice donor or acceptor sites (0.02%), as well as start or stop codon gain or loss (< 0.1%), were even less frequent. To estimate the potential functional effects of the detected variants, we categorized them into four impact groups: modifier, low, moderate, and high (Fig. 1c). The majority of variants were of modifier effect (95.9%), mainly located in non-coding regions (Supplementary Table S3). Only 2.38% and 0.14% of the variants were predicted to have moderate or high impact, respectively, corresponding to 36,817 and 6,217 affected genes (Fig. 1c, Supplementary Table S3). Among the genes with moderate-impact variants, only 1,192 genes contained more than 10 predicted SNP effects, implying that the gene body regions of FB and SH are largely conserved (Supplementary Table S4).
Given the octoploid nature of strawberry, the distribution of variants across the four subgenomes (A, B, C, and D) were also examined (Fig. 1d). Most detected changes were SNPs, while insertions and deletions contributed minimally, and larger structural variations such as duplications, inversions, and translocations were nearly absent (Fig. 1d), suggesting no major chromosomal rearrangements between the two cultivars. Consistent with this, previous whole-genome synteny analyses indicated general genomic collinearity between FB and SH[30]. In summary, only a small proportion of the genome harbored SNPs likely to alter protein-coding sequences. This genome-level analysis provides a foundation for comparative assessment of DNA methylation patterns between the two cultivars.
Genome-wide DNA methylation profiling in FB and SH strawberry cultivars
-
To investigate genome-wide DNA methylation landscapes, we performed WGBS on leaf tissues from the octoploid strawberry cultivars FB and SH. Given that both high-quality FB and SH genomes have recently been assembled[30,31], WGBS reads were aligned to their respective cultivar-specific reference genomes to maximize mapping accuracy. This strategy yielded mapping rates of 51.3% for FB and 49.0% for SH (Supplementary Table S1). In contrast, reciprocal mapping to the alternate genome resulted in lower mapping rates (37.7% for FB and 38.2% for SH), indicating over 10% improvement of mapping rate when using the corresponding genome. We further evaluated overall genome coverage as well as cytosine-level coverage across the genome. The proportion of cytosines covered by three or more reads reached 88.4% in FB and 85.0% in SH, with an average sequencing depth of 28.3× for FB and 20.7× for SH (Supplementary Table S1). Together, these results support the robustness of our WGBS datasets for downstream methylome analysis.
Using this high-quality WGBS data, we profiled genome-wide DNA methylation patterns across all 28 chromosomes in both cultivars. Circular ideograms (Fig. 2) illustrate the integration of DNA methylation levels, gene density, and TE density. DNA methylation was enriched in TE-rich regions, typically corresponding to pericentromeric or centromeric areas, and showed a strong inverse correlation with gene-rich euchromatic arms. These observations are consistent with patterns reported in other plant species[46,47], supporting the successful and accurate performance of our WGBS data. Overall, the two cultivars of genetically distinct origin exhibited a largely conserved global methylation landscape, with localized differences in methylation intensity potentially reflecting cultivar-specific regulatory features.
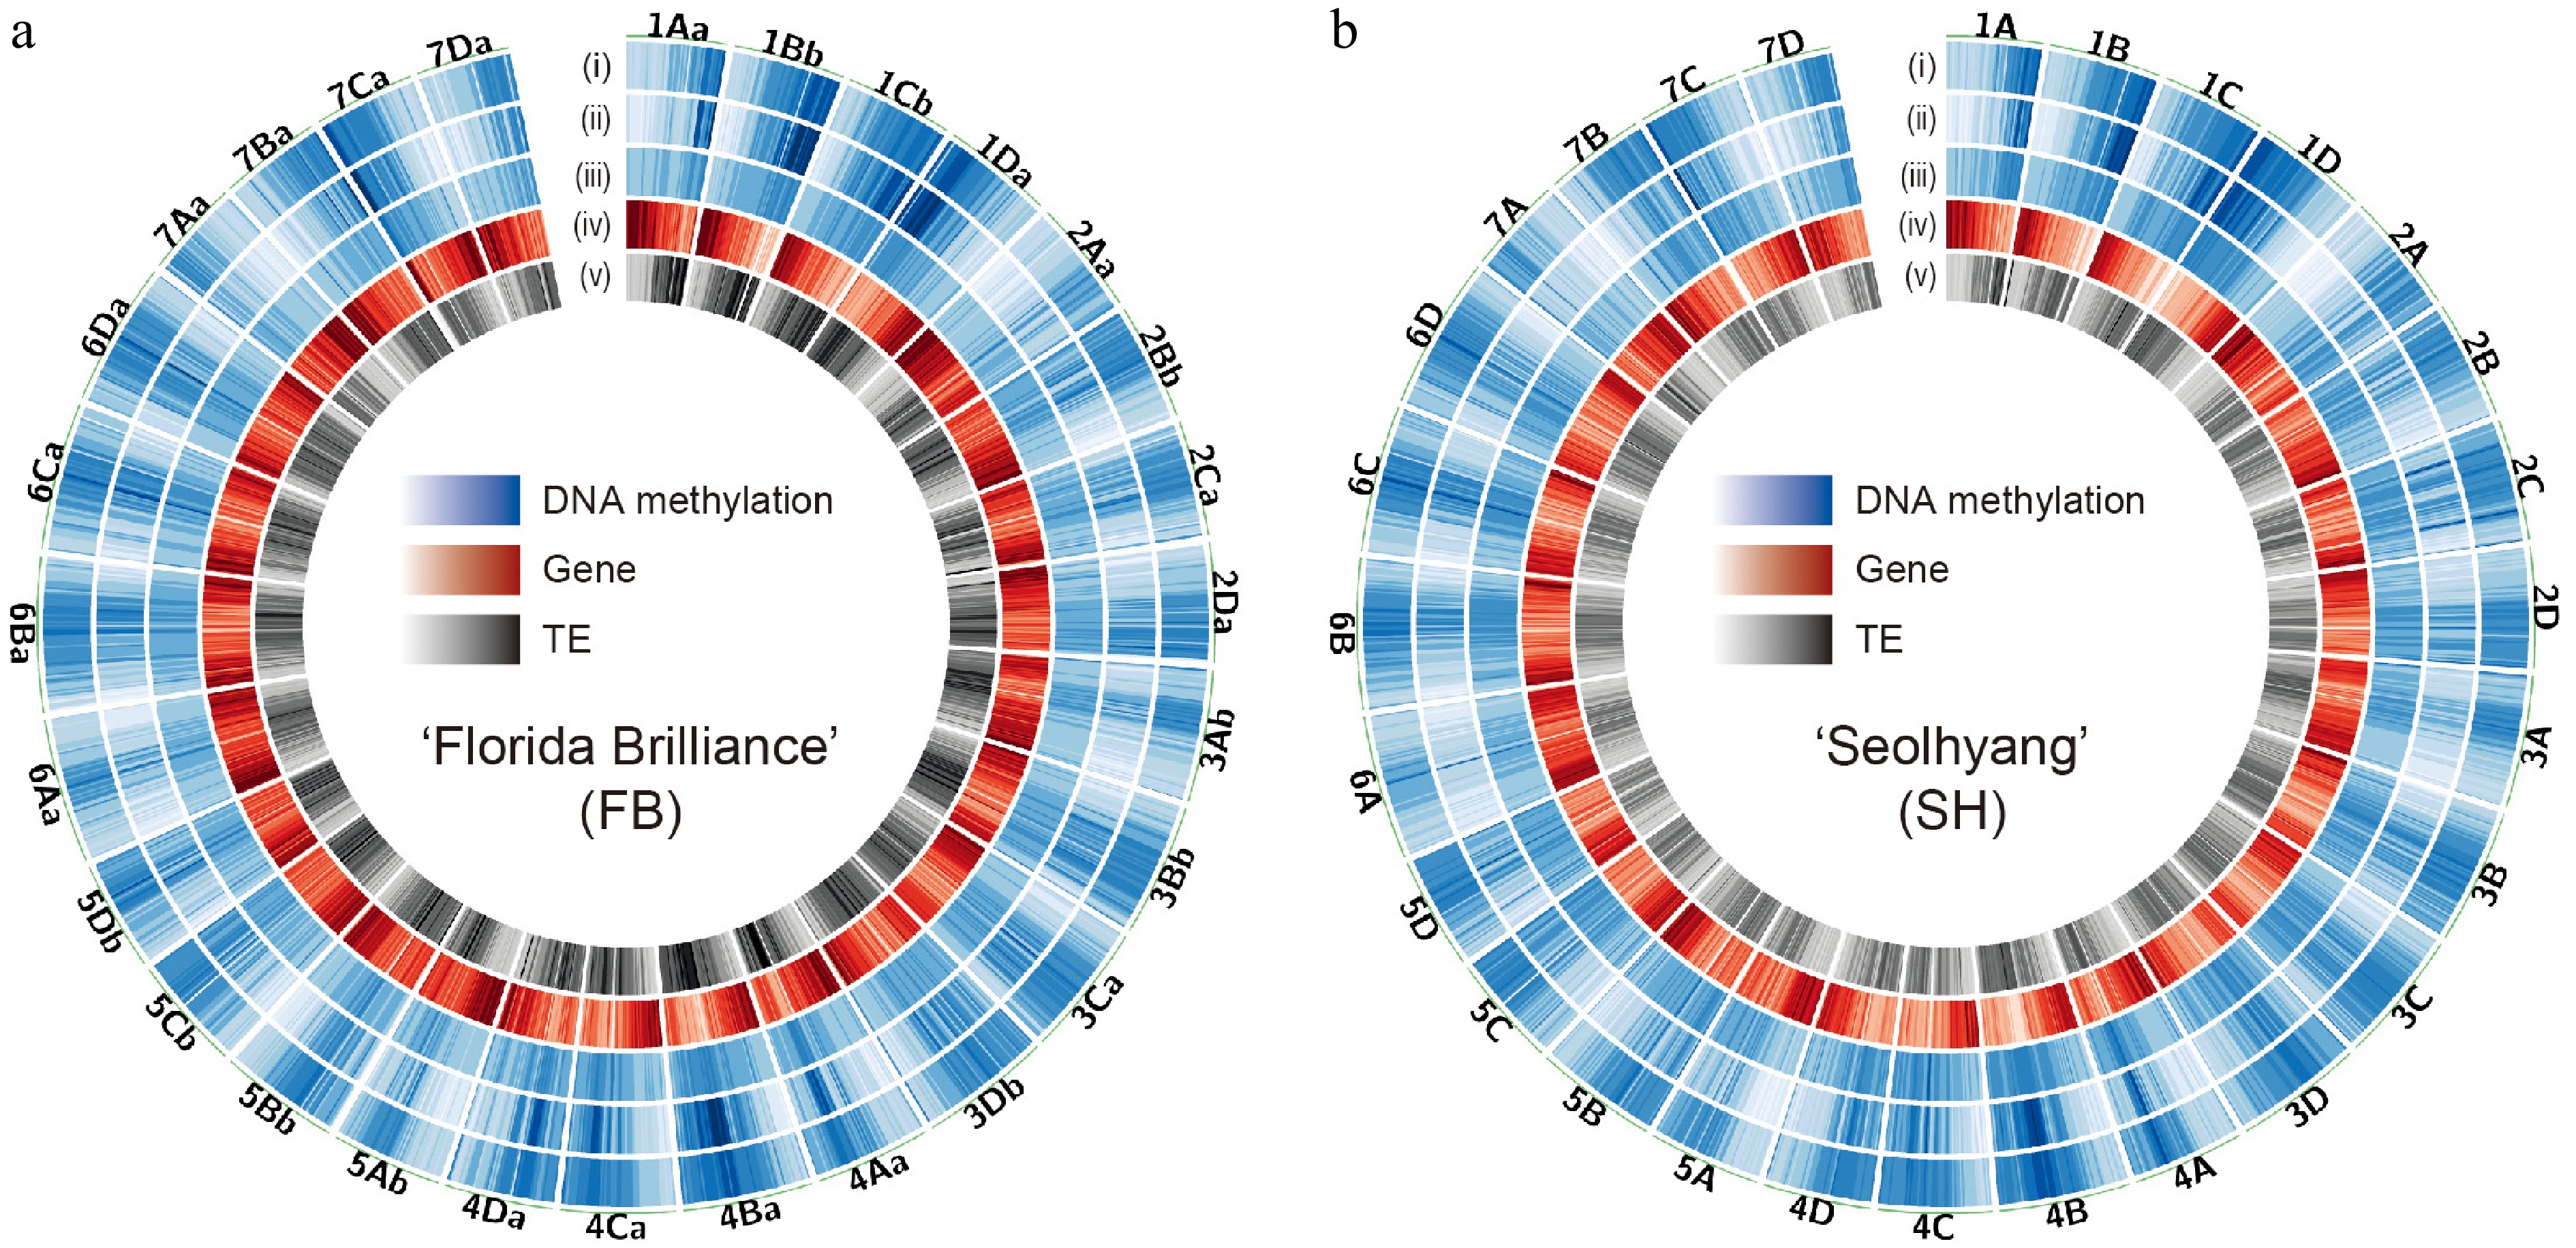
Figure 2.
Genome-wide DNA methylation landscape of octoploid strawberry cultivars. Circos plots showing the genome-wide distribution of DNA methylation in (a) 'Florida Brilliance' (FB), and (b) 'Seolhyang' (SH). Each track indicates the density of (i) mCG, (ii) mCHG, (iii) mCHH, (iv) genes, and (v) TEs from the outside. The density scales are as follows: mCG (0–1), mCHG (0–0.6), mCHH (0–0.1), genes (0–100), and TEs (0–774). Methylation levels and feature densities were calculated in non-overlapping 500-kb windows across the genome.
Comparative DNA methylation patterns across genomic features and contexts
-
Following the genome-wide profiles, a comparative analysis of DNA methylation patterns between FB and SH was conducted across specific genomic features and methylation contexts (CG, CHG, and CHH). Both cultivars exhibited similar overall methylation levels, with the highest levels observed in the CG context, followed by CHG and CHH (Fig. 3a). Average methylation levels across genomic features showed that DNA methylation was generally higher in TEs and repetitive regions and lower in gene-associated regions such as exons and introns. (Fig. 3a). Notably, mCHG levels in SH were slightly reduced in both exons and TEs compared to FB. To further examine methylation variability, the distribution of methylation values across these genomic categories was analyzed (Fig. 3b). While CG and CHH patterns were largely comparable, SH consistently exhibited lower mCHG, especially in TE and repeat regions. This trend was further supported by metaplot analysis visualizing methylation across gene and TE bodies (Fig. 3c). The mCHG levels in SH showed a slight reduction over gene bodies and a more pronounced decrease across TEs, indicating a potential cultivar-specific difference in CHG methylation targeting.
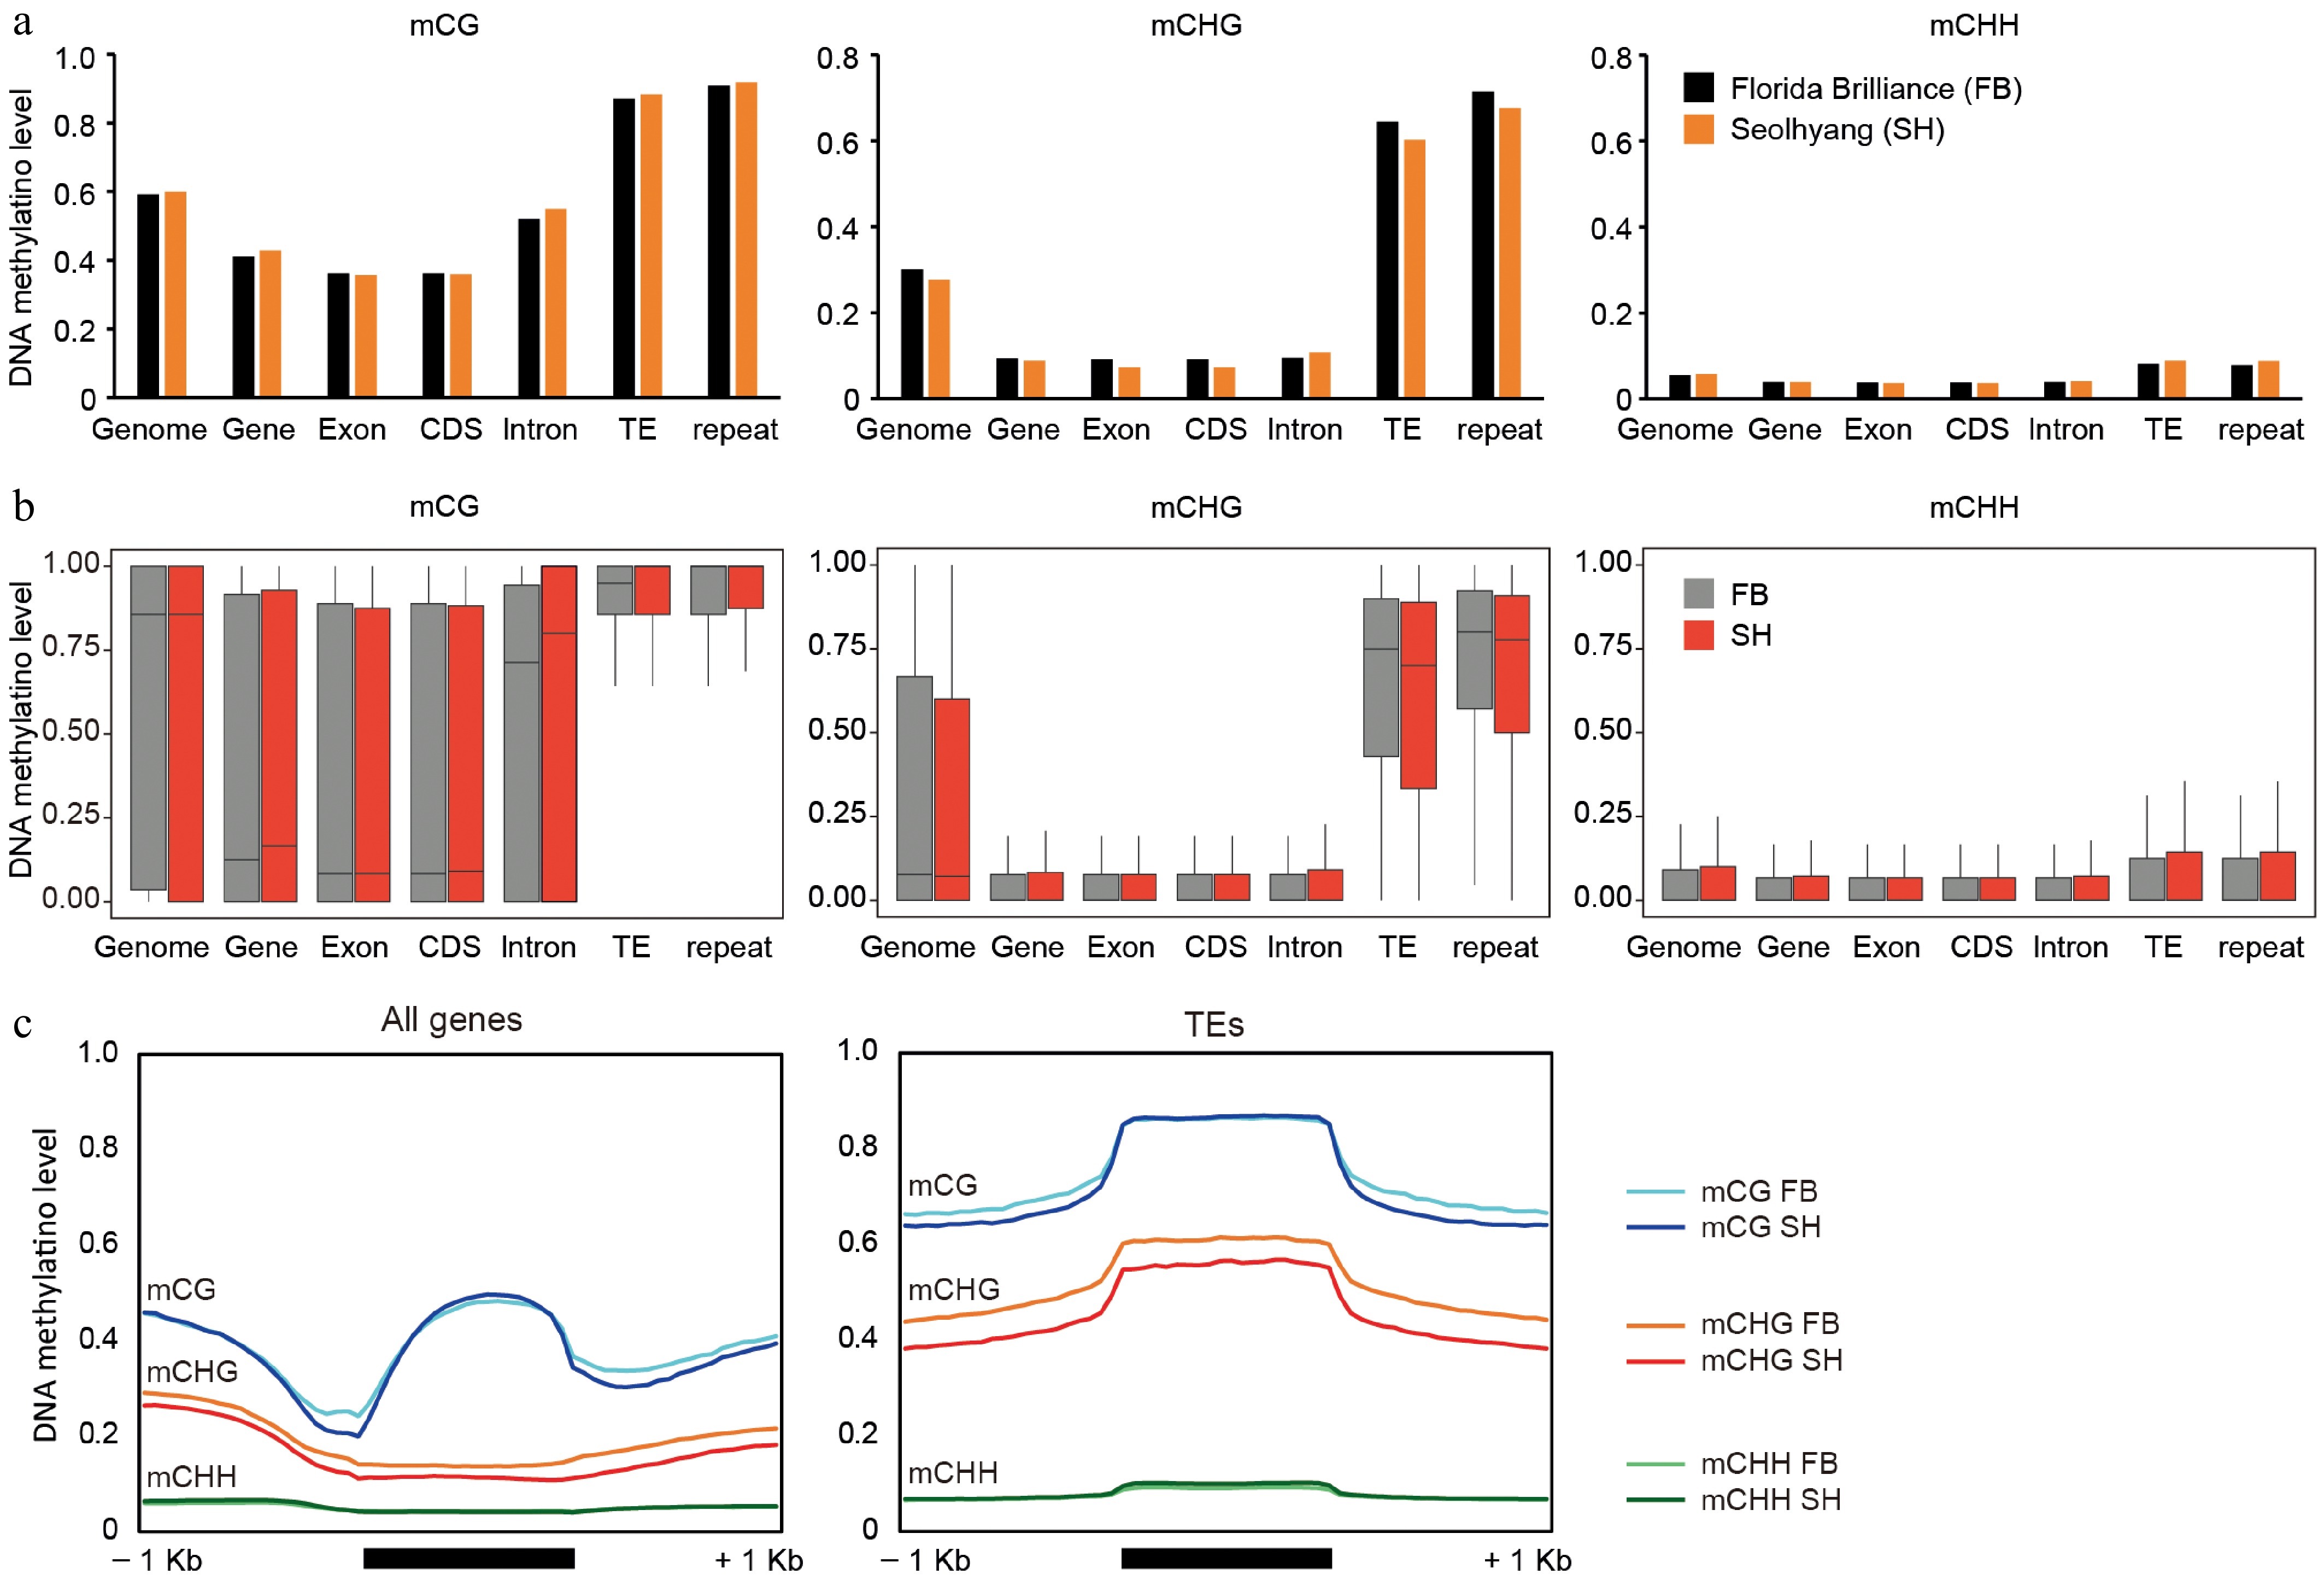
Figure 3.
Comparative analysis of DNA methylation levels across genomic features in octoploid strawberry cultivars. (a) Average DNA methylation levels in CG, CHG, and CHH contexts across various genomic features, including whole genome, genes, exons, coding sequences (CDS), introns, TEs, and repetitive elements. (b) Distribution of DNA methylation levels in CG, CHG, and CHH contexts across the same genomic features shown in (a), with variation represented as boxplots for FB (gray) and SH (red). (c) Metaplots illustrating DNA methylation patterns over genes and TEs. To generate the metaplots, each region comprising the 1-kb upstream, the gene/TE body, and the 1-kb downstream was divided into 20 equal-sized bins. For each bin, the number of methylated cytosine reads and the total cytosine reads were counted, and the average methylation level was calculated based on these values.
Gene classification by DNA methylation profiles in strawberry
-
To further dissect methylation profiles at the gene level, we classified genes in FB and SH into three categories—gene body methylated (gbM), transposon-like methylated (teM), and unmethylated (UM)—based on methylation levels across CG, CHG, and CHH contexts (Supplementary Table S5). Representative genome browser views (Fig. 4a) highlight these classes: gbM genes exhibit high mCG but lack mCHG and mCHH; UM genes show no substantial methylation in any context; teM genes display elevated levels across all contexts, particularly mCG and mCHG. These context-specific signatures were consistently observed in metaplot analyses (Fig. 4b), with teM genes showing broad methylation enrichment resembling TE-like patterns, while UM genes remained largely unmethylated.
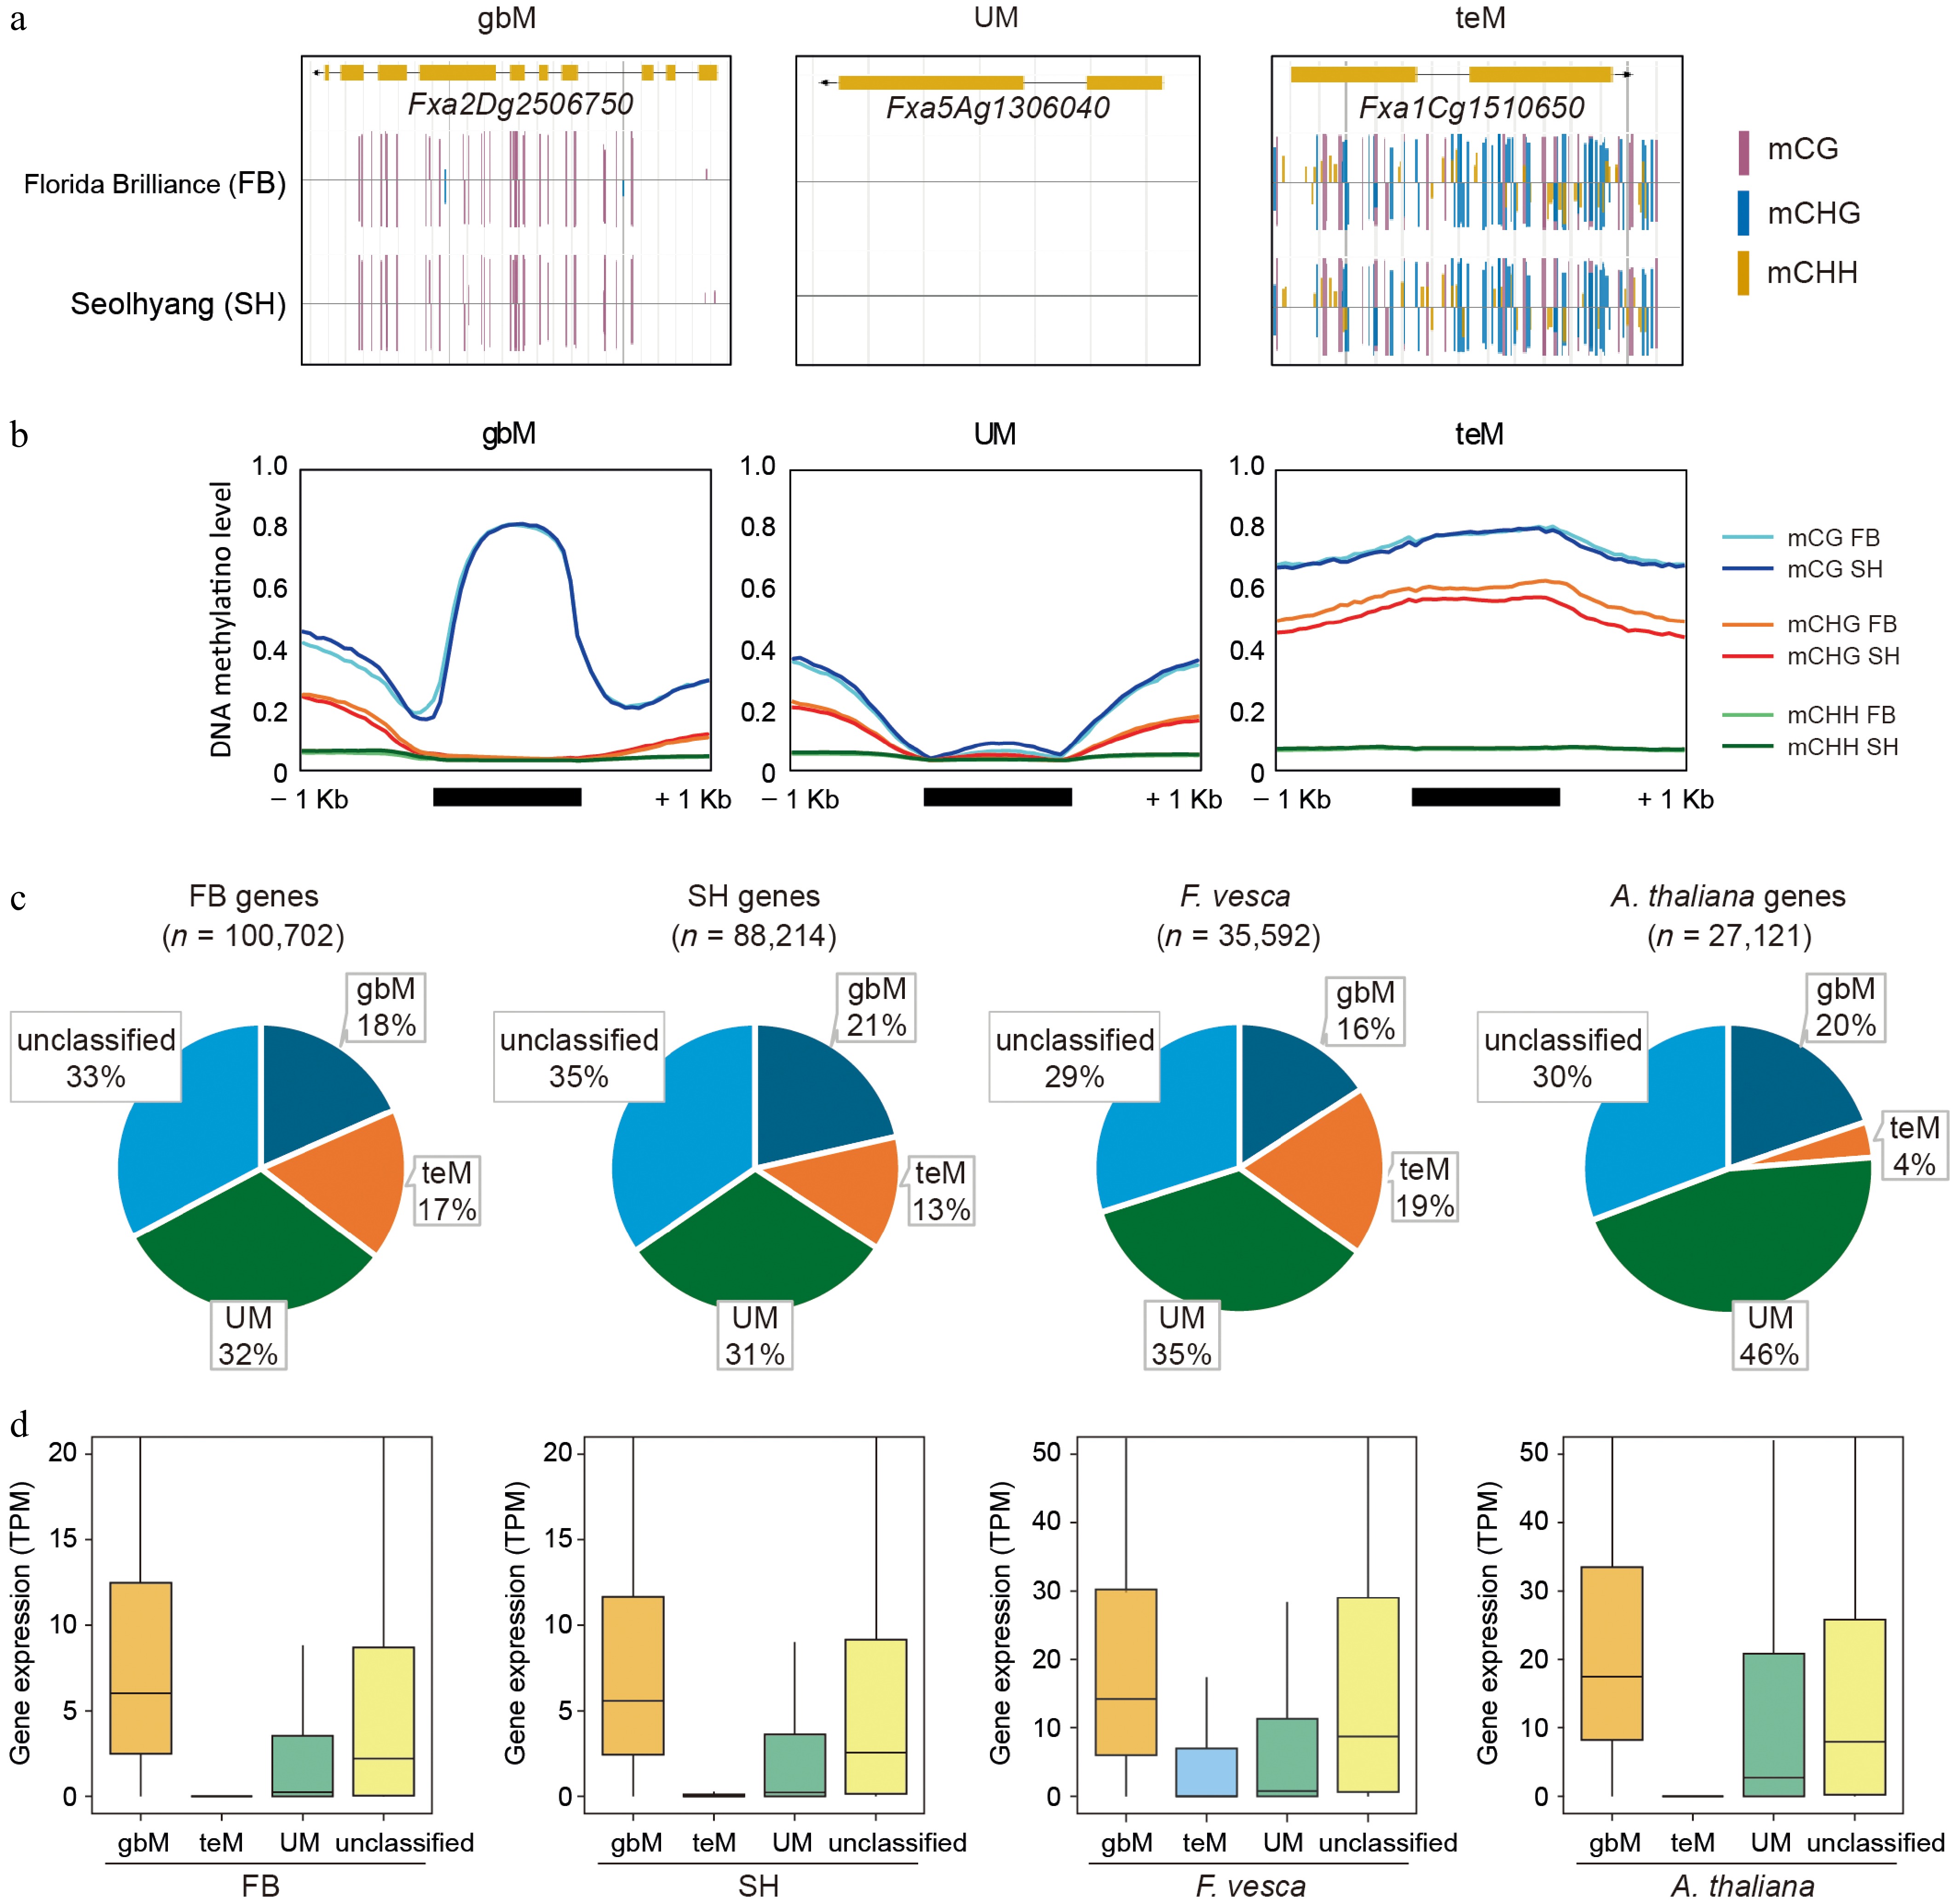
Figure 4.
Classification and comparison of gene methylation patterns in octoploid strawberry cultivars. (a) Representative genome browser views of genes classified as CG gene body methylated (gbM), unmethylated (UM), and TE-like methylated (teM) in FB and SH. Methylation contexts are indicated by colored bars: mCG (magenta), mCHG (blue), and mCHH (yellow). (b) Metaplots showing DNA methylation levels across 1-kb upstream and downstream regions of gbM, UM, and teM genes, where average methylation levels were calculated by dividing each region into 20 equal bins and computing the mean ratio of methylated to total cytosine reads within each bin. (c) Pie charts representing the proportions of gbM, teM, UM, and unclassified genes in FB, SH, Fragaria vesca, and Arabidopsis thaliana. (d) Boxplots showing gene expression levels (TPM) for each methylation category (gbM, teM, UM, and unclassified) in FB, SH, F. vesca, and A. thaliana.
Notably, while methylation patterns between FB and SH were broadly similar, teM genes in SH displayed a slightly reduced mCHG level compared to FB (Fig. 4b). This trend was not observed in gbM or UM genes, suggesting that the reduced mCHG observed in genic regions of SH (as seen in Fig. 3c) originates primarily from teM genes. To explore the underlying cause, we analyzed the expression of key DNA methylation machinery genes using RNA-seq data. Surprisingly, the expression of CMT3, a methyltransferase responsible for maintaining CHG methylation[16], was slightly higher in SH. However, expression of RNA-directed DNA methylation components such as AGO4 and CLSY1/2[48,49] was lower in SH, and the DNA demethylase gene ROS1a[50] showed elevated expression. These expression patterns may collectively contribute to reduced mCHG methylation in SH teM genes and TEs (Supplementary Fig. S1).
We next quantified the distribution of methylation classes (Fig. 4c). In the octoploid strawberries FB and SH, 18%–21% of genes were classified as gbM, 31%–32% as UM, and 13%–17% as teM, with the remaining genes unclassified. To determine if these distributions were conserved across species, we also analyzed gene body methylation in Fragaria vesca, and Arabidopsis thaliana. The gbM category accounted for 16%~21% of genes in all four species (FB, SH, Fragaria vesca, and Arabidopsis thaliana), suggesting a conserved role, whereas the proportions of teM and UM genes varied among species (Fig. 4c). Notably, F. vesca showed the highest teM proportion (19%), while Arabidopsis exhibited only 4%. Because teM genes are often located near TEs, we compared TE densities among these species by counting annotated TEs within 500-kb windows (Supplementary Fig. S2a). FB exhibited the highest TE density, followed by SH and F. vesca, whereas A. thaliana had the lowest. Regression analysis revealed a positive correlation between TE density and teM proportion across species (R2 = 0.7645, Supplementary Fig. S2b), suggesting that the elevated teM ratio in FB may be largely attributable to its increased TE abundance.
Finally, we examined gene expression levels for each methylation class using RNA-seq (Fig. 4d). Consistent across all four species, gbM genes exhibited the highest expression, followed by unclassified and UM genes, while teM genes had the lowest expression levels. This conserved expression hierarchy is consistent with previous observations and may reflect a general association between methylation class and gene activity.
Divergence of gene body methylation and expression between FB and SH cultivars
-
To investigate how gene body methylation patterns differ between FB and SH, we identified one-to-one orthologous genes using synteny conservation and reciprocal best BLASTP hits, yielding a core gene set of 64,303 genes (Fig. 5a, Supplementary Table S6). Genes from both cultivars were classified into gbM, teM, UM, or unclassified categories based on DNA methylation profiles, and transition patterns from FB to SH were examined (Fig. 5b). Among FB gbM genes (n = 15,051), the vast majority (84.8%) retained their gbM status in SH. A small proportion transitioned to teM (1.8%) or UM (1.0%), while 12.4% became unclassified. However, FB teM genes (n = 6,383) showed higher plasticity: only 69.2% remained as teM, with 6.5% and 8.9% transitioning to gbM and UM, respectively. FB UM genes (n = 19,676) were relatively stable, with 78.5% retaining UM classification and only 1.1% and 2.0% transitioning to gbM or teM. These results suggest that teM genes show greater classification dynamics between cultivars than gbM and UM genes.
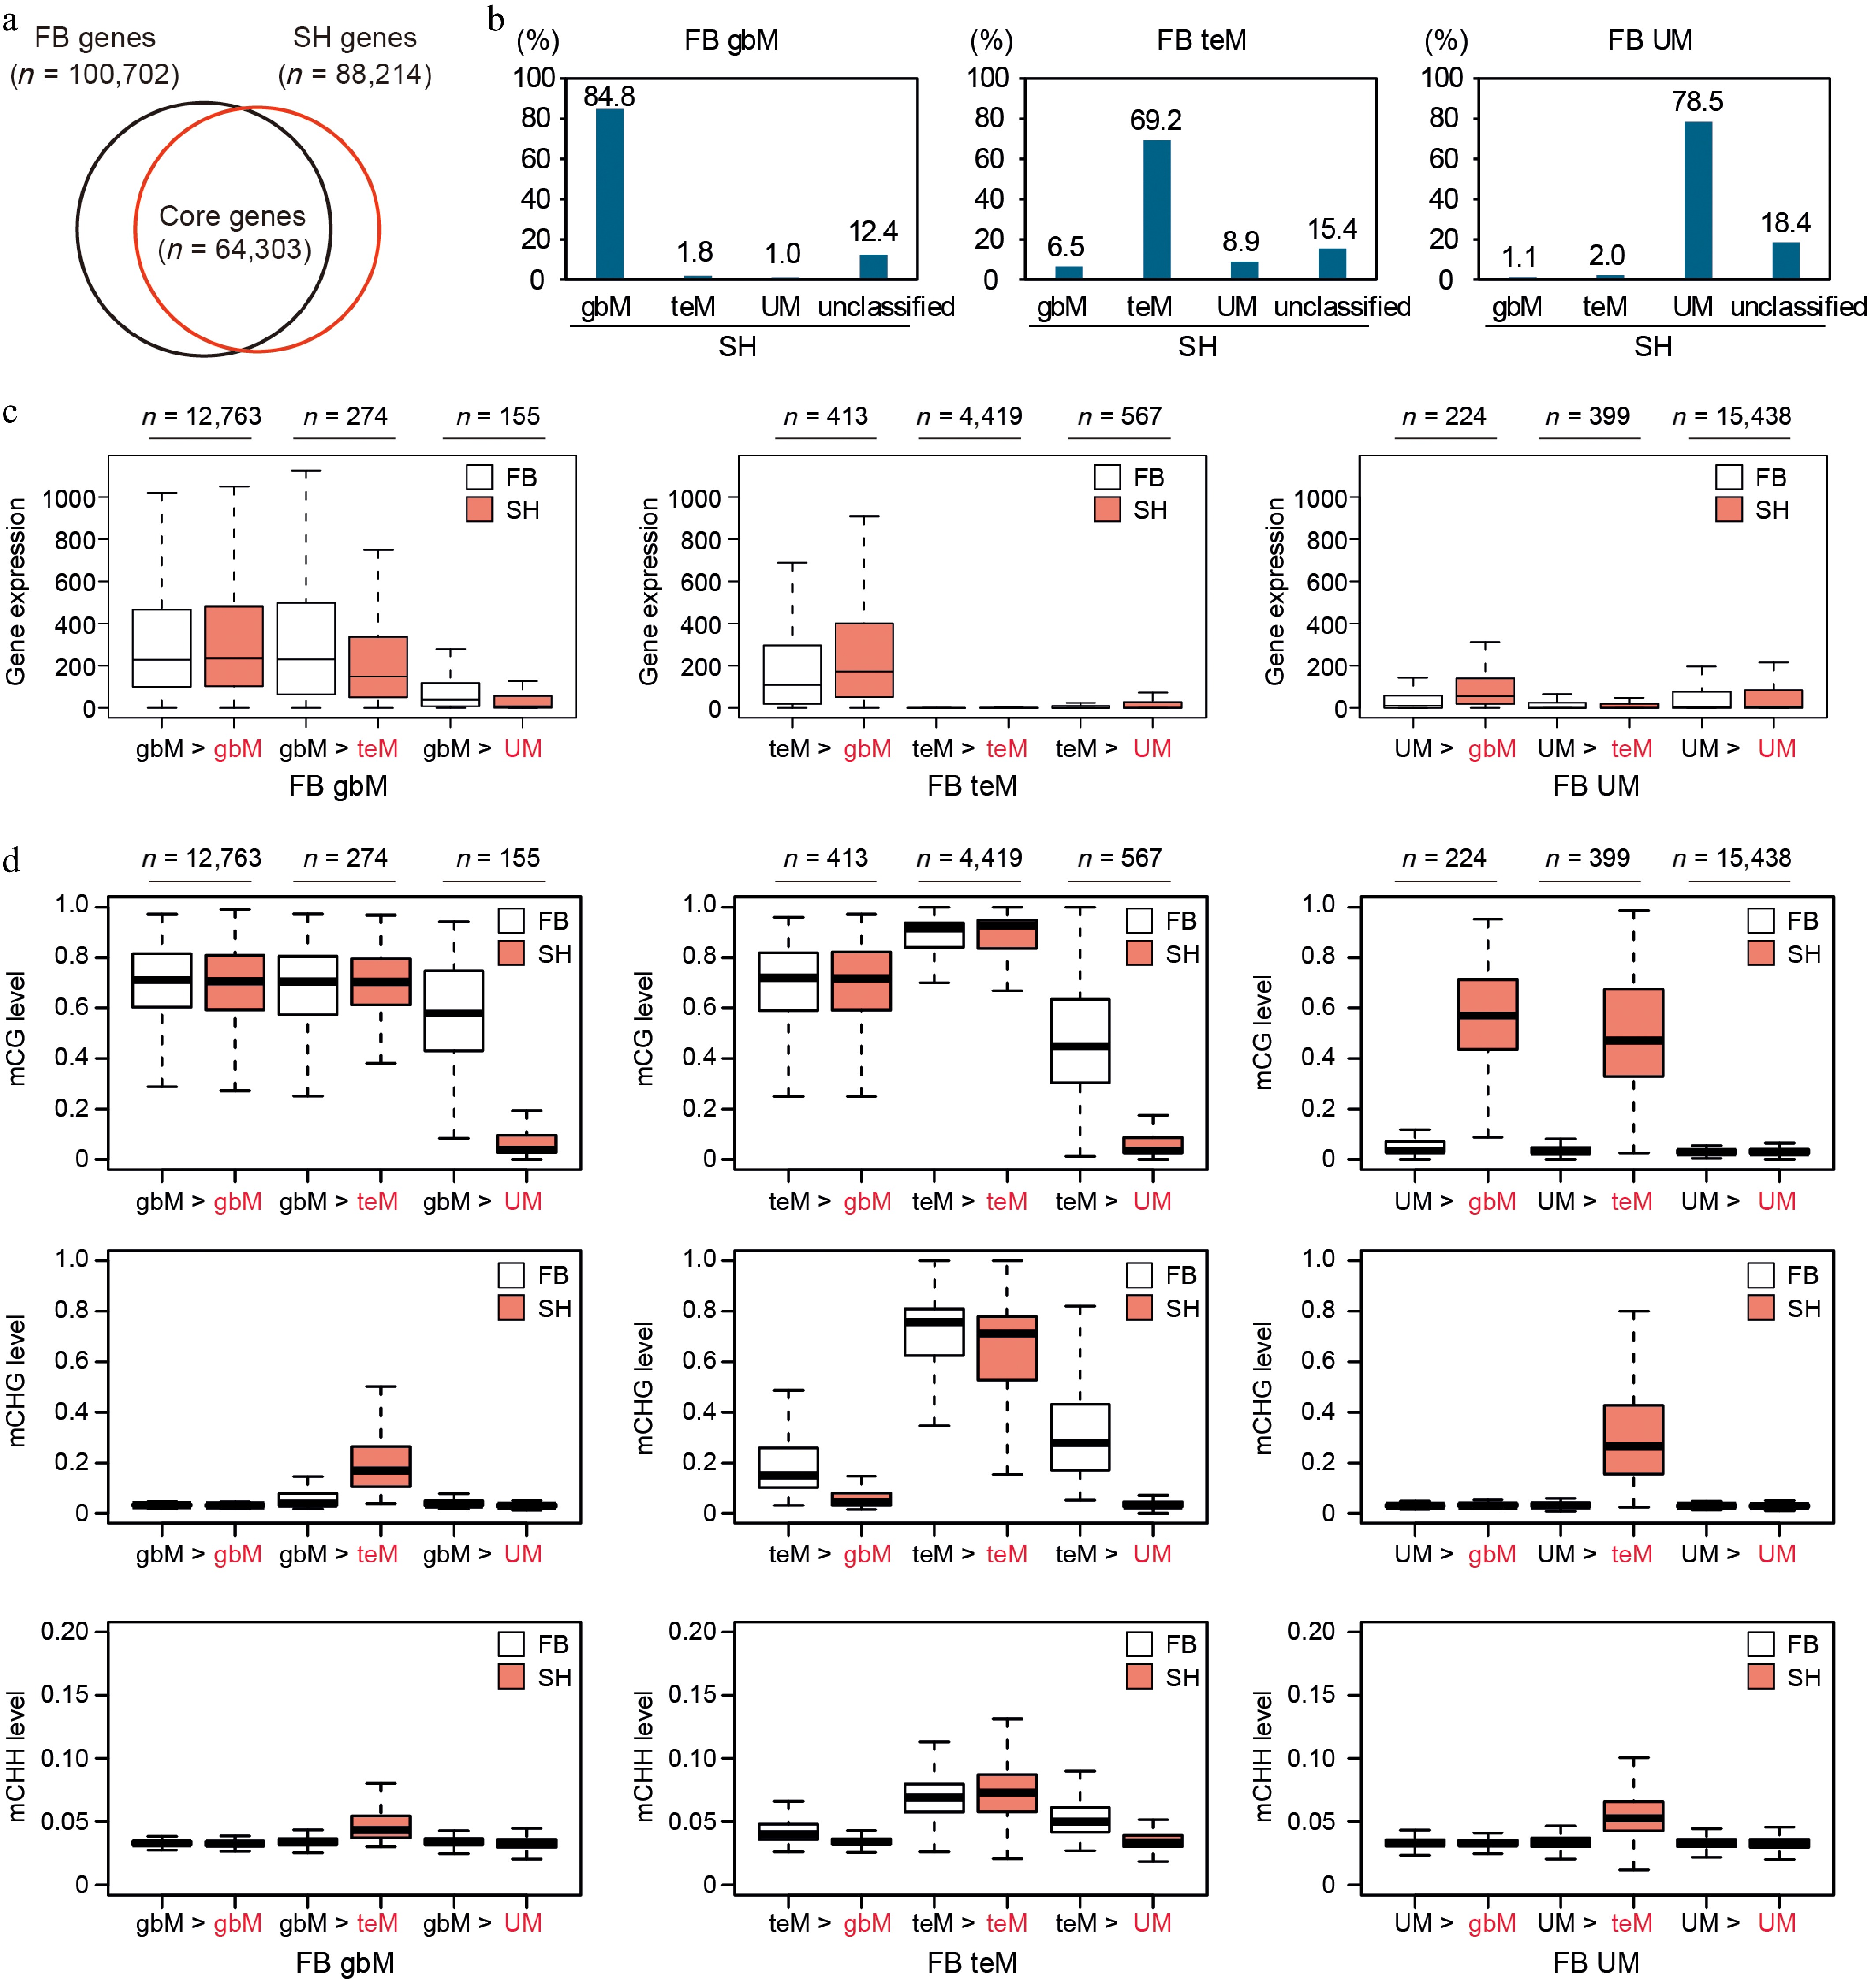
Figure 5.
Conservation and dynamics of gene body methylation and gene expression between FB and SH. (a) Venn diagram showing the overlap of predicted genes between FB and SH. A total of 64,303 genes with one-to-one reciprocal best BLAST hits at the protein level were defined as core genes and used for the analyses in panels (b)–(d). (b) Transition of DNA methylation classification (gbM, teM, UM) of FB genes in SH. For each methylation category in FB (gbM, teM, and UM), the percentage of genes that retained or shifted their methylation classification in SH is shown. (c) Gene expression levels normalized for gene length and library size, and (d) DNA methylation levels in FB (white) and SH (red) across transition categories. Each panel compares the expression of genes classified as gbM, teM, or UM in FB, grouped by their corresponding methylation category in SH.
To assess the functional consequences of methylation shifts, we compared gene expression levels across transition groups using length- and library size-normalized RNA-seq data (Fig. 5c). For gbM genes, those stably classified as gbM in both cultivars (gbM > gbM; n = 12,763) showed consistently high expression. In contrast, gbM genes that transitioned to teM (n = 274) or UM (n = 155) in SH exhibited markedly reduced expression. Interestingly, the gbM > UM group showed lower expression even in FB (Fig. 5c) and had relatively low CG methylation compared to the gbM > gbM group (Fig. 5d), suggesting they were weakly methylated gbM genes. In SH, these genes were completely unmethylated and transcriptionally silenced. FB teM genes were generally transcriptionally repressed (Fig. 4d), and this pattern held true for the teM > teM group (n = 4,419), which exhibited high methylation across all contexts (Fig. 5d). In contrast, teM > UM genes (n = 567) displayed a slight increase in expression in SH. These genes showed lower methylation levels in FB relative to the conserved teM > teM group, possibly reflecting a transition state toward demethylation. The teM > gbM group (n = 413) displayed moderate expression in FB and higher expression in SH. In FB, these genes already had high CG methylation and lower CHG methylation, suggesting they may have been in transition from teM to gbM. FB UM genes were generally lowly expressed and hypomethylated (Fig. 5c, d). The UM > gbM group showed a mild increase in expression and CG methylation in SH, though their expression remained lower than that of other gbM groups. Conversely, UM > teM genes showed increased methylation but remained relatively lowly expressed in SH, resembling the methylation profiles of teM > UM genes.
In addition to the three major methylation classes, we also examined the genes categorized as unclassified, which accounted for 33% and 35% of the total genes in FB and SH, respectively (Fig. 4c, Supplementary Fig. S3). Despite being excluded from the gbM, teM and UM groups, these genes displayed weak but discernible CG methylation patterns resembling gbM-type features. Among FB unclassified genes, the majority remained unclassified in SH (uncl > uncl), exhibiting moderate expression and intermediate mCG levels, but nearly absent mCHG and mCHH methylation (Supplementary Fig. S3a, S3b). These patterns suggest that they represent weakly methylated gbM genes falling below the threshold for gbM classification. When examining the unclassified genes that transitioned to other categories, the most frequent shift was from unclassified to UM, followed by transitions to gbM and teM (Supplementary Fig. S3b). This trend suggests that most transitions within the unclassified group involve either a loss of mCG methylation leading to UM status or a gain of mCG methylation resulting in gbM classification. Overall, the unclassified group appears to represent an intermediate or unstable gbM population undergoing dynamic methylation turnover.
Taken together, these results reveal that DNA methylation class transitions are accompanied by concordant changes in gene expression. gbM genes are typically stably maintained and associated with moderate to high expression. In contrast, teM genes exhibit more variable transitions and are consistently associated with transcriptional repression. UM genes are transcriptionally silent unless they acquire gbM marks, in which case expression is only modestly restored. These findings highlight a conserved epigenetic hierarchy of gene regulation, in which gbM supports expression stability, teM is associated with repression, and UM represents an unmarked, typically inactive state.
Subgenome-level comparison of DNA methylation and gene expression patterns
-
To examine subgenome-specific DNA methylation variation in octoploid strawberries, we profiled methylation levels across the four subgenomes (A, B, C, and D) in FB and SH (Fig. 6). DNA methylation levels displayed the typical hierarchy, with mCG being the most abundant, followed by mCHG and then mCHH, across all genomic features, including genes, exons, CDS, introns, TEs, and repeats (Fig. 6a). TE- and repeat-rich regions were consistently hypermethylated, while gene-associated features were hypomethylated across subgenomes. Among these, subgenome A exhibited slightly lower mCG and mCHG levels across most features in both cultivars, suggesting the presence of subgenome-specific methylation regulation.
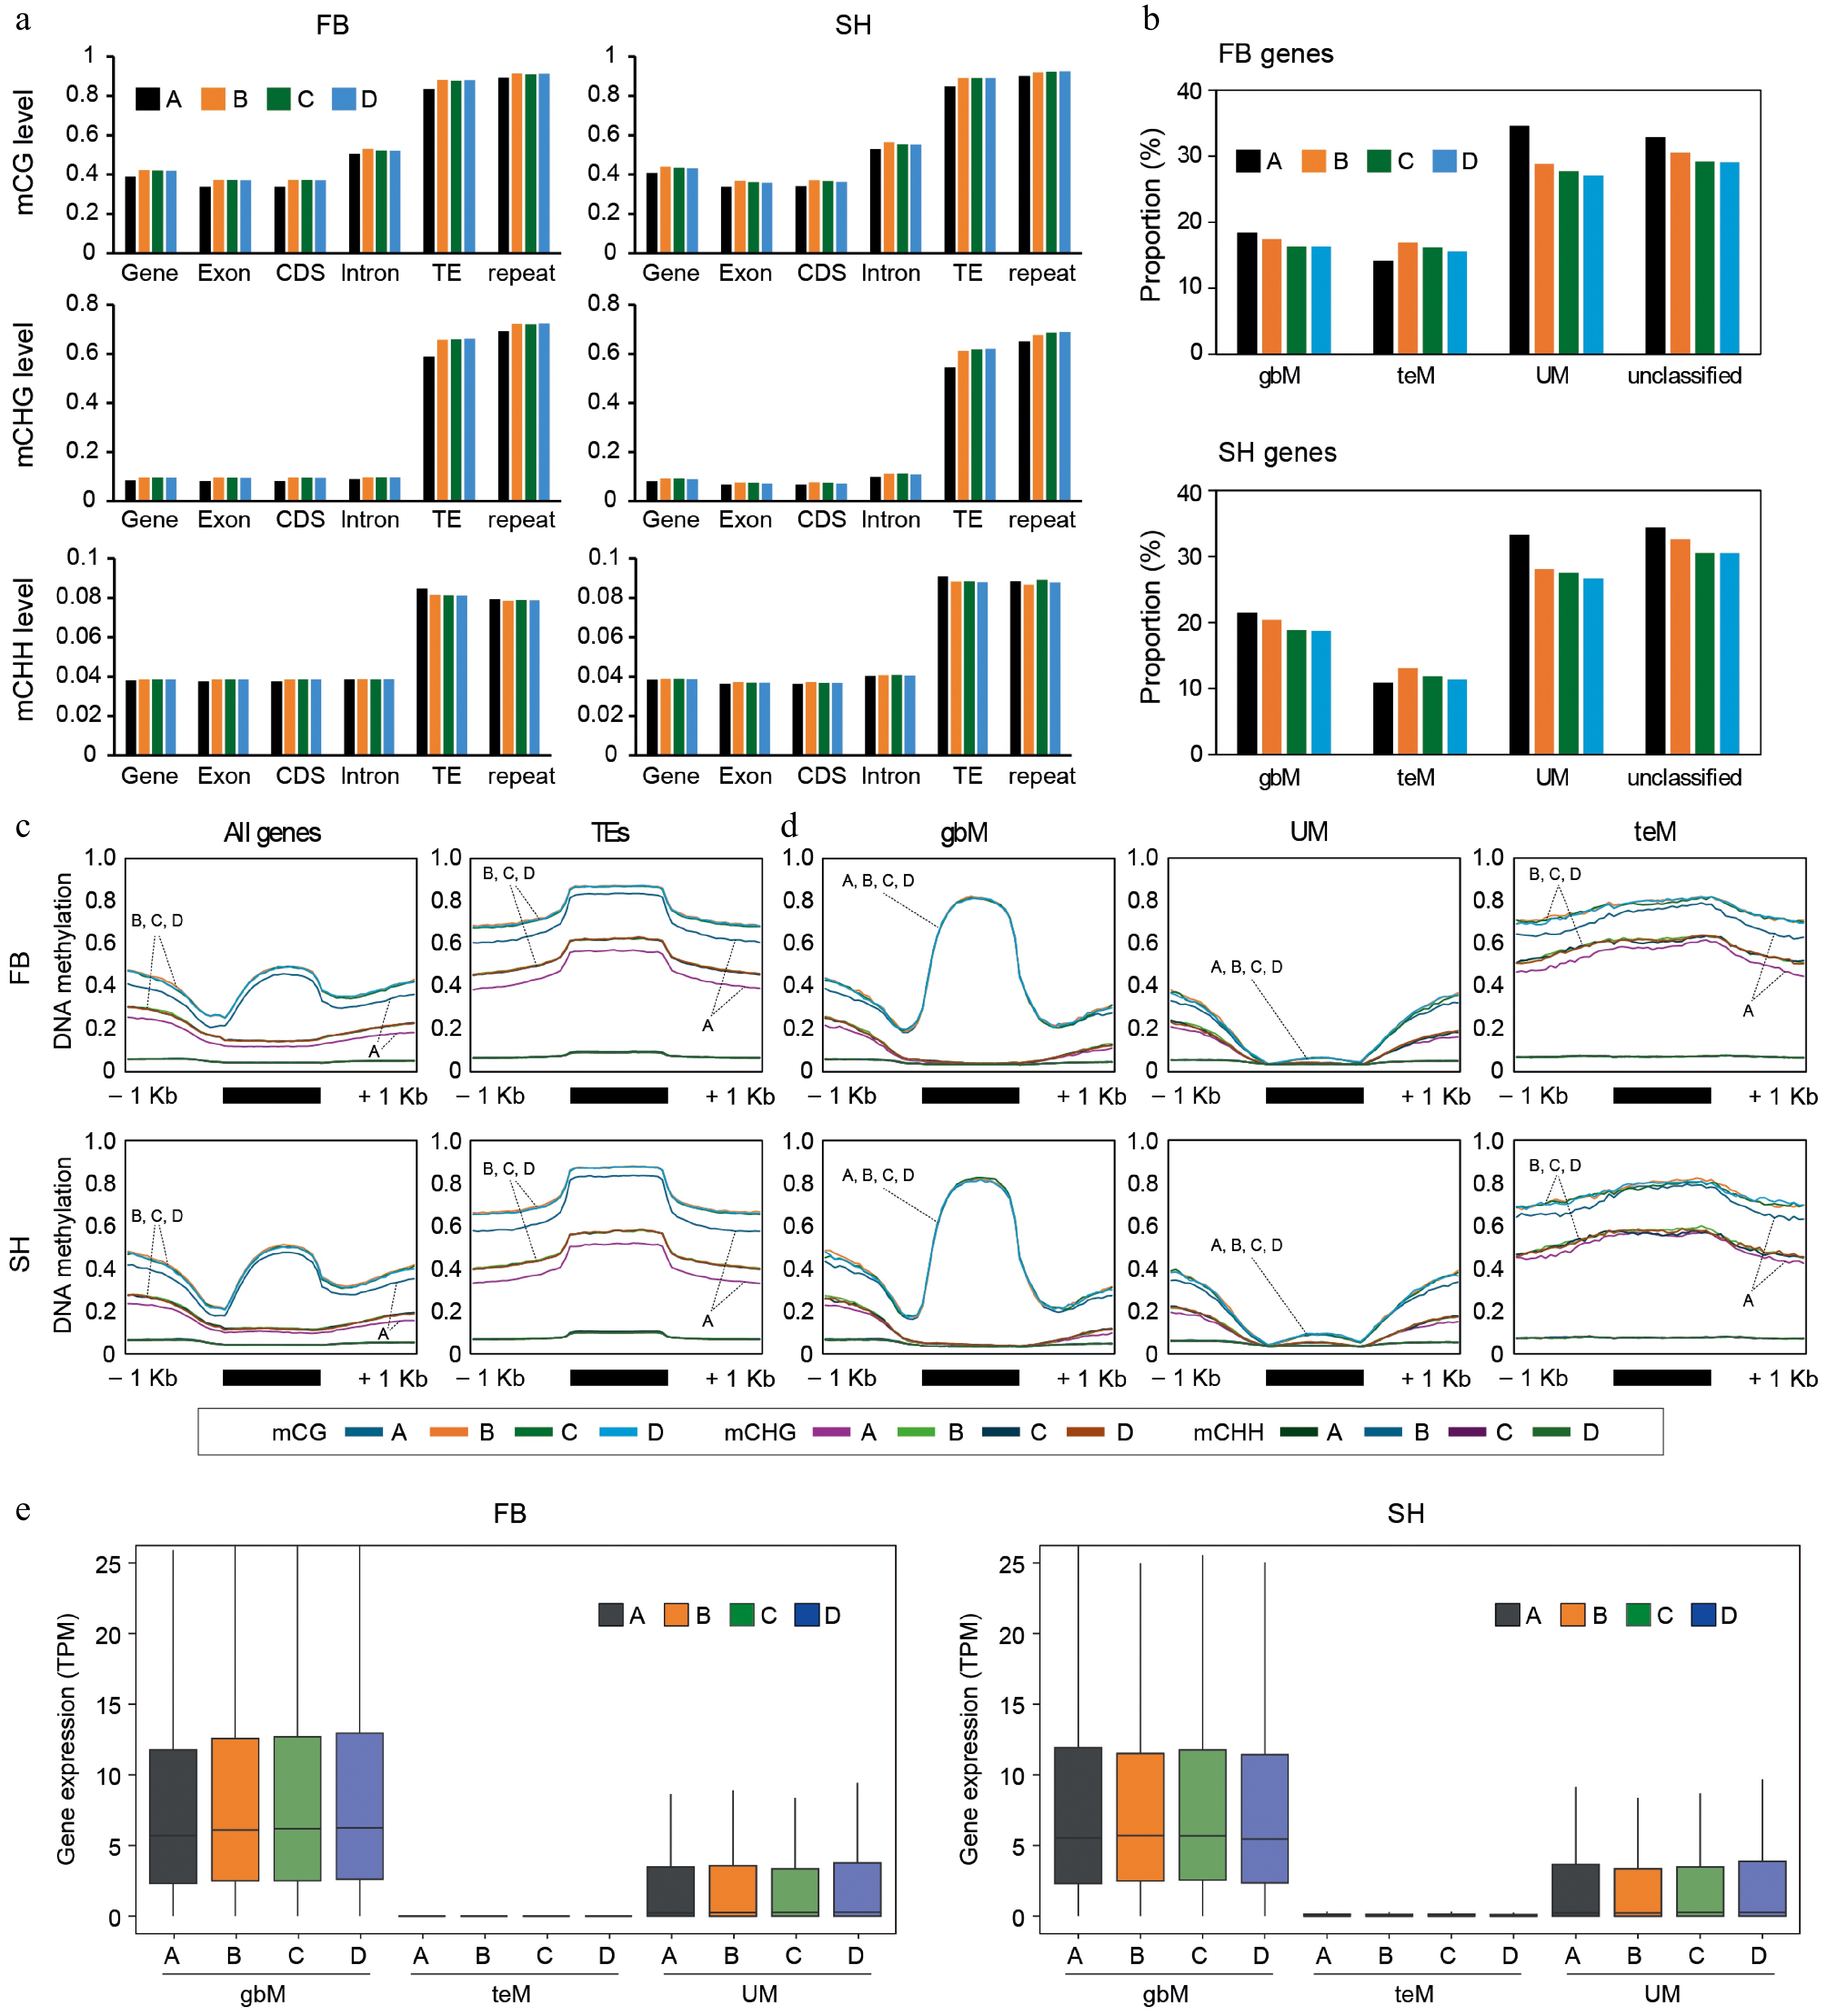
Figure 6.
DNA methylation and gene expression profiles across subgenomes in octoploid strawberry cultivars. (a) DNA methylation levels (mCG, mCHG, mCHH) across genomic features, including genes, exons, CDS, introns, TEs, and repeats, were analyzed for each subgenome (A, B, C, D). (b) Proportion of gene groups (gbM, UM, teM, and unclassified) for each subgenome in FB and SH. Subgenome-specific proportions revealed subtle differences between the cultivars. (c) Metaplots showing DNA methylation patterns across genes and TEs for each subgenome. (d) DNA methylation metaplots for gbM, UM, and teM genes across subgenomes. (e) Gene expression levels of gbM, UM, and teM genes were compared across subgenomes.
We next assessed whether methylation-based gene classification varied by subgenome. Subgenome-level comparisons revealed subtle differences in the proportion of gbM, teM, UM, and unclassified genes (Fig. 6b). In both cultivars, subgenome A showed a higher proportion of UM genes and a lower proportion of teM genes compared to the others. Building on our previous findings (Supplementary Fig. S2a-S2b), which demonstrated a strong positive correlation between TE density and the proportion of teM genes in octoploid and diploid strawberries as well as Arabidopsis thaliana, we next investigated whether this relationship also holds at the subgenome level within octoploid strawberry. Subgenome-specific analysis revealed that subgenome A, which consistently showed the lowest teM gene proportion in both FB and SH, also exhibited the lowest TE density (Supplementary Fig. S2c). A strong positive correlation was observed between the teM gene proportion and TE density across subgenomes in both cultivars (R2 = 0.9612), further reinforcing the link between TE abundance and the establishment of teM patterns. (Supplementary Fig. S2d). These results suggest that local TE density is a major determinant of teM gene prevalence within the octoploid genome.
Metaplot analyses confirmed subgenome-specific DNA methylation differences in both cultivars. In particular, subgenome A consistently exhibited reduced levels of both mCG and mCHG methylation compared to subgenomes B, C, and D, across gene bodies and TEs (Fig. 6c). To determine which gene categories are primarily affected by this hypomethylation, we further analyzed subgenome-specific methylation within the gbM, UM, and teM gene groups. (Fig. 6d). While gbM and UM genes displayed similar methylation profiles across all subgenomes, teM genes showed notably reduced mCG and mCHG levels specifically in subgenome A. This pattern likely reflects the overall hypomethylation of TEs observed in subgenome A (Fig. 6c), suggesting that TE-associated methylation is particularly reduced in this subgenome. Finally, gene expression levels across methylation categories and subgenomes were assessed (Fig. 6e). In both cultivars, gbM genes exhibited the highest expression regardless of subgenome, while teM genes were strongly repressed. UM genes displayed intermediate expression levels. These trends were consistent across all subgenomes, reinforcing the conserved functional relationship between gene body methylation and transcriptional activity.
To further assess whether subgenome-specific TE hypomethylation affects nearby gene expression, we categorized all annotated genes into two groups: those overlapped with TEs and those that were not. In total, 38,057 TE-overlapping genes in FB and 33,916 genes in SH were identified (Supplementary Table S7) and compared to the remaining non-overlapping genes. We then evaluated gene expression and methylation levels separately across subgenomes (Fig. 7). Notably, in both cultivars, only subgenome A showed significantly elevated expression of TE-overlapping genes relative to the same group in subgenomes B–D (Wilcoxon test, p < 0.001). This elevated expression coincided with significantly lower CG and CHG methylation levels in subgenome A, consistent with the genome-wide methylation patterns previously observed. In contrast, for the 'other' non-TE-overlapping gene group, no significant expression or methylation differences were detected across subgenomes. These results suggest that the uniquely low TE methylation in subgenome A facilitates increased expression of nearby genes, providing direct evidence that subgenome-specific methylation states can exert functional regulatory influence.
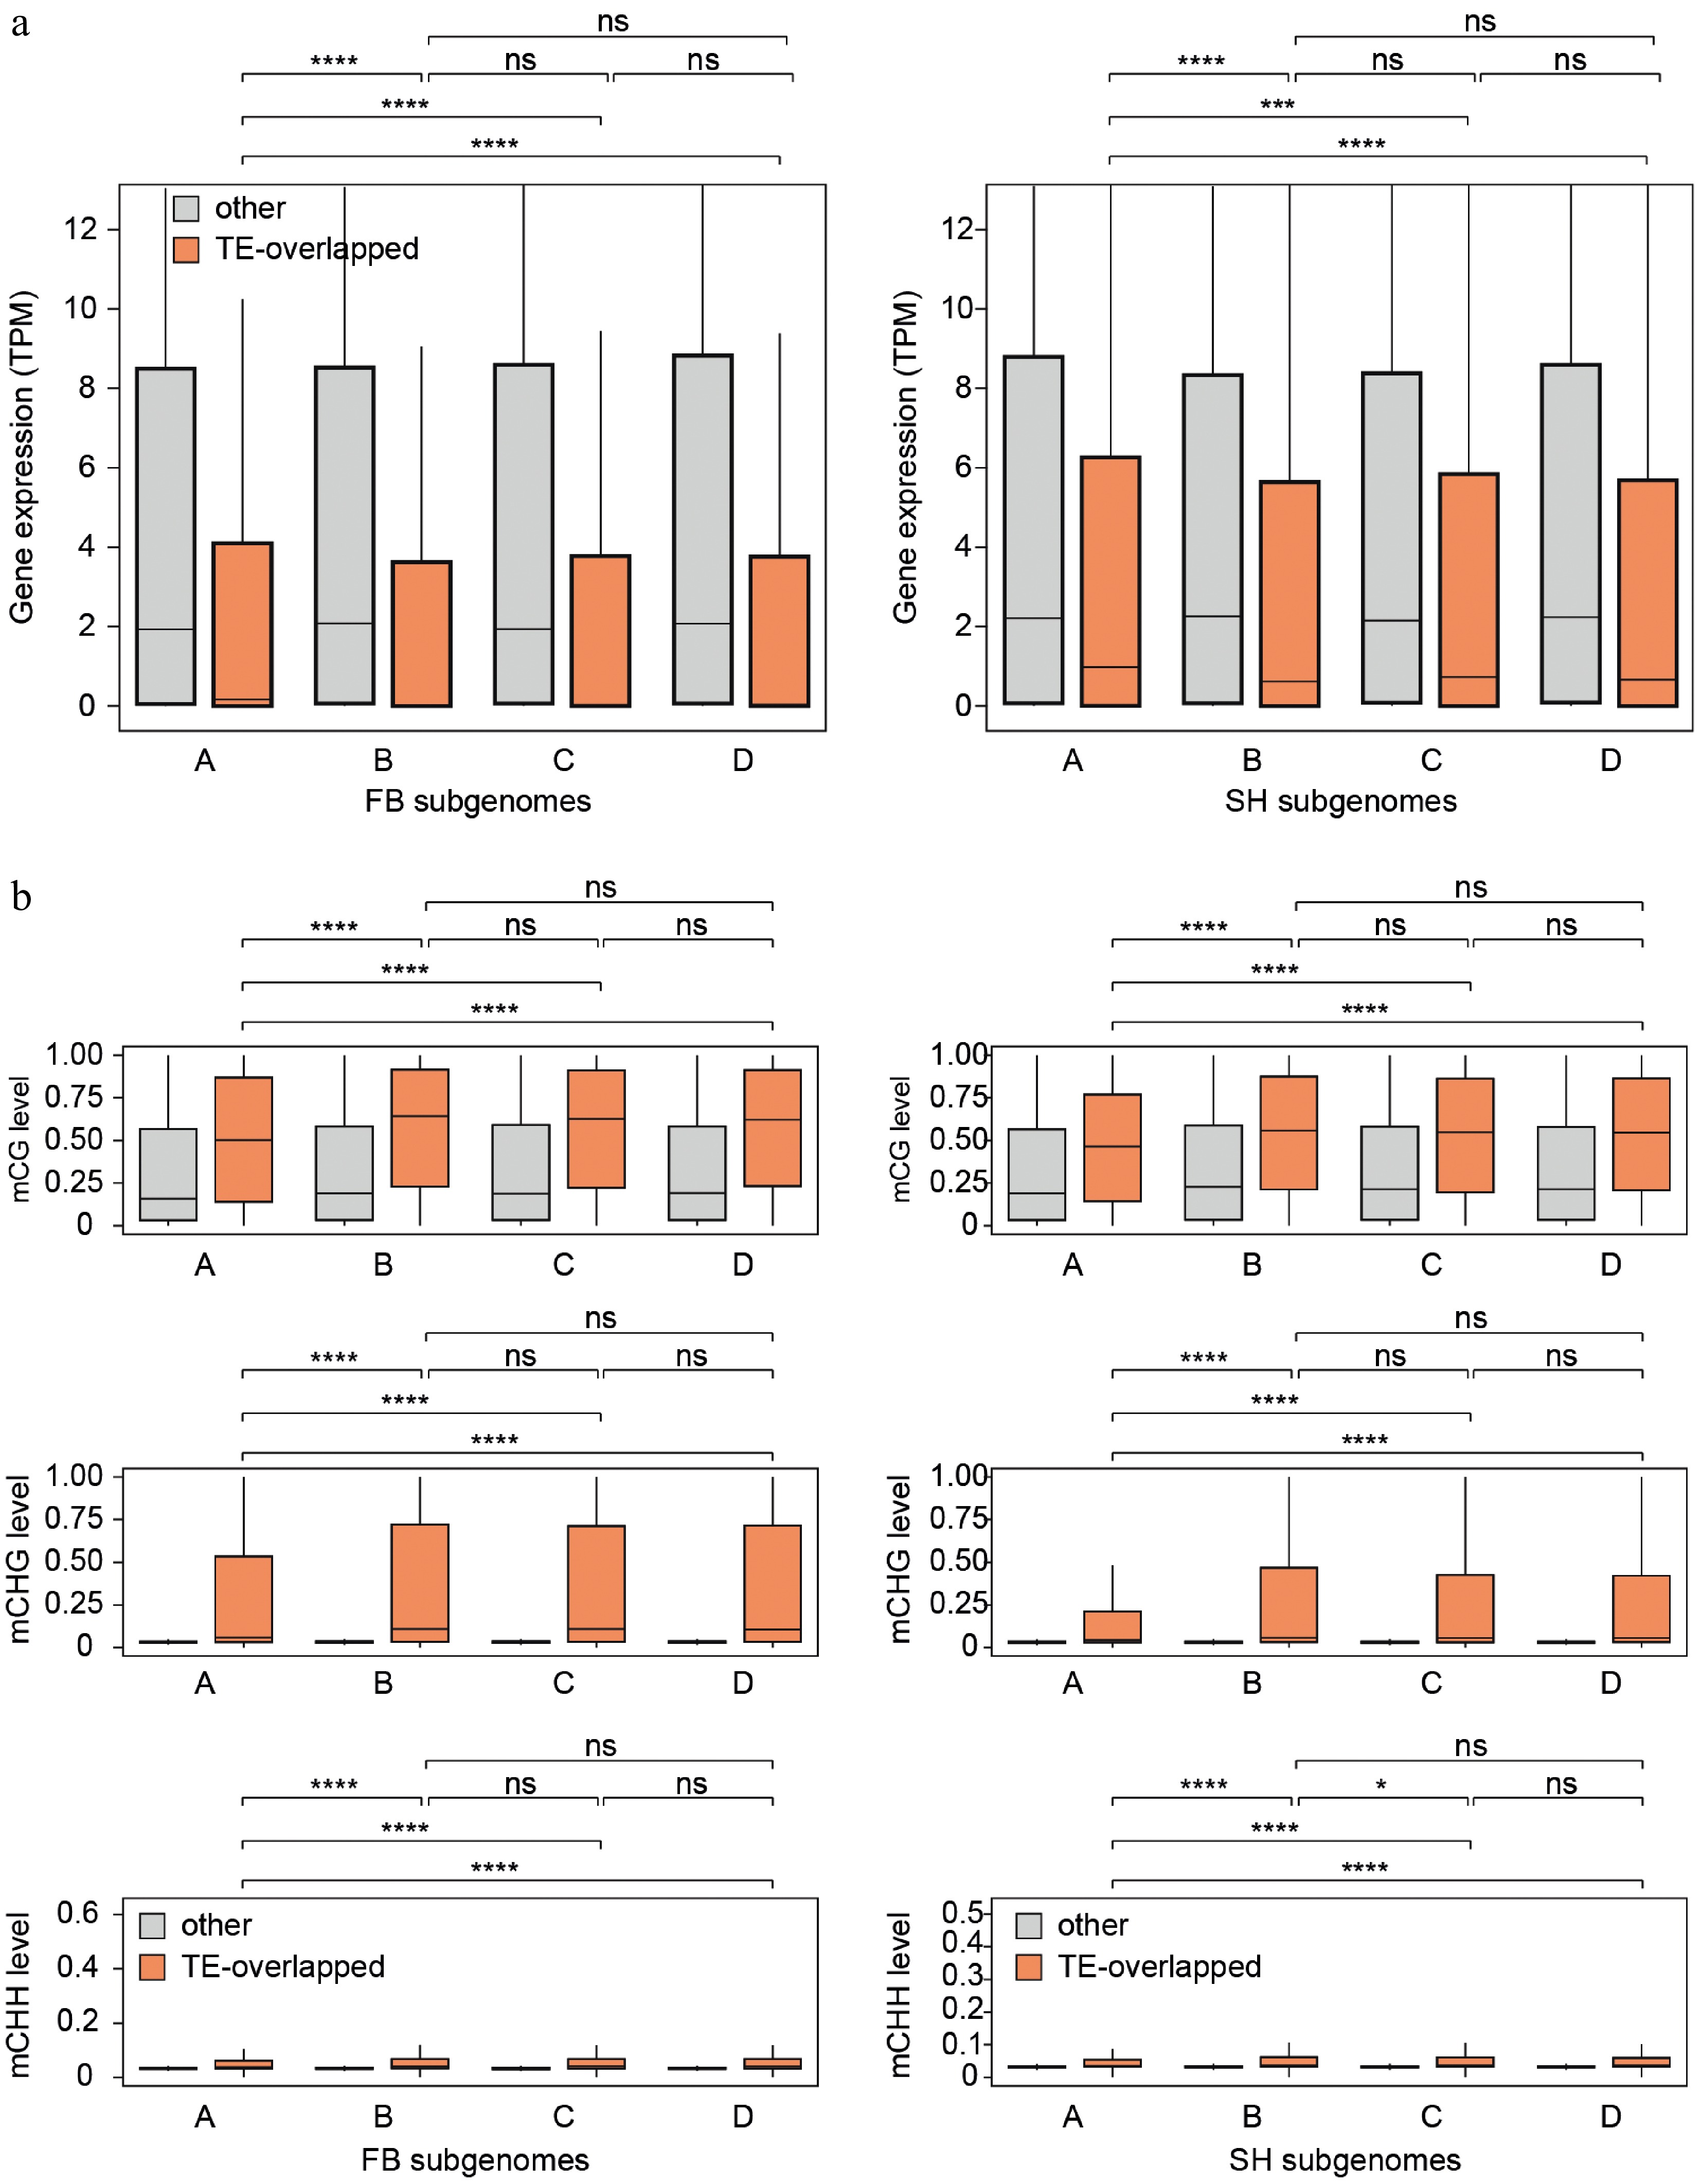
Figure 7.
Differences in gene expression and DNA methylation between TE-overlapping and non-overlapping genes across subgenomes. (a) Boxplots showing gene expression levels (TPM) of TE-overlapping genes (orange) and non-overlapping genes (gray) in each subgenome (A–D) for FB (left) and SH (right). (b) Boxplots of CG, CHG, and CHH methylation levels at gene bodies for TE-overlapping and non-overlapping genes across subgenomes in both cultivars. Notably, only subgenome A exhibited significantly higher gene expression and lower DNA methylation levels in TE-overlapping genes compared to subgenomes B–D. Statistical comparisons were performed using the Wilcoxon test. * p ≤ 0.05, ** p ≤ 0.01, *** p ≤ 0.001, **** p ≤ 0.0001, ns = not significant.
Together, these findings reveal that although DNA methylation architecture is broadly conserved across subgenomes, subgenome A is characterized by consistently reduced mCG and mCHG levels. This hypomethylation, particularly pronounced in TE-associated regions and teM-classified genes, coincides with a lower TE density and teM gene proportion. Moreover, genes overlapping with TEs in subgenome A exhibit higher expression than their counterparts in other subgenomes, supporting a functional link between localized hypomethylation and gene regulation. These patterns suggest that local transposon abundance and methylation dynamics jointly shape subgenome-specific expression profiles, highlighting the possible contribution of epigenetic regulation to subgenome divergence in polyploid strawberry.
-
In this study, we explored the epigenetic landscape of two octoploid strawberry cultivars, FB and SH, based on gene body DNA methylation patterns in leaf tissue and their associations with TEs and gene expression. These cultivars differ not only in geographic origin but also in fruit-related traits such as firmness and sweetness, which may involve epigenetic regulation. Although our analysis focused on leaf samples, the data provide a useful baseline for interpreting cultivar-specific methylation patterns and for future comparisons with fruit tissues. Notably, SH exhibited lower mCHG levels in TEs and teM genes than FB, despite higher CMT3 expression (Figs. 3c, 4b, Supplementary Fig. S1). Given that CMT3 is required for CHG maintenance through its interaction with SUVH histone methyltransferases in the CMT3–H3K9me2 feedback loop in Arabidopsis[51,52], the lower mCHG levels observed in SH likely reflect multiple convergent factors. As shown in Supplementary Fig. S2a, SH has a lower TE density than FB, which would reduce the abundance of heterochromatic regions marked by H3K9me2. Because CMT3 depends on H3K9me2-marked chromatin as its substrate[51,52], this reduction could limit the genomic regions available for CHG methylation, even when CMT3 transcript levels are elevated. In addition, the reduced expression of RdDM components such as AGO4 and CLSY1/2 (Supplementary Fig. S1) may weaken siRNA-mediated reinforcement of methylation at TE loci. Conversely, SH showed markedly higher expression of the DNA demethylase ROS1a, which is known to antagonize RdDM and actively remove DNA methylation, particularly near gene-proximal TEs[50,53]. Collectively, these observations suggest that the combination of reduced TE density, weakened RdDM activity, and enhanced ROS1a-mediated demethylation may together contribute to SH-specific lower mCHG levels in TEs, despite the higher transcriptional level of CMT3. Although the roles of H3K9me2-mediated chromatin organization and siRNA-dependent RdDM reinforcement were not directly assessed in this study, they represent plausible alternative explanations for the cultivar-specific mCHG differences in strawberries.
To further interpret these methylation changes, we categorized genes in the octoploid strawberry into three DNA methylation classes—gbM, teM, and UM (Fig. 4). The consistent relationship between DNA methylation classes and gene expression across species supports the evolutionary conservation of functional roles among gbM, teM, and UM gene categories. This implies that epigenetic mechanisms regulating transcription have been maintained despite differences in genome structure and ploidy. Although this study focused on gene body methylation in leaf tissue, extending the analysis to fruit and other organs could uncover additional layers of epigenetic regulation, particularly those tied to tissue-specific functions. Given that gbM genes are generally stably expressed across tissues, whereas teM and UM genes may display more variable or restricted expression[20,21,24,25], examining their methylation and transcriptional dynamics across developmental stages and tissue types would be especially informative. Identifying genes that undergo methylation and expression shifts across organs could provide critical insight into context-dependent regulation and may offer novel targets for trait-specific breeding.
Building on this, our analysis of orthologous genes between FB and SH revealed that while gbM and UM classifications were largely conserved, teM genes frequently transitioned to other categories (Fig. 5). The teM orthologs that shifted to gbM or UM categories showed lower DNA methylation and moderately elevated expression levels compared to teM genes that remained stably classified as teM in both cultivars. These transitioning genes may represent a transitional epigenetic state, neither fully silenced nor fully active, suggesting they are poised for context-dependent activation and may play roles in tissue-specific regulation. teM genes may play a role in tissue-specific control. Supporting this possibility, similar behavior has been observed in maize, where a subset of teM genes is strongly repressed in vegetative tissues but becomes transcriptionally activated in the male gametophyte[26]. Such patterns imply that teM genes are not permanently silent but may serve regulatory roles in specific developmental contexts. Methylation state transitions, therefore, could provide a flexible mechanism by which gene expression is fine-tuned across tissues or environmental conditions.
Expanding beyond cultivar comparisons, we also observed a positive correlation between TE density and the proportion of teM-classified genes at the species level (Supplementary Fig. S2). This relationship suggests that as genomes accumulate more TEs, these elements are more likely to insert near or within genes, promoting the spread of heterochromatin and DNA methylation into genic regions. Consequently, genomes with higher TE content, such as octoploid strawberry tend to experience a greater epigenetic burden, reflected in increased teM ratios and elevated mCHG levels. This concept is supported by comparative studies showing that global DNA methylation levels scale with genome size and TE load[54]. Within our study, the slightly higher TE content observed in FB compared to SH may help explain the modest increase in teM gene frequency and mCHG levels. Similarly, in tea plant (Camellia sinensis), a relatively recent TE burst has been associated with elevated CHG methylation and increased TE-related genic methylation[55], suggesting that a comparable event may have occurred more recently in FB.
At the subgenome level, DNA methylation analysis provided further insight into the phenomenon of subgenome dominance commonly observed in polyploid species such as strawberry[28]. Subgenome A, derived from Fragaria vesca, consistently exhibited lower DNA methylation levels compared to the other subgenomes, in agreement with previous methylome data from the cultivar 'Benihoppe'[28]. Subgenome dominance refers to the preferential retention and higher expression of genes from one ancestral genome, while the other subgenomes often undergo gene loss or transcriptional silencing. In line with this definition, subgenome A in our study displayed the lowest TE density, mCG and mCHG levels in TEs, as well as the lowest proportion of teM-classified genes, relative to subgenomes B, C, and D (Fig. 6, Supplementary Fig. S2c). This reduced TE burden and lower DNA methylation may create a more open chromatin environment, providing a transcriptional advantage to subgenome A. The lower TE abundance in subgenome A would result in fewer H3K9me2-marked heterochromatic regions, thereby limiting the genomic sites available for CMT3/SUVH- and MET1-mediated methylation maintenance. Supporting this interpretation, chromatin accessibility profiling has shown that subgenome A harbors a greater number of accessible chromatin regions than the other subgenomes, thereby facilitating transcription factor binding and gene activation[27]. Consistently, we observed that TE-overlapping genes were more highly expressed specifically in subgenome A (Fig. 7a), suggesting that subgenome-specific hypomethylation of TEs can directly enhance the expression potential of nearby genes. This observation also aligns with previous reports showing that homeologs in subgenome A are preferentially expressed in metabolic pathways involved in fruit development, including those related to flavor, color, and aroma[2]. Given this transcriptional advantage, genes located in subgenome A may have a greater impact on phenotypic differences between cultivars, including traits such as fruit firmness and sweetness, as well as other morphological features. For future study, it would be interesting to investigate whether subgenome-specific chromatin states and histone modifications could directly influence methyltransferase recruitment or activity in octoploid strawberry. The long-read methylome profiling could also dissect the mechanisms involved in the hypomethylation characteristics of subgenome A and its potential role in subgenome dominance. Altogether, these findings further support the idea that the epigenetic landscape of subgenome A underlies its dominant transcriptional role in octoploid strawberry.
While our data illuminated cultivar- and subgenome-specific methylation patterns, several open questions remain. First, generating a tissue-resolved atlas of methylomes and transcriptomes from fruit, flower, and root would clarify whether teM dynamics and subgenome A hypomethylation vary across developmental stages. Second, the causal relationship between DNA methylation machinery and the mCHG landscape could be tested by using CRISPR/Cas9 to knock out or overexpress CMT3, ROS1a, and CLSY chromatin remodelers in stable strawberry transformants. These experiments would help determine whether manipulating enzyme dosage can recapitulate the cultivar-specific methylation differences observed in this study. Third, profiling 24-nucleotide small RNAs in both cultivars would reveal whether the apparent attenuation of RdDM in SH is associated with reduced siRNA abundance at particular TE families. This analysis could also determine whether the subgenome A-specific hypomethylation correlates with subgenome-specific differences in small RNA abundance. Finally, a systematic search for hypomethylated, TE-proximal genes that influence fruit flavor, disease resistance, and other agronomic traits could identify promising targets for precise epigenome editing and enable the rational improvement of strawberry cultivars. Collectively, these future directions will clarify how DNA methylation pathways operate in a polyploid context, and provide a foundation for leveraging epigenomic variation in crop improvement.
-
Our comprehensive comparison of the DNA methylomes of two octoploid strawberry cultivars, FB and SH, revealed both conserved and cultivar-specific epigenetic patterns. While global methylation landscapes were broadly similar, SH exhibited reduced mCHG methylation, particularly in TEs and teM-classified genes, likely resulting from a combination of reduced RdDM activity and elevated ROS1a expression. Gene-level methylation classification uncovered conserved functional associations and species-specific differences, with teM genes showing greater epigenetic plasticity and a stronger correlation with local TE density. Furthermore, subgenome-level analyses demonstrated that subgenome A is distinguished by reduced TE abundance, a lower proportion of teM-classified genes, and reduced mCG and mCHG levels in TEs, which may contribute to its enhanced transcriptional activity and subgenome dominance. Notably, TE-overlapping genes in subgenome A exhibited higher expression compared to those in other subgenomes, likely due to reduced local methylation, reinforcing the idea that epigenetic landscapes contribute to differential subgenome regulation in polyploid strawberry. Building on these findings, stable methylation patterns that influence gene expression can serve as valuable epigenetic markers for predicting gene expression and phenotypic variation in strawberry breeding. Moreover, the ability to modify these methylation states through targeted epigenome editing, such as dCas9–methyltransferase systems, offers new possibilities for precise regulation of desirable traits. In particular, the epigenetic flexibility of teM genes and the naturally hypomethylated subgenome A may provide promising targets for improving fruit quality and disease resistance. Together, these findings provide a baseline methylome profile of octoploid strawberries and open new avenues for integrating epigenetic regulation into future breeding strategies.
-
Not applicable.
-
The authors confirm their contributions to the paper as follows: study conception and design: Jang H, Oh Y, Kim DS, Lee S; data collection: Han K, Oh Y; analysis and interpretation of results: Jang H, Han H, Lee S; draft manuscript preparation: Jang H, Lee S. All authors reviewed the results and approved the final version of the manuscript.
-
WGBS and RNA-seq data produced in this study is available in the NCBI GEO database under GSE297355. All data generated or analyzed during this study is included in this published article.
-
This work is supported by the Plant Health and Production and Plant Products: Plant Breeding for Agricultural Production (Project No. 2024-67013-42583), and Specialty Crops Research Initiative (SCRI) award no. 2022–51181-38328 from the U.S. Department of Agriculture's National Institute of Food and Agriculture. Additional support was provided by the National Institute of Horticultural and Herbal Science, Rural Development Administration, Republic of Korea (Project No. PJ017707), and the 2025 RDA Fellowship Program of the National Institute of Horticultural and Herbal Science, Rural Development Administration, Republic of Korea. This work was also supported by the National Research Foundation of Korea (NRF) grant funded by the Korea government (MSIT) (RS-2024-00355164).
-
The authors declare that they have no conflict of interest.
- Supplementary Table S1 Mapping statistics of whole genome bisulfite sequencing data.
- Supplementary Table S2 Number of predicted biological effects associated with SNPs by genomic region and type.
- Supplementary Table S3 Number of predicted biological effects associated with SNPs by impact.
- Supplementary Table S4 Genes with SNP effects classified by predicted impact.
- Supplementary Table S5 Gene classification by DNA methylation profiles.
- Supplementary Table S6 One-to-one orthologous genes and their gene body methylation status between 'Florida Brilliance' and 'Seolhyang' cultivars.
- Supplementary Table S7 TE-overlapping genes in 'Florida Brilliance' and 'Seolhyang'
- Supplementary Fig. S1 Expression of DNA methylation-related genes in FB and SH.
- Supplementary Fig. S2 Relationship between TE density and the proportion of teM genes.
- Supplementary Fig. S3 Conservation and dynamics of gene expression and DNA.
- Copyright: © 2026 by the author(s). Published by Maximum Academic Press, Fayetteville, GA. This article is an open access article distributed under Creative Commons Attribution License (CC BY 4.0), visit https://creativecommons.org/licenses/by/4.0/.
-
About this article
Cite this article
Jang H, Han H, Oh Y, Han K, Kim DS, et al. 2026. Genome-wide DNA methylation profiling of the octoploid strawberry (Fragaria × ananassa). Epigenetics Insights 19: e005 doi: 10.48130/epi-0026-0002 

Genome-wide DNA methylation profiling of the octoploid strawberry (Fragaria × ananassa)
- Received: 30 August 2025
- Revised: 28 November 2025
- Accepted: 19 January 2026
- Published online: 30 March 2026
Abstract: Cultivated strawberry (Fragaria × ananassa) is an economically important fruit crop with a complex octoploid genome, which has historically limited genomic and epigenomic analyses. Recent advances in long-read sequencing technologies have enabled the assembly of high-quality telomere-to-telomere reference genomes, opening new opportunities for studying epigenetic regulation in this polyploid species. DNA methylation, a heritable epigenetic modification, regulates gene expression and maintains genome stability. In plants, DNA methylation plays crucial roles in seed development, fruit ripening, stress responses, and genome evolution. In this study, whole-genome DNA methylation profiles were generated for two genetically distinct octoploid strawberry cultivars, 'Florida Brilliance', and 'Seolhyang'. Genome-wide analyses showed that while overall methylation patterns were largely conserved, 'Seolhyang' had reduced CHG methylation, especially in transposable elements and certain genes. Genes were grouped into three categories based on genebody methylation: CG genebody methylated, transposon-like methylated, and unmethylated. Notably, the frequency of transposon-like methylated genes was positively correlated with local transposable element density. These categories exhibited distinct expression patterns and varied across subgenomes. Subgenome-level analyses revealed that subgenome A across all seven chromosome sets had the lowest DNA methylation levels and the fewest transposable elements, which may contribute to its dominant gene expression among the subgenomes. Additionally, genes overlapping with transposable elements in subgenome A showed higher expression, indicating that reduced local methylation may promote transcription. This study presents a comprehensive DNA methylation analysis of two genetically and geographically distinct strawberry cultivars and provides new insights into the role of epigenetic regulation in polyploid crops.
-
Key words:
- Octoploid strawberry /
- DNA methylation /
- Subgenome dominance /
- Epigenetics