


-
Sugars, including monosaccharides, sucrose, and polyols, serve as fundamental metabolic precursors for carbohydrate synthesis, energy substrates, cellular osmolytes, and signaling molecules that regulate developmental processes and stress responses in plants[1−4]. Functioning as central metabolic hubs, sugars integrate diverse biochemical pathways encompassing carbon metabolism, lipid metabolism, protein turnover, secondary metabolite biosynthesis, and nucleotide metabolism, thereby playing essential roles in plant growth and development. These compounds are primarily synthesized in source organs (e.g., leaves) and subsequently translocated through the phloem to sink tissues (e.g., seeds, fruits) via either symplastic (plasmodesmata) or apoplastic (transmembrane) pathways, with the latter requiring specialized sugar transporters[5,6]. The source-to-sink sugar flux is mediated by two major transporter families: monosaccharide transporters (MSTs) and sucrose transporters (SUTs)[7,8]. Following apoplastic sucrose hydrolysis, the resulting hexoses are imported into sink cells by sugar transporter proteins (STPs) and hexose transporters (HTs)[9,10]. STPs, belonging to the MST superfamily, function as H+-coupled symporters typically containing 12 transmembrane domains that facilitate the transport of various monosaccharides, including fructose, glucose, galactose, mannose, and xylose across plasma membranes[11,12]. Since the initial cloning of an STP gene from Chlorella in 1989[13], genome sequencing has enabled the identification of STP gene families in numerous plant species, revealing both conserved features and species-specific adaptations in their expression patterns and substrate specificities[14−17]. For instance, while most STPs exhibit broad substrate ranges, certain isoforms like cassava MeSTP4 and MeSTP10 demonstrate exclusive specificity for maltose transport[18,19]. Tissue-specific expression patterns are particularly evident in Arabidopsis, where AtSTP1 shows ubiquitous expression[20], AtSTP4 localizes to root tips and pollen[21], and AtSTP2/6/9/11 display pollen-specific expression. Similarly, rice OsMST3 is uniquely expressed in root xylem, where it contributes monosaccharides for secondary cell wall biosynthesis[22]. These findings collectively highlight the functional diversification of STP family members in mediating spatial and temporal regulation of sugar allocation, with important implications for understanding carbon partitioning and sink strength modulation in plants.
Sugars constitute the fundamental carbon skeletons for plant metabolic processes and biomass accumulation. Under escalating environmental stresses, plants encounter substantial energetic challenges in maintaining homeostasis, necessitating a delicate trade-off between growth-related energy expenditure and stress adaptation mechanisms. Phytohormones, as master regulators of plant growth, development, and stress responses, play pivotal roles in modulating sugar metabolism under adverse conditions. The sugar transporter protein (STP) family, as crucial facilitators of monosaccharide transport, exhibits hormone-responsive regulation patterns. For instance, STP1 demonstrates significant induction upon treatment with defense-related phytohormones including salicylic acid (SA) and methyl jasmonate (MeJA)[23]. Comprehensive studies in pepper (Capsicum annuum L.) reveal tissue-specific regulatory patterns: six-hour treatments with abscisic acid (ABA), indole-3-acetic acid (IAA), and gibberellins (GA) upregulate CaSTP5/6/9/10/17 expression in root tissues, while foliar responses show contrasting regulation - with CaSTP6 being significantly induced by ABA and IAA, whereas CaSTP5/8/9/10 are markedly suppressed[24]. These findings underscore the potential involvement of STP-mediated sugar transport in plant adaptive responses to environmental perturbations, highlighting their importance in stress-responsive metabolic reprogramming.
Sugars represent critical determinants of fruit quality in apples, with their accumulation being regulated through a coordinated series of physiological processes, including photosynthetic carbon fixation in source leaves, phloem-mediated translocation, apoplastic/symplastic transport within fruit tissues, and vacuolar sequestration[25]. As such, sugar transporter proteins (STPs) serve as pivotal regulators governing fruit sugar accumulation dynamics. The present investigation employs integrated bioinformatics approaches coupled with qRT-PCR-based hormone induction assays to systematically characterize the STP gene family, with a particular focus on gene architecture, subcellular localization, cis-regulatory elements, and spatiotemporal expression profiles. These comprehensive analyses establish a robust molecular foundation for elucidating the functional specialization of STP family members and provide a scientific framework for targeted genetic improvement of fruit quality traits.
-
The experiment was carried out from October 2023 to April 2024, and the test material was tissue-cultured 'gala' apple seedlings. Connect apple single bud stems to MS medium (MS + 30 g·L−1 sucrose + 6 g·L−1 agar + 0.5 mg·L−1 6-BA + 0.05 mg·L−1 NAA, PH adjusted to 5.8−6.0), placed in an artificial climate box (RDN-1000D-4 type) pre-cultured for 40 d (temperature 25 °C, light intensity 8,000 lx, photoperiod 16/8 h), and then choose to grow robust and without contaminated apple tissue culture seedlings are used for treatment. This experiment was treated with 10 mmol·L−1 IAA, 50 mmol·L−1 GA, 50 mmol·L−1 ABA solution stress for 0, 4, 8, 12, and 24 h, and each treatment was repeated three times[26]. A sample of 0.1 g (apple leaves) was collected and weighed, wrapped in tin foil and quickly frozen in liquid nitrogen, and then the total RNA of apple leaves was extracted by the CTAB method[27,28].
Identification of apple STP gene family members
-
Fourteen Arabidopsis STP gene accession numbers were obtained from known literature[12]. Enter the accession number of Arabidopsis STP in NCBI and obtain the CDS sequence and amino acid sequence corresponding to each gene. Enter the obtained CDS fragments into the Rosaceae database GDR (
www.rosaceae.org ) for BLAST alignment, the screening condition E ≤ 1e-10, and perform DNAMAN alignment on the obtained genes to remove redundant sequences. Using the characteristic domain of the STP gene family in the literature (Pfam: PF00083), through SMART (http://smart.embl-heidelberg.de ) and Pfam (http://pfam.sanger.ac.uk ) online software, all predicted proteins are tested for structural integrity, and members that do not contain characteristic domains are removed to obtain apple STP gene family members. In addition, this study identified STP gene family members in sweet orange (Citrus sinensis (L.) Osbeck), tomato (Solanum lycopersicum L.), cassava (Manihot esculenta Crantz), Chinese cabbage (Brassica rapa L.), sorghum (Sorghum bicolor (L.) Moench), and grape (Vitis vinifera L.) to infer the phylogenetic relationships of apple STP gene family members. The HmmerSearch tool was employed to screen their genomes using the PF00083 model, while SMART and Pfam were utilized to validate the candidate genes.Analysis of physicochemical properties, gene structure, motif sequence and subcellular location of STP gene family in apple
-
Through the bioinformatics online software ExPASy (
https://web.expasy.org/protparam ) to analyze the physical and chemical properties of the apple STP family members, such as the number of amino acids, molecular weight, fat index, and hydrophilicity[29]. GSDS (http://gsds.cbi.pku.edu.cn/ ) was used for gene structure analysis[30]. TMHMM Server v. 2.0 (www.cbs.dtu.dk/services/TMHMM ) was used for analyzing protein transmembrane structure. Using the online website MEME (http://meme.nbcr.ne-t/meme/cgi-bin/meme.cgi ) to analyze protein-conserved motifs[31]. Using WoLF PSOT (www.genscript.com/wolf-psort.html ) to analyze the subcellular localization of Apple STP family members.Multiple sequence alignment of apple STP protein and construction and analysis of phylogenetic tree
-
Using ClustalX software to perform multiple sequence alignment of apple STP protein[32]. The phylogenetic tree was constructed using the amino acid sequences of STPs from Arabidopsis, sweet orange, tomato, cassava, Chinese cabbage, sorghum, grape, and apple with the MEGA7.0 software. The neighbor-joining (NJ) method was employed for tree construction, and the Bootstrap value was set to 1,000 to ensure the robustness and reliability of the phylogenetic analysis[33].
Analysis of cis-acting elements and microarray expression profile of STP gene family in apple
-
Search for apple tissue expression data (GSE42873) in the GEO database of NCBI (National Center for Biotechnology Information). The expression data of apple STP is obtained according to its gene accession number[34]; tissue types include different organs of apples, such as flowers and fruits, leaves, roots, stems, seeds and seedlings, etc. Use Excel software to convert the log2 transform of the obtained data, and finally, use the heat map creation tool HemI (
www.hemi.biocuckoo.org ) to complete the visual analysis of the expression of the STP gene chip.First, obtain the gene sequence 2,000 bp upstream of the apple STP promoter in the Rosaceae database, and then submit the obtained sequence to the PlantCARE website (
http://bioinformatics.psb.ugent.be/webtools/plantcare/html ) for analysis and activation The cis-acting element of the subregion.Transcriptional regulation analysis of the STP gene family members in apple
-
Extract the upstream 2,000 bp regulatory region sequences of the apple STP gene family members and use PlantTFDB (
https://planttfdb.gao-lab.org ) to predict their transcription factor binding sites. Use Cytoscape (3.10.0) to construct the transcription regulatory network. Employ PlantTFDB to predict the DNA-binding domains of transcription factors and use JASPAR (https://jaspar.elixir.no/inference ) to predict transcription factor binding sites on the DNA sequences. Utilize the AlphaFold 3 to predict the docking conformations of transcription factor-DNA interactions. Analyze the interaction interfaces between transcription factors and DNA using PDBePISA (www.ebi.ac.uk/pdbe/pisa ) and perform visualization using PyMOL 3.1.Quantitative real-time polymerase chain reaction (qRT-PCR)
-
Enter the CDS sequence of the apple STP family gene in the website of Sangong Bioengineering (Shanghai) Co., Ltd., conduct online primer design, and submit the designed primers (Supplementary Table S1) to the company for synthesis. Prime Script RT reagent Kit (Perfect RealTime) kit (TaKaRa) for cDNA synthesis. The reverse transcription product should be stored at −20 °C for later use. For qRT-PCR, the Swiss LightCycler 96 real-time fluorescent quantitative PCR instrument was used for quantitative analysis, with the apple GAPDH gene as an internal reference gene[35], and specific expression analysis of the apple STP gene family. The amplification system contains 1.5 μL cDNA, 1 μL upstream and downstream primers, 10 μL SYBR, 6.5 μL ddH2O, and 20 μL total system. The reaction program is: 95 °C for 30 s, 95 °C for 5 s, 60 °C for 34 s, 95 °C for 15 s, 60 °C for 60 s, 95 °C for 15 s, a total of 40 cycles. There are three biological replicates for each treatment, and the test data is converted by log10 transform. Finally, a heat map is made with HemI.
-
Genome-wide analysis identified 30 STP genes in apples, designated MdSTP1 through MdSTP30, which were unevenly distributed across ten chromosomes (Table 1). The encoded polypeptides exhibited considerable variation in length, ranging from 235 amino acid residues (MdSTP25, the shortest isoform) to 655 residues (MdSTP13, the longest isoform). Bioinformatic characterization revealed substantial physicochemical diversity among family members: instability indices ranged from 27.77 to 43.10, indicating variable protein stability; aliphatic indices spanned 23.51 to 112.00, reflecting differences in thermostability; and consistent negative GRAVY values confirmed the hydrophilic nature of all STP proteins. Molecular weights varied from 26,332.08 to 254,819.64 Da, while theoretical isoelectric points (pI) showed a broad distribution from 4.97 to 9.43, suggesting functional diversification in cellular microenvironments.
Table 1. Physical and chemical property analysis of STP genes in apple.
Gene name Gene accession no. Chromosome
locationPeptide (aa) Mw (kD) PI II AI GRAVY CDs (bp) FULL (bp) MdSTP1 MDP0000137412 Chr 02 516 185,529.61 7.14 38.78 25.58 0.603 1,551 2,189 MdSTP2 MDP0000146340 − 453 49,132.05 8.95 30.30 106.75 0.581 1,359 2,270 MdSTP3 MDP0000154362 Chr 15 522 56,747.72 9.09 33.43 111.34 0.535 1,569 2,943 MdSTP4 MDP0000175148 Chr 13 459 254,819.64 6.72 39.01 26.77 0.616 1,380 3,033 MdSTP5 MDP0000177942 Chr 01 479 214,554.17 7.53 35.91 26.45 0.604 1,440 2,522 MdSTP6 MDP0000185402 Chr 15 514 − − 27.77 104.11 0.616 1,545 1,947 MdSTP7 MDP0000187438 Chr 02 518 56,544.23 9.34 34.07 103.92 0.452 1,557 2,357 MdSTP8 MDP0000190194 Chr 13 454 157,635.95 6.41 42.94 26.49 0.655 1,365 1,876 MdSTP9 MDP0000190996 Chr 09 430 162,749.64 7.27 43.10 25.51 0.533 1,293 1,917 MdSTP10 MDP0000191620 Chr 07 497 53,868.39 9.39 31.32 105.94 0.574 1,494 1,634 MdSTP11 MDP0000192591 Chr 15 605 66,120.31 8.96 33.13 102.83 0.401 1,818 2,841 MdSTP12 MDP0000193050 Chr 13 528 57,859.72 9.24 39.08 106.91 0.426 1,587 5,069 MdSTP13 MDP0000193898 Chr 05 655 72,422.79 9.20 34.86 100.15 0.453 1,968 2,993 MdSTP14 MDP0000201154 Chr 03 574 62,630.85 9.03 30.94 98.17 0.352 1,725 3,341 MdSTP15 MDP0000204929 Chr 13 551 205,076.15 6.62 41.55 28.20 0.658 1,536 2,447 MdSTP16 MDP0000216376 Chr 01 450 124,547.01 6.97 38.52 23.51 0.608 1,353 1,497 MdSTP17 MDP0000231284 Chr 09 509 55,673.94 9.06 34.07 110.51 0.606 1,530 1,958 MdSTP18 MDP0000236607 Chr 10 428 155,806.89 7.08 40.50 24.13 0.654 1,287 1,840 MdSTP19 MDP0000240921 Chr 02 518 56,580.07 9.34 34.11 103.92 0.457 1,557 2,357 MdSTP20 MDP0000258256 Chr 15 518 56,293.23 9.23 33.39 108.26 0.505 1,557 2,642 MdSTP21 MDP0000266249 Chr 14 479 51,146.79 9.28 32.64 106.47 0.568 1,440 1,538 MdSTP22 MDP0000282726 Chr 09 509 55,818.17 8.97 31.36 110.67 0.599 1,530 1,916 MdSTP23 MDP0000288533 Chr 10 519 228,109.15 6.55 35.69 25.74 0.641 1,560 2,712 MdSTP24 MDP0000289098 Chr 13 510 56,313.63 9.00 29.22 112.00 0.571 2,415 1,533 MdSTP25 MDP0000294725 − 235 26,332.08 9.33 39.69 110.81 0.376 708 708 MdSTP26 MDP0000485591 Chr 13 371 161,539.07 4.97 38.02 26.82 0.647 1,116 1,920 MdSTP27 MDP0000721688 Chr 13 524 57,363.86 9.43 41.79 99.56 0.306 1,575 7,162 MdSTP28 MDP0000735707 Chr 15 563 61,159.36 8.89 29.65 97.14 0.477 1,692 3,273 MdSTP29 MDP0000831221 Chr 13 511 55,997.23 9.10 33.31 107.03 0.565 1,536 1,951 MdSTP30 MDP0000906893 Chr 02 521 223,660.09 6.98 38.53 27.14 0.641 1,566 2,649 Secondary structure and subcellular localization analysis of apple STP proteins
-
Secondary structure prediction of the 30 apple STP proteins revealed consistent structural features across all family members (Table 2). The composition analysis demonstrated that these proteins contain four major structural elements: α-helices (45.75%−56.60%), β-turns (4.46%−7.66%), extended chains (14.02%−19.83%), and random coils (20.85%−31.68%). Notably, the relative abundance of these structural elements followed the order: α-helix > random coil > extended chain > β-turn, indicating that α-helices and random coils dominate the secondary structure of apple STP proteins.
Table 2. The secondary structure and subcellular location of STP proteins in apple.
Protein Alpha helix Extended strand Beta turn Random coil Subcellular localization MdSTP1 50.58% 15.70% 5.23% 28.49% plas, vacu, golg, cyto MdSTP2 50.77% 14.79% 4.64% 29.80% plas, vacu, cyto, E.R., golg MdSTP3 47.89% 15.71% 5.75% 30.65% plas, vacu, E.R. MdSTP4 45.75% 18.08% 5.66% 30.50% plas, vacu, golg, E.R. MdSTP5 55.95% 15.03% 4.80% 24.22% plas, vacu MdSTP6 49.61% 15.76% 5.06% 29.57% plas, vacu, cyto, E.R. MdSTP7 47.30% 16.41% 5.02% 31.27% plas, vacu, golg, cyto MdSTP8 54.63% 14.98% 5.07% 25.33% plas, E.R., golg MdSTP9 51.63% 15.58% 6.05% 26.74% plas, vacu MdSTP10 52.92% 16.30% 4.63% 26.16% plas, vacu, cyto, E.R. MdSTP11 48.43% 16.86% 4.46% 30.25% plas, vacu, golg, cyto MdSTP12 49.05% 15.34% 5.68% 29.92% plas, vacu, E.R., cyto, mito MdSTP13 48.09% 19.24% 7.48% 25.19% plas, vacu, golg, cyto, E.R. MdSTP14 47.74% 15.85% 5.92% 30.49% plas, vacu, cyto, mito, E.R. MdSTP15 49.71% 15.46% 5.48% 29.35% vacu, plas, cyto, E.R. MdSTP16 48.89% 17.33% 4.67% 29.11% plas, vacu, cyto MdSTP17 51.67% 15.52% 5.70% 27.11% plas, vacu MdSTP18 49.71% 15.46% 5.48% 29.35% plas, vacu, E.R., cyto, mito, extr MdSTP19 48.65% 16.80% 4.83% 29.73% plas, vacu, golg, cyto MdSTP20 48.46% 16.22% 5.02% 30.31% vacu, plas, golg, cyto MdSTP21 46.14% 19.83% 5.64% 28.39% vacu, plas, cyto MdSTP22 50.49% 15.13% 5.70% 28.68% plas, vacu, E.R., chlo, pero MdSTP23 49.13% 16.96% 5.59% 28.32% vacu, plas, golg, cyto MdSTP24 47.65% 17.06% 6.67% 28.63% vacu, plas, E.R., chlo, cyto, pero MdSTP25 56.60% 14.89% 7.66% 20.85% plas, E.R., golg, chlo, vacu MdSTP26 52.29% 14.02% 4.58% 29.11% plas, vacu, golg MdSTP27 47.14% 16.41% 4.77% 31.68% plas, vacu MdSTP28 47.78% 17.41% 6.04% 28.77% plas, E.R., golg MdSTP29 48.92% 14.68% 6.07% 30.33% plas, vacu, E.R., chlo, pero MdSTP30 47.60% 16.12% 5.37% 30.90% plas, vacu, cyto, E.R. Subcellular localization predictions showed that apple STP proteins primarily localize to the plasma membrane, with additional members targeting the vacuole, endoplasmic reticulum, cytoskeleton, and Golgi apparatus. A smaller subset of STP proteins was predicted to localize to mitochondria, chloroplasts, and peroxisomes, suggesting functional specialization among family members within different cellular compartments.
Homology alignment and evolution analysis of apple STP protein sequences
-
Comprehensive phylogenetic analysis of STP proteins across multiple plant species revealed seven well-defined subfamilies (I−VII), each demonstrating distinct species distribution patterns (Fig. 1). The subfamilies varied significantly in size: subfamily I contained ten members, subfamilies II and III comprised 27 and 24 members respectively, while Subfamilies IV−VII included 27, 25, 18, and 31 members respectively. Notably, apple STP proteins (MdSTPs) exhibited unique evolutionary trajectories, with subfamily VI containing the highest proportion of MdSTPs (9/30) - a striking contrast to basal species like Arabidopsis and grape that possess only one STP member in this subfamily. Conversely, MdSTPs were completely absent from subfamily VII despite its broad representation across other species, suggesting apple-specific gene duplication and deletion events during evolution. The analysis further revealed lineage-specific distribution patterns: sorghum showed remarkable concentration in subfamily III (46.15% of its STPs), grape STPs (VvSTPs) predominantly clustered in Subfamily VII, while citrus STPs (CsSTPs) were mainly distributed in subfamily II. These findings highlight substantial divergence in STP family evolution even among closely related fruit-bearing species, including apple, grape, and citrus, underscoring the dynamic nature of STP gene family expansion and specialization across plant lineages.
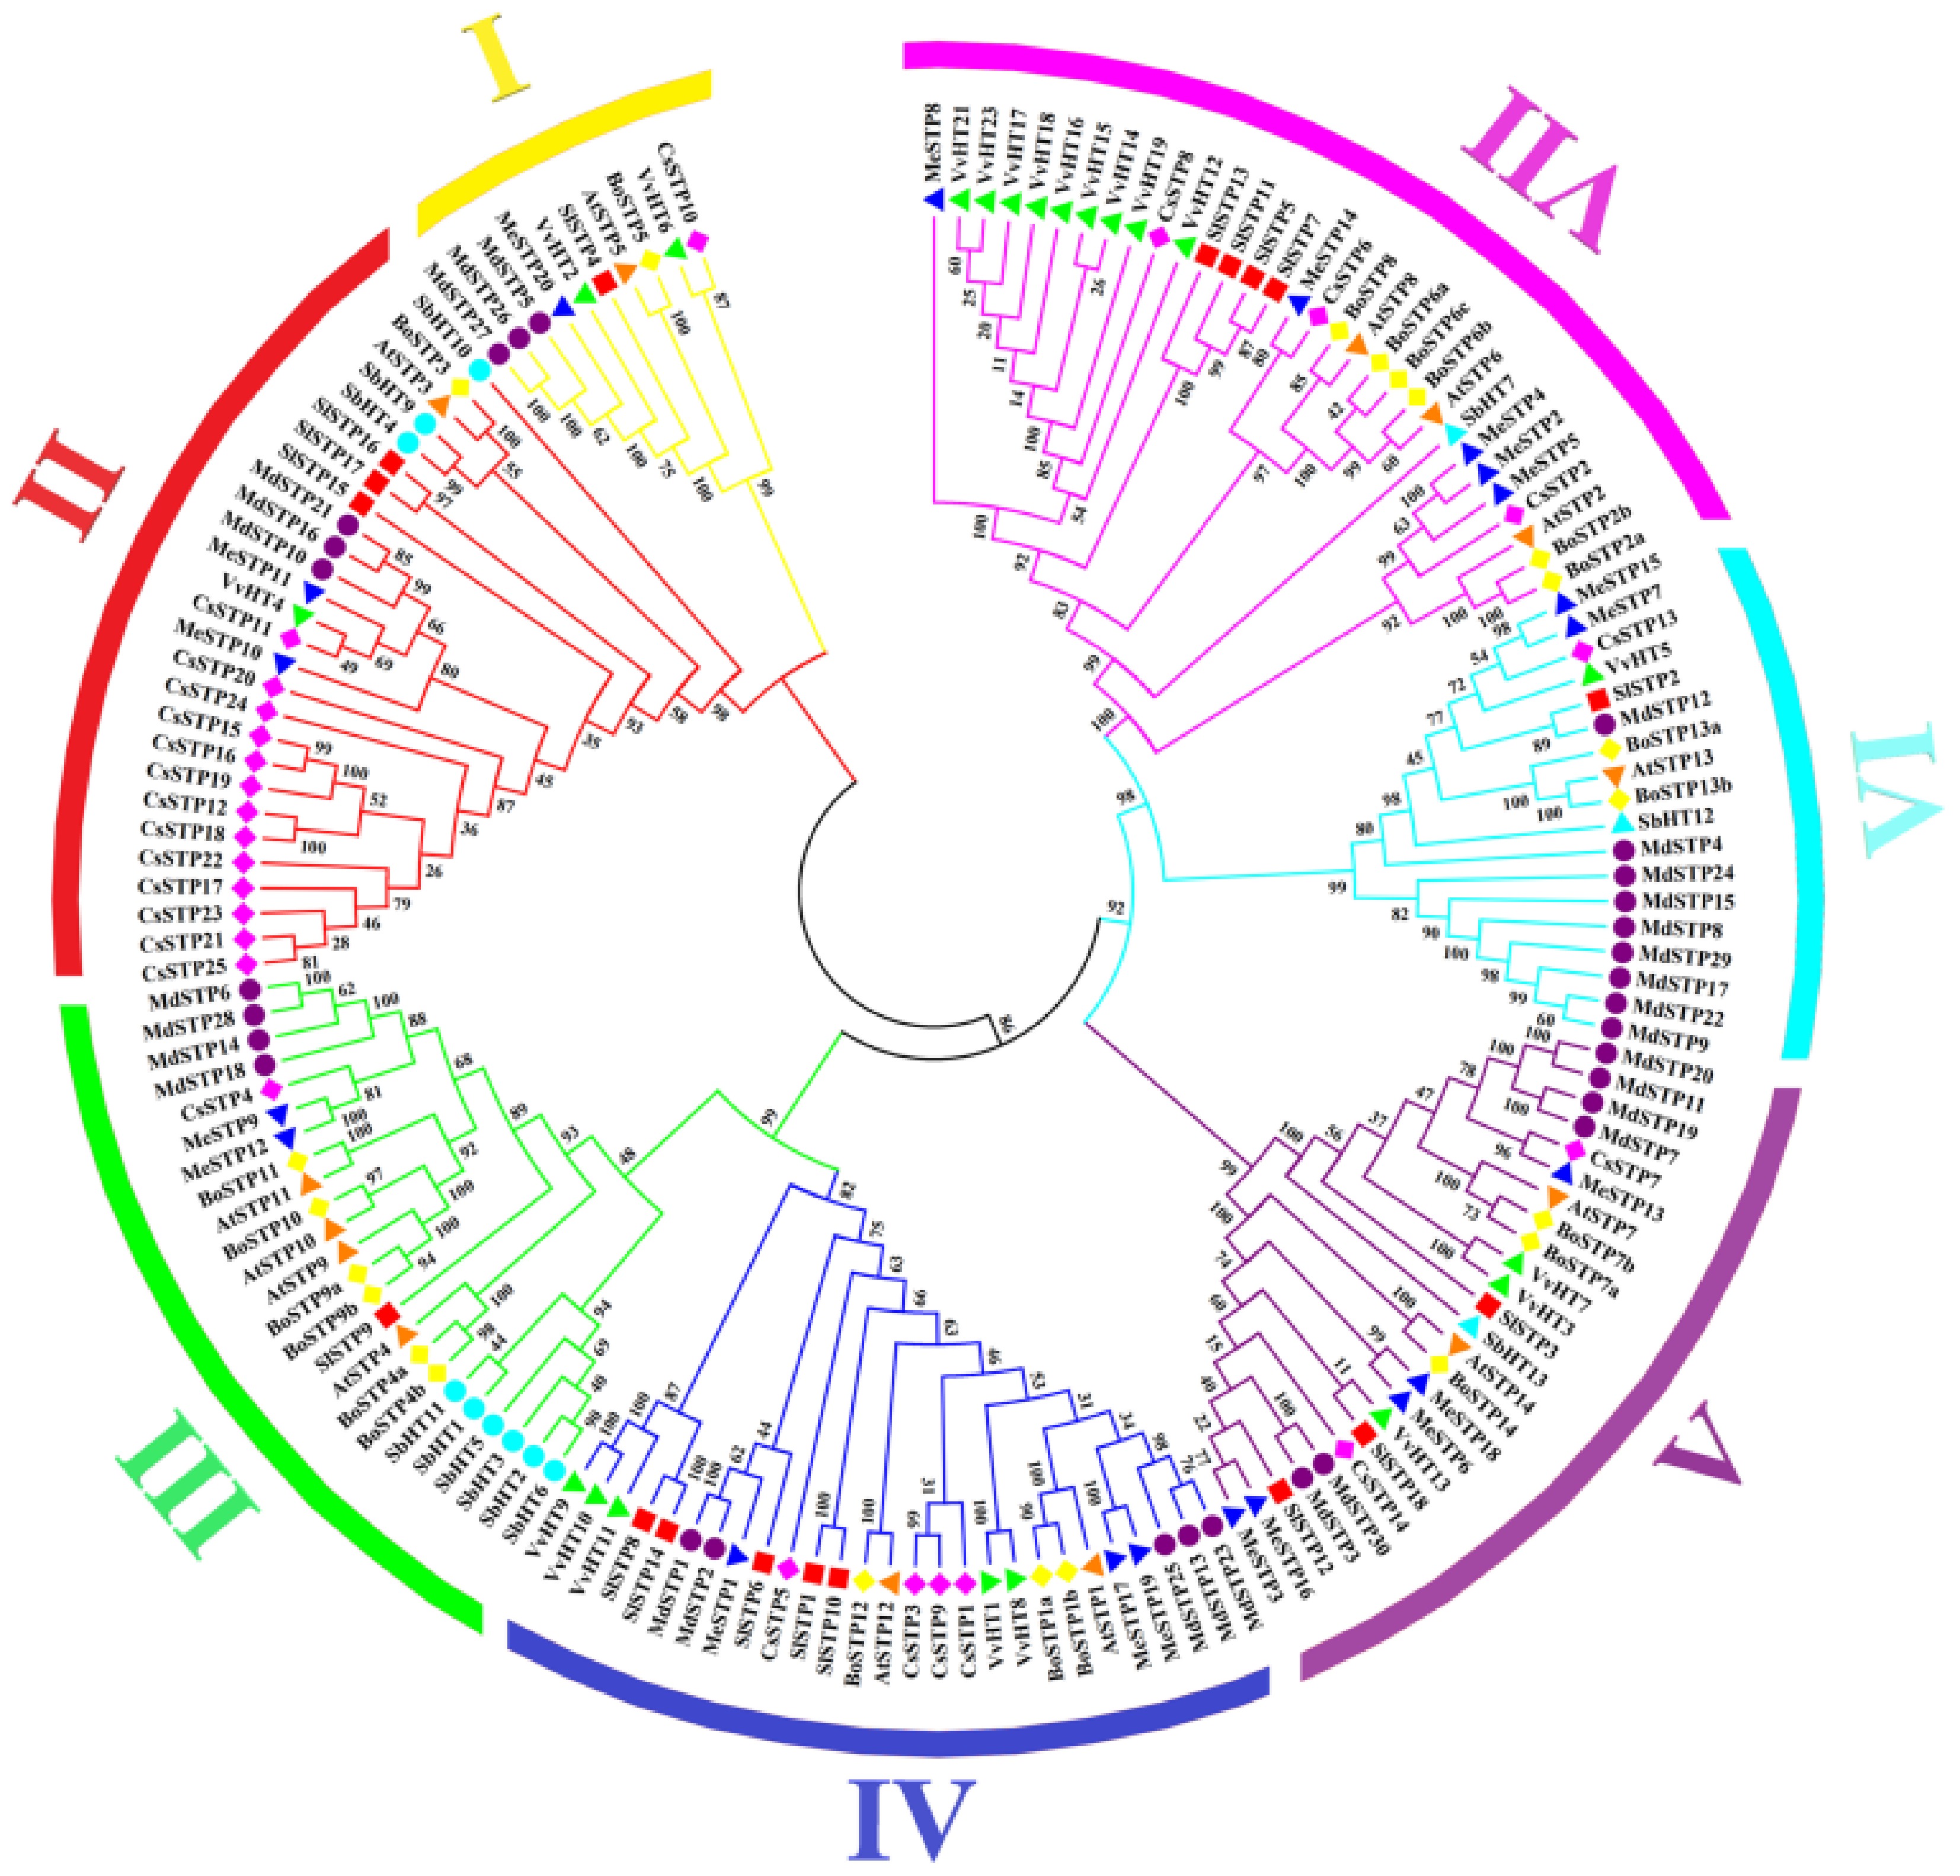
Figure 1.
Phylogenetic tree of STP proteins based on multiple species. The outermost ring of the phylogenetic tree is color-coded to represent different subfamilies, while distinct symbols on the branches denote various species. The numbers above the branches indicate bootstrap values. The abbreviations At, Cs, Sl, Me, Br, Sb, and Vv correspond to Arabidopsis, sweet orange, tomato, cassava, Chinese cabbage, sorghum, and grape, respectively.
Chromosome localization and evolutionary history of apple STP gene family
-
Chromosomal mapping analysis identified 30 MdSTP genes unevenly distributed across the apple genome (Fig. 2a), with 28 genes localized to ten chromosomes and two genes residing on unplaced scaffolds. Chromosome 13 emerged as a major hotspot, harboring seven MdSTP genes (MdSTP8/12/15/24/26/27/29). Phylogenetic analysis revealed these genes cluster into distinct clades, with MdSTP12/15/8/24/29 grouping in clade IV, while MdSTP26 and 27 belong to clade I. Although these genes are not arranged in tandem, their phylogenetic relationships and chromosomal positions suggest derivation from ancestral segmental duplication events (Fig. 1). The study identified several tandem duplication pairs, including MdSTP11/20 on chromosome 15, MdSTP7/19, MdSTP17/22, and MdSTP6/28 (Supplementary Table S2), indicating tandem duplication has significantly contributed to STP family expansion in apple. Furthermore, synteny analysis (Fig. 2b) detected six pairs of syntenic MdSTP genes distributed across 17 chromosomes, providing compelling evidence for the role of polyploidization events in shaping the evolutionary trajectory of the apple STP gene family. These findings collectively demonstrate that both tandem and segmental duplication mechanisms have driven the diversification of sugar transporters in apples during their evolutionary history.
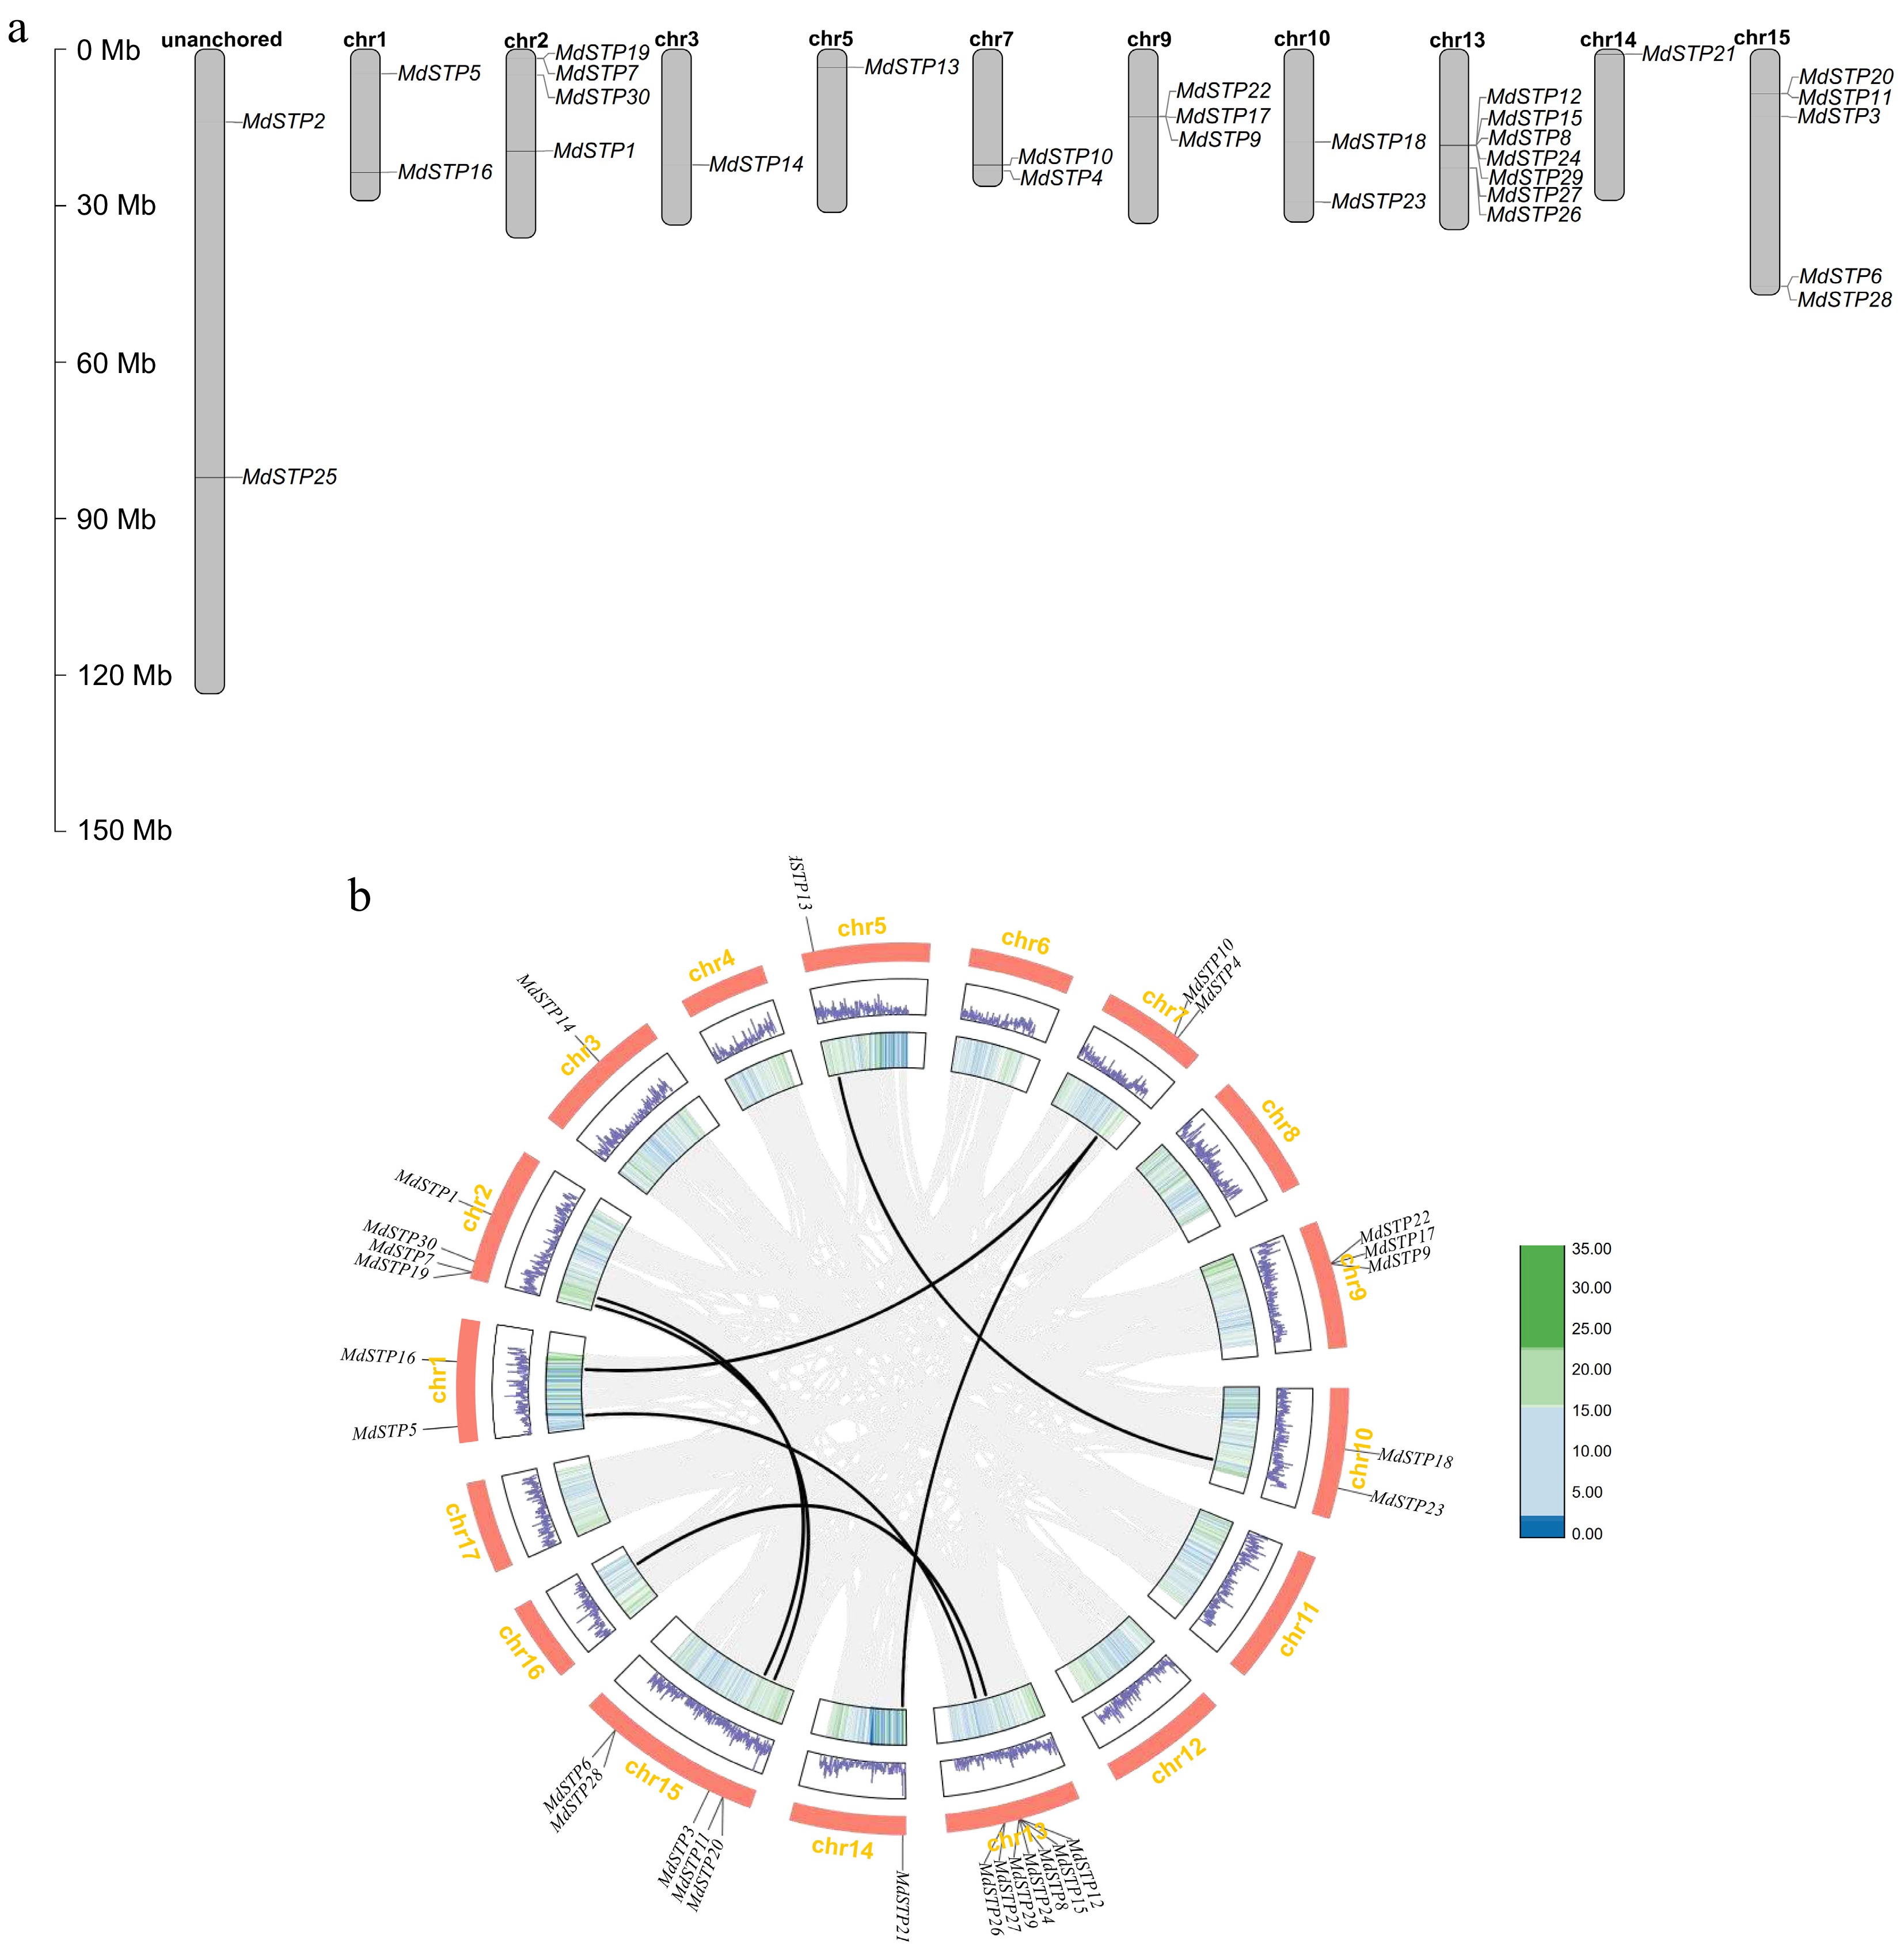
Figure 2.
Chromosomal localization and intra-species synteny of MdSTPs gene family members in apple. (a) Illustrates the chromosomal localization of MdSTPs gene family members in apple. (b) Demonstrates the syntenic relationships within the apple genome. In (a), the positions of individual genes are marked by black lines, with corresponding chromosome numbers displayed at the top of each chromosomal bar. In (b), grey lines represent syntenic blocks within the apple genome, while black lines specifically indicate syntenic gene pairs of MdSTPs. The innermost first and second concentric circles display gene density distributions across corresponding chromosomes, presented as heatmaps and line graphs, respectively.
Structural analysis of apple STP gene family
-
Comprehensive structural analysis of the 30 apple STP genes (Fig. 3) revealed significant variation in genomic organization. The exon count ranged from one to six, with MdSTP13 containing the maximum number of exons (six) and MdSTP25 representing the only intronless member. Gene length varied substantially from < 1 kb (MdSTP25) to 7 kb (MdSTP27), with most members (66.7%) exhibiting either four or five exons. Notably, phylogenetic conservation was evident in gene structure organization. Members within the same phylogenetic branch demonstrated remarkable structural similarity: (1) Subfamily II members MdSTP10 and MdSTP21 both contained two exons with comparable gene lengths; (2) Subfamily V members (MdSTP3/30/20/19/7) uniformly possessed four exons each. These conserved structural patterns strongly suggest functional and regulatory coherence among evolutionarily related STP genes, potentially reflecting conserved roles in sugar transport mechanisms across different apple tissues and developmental stages. The observed structural conservation, particularly in exon-intron organization, provides important insights into the evolutionary constraints shaping this critical transporter family.
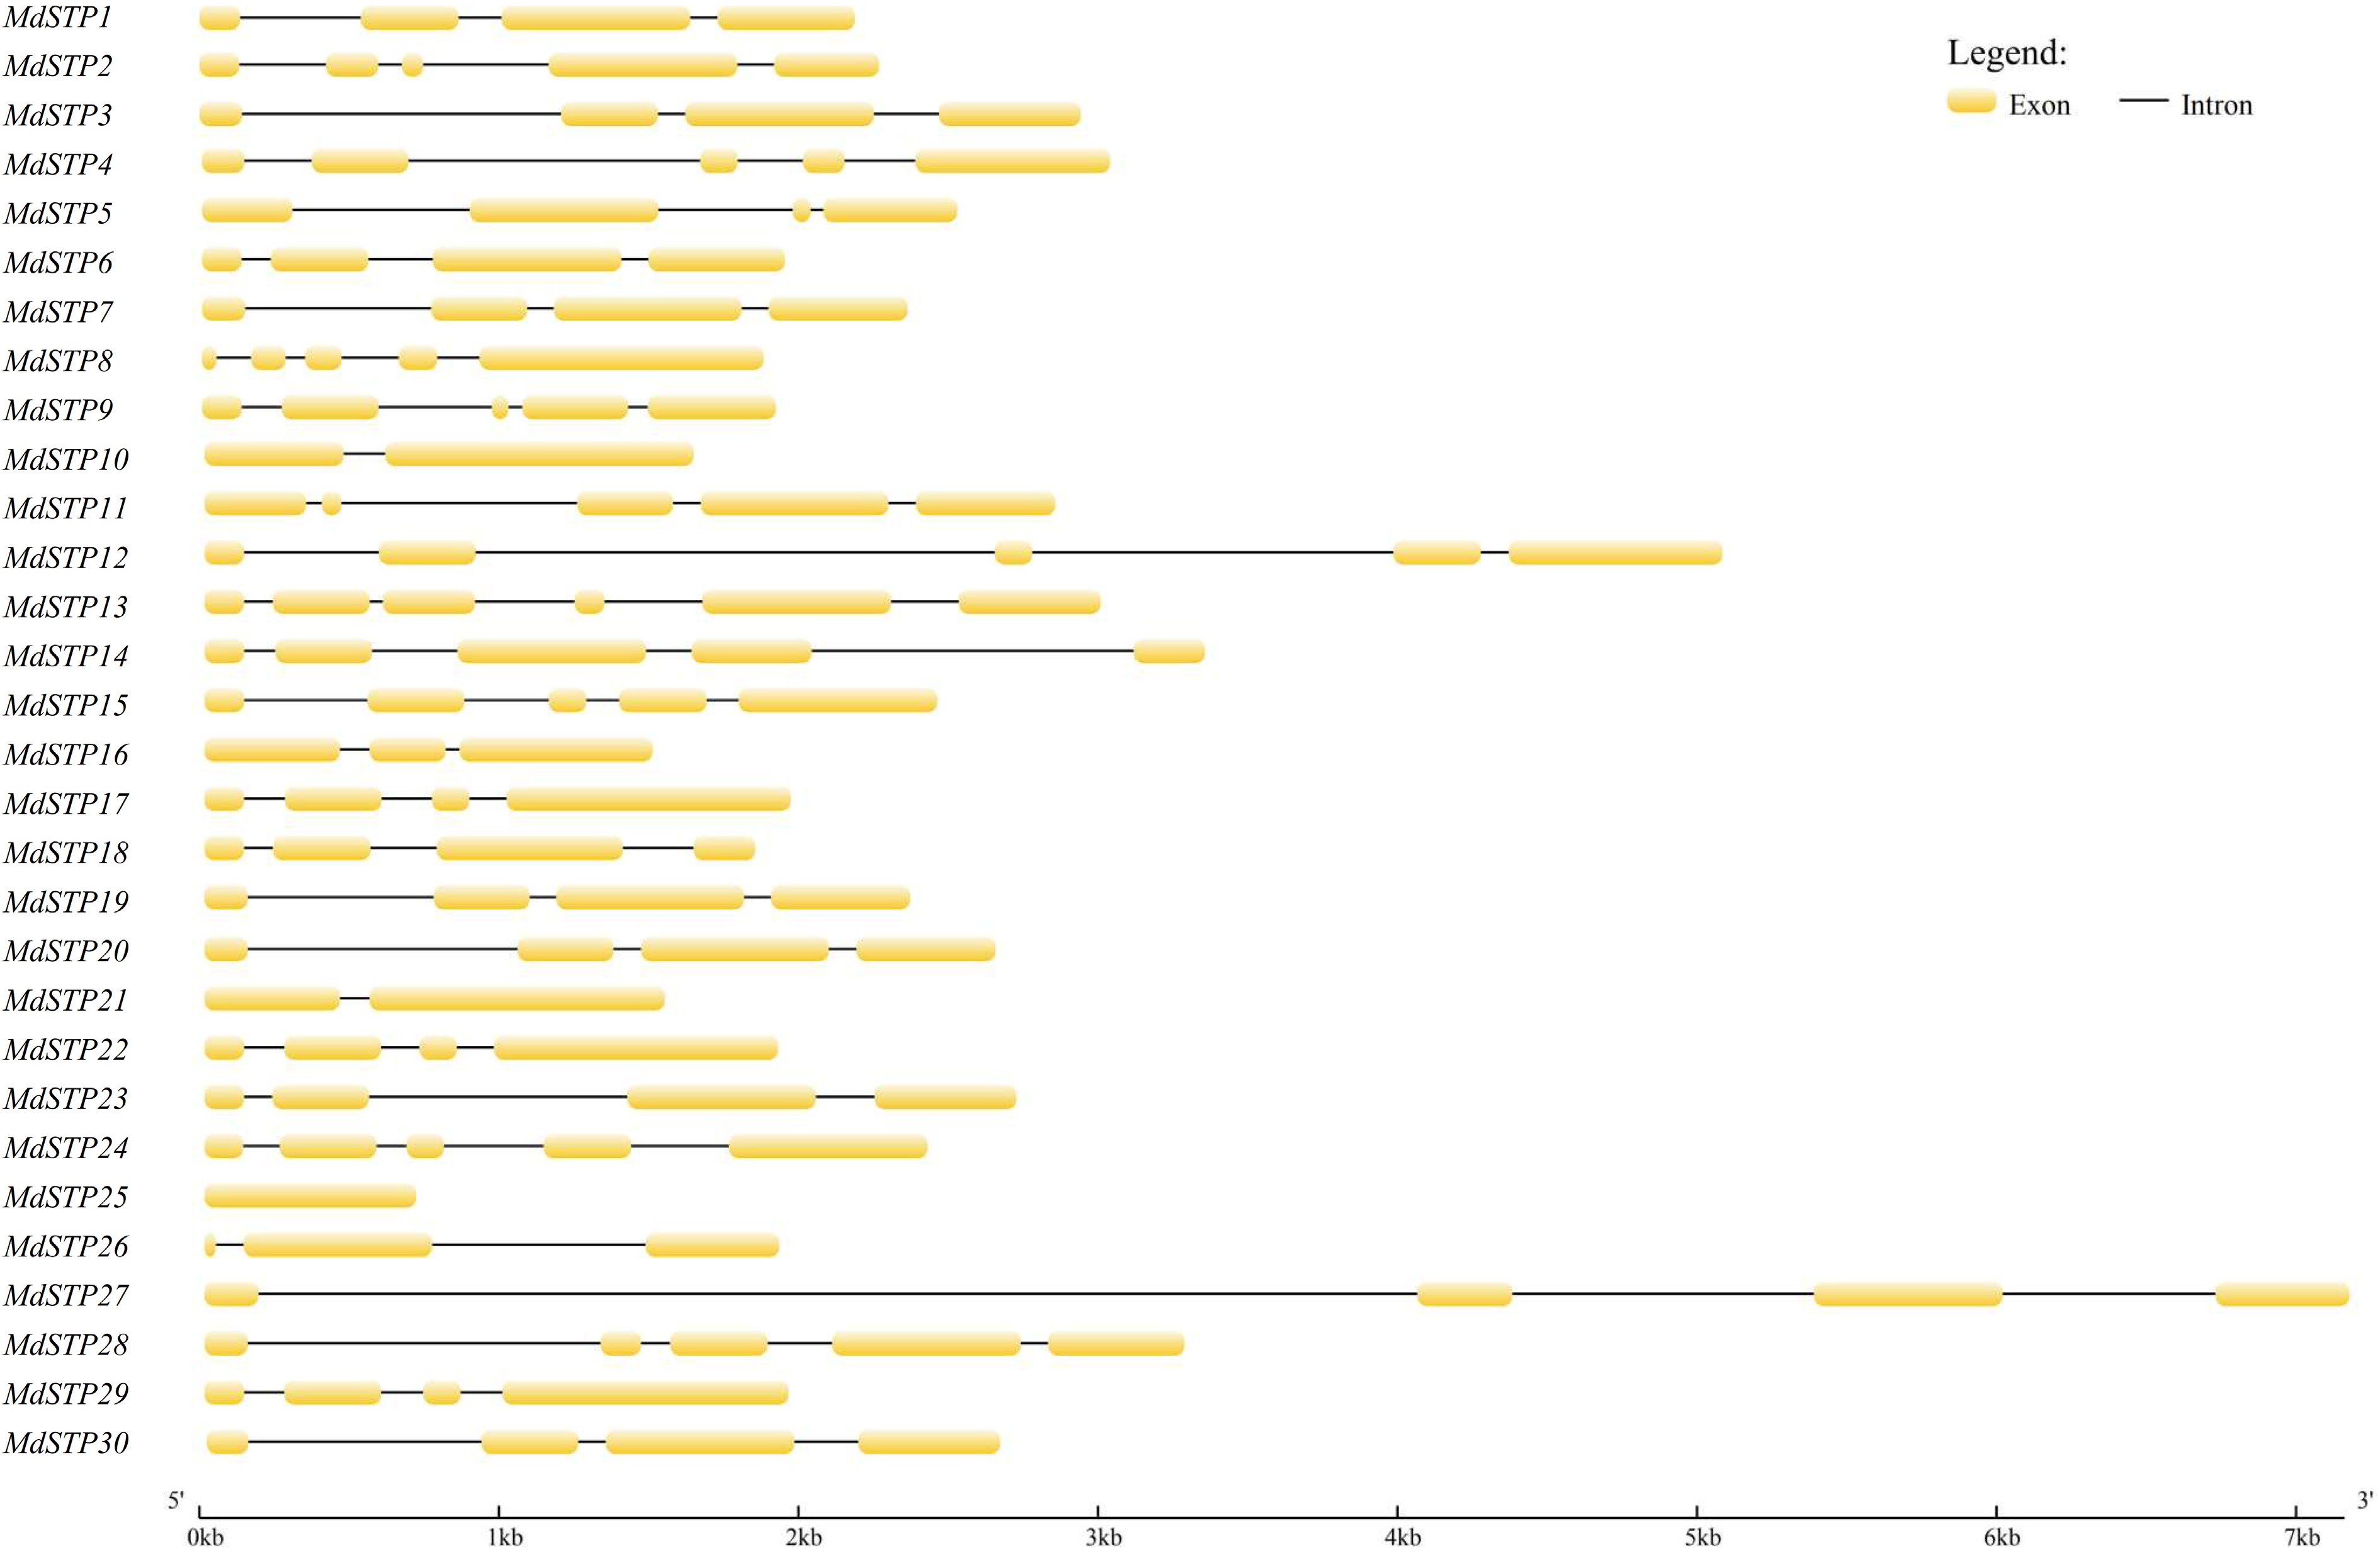
Figure 3.
Gene structure of MdSTPs. Exons are depicted as yellow boxes, while introns are represented by black lines.
Apple STP protein conservative motif analysis
-
Bioinformatic analysis of the apple STP family identified ten conserved protein motifs (designated Motifs 1−10) with distinct structural characteristics (Fig. 4). These motifs exhibited considerable variation in length, ranging from 15 amino acids (Motif 8) to 41 amino acids (Motif 7). Five motifs (3/4/6/8/10) were universally conserved across all MdSTP family members, suggesting their fundamental role in maintaining structural integrity and transporter function. The C-terminal domain was characterized by three conserved motifs: Motif 2 (29 aa), Motif 5 (21 aa), and Motif 6 (20 aa), while the N-terminal region contained Motif 7, 9, and 10. Phylogenetic analysis revealed striking clade-specific motif conservation patterns: Branch I members (MdSTP5/6/27) consistently lacked N-terminal Motif 9; Branch II members (MdSTP21/16/10) were deficient in Motif 4; and Branch V members (MdSTP20/19/7/10/11) retained complete motif complements. Notably, the identical motif composition observed in MdSTP5/6/27 (6 motifs) and similar profiles in MdSTP16/10 strongly suggest functional conservation within phylogenetic clades. These findings demonstrate that while the apple STP family has diversified into six distinct phylogenetic branches, members within each clade maintain conserved motif architectures.
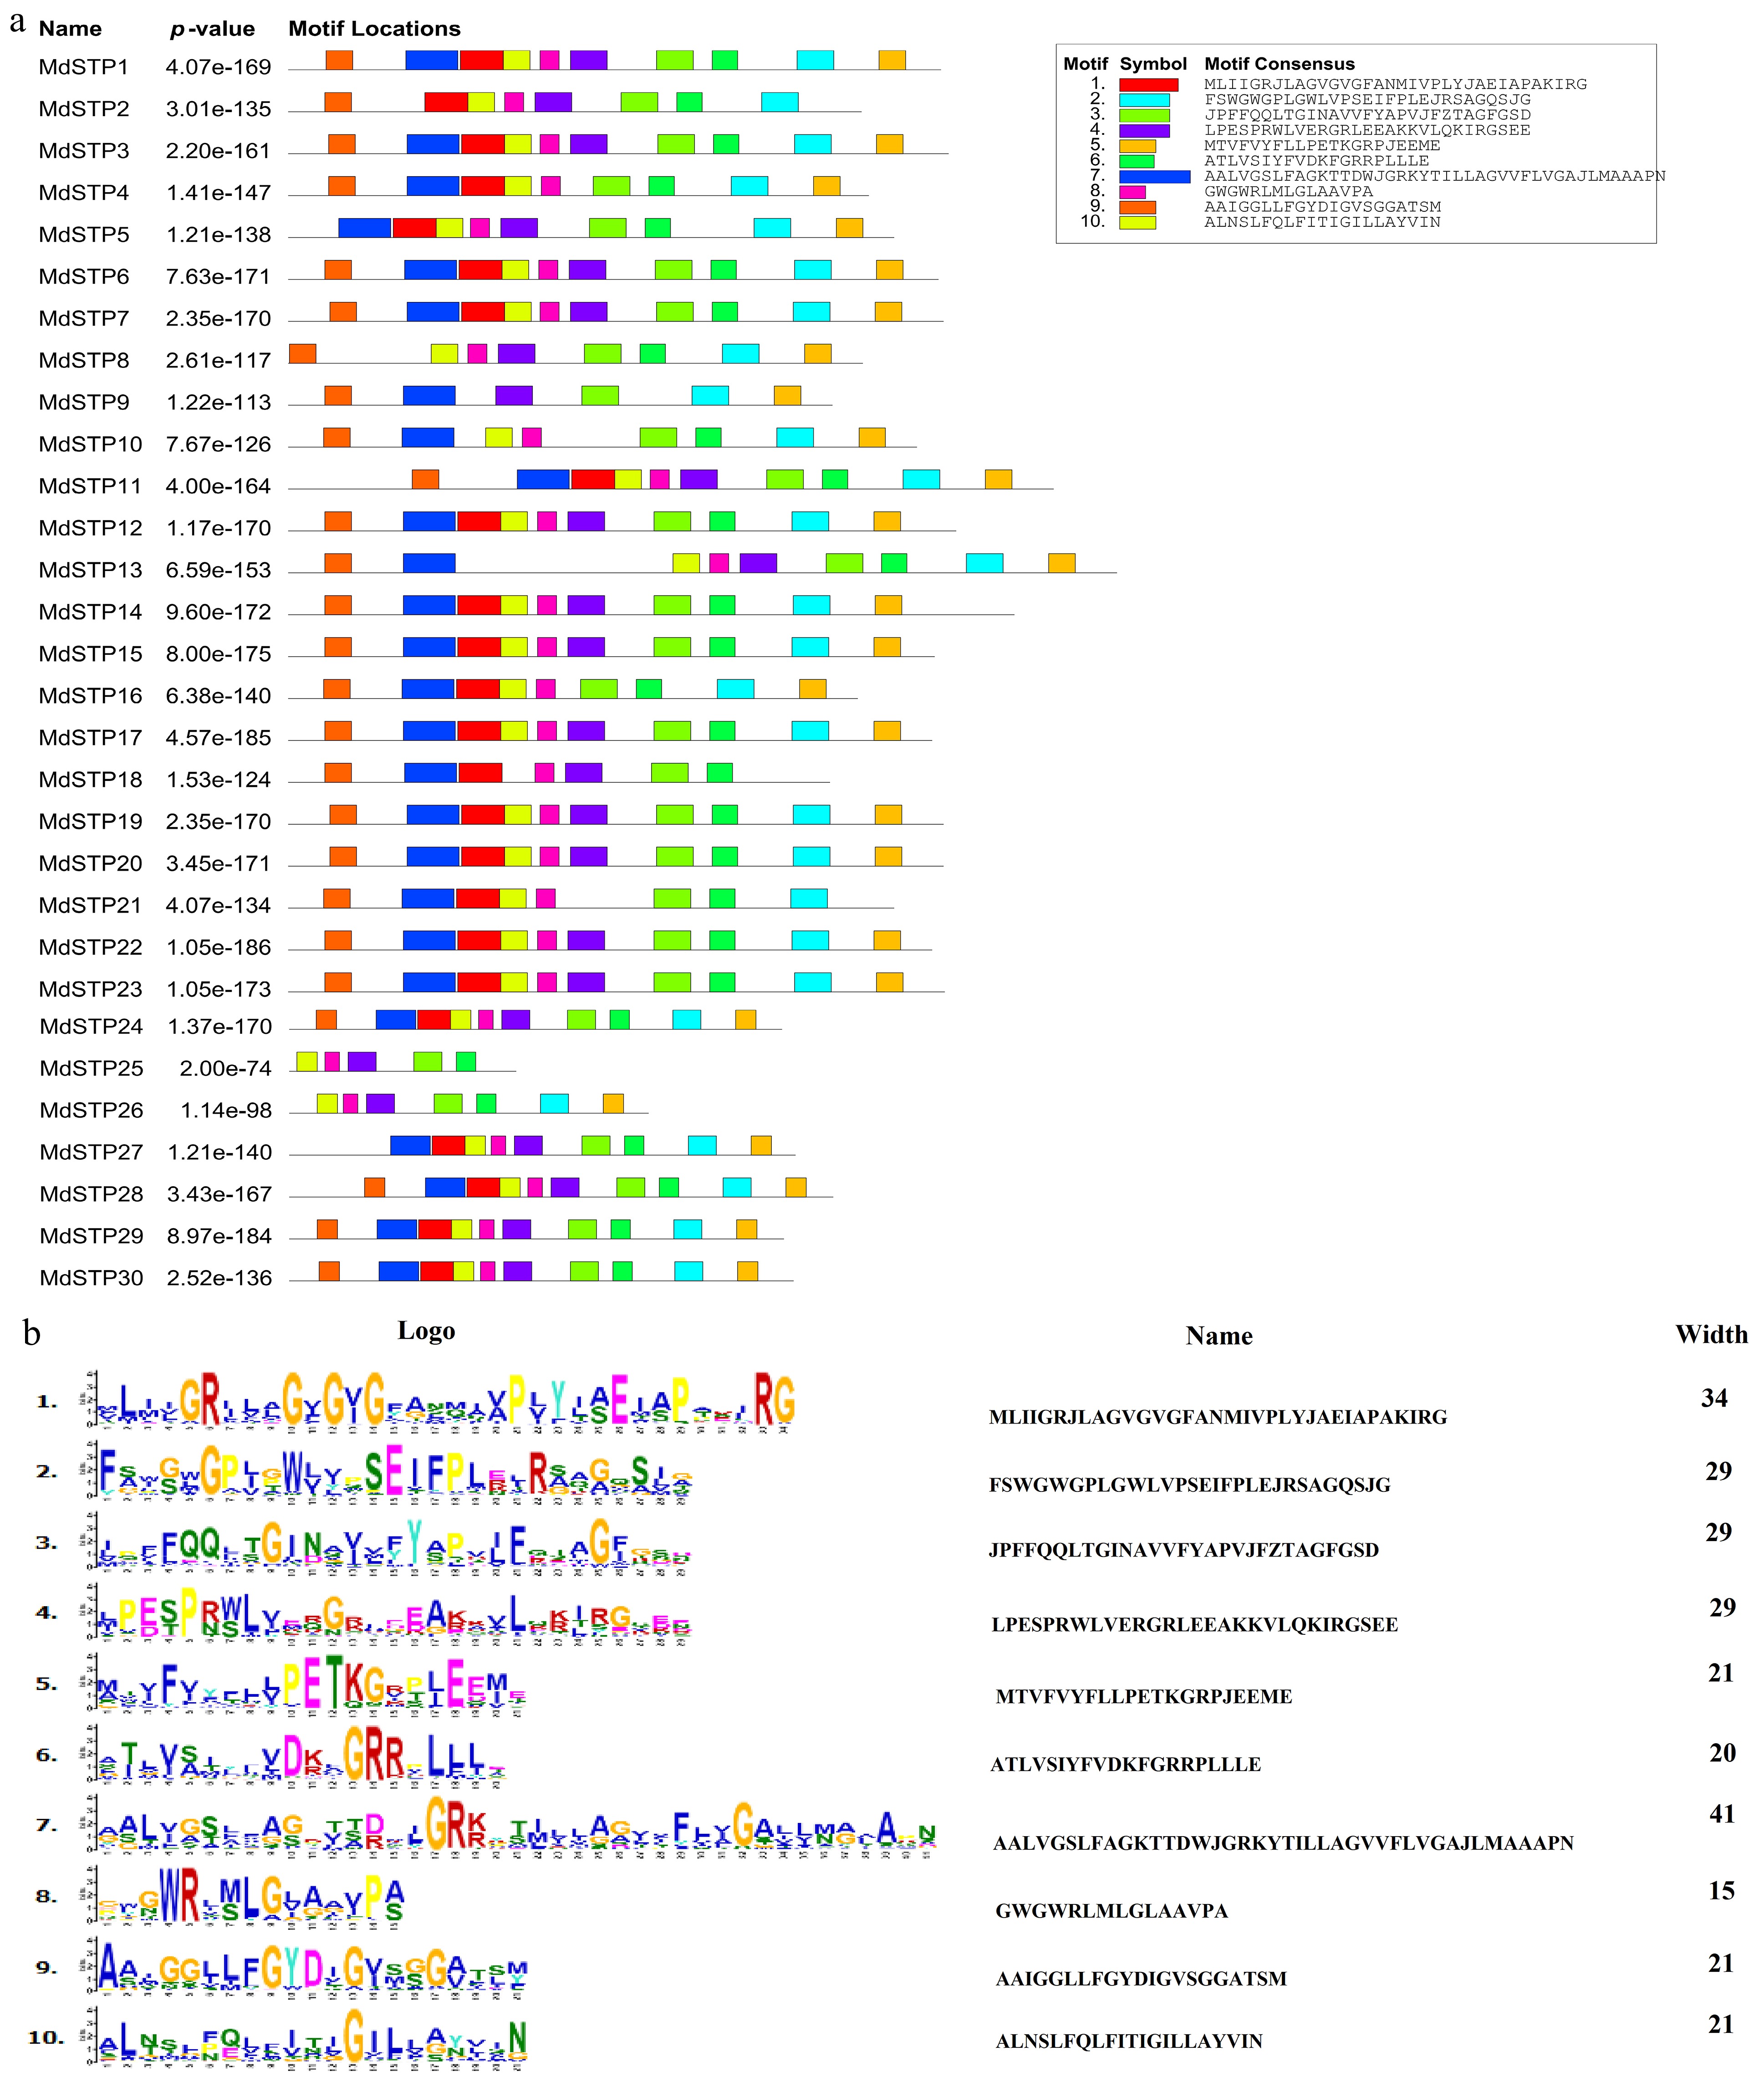
Figure 4.
Analysis of motifs in MdSTPs Proteins. (a) A total of 10 motifs were identified. (b) Sequence characteristics of the motifs. In (a), the 10 putative motifs are sequentially numbered from 1 to 10 and represented by distinct colors.
Cis-acting regulatory element analysis of the apple STP gene family
-
The 2,000 bp promoter sequences upstream of apple STP genes (Fig. 5) identified a sophisticated regulatory architecture comprising four functionally distinct categories of cis-acting elements. The promoter regions contained: (1) hormone-responsive elements, including gibberellin-sensitive motifs (P-box, GARE-motif, TATC-box), methyl jasmonate-responsive elements (CGTCA-motif, TGACG-motif), auxin-related motifs (TGA-element, AuxRR-core), salicylic acid-responsive TCA-element, and abscisic acid-sensitive ABRE; (2) stress-inducible elements such as drought-responsive MBS and low temperature-sensitive LTR; (3) tissue-specific regulatory components including the meristem-associated CAT-box; and (4) light-responsive elements (ACE, G-box, MRE, Box 4, I-box). These findings demonstrate that apple STP genes are regulated by an intricate network of cis-regulatory elements that integrate hormonal signals (gibberellins, jasmonates, auxins, abscisic acid, and salicylic acid), environmental stresses (drought and low temperature), tissue-specific developmental cues, and light-mediated transcriptional control. The combinatorial presence of these regulatory motifs strongly suggests that the STP gene family serves as a crucial regulatory node coordinating multiple physiological processes, including hormone-mediated growth regulation, stress adaptation mechanisms, organ-specific development, and photomorphogenic responses, highlighting their pivotal role as integrators of both endogenous developmental programs and environmental stimuli in apple.
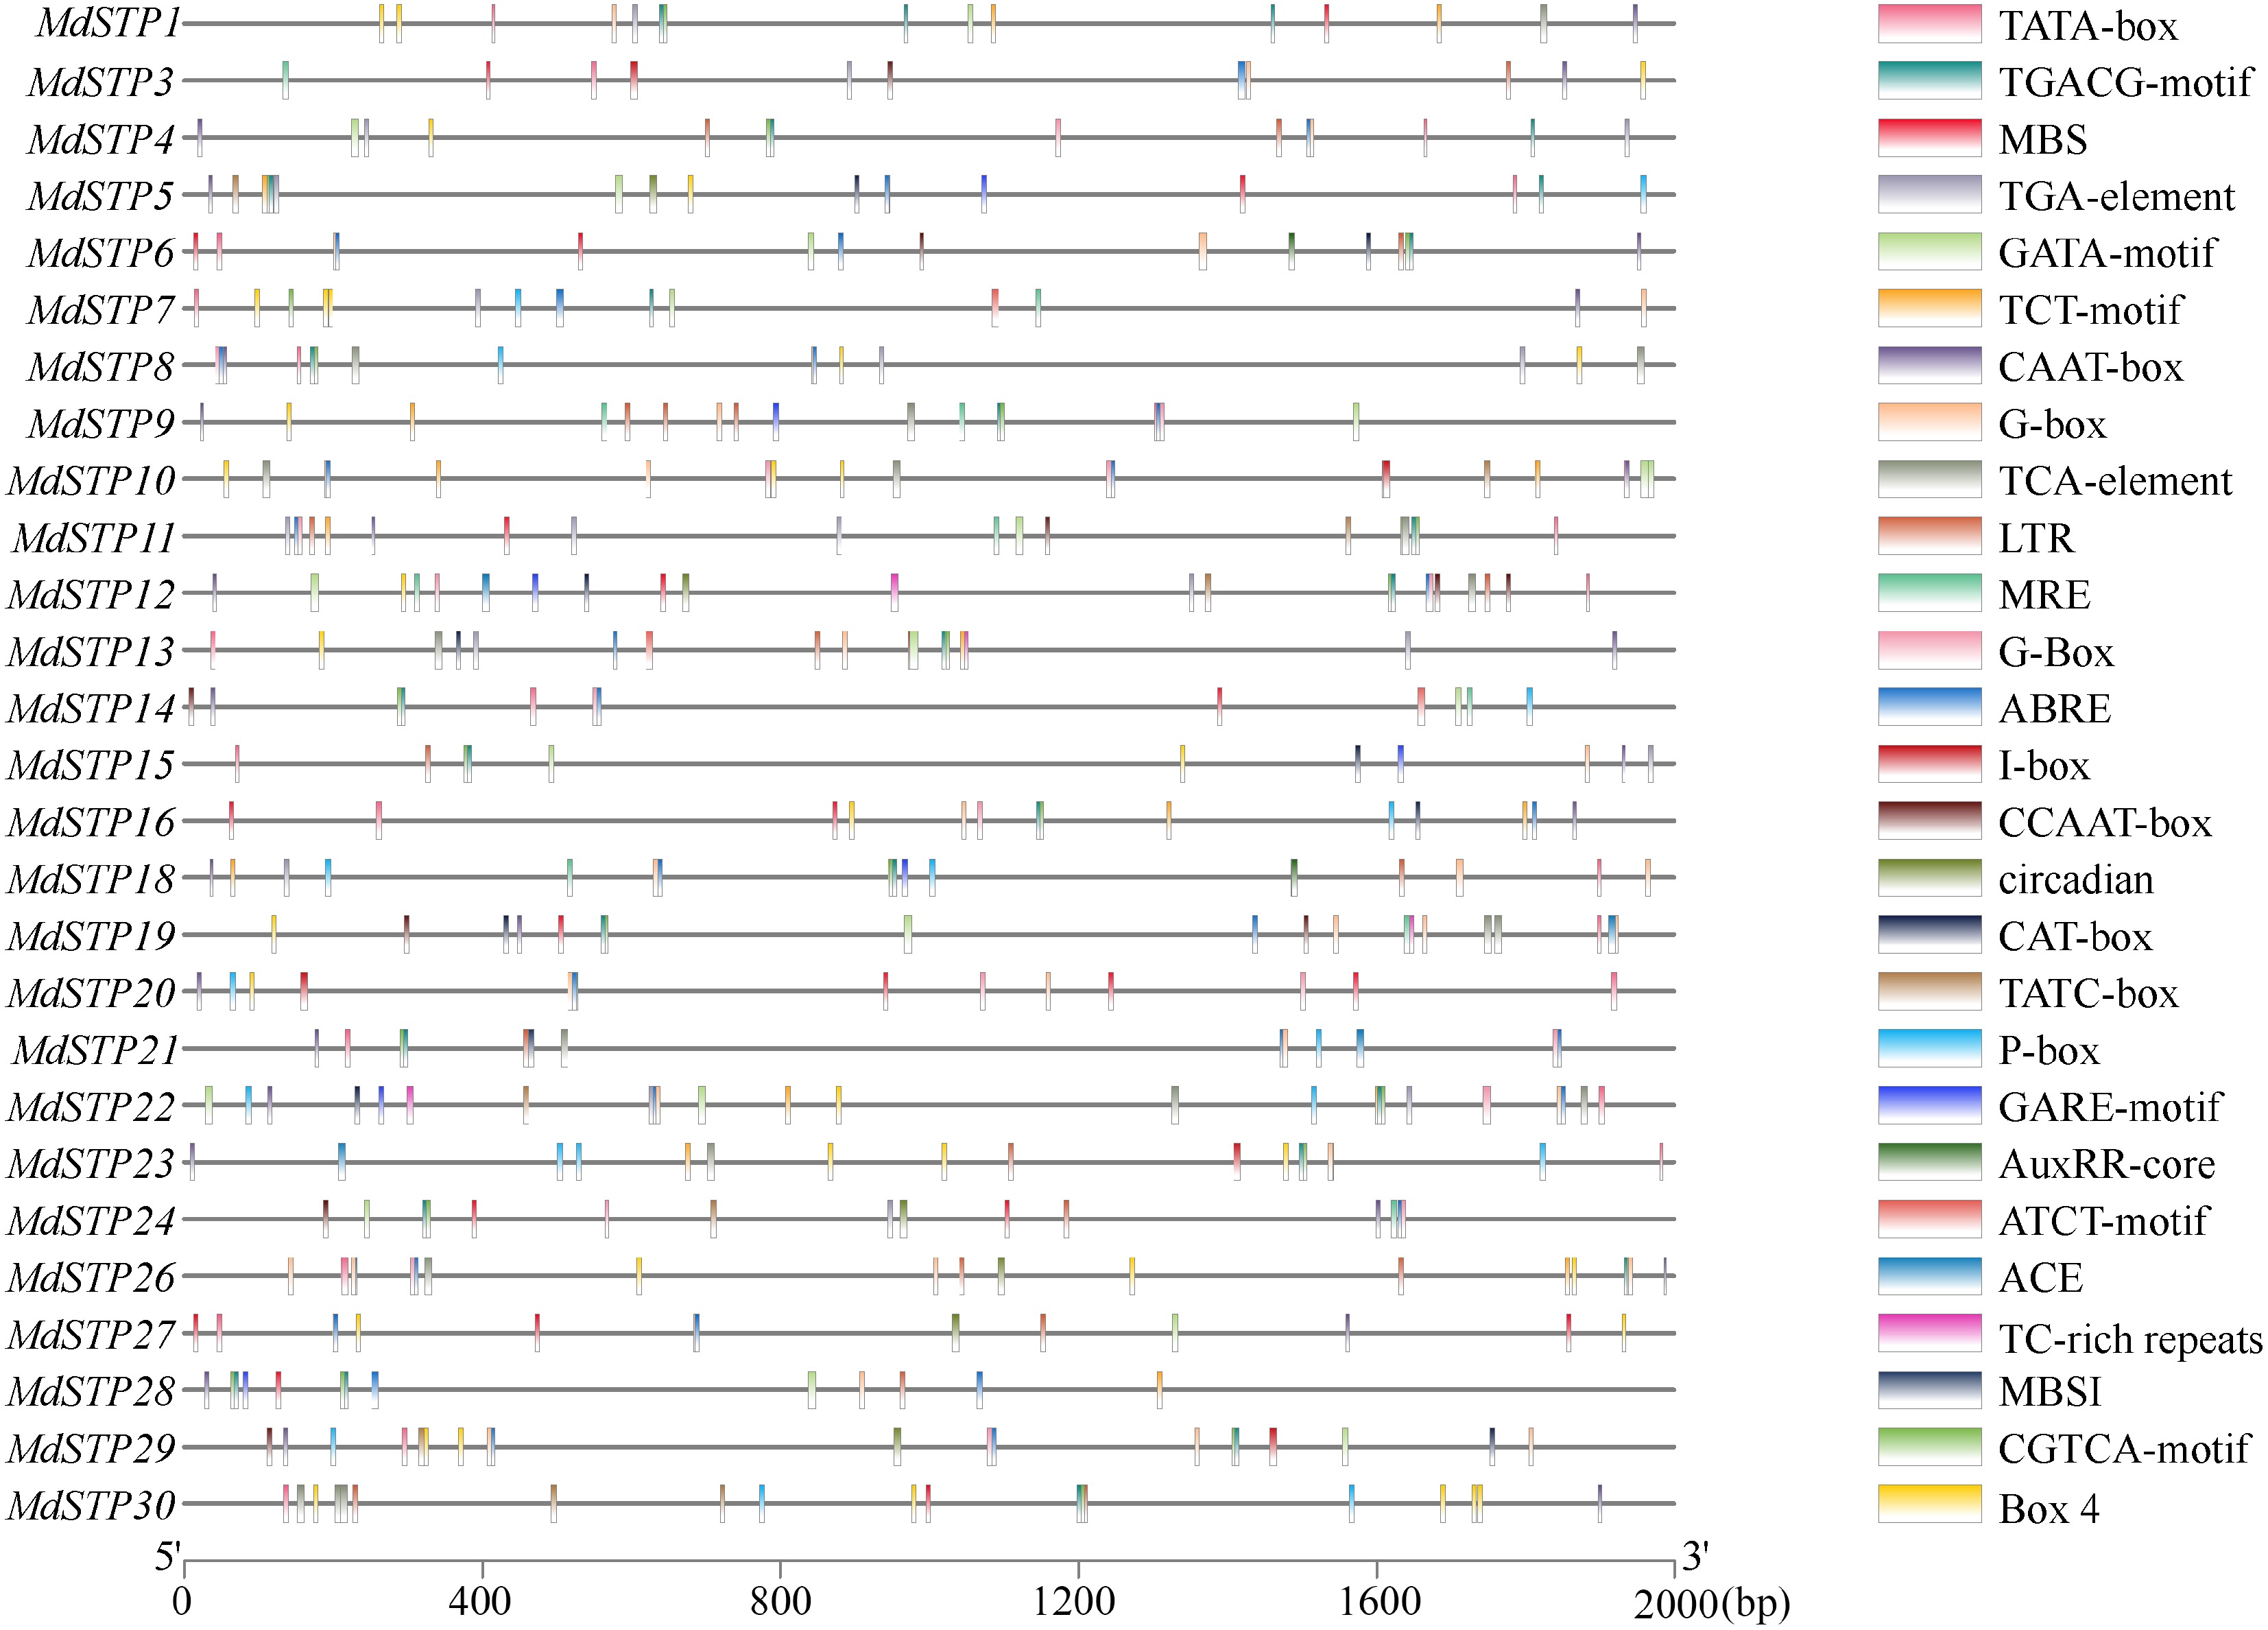
Figure 5.
Cis-acting regulatory elements of MdSTPs genes. A total of 27 cis-acting elements were identified within the promoter regions of the 30 MdSTPs genes, each represented by distinctively colored boxes.
Chip expression profile of apple STP genes
-
Gene chip analysis showed that 30 MdSTP genes had different expression patterns in different tissues of different apple varieties (Fig. 6). Among the 30 MdSTP genes, 24 genes (except MdSTP3/4/7/10/13/23) showed relatively high expression levels in seeds and seedlings of different apple varieties; 27 genes (except MdSTP3/13/23) showed relatively high expression levels in the roots and stems of Golden Delicious GD and X8877. In contrast, most genes that keep high expression were found in flowers of M69, young fruits of M74, leaves of M14 and fruits of M20. The expression levels in M74 flowers, M20 young fruits, M49 leaves and M74 fruits were all lower. Interestingly, some MdSTP genes are expressed in all tissues, but their expression levels vary greatly in the same tissues of different apple varieties. For example, MdSTP8 is more highly expressed in flowers of M69 than in flowers of M74. MdSTP24 was expressed higher in mature fruits of M20 but lower expressed in young fruits of M20. MdSTP3/13/23 exhibit low expression levels across all tissues of the apple cultivars, including seedlings and seeds, where other MdSTPs are highly expressed. These findings highlight the remarkable functional diversification of MdSTP genes, with distinct expression profiles reflecting their specialized roles in different developmental stages and tissue types.
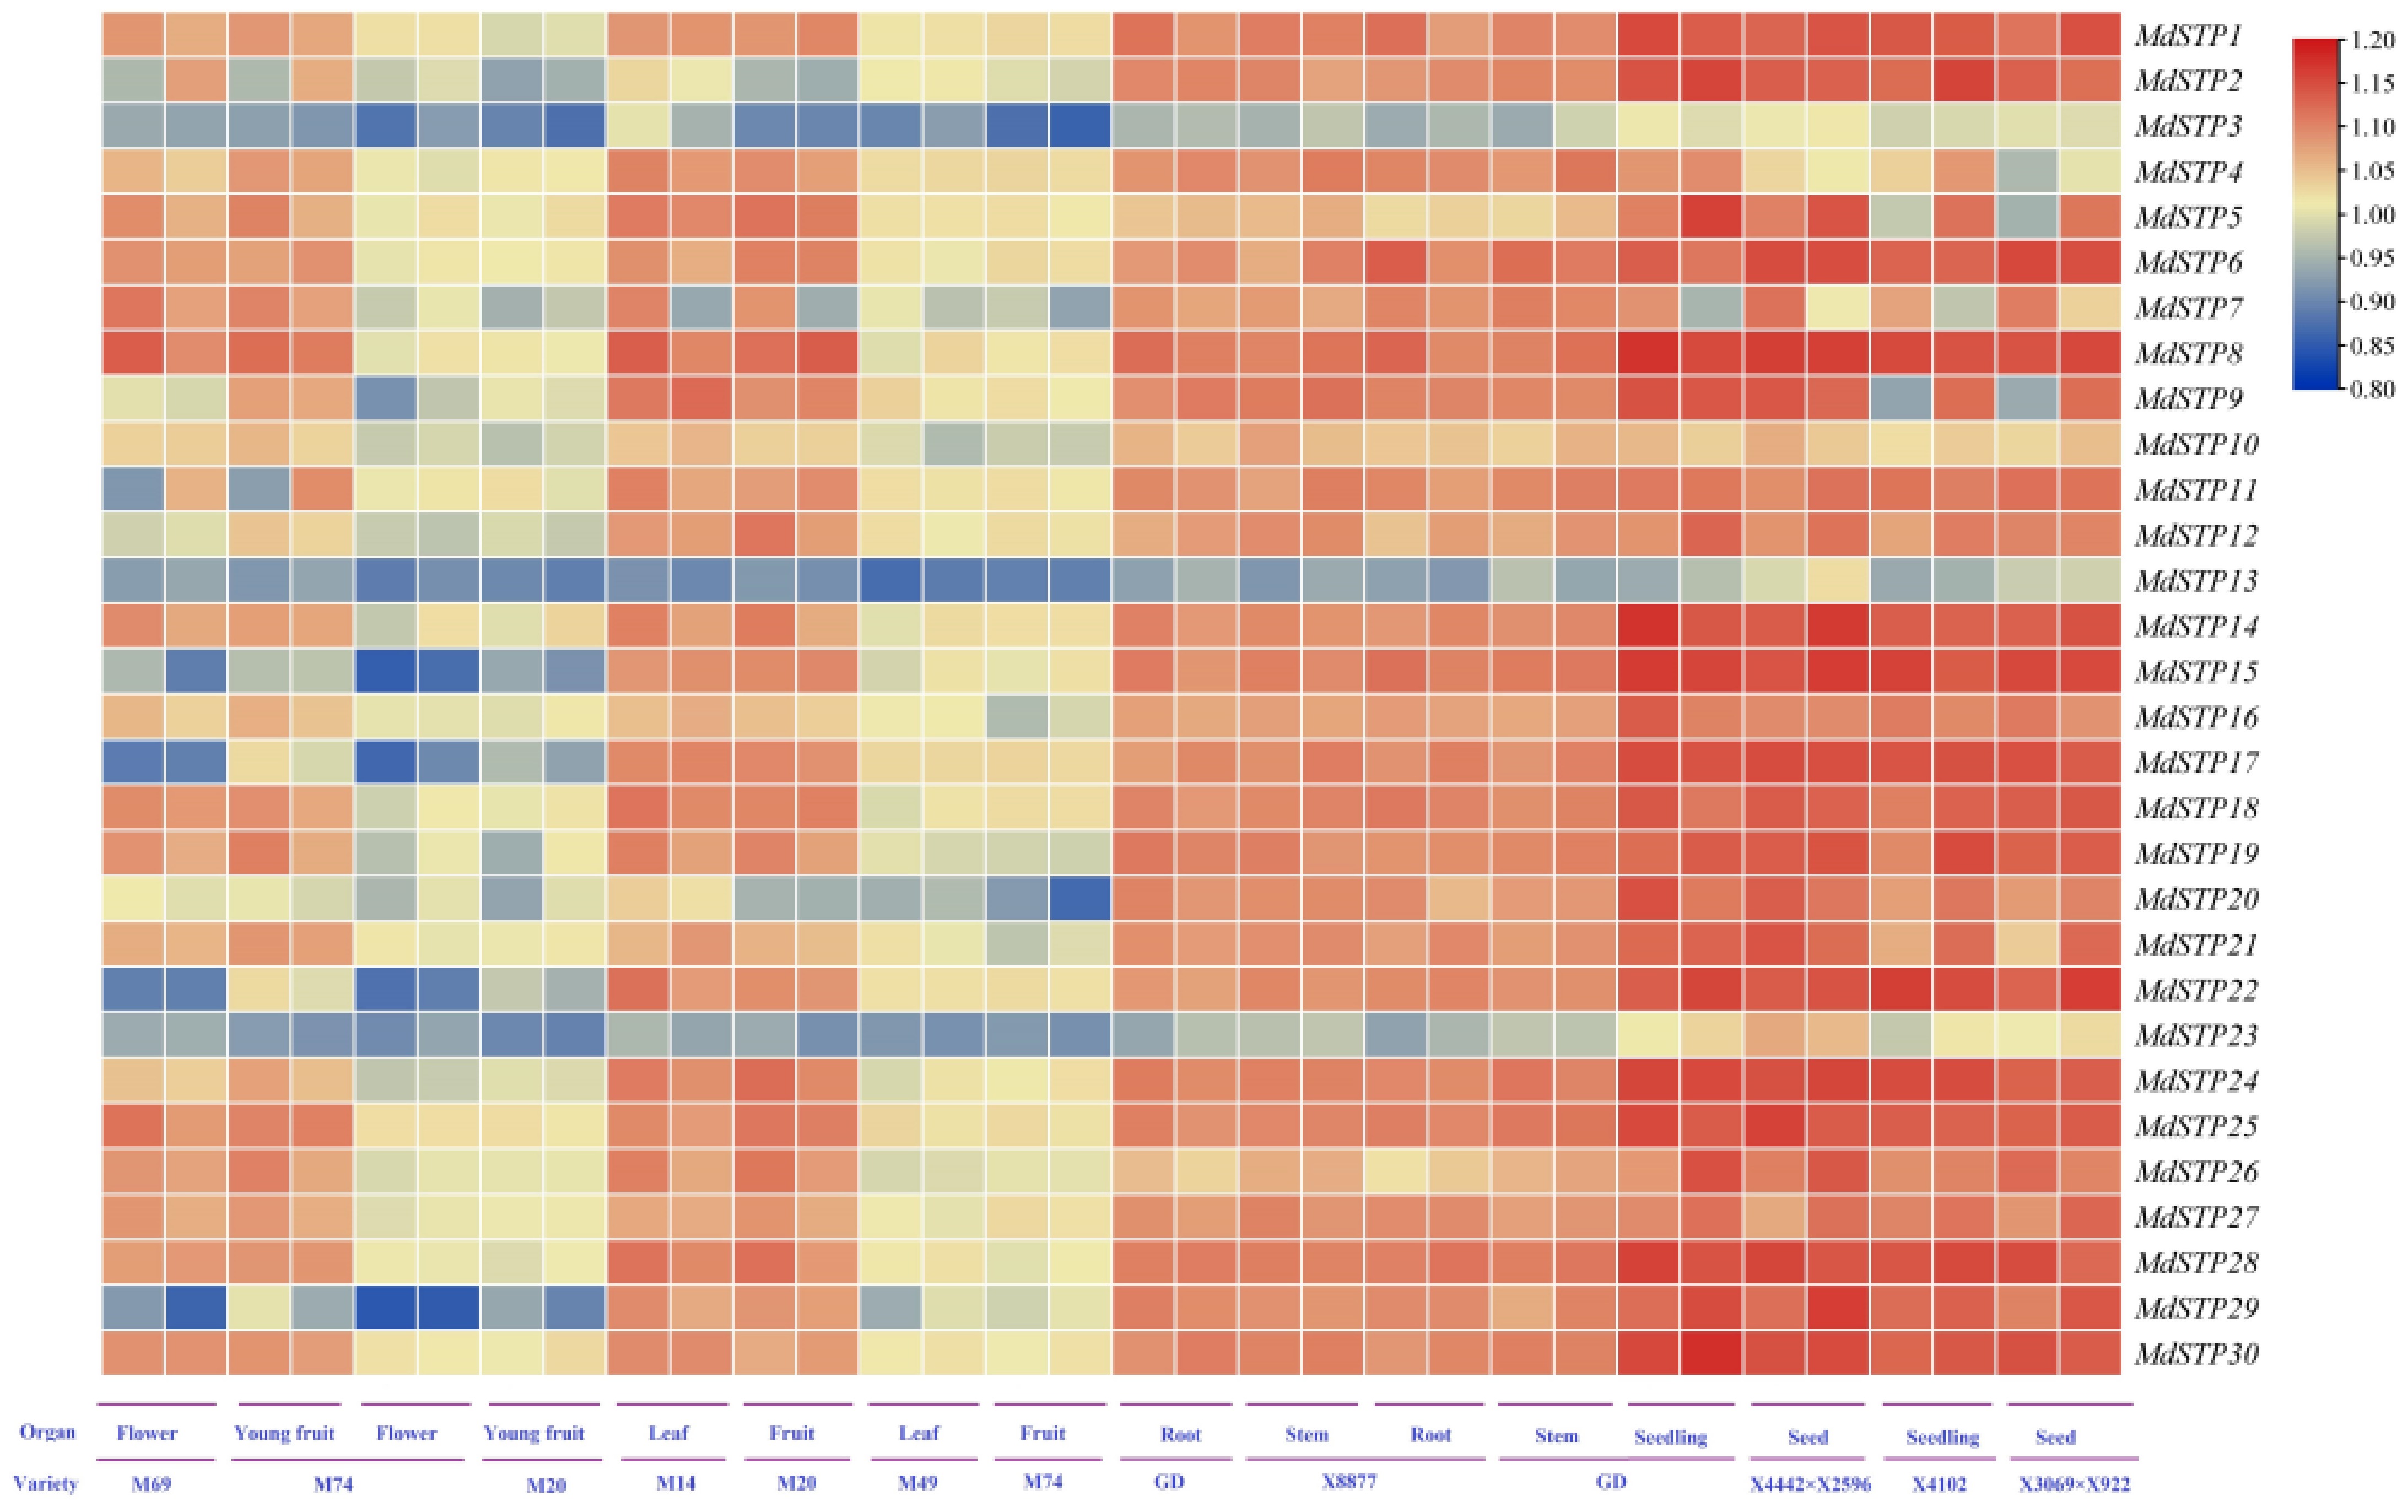
Figure 6.
Expression levels of MdSTPs across various cultivars and tissues. At the bottom of the heatmap, 'Variety' denotes different apple cultivars, while 'Organ' represents various tissue types. The heatmap employs a blue-yellow-red color gradient to indicate gene expression levels, ranging from low to high. The expression levels are comparatively analyzed based on the integrated data from both the horizontal and vertical axes.
Transcriptional regulatory relationships of the apple STP gene family members in fruit
-
To elucidate the transcriptional regulatory mechanisms of MdSTPs in apple fruit, this study analyzed the expression levels of MdSTPs during fruit ripening and identified the transcription factors that modulate their activity. The results revealed that MdSTP3, MdSTP13, and MdSTP23 are the predominantly expressed MdSTPs during fruit maturation, with MdSTP3 exhibiting the highest expression levels in both cultivars (Fig. 7a). Notably, in cultivar M20, the expression levels of most MdSTPs, including MdSTP3, MdSTP13, and MdSTP23, decreased during the ripening stage compared to their levels at 100 days post-anthesis. In contrast, in cultivar M74, the expression levels of most MdSTPs increased during ripening relative to their levels at 100 days post-anthesis. Predictions of transcription factor interactions suggest that MdSTPs can be activated or repressed by members of 39 TFs families, including ERF, MYB, and DOF (Fig. 7b). The ERF transcription factor family was found to have the highest number of binding sites. This study identified 214 ERF genes in the apple genome and found that 93 MdSTPs were expressed in the fruit of both cultivars. Among these, MdERF44, MdERF50, MdERF71, and MdERF86 were highly expressed in the fruit (Fig. 7d). Correlation analysis indicated that the expression levels of most MdERFs were positively correlated with the expression levels of MdSTP3, MdSTP13, and MdSTP23 (Fig. 7c), suggesting that MdERFs may positively regulate the expression of these MdSTPs.
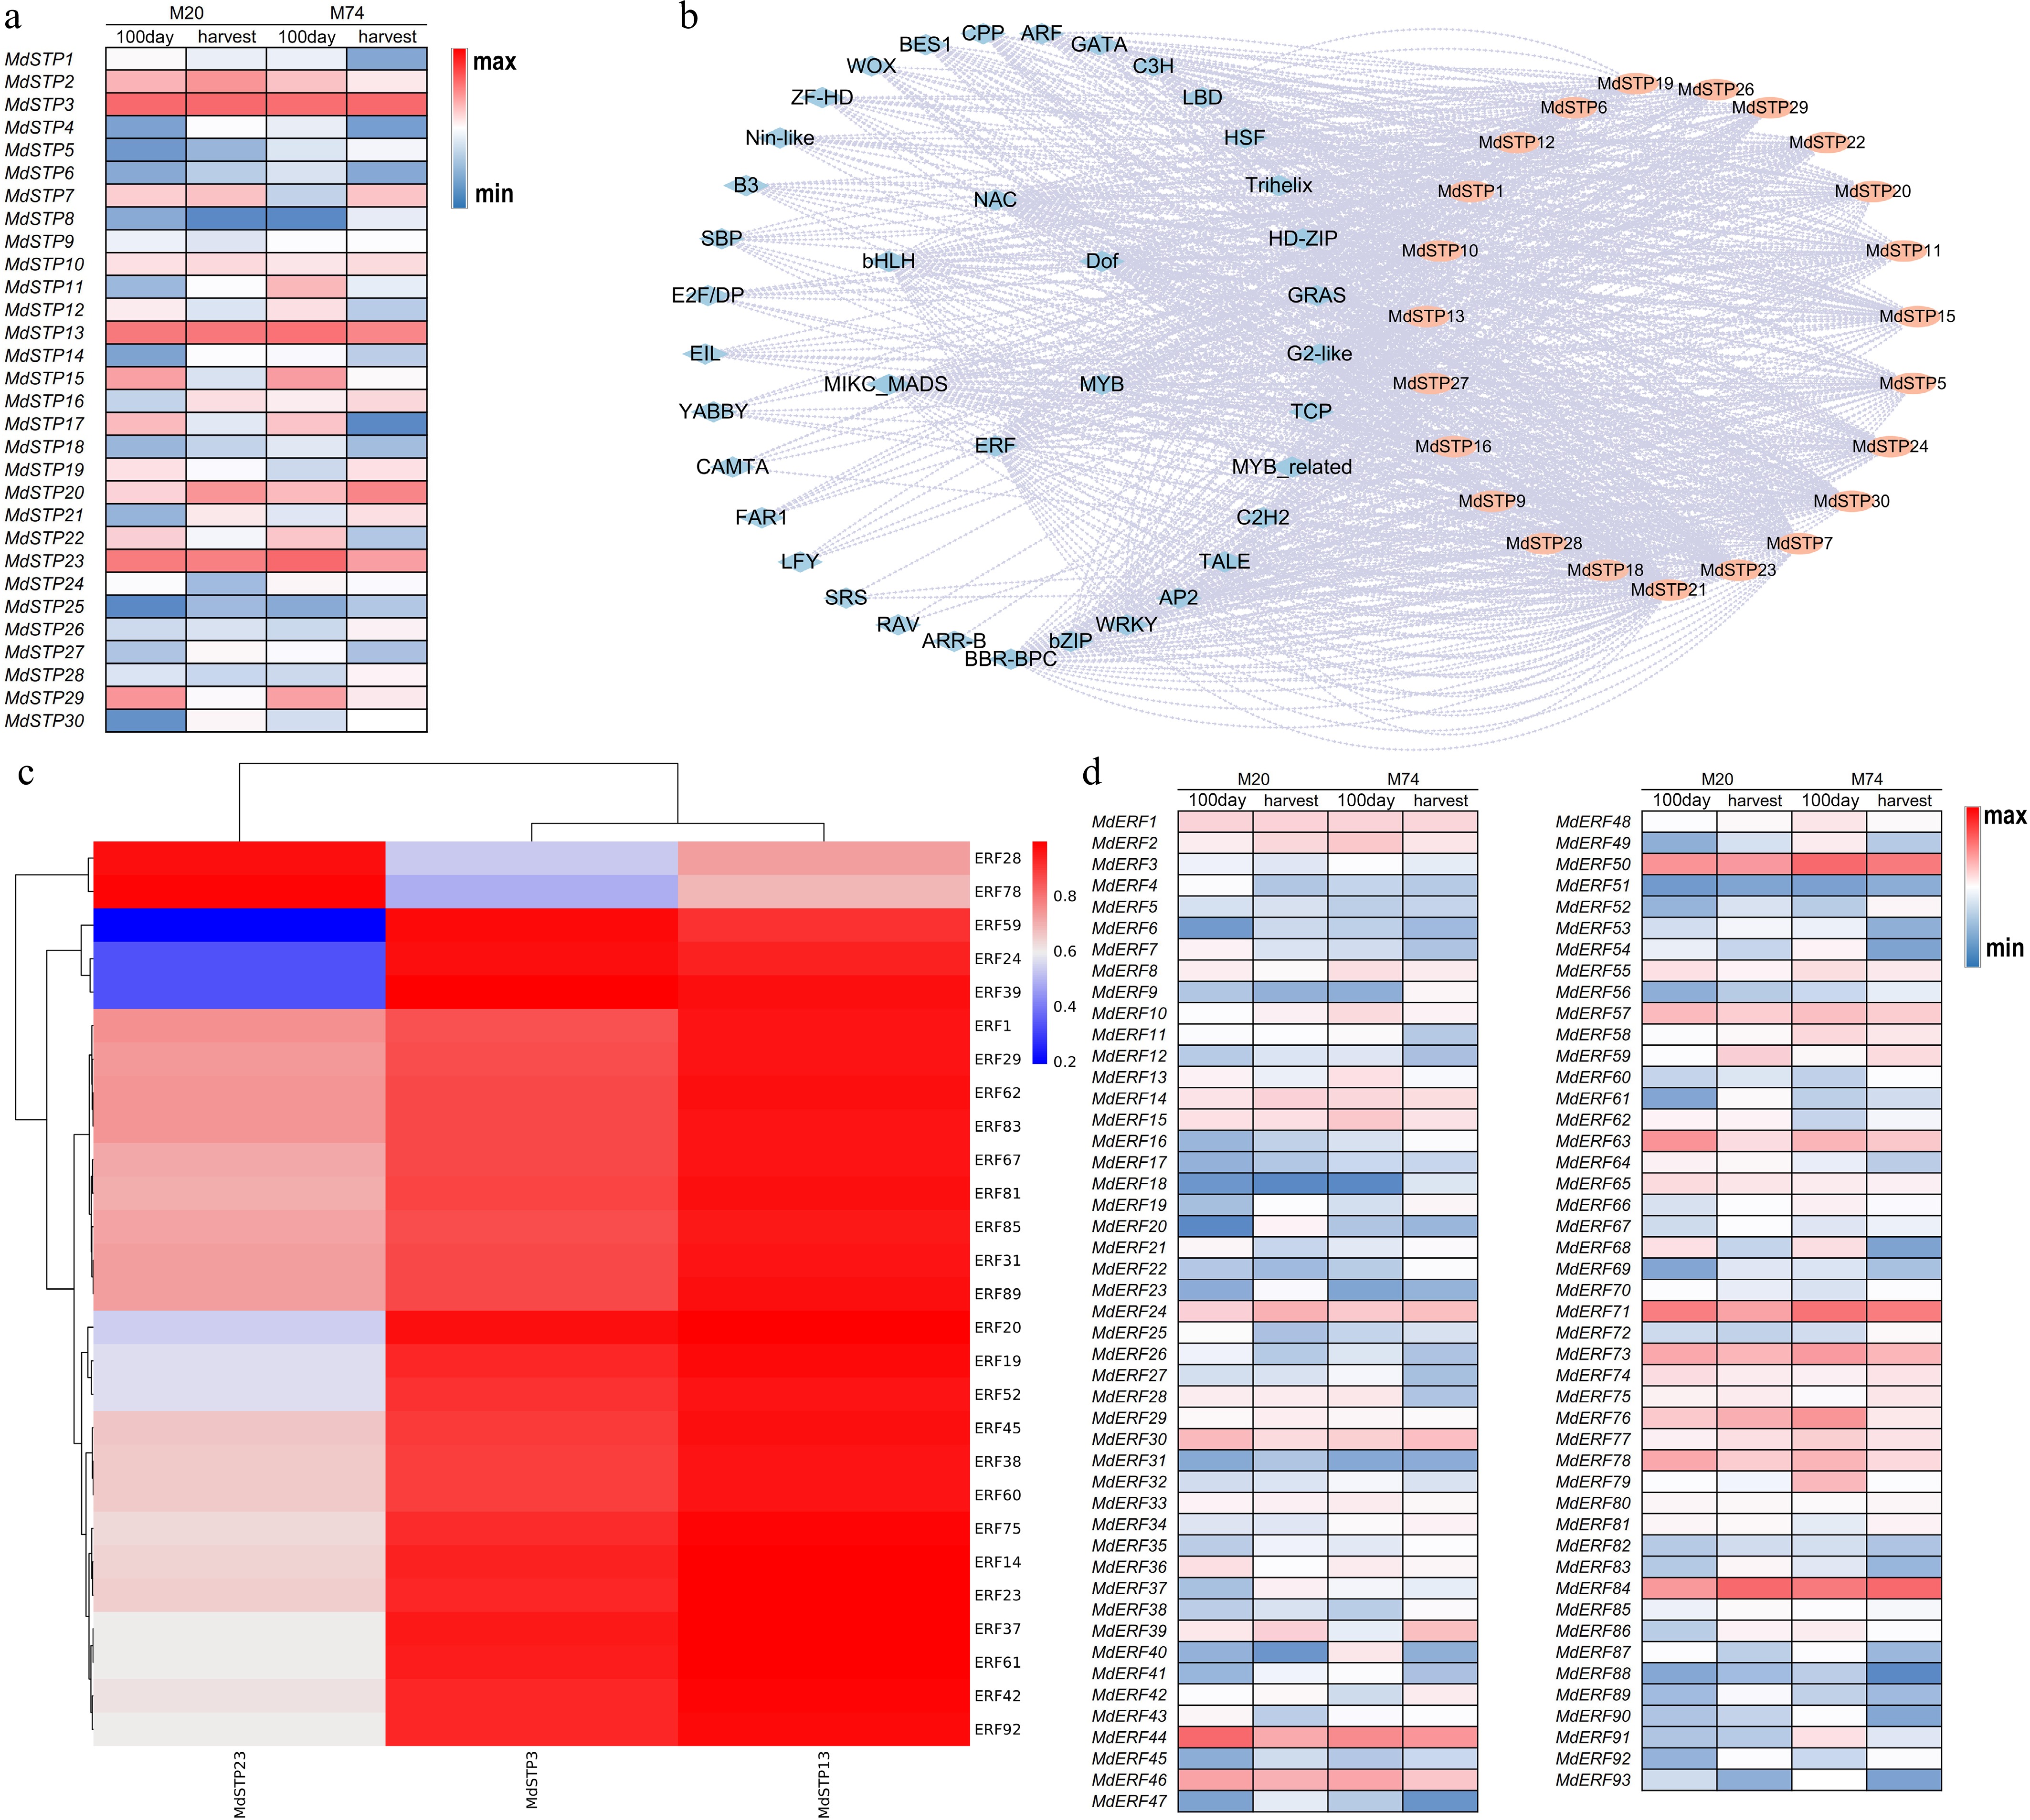
Figure 7.
The expression level of MdSTPs in fruits and its transcriptional regulatory mechanism. (a) Expression levels of MdSTPs in fruits. (b) Transcription factor regulatory network. (c) Correlation between the expression levels of MdERFs and MdSTPs. (d) Expression levels of MdERFs in fruits. In (a) and (d), '100 day' refers to 100 d post-flowering, while 'harvest' indicates the fruit ripening stage. The blue-white-red color gradient represents low-medium-high expression levels, respectively. The expression levels are comparatively analyzed based on the integrated data from both the horizontal and vertical axes. In (b), blue denotes transcription factors, while orange represents MdSTPs.
To verify whether the ERF transcription factor can activate the expression of the MdSTPs gene, this study utilized molecular docking to analyze the binding conformation between the AP2 domain of MdERF50 and the promoter of MdSTP13. The results (Fig. 8) show that the AP2 domain of MdERF50 (5'-VAGPPVKHRKQHRXKYAQNQEPSLLRGVYFKNMKWHAAIKVDKKQIHLGTVGSQEEAAHLYDRAAFMCGREPNFELSEEEKQELRKFKWDEFLVMTRHAITNKKHMRRQGAESEKRSESPQLEDSDWEDDXEEV-3') can bind to the 5'-GATAAAGAGAAGAAAAATGA-3' region of the MdSTP13 promoter, forming a total of 19 hydrogen bonds involving 14 amino acid residues. This suggests that MdSTPs are likely subject to transcriptional regulation by MdERFs.
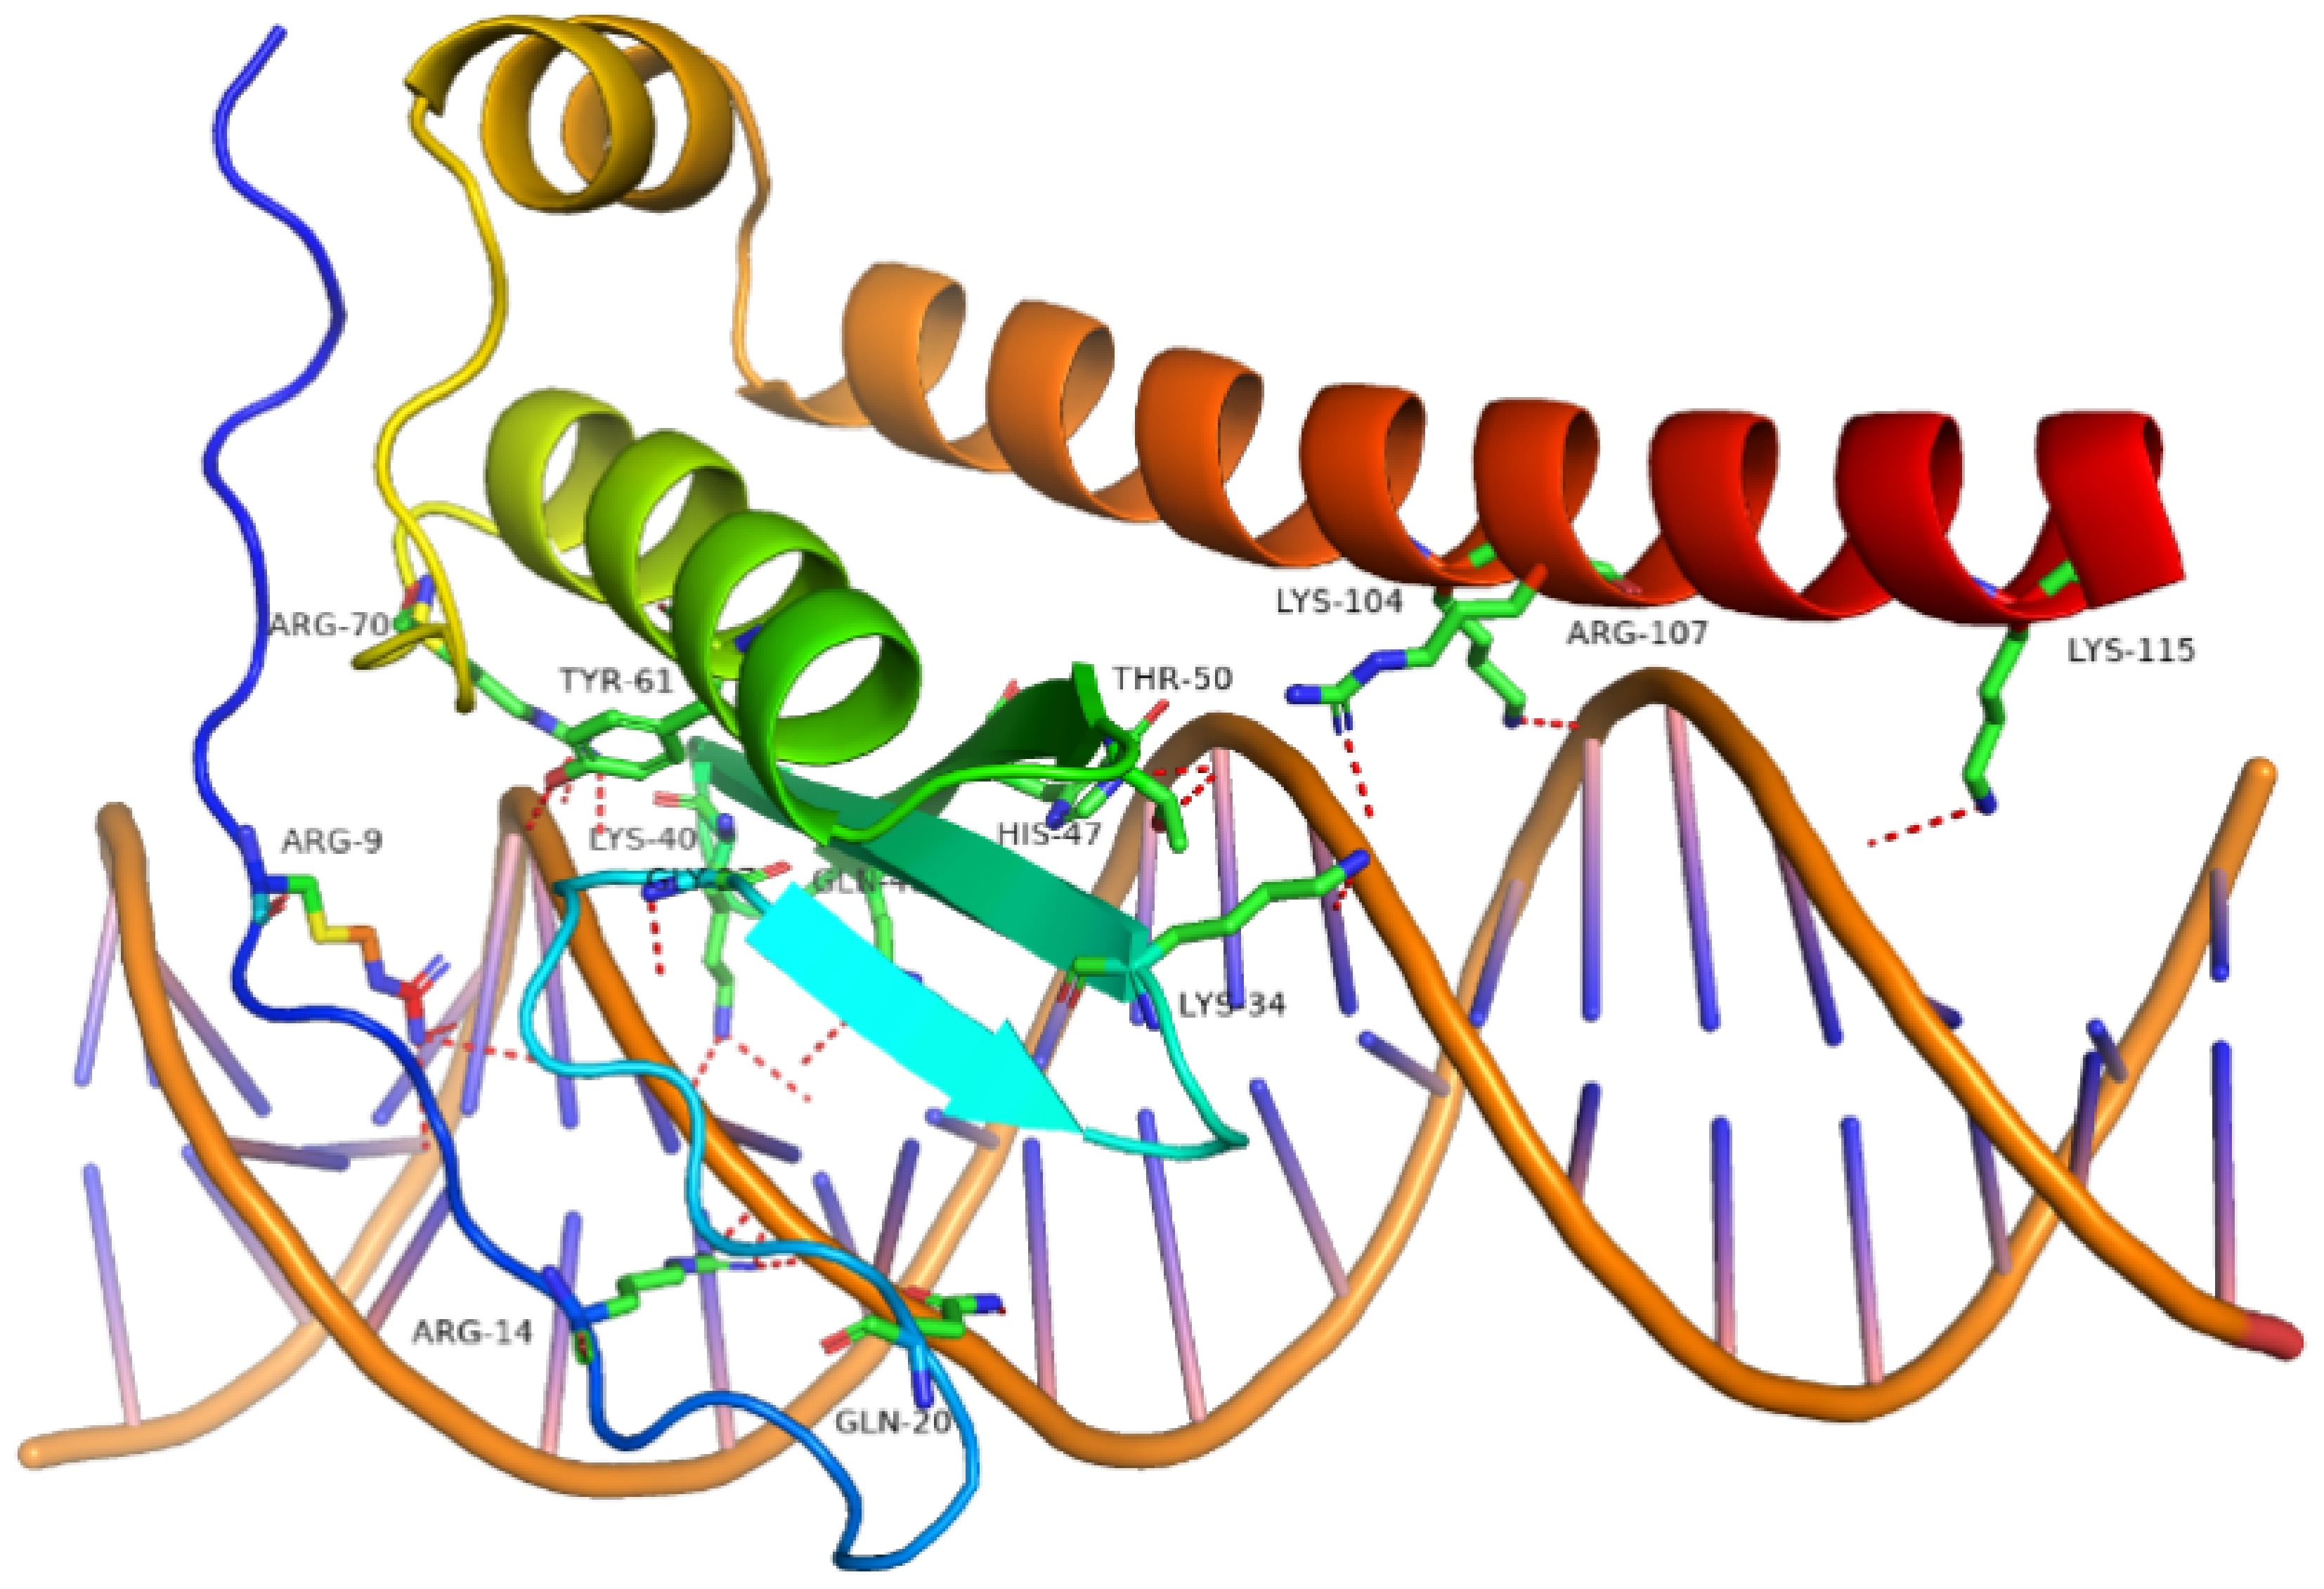
Figure 8.
The molecular conformation of the docking between MdERF and MdSTP13 promoter region. The red dashed lines indicate hydrogen bonds between the AP2 domain and the MdSTP13 promoter region.
Response analysis of apple STP gene family to different hormone stress
-
The response of 30 MdSTP family members to different hormone stresses was analyzed based on qRT-PCR. The results showed that apple STP family members had different expression levels of MdSTP when treated with IAA, ABA and GA for 4, 8, 12, and 24 h, respectively (Fig. 9). When STP family members were induced by IAA for 4 h, MdSTP8 and MdSTP26 were significantly up-regulated. Interestingly, when the MdSTP gene was induced by IAA at 8, 12 and 24 h, most of the genes were also significantly up-regulated, such as MdSTP2/9/16/17/18/21/22/26/27/28 genes. It is speculated that IAA is regulating the expression of STP family members. When STP family members were induced by ABA for 4 and 12 h, some genes were up-regulated, such as MdSTP10, MdSTP12, and MdSTP23. However, MdSTP8, MdSTP18 and MdSTP30 were all down-regulated after being induced by ABA at different times. When STP family members were induced by GA for 8 h, the expression of MdSTP1, MdSTP8, MdSTP29 and MdSTP30 were significantly up-regulated. When GA was induced for 4 h, MdSTP1, MdSTP6, and MdSTP18 were significantly down-regulated. At the same time, when GA was induced for 24 h, MdSTP18 was also significantly down-regulated.
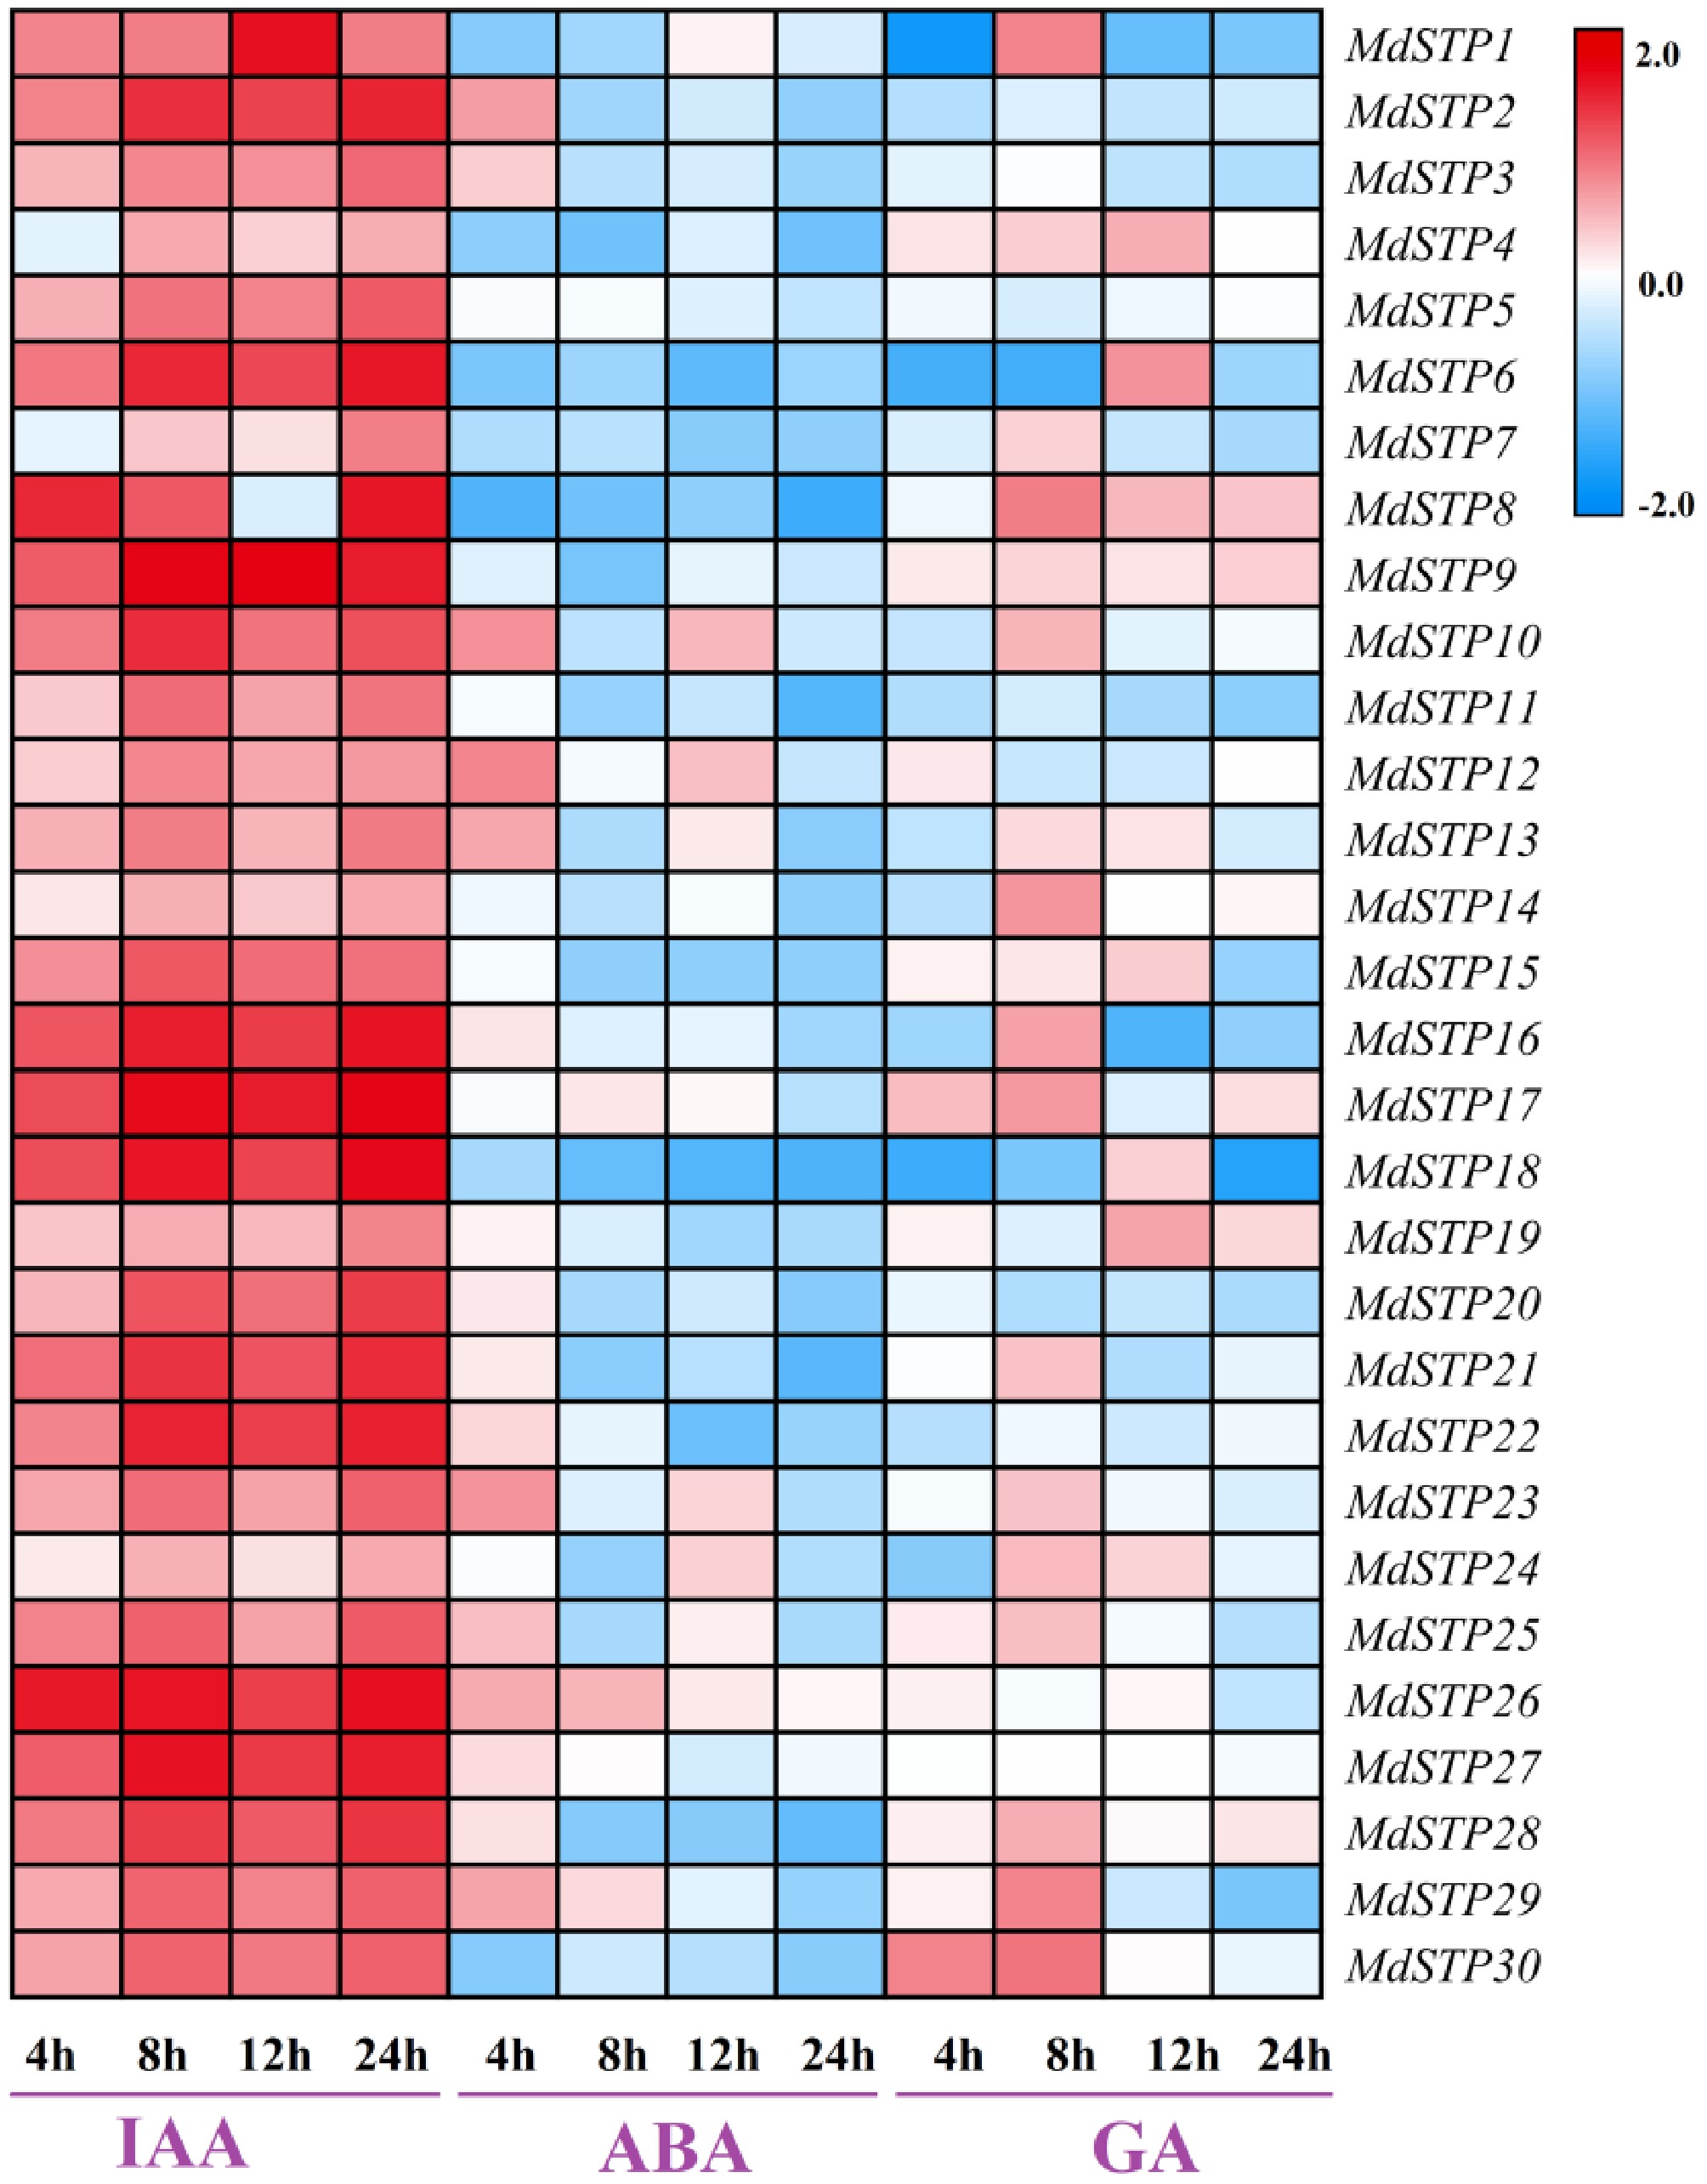
Figure 9.
Expression levels of MdSTPs gene under different hormone treatments. The horizontal axis represents different time points of plant hormone treatments, while the vertical axis indicates the relative expression levels of MdSTPs. The blue-white-red color gradient signifies low-medium-high gene expression levels, respectively. The expression levels are comparatively analyzed based on the integrated data from both the horizontal and vertical axes.
-
The STP gene family plays fundamental roles in regulating plant carbon allocation, floral organ development, crop yield, and environmental adaptation through its involvement in sugar transport processes[36,37]. While functionally conserved across species, this gene family exhibits nomenclature variations, being designated as MST in rice (Oryza sativa), HT in grape (Vitis vinifera), and HXT in sugarcane (Saccharum officinarum)[15,16,36]. Through comprehensive genome analysis using HMMER and BLAST algorithms, the study identified 30 STP family members in apple, which are unevenly distributed across ten chromosomes. Comparative genomic analysis revealed that apple possesses a notably larger STP gene family compared to other plant species, including Arabidopsis (14 members)[12], tomato (Solanum lycopersicum, 18)[28], cassava (Manihot esculenta, 20)[14], sweet orange (Citrus sinensis, 25)[38], Chinese cabbage (Brassica oleracea, 22)[39], grape[15], and pear (Pyrus bretschneideri, 20)[18], suggesting potential functional expansion and diversification in the apple genome.
Bioinformatic analysis revealed that all apple STP proteins contain the conserved Sugar_tr domain (PF00083), characteristic of the Major Facilitator Superfamily (MFS). Plant MFS transporters typically possess 12 transmembrane domains (TMD1−TMD12) organized into N-terminal (TMD1−TMD6) and C-terminal (TMD7−TMD12) segments[11]. The majority of these proteins comprise 400−600 amino acid residues with highly conserved N- and C-terminal regions, suggesting evolutionary derivation from an ancestral 6-TMD protein through duplication events[40]. Comparative structural analysis demonstrated that while 14 MdSTPs maintain the complete 12-TMD architecture, others exhibit domain deletions - most notably MdSTP25 with only five TMDs. This pattern of TMD loss, consistent with observations in sorghum, cassava, grape and tomato[11,14,15,28], indicates frequent N- or C-terminal domain deletion during STP family evolution. Gene structure analysis further revealed considerable exon number variation (1−6 exons, predominantly 2−4) among MdSTPs, mirroring patterns observed in Arabidopsis, grape and pear[11,12,15]. These structural variations likely arose through evolutionary exon/intron gain/loss events, contributing to functional diversification within the STP gene family.
The prediction of subcellular localization revealed that all 30 apple STPs are targeted to the plasma membrane, consistent with their established role in mediating monosaccharide uptake from the extracellular space into plant cells[13]. Structural analysis of the Arabidopsis AtSTP13 homolog suggests that membrane localization signals are primarily encoded in C-terminal motifs[41], leading us to hypothesize that Motif 2 and Motif 5 may represent core domains critical for plasma membrane targeting of apple STPs. Phylogenetic classification divided the apple STP family into seven distinct subfamilies, with Subfamily VI containing the highest representation (9 MdSTPs), followed by Subfamily V (5 members), while Subfamily VII showed no apple representatives. This phylogenetic complexity contrasts with the simpler four-subfamily organization observed in gramineous species, including Arabidopsis, chestnut and cassava[42], highlighting significant evolutionary divergence in STP family expansion and specialization between plant lineages.
Comparative analysis of STP gene expression reveals distinct organ-specific patterns across diverse plant species[8]. In Arabidopsis, AtSTP1 shows predominant expression in germinated seeds, seedlings, and guard cells[21,43], while AtSTP2/6/9/11 exhibit pollen-specific expression and AtSTP4 demonstrates root-preferential expression[44]. Citrus species display fruit-enriched expression of at least 9 CsSTPs[37], whereas tomato shows specialized patterns: SlSTP1 in young fruits, SlSTP3 exclusively in flowers and developing fruits, and SlSTP2 in leaves, branches, and developing fruits[28]. Our study of apple STPs identified: (1) 24 genes (excluding MdSTP3/4/7/10/13/23) with high expression in seedlings and seeds across varieties; (2) 27 genes (excluding MdSTP3/13/23) showing elevated expression in roots and stems of specific cultivars; and (3) a large number of MdSTP genes concentrated expression in M69 flowers, M74 young fruits, M14 leaves, and M20 mature fruits. These pronounced interspecies and interorgan expression differences strongly suggest STP genes play specialized roles in hexose accumulation, with apple MdSTPs likely contributing to carbohydrate partitioning in a tissue- and variety-specific manner.
The accumulation of sugars in fruits is a primary factor influencing their sweetness[45]. Typically, sugars are synthesized in the plant's photosynthetic tissues and then transported to fruits and other organs for storage via transport proteins[46,47]. This process involves multiple families of transporter proteins and is regulated by transcription factors[46]. The ERF transcription factor family is one of the largest in plants, participating in various biological processes[48]. Some experiments have confirmed the involvement of ERF transcription factors in the regulation of sugar accumulation in fruits[49,50]. Research on prunus armeniaca has revealed that two STP genes are significantly upregulated during fruit ripening, and this upregulation of STP expression appears to be associated with the increased expression of ERF10[26]. In this study, it was found that the expression levels of MdSTP genes exhibit significant differences during the ripening process and after harvest, suggesting that sugar accumulation in fruits is related to MdSTPs. The high expression of MdSTP3, MdSTP13, and MdSTP23 may be closely associated with sugar transport during the fruit expansion stage. Additionally, it was observed that MdSTPs are likely regulated by MdERFs. In the fruit, the expression levels of MdERFs are significantly positively correlated with the expression levels of MdSTPs. Molecular docking analyses between proteins and DNA confirmed that ERF can bind to the promoter regions of STP genes. Therefore, the study concludes that MdSTPs are involved in sugar accumulation during apple fruit ripening, and MdERFs positively regulate sugar accumulation in apple fruits.
Sugar transporters are more sensitive to changes in the concentration of extracellular monosaccharides, and their expression can be affected by biological and abiotic stresses, such as mechanical damage, nematode and bacterial infection, as well as hormone induction and sugar concentration regulation[41]. This means that the metabolic network that regulates sugar transporters is greatly affected by stimulus signals inside and outside the cell membrane. In order to identify the stress expression of hormones on apple MdSTPs gene, this study used 10 mmol·L−1 IAA, 50 mmol·L−1 GA, and 50 mmol·L−1 ABA to treat the leaves of apple tissue culture seedlings for 0, 4, 8, 12 and 24 h, respectively. The results showed that the MdSTPs gene was induced by IAA at different times, and there was no down-regulated expression of the MdSTPs gene. This study speculates that the MdSTPs gene is involved in the positive regulation process induced by IAA stress, which is consistent with the identification results of potato sugar transporter[51]. In sorghum, SbSTP5 is highly expressed in roots induced by ABA, and SbSTP4 is highly expressed in stalks induced by ABA[11]. In sugarcane, the expression of HXT2 is down-regulated after being stressed by ABA. When HXT12 is under the stress of ABA, although the induction time is different, the expression of HXT12 is up-regulated[26]. In this study, when the MdSTPs gene was induced by ABA at different times, some genes were up-regulated, and the other genes were down-regulated. At the same time, the most up-regulated genes, such as MdSTP2/3/10/12/13/23/29, etc., occurred at 4 h after ABA induction. It is speculated that these genes may be involved in the adversity response caused by ABA, and their function is strongest at 4 h. Zhang et al.[26] showed that after the sugarcane HXT gene was treated with GA at different times, the expression of different HXT genes was different, and the expression of HXT2 gene was up-regulated in sugarcane leaves after 24 h GA treatment. In this study, when MdSTP family members were induced by GA for 8 h, MdSTP1, MdSTP8, MdSTP29 and MdSTP30 showed up-regulated expression. MdSTP1, MdSTP6, and MdSTP18 showed down-regulated expression at 4 h of GA induction, and the most up-regulated genes occurred at 8 h of induction. It is speculated that these genes are most sensitive to GA treatment for 8 h, and they will play an important role at 8 h.
-
Through integrated bioinformatics and qRT-PCR approaches, comprehensive genome-wide identification and hormonal regulation analysis of the apple STP gene family was conducted. Our results demonstrate that the 30 identified MdSTPs phylogenetically cluster into seven distinct subfamilies exhibiting high structural conservation within each subgroup. Tissue-specific expression profiling revealed predominant STP activity in seeds, seedlings, roots, and stems, with MdSTP3/13/23 emerging as key regulators of sugar accumulation during fruit ripening. Furthermore, this study established that MdERF transcription factors may positively regulate sugar accumulation process. qRT-PCR analysis showed that 30 MdSTP family members responded differently to IAA, GA and ABA stress induced at different times, and IAA positively regulated the expression of STP genes. These findings collectively provide novel insights into the structural evolution, spatial expression patterns, and hormonal regulation of STP-mediated sugar transport in apple.
-
The authors confirm their contribution to the paper as follows: study conception and design: Guo Z, Cao X; data collection: Guo Z, Zou Y, An X; analysis and interpretation of results: Guo Z, Zou Y, Zhou Y; draft manuscript preparation: Guo Z. All authors reviewed the results and approved the final version of the manuscript.
-
All data generated or analyzed during this study are included in this published article and its supplementary information files.
-
The authors would like to express their sincere gratitude to Mr. Jianwei Qi from Gansu Agricultural University for his invaluable guidance on the methodological aspects of this study.
-
The authors declare that they have no conflict of interest.
- Supplementary Table S1 qRT-PCR primers of STP genes in apple.
- Supplementary Table S2 The specific position of MsSTPs on chromosome.
- Copyright: © 2025 by the author(s). Published byMaximum Academic Press, Fayetteville, GA. This articleis an open access article distributed under Creative CommonsAttribution License (CC BY 4.0), visit https://creativecommons.org/licenses/by/4.0/.
-
About this article
Cite this article
Guo Z, An X, Cao X, Zou Y, Zhou Y. 2025. Genome-wide identification and expression analysis of STP gene family in Malus domestica. Fruit Research 5: e028 doi: 10.48130/frures-0025-0020 

Genome-wide identification and expression analysis of STP gene family in Malus domestica
- Received: 27 December 2024
- Revised: 03 April 2025
- Accepted: 10 April 2025
- Published online: 22 July 2025
Abstract: The sugar transporter protein (STP) gene family serves a pivotal role in monosaccharide translocation, plant growth, and developmental processes. Utilizing the Arabidopsis thaliana STP gene family as a reference, comprehensive analyses were conducted on apple (Malus domestica) STP genes, encompassing sequence alignment, physicochemical characterization, gene structure organization, conserved motif identification, and tissue-specific expression profiling. Quantitative real-time PCR (qRT-PCR) was employed to investigate the hormone-responsive expression patterns of the apple STP gene family. A total of 30 STP genes were identified, encoding polypeptides ranging from 235 to 655 amino acids in length. Gene structure analysis revealed variations in exon number and positional distribution among different STP genes, indicative of functional diversification. Cis-regulatory element analysis demonstrated the presence of core promoter elements, enhancer sequences, and regulatory motifs associated with hormone signaling, abiotic stress responses, organ-specific expression, and light regulation. Microarray-based expression profiling indicated that the majority of STP genes exhibited preferential expression in seeds, seedlings, roots, and stems. Notably, MdSTP3, MdSTP13, and MdSTP23 were identified as the predominant isoforms expressed in apple fruits, with their transcriptional activity being positively modulated by MdERF transcription factors. qRT-PCR validation further elucidated the differential responsiveness of the 30 MdSTP genes to indole-3-acetic acid (IAA), gibberellic acid (GA), and abscisic acid (ABA) treatments, with IAA exerting a pronounced upregulatory effect on STP gene expression. Collectively, these findings underscore the functional heterogeneity of the apple STP gene family in terms of tissue-specific expression and hormonal regulation, thereby providing a robust foundation for elucidating the molecular mechanisms underlying STP-mediated growth and developmental processes in plants.
-
Key words:
- Apple /
- Sugar transporter /
- Phylogenetic analysis /
- Expression profiling /
- Ethylene response factor