


-
Hybridization is a well-known phenomenon in nature, and plays an important role in plant evolution, adaptation, and new species formation, as a critical mechanism of genetic variation[1,2]. Hybridization can produce new phenotypes and genotypes through transgressive segregation[3], and these new phenotypes and genotypes could increase genetic diversity and provide abundant germplasm resources for breeding.
Fruit is the unique reproductive organ of angiosperms and is a significant success in their evolution. It is extremely important for the sexual reproduction of plants, and determines plant adaptation, survival, and reproduction. As the key driving factors, fruit color drives species adaptive differentiation in multi-level ecological genetic feedback through reproductive isolation, geographical expansion, and even macroscopic evolutionary patterns[4,5], therefore, the role of fruit-colour variation in species diversification has long been of interest in plant evolution and phylogeny[6]. In the evolutionary process, the characteristic of fruits have been differentiated, and multiple fruit types have emerged that can adapt to complex environments, including the diversity of fruit colors[7,8]. In addition, fruit color is the first sensory perception of fruits and is the commercial value of fruits; therefore, it is a key focus target trait in breeding.
Most fruit colors depend on the content and type of anthocyanins and carotenoids, and some other phytochemicals or metabolites which are beneficial for human health[9]. Therefore, the fruit color determines the flavor and functional value of the fruit. Most fruit colors are basically determined by the substance content and their ratio, such as anthocyanins, flavonoids, and carotenoids. The type and content of anthocyanins give the fruit colors such as red, blue, and purple, while carotenoids give the fruit colors such as yellow, red, and orange[9]. The diversity of fruit colors is the result of the comprehensive presentation of plant pigments, and differences in the types of these three pigment substances can also occur between different germplasms of the same plant species[10]. In addition, transcription factors could regulate color-related gene expression, and affects the formation of fruit color by binding to the promoter regions of related genes, activating or inhibiting gene expression. For instance, MYB transcription factors play an important regulatory role in the synthesis and accumulation of anthocyanins, carotenoids, and chlorophyll[11−13]. Like MYB, NAC regulate the synthesis and accumulation of anthocyanins and other pigments[14], MADS-box participate in the metabolic regulation of carotenoids and chlorophyll[15], and WRKY play a role in anthocyanin and carotenoid biosynthesis[16].
Lycium barbarum and Lycium ruthenicum Murr. are two major species of Lycium genus in the Solanaceae family. L. barbarum has been used as valuable medicinal herb for thousands of years due to its abundant bioactive compounds[17]. L. ruthenicum has been treated as a traditional Tibetan medicine, it was developed as a nutrient food in recent years due to its high anthocyanin content and antioxidant activity[18]. The fruit of L. ruthenicum is black or dark purple, while the fruit of L. barbarum is bright red or yellow. The different fruit colors are mainly attributed to the content and ratio of anthocyanins, flavonoids, and carotenoids[19−21]. Previous research found that the high content of carotenoids, mainly composed of zeaxanthin, was accumulated in the red fruit of L. barbarum, but not found in the fruit of L. ruthenicum[22].
A previous study found that flavonoids are the most important compounds in wolfberry fruit, phenylalanine ammonialyase (PAL), chalcone synthase (CHS), and flavonone 3-hydroxylase (F3H) are three key genes in the accumulation of flavonoids. Anthocyanin biosynthesis, flavonoid biosynthesis, and phenylpropane biosynthesis are the three main pathways related to flavonoid biosynthesis in wolfberry[23]. Previous research has laid the foundation for the metabolite characteristics of different wolfberry fruit colors, but there are still a few scientific problems that need to be further studied and resolved: the molecular mechanism of different fruit color formation; the influence of color differences on fruit flavor; and the effect of different colored fruits on plant resistance. In the field investigation, it was found there are sympatric distribution areas of L. ruthenicum and L. barbarum, and most individuals in this region show a variety of phenotypes in tree shape, leaf, and fruit, some individuals are similar to L. ruthenicum, some are similar to L. barbarum, and some showed interspecific types of the two species[24]. Based on the phenotype and SSR marker, it was revealed there are low level gene flow between these two Lycium species. According to the research, the majority of gene flow and introgression was mediated by the backcrossing of hybrids with the two parents, the interspecific type of the two species are hybrids and descendants generated after back-crossing[25]. Although the plant type, leaf shape, and fruit shape are diverse, there are four major types of fruit colors: black, dark red, yellow, and yellow_spots (Fig. 1). These wild germplasms with multiple fruit colors accumulate rich genetic resources during long-term adaptation to environmental changes, which is the rich material basis for the innovation of the wolfberry germplasm. Based on the theoretical significance of hybrid progeny in the study of evolution, and the new species formation, as well as the application value in breeding, these natural hybrids and phenotype variation provides ideal materials for species formation, interspecific hybridization, and new variety cultivation of Lycium.
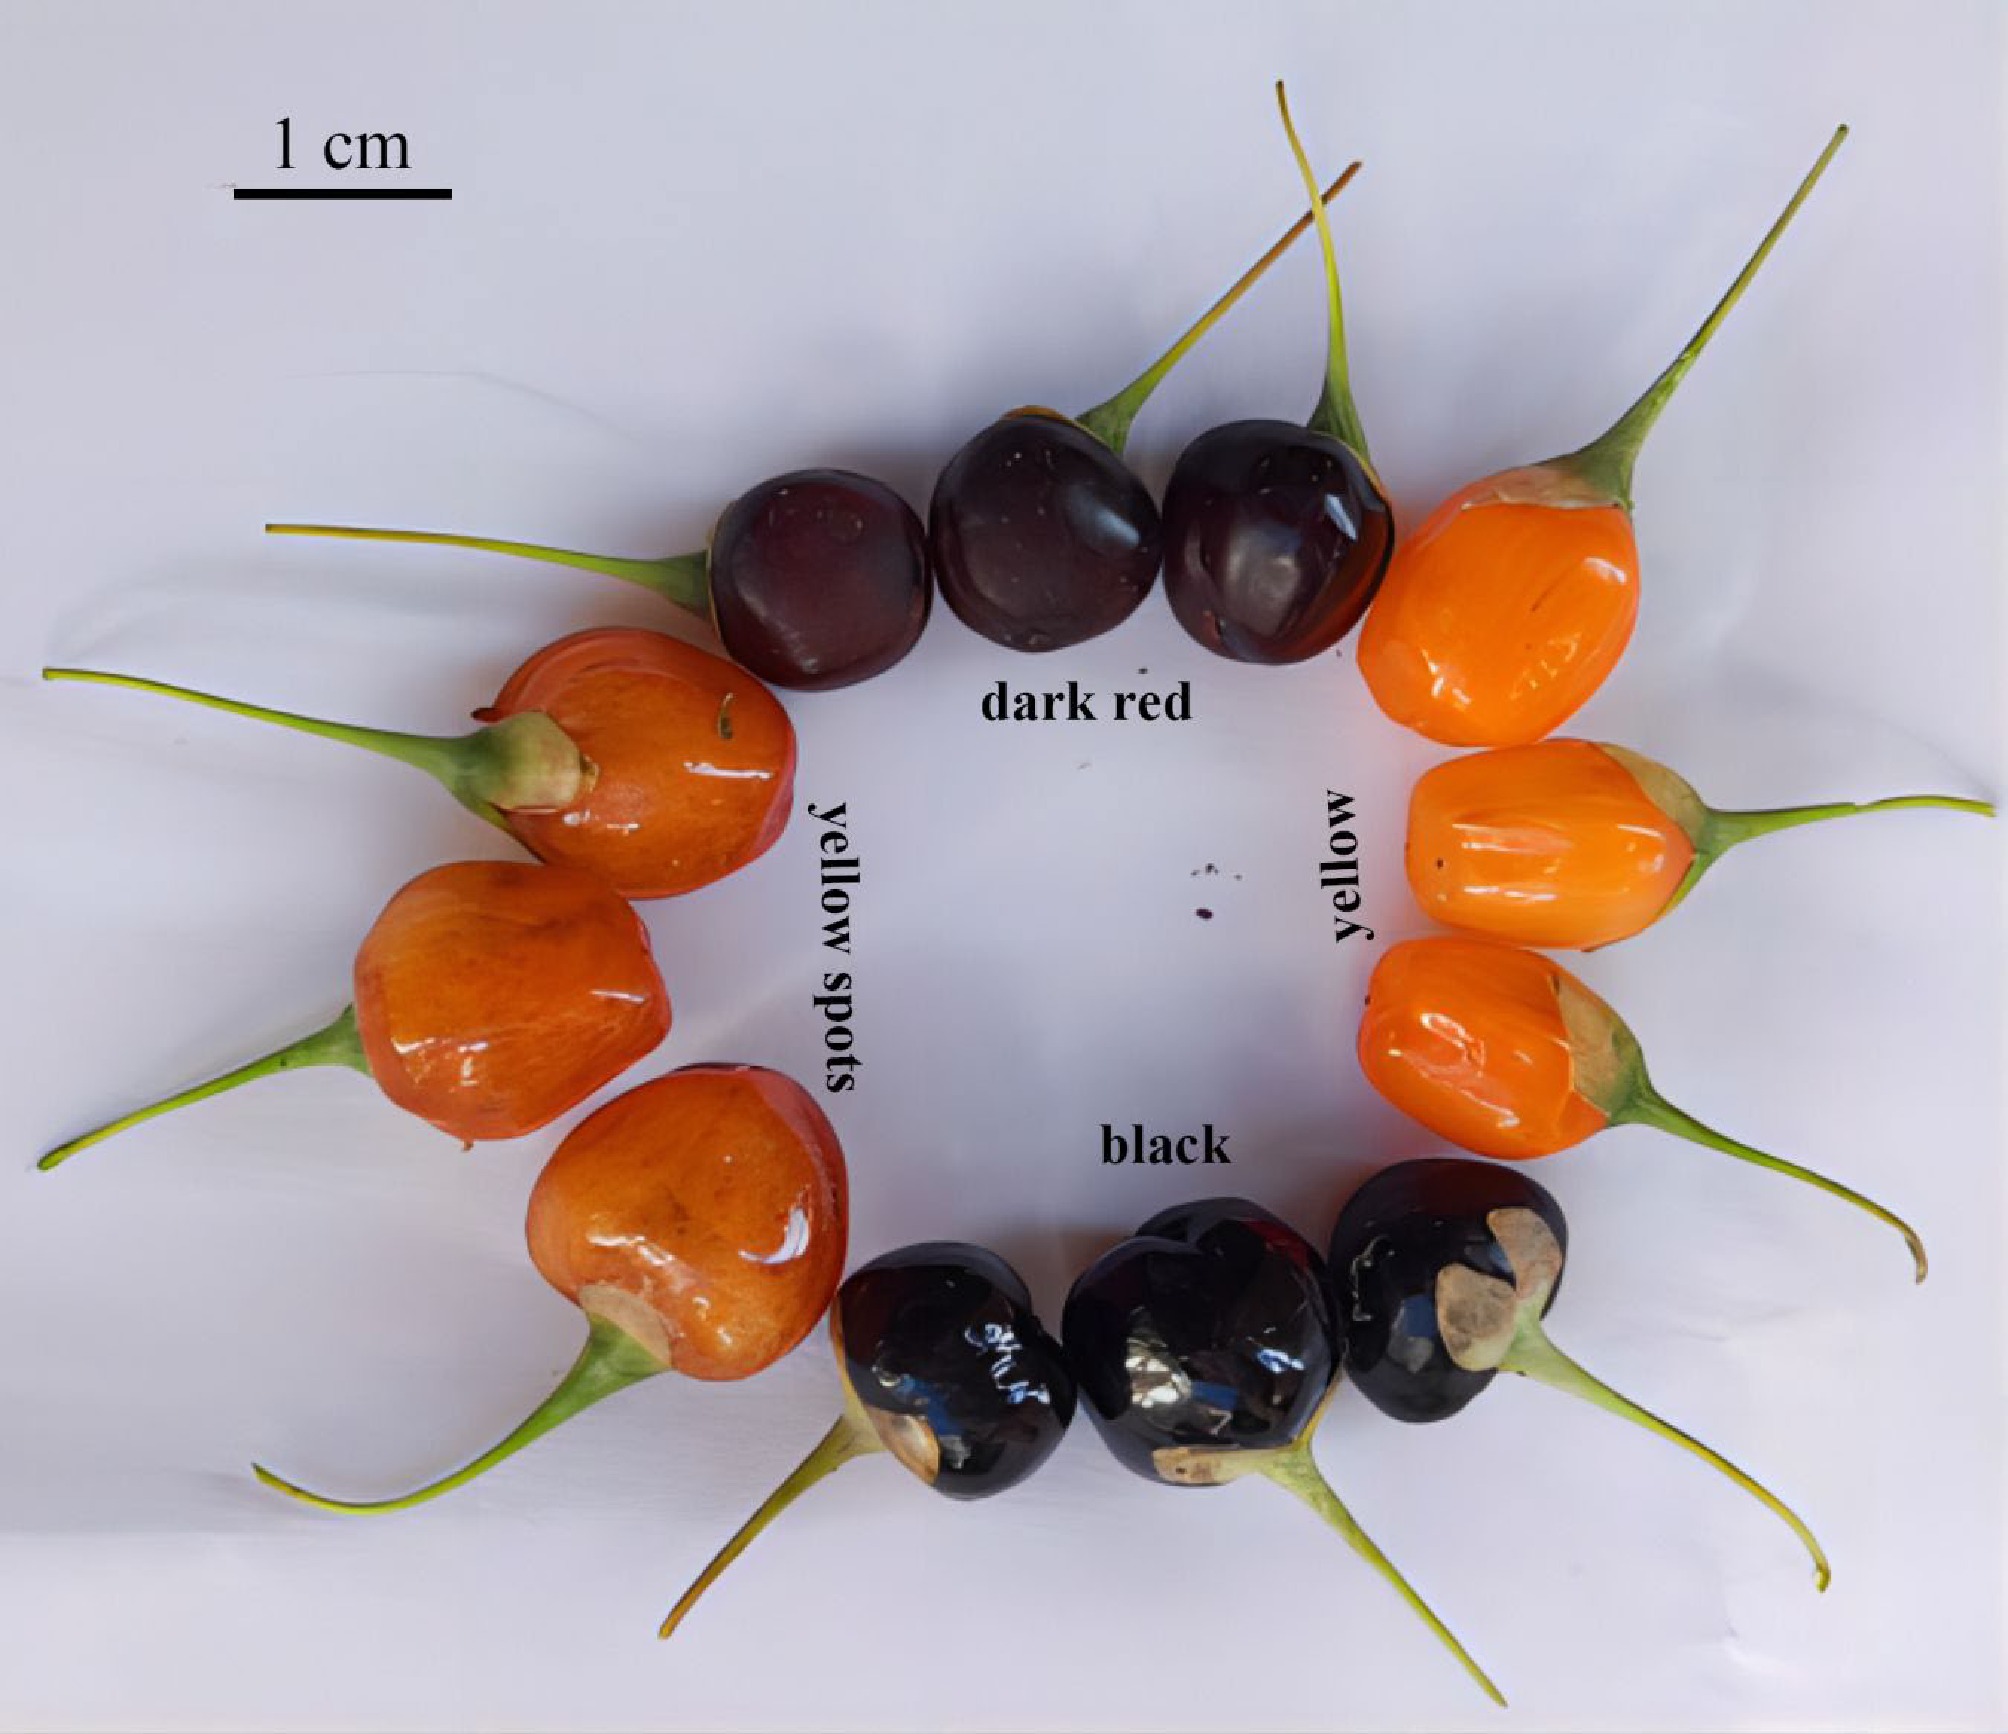
Figure 1.
The four fruit colors of hybrids collected in the field.
In the present study, metabolism detection was combined with transcriptome sequencing to uncover the major mechinism that regulate fruit color of the four types of hybrids, and further reveal the relationship between different fruit colors and flavors in lycium, even other horticulture plants. These studies could help to reveal the mechanism for the evolution, new species formation, and phylogenetics of Lycium species, and illustrate the possible mechanism of interspecific hybridization and introgression on the color formation of offspring, as well as new variety cultivation of Lycium.
-
Four types of colored fruits were collected from a sympatric region mentioned in our previous research in August 2022[25]. All fruit samples were free from pests and diseases and fully mature to ensure they are all in the same developmental stage, and physiological time. For each type of fruit, three replicates for each group were prepared for transcriptome and four replicates of each group for metabolites detection[26]. All collected fruit samples were stored in liquid nitrogen for the following experiments. Sample collection was approved by the local forestry department.
Metabolite profiling analysis
Metabolite extraction and HPLC-MS/MS analysis
-
LC-MS/MS analyses were conducted using ExionLC™ AD system paired with a QTRAP® 6500+ mass spectrometer (SCIEX, Framingham, MA, USA). Sample pretreatment methods, instrument conditions, identification, and quantification of metabolites were performed as the company's standard procedures outlined in previous research[27].
Metabolite identification, quantification, and data analysis
-
The HPLC-MS/MS data files were processed with SCIEX OS (Version 1.4) for peak integration and correction, with primary parameters set as follows: a minimum peak height of 500, a signal-to-noise ratio of 5, and a Gaussian smoothing width of 1[28].
All detected metabolites were annotated based on the Kyoto Encyclopedia of Genes and Genomes (KEGG), Human Metabolome Database (HMDB), and LipidMaps databases[29]. Principal component analysis (PCA), and partial least squares discriminant analysis (PLS-DA) were conducted at MetaX[30].
Univariate analysis (t-test) was used to calculate the statistical significance (p-value)[31]. Metabolites were classified as differential accumulated metabolites (DAMs) according to the criteria of Variable Importance in the Projection (VIP) > 1, p-value < 0.05, and fold change ≥ 2 or ≤ 0.5[32]. The clustering heat maps were generated using the pheatmap package in R language by applying z-score normalization to the peak areas of DAMs.
RNA extraction, detection, and assessment
-
Total RNA of four types of fruit was extracted using TaKaRa MiniBEST Plant RNA Extraction Kit (TaKaRa, Dalian, China). The quantification and qualification of RNA were assessed in a Bioanalyzer 2100 system (Agilent Technologies, CA, USA), combined with agarose gel electrophoresis.
Library construction for transcriptome sequencing
-
The transcriptome sequencing library was constructed according to the protocol of TruSeq™ RNA sample preparation kit from Illumina (San Diego, CA, USA). The library was quantified by Qubit2.0 Fluorometer (Invitrogen, USA). After quantification, the sequencing was performed in the NovaSeq 6000 (2 × 150 bp read length)[33].
Data analysis
Quality control, mapping, and novel transcripts prediction
-
High quality clean data were obtained after quality control, including low-quality read removal, adapters, and N base sequences discarded. The clean reads were mapped to the reference genome of Lycium (GenBank assembly Accession No.: GCF_019175385.1-RS_2023_10) using Hisat2 v2.0.5[34]. Novel transcripts were predicted by StringTie (v1.3.3b) in a reference-based approach based on a novel network flow algorithm.
Gene expression assessment and differential expression enrichment
-
Gene expression levels were analyzed based on the FPKM (Fragments Per Kilobase of transcript sequence per Million base pairs) value that was calculated according to the gene length and read counts mapped to genes in the Lycium genome by featureCounts v1.5.0-p3[35].
Gene expression levels were detected using the DESeq2 R package (1.20.0), with the parameter set as p-value ≤ 0.05. All of the differentially expressed genes (DEGs) were enriched in Gene Ontology (GO), and KEGG pathway based on clusterProfiler R package, the parameter set as p-value ≤ 0.05[36].
Correlation network analysis of the metabolome and transcriptome
-
Pearson correlation coefficients (PCC) of the correlated DEGs and DAMs in each of the comparisons were calculated according to their quantitative values using R (
www.r-project.org ). The top five DAMs and top ten DEGs were selected to draw the metabolic and transcriptional correlation network based on the mixOmics R package.Quantitative real-time PCR (qRT-PCR) validation for the transcriptome profile
-
The cDNA was synthesized with the PrimeScriptTM RT Master Mix (TIANGEN, China) at 37 °C for 15 min, followed by 85 °C for 5 s. The qPCR validation was validated with the 2−ΔΔCᴛ method with a total volume of 20 μl containing 0.4 μl cDNA, 10 μl of TB Green Premix Ex Taq II (Tli RNaseH Plus)(2X)(TaKaRa, China), and 0.6 μl primer. The amplification program was set as follows: 95 °C for 15 min, 50 cycles of 10 s at 95 °C, and 32 s at 60 °C. All biological replicates were analyzed in triplicate. The cDNA synthesis and qPCR validation were performed in a CFX Connect Real-time PCR Cycler (Bio-Rad, USA). All of the amplicons that presented a single melt curve peak were selected, the primer information is shown in Supplementary Table S1. GAPDH and LbCML38 were used as endogenous controls according to previous research in Lycium[37,38].
-
A total of 993 metabolites were detected from four types of fruit, and these metabolites were divided into 20 categories, including 182 amino acids and their derivatives (18.33%), 126 flavonoids (12.69%), 101 carbohydrates and their derivatives (10.17%), and so on (Fig. 2a).
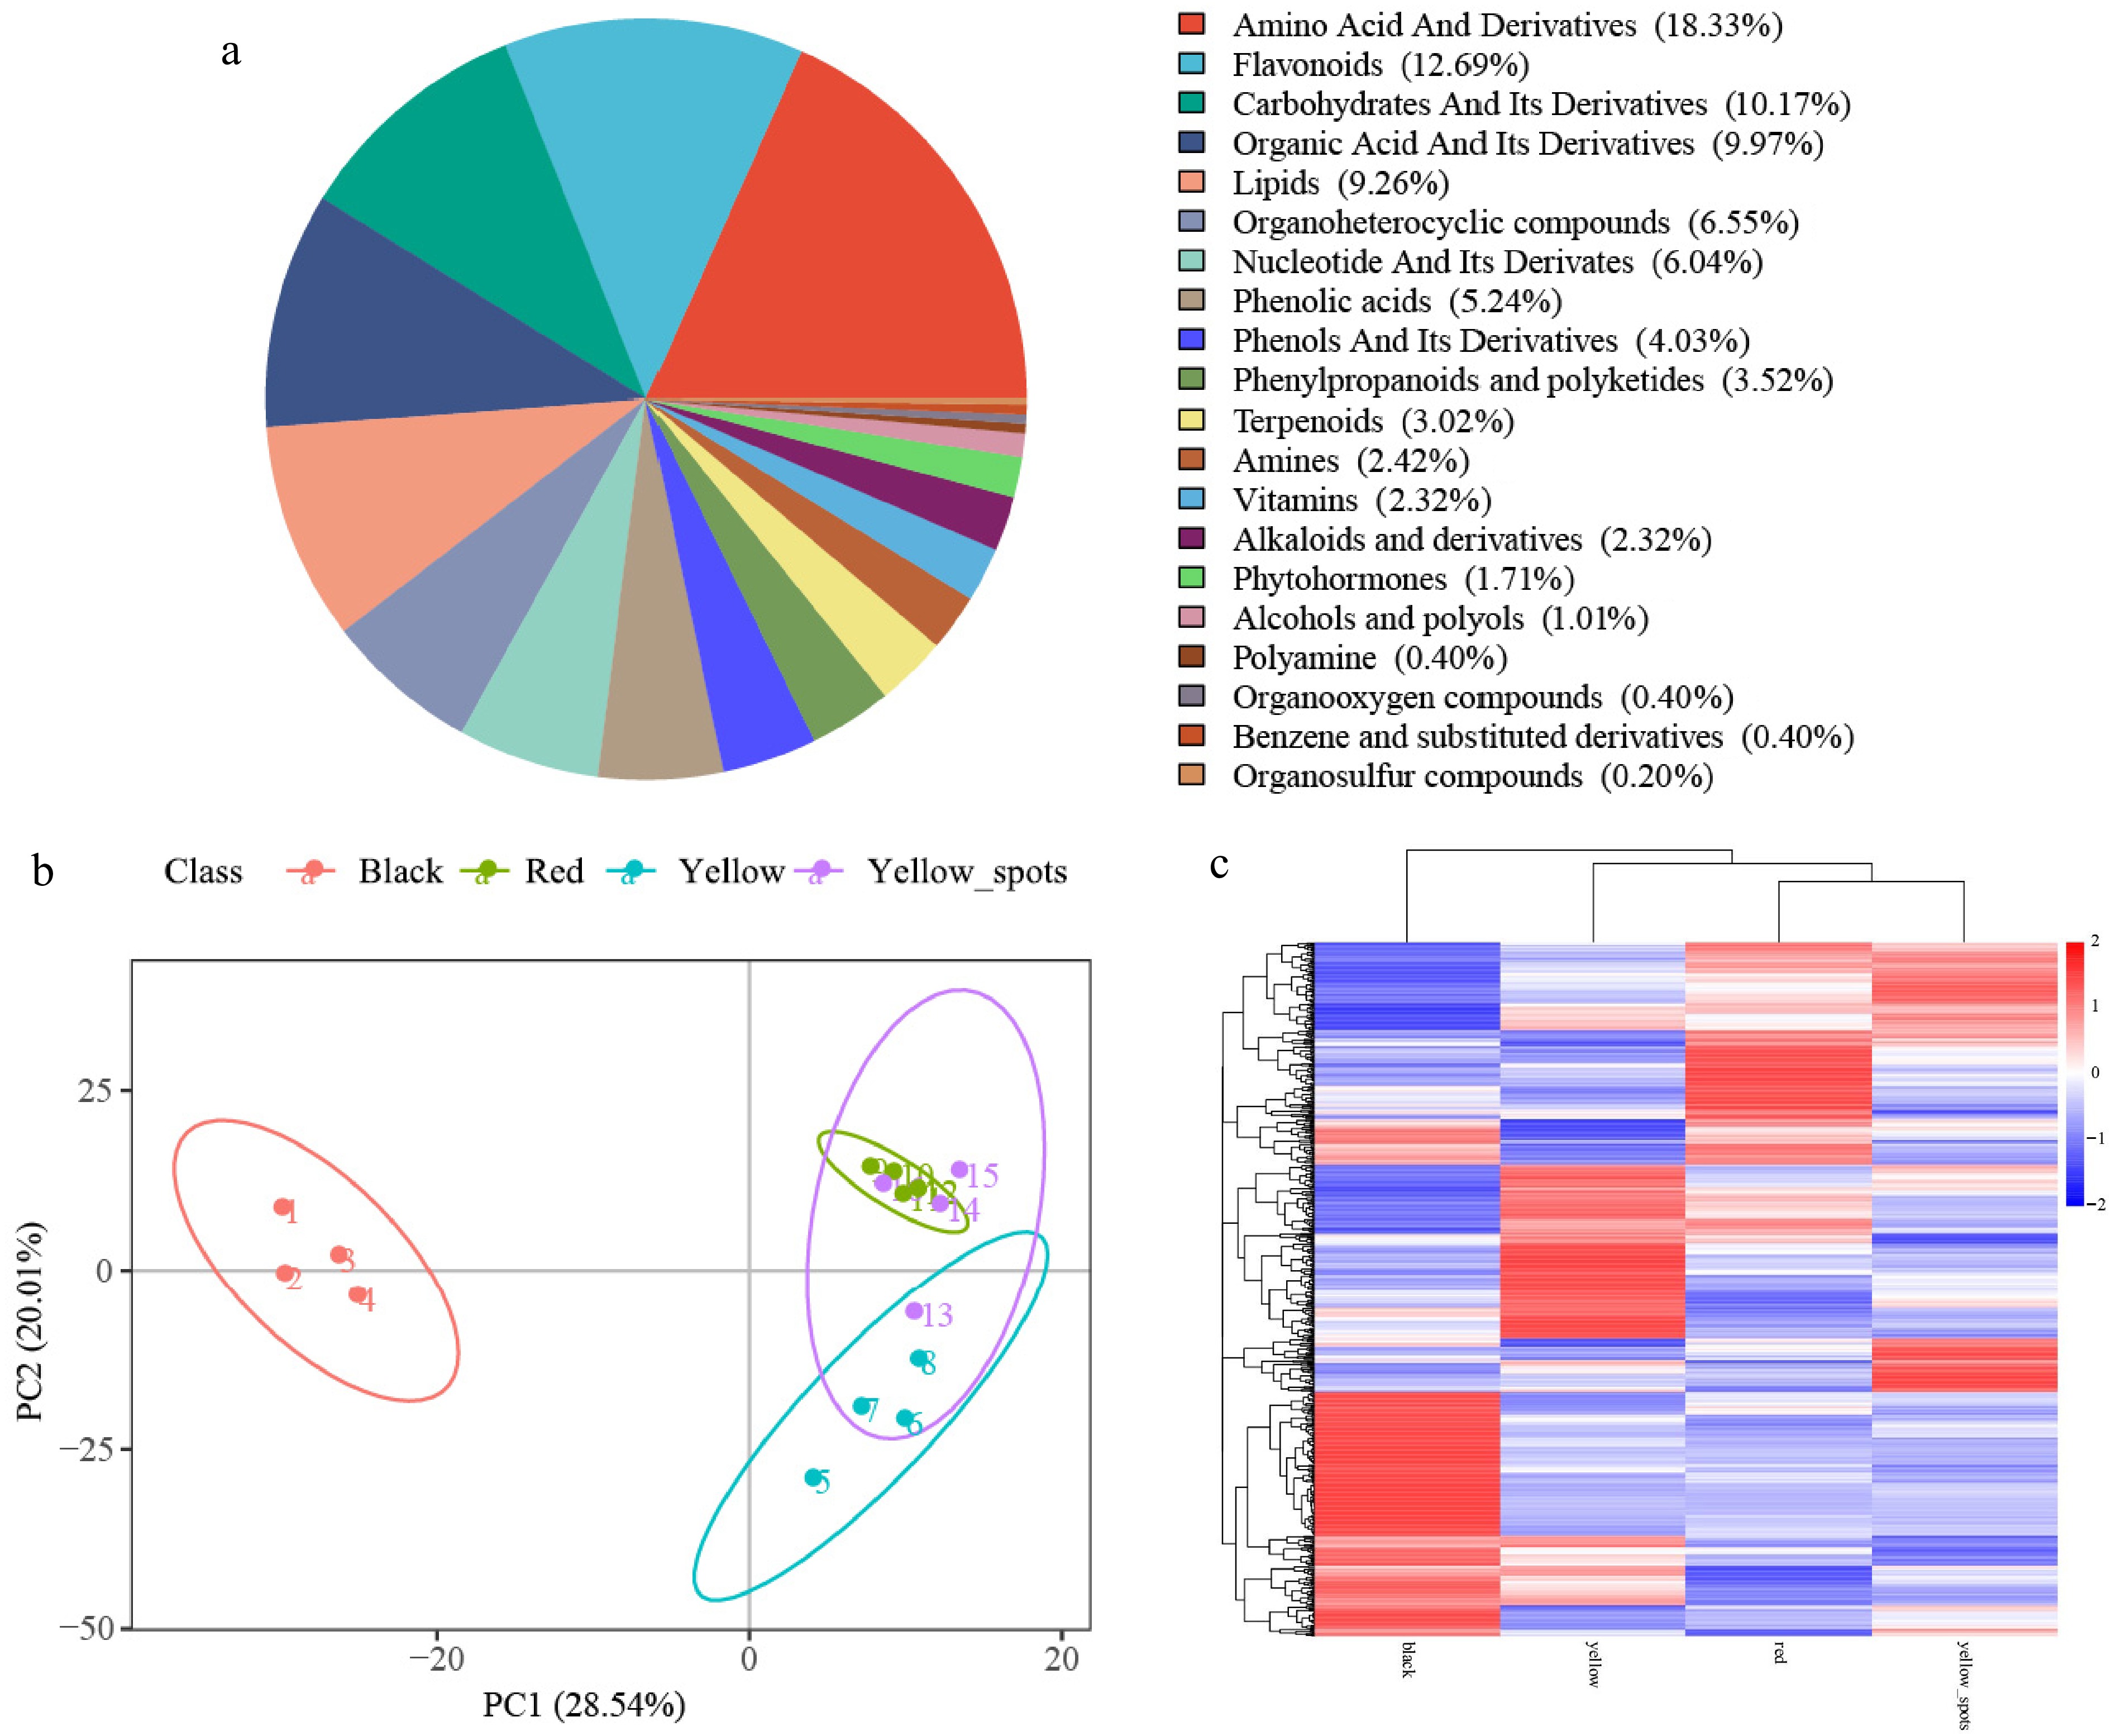
Figure 2.
Metabolomic profiling of four fruit types. (a) Pie chart of metabolite class distribution. (b) PCA analysis of metabolites. (c) Heatmap of all detected metabolites.
All the biological replicates of the four fruit types were grouped, indicating a high reliability of the generated metabolism (Fig. 2b). PC1 and PC2 represented 28.54% and 20.01% variation, respectively. The detected metabolites were clearly clustered into two main groups: the black color fruits were clearly separated from fruits of other types; and the fruits of the other three types were not clearly separated.
The cluster heat-map of all DAMs showed that many types of DAMs were detected (Fig. 2c), and all types of fruit possessed unique, dominant, and higher-level DAMs. As Table 1 shows, considerable numbers of DAMs were detected between the compared samples, 357, 331, 313, 252, 205, and 143 DAMs in black vs dark red, black vs yellow, black vs yellow_spot, yellow vs dark red, yellow vs yellow_spot, and yellow_spot vs dark red comparisons, respectively.
Table 1. Detected DAMs in different comparisons.
Compared samples No. of total identified No. of total significantly different No. of significantly up No. of significantly down Black vs yellow 993 331 171 160 Black vs dark red 993 357 187 170 Black vs yellow_spots 993 313 164 149 Yellow_spots vs dark red 993 143 59 84 Yellow vs yellow_spots 993 205 97 108 The highest numbers of DAMs were detected in amino acid and derivatives (132), followed by flavonoids (89), carbohydrates and their derivatives (80), organic acid and their derivatives (66), lipids (45), organoheterocyclic compounds (44), and phenolic acids (41) (Table 2). Amino acid and derivatives, flavonoids, and carbohydrates and their derivatives, are the three top DAMs in the black vs dark red, black vs yellow, and yellow vs yellow_spot comparisons. Amino acid and derivatives, carbohydrates and its derivatives, organic acid and its derivatives, were the three top type DAMs in the black vs yellow_spot, and yellow vs dark red comparison (Table 2). Different to the above mentioned comparison, amino acid and derivatives, flavonoid, and organic acid and its derivatives were the most accumulated metabolites class in the yellow_spot vs dark red comparison (Tab. 2).
Table 2. Differential metabolites in six comparisons.
Comparison/DAM Black vs
dark redBlack vs
yellowBlack vs
yellow_spotYellow vs
dark redYellow vs
yellow_spotYellow_spot vs
dark redAmino acid and derivatives 55 75 55 60 46 33 Flavonoids 52 51 36 18 21 20 Carbohydrates and its derivatives 48 38 50 26 20 11 Organic acid and its derivatives 37 29 37 25 21 14 Phenolic acids 30 23 25 14 11 7 Organoheterocyclic compounds 22 24 20 13 18 8 Lipids 19 20 18 20 12 8 Nucleotide and its derivates 18 9 9 23 15 11 Phenylpropanoids and polyketides 13 13 7 12 6 1 Phenols and its derivatives 11 10 12 5 12 11 Vitamins 11 6 9 9 3 4 Alkaloids and derivatives 9 8 9 3 0 1 Phytohormones 8 6 5 8 3 3 Amines 6 6 8 4 10 3 Terpenoids 6 2 3 5 6 5 Alcohols and polyols 5 5 6 3 0 2 Polyamine 3 3 1 2 0 1 Benzene and substituted derivatives 2 1 2 2 1 0 Organooxygen compounds 2 2 1 0 0 0 Total 357 331 313 252 205 143 A total of 54 DAMs classed in amino acid and derivatives were found accumulated in black fruit, including eight essential amino acids, histidine, valine, L-tryptophan, L-phenylalanine, isoleucine, leucine, methionine, and threonine (Fig. 3a). While a total of 42 DAMs were found highly accumulated in dark red fruit, including three essential amino acids L-threonine, L-lysine, and lysine (Fig. 3a).
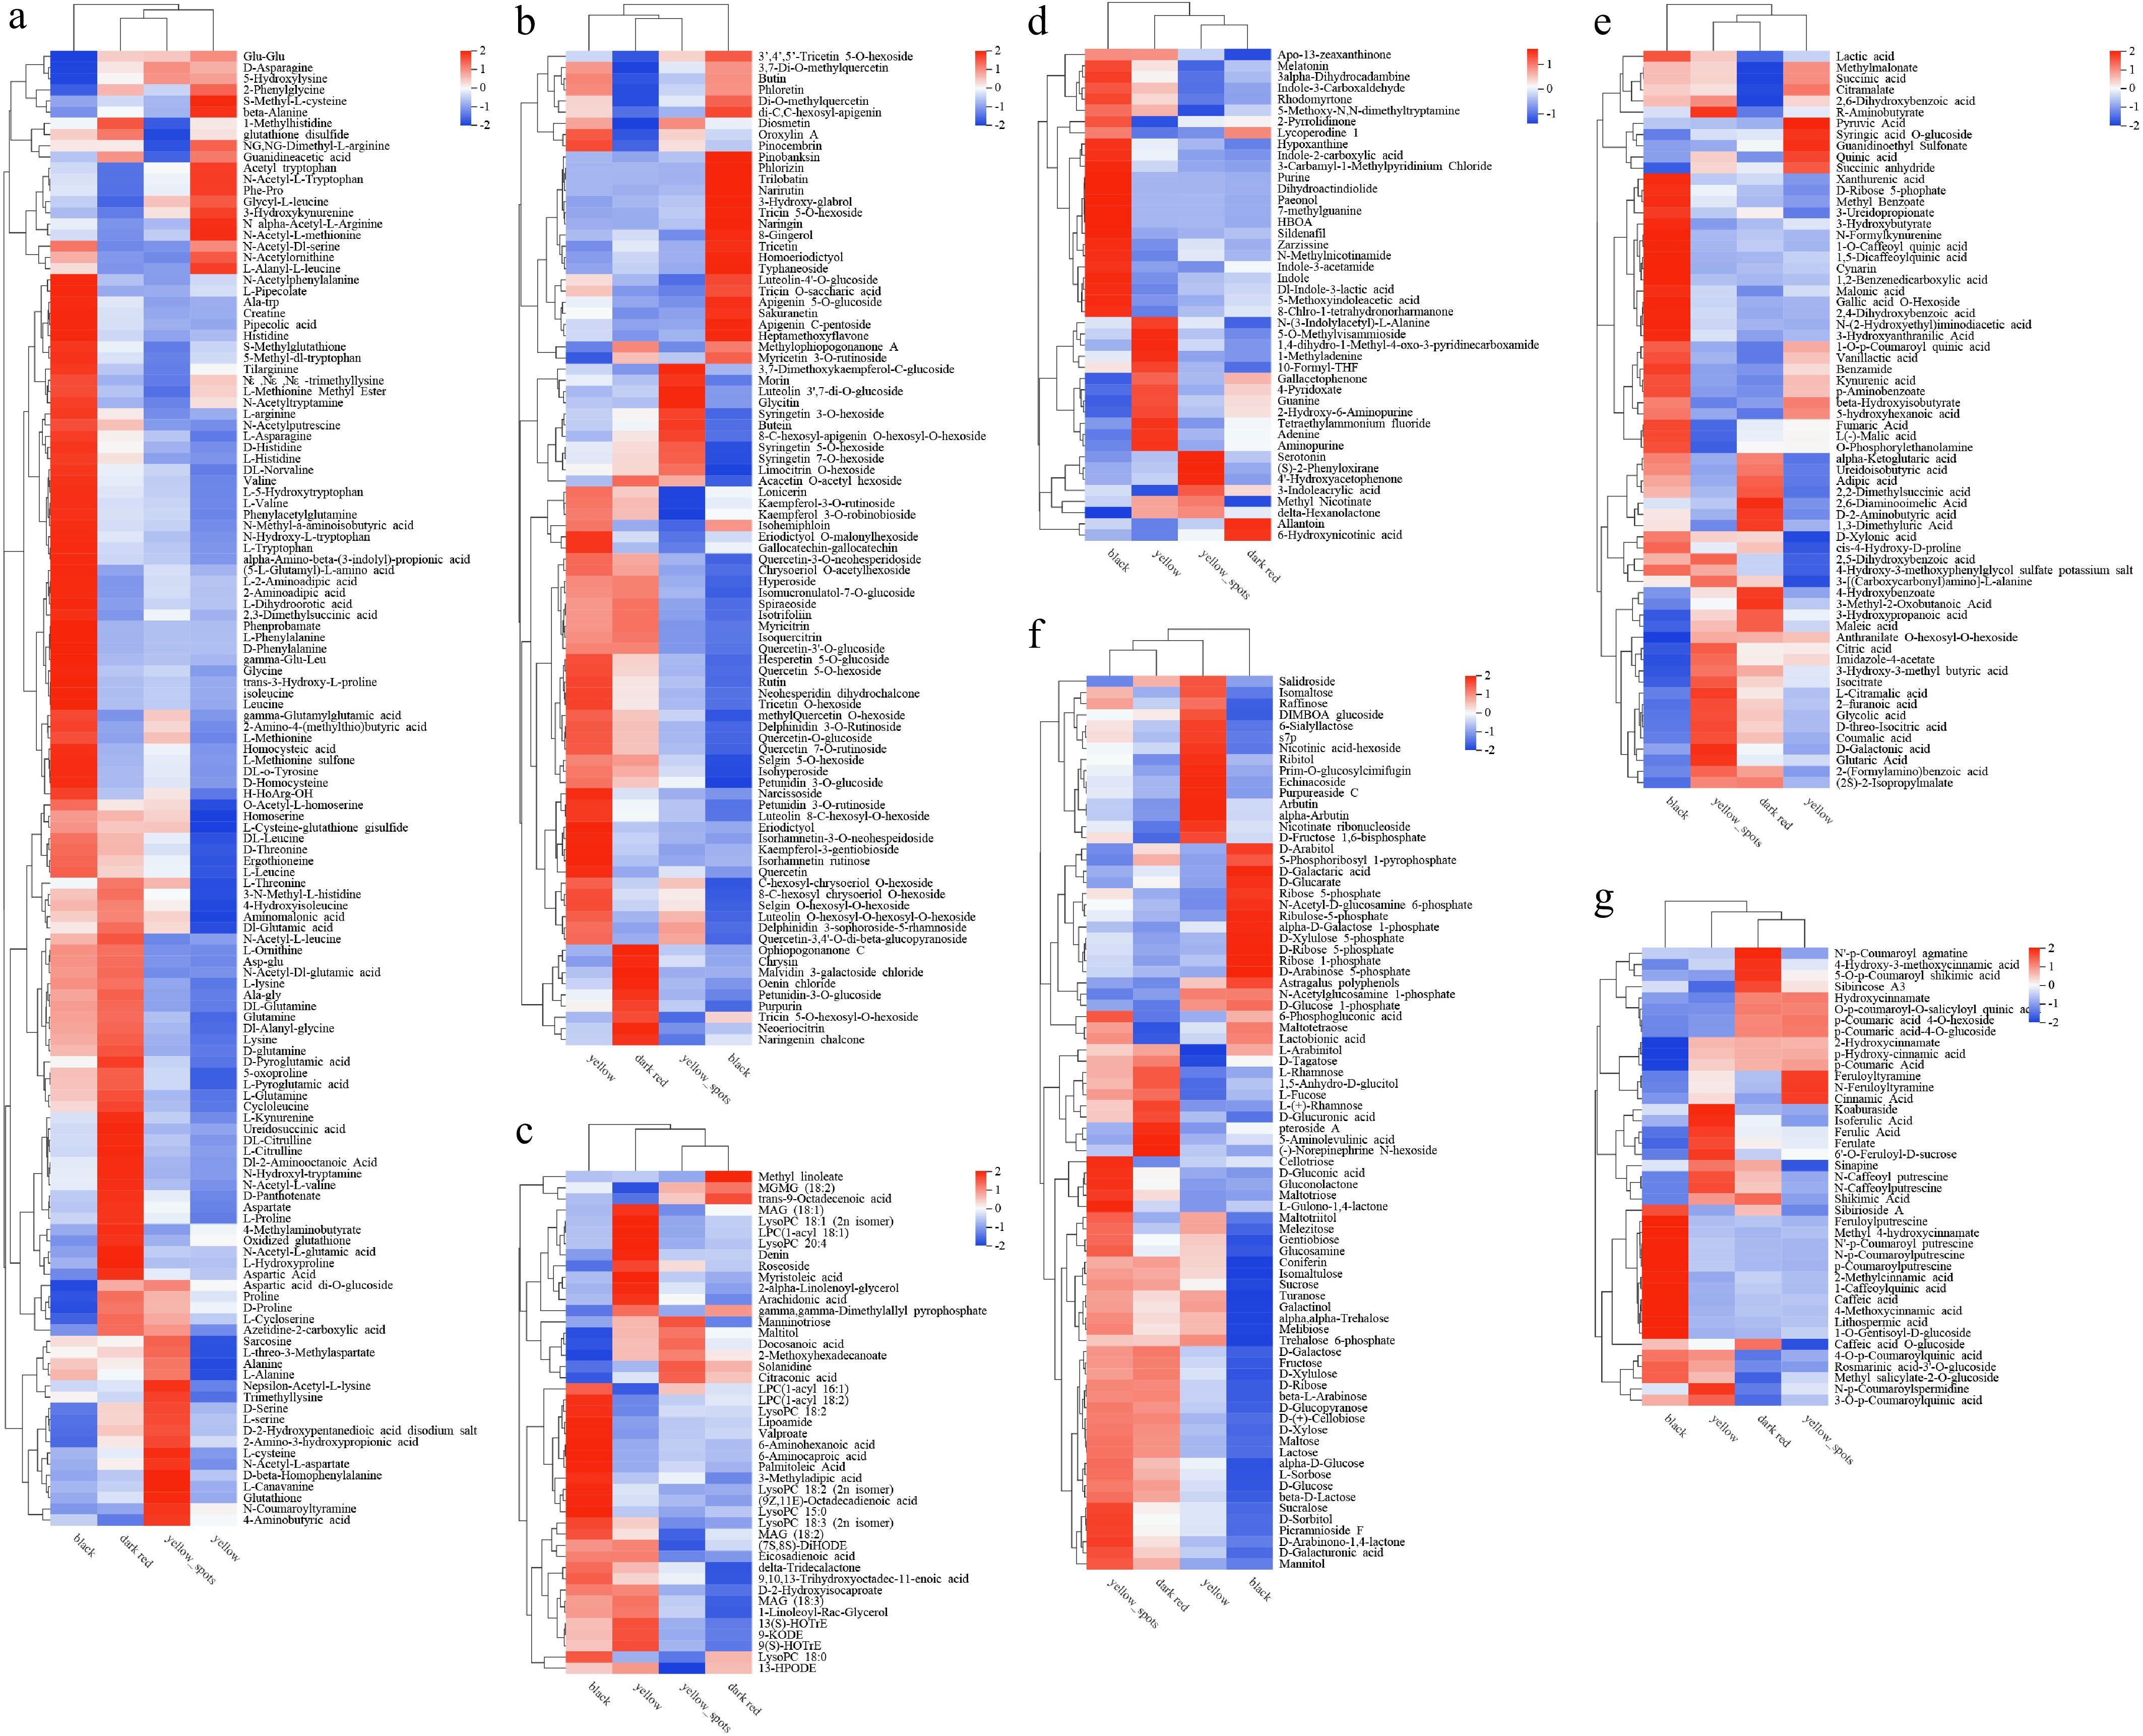
Figure 3.
Heat map of main metabolite types related to fruit color and quality. (a) Amino acids, (b) flavonoids, (c) lipids, (d) organoheterocyclic compounds, (e) organic acids and their derivatives, (f) carbohydrates and their derivatives, (g) phenolic acids, in four fruit types.
Most of the DAMs in flavonoids were highly accumulated in yellow fruit, such as lonicerin, isohemiphloin, hyperoside, myricitrin, isoquercitrin, rutin, narcissoside, eriodictyol, isorhamnetin, rutinose, and quercetin (Fig. 3b). Ophiopogonanone C, chrysin, malvidin 3-galactoside chloride, oenin chloride, petunidin-3-O-glucoside, purpurin, tricin 5-O-hexosyl-O-hexoside, neoeriocitrin, and naringenin chalcone were highly accumulated in dark red fruit. Pinobanksin, phlorizin, trilobatin, narirutin, naringin, and some other 14 DAMs were highly accumulated in black fruit (Fig. 3b).
Organoheterocyclic compounds and lipids showed the same cumulative characteristics in different comparisons, and the majority of DAMs highly accumulated in black and yellow fruit, only a few DAMs highly accumulated in yellow_spot and dark red (Fig. 3c, d).
In carbohydrates and its derivatives, D-glucose, fructose, sucrose, and some primary metabolites that have a significant impact on fruit sweetness are more abundant in dark red and yellow_spot fruit than in other fruit types (Fig. 3f). Other bioactive secondary metabolites in carbohydrates and its derivatives, such as purpureaside C and echinacoside were highly accumulated in yellow fruit, coniferin has the highest content in dark red fruits, gentiobiose, raffinose, galactinol, alpha-trehalose, and some other functional oligosaccharide were highly accumulated in yellow_spot and yellow fruit (Fig. 3f).
All in all, the majority of DAMs classed in organic acid and its derivatives have low content in yellow fruit, common organic acids that significantly contribute to sourness, such as citric acid, maleic acid, and quinic acid have high content in yellow_spot, dark red, and yellow respectively, L(−)-malic acid and fumaric acid have high content in black fruit (Fig. 3e).
The DAMs classed in phenolic acids were dominated by coumaric acid, cinnamic acid, ferulic acid, caffeic acid, shikimic acid, and their derivatives. Notably, 1-caffeoylquinic acid, caffeic acid, and some bitterness substance have the highest content in black fruit (Fig. 3g).
According to the KEGG annotation, the top enriched KEGG terms between comparisons were slightly different. Biosynthesis of secondary metabolites (43), phenylpropanoid biosynthesis (12), galactose metabolism (11), amino sugar and nucleotide sugar metabolism (10), and arginine and proline metabolism (10), were the top five enriched KEGG terms in black vs dark red comparison (Fig. 4a, Table 3). Biosynthesis of secondary metabolites (50), ABC transporters (19), biosynthesis of amino acids (19), phenylpropanoid biosynthesis (13), and aminoacyl-tRNA biosynthesis (12) were the top five enriched KEGG terms in black vs yellow comparison (Fig. 4b, Table 3). Metabolic pathways (80), biosynthesis of secondary metabolites (42), ABC transporters (19), biosynthesis of amino acids (16) and galactose metabolism (12) were the top five enriched KEGG terms in the black vs yellow_spot comparison (Fig. 4c, Table 3). Biosynthesis of amino acids (15), pyrimidine metabolism (13), ABC transporters (12), aminoacyl-tRNA biosynthesis (10), and alanine, aspartate, and glutamate metabolism (eight) were the top five enriched KEGG terms in the yellow vs dark red comparison (Fig. 4d, Table 3). Metabolic pathways (58), pyrimidine metabolism (seven), carbon metabolism (seven), tyrosine metabolism (six), and amino sugar and nucleotide sugar metabolism (six) were the top five enriched KEGG terms in the yellow vs yellow_spot comparison (Fig. 4e, Table 3). Biosynthesis of amino acids (nine), arginine biosynthesis (seven), ABC transporters (seven), tyrosine metabolism (four), and zeatin biosynthesis (four) were the top five enriched KEGG terms in the yellow_spot vs dark red comparison (Fig. 4f, Table 3).
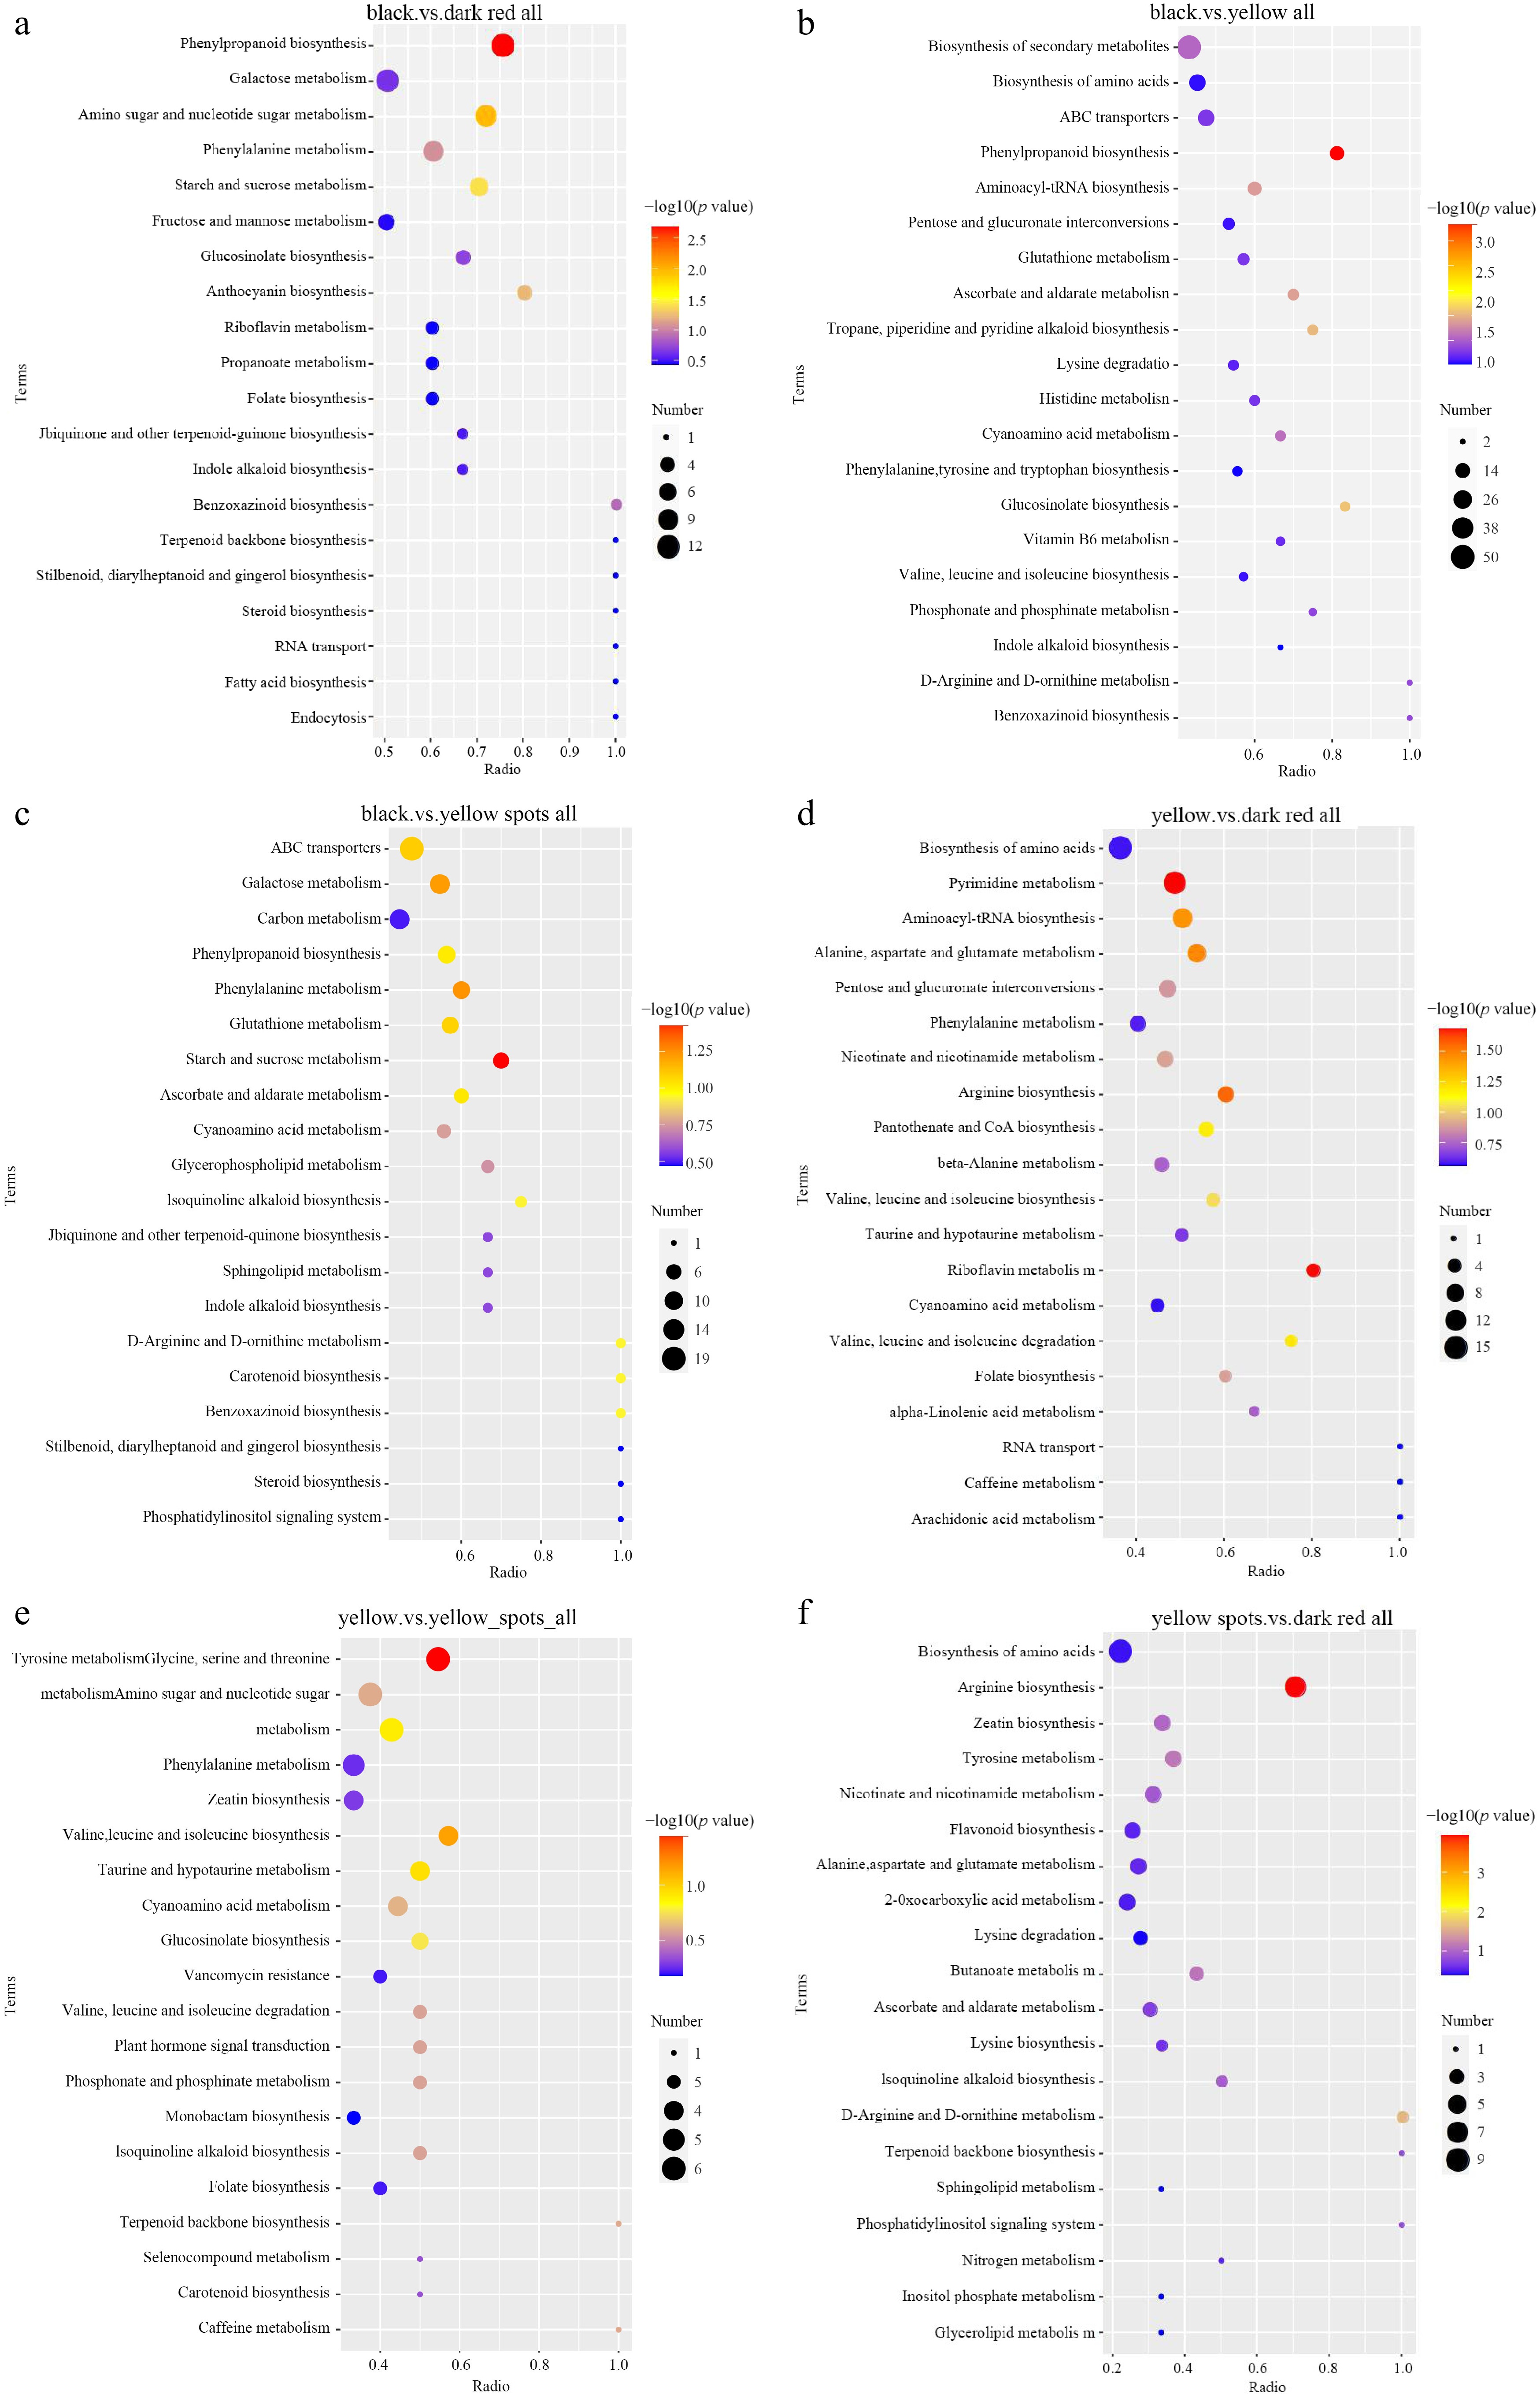
Figure 4.
KEGG enriched scatterplot of DAMs in four comparisons. (a) Black vs dark red, (b) black vs yellow, (c) black vs yellow spot, (d) yellow vs dark red, (e) yellow vs yellow spot, (f) yellow spot vs dark red.
Table 3. Top enriched KEGG term and metabolites number in six comparisons.
KEGG term No. meta Black vs red Biosynthesis of secondary metabolites 43 Phenylpropanoid biosynthesis 12 Galactose metabolism 11 Amino sugar and nucleotide sugar metabolism 10 Arginine and proline metabolism 10 Black vs yellow Biosynthesis of secondary metabolites 50 ABC transporters 19 Biosynthesis of amino acids 19 Phenylpropanoid biosynthesis 13 Aminoacyl-tRNA biosynthesis 12 Black vs yellow spot Metabolic pathways 80 Biosynthesis of secondary metabolites 42 ABC transporters 19 Biosynthesis of amino acids 16 Galactose metabolism 12 Yellow vs dark red Biosynthesis of amino acids 15 Pyrimidine metabolism 13 ABC transporters 12 Aminoacyl-tRNA biosynthesis 10 Alanine, aspartate and glutamate metabolism 8 Yellow vs yellow_spot Metabolic pathways 58 Pyrimidine metabolism 7 Carbon metabolism 7 Tyrosine metabolism 6 Amino sugar and nucleotide sugar metabolism 6 Yellow_spot vs dark red Biosynthesis of amino acids 9 Arginine biosynthesis 7 ABC transporters 7 Tyrosine metabolism 4 Zeatin biosynthesis 4 No. meta means Number of Metabolites. Sequencing quality and gene annotation
-
A total of 494,434,312 clean reads were obtained from 12 sequencing libraries of four types of fruit. As shown in Supplementary Table S2, the black fruit showed a lower mapping proportion than the other three fruit types. The proportion mapped to the exon region of the reference varied from 63.6293% to 72.3350%. The percentage of the sequences in the intron region ranged from 9.3060% to 10.0248%, and the percentage of the sequences in the intergenic regions ranged from 20.1625% to 25.5662% (Supplementary Tables S3, S4). Raw data are available in the NCBI SRA database (Accession No. PRJNA1141763).
A total of 6,522 novel gene were annotated, 1,302 of them were annotated in KEGG, the majority of the novel genes were annotated in metabolic pathways (228), and biosynthesis of secondary metabolites (162), in which the pathways that related to fruit quality were phenylpropanoid biosynthesis (sly00940, 20), biosynthesis of amino acids (sly01230, 20), starch and sucrose metabolism (sly00500, 17), valine, leucine, and isoleucine biosynthesis (sly00290, 15), flavonoid biosynthesis (sly00941, 11), zeatin biosynthesis (sly00908, 9), stilbenoid, diarylheptanoid, and gingerol biosynthesis (sly00945, 9), fatty acid biosynthesis (sly00061, 4), isoquinoline alkaloid biosynthesis (sly00950, 1), phenylalanine, tyrosine, and tryptophan biosynthesis (sly00400, 1), monoterpenoid biosynthesis (sly00902, 1), cutin, suberine, and wax biosynthesis (sly00073, 1), biosynthesis of unsaturated fatty acids (sly01040, 1), carotenoid biosynthesis (sly00906, 3), and steroid biosynthesis (sly00100, 4) .
Identification of DEGs and enrichment analysis
-
The PCA results of transcriptome sequencing showed that all replicates of four type fruit were grouped. As shown in Fig. 5a, PC1 and PC2 represented 31.87% and 19.08% variation, the detected genes were clearly clustered into three main groups, the black colour fruit and the dark red colour fruit were clearly separated from the yellow fruit and yellow_spot fruit, which do not show clear separation.
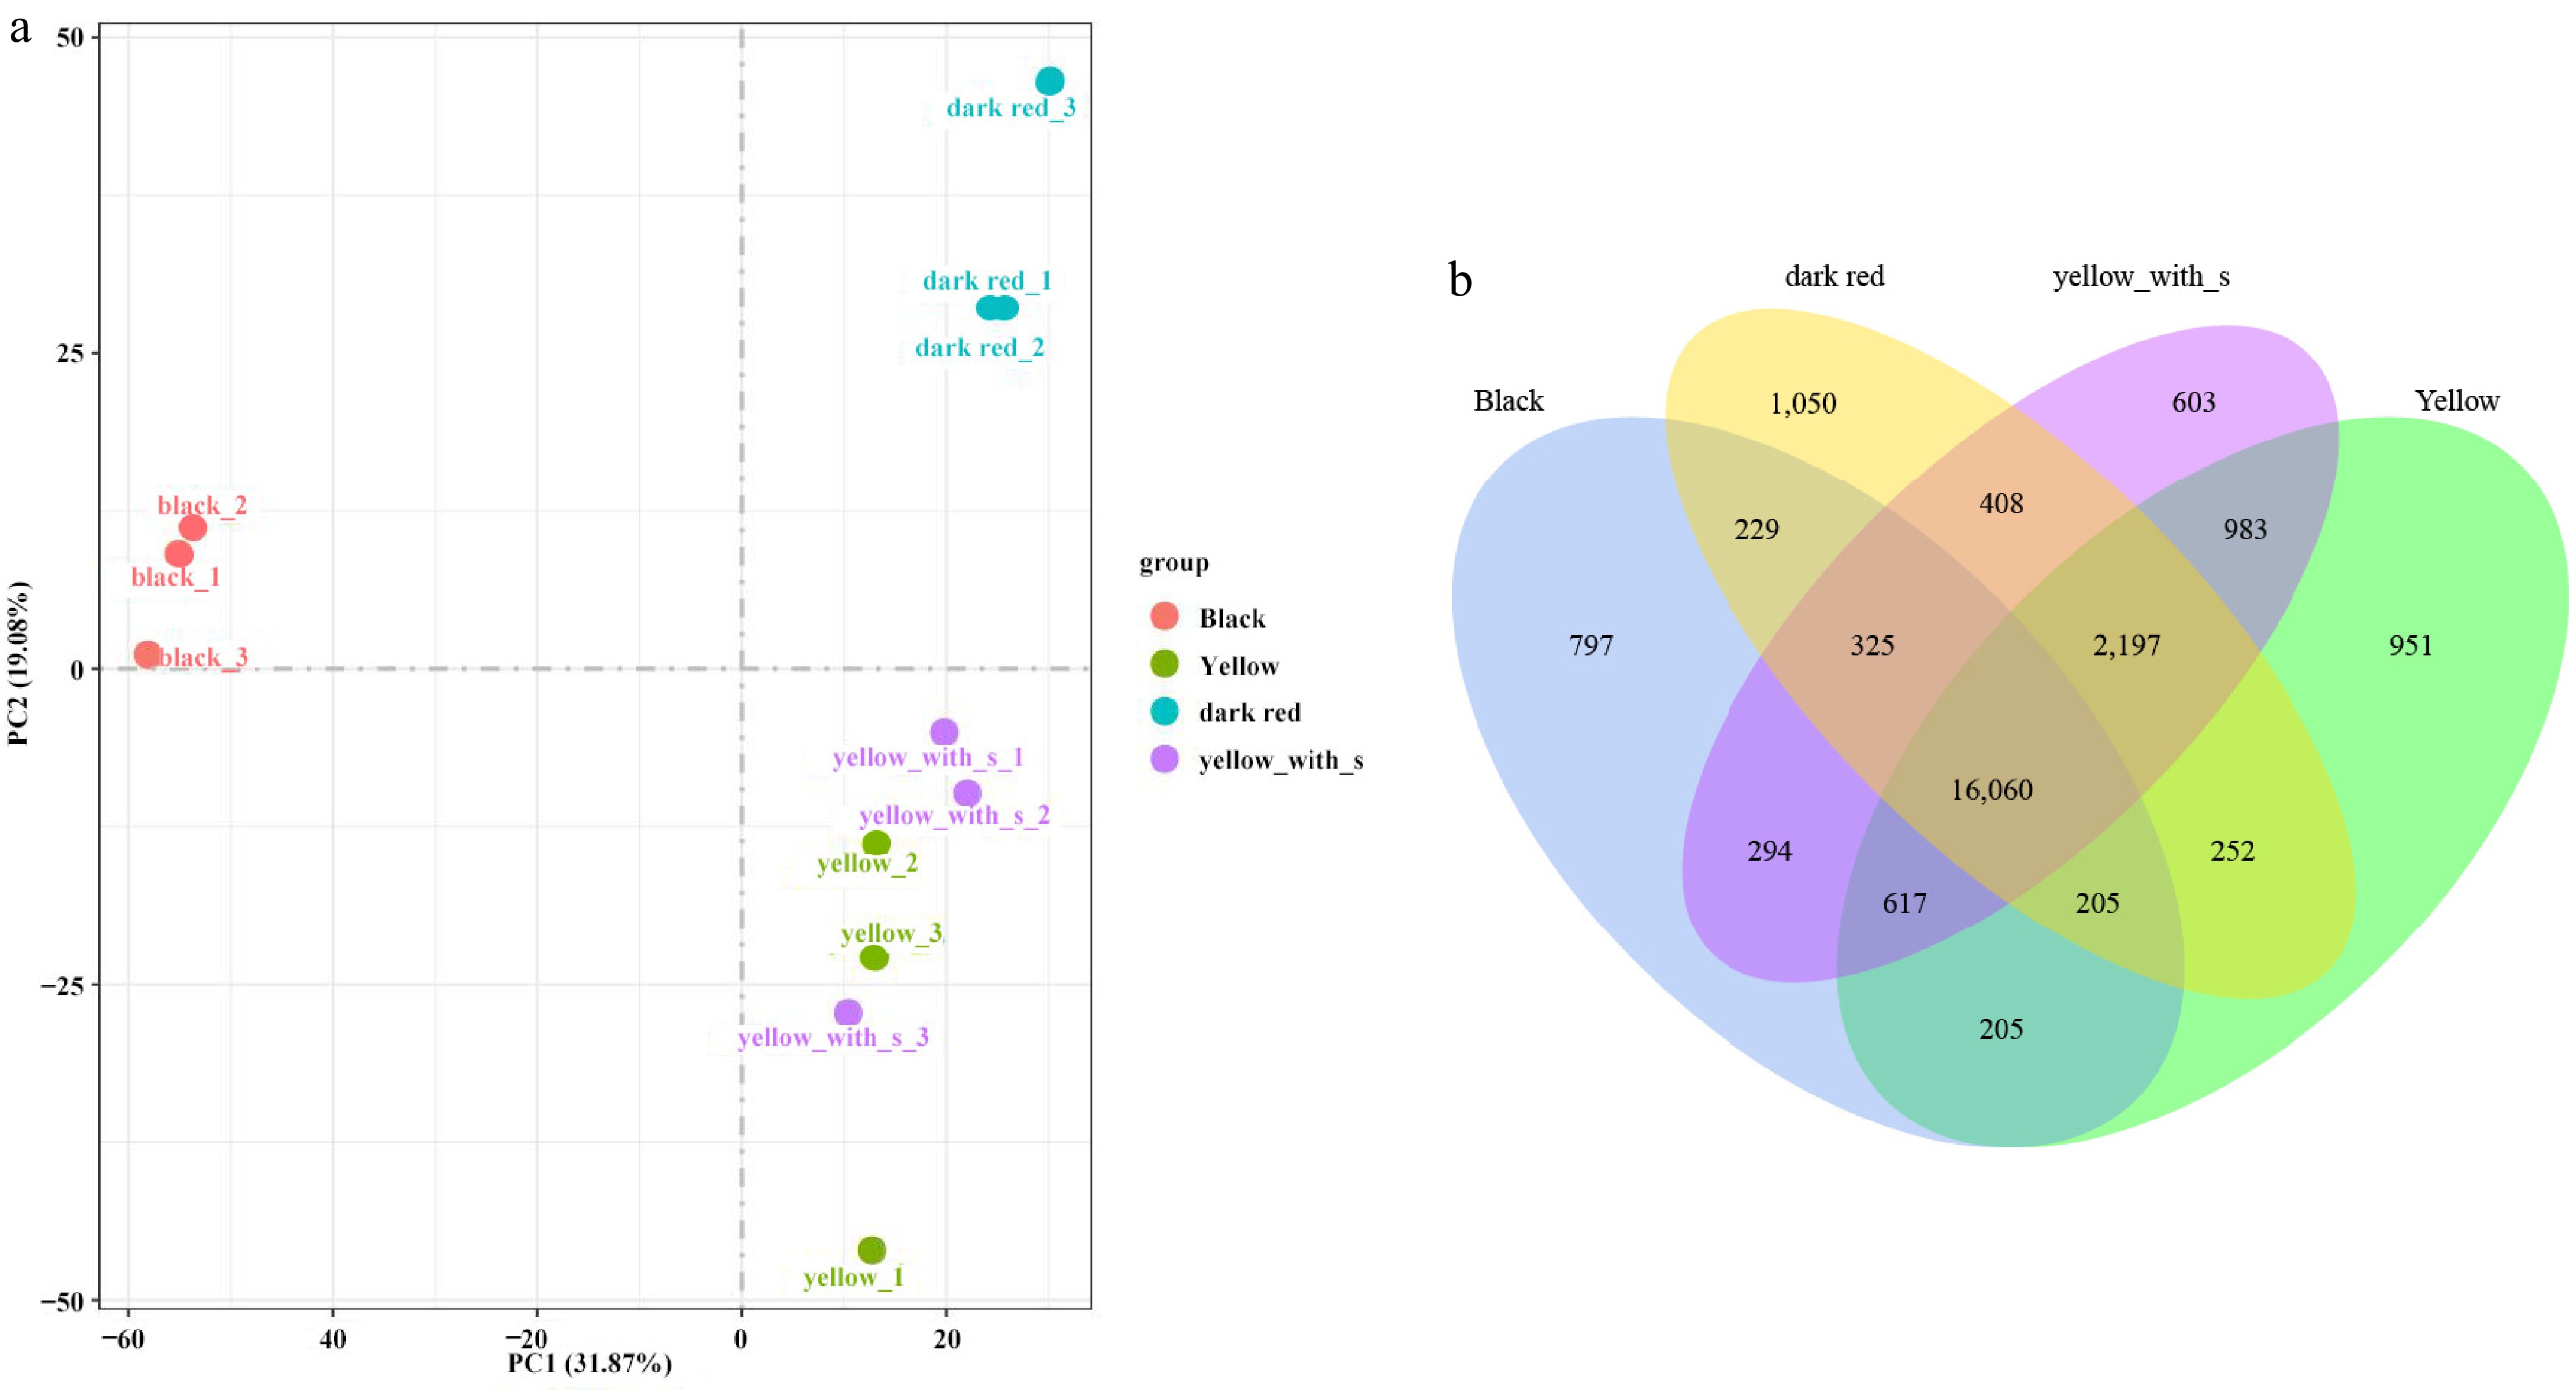
Figure 5.
PCA and Venn profiling of four fruit types in transcriptome. (a) PCA analysis of transcriptome. (b) Venn plot of DEGs.
The Venn diagram in Fig. 5 shows that yellow fruit and yellow_spot fruit shared the most common genes compared to the other comparisons, while the black fruit and the dark red fruit shared the least common genes (Fig. 5b). DEGs were detected from six comparisons, the highest amount of DEGs were found in the black vs dark red comparison (7,259), and the least DEGs were found in the yellow vs yellow_spot comparison (321) (Table 4).
Table 4. The number of detected DEGs in six comparisons.
Compare All Up Down Black vs yellow 4,955 1,551 3,404 Black vs dark red 7,259 2,524 4,735 Black vs yellow_spot 5,382 1,334 4,048 Yellow vs dark red 3,642 1,740 1,902 Yellow vs yellow_spot 321 163 158 Dark red vs yellow_spot 3,453 1,507 1,946 All of the DEGs were classified into four sub clusters. The genes in sub_cluster1 were lowly expressed in black fruit, and highly expressed in the other fruit types. The genes in sub_cluster2 highly expressed in black and dark red fruit, but lowly expressed in yellow and yellow_spot fruit. The expression levels of genes in sub_cluster3 are roughly similar among the four fruit types. Genes in sub_cluster4 highly expressed in dark red fruit, and lowly expressed in black, and the expression level in yellow fruit and yellow_spot fruit were lower than that in dark red fruit, and higher than that in black fruit (Fig. 6). A total of 122 DEGs were clustered in sub_cluster1, including four UDPGT (UDP-glucosyltransferase) numbers, four p450 numbers, HSP gene family number, and some transcription factors. In sub_cluster2, there are 2,673 DEGs, including 86 pkinase domains, 39 p450 numbers, 29 peptidase domains, 20 UDPGT numbers, and some transcription factors, such as AP2 (16), WRKY( 12), Myb (10), and F-box (nine). The majority of DEGs (8,219) were clustered in sub_cluster3, including 167 Pkinase family numbers, 89 p450 number, 80 pkinase_Tyr domain, 54 peptidase_S8 domain, 64 NB-ARC family number, 50 UDPGT number, and 32 2OG-FeII_Oxy family numbers and some transcription factors, such as F-box(50), Myb_DNA-binding (28), WRKY (22), and WD40 (17), the least amount of DEGs (115) were clustered in sub_cluster 4.
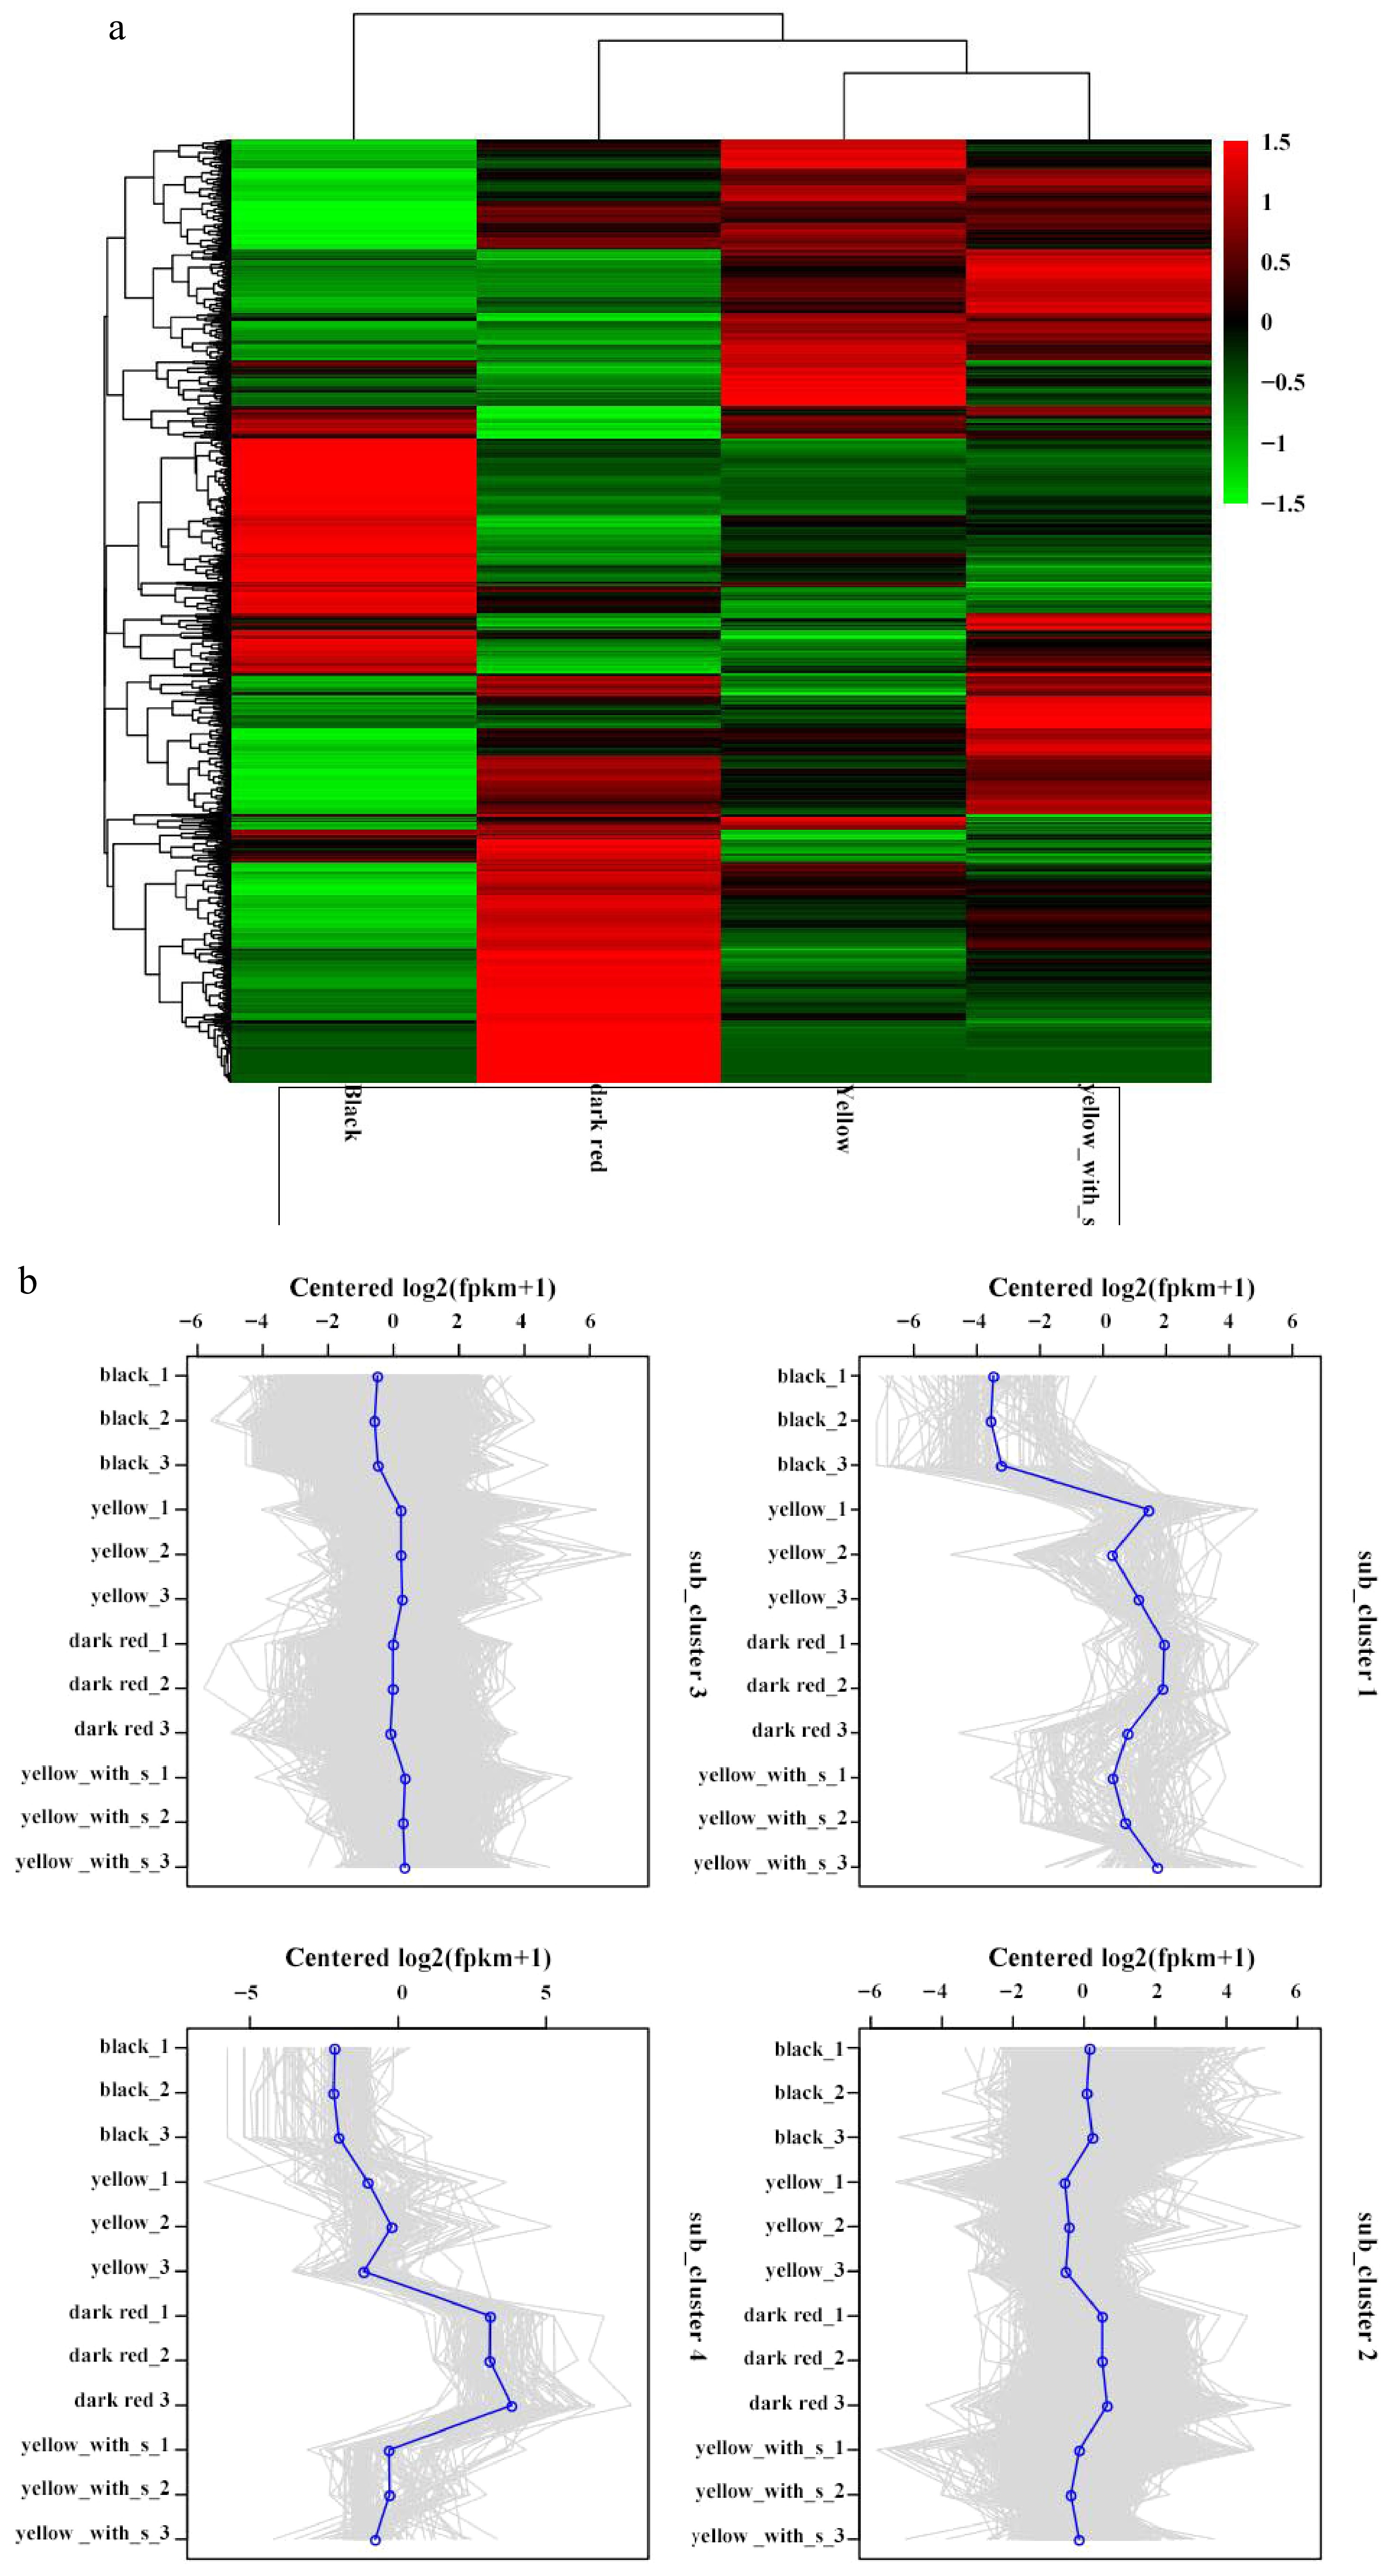
Figure 6.
Differential genes classed in heatmaps, subclusters, and expressions in four fruit types. (a) Heatmap of DEGs. (b) Subcluster plots of DEGs.
All of the DEGs were enriched in KEGG, as shown in Fig. 7. In the black vs dark red comparison, the carotenoid biosynthesis, flavonoid, valine, leucine and isoleucine biosynthesis, galactose metabolism, tyrosine metabolism, cysteine, and methionine metabolism were the top six enriched pathway, but did not reach significant levels. In the biosynthesis of amino acids and the phenylpropanoid biosynthesis pathway, the expression of DEGs did not show significant levels, but enriched more genes than other pathways (Fig. 7a). In the comparison of black vs yellow, biosynthesis of amino acids, cysteine, and methionine metabolism were the top two enriched pathways (Fig. 7b). In the comparison of black vs yellow_spots, biosynthesis of cofactors, ascorbate and aldarate metabolism, fatty acid biosynthesis, alanine, aspartate, and glutamate metabolism were the top four enriched pathways (Fig. 7c). In the comparison of dark red vs yellow, biosynthesis of amino acids, flavonoid biosynthesis, amino sugar, and nucleotide sugar metabolism, alanine, aspartate, and glutamate metabolism were the top four enriched pathways (Fig. 7d). In the dark red vs yellow_spot comparison, flavonoid biosynthesis, ascorbate, and aldarate metabolism, and biosynthesis of amino acids were the top three enriched pathways (Fig. 7e). In the comparison of yellow vs yellow_spot, glycolysis/gluconeogenesis, carbon metabolism, pyruvate metabolism, biosynthesis of amino acids, biotin metabolism, and citrate cycle (TCA cycle) were the top six enriched pathways (Fig. 7f).
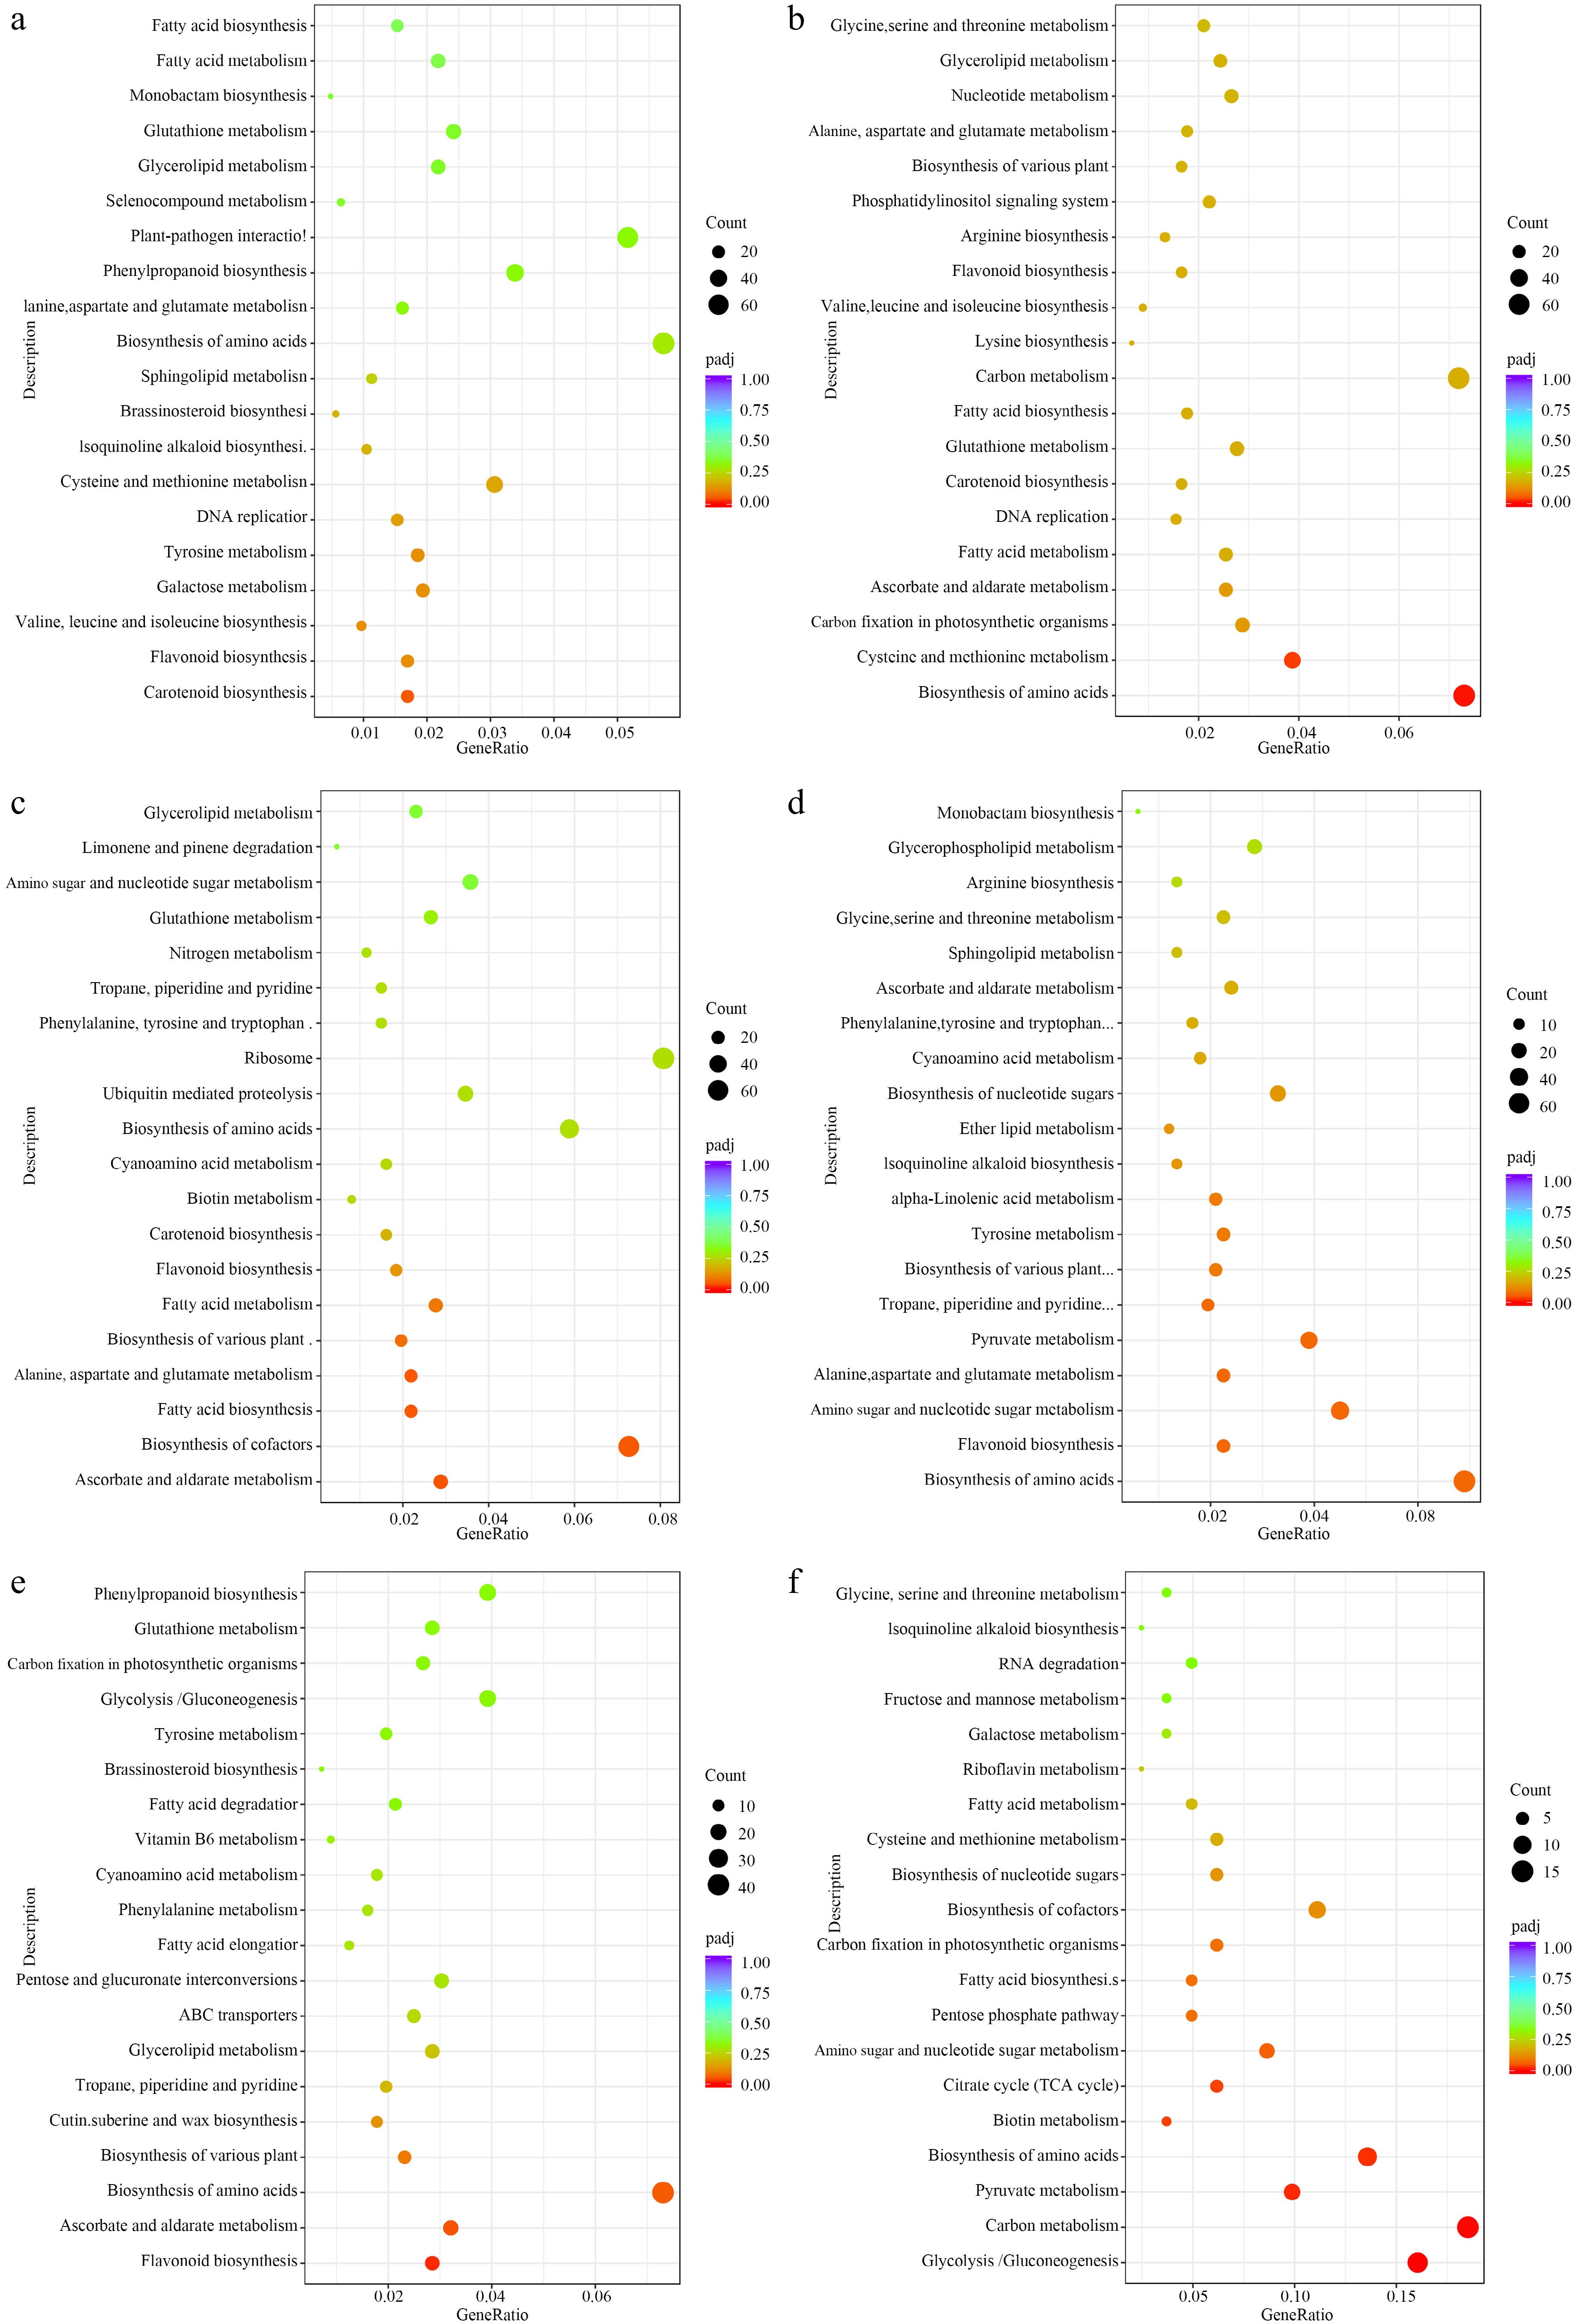
Figure 7.
KEGG enriched scatterplot of DEGs in four comparisons. (a) Black vs dark red, (b) black vs yellow, (c) black vs yellow spot, (d) dark red vs yellow, (e) dark red vs yellow spot, (f) yellow vs yellow spot.
Integrated analysis of gene and metabolite expression patterns
-
As shown in KEGG pathway enrichment analysis of DEGs combined with DEMs, a few pathways showed tight correlation in each comparison (Supplementary Fig. S1a–S1f), for example, the DEGs and DAMs were closely correlated in the phenylpropanoid biosynthesis pathway in the black vs dark red comparison. In yellow vs dark red comparison, the DEGs and DAMs were closely correlated in the arginine biosynthesis pathway, and alanine, aspartate, and glutamate metabolism were closely related. In other comparisons, the relationship of the DEGs and DAMs did not show a tight and clear correlation in most of the KEGG pathways.
To further illustrate the mechanisms of metabolite accumulation and transcriptional regulation, the interaction between all of the DEGs and DAMs was analyzed. As shown in the correlation network map of DEGs and DAMs in different comparisons (Fig. 8a–f).
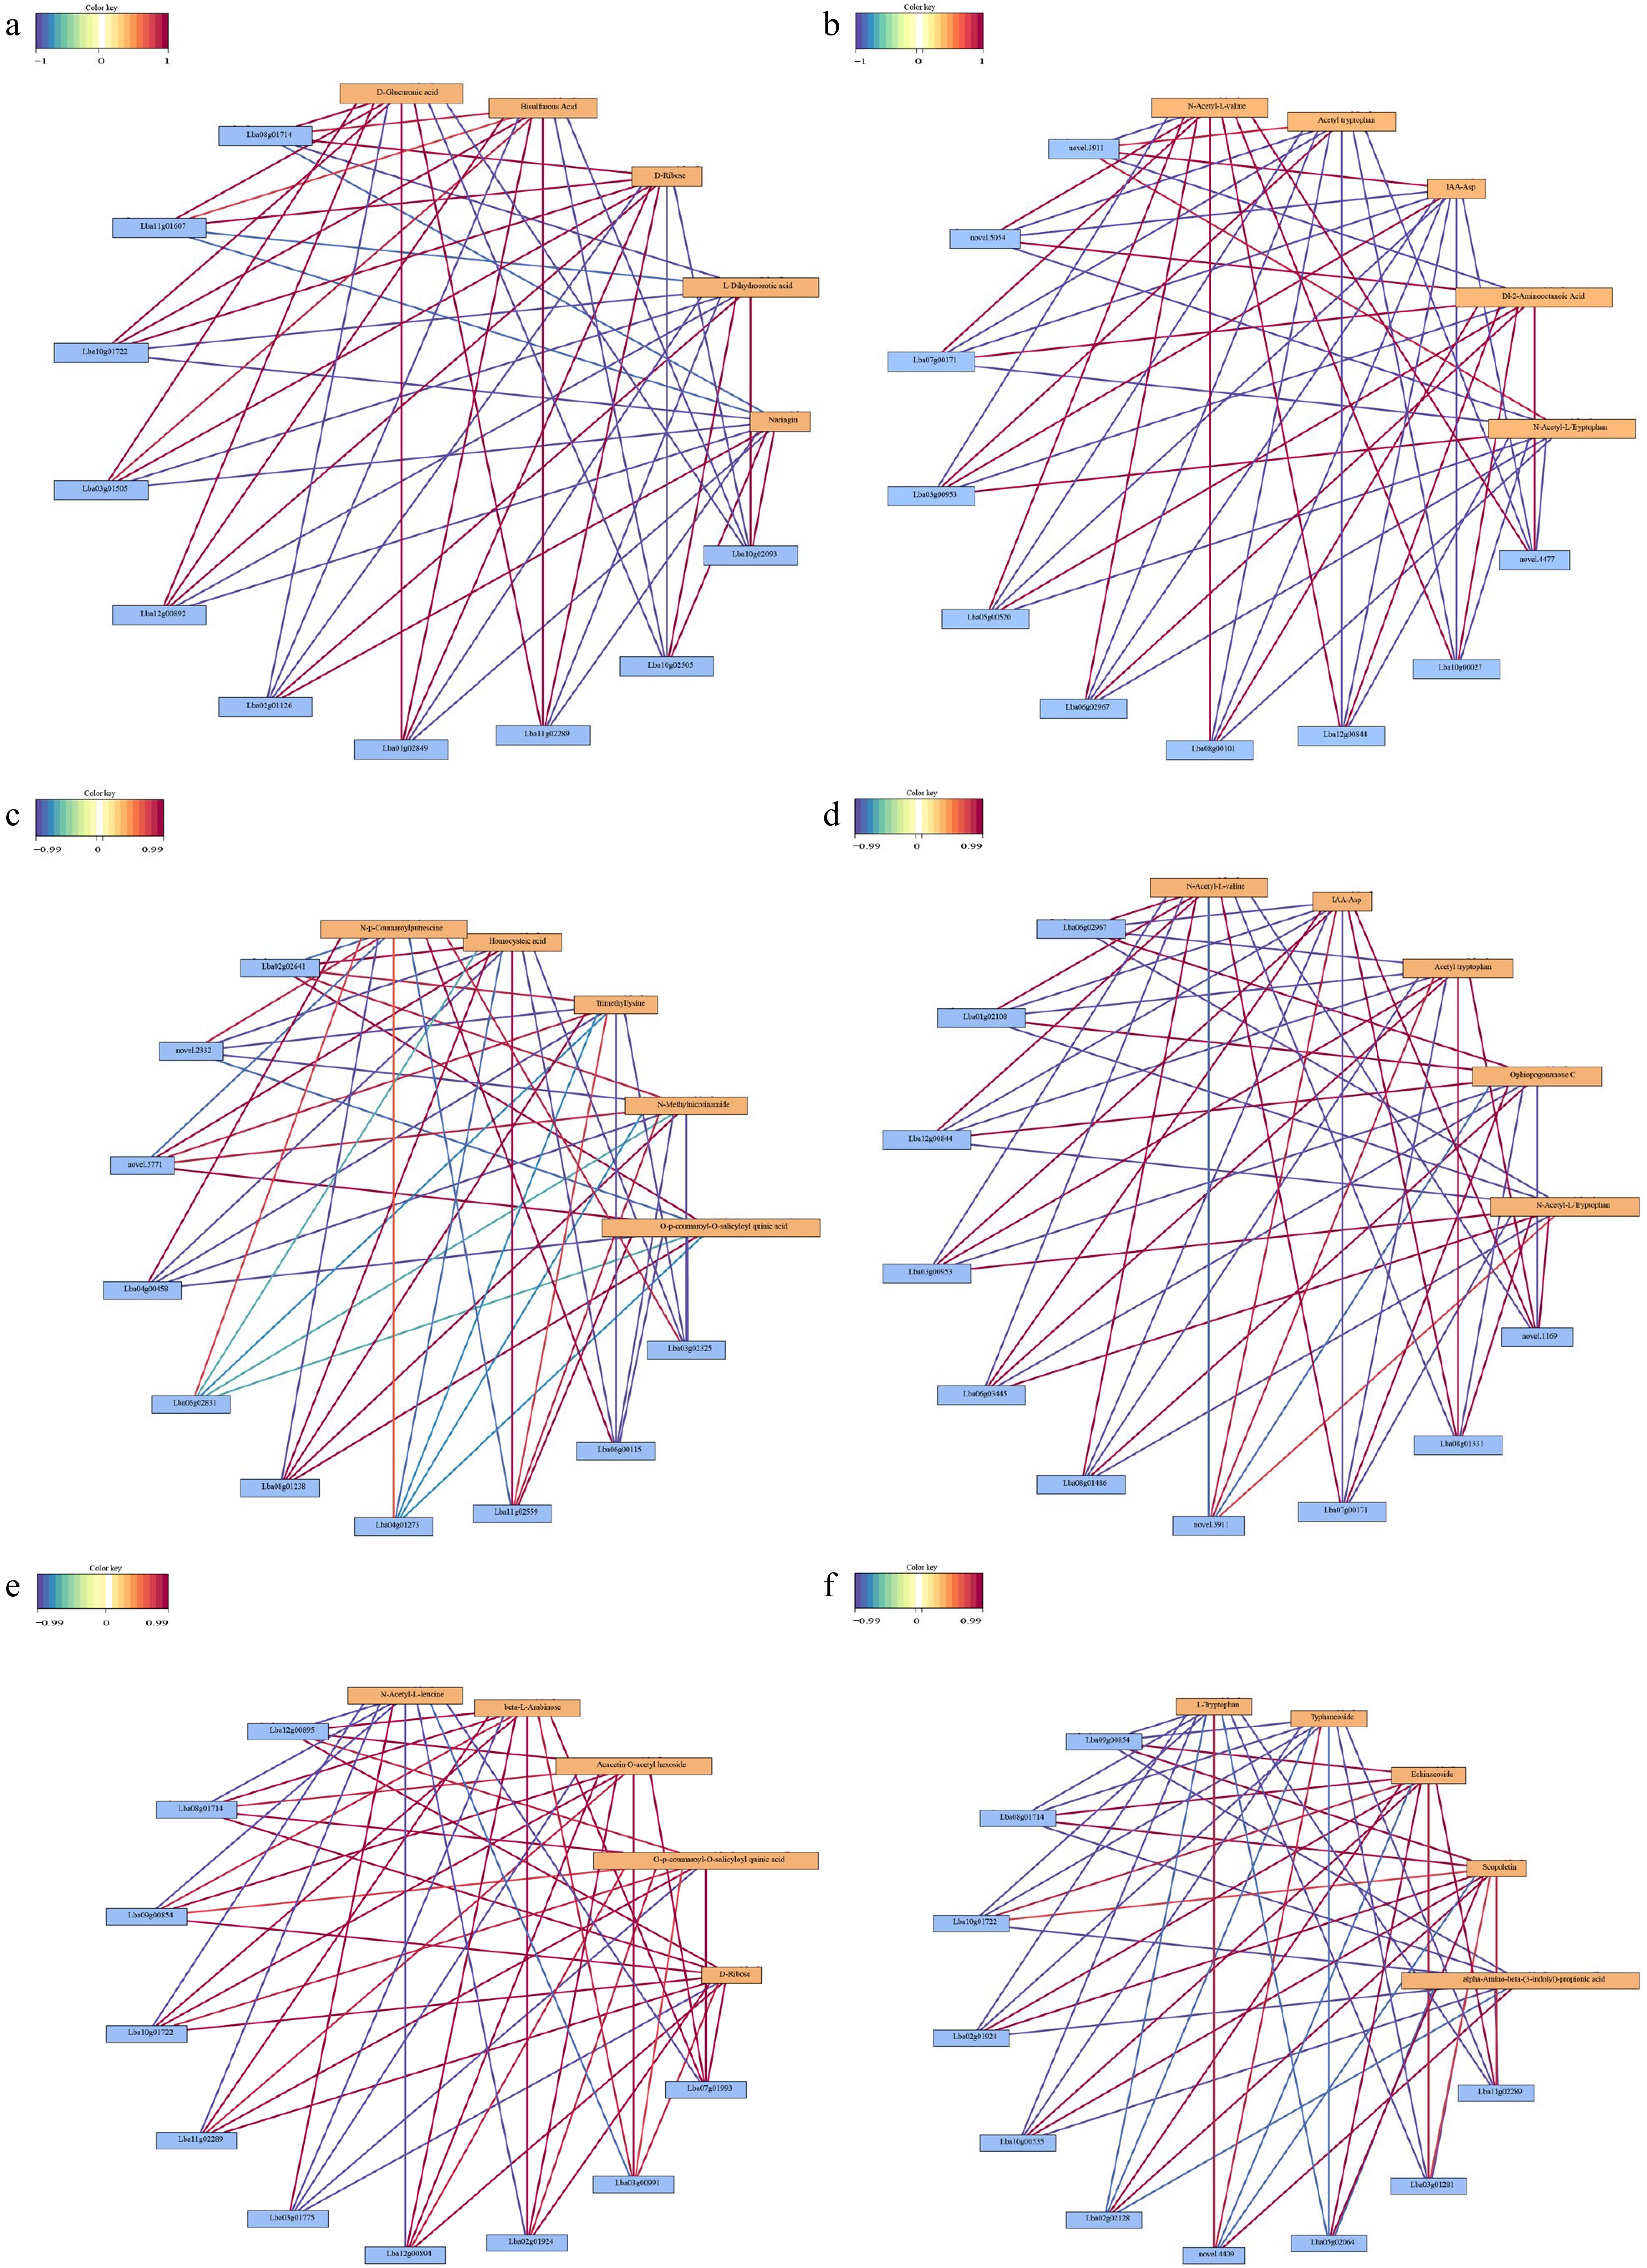
Figure 8.
Correlation network of the top metabolites and genes in four comparisons. (a) Black vs dark red, (b) yellow spots vs dark red, (c) yellow vs yellow spot, (d) yellow vs dark red, (e) black vs yellow spot, (f) black vs yellow.
In the black vs dark red comparison, the top five DAMs were tightly correlated with Lba08g01714 (cytochrome P450 76A2, C76A2), Lba11g01607 (1-aminocyclopropane-1-carboxylate oxidase 1, ACCO1), Lba10g01722 (acyl-acyl carrier protein thioesterase TE3), Lba12g00892 (not annotated), Lba02g01126 (kinesin-like protein KIN-12C, KN12C), Lba01g02894 (protein double-strand break formation, DFO), Lba11g02289 (not annotated), Lba10g02505 (very-long-chain (3R)-3-hydroxyacyl-CoA dehydratase PASTICCINO 2), and Lba10g02093 (RNA-binding protein 42, RBM42)(Fig. 8a).
In the yellow_spot vs dark red comparison, the top five DAMs, including N-acetyl-L-valine, acetyl tryptophan, IAA-Asp, Dl-2-aminooctanoic acid, and N-acetyl-L-tryptophan, which were classed in amino acids and their derivatives, were regulated by novel.3911, novel.4477, novel.5054, Lba03g00953 (Increased DNA methylation 1, IDM1), Lba05g00520 (amino acid transporter, AVT6C), Lba06g02967 (guanosine nucleotide diphosphate dissociation inhibitor, GDI), Lba07g00171 (AUGMIN subunit 8, AUG8), Lba08g00101 (not annotated), Lba10g00027 (Agenet domain), and Lba12g00844 (FHA domain) (Fig. 8b).
In the yellow vs yellow_spot comparison, the top DAMs were N-p-coumaroylputrescine, homocysteic acid, trimethyllysine, N-methylnicotinamide, and O-p-coumaroyl-O-salicyloyl quinic acid, they were regulated by Lba02g02641 (not annotated), Lba04g00458 (monocopper oxidase-like protein SKU5), Lba06g02831 (basic blue protein), Lba08g01238 (protein of unknown function), Lba04g01273 (not annotated), Lba11g02559 (senescence regulator), Lba06g00115 (not annotated), Lba03g02325 (enolase 1), Novel.2332 (probable xyloglucan endotransglucosylase/hydrolase, XTH16), and Novel.5771 (putative AC transposase) (Fig. 8c).
In the yellow vs dark red comparison, the top ten DEGs that regulated the top five DAMs were Novel.1169 (Actin-1, ACT1), Novel.3911 (disease resistance protein Roq1, ROQ1), Lba06g02967 (GDI, guanosine nucleotide diphosphate dissociation inhibitor), Lba01g02108 (UGT2, 7-deoxyloganetin glucosyltransferase), Lba12g00844 (Nijmegen breakage syndrome 1, NBS1), Lba03g00953 (increased DNA methylation, IDM1), Lba06g03445 (protein nuclear fusion defective 4, NFD4), Lba08g01486 (IQ domain-containing protein, IQM3), Lba07g00171 (AUGMIN subunit 8, AUG8), and Lba08g01331 (not annotated) (Fig. 8d).
In the black vs yellow_spots comparison, the top ten DEGs were Lba12g00895 (light-induced protein), Lba08g01714 (Cytochrome P450 76A2), Lba09g00854 (cytochrome P450 76A2), Lba10g01722 (acyl-acyl carrier protein thioesterase TE3), Lba11g02289 (not annotated), Lba03g01775 (4-coumarate-CoA ligase 2, 4CL2), Lba12g00894 (light-induced protein), Lba02g01924 (trimethyltridecatetraene synthase), Lba03g00991 (non-specific lipid-transfer protein 1), and Lba07g01993 (not annotated) (Fig. 8e).
In the black vs yellow comparison, the top ten DEGs were Lba11g02289 (not annotated), Lba03g01281 (14KD_DAUCA 14 kDa proline-rich protein DC2.15), Lba05g02064 (protein detoxification 14, DTX14), Novel.4409 (aquaporin TIP1-1, TIP11), Lba02g02128 (7-deoxyloganetin glucosyltransferase, UGT2), Lba10g00535 (UGT9_GARJA beta-D-glucosyl crocetin beta-1, 6-glucosyltransferase), Lba02g01924 (trimethyltridecatetraene synthase), Lba10g01722 (acyl-acyl carrier protein thioesterase TE3), Lba08g01714 (cytochrome P450 76A2, C76A2), and Lba09g00854 (bidirectional sugar transporter SWEET14, SWT14), these ten genes were tightly correlated with L-tryptophan, typhaneoside, echinacoside, scopoletin and alpha- -amino-beta (3-indolyl)-propionic-acid (Fig. 8f).
Realtime-PCR validation of DEGs in four fruit types
-
To test the credibility of RNA-seq data, 18 DEGs involved in flavonoid, phenylpropanoid, α-linolenic acid, and linoleic acid metabolism were selected to perform the quantitative RT-PCR. The expression of selected DEGs was expressed in four type fruits. The result of these genes in RT-PCR is consistent with the transcriptome sequencing results, it proves the validation of transcriptome sequencing (Fig. 9).
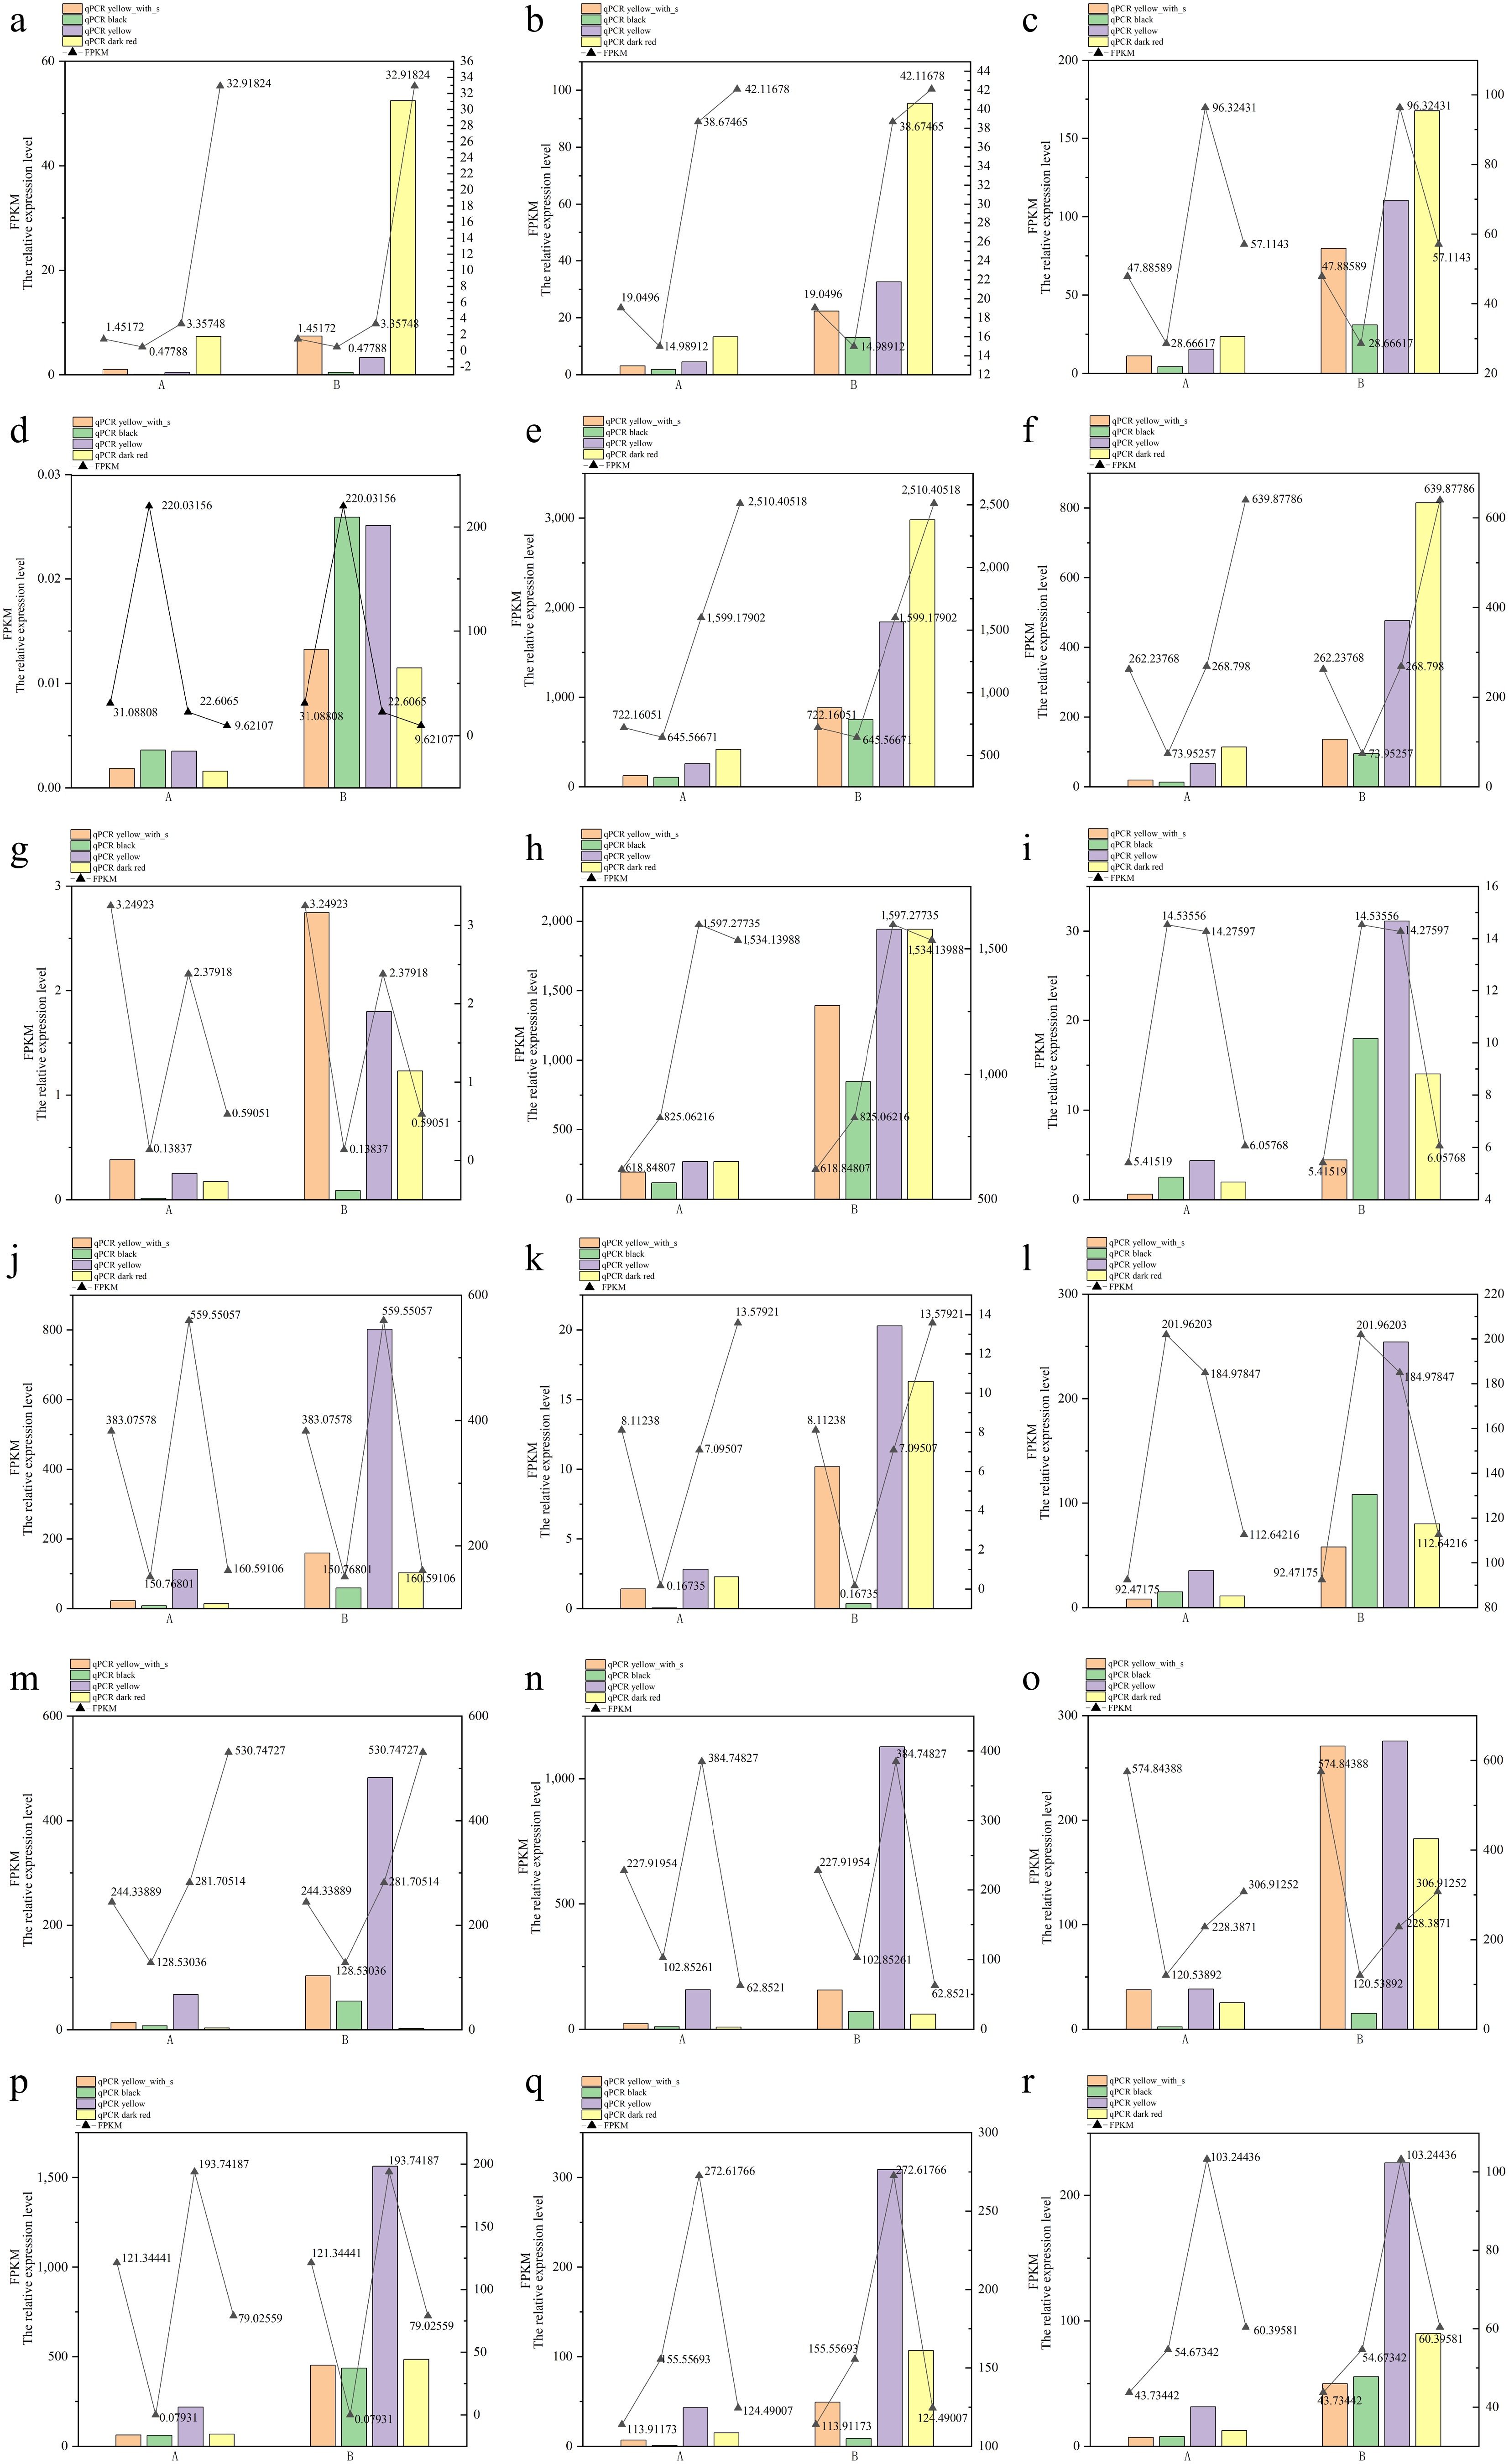
Figure 9.
RT-PCR validation of key DEGs in four fruit types. (a) Lba01g01874, (b) Lba01g02344, (c) Lba02g00136, (d) Lba02g00994, (e) Lba03g00118, (f) Lba03g01605, (g) Lba04g01211, (h) Lba05g01557, (i) Lba05g02210, (j) Lba06g01747, (k) Lba06g02033, (l) Lba07g00206, (m) Lba07g00818, (n) Lba07g02052, (o) Lba07g02085, (p) Lba08g02201, (q) Lba11g01391, (r) Lba11g01902. Note: (a)–(r) are the relative expression of 18 genes, A indicates LbaCML38 as the reference gene, B indicates the GAPDH as the reference gene.
-
The formation of fruit colors depend on the chemical components related to pigments, and is greatly related to the species. The difference in fruit color depend on the changes in the concentrations of metabolites that are not only related to the fruit color, but also the taste and quality.
Although the phenotype differences between these hybrids fruits are mainly manifested in color, according to the metabolism detection result, the highest DAMs, not only classed in pigments, but also in fruit flavor and fruit quality related components, such as amino acid and derivatives, flavonoid, carbohydrates, and its derivatives, organic acid, and its derivatives, lipids, organoheterocyclic compounds, and phenolic acids (Table 2). These results imply that the different colors of fruits affected their flavor and quality.
As the PCA results showed (Fig. 3), the black colour fruit were clearly separated from other fruit types, it is indicating that the metabolite profiles in black colour fruit are obviously distinct to the other three fruit types.
As the results of metabolism detection, phenylpropanoid biosynthesis were the top enriched KEGG terms in the black vs dark red comparison, and the black vs yellow comparison (Fig. 6a, b, Table 3), but it is not the top enriched term in black vs yellow_spot comparison, in which metabolic pathways, biosynthesis of secondary metabolites, ABC transporters, biosynthesis of amino acids, and galactose metabolism were the top five enriched KEGG terms (Fig. 6c, Table 3), it suggests that the color with spots may be related to the formation of the color of black fruit. In the previous research on L. ruthenicum, a total of 14 anthocyanins were detected in fresh fruit, and petunidin derivatives, which accounted for most of the total anthocyanin, is the major component causing the black phenotype of fruit. The metabolism detection results showed that amino acid and derivatives, flavonoids, and carbohydrates and its derivatives were the three top type DAMs in the yellow vs yellow_spot comparison (Table 2). Amino acids are involved in sugar metabolism, indirectly affecting anthocyanin synthesis, and subsequently influencing fruit color. In addition, the components of flavonoids mainly related to fruit color in yellow_spot fruits were coumalic acid that is the precursor substances of flavonoid biosynthesis[39], the high content of coumaric acid may promote the biosynthesis of many substances in the entire flavonoid biosynthesis pathway, but the content of these substances may not reach a significant level.
In the yellow vs yellow_spot comparison, there is only one DEG in the flavonoid biosynthesis pathway, dihydroflavonol-4-reductase (DFR), was found, but it did not reach a significant level. DFR is the key gene in anthocyanin biosynthesis, it can use dihydrokaempferol (DHK), dihydroquercetin (DHQ), and dihydromyricetin (DHM) as substrates to reduce and produce different colorless anthocyanin glycosides[40], the substrate specificity determines the type and content of the anthocyanins in plants, resulting in different fruit colors[41]. Therefore, we speculate that the high expression of the DFR gene possibly leads to an increase in the synthesis of anthocyanins in the fruits, resulting in fruit spot formation. In yellow vs yellow_spot comparison, it was found that Lba06g02831 (basic blue protein) were correlated with the top five DAM, especially positively correlated with N-p-coumaroylputrescine that comes from the connection of p-coumaric acid and putrescine through an amide bond (Fig. 8c). It is further demonstrated that the role of coumaric acid is promoted in flavoniod biosynthesis. In addition, the Novel.5771 gene was positively correlated with the top five DAMs (Fig. 8c). According to the annotation result, Novel.5771 is the putative AC transposase that could initiate recombination, leading to genome rearrangement, and playing a role in the genome evolution[42], therefore, the formation of spot in yellow fruit maybe related with the genome arrangement and evolution of Lycium.
In the black vs dark red comparison, naringin is one of the top five DAMs, naringin belongs to the class of dihydroflavonoids that mainly involved in the accumulation differences of flavonoids and carotenoids[43]. Dihydroflavonoids are a class of plant flavonoid metabolites, serving as precursor substances in the anthocyanin synthesis pathway. Through catalysis by dihydroflavonol 4-reductase (DFR), it generates leucoanthocyanidins, which in turn form anthocyanins, and ultimately determining the color of fruit. The high accumulation of naringin in black fruit indicates that it is the main reason for the color difference between these two fruits. Beta-carotene hydroxylase 1(BCH), which is one of the top five DEGs closely related to top five DAMs in the black vs dark red comparison, catalyzes the synthesis of lutein and zeaxanthin from β-carotene and α-carotene[44], therefore, the different expression of BCH in black and dark red fruit result in different content of lutein and zeaxanthin, and further lead to different fruit color. In addition, it was found that Lba08g01714 (Cytochrome P450 76A2, CYP76A2) is one of to five DEGs in the black vs dark red comparison, according to previous research, the members of the CYP76 gene family could catalyse various oxidative reactions in many plant species[45]. For instance, CYP76 are related to the biosynthesis of tanshinones[46−48], at the same time, it was found that the red or colorless pulp depends on the CYP76ADs that may play a key role in the color-breaking step leading to fruit color change in Pitaya fruit[49]. CYP76A26 converts iridodial and iridotrial into 7-deoxyloganetic acid in Catharanthus roseus[50], CYP76B6 and CYP76C1 catalyze hydroxylation of geraniol[51]. Therefore, it was suspected that CYP76A2 may be related with formation of color and some other key components, but its function in Lycium plants needs further investigation. Besides the above mentioned genes, Lba10g01722, that annotated as acyl-acyl carrier protein thioesterase could catalyze the production of medium saturated fatty chains in some plants[52,53], Lba10g02505 (very-long-chain (3R)-3-hydroxyacyl-CoA dehydratase PASTICCINO 2) also related with fatty acid synthesis in plants[53−55]. According to the metabolism results, most of the lipids related to DAMs highly accumulated in black fruit (Fig. 5g). Therefore, it is speculated that the high level expression of Lba10g01722 and Lba10g02505 in black fruit may be the possible reason for the high levels of lipid substances in black fruit.
In the yellow_spot vs dark red comparison, biosynthesis of amino acids, arginine biosynthesis, ABC transporters, tyrosine metabolism, and zeatin biosynthesis were the top five enriched KEGG terms (Fig. 6f, Table 3). In the top DEGs that were closely correlated with top DAMs, Avt6 is involved in vacuolar amino acid compartmentalization[56], IDM1 is a histone acetyltransferase belonging to the GNAT subfamily of histone acetyltransferases, this protein participates in acetylation modification of the N-terminal tail of core histones, and loosening the chromatin structure[57,58]. Therefore, it was suspected that the formation of the top five DAMs in the yellow_spot vs dark red comparison may be related with acetylation modification of histones. But there are no previous reports about the function of IDM1 in Lycium plants, therefore further research is needed.
In conclusion, different colors of the four types determined the quality difference. Some functional oligosaccharide were highly accumulated in yellow_spot and yellow fruit, while the components that impact on fruit sweetness were more abundant in dark red and yellow_spot fruit. The difference of amino acid and derivatives were found in black fruit and dark red fruit, and most of the flavonoid components were highly accumulated in yellow fruit. All of these component differences were determined by gene expression level, various oxidative reactions and gene modification. All of these factors collectively lead to differences in fruit color, resulting in differences in fruit quality.
This research was supported by the National Natural Science Foundation of China (General Program) (32170239), and the Qinghai Natural Science Foundation (2022-ZJ-725).
-
The authors confirm their contributions to the paper as follows: designed the study: Zhang D, Wang Z; wrote the manuscript: Zhang D; designed the figures, analyzed, and statistically processed the data: Cui M, Liu X; performed the experiments: Li T; revised the manuscript: Shi W. All authors reviewed the results and approved the final version of the manuscript.
-
The datasets generated during and/or analyzed during the current study are not publicly available due to [the project remains unfinished], but are available from the corresponding author on reasonable request.
-
The authors declare that they have no conflict of interest.
- Supplementary Table S1 The primers information for the qRT-PCR.
- Supplementary Table S2 Data of sequencing result.
- Supplementary Table S3 Result of mapping.
- Supplementary Table S4 The percent of mapped region.
- Supplementary Fig. S1 KEGG enrichment share.scatterplot of transcriptome and metabolism.
- Copyright: © 2025 by the author(s). Published by Maximum Academic Press, Fayetteville, GA. This article is an open access article distributed under Creative Commons Attribution License (CC BY 4.0), visit https://creativecommons.org/licenses/by/4.0/.
-
About this article
Cite this article
Zhang D, Cui M, Li T, Liu X, Shi W, et al. 2025. Metabolite characteristics and molecular mechanism of different fruit color formation in hybrids from two Lycium species. Fruit Research 5: e045 doi: 10.48130/frures-0025-0034 

Metabolite characteristics and molecular mechanism of different fruit color formation in hybrids from two Lycium species
- Received: 28 May 2025
- Revised: 05 September 2025
- Accepted: 09 September 2025
- Published online: 17 December 2025
Abstract: Hybridization could result in genetic diversity and provide abundant germplasm resources for cross-breeding. Moreover, the diversity of fruit color is a typical phenotypic characteristic of hybrid varieties. In this study, metabolism and transcriptome were combined to uncover the major metabolites and molecular mechanism that result in four different fruit color formations in hybrids from two Lycium species. Most differential accumulated metabolites (DAMs) were detected in the black vs dark red comparison. The components that impact fruit sweetness were more abundant in dark red and yellow_spot fruit, and most of the DAMs in flavonoids were highly accumulated in yellow fruit. Some functional oligosaccharide were highly accumulated in yellow_spot and yellow fruit. Dihydroflavonol-4-reductase (DFR) and Lba06g02831 are the key genes in the formation of spots in yellow fruit. The different content of some key metabolites is related to various oxidative reactions and gene modification. This study provides a fresh viewpoint on uncovering the mechanisms in fruit color formation of wolfberry, and lays the foundation for the synthesis and metabolic pathways of substances related to fruit quality and color in wolfberry.
-
Key words:
- Hybrids /
- Lycium /
- Fruit color /
- Metabolome /
- Transcriptome