


-
American shad (Alosa sapidissima, belonging to the Clupeidae family) is a eurythermal, anadromous fish species[1] that is widely distributed in the Pacific and Atlantic basins of North America[2]. It was introduced into China for aquaculture in the early 21st century[3] and successfully cultured in indoor freshwater systems. At present, the American shad has become one of the most expensive aquaculture species in the Chinese fish market[4]. American shad is similar to Chinese shad (Tenualosa reeesi) in morphology, ecological habits, digestive systems, meat quality, and nutritional value. These two fishes belong to the same subfamily (Alosinae), but different genera.
The biological characteristics of the American shad have been studied to improve productivity, such as reproductive features[3,4], salinity adaptation[5,6], and larval development[7]. They are stenothermal fish with a small temperature range for survival[1]. They are extremely sensitive to environmental changes. For example, they can receive high-frequency ultrasonic signals such as 180 kHz that most fish cannot, which causes a stress response[8,9]. They also have small gills and require constant and rapid swimming to obtain oxygen, resulting in large demand for dissolved oxygen concentrations in the water. All of these properties mean that the American shad has to maintain a high basal metabolic rate[10,11]. Also, they are sensitive to salinity which affects their adaptability to temperature[5,6,12]. These combined special biological traits make this species very difficult to culture. Consequently, it is inevitably important to investigate its genome and transcriptome to further understand the species' genetic background.
This study presents a high-quality, chromosomal-level genome assembly of American shad using the PacBio platform. Six tissues (heart, liver, intestines, gills, muscle, and testis) of the same organism were performed for RNA-Seq and the important genes were predicted using our comprehensive transcriptomic data. The high-quality, chromosomal-level genome, and transcriptome of American shad will provide an invaluable and systematic resource for further studies on the its biology, evolution, germplasm conservation, and genetic selection.
-
The Amercian shad used in this study were from one selective breeding strain (Fig. 1a). Muscle, liver, intestines, gills, heart, and testis tissues were collected from a freshly killed one-year-old male individual stored on ice and washed with 1× PBS before snap freezing with liquid nitrogen. Genomic DNA was extracted from approximately 1 g of liver using the CTAB method as previously described[13]. Briefly, the sample was ground into powder with liquid nitrogen and transferred to a 1.5 mL tube before adding preheated 2% CTAB extraction buffer with 20 μL of Protein K and 4 μL of RNase A (in 10 mg/mL stock solution). The sample was incubated in a 65 °C water bath for 1 h before being purified twice with isopycnic chloroform (containing 24:1 isoamyl alcohol with 0.6× isopropyl). The DNA was harvested by centrifugation at 13,000 rpm at 4 °C for 10 min, washed with 70% ethanol, and dissolved in 15–100 μL of TE buffer.
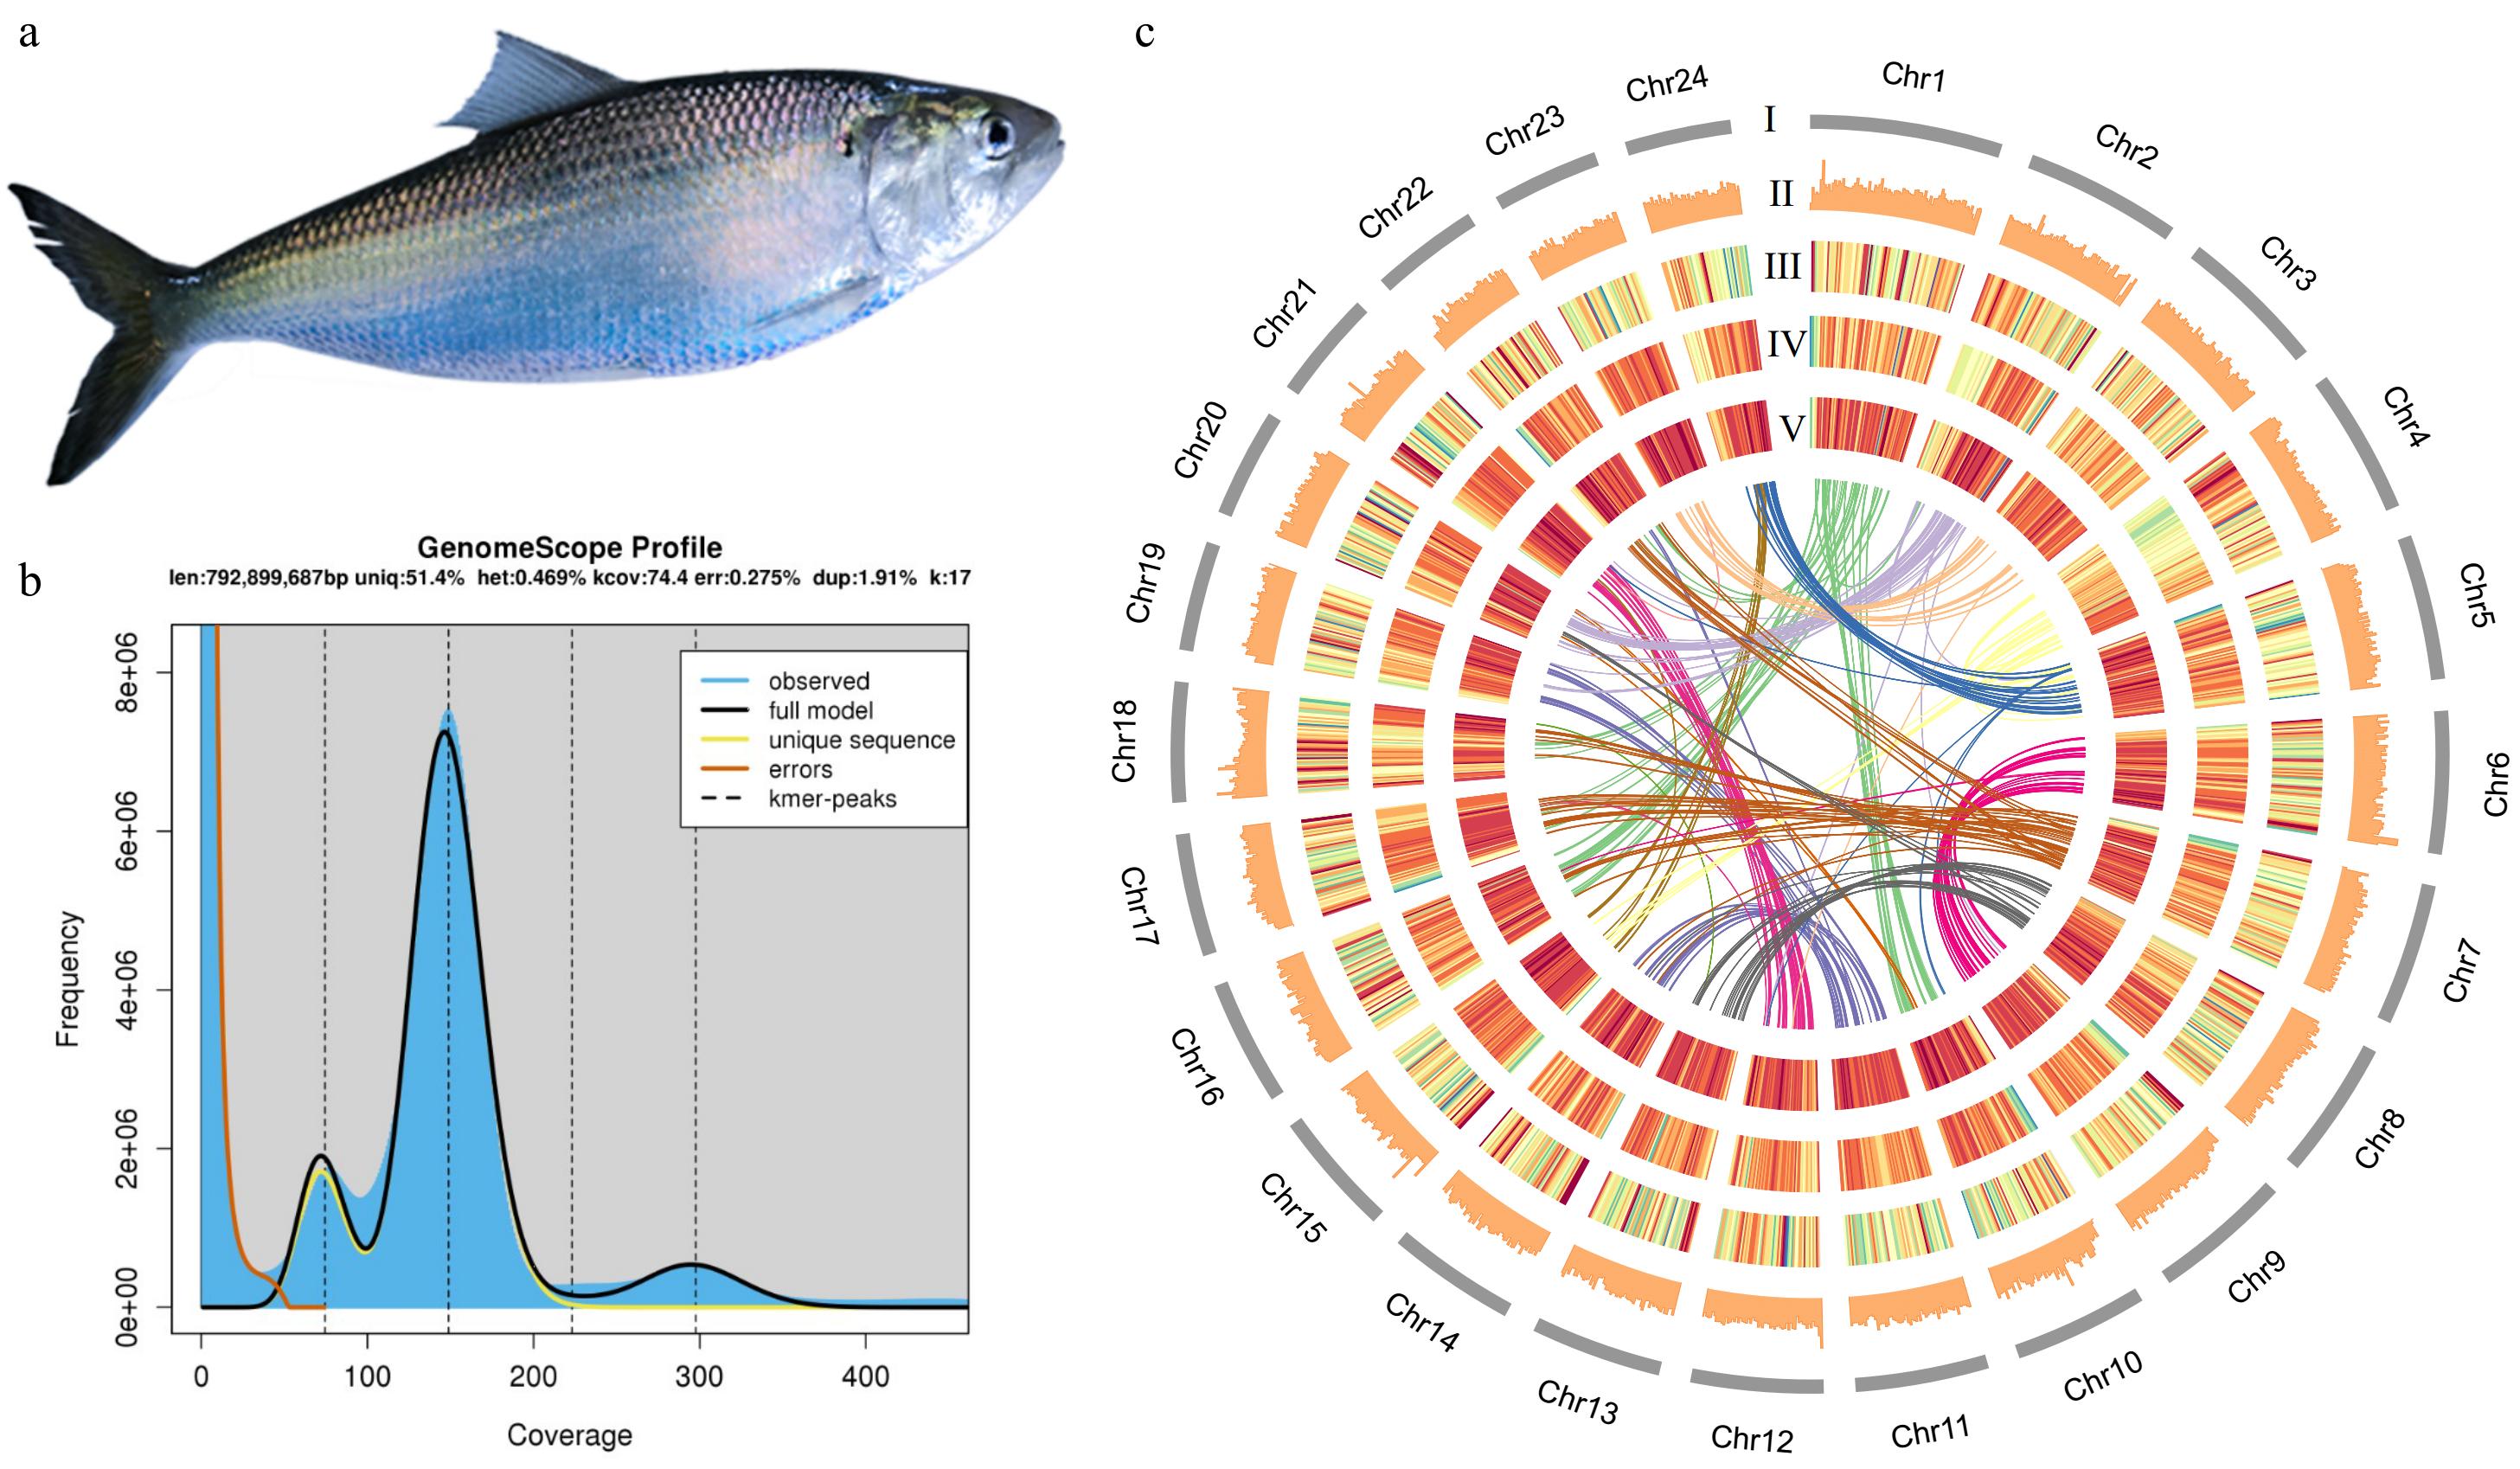
Figure 1.
(a) American shad. (b) Genome scope profile for size prediction. (c) Circos plot features for each chromosome. len: inferred total genome length; uniq: percent of the genome that is unique (not repetitive); het: overall rate of heterozygosity; kcov: mean kmer coverage for heterozygous bases. Note the top of the peak will not intersect the kcov line because of the over dispersion in real data; dup: average rate of read duplications; err: error rate of the reads. (I) Karyotype. (II) GC content. (III) Gene intensity. (IV) The intensity of transposable elements. (V) The intensity of long tandem repeats. The innermost ribbon plot shows the collinearity between chromosomes. The warmer colour indicates higher intensity.
Illumina library construction, sequencing, and genome survey
-
The genomic DNA was sheared into fragments of approximately 400 bp using S220-focused ultrasonicators (Covaris, USA). Adapters were ligated onto the 3' end of the fragments. After PCR amplification and purification, the final libraries were sequenced using the Illumina Nova-Seq platform (Illumina Inc., USA) with a 150 bp paired-end sequencing strategy. All types of Illumina short-read raw reads (including DNA short reads for genome surveys, Hi-C reads for scaffolding, and RNA-Seq reads) were quality controlled using fastp[14]. After QC, the clean data were used for the genome survey by estimating the K-mer distribution (K = 17) using Jellyfish software[15]. The genome size and heterozygosity ratio were estimated using GenomeScope[16].
Code availability: Jellyfish, version 2.2.6, parameters used: -m 17 -C.; GenomeScope, version 1.0.0.
PacBio library construction and sequencing
-
For PacBio sequencing, high molecular weight (HMW) DNA was extracted from the liver tissue according to the 20 kb SMRTbell Library Protocol. DNA quality was assessed by standard agarose gel electrophoresis and Thermo Fisher Scientific Qubit Fluorometry (Waltham, MA, USA). The genomic DNA was sheared to an average size of 15 kb using g-TUBE (Covaris). Damaged DNA and ends were enzymatically repaired, and DNA fragments were enriched and purified using 1× AMPure beads. Hairpin adapters were ligated using a blunt-end ligation reaction for a circular consensus (CCS) library. The libraries were sequenced using P6-C4 chemistry on a PacBio Sequel II sequencing platform at Shanghai OE Biotech Co., Ltd. (Shanghai, China).
Hi-C library construction and sequencing
-
For Hi-C library preparation, DNA was crosslinked and digested with the restriction enzyme, followed by biotin labelling and ligation to form chimeric circles. The biotinylated circles were pulled down and sheared again to construct a sequencing library with an insert size of 350 bp. The Hi-C library was sequenced using the Illumina HiSeq X-Ten platform (Illumina, San Diego, CA, USA) for chromosome pseudomolecule construction.
Transcriptome sequencing
-
Total RNA was extracted from six tissues (heart, liver, intestines, gills, muscle, and testis) of the same individual male fish using an Illumina TruSeq Stranded mRNA LTSample Prep Kit according to the manufacturer's protocol. RNA purity and quantity were evaluated using a NanoDrop 2000 spectrophotometer (Thermo Fisher Scientific, Waltham, MA, USA). RNA integrity was assessed using the Agilent 2100 Bioanalyzer (Agilent Technologies, Santa Clara, CA, USA). Libraries were constructed using the TruSeq Stranded mRNA LT Sample Prep Kit (Illumina Inc., USA) according to the manufacturer's instructions and sequenced on the Illumina Nova-Seq platform (Illumina Inc., USA) using the 150 bp paired-end read strategy.
Genome assembly
-
The multiple subreads of the same SMRTbell molecule were combined into a highly accurate consensus sequence (HiFi reads) with CCS mode[17], yielding 33.6 Gb of HiFi reads (read N50: 20.2 kb). Hifiasm[18] was used to assemble the genome using default parameters.
Code availability: CCS, version 4.2.0; hifiasm, version 0.11.
Hi-C scaffolding and gap-filling
-
In total, 92.0 million read pairs were input into the Juicer[19] and 3D-DNA[20], Hi-C analysis, and scaffolding pipelines. After the quality of Illumina reads was controlled, they were aligned to the draft assembly using BWA MEM[21]. The resulting Hi-C contact matrix was visualised using Juicebox[22], and the mis-assemblies and mis-joins were manually corrected based on the neighbouring interactions.
Code availability: Juicebox, version 1.11.9; 3d-DNA, version 20180922, parameters used: -r 1 -q 10; BWA MEM, version 0.7.17; Juicer, version 1.5.7.
Repeat annotation
-
For repeat annotation, the Extensive de-novo TE Annotator (EDTA version 1.7.0)[23] was adopted, which incorporates LTRharvest, LTR_FINDER, LTR_retriever, TIR-Learner, HelitronScanner, RepeatModeler, and RepeatMasker, as well as customized filtering scripts for de novo identification of each TE class, and compiles the results into a comprehensive TE library. Subsequently, the TEs identified were annotated by searching the EDTA TE library using RepeatMasker (version 4.0.9).
The Extensive De novo TE Annotator (EDTA version:1.7.0), as well as customized filtering scripts for de novo identification of each transposable elements (TE) class and compiles the results into a comprehensive TE library. The TE annotator EDTA pipeline[23] was used to de novo identify the TE class. Then, the results were compiled into a comprehensive TE library. RepeatMasker was used to perform the homolog annotation with the EDTA TE library and combined it with structural annotation from the raw step.
Code availability: EDTA, version 1.7.0; RepeatMasker, version 4.0.9.
Gene prediction and annotation
-
For gene prediction, RNA-seq data from six organs (heart, liver, intestines, gills, muscle, and testis) of Alosa sapidissima were aligned to the assembled genome using HISAT2 (version 2.10.2)[24], and transcripts were reconstructed using StringTie (version 1.3.0)[25]. Additionally, proteomes from three closely related species—Atlantic herring (Clupea harengus), zebrafish (Danio rerio), and Japanese rice fish (Oryzias latipes)—were obtained from the Phytozome database and incorporated to assist in the gene prediction and annotation of Alosa sapidissima.
Two rounds of MAKER[26] runs were performed to ensure the annotation quality. The gene predictor software AUGUSTUS[27] and GeneMark-ES[28] were trained using BRAKER2[29−32] with RNA-Seq and Iso-Seq transcripts aligned to the hard-masked genome. In the first round of MAKER runs, all homologous proteins, ESTs from NCBI (date: 2019.04.24), and transcripts of the aforementioned three species were reassembled using StringTie[25] and integrated for genome annotation using MAKER[26]. The predicted gene models with AED scores equal to zero were extracted for SNAP[33] training. In the second round of MAKER[27], multiple tiers of coding evidence were combined, including ab initio gene prediction from three software programs, transcript evidence, and protein evidence, to generate a comprehensive set of protein-coding genes. The integrity of genome assembly and annotation was evaluated using BUSCov3.1.0[34] by comparing with single-copy genes among 20 species in Actinopteri. The 20 species are: Astyanax mexicanus, Clupea harengus, Cynoglossus semilaevis, Danio rerio, Esox lucius, Fundulus heteroclitus, Gadus morhua, Gasteros teusaculeatus, Larimichthys crocea, Lepisosteus oculatus, Maylandia zebra, Notothenia coriiceps, Oreochromis niloticus, Oryzias latipes, Poecilia formosa, Scleropages formosus, Stegastes partitus, Takifugu rubripes, Tetraodon nigroviridis, and Xiphophorus maculatus.
Gene functions were predicted according to the best matches by aligning the protein sequences to the SwissProt[35], TrEMBL[35], NR[36], eggNOG[37], and KOG[38] databases using DIAMOND[39]. The motifs and domains were annotated using InterProScan[40] by searching against publicly available databases, including ProDom[41], PRINTS[42], Pfam[43], SMART[44], PANTHER[45], and PROSITE[46]. The Gene Ontology (GO) IDs for each gene were assigned according to the corresponding InterPro entry.
Genome-wide prediction of non-coding RNAs (ncRNAs), such as rRNA, small nuclear RNA, and miRNA, were performed with RNAmmer[47] and Infernal[48] against Rfam[49]. All putative tRNAs were identified using tRNAscan-SE[50].
Code availability: HISAT2, version 2.10.2; StringTie version: 1.3.0; BUSCO, version 3.1.0; Fastp 0.20.0; LTR_FINDER_parallel, version 20190525; TR_FINDER, version 1.0.7; LTR_retriever, version 2.8.2; TIR-Learner, version 2.4; AUGUSTUS, version 3.3.2; SNAP, version 20131129; StringTie, version 1.3.0; RepeatModeler, version 1.0.11; MAKER, version 2.31.10; BRAKER2, version 2.1.4; GeneMark-ES, version 4.3.8; Phytozome, version 12.1; DIAMOND, version 0.9.7, e-value ≤ 1 × 10⁻⁵; InterProScan, version 5.36; RNAmmer, version 1.2; Infernal, version 1.1.2; Rfam, version 14.1; tRNAscan-SE, version 1.3.1; HelitronScanner, version 1.1.
Comparative genomic analysis
-
Genome assemblies and annotations were downloaded from Phytozome[51], NCBI[52], and GigaDB[53]. Specifically, we downloaded genomes of 17 fish species, including Pygocentrus nattereri (GCF_015220715.1), Astyanax mexicanus (GCF_000372685.2), Ictalurus punctatus (GCF_001660625.1), Danio rerio (GCF_000002035.6), Sinocyclocheilus anshuiensis (GCF_001515605.1), Sardina pilchardus (GCA_003604335.1), Clupea harengus (GCF_900700415.2), Oryzias latipes (GCF_002234675.1), Xiphophorus maculatus (GCF_002775205.1), Oreochromis niloticus (GCF_001858045.2), Takifugu rubripes (GCF_901000725.2), Gadus morhua(GCF_902167405.1), Esox Luciusm (GCF_011004845.1), Salmo salar (GCF_000233375.1), Paramormyrops kingsleyae (GCF_002872115.1), Scleropages formosus (GCF_900964775.1), and Lepisosteus oculatus (GCF_000242695.1) for the phylogenetic analysis. The longest transcript was selected to represent each coding gene. Protein sequences were analysed using OrthoFinder[54] with diamond for all-to-all alignment. All single-copy orthologs were aligned using MAFFT[55]. All aligned sequences were concatenated to a super DNA chain, followed by trimming ambiguous or low-quality alignment regions using trimAl[56]. The trimmed protein alignment was input into RAxML[57] to construct a phylogenetic tree. The divergence time was estimated under a relaxed clock model using MCMCTree in the PAML[58] package. The orthologous gene pairs were identified using LAST in MCScan[59], and the synteny dot plot was obtained using dotplot script in JCVI[60]. Tandem duplicated genes were detected by MCScanX[61].
The single-copy orthologs inferred from OrthoFinder[54] and phylogenetic tree topology constructed using MCMCTree were input into café[62], which employs a random birth and death model to estimate the size of each family at each ancestral node. For each branch and node, an expanded and contracted gene family with a family-wise p-value less than 0.05 was defined as significant. Significantly overrepresented GO and KEGG terms among these significantly expanded gene families were identified using clusterProfiler[63], and the Benjamini-Hochberg false discovery rate (FDR) correction was applied. Terms that had FDR-adjusted p-values lower than 0.05 were considered significant.
Single-copy ortholog coding sequences (CDSs) were obtained from OrthoFinder[54] to identify positively selected genes in American shad within the species Astyanax mexicanus, Pygocentrus nattereri, Ictalurus punctatus, Sinocyclocheilus anshuiensis, D. rerio, Sardina pilchardus, and Clupea harengus. Based on the protein sequence alignment from MAFFT[55], CDSs were converted into codon nucleotides using Epal2nal.pl[64]. Additionally, a phylogenetic tree was constructed using IQ-TREE[65].
The nonsynonymous mutation rate (Ka) and synonymous mutation rate (Ks) of the single copy orthologous gene families of the American shad were analyzed for positive gene selection. Ks values were calculated through maximum likelihood estimation (MLE) using Codeml in the PAML56 package and Ks values were calculated using ParaAT.pl[64]. The raw Ks distributions were used to fit a mixed model of Gaussian distributions and were plotted with ggplot2[65]. Specifically, according to the clustering of each common single copy orthologus gene family, the codeml in the PAML package was subjected to calculate the MLE under two assumptions (zero hypothesis: H0: model = 2, NS sites = 2, Fix_omega = 1, and alternative hypothesis: H1: model = 2, NS sites = 2) through the branch site model. Then, based on MLE and the difference in degrees of freedom, the Chi-squared test was used to testify genes with Ka/Ks values greater than one were considered positively selected genes.
Code availability: PAML, version 4.9i; CAFE, version 4.2; KaKs_Calculator, version 2.0, parameters used: YN model; MCscan-(Python-version); JCVI, version v1.0.9; MCScanX, version 2, parameters used: BlastP e-value < 1 × 10⁻¹⁰; MCMCTree, in paml version 4.9i; RAxML, version 8.1.2, parameters used: 100 bootstrap replicates and PROTGAMMAAUTO model; OrthoFinder, version 2.2.7; MAFFT, version 7.407; trimAl, version 1.4.rev22, parameters used: -automated1; clusterProfiler, version 3.12; IQ-TREE, version 1.6.12; codeml, parameters used: runmode = 0 (user tree), set-type = 1 (codon sequences), CodonFreq = 2 (F3X4), model = 2, NSsites = 2. Fix_omega was set to 1 (omega or omega_1 fixed) for null hypothesis or set to 0 (estimated) for the alternative hypothesis.
-
Using the PacBio SequelII sequencing platform and CCS (Circular Consumer) mode, 519.6 GB of original data were output, with an average read length of 58.2 kb and an N50 of 140.4 kb (Supplementary Table S1). The subread was 518.6 G, with an average length of 17.2 kb and an N50 of 20.3kb. The HiFi data was 33.6 G, with an average length of 20.8 kb, N50 length of 20.2 kb, and Q30 length of 93.96%. HiFiasm software was used to assemble HiFi data, then a 919 M Genome size was obtained on a contig level. In total, 230,2 contigs were obtained, of which the longest was 7.3 M, and their average length was 399 kb, with a contigN50 of 1.15 M. The Benchmarking Universal Single-Copy Orthologs (BUSCO) evaluation for the assembly results was carried out using 4,584 single copy genes of Actinopteri, and the integrity was 93.2%. After Hi-C data quality control, 88.0 G clean data was had, with a Q30 of 91.06%.
Using the PacBio platform, 33.6 Gb of high-accurate HiFi reads were generated and a high-quality American shad genome was assembled with 36.56X sequencing coverage (Supplementary Table S1). The read N50 was 20.2 kb with an average read length of 17.2 kb (Supplementary Table S1). The final assembly size was 920 Mb, with a GC content of 43.19% and a contig N50 and scaffold N50 of 1.15 and 37.99 Mb, respectively (Table 1 and Fig. 1b). The heterozygosity rate is 0.469%, and about 413.7 Mb repetitive sequences were predicted, covering 45.0% of the assembled genome (Fig. 1b & Table 2). All the sequences can be successfully clustered on 24 chromosomes, with an attachment rate of 97.51%. The chromosome lengths ranged from 30.28 to 54.79 Mb (Table 3).
Table 1. Statistics of the American shad genome assembly.
Item Assembly statistics Total length (bp) 920,245,501 Number of contigs 2,302 Number of scaffolds 274 Contig N50 (bp) 1,152,427 Scaffold N50 (bp) 37,994,265 Maximum contig length (bp) 7,309,698 GC content (%) 43.19 Completely retrieved single-copy orthologs (%) 93.8 Complete and single-copy BUSCOs (%) 89.60 Complete and duplicated BUSCOs (%) 4.20 Partially retrieved single-copy orthologs (%) 2.5 Table 2. Annotation of repeat sequences.
Class Count Length (bp) Percentage DIRS 710 242765 0.03% DNA − − − DTA 508,133 116,314,889 12.64% DTC 225,315 31,080,936 3.38% DTH 26,565 5,057,458 0.55% DTM 138,994 22,287,764 2.42% DTT 7,397 1,097,116 0.12% Helitron 79,770 11,666,059 1.26% LINE 3,013 1,943,108 0.21% LTR − − − Copia 2,494 714,658 0.08% Gypsy 159,707 50,775,360 5.52% Unknown 302,822 65,763,801 7.15% MITE − − − DTA 46,637 5,802,613 0.63% DTC 5,594 551,629 0.06% DTH 4,346 371,579 0.04% DTM 92,139 14,049,594 1.53% DTT 418 31,172 0.00% Maverick 77 99,461 0.01% Penelope 830 867,362 0.09% TIR − − − Tc1-Mariner 470 99,441 0.01% Unknown 123,728 26,970,622 2.93% Total interspersed 1,729,159 355,787,387 38.66% Low complexity 74,138 6,172,731 0.67% Simple repeat 866,409 51,709,171 5.62% Total 2,669,706 413,669,289 44.95% DIRS, Dictyostelium intermediate repeat sequence; DTA, hAT superfamily; DTC, CACTA superfamily; DTH, PIF-Harbinger superfamily; DTM, Mutator superfamily; DTT, Tc1-Mariner superfamily; LINE, long interspersed nuclear elements; LTR, long terminal repeat; MITE, miniature inverted-repeat transposable elements; and TIR, terminal inverted repeats. To verify the completeness of genome assembly, we assembled the American shad genome by short reads sequence alignment (also used for survey analysis) through bwa (v0.7.17), marked the repeated sequence with GATK (v4.2.0.0), and then counted the alignment rate through qualimap (v2.2.1). Illumina generated data was 1,003,563,064 reads. 86,8212,582 reads were back to the genome, with an alignment rate of 98.33% (Supplementary Table S2), which proved that the genome was assembled with high quality. Combined both Pacbio and Illumina data, BUSCO evaluation showed that 93.8% and 2.5% of the conserved single-copy orthologous genes were completely and partially retrieved, with completed and duplicated BUSCOs of 4.2%, suggesting the high quality of the assembled genome sequence (Table 1). 28,120 protein-coding genes encoding 29,212 proteins were predicted (Table 3). The integrity of genome assembly and annotation was evaluated by comparing with 4,584 single-copy genes among 20 species in Actinopteri, of which 4,064 (88.6%) were found in the genome assembly. The karyotype, GC content, gene intensity, the intensity of transposable elements, and the intensity of long tandem repeats on 24 chromosomes are demonstrated in Fig. 1c.
Table 3. Statistics of the American shad genome by chromosome.
Chromosome Size (Mb) Gap no. GC% Gene Protein tRNA miRNA snRNA snoRNA lncRNA Chr1 54.79 70 43.00 1,841 1,927 108 19 412 36 97 Chr2 44.56 97 43.03 1,252 1,314 35 18 370 5 69 Chr3 42.16 90 42.79 1,212 1,246 63 8 5 24 50 Chr4 41.48 104 42.50 1,396 1,444 39 8 2 12 72 Chr5 41.39 59 43.14 1,477 1,527 66 14 5 28 90 Chr6 40.62 77 43.62 1,246 1,315 31 29 3 11 79 Chr7 40.49 73 42.80 1,369 1,423 1,108 23 89 15 90 Chr8 39.44 93 43.28 1,178 1,241 58 9 3 7 73 Chr9 39.36 54 42.85 1,258 1,301 89 16 284 9 95 Chr10 38.18 77 43.27 1,199 1,246 134 8 4 27 83 Chr11 37.99 73 43.11 1,240 1,299 65 18 7 19 86 Chr12 37.72 74 43.28 1,297 1,354 2,247 12 7 6 71 Chr13 37.34 80 43.05 1,143 1,189 89 13 9 33 81 Chr14 36.50 56 43.05 1,028 1,055 1,886 10 9 22 65 Chr15 35.68 108 43.60 1,054 1,096 1,111 9 2 2 73 Chr16 35.61 65 43.05 949 986 31 5 1 3 65 Chr17 34.99 96 43.28 1,073 1,106 102 15 1 9 68 Chr18 34.23 127 43.25 962 1,006 69 548 4 132 45 Chr19 31.23 117 43.33 858 873 99 10 214 3 50 Chr20 31.03 74 43.21 850 877 79 13 6 12 45 Chr21 30.88 101 43.27 994 1,027 33 8 4 15 59 Chr22 30.85 85 43.30 1,014 1,042 41 8 2 15 64 Chr23 30.44 76 43.47 1,021 1,085 89 3 2 12 81 Chr24 30.28 102 43.14 1,055 1,079 66 10 6 11 56 Unplaced 22.88 0 45.29 154 154 590 750 1,642 0 3 Total 920.24 2,028 43.19 28,120 29,212 8,328 1,584 3,093 468 1,710 Phylogenetic and evolutionary analysis
-
Supplementary Table S3 presented the ortholog gene families in American shad and the other 17 species. 250 single-copy orthologous genes from the 20,706 gene families were identified, which were used to construct a phylogenetic tree (Table 4). The data showed that three species from the Clupeidae family (including Alosa sapidissima, Sardina pilchardus, and Clupea harengus) formed a relatively independent clade, which diverged from other teleosts 207.7 million years ago (Mya). In this clade, the American shad is most closely related to the European pilchard (Sardina pilchardus) (Fig. 2a).
Table 4. Statistics of orthology genes in phylogenetic tree construction.
Item Statistics Number of genes 479,036 Number of genes in orthogroups 453,950 Number of unassigned genes 25,086 Percentage of genes in orthogroups 94.8% Percentage of unassigned genes 5.2% Number of orthogroups 20,706 Number of species-specific orthogroups 286 Number of genes in species-specific orthogroups 1,204 Percentage of genes in species-specific orthogroups) 0.3% Mean orthogroup size 21.9 Median orthogroup size 19 G50 (assigned genes) 26 G50 (all genes) 23 O50 (assigned genes) 5,190 O50 (all genes) 5,701 Number of orthogroups with all species present 7,489 Number of single-copy orthogroups 250 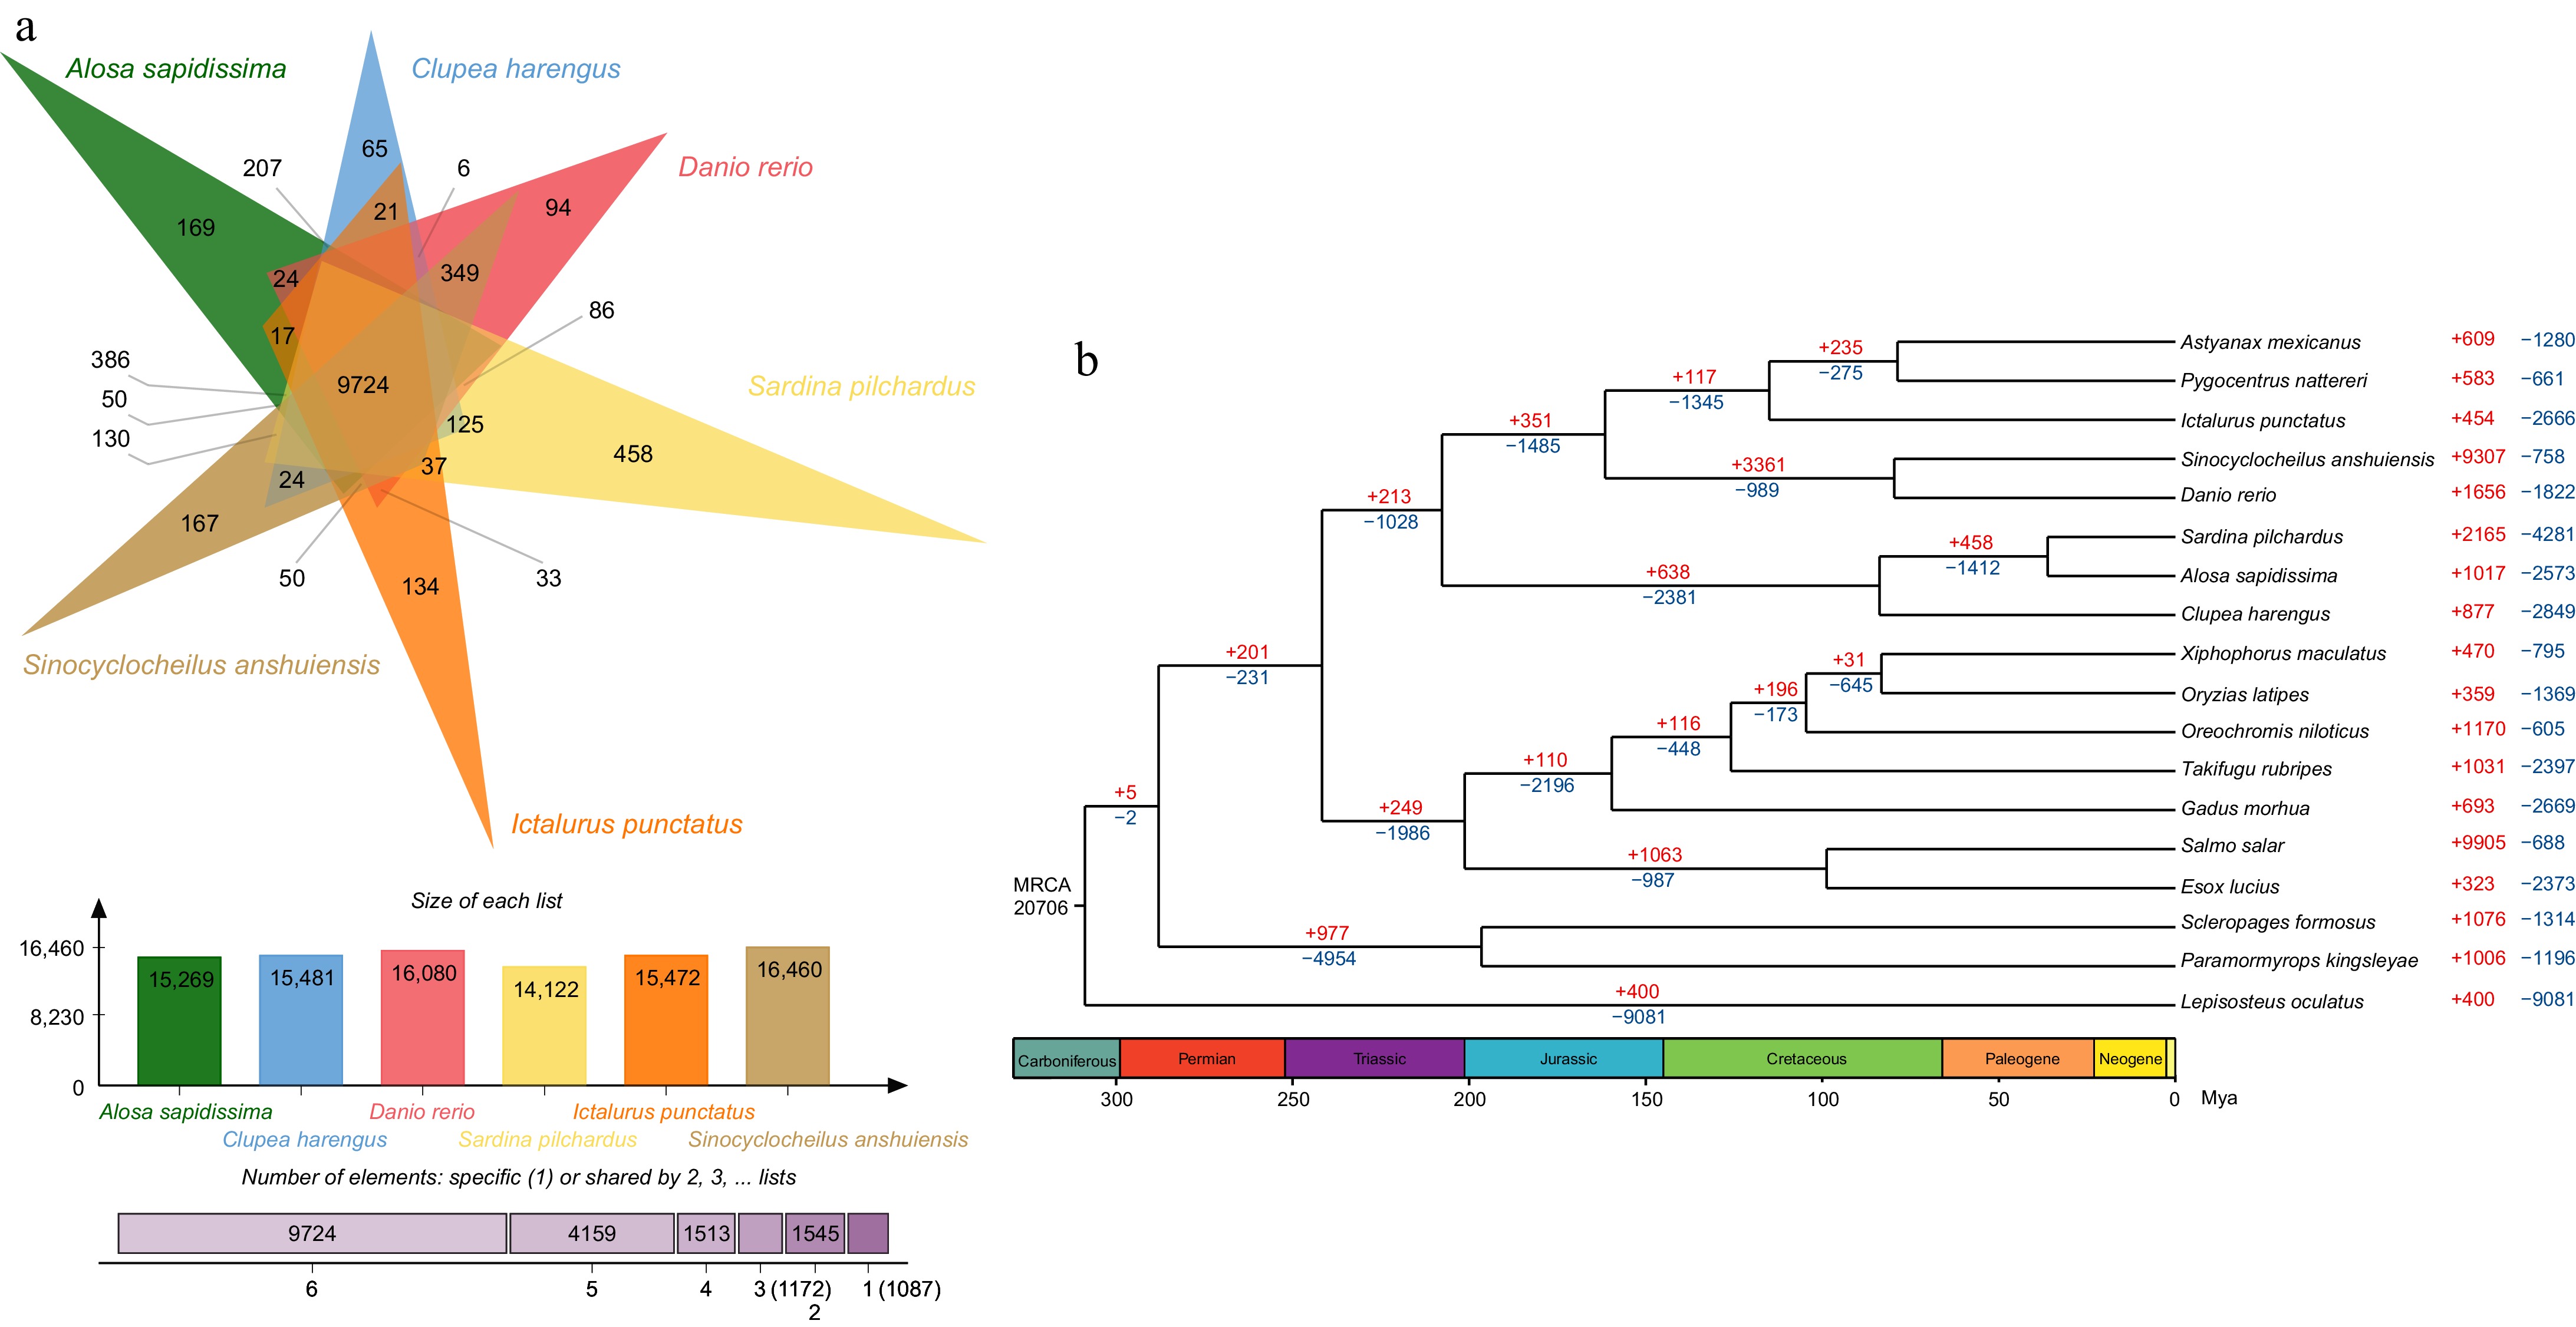
Figure 2.
Phylogenetic tree, gene family expansion and contraction analysis and venn diagram for common and unique genes in American shad genome. (a) Top: the diagram shows the number of common and unique gene families of six species; Middle: the number of gene families of six species; and Bottom: the number of gene families shared by the six species. (b) Phylogenetic analyses indicated by a time divergent tree and gene family expansion and contraction analysis (red numbers = expansion; blue numbers = contraction; black numbers = the estimated divergence time).
In the gene expansion/contraction section, we focused primarily on the American shad's gene families. And the contractions and expansions within these gene families were analysed to understand their evolution and adaptation. 1,017 expanded and 2,573 contracted gene families were identified (Fig. 2a), including 81 expanded (1,038 genes) and 143 contracted (508 genes) gene families that have undergone rapid evolution. Gene Ontology (GO) enrichment analysis showed genes related to motion and signal transduction such as calcium ion trans-membrane transport, ATP binding, voltage-gated calcium channel activity, actin filament binding, motor activity, cell cycles (including proliferation and apoptosis) such as DNA replication, serine-type endopeptidase activity, ubiquitin-protein transferase activity, negative regulation of adenylate cyclase activity, DNA-directed DNA polymerase activity, lipoprotein metabolic process, regulation of cell cycle, and endogenous immunity such as activation of innate immune response was expanded (Supplementary Table S4). While genes in the adaptive immunity family such as MHC class II protein complex, CCR1 chemokine receptor binding, CCR4 chemokine receptor binding, CCR5 chemokine receptor binding, antigen processing, and presentation, inflammatory response, response to virus, immune response, and chemokine activity were contracted (Supplementary Table S4 ).
Analysis of common and unique gene families
-
Five fish species, Sardina pilchardus, Clupea harengus, Danio rerio, Sinocyclocheilus anshuiensis, and Ictalurus punctatus which are very closely related to American shad were selected to find the common and unique gene families using Orthovenn2[66], 169 specific gene families were obtained, which were applied to interpret the potential biological significance of American shad (Fig. 2b). For instance, unique gene families may be tied to distinct biological traits, such as sensitivity. Functional enrichment analysis of the 169 unique gene families indicated that American shad has better growth and development capabilities than other closely related species. Enriched GO BP (Biological Process) terms showed that American shad has unique gene regulation and cell proliferation behaviours (Fig. 3a).
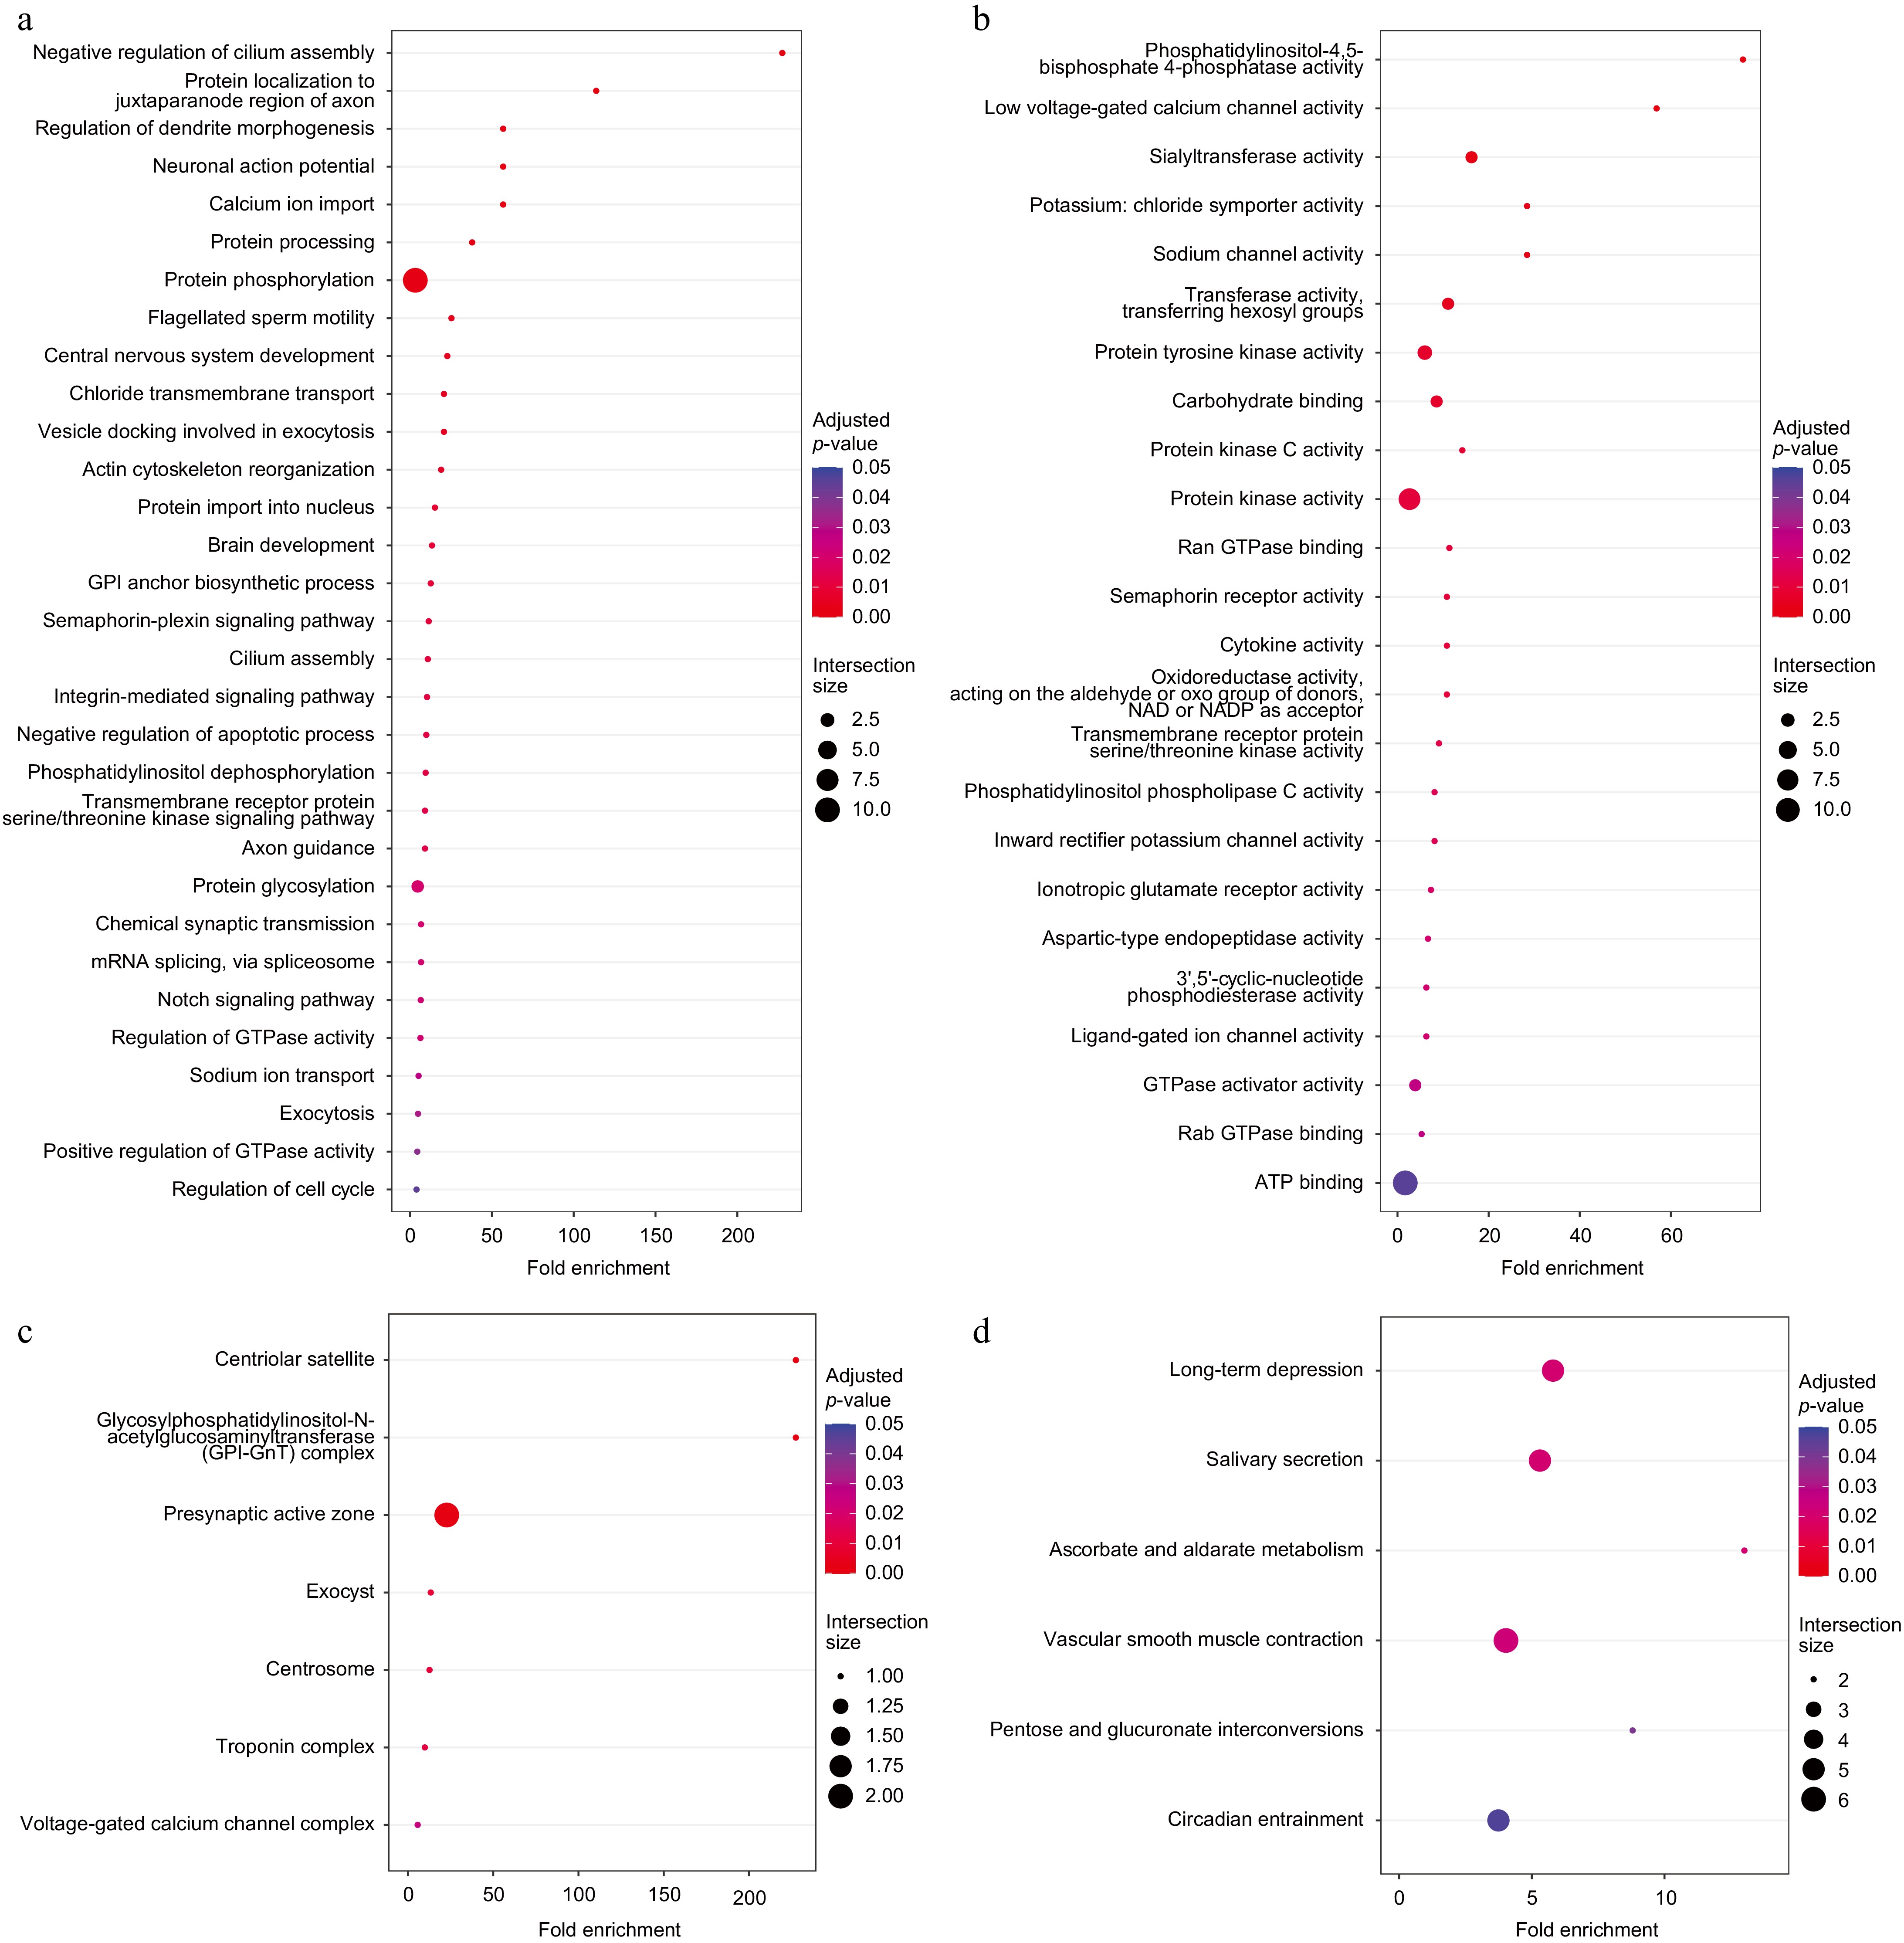
Figure 3.
Functional enrichment analysis of 169 specific gene families. (a) Enriched GO BP terms. (b) Enriched GO MF terms. (c) Enriched GO CC terms. (d) Enriched KEGG pathways.
Consistently, in the GO MF (Molecular Function) enriched terms (Fig. 3b), the enrichment of the terms, such as low voltage-gated calcium channel activity, potassium: chloride symporter activity, sodium channel activity, inward rectifier potassium channel activity, and ligand-gated ion channel activity, indicated that the development of the nervous system in American shad was enhanced, while the stress system may be more sensitive. At the same time, redox reactions in American shad may be stronger, promoting the energy supply, as indicated by the enrichment of terms such as Ran GTPase binding, oxidoreductase activity, GTPase activator activity, Rab GTPase binding, and ATP binding. In the enriched GO CC (Cellular Component) terms (Fig. 3c), the enrichment of specific positively selected gene families in the centrosome and centriolar satellite suggests that these genes are associated with cell cycle and division, and the enrichment in the troponin complex.
The enriched KEGG terms (Fig. 3d) are consistent with the above conclusions. The long-term depression pathway suggests that these genes are associated with neurogenesis, vascular smooth muscle contraction suggests that they are associated with the locomotor system, pentose, and glucuronate interconversions.
Analysis of positively selected genes
-
The evolutionary relationships of seven species, including Astyanax mexicanus, Pygocentrus nattereri, Ictalurus punctatus, Sinocyclocheilus anshuiensis, Danio rerio, Sardina pilchardus, Clupea harengus, together with Alosa sapidissima were constructed as the background branch, and Alosa sapidissima was marked as foreground branch. One hundred and seventy one gene families were positively selected (Supplementary Table S5). GO terms associated with basic life activities were significantly enriched in positively selected gene families (Fig. 4a) including gene expression (such as formation of translation pre-initiation complex, translational initiation, tRNA methylation, and transcription by RNA polymerase III), biosynthesis (such as de novo pyrimidine nucleobase biosynthetic process, coenzyme A biosynthetic process, uroporphyrinogen III biosynthetic process, and ribosome biogenesis), and metabolism (such as polyamine metabolic process, regulation of protein catabolic process, proteasome assembly, and negative regulation of protein ubiquitination). The above results suggested individuals that have sound basic physiological conditions would be naturally selected.
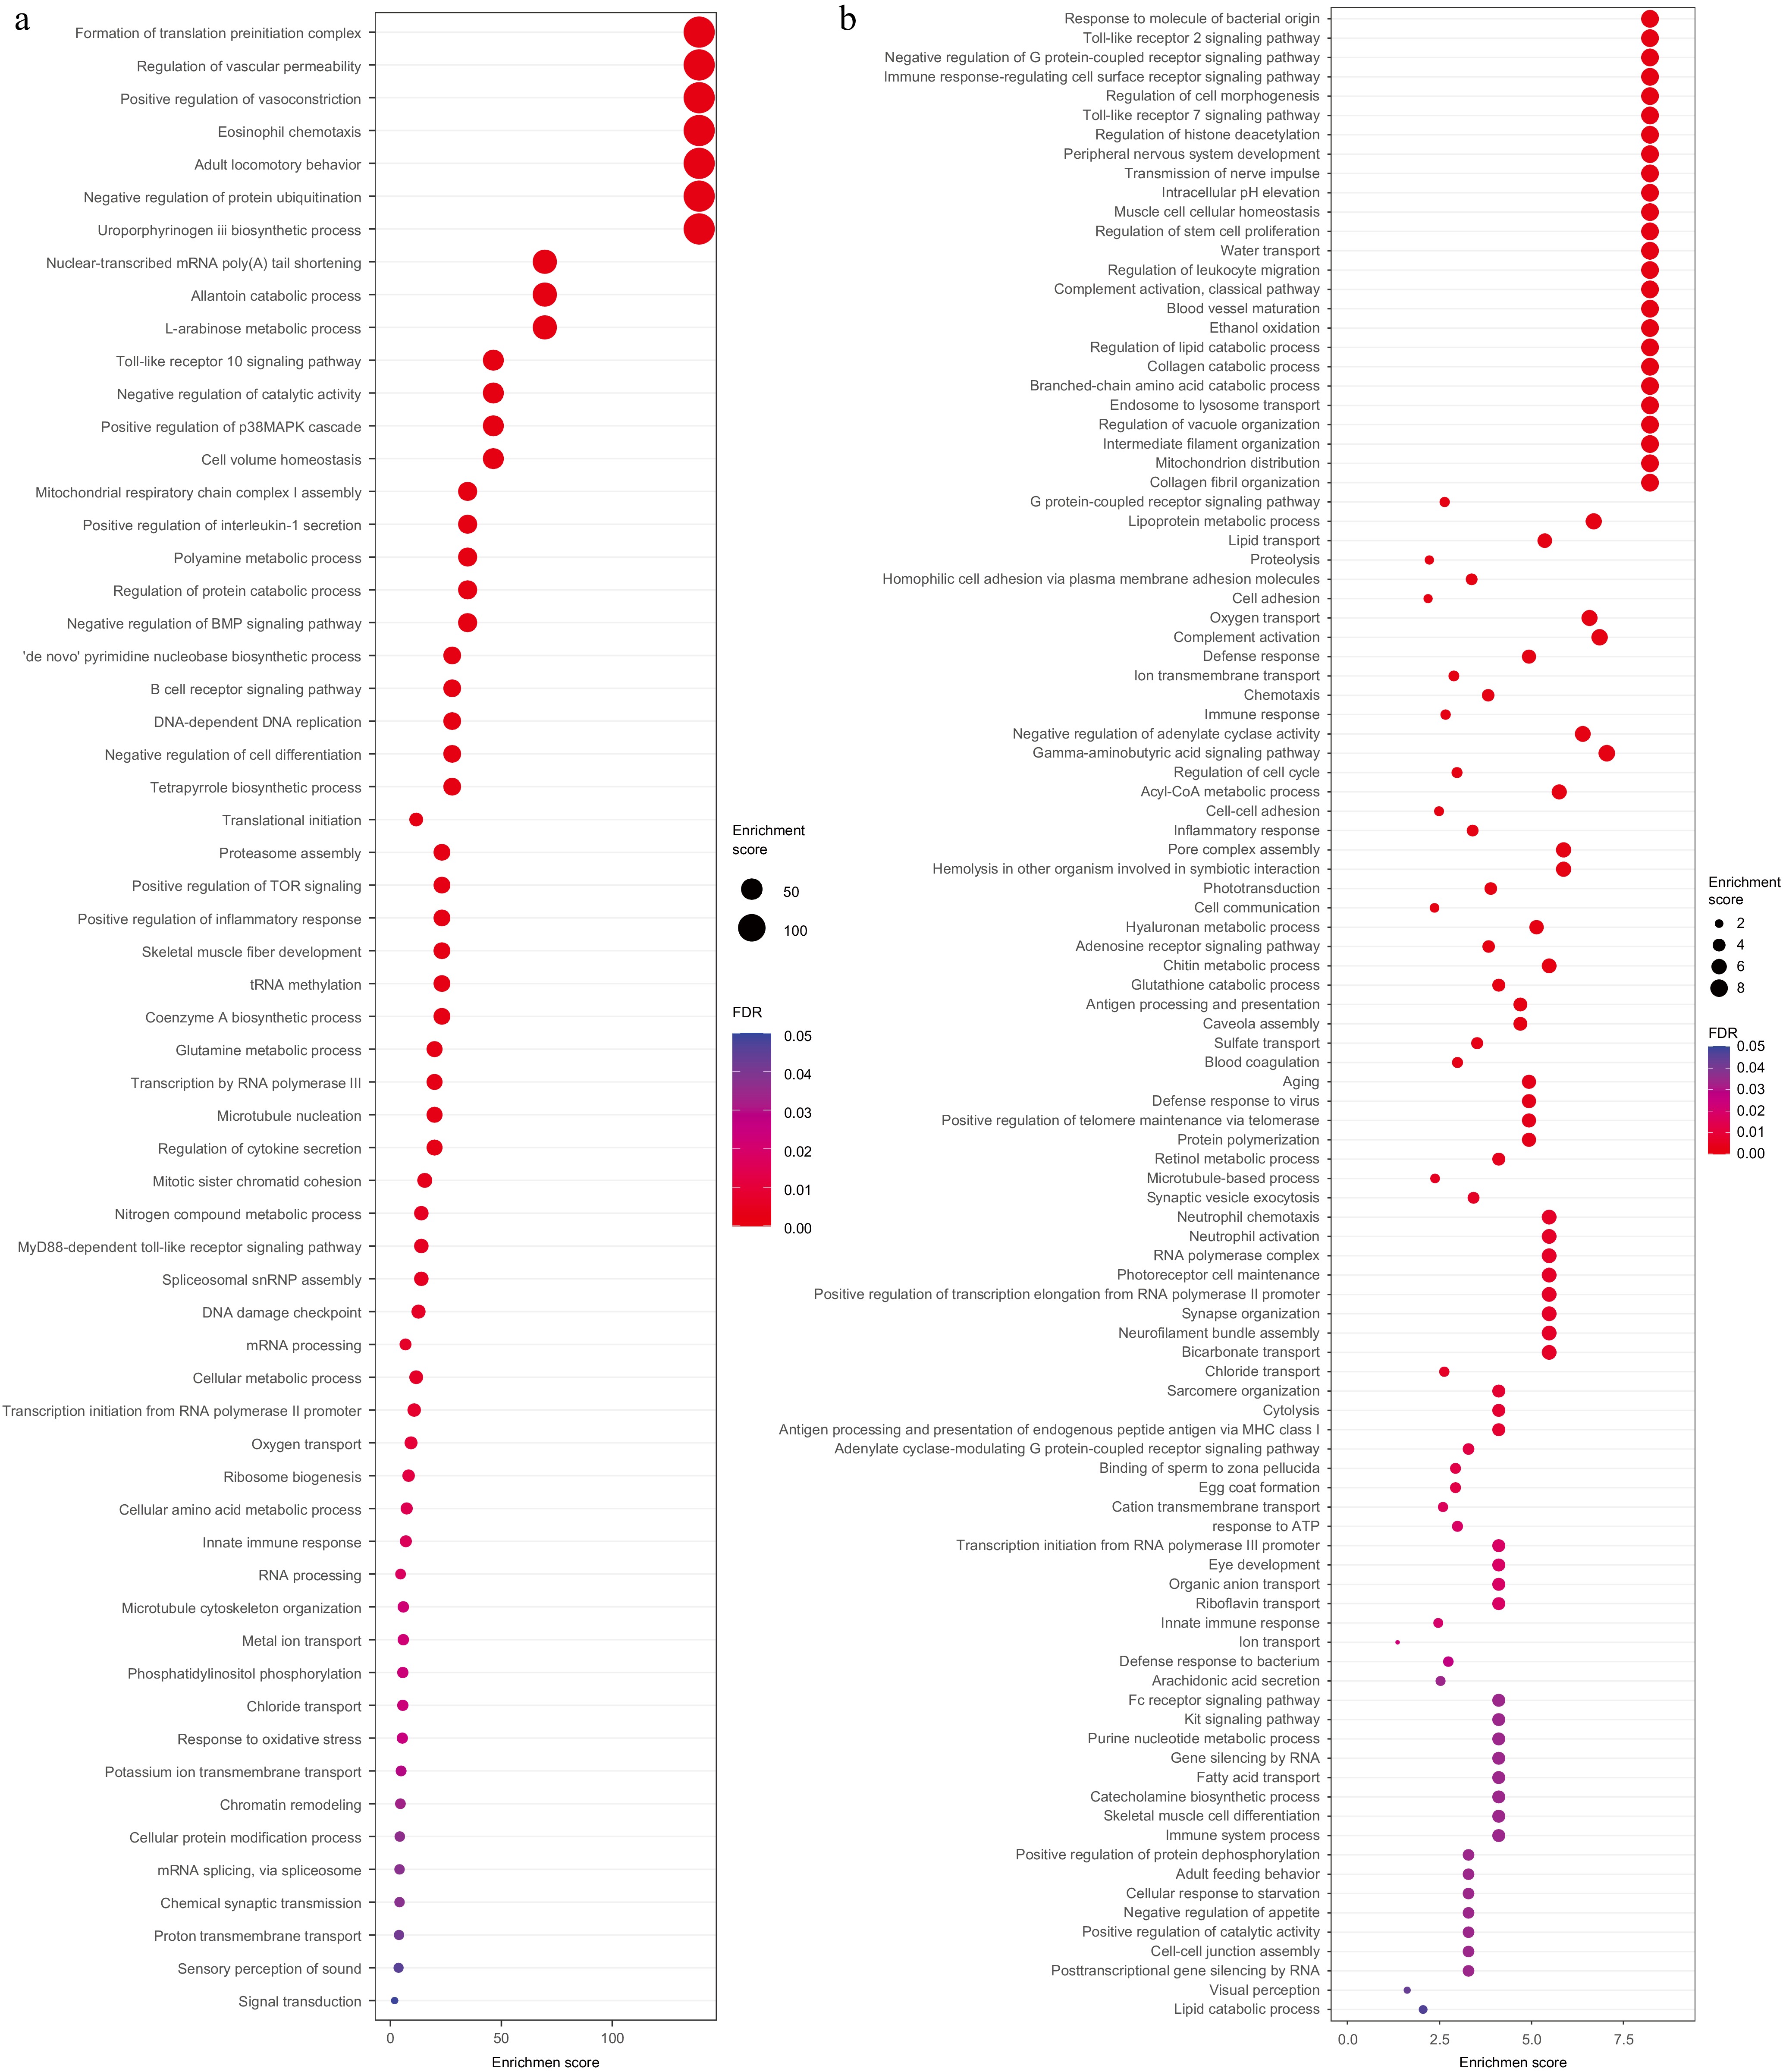
Figure 4.
GO enrichment analysis for positive selected genes and tandem duplicated genes GO enrichment analysis for (a) positive selected genes, and (b) tandem duplicated genes.
Analysis of tandem duplicated genes
-
Duplicated sequences can be divided into tandem repeat sequences and interspersed sequences. The tandem repeat sequence includes microsatellite sequence, minisatellite, and interspersed repeat sequences, also known as transposable elements (TEs). The EDTA process was used to predict repeat sequences, which combines LTR_ Finder, LTR detector to annotate the TEs, and Helitron Scanner and TIR Learner, Repeat Mask, and Repeat Modeler to annotate the tandem repeat genes. Among 45.0% of repetitive sequences, dispersed sequences account for 38.7%, low complexity sequences for 0.67%, and simple repeat sequences for 5.62%, respectively (Table 2). For the TEs, long interspersed nuclear elements (LINE) and long terminal repeat (LTR) accounted 0.21% and 12.8% (Table 2). The protein sequences translated from the longest transcripts of all genes were aligned using blastp (with an e-value threshold of ≤ 1E-10) to obtain pairs of homologous genes. Subsequently, the MCScanX software was employed to identify and determine the type and quantity of tandem repeat genes. 3,254 tandemly duplicated genes were predicted in the genome of American shad (Fig. 4b). Consistently, the significantly enriched GO terms are mainly associated with basic life activities, including cell homeostasis maintenance (such as intracellular pH elevation, and chloride transport), movement (collagen fibril organisation, transmission of nerve impulses, muscle cell cellular homeostasis, and motor activity), and metabolic process catalysis (such as lipid catabolic process, branched-chain amino acid catabolic process, and collagen catabolic process), which is consistent with the results of genes under positive selection. On the other hand, some immune-related terms are also enriched, such as toll-like receptor signalling pathway, interleukin-1 receptor binding, RAGE receptor binding, regulation of leukocyte migration, and chemotaxis. This indicates that, although some immune reactions might have degenerated, other alternative specific immune pathways might be maintained in this species.
-
This study presents a high-quality genome assembly (920 Mb, 24 chromosomes) of the American shad (A. sapidissima). Consistent with previous studies, the analysis suggests that American shad has the closest relationship with European pilchard (S. pilchardus), with similar genome sizes, although they belong to different subfamilies[67,68]. However, the genome sizes of the species in the same subfamily of the American shad have larger differences, such as ilish (Tenualosa ilisha), which has a genome size of 762.5 Mb[69].
Interestingly, the genome data revealed many genes related to metabolic processes, especially energy supply molecules and pathways, were significantly enriched in positively selected and/or tandem duplicated genes, such as lipid catabolic process, lipoprotein metabolic process, and L-arabinose metabolic process. Also, the movement-related genes were enriched. All of these are concordant with the biological characteristics of the American shad. For example, the American shad, a high-speed swimmer in days and nights, often overreacts to noise, lightning and some other environmental stimulations (such as low dissolved oxygen), which demand high metabolic rates, and energy supply[4,10,70]. The GO MF enrichment of the terms indicated the development of the nervous system was enhanced, and redox reactions may be stronger in American shad, which may explain some of the unique characteristics of the American shad in aquaculture systems. This species is very sensitive to environmental disturbances, such as sudden noise and flashing lights, which induces high-speed, frantic, disorderly swimming resulting in collisions with each other in the culture system, resulting in serious body damage, and even death[10,71]. It also often overreacts to handling and netting, which easily results in scale loss, physiological stress, and asphyxiation death[72]. Therefore, American shad is considered to be one of the most sensitive species with high metabolic rates which leads to difficulties in its culture management, and needs special considerations to domesticate carefully in an aquaculture system.
-
This study presents a high-quality, chromosomal-level genome assembly of American shad using the PacBio platform and tissue-specific transcriptomic data. Comparative genome analysis indicated the closest relationship between the American shad and European pilchard. GO enrichment analysis of tandem duplicated genes and positively selected genes showed that terms belonging to biological process, related with favour basic life activities such as gene expression, biosynthesis, metabolism, cell homeostasis maintenance, especially motion and immunisation were kept, which agreed with the physiological characteristics of American shad.
-
All procedures were reviewed and preapproved by the Ethics Committee of Postdoctoral Workstation of Suzhou Ecoman Biotechnology Co., Ltd. Identification number: 2020-HACCP-RAS-GM-006.
-
The authors confirm contribution to the paper as follows: project conception and coordination: Liu Q; sampling performed, DNA and RNA extraction: Du J; sequencing experiments design: Zheng Y; data analysis: Deng S, Zheng Y; writing - draft manuscript preparation: Zheng Y, Deng S; writing - revision: Deng S, Liu Q. All authors reviewed the results and approved the final version of the manuscript.
-
The whole-genome sequencing raw data (including HiFi reads SRR14718725 and Hi-C reads SRR15254506) were submitted to the NCBI Sequence Read Archive (SRA) database under BioProject PRJNA732845. The assembled genome was deposited into GenBank under accession GCA_019202745.1. The raw RNA-seq reads of American shad have been deposited in SRA under the BioProject PRJNA734783, including testis (SRR14719578), muscle (SRR14719579), gills (SRR14719580), intestines (SRR14719581), liver (SRR14719582), and heart (SRR14719583). The genome assembly version described in this paper is version JAHTKL010000000.
-
We would like to thank Mr. Han Meng and Ms. Naomi Sudo for their assistance in sampling the fish tissues. We would also like to express our appreciation for support from the Ecological Center at the University of Memphis, USA.
-
The authors declare that they have no conflict of interest.
- Supplementary Table S1 Statistics of PacBio sequencing data of American shad genome.
- Supplementary Table S2 Statistics of NGS data mapping to genome.
- Supplementary Table S3 Summary of orthology gene numbers in phylogenetic tree construction.
- Supplementary Table S4 GO enrichment of rapidly expanded and contracted genes in the American shad genome.
- Supplementary Table S5 List of positive selected genes.
- Copyright: © 2025 by the author(s). Published by Maximum Academic Press, Fayetteville, GA. This article is an open access article distributed under Creative Commons Attribution License (CC BY 4.0), visit https://creativecommons.org/licenses/by/4.0/.
-
About this article
Cite this article
Zheng Y, Deng S, Du J, Liu Q. 2025. A chromosomal-level genome assembly of the American shad: insights into phylogenetic relationships. Genomics Communications 2: e006 doi: 10.48130/gcomm-0025-0005 

A chromosomal-level genome assembly of the American shad: insights into phylogenetic relationships
- Received: 21 October 2024
- Revised: 25 February 2025
- Accepted: 27 February 2025
- Published online: 28 March 2025
Abstract: American shad is an important fishery species distributed in North America. It was introduced to China in 2003 and has become one of China's most expensive aquaculture species. Here we report a high-quality, chromosomal-level genome assembly using the PacBio sequencing platform and tissue-specific transcriptomic data. The results showed the genome size is 920 Mb, with G + C content of 43.19%, contig N50 and scaffold N50 of 1.15 and 37.99 Mb. All the sequences can be successfully clustered on 24 chromosomes, with an attachment rate of 97.51%. 28,120 coding genes encoding 29,212 proteins were identified. A phylogenetic tree was constructed based on 250 single-copy orthologous genes selected from 20,706 gene families with 18 fish species, which suggests it is most closely related to European pilchard. For genome comparison, 1,017 expanded and 2,573 contracted gene families, including 81 expanded and 143 contracted ones were identified. One hundred and sixty nine unique gene families were obtained, which can explain the biological traits. Enrichment analysis of tandem duplicated genes and positively selected genes showed that terms related to biological processes for basic life activities were enriched, such as gene expression, biosynthesis, metabolism, movement, and immunization. The data can provide invaluable information to understand habitual natureo American shad.
-
Key words:
- Genomics /
- Transcriptomics /
- Genome annotation /
- Phylogenetic analysis /
- Evolution