


-
Genome size, defined as the DNA content of a haploid genome in a species[1], represents a fundamental biological trait with profound evolutionary and ecological implications. The standard measurement units include picograms (pg) or megabase pairs (Mb), with a conversion factor of 1 pg ≈ 978 Mb[2]. Among land plants, genome size exhibits remarkable variability[3]. Differences in genome size are correlated with multiple adaptive traits in plants, including cell division rates in cellular processes[4], reproductive modes in mating systems[5], growth forms in morphology[6], ecological stoichiometry in biochemical processes[7], and diversification rates in speciation processes[8]. Ecologically, genome size exerts pleiotropic effects on cellular architecture and organismal life history strategies[9,10]. The C-value, defined as the amount of DNA contained within a haploid nucleus (i.e., the unreplicated gametic genome size), has been observed to correlate positively with cellular traits such as increased cell volume and prolonged cell cycle duration. Conversely, it exhibits an inverse relationship with metabolic rates, potentially imposing evolutionary constraints on ecological niche breadth[11,12]. Notably, the species-specific stability of the C-values facilitates phylogenetic reconstruction and taxonomic identification, highlighting their taxonomic utility[13], whereas in genomic applications, precise determination of the C-value provides critical parameters for estimating the sequencing depth, optimizing costs, and assembling repetitive sequences[14]. Among its emerging roles, genome size transitions serve as an intrinsic genomic property that can act as a dynamic biomarker for evolutionary trajectories in ecological dynamics, their precise quantification has been a critical research priority[15,16]. Undoubtedly, genome size has important ecological and evolutionary implications[3,17,18]; thus, estimating genome size is vital for understanding its associated functional significance. Consequently, accurate estimation of genome size is becoming increasingly important..
Contemporary genome size estimation relies on four methods: (1) flow cytometry (FCM)[19], (2) genomic survey sequencing[20], (3) Feulgen microdensitometry[21], and (4) real-time quantitative polymerase chain reaction (qPCR)[22]. Each method offers distinct advantages depending on the research objectives and available resources. Among these techniques, FCM has emerged as the predominant method and has been widely used for estimating plant genome size, owing to its unique advantage of the combination of operational simplicity with standardized protocols, high reliability and reproducibility, time efficiency, and broad applicability across a wide range of genome sizes[23]. The technique operates by staining nuclei with DNA-specific fluorochromes and comparing the fluorescence intensities against internal standards (Fig. 1). As noted by Bennett et al.[23], FCM via the optical electronic approach enables rapid, high-throughput measurements and has revolutionized genome size studies. The widespread adoption of FCM, especially in plant sciences, has facilitated the creation of comprehensive genome size databases, enhanced taxonomic and phylogenetic research, supported plant breeding programs, and provided insights into evolutionary patterns (Supplementary Fig. S1). While FCM remains dominant, the genomics revolution has introduced powerful computational alternatives with the increasing accessibility of high-throughput sequencing. In particular, K-mer analysis has gained momentum in estimating genome size by deriving size estimates directly from raw sequencing reads (Fig. 1 and Supplementary Fig. S2). Moreover, K-mer analysis provides supplementary genomic metrics, such as heterozygosity level, repeat content composition, and genome complexity[24]. These computational approaches are particularly advantageous for non-model organisms lacking cytogenetic data or in situations where FCM infrastructure is unavailable[24,25]. Recent technological advances, particularly in long-read sequencing and genome assembly algorithms, have significantly enhanced the accuracy and utility of sequencing-based estimation techniques, positioning them as increasingly viable alternatives to traditional techniques[26].
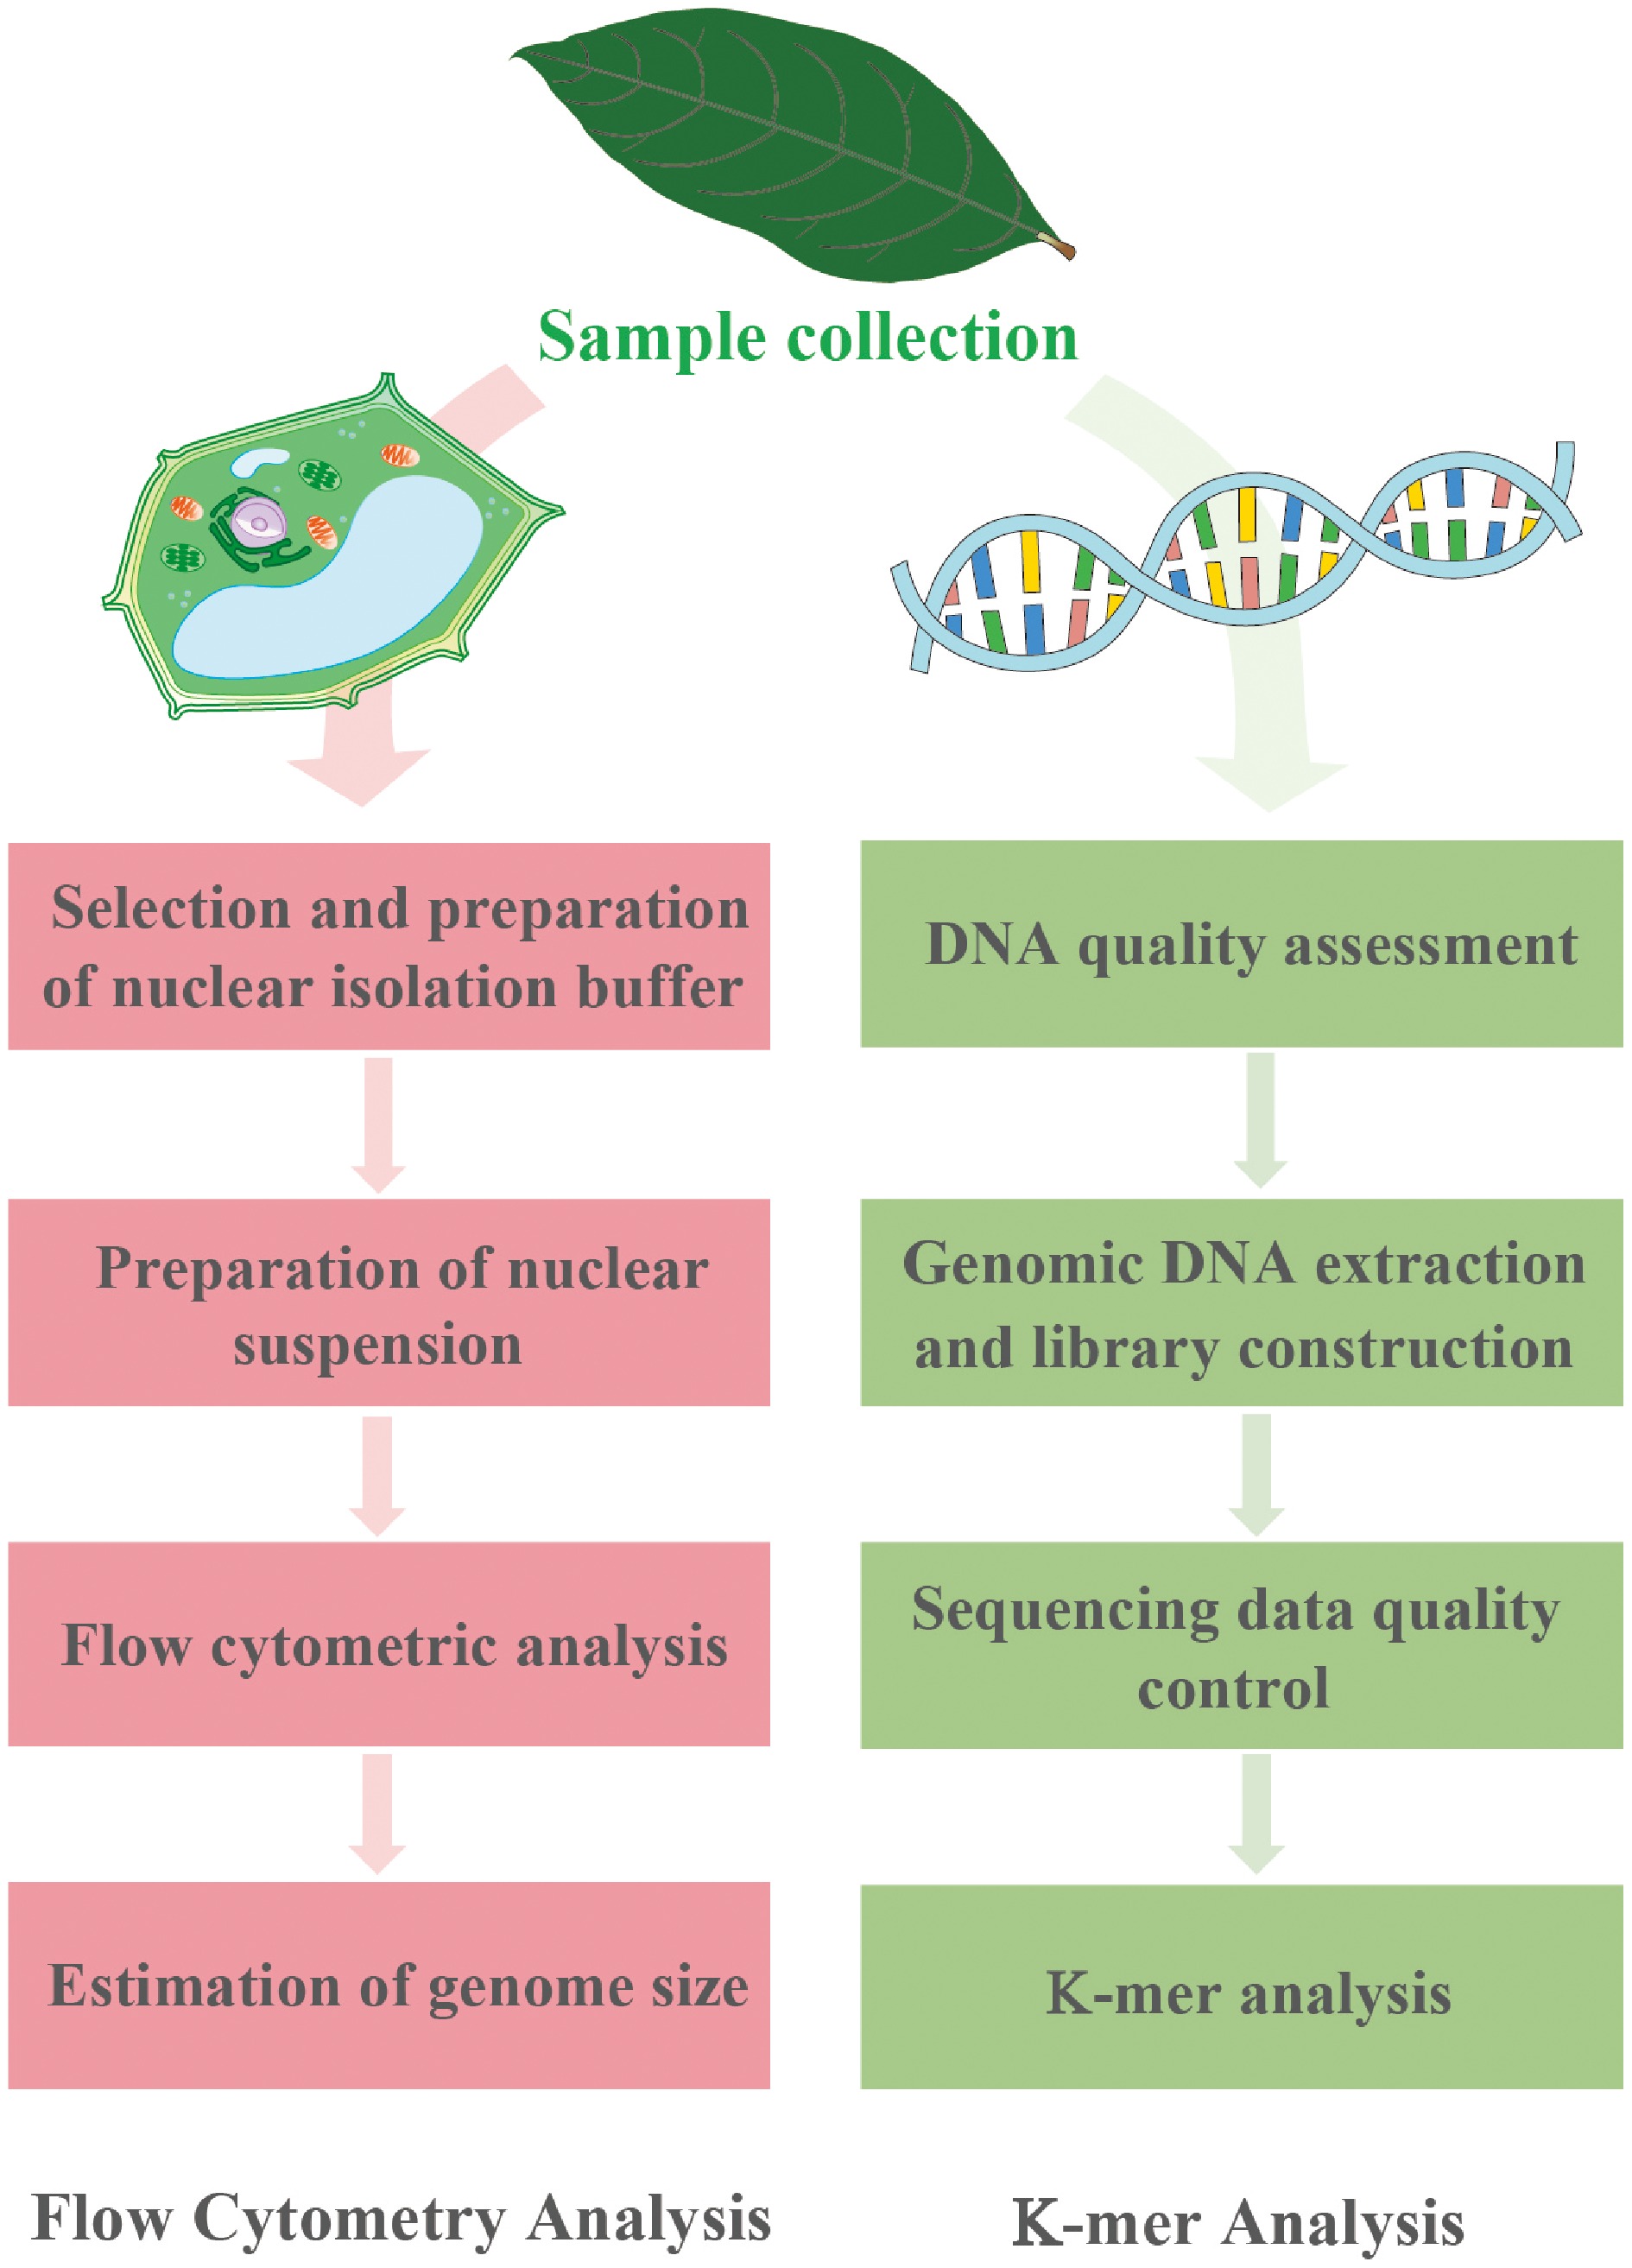
Figure 1.
Experimental protocols for FCM (left) and K-mer analysis (right).
With the rapid advancement of sequencing technologies, the long-standing status of FCM as the "gold standard" for estimating plant genome size has come under scrutiny[27]. While FCM directly measures nuclear DNA content via fluorescent dyes and internal standards, its accuracy can be affected by the staining protocols, the choice of reference species, and interfering secondary metabolites in plant tissues. In contrast, K-mer-based methods infer genome size from sequencing read data by identifying and counting unique K-mer occurrences. Additionally, FCM also has limitations, notably its requirement for fresh or properly preserved nuclei[27,28]. By comparison, K-mer approaches do not require living tissue and can be applied retrospectively to archival sequencing data[29].
Several empirical studies have demonstrated that K-mer estimates may substantially deviate from FCM measurements. For example, K-mer analysis of male Oncopeltus fasciatus reads yielded genome size estimates that were 60 to 1,110 Mb larger than the ~930 Mb value obtained by FCM[30]. Similarly, a study on the whitefly Bemisia tabaci reported K-mer-based estimates approximately 60 Mb larger than the FCM values for one biotype[31]. K-mer estimates in Oryza species were 5%–10 % larger than the FCM values in most cases[32]. Conversely, in Reseda lutea and Reseda pentagyna, K-mer-derived C-values were 7%–13% lower than the FCM measurements, possibly due to chemical interference affecting FCM's accuracy[33]. These contrasting findings have sparked debate over whether K-mer-based approaches can fully replace FCM. Should FCM, long considered the gold standard for estimating genome size, be phased out in favor of emerging K-mer-based methods?
In this study, we focused on Engelhardia, a representative genus within the Juglandaceae family, to conduct a comparative analysis of genome size estimates across five species: Engelhardia spicata var. spicata, Engelhardia spicata var. colebrookeana, Engelhardia spicata var. aceriflora, Engelhardia roxburghiana, and Engelhardia fenzelii. This genus is widely distributed in tropical and subtropical regions of East Asia, and fossil evidence suggests a close association with tropical environments in the Indochina Peninsula during the early Eocene. Subsequent climatic cooling during the Miocene, along with the onset of the East Asian summer monsoon, is believed to have driven the diversification of Engelhardia into subtropical regions, highlighting its ecological and evolutionary significance[34−36].
To systematically evaluate genome size estimation methodologies, we employed both FCM and K-mer analysis using low-coverage sequencing data. FCM was used to quantify nuclear DNA content following standardized protocols, providing baseline genome size estimates and facilitating the assessment of interspecific variation. Concurrently, genome survey analyses were conducted using short-read next-generation sequencing data to estimate genome sizes through K-mer distribution analysis and to obtain additional genomic metrics, such as heterozygosity and repeat content. By integrating the results from both approaches, we aimed to assess their relative strengths and limitations in the context of determining genome size in non-model woody plants. Specifically, we evaluated the consistency, resolution, data requirements, and applicability of these methods to species with limited genomic resources. Through this dual-method evaluation, we sought to determine whether FCM remains indispensable for estimating genome size or if genome survey analysis can serve as a reliable alternative. This comprehensive assessment provides valuable insights for comparative genomics and biodiversity research into tropical tree taxa, such as Engelhardia.
-
For this study, young leaf samples from five Engelhardia species were collected at different locations in China and immediately stored in liquid nitrogen. Details of the species, collection sites, and geographic coordinates are provided in Supplementary Table S1. The internal reference plant for FCM, Zea mays 'A188', was provided by the Kunming Institute of Botany, Chinese Academy of Sciences.
Preparation of nuclear suspensions
-
Tissue samples were immersed in 0.8 mL of precooled MGb lysis buffer [45 mM MgCl2·6H2O, 20 mM 3-(N-morpholino)propanesulfonic acid (MOPS), 30 mM sodium citrate, 1% (w/v) polyvinylpyrrolidone (PVP) 40, 0.2% (v/v) Triton X-100, 10 mM Na2EDTA, and 20 μL/mL β-mercaptoethanol; pH 7.5]. The samples were finely chopped in a vertical direction using a sharp razor blade to facilitate nuclear release, followed by incubation on ice for 10 min. The resulting suspension was then filtered through a 40-μm nylon mesh to obtain a nuclear suspension. For nuclear staining, appropriate volumes of a precooled propidium iodide (PI) solution (stock concentration: 1 mg/mL) and an RNase solution (stock concentration: 1 mg/mL) were added to the nuclear suspension. The mixture was incubated on ice in the dark for 0.5–1 h to ensure complete staining. The final working concentration of both PI and RNase was adjusted to 50 μg/mL[1,27].
FCM for estimating genome size
-
The nuclear suspensions of the target samples were mixed with the internal reference Zea mays 'A188' at an appropriate ratio. FCM analysis was performed using a BD FACScalibur flow cytometer. The stained nuclear suspensions were excited with a 488-nm blue laser, and the fluorescence emission intensity of PI was measured. For each analysis, data were collected from 10,000 particles, ensuring that the coefficient of variation (CV%) remained below 5%. FCM histograms were generated and analyzed using ModFit 3.0 software.
PI is a fluorescent dye that intercalates uniformly into double-stranded nucleic acids, enabling specific staining of DNA. Under excitation at 488 nm, the fluorescence emission of PI–DNA complexes can be detected by a flow cytometer. The amount of PI intercalated during staining is proportional to the DNA content, allowing the fluorescence intensity to serve as an indicator of the relative genomic DNA content. By comparing the fluorescence peak intensities of the PI–DNA complexes from the target sample and the internal reference plant, the DNA content ratio between the two can be determined. The genome size of the target sample (C-value) is then calculated by multiplying the C-value of the internal reference by the fluorescence intensity ratio of the genome size of the target sample. Mathematically, it is calculated using the following formula: Genome size of target sample = Genome size of reference × Fluorescence intensity of target sample/Fluorescence intensity of reference sample[1]. When measuring the genome size of Engelhardia using FCM, we applied this standardized approach, with Zea mays (2,300 Mb) as the internal reference standard (Supplementary Table S2).
Genomic DNA extraction and sequencing
-
For genome sequencing, the genomic DNA was extracted by the MGIEasy Genomic kit following the manufacturer's instructions. The quality of the extracted DNA was assessed using an ultraviolet–visible spectrophotometer. Illumina libraries with an insert size of 350 bp were prepared on a PCR-free DNBSEQ platform (BGI, Wuhan, China) and sequenced on a paired-end (PE) 150-bp format system. The quality of the raw sequencing data was assessed using seqtk (
https://github.com/lh3/seqtk ), including evaluations of base quality, sequence length distribution, and GC content (Supplementary Tables S3 and S4).K-mer analysis
-
To estimate the genome size, heterozygosity, and repeat content of five Engelhardia species, we employed a K-mer analysis method[37]. According to the principle that genome size equals the total number of K-mers divided by the expected K-mer depth, the genome size of each species was estimated. Heterozygosity (based on the ratio of the heterozygous peak to the homozygous peak) and the proportion of repeat sequences (calculated from the area difference between the observed K-mer curve and the expected Poisson distribution) were also inferred from the K-mers' distribution. To ensure robustness of the estimates, K-mer frequency analyses were performed across a range of K-mer lengths (19 to 43) using Jellyfish v2.3.0[38]. The resulting frequency histograms were then analyzed using GenomeScope2[39] to evaluate consistency across different K values. Among them, the 43-mer was selected for the main analysis in this study due to its optimal balance between resolution and complexity. Detailed survey results for all tested K-mer lengths are provided in Supplementary Tables S5–S9. To ensure the accuracy of the genome survey results, we systematically evaluated the quality of the K-mer frequency histograms and the model fitting. The histograms' quality was assessed based on three criteria: (i) presence of a clear, sharp primary peak, (ii) separation from low-frequency erroneous K-mers, and (iii) low background noise. GenomeScope2 model fitting was evaluated using two key parameters: the fitted model's R² (coefficient of determination) and the residual error.
-
Clear and distinct fluorescence peaks were observed for all five Engelhardia species as well as for the internal reference, Zea mays (maize), in the FCM analyses using PI staining (Fig. 2). The absence of background noise and signal overlap confirmed the reliability of maize as a reference standard. For each species, consistent fluorescence intensities were obtained across three replicates, and the fluorescence ratios relative to maize were used to estimate the genome sizes (Supplementary Figs. S3–S7). The inferred genome sizes ranged from approximately 800 to 870 Mb (Fig. 2, Supplementary Table S2).
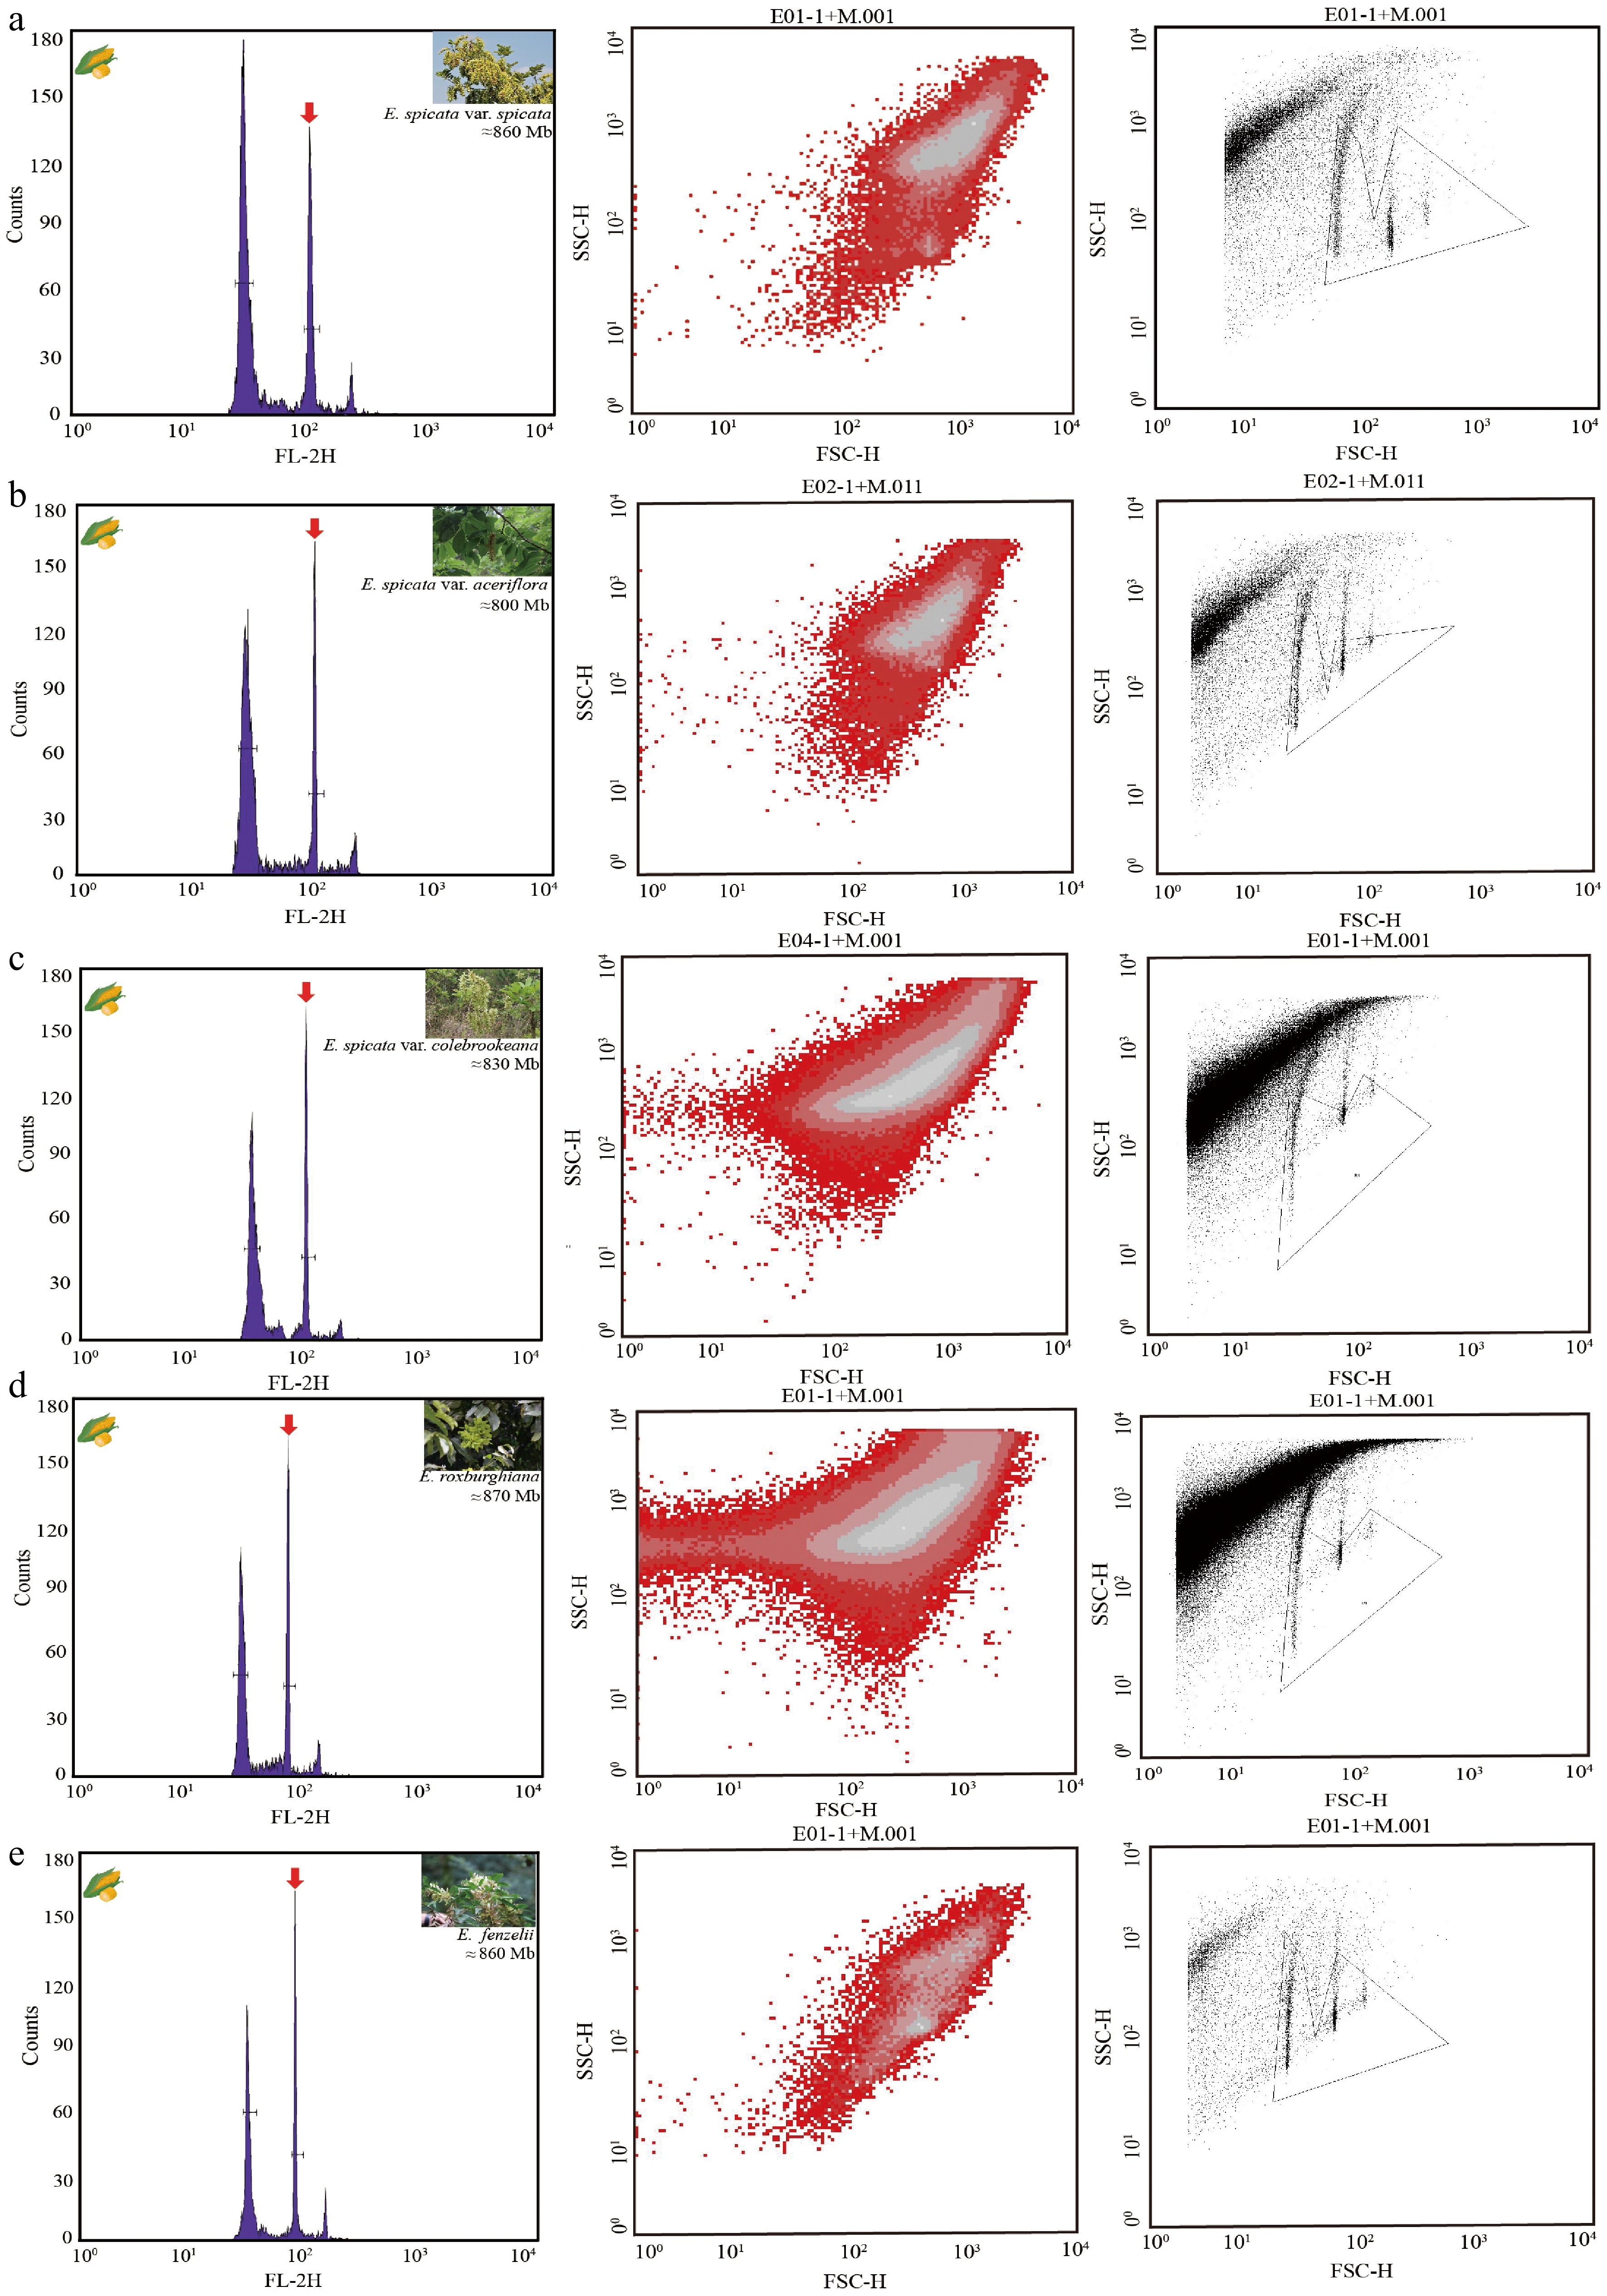
Figure 2.
FCM histograms and scatter plots of estimated nuclear DNA content in five Engelhardia species. (a)–(e) represent different species or varieties of Engelhardia, showing the FCM results from the same sample. Left: fluorescence intensity histogram (FL-2H) indicating the relative nuclear DNA content, with the major G1 peaks marked by red arrows. Middle: dot plots of forward scatter (FSC-H) versus side scatter (SSC-H), showing cell/nuclei size and granularity. Right: corresponding gated regions for nuclei selection in FSC-SSC space. (a) E. spicata var. spicata; estimated genome size ≈ 860 Mb. (b) E. spicata var. aceriflora; estimated genome size ≈ 800 Mb. (c) E. spicata var. colebrookeana; estimated genome size ≈ 830 Mb. (d) E. roxburghiana; estimated genome size ≈ 870 Mb. (e) E. fenzelii; estimated genome size ≈ 860 Mb. All measurements were performed using PI staining with an appropriate internal standard. Histograms show clearly separated peaks for the sample and standard, allowing a reliable estimation of genome size.
Genome feature estimation based on K-mer analysis
-
K-mer frequency analysis based on 43-mers revealed distinct bimodal distributions in four Engelhardia species, namely E. spicata var. spicata, var. aceriflora, var. colebrookeana, and E. roxburghiana, with prominent secondary peaks located at approximately half the depth of the main peak (Fig. 3a–d), with estimated heterozygosity rates ranging from 1.02% to 1.08% (Supplementary Table S10). In contrast, E. fenzelii showed a broad, right-skewed distribution without a distinct heterozygous peak, corresponding to a lower heterozygosity rate of 0.45% (Fig. 3e). Genome size estimates based on K-mer depth ranged from 724.53 to 1,130.59 Mb, with the E. spicata complex exhibiting relatively conserved genome sizes (~724 to 734 Mb), while E. roxburghiana and E. fenzelii showed larger genome sizes (858.50 and 1,130.59 Mb, respectively) (Fig. 3f). Repeat content was also markedly higher in E. fenzelii (58.30%) compared with the other species (13.80%–18.50%). Model fitting statistics from GenomeScope2 indicated reliable estimates, with all samples achieving R² values above 95% and residual errors below 0.4% (Supplementary Table S10).
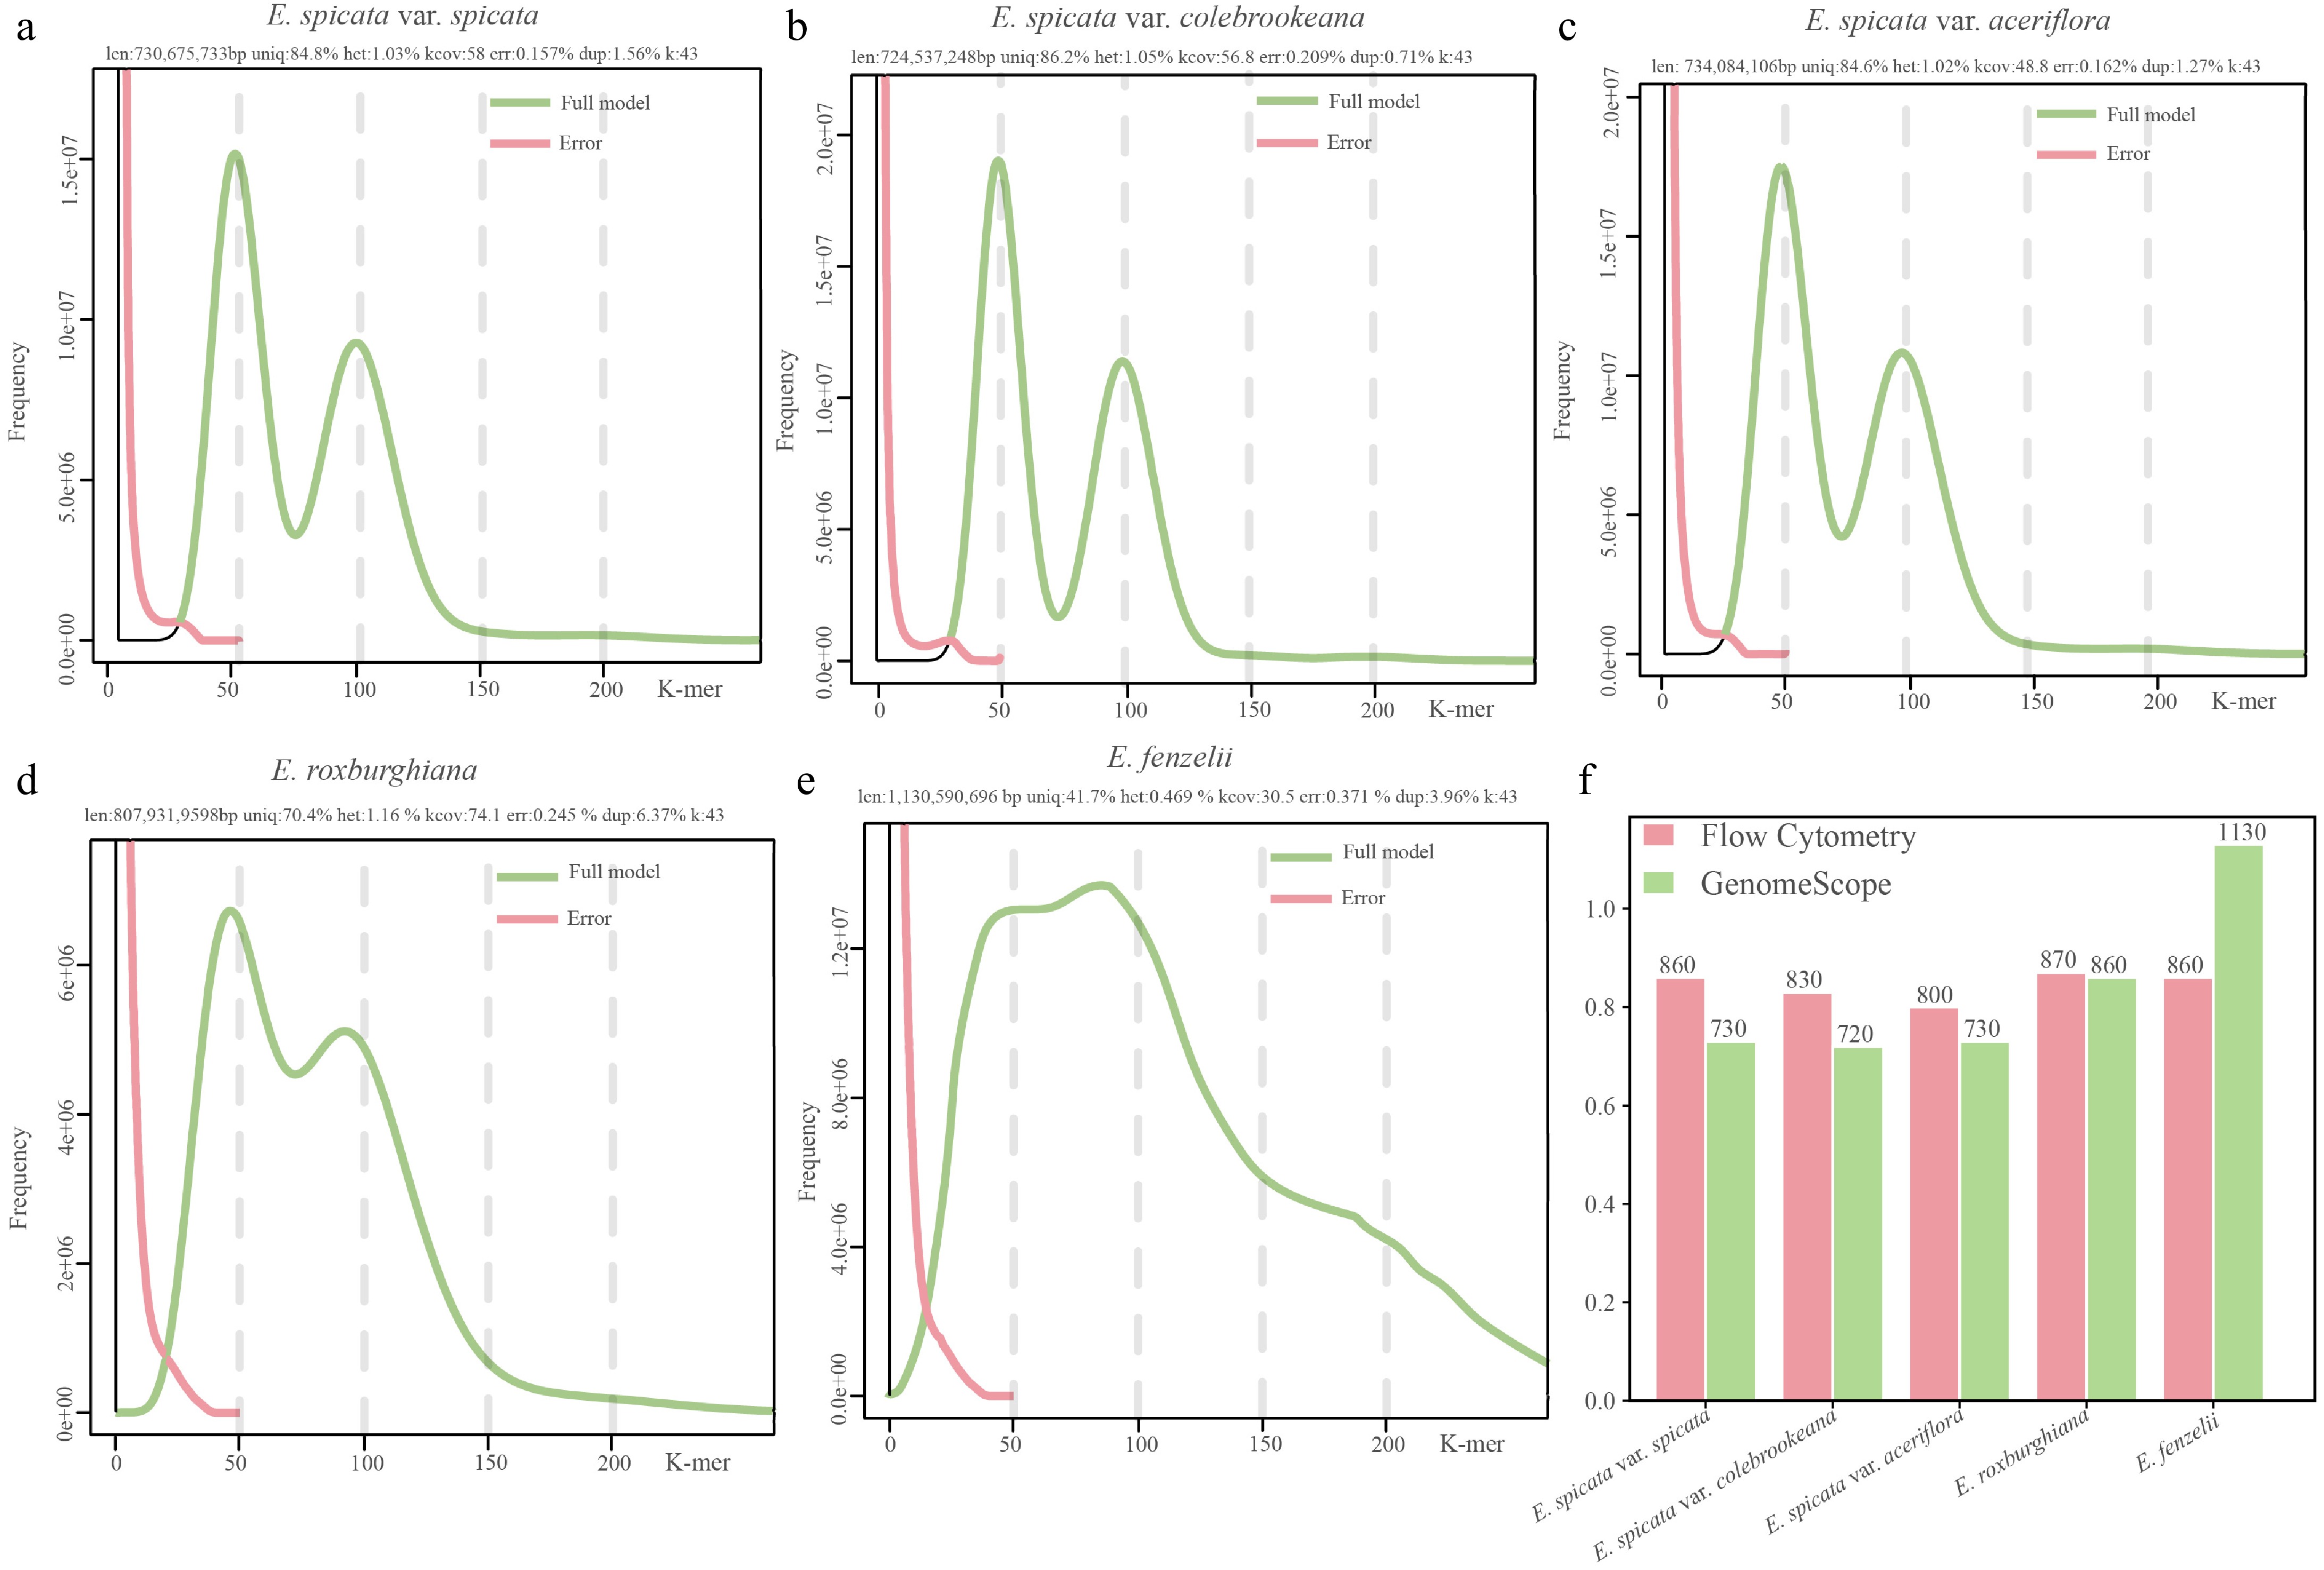
Figure 3.
Estimated genome size based on K-mer analysis and comparison with FCM measurements in five Engelhardia species. (a)–(e) K-mer frequency distributions and genome profiling results generated using GenomeScope2 for five Engelhardia taxa based on Illumina sequencing data (K = 43). The green curve represents the model's fit to the observed K-mer frequency histogram, while the pink curve shows the error. Key genome characteristics such as genome size, heterozygosity (het), unique sequence proportion (uniq), and sequencing error rate (err) are shown above each plot. (f) Comparison of genome size (Mb) estimates from FCM (pink bars) and K-mer analysis (green bars).
-
Estimating genome size is fundamental to genomic studies, yet method-dependent variability remains a key challenge[40]. In this study, we systematically compared FCM and K-mer-based approaches to estimate genome sizes across five representative Engelhardia species. These findings provide important insights into the accuracy, underlying assumptions, and limitations of both methods when applied to plant genomes with varying levels of heterozygosity and repeat content.
Accuracy and reliability of FCM-based genome size estimation
-
Our FCM measurements determined that five representative Engelhardia species possess genome sizes narrowly ranging from 800 to 870 Mb, with sharp, distinct PI fluorescence peaks and minimal background noise, indicating high-quality nuclear preparation and reliable quantification (Fig. 2, Supplementary Table S2, Supplementary Figs. S3–S7). In particular, E. roxburghiana exhibited an FCM-estimated genome size of approximately 850 Mb, which closely aligns with 884.78 Mb chromosome-level assembly reported by Ding et al.[41]. This near concordance (≤ 4% difference) underscores FCM's precision when standardized protocols and internal controls, such as maize (Zea mays; 2,300 Mb), are employed to mitigate staining-related artifacts[27].
K-mer-based approaches underestimate genome size in highly heterozygous genomes
-
In contrast, the K-mer-based estimates in our study underestimated the genome size compared with the FCM results in E. spicata (var. spicata, aceriflora, and colebrookeana) and E. roxburghiana, all of which exhibited heterozygosity levels > 4%. This likely reflects misinterpretation of the model in the context of elevated heterozygosity. In diploid genomes, heterozygous sites produce distinct K-mers from each allele, whereas homozygous sites yield identical K-mers. Consequently, in K-mer frequency histograms, homozygous K-mers typically occur at double the depth (≈ 2C), whereas heterozygous K-mers appear at half that depth (≈ C), resulting in a characteristic bimodal distribution: the primary peak corresponds to homozygous regions, and the secondary peak reflects heterozygous variation. As heterozygosity increases, the abundance of heterozygous K-mers rises accordingly, often making the secondary peak more prominent or even higher than the main peak. Such distributional shifts can lead to erroneous genome size estimations if the secondary (C) peak is mistakenly assigned as the main (2C) coverage peak[42]. In this case, the estimated K-mer depth (Ck) is artificially inflated. According to the standard formula for estimating genome size, namely G = [N × (L – K + 1)] / (Ck × p), where G is the genome size, N is the total number of reads, L is the read length, K is the K-mer size, Ck is the estimated coverage depth, and p is ploidy, an overestimated Ck will reduce the calculated genome size G[24,43,44]. This bias is especially pronounced in highly heterozygous species, as observed in our data, and underscores a fundamental limitation of K-mer-based approaches insuch genomic contexts even when using heterozygosity-aware models like GenomeScope2.
K-mer-based approaches overestimate genome size in repeat-rich genomes
-
An exception was E. fenzelii, which had low heterozygosity (0.45%) and exhibited a substantially inflated K-mer-based genome size (1,130.6 Mb) compared with the FCM estimate (860 Mb). This discrepancy appears to stem from its extraordinarily high repeat content (~58.3%). Studies have shown that excessive repeat content can distort K-mer histograms, leading to misinterpretation of the sequencing depth and genome size[24,43]. Specifically, when repeat units approach or exceed the K-mer length, the histogram’s main peak may flatten or broaden-hindering accurate resolution of homozygous depth (Fig. 3e). This ultimately causing the model to fit a lower sequencing depth, thus inflated the estimated genome size[22,45].
Sensitivity to K-mer parameters and implications
-
It is important to highlight that genome sizes estimated via K-mer analysis are also sensitive to the parameter settings and model selection. In this study, we tested a range of K-mer sizes (K = 9–43) and observed a notable trend: as K increased, the estimated repeat content decreased steadily (Supplementary Tables S5–S9). While this is consistent with expectations that shorter K-mers inflate repeat estimates due to reduced resolution, it also reinforces the necessity of empirical optimization of K[46]. Based on comprehensive model evaluation (peak clarity, residual error, convergence), we selected K = 43 for our final estimates. However, we acknowledge that the characterization of repetitive sequences and heterozygosity is sensitive to K-mer size and modeling strategy[47]. These aspects merit further investigation, but fall beyond the primary scope of this study, which centers on assessing the accuracy of estimating genome size. Future efforts may incorporate parameter tuning, multiple modeling tools, and long-read sequencing to refine analyses of repeats and heterozygosity.
Our results advocate for an integrative framework: pairing sequencing-based inference with cytometric validation offers more accurate estimates of genome size, particularly in complex plant genomes. For non-model taxa such as Engelhardia, this dual strategy ensures reliable genome characterization, providing a solid foundation for downstream applications including genome assembly, comparative genomics, and evolutionary studies.
-
Our findings underscore critical methodological considerations for estimating genome size in plant genomics research. Specifically, inherent limitations of relying solely on K-mer-based methods emerge when applied to complex or repetitive plant genomes, particularly those with high structural complexity (e.g., high repeat content) or heterozygosity. For taxa lacking comprehensive reference genomes, the accuracy of K-mer–based estimates may be compromised. Despite the growing accessibility of next-generation sequencing, FCM remains a robust, rapid, and cost-effective approach for accurately determining genome size, especially in non-model taxa. Importantly, FCM provides direct physical measurements of the nuclear DNA content without the computational assumptions required for in silico methods. Therefore, we propose a tiered analytical framework where FCM serves as a foundational method for rapid, accurate estimates of genome size, while genome survey sequencing provides supplementary resolution of the genome's structure and complexity when high-quality sequencing data are available. For ecologically important but understudied species lacking genomic resources, such as many ecologically significant but understudied woody plants, an integrative approach that combines the precision of FCM's precision with genome survey sequencing's analytical depth, enables accurate, biologically relevant genome size estimates. In all, it is not the right time to abandon FCM for estimating genome size.
We thank Prof. Zhi-qiang Wu (EIC of Genomics Communications) and the four reviewers for the constructive comments and suggestions that helped us improve the manuscript greatly. This work was supported by the National Natural Science Foundation of China (No. 42171063); Southeast Asia Biodiversity Research Institute, Chinese Academy of Sciences (No. Y4ZK111B01); the Special Fund for Scientific Research of Shanghai Landscaping & City Appearance Administrative Bureau (G242414, G242416); the "Yunnan Revitalization Talent Support Program" in Yunnan Province (XDYC-QNRC-2022-0028); the CAS "Light of West China" Program; and the 14th Five-Year Plan of the Xishuangbanna Tropical Botanical Garden, Chinese Academy Sciences (XTBG-1450303).
-
The authors confirm their contributions to the paper as follows: study conception and design: Meng HH; data collection: Meng HH, Song YG, Wu SD; analysis and interpretation of results: Li M; draft manuscript preparation: Meng HH, Li M, Su RP, Cai X, Huang PH, Fang OY, Hu GX, Li J. All authors reviewed the results and approved the final version of the manuscript.
-
All data generated or analyzed during this study are included in this published article and its supplementary information files. The full analysis pipeline is publicly available on GitHub to ensure transparency and reproducibility. The repository can be accessed at https://github.com/lmajk/Engelhardia-genome-pipeline.
-
The authors declare that they have no conflict of interest.
- Supplementary Table S1 Collection information for five Engelhardia species.
- Supplementary Table S2 Results of flow cytometric determination of genome size of five Engelhardia species.
- Supplementary Table S3 The illumina short reads for five Engelhardia species.
- Supplementary Table S4 Summary of raw sequencing data quality for five Engelhardia species.
- Supplementary Table S5 K-mer analysis data statistics of E. spicata var. spicata.
- Supplementary Table S6 K-mer analysis data statistics of E. spicata var. colebrookeana.
- Supplementary Table S7 K-mer analysis data statistics of E. spicata var. aceriflora.
- Supplementary Table S8 K-mer analysis data statistics of E. roxburghiana.
- Supplementary Table S9 K-mer analysis data statistics of E. fenzelii.
- Supplementary Table S10 Estimation of genome size of five Engelhardia species based on 43 K-mer.
- Supplementary Fig. S1 Keyword co-occurrence and clustering timeline map of research on flow cytometry in genome size studies (2000–2025).
- Supplementary Fig. S2 Keyword co-occurrence and clustering timeline map of research on genome Survey analysis in genome size studies (2000–2025).
- Supplementary Fig. S3 Test results-histogram of E. spicata var. spicata.
- Supplementary Fig. S4 Test results-histogram of E. spicata var. colebrookeana.
- Supplementary Fig. S5 Test results-histogram of E. spicata var. aceriflora.
- Supplementary Fig. S6 Test results-histogram of E. roxburghiana.
- Supplementary Fig. S7 Test results-histogram of E. fenzelii.
- Copyright: © 2025 by the author(s). Published by Maximum Academic Press, Fayetteville, GA. This article is an open access article distributed under Creative Commons Attribution License (CC BY 4.0), visit https://creativecommons.org/licenses/by/4.0/.
-
About this article
Cite this article
Li M, Su RP, Cai X, Huang PH, Fang OY, et al. 2025. Is it time to abandon the flow cytometry in estimations of genome size when the K-mer analysis is available? The case of Engelhardia species. Genomics Communications 2: e013 doi: 10.48130/gcomm-0025-0014 

Is it time to abandon the flow cytometry in estimations of genome size when the K-mer analysis is available? The case of Engelhardia species
- Received: 28 April 2025
- Revised: 02 July 2025
- Accepted: 04 July 2025
- Published online: 28 July 2025
Abstract: Genome size represents a fundamental genomic trait with profound implications across evolutionary biology, ecology, and genomics. Flow cytometry (FCM) has served as the gold standard for estimating genome size for decades, while the advent of next-generation sequencing has popularized K-mer analysis as an increasingly viable alternative. This technological development prompts a critical reassessment of FCM, a method that is revered yet often questioned. To evaluate their relative accuracy and applicability in non-model plants, we conducted a comparative evaluation of both methods in five ecologically significant but genomically understudied Engelhardia species as a test case. Our results revealed that FCM yielded genome sizes with consistent estimates of 800–870 Mb, while K-mer analysis produced broader estimates (720–1,130 Mb) with additional genomic insights into their heterozygosity and repeat content. K-mer analysis provides simultaneous structural information as well as indicating genomic size; however, it also presents three notable limitations: (1) it is sensitive to repetitive elements and sequencing biases; (2) it requires a sustained period of analytical processing to complete the related workflow; and (3) it has variable precision with broad estimations of genomic size despite the higher theoretical resolution. Contrary to the prevailing technological thinking, our findings challenge the assumption that K-mer methods universally supersede FCM. The continued utility of FCM is evidenced by its operational simplicity, cost-effectiveness and reliability for preliminary assessments. We argue that methodological selection should be guided by research objectives rather than technological novelty. For nonmodel plants particularly, FCM remains an indispensable tool rather than competing with sequencing-based approaches. The future of estimating genome size lies not in the exclusive adoption of either method, but in their strategic integration depending on the required precision, the available resources, and the desired genomic insights.
-
Key words:
- Genome size estimation /
- Flow cytometry /
- K-mer analysis /
- Engelhardia /
- Nonmodel plants