


-
The subfamily Apocynoideae represents a biologically and economically valuable group with considerable resource potential. Many of its species exhibit notable medicinal properties, and their extracts are especially abundant in alkaloids and glycosides. These compounds have been widely used in the treatment of diverse conditions, such as fever, malaria, bruising, diabetes, asthma, and various gastrointestinal disorders[1]. Nerium oleander is an evergreen, upright shrub belonging to Nerium within subfamily Apocynoideae[2]. It exhibits a wide geographical distribution, thriving primarily in tropical and subtropical climates, while also making sporadic appearances in temperate regions[3]. N. oleander and related species are widely cultivated as ornamental plants for landscaping. Additionally, wild ornamental species play a significant role in horticulture due to their diversity and utility.
Chloroplasts serve as the primary organelles responsible for photosynthesis in plants[4]. The chloroplast genome is generally maternally inherited, and, in comparison with the nuclear genome, remains compact and structurally conserved[5]. These features make chloroplast genomes particularly useful for plant germplasm identification, phylogenetic inference, and molecular breeding applications[6]. With ongoing improvements in sequencing technologies and the continued decline in associated costs, genomic data is being applied more extensively to investigate evolutionary relationships[7]. As a result, the number of species for which complete nuclear and organellar genome assemblies are available has grown rapidly. At the same time, high-throughput sequencing platforms have enabled more efficient analyses of chloroplast genomes.
Within Apocynaceae, extensive comparative analyses based on chloroplast genomes have greatly contributed to the establishment of family-level phylogenetic frameworks and have deepened insight into diversification patterns[8,9]. These studies have also supported recent revisions of the family's systematic classification, thereby providing a solid basis for further investigations at the subfamily and tribal levels[2]. Building on these efforts, previous studies have further clarified the phylogenetic position of Apocynoideae within Apocynaceae. A highly supported phylogenetic tree constructed from 66 plastid protein-coding genes shows that Apocynoideae and Periplocoideae form a sister relationship, and together they constitute a clade sister to Asclepiadoideae and Secamonoideae[3]. Within Apocynoideae, Parsonsieae occupies a basal position, Apocyneae and Wrightieae form a sister group, and Echiteae is resolved as an outgroup to this clade, with all four tribes being monophyletic[3]. In addition, variations in the contraction and expansion of the inverted repeat (IR) regions among tribes further reflect the evolutionary dynamics of plastome structure within this subfamily[9]. Comprehensive comparative analyses of chloroplast genomes within Apocynoideae remain limited, especially for cultivated varieties of N. oleander. Most available studies focus on single-species chloroplast genome characterization or are confined to a few genera. For example, the assembly, annotation, and evolutionary analysis of the Periploca forrestii chloroplast genome identified an expansion of the IR region; however, such isolated investigations do not provide a subfamily-wide comparative framework and thus cannot adequately resolve lineage-specific evolutionary patterns within Apocynoideae[10]. As an important ornamental species, N. oleander comprises numerous cultivated varieties exhibiting pronounced phenotypic variation. However, investigations of its genetic diversity have largely relied on traditional molecular markers, including amplified fragment length polymorphism (AFLP) and simple sequence repeat (SSR) markers[11]. Only a small proportion of early research has employed random amplified polymorphic DNA (RAPD) or inter-simple sequence repeat (ISSR) markers for assessing genetic relationships among closely related species[12,13]. However, comparative analyses involving multiple cultivars based on complete chloroplast genome sequences are still lacking. Methodological studies have shown that the published chloroplast genomes of N. oleander and its close relatives can serve as reliable reference sequences for chloroplast reconstruction and auxiliary assembly in related species[14]. This provides a solid methodological foundation for the assembly strategy used in this study.
In this study, chloroplast genome sequences of N. oleander cultivars 'Paihua' and 'Nanum', which exhibit pronounced differences in flower color, were generated and annotated using high-throughput sequencing. Newly generated chloroplast genomes were subsequently compared with the previously published genome of N. oleander to assess the potential contribution of chloroplast genomic variation to phenotypic differentiation. By combining the three chloroplast genomes with those of 11 related species in Apocynoideae, a comparative framework was established to investigate gene structural features, repeat sequence composition, and patterns of sequence variation. Based on these analyses, this study aimed to: (1) elucidate lineage-specific evolutionary patterns of chloroplast genomes within Apocynoideae; and (2) explore their potential adaptive significance. Collectively, our results contribute to filling a crucial gap in chloroplast-based comparative analyses at the subfamily level, as well as providing a valuable genomic foundation for species identification, genetic resource exploitation, and molecular breeding in Apocynaceae.
-
Fresh leaves of two N. oleander cultivars, 'Paihua' and 'Nanum', were collected at Nanjing Forestry University. Genomic DNA was isolated from fresh leaves using a modified CTAB protocol[15]. DNA integrity was evaluated by 1% agarose gel electrophoresis, and its purity and concentration were measured with a NanoDrop spectrophotometer. A 150 bp paired-end sequencing library was subsequently prepared from the purified DNA and sequenced on an Illumina platform, yielding approximately 10 Gb of clean data with an average sequencing depth of approximately 16×. In addition to two N. oleander cultivars, 'Paihua' and 'Nanum', we retrieved 12 chloroplast genomes of closely related groups from the NCBI database. These represent five tribes within Apocynoideae—Apocyneae, Echiteae, Nerieae, Malouetieae, and Wrightieae—covering five of the nine tribes in the subfamily. The selected groups span herbaceous, shrub, and woody liana life forms and encompass tropical, subtropical, and some temperate regions, thereby capturing the major genetic and ecological diversity of the subfamily.
Assembly and annotation of chloroplast genomic sequences
-
Chloroplast genomes were assembled de novo using GetOrganelle v1.7.7[16]. The resulting contigs were then inspected and manually refined in Bandage v0.9.0[17], producing complete chloroplast genome sequences for both cultivars. Genome annotation was carried out with the online platform GeSeq (
https://chlorobox.mpimp-golm.mpg.de/geseq.html )[18], using the previously published N. oleander (NC_025656) chloroplast genome as a reference. Annotations were further adjusted manually in Geneious Prime v2025.2[19]. Chloroplast genome maps of N. oleander cultivars 'Paihua' and 'Nanum' were generated with OGDRAW v1.3.1[20], and gene annotation information was retrieved using CPStools v3.0[21].Analysis of codon characteristics
-
To evaluate factors influencing codon usage bias, codon features were examined across 14 chloroplast genomes within Apocynaceae, including three from N. oleander and 11 from related species. Prior to the analysis, the coding sequences (CDS) that were shorter than 300 bp, did not start with ATG, contained internal stop codons, or included repetitive sequences were excluded from the dataset. The effective number of codons (ENC), relative synonymous codon usage (RSCU) of protein-coding genes, and GC content at the third position of synonymous codons (GC3s) were calculated using CodonW v1.4.4 (
https://codonw.sourceforge.net ). Total GC content of codons (GC_all) as well as GC content at the first, second, and third codon positions (GC1, GC2, GC3) were calculated using the online tool CUSP (http://emboss.toulouse.inra.fr/cgi-bin/emboss/cusp ). Codons encoding methionine (AUG) and tryptophan (UGG), as well as the stop codons (UAA, UAG, UGA), were removed from the analysis mentioned above[22]. Based on the resulting codon-specific RSCU values, bar charts were generated to visualize patterns of synonymous codon usage across the examined species. Using ENC as the grouping criterion, the CDS were divided into high- and low-expression groups. RSCU and ΔRSCU were calculated for both groups. Codons with ΔRSCU ≥ 0.08 and RSCU > 1 in the high-expression group were considered optimal codons[23]. Correlations between the GC content at different codon positions (GC1, GC2, GC3, GC_all) and the ENC was analyzed using SPSS Statistics v31.0.Selective pressure analysis
-
Two different algorithms were employed to analyze selection pressure on the 14 chloroplast genomes of Apocynoideae. The first method involved calculating the pairwise ratio of non-synonymous (Ka) to synonymous (Ks) substitutions (Ka/Ks) between the 14 chloroplast genomes based on concatenated CDS[24]. A set of 81 CDS was extracted from annotation files using PhyloSuite v2[24], and concatenated into a supermatrix, followed by the calculation of the pairwise Ka/Ks values for each concatenated sequence using KaKs_Calculator v3.0[25]. As for the second approach, the sequence of Strophanthus hispidus (NC_079589) was used as a reference to calculate Ka, Ks, and the Ka/Ks ratio by CPStools v3.0 for individual genes. A Ka/Ks ratio > 1 implies an excess of non-synonymous substitutions and positive selection on amino acid sequences, whereas a ratio < 1 reflects dominant synonymous changes and functional conservation of encoded proteins.
Repeat sequences analysis
-
The long repeat sequences in the 14 chloroplast genomes of Apocynoideae were analyzed using REPuter (
https://bibiserv.cebitec.uni-bielefeld.de/reputer )[26]. Simple sequence repeats (SSRs) were predicted using the MISA-web tool v2.1[27]. The SSR identification criteria were set as follows: mononucleotide (≥ 8 repeats), dinucleotide (≥ 5), trinucleotide (≥ 4), tetranucleotide (≥ 3), pentanucleotide (≥ 3), and hexanucleotide (≥ 3). An interval of at least 100 base pairs was required between adjacent SSRs.Comparative genomic analysis
-
CPStools v3.0 was used to extract sequences, perform multiple sequence alignments, and calculate nucleotide diversity for the 14 chloroplast genomes. The complete chloroplast genome sequences were compared using mVISTA (
https://genome.lbl.gov/vista/mvista/submit.shtml )[28]. The IR boundaries were analyzed using IRscope (http://msgvd.genehub.com.cn/IRscope/ )[29].Phylogenetic analysis
-
Along with the 14 chloroplast genomes above, we downloaded another 36 chloroplast genomes from the NCBI database to conduct phylogenetic analysis. Of the 50 chloroplast genomes, 49 were from Apocynaceae and represented three subfamilies: Apocynoideae, Asclepiadoideae, and Rauvolfioideae, while the remaining one, from Gentiana scabra (NC_057091), was selected as the outgroup. G. scabra belongs to Gentianales, the same order as Apocynaceae, and the two families form a sister-group relationship[30]. In phylogenetic studies of Apocynaceae, Gentianaceae is commonly used as the outgroup. For phylogenetic reconstruction, CDS were extracted from the annotated GenBank files of each chloroplast genome. A set of 65 homologous and highly conserved CDS shared among all samples was identified and retained for subsequent analyses. Each CDS was aligned individually using MAFFT v7.526[31]. The alignments obtained were further refined with trimAl v1.5.1 using the parameters "–gt 0.7" and "–cons 60" to eliminate ambiguously aligned regions and poorly aligned positions[32]. The trimmed alignments of the 65 CDS were concatenated into a matrix. We used ModelTest-NG v0.1.7 to determine the best-fitting nucleotide substitution model based on the Bayesian Information Criterion (BIC)[33]. The GTR + I + G4 model was subsequently employed to reconstruct the maximum likelihood phylogeny using RAxML-NG v1.2.2[34]. Support for the branches was evaluated through 1,000 bootstrap replicates. The generated phylogenetic tree was visualized using the online platform iTOL v7.2.2[35].
-
The chloroplast genomes of N. oleander cultivars 'Paihua' and 'Nanum' both display the typical quadripartite structure, consisting of large single copy (LSC) and small single copy (SSC) regions separated by two inverted repeats (IRa/IRb) (Fig. 1). The genome sizes for N. oleander cultivars 'Paihua' and 'Nanum' are 154,760 and 154,857 bp, respectively, and have an identical GC content of 38.1%. The LSC regions are 85,232 and 85,135 bp, with the same GC content of 36.2%. The SSC regions are 18,135 bp and have a GC content of 32.1% in both cultivars. The inverted repeat regions span 25,745 bp each and flank the LSC and SSC regions (Supplementary Table S1).
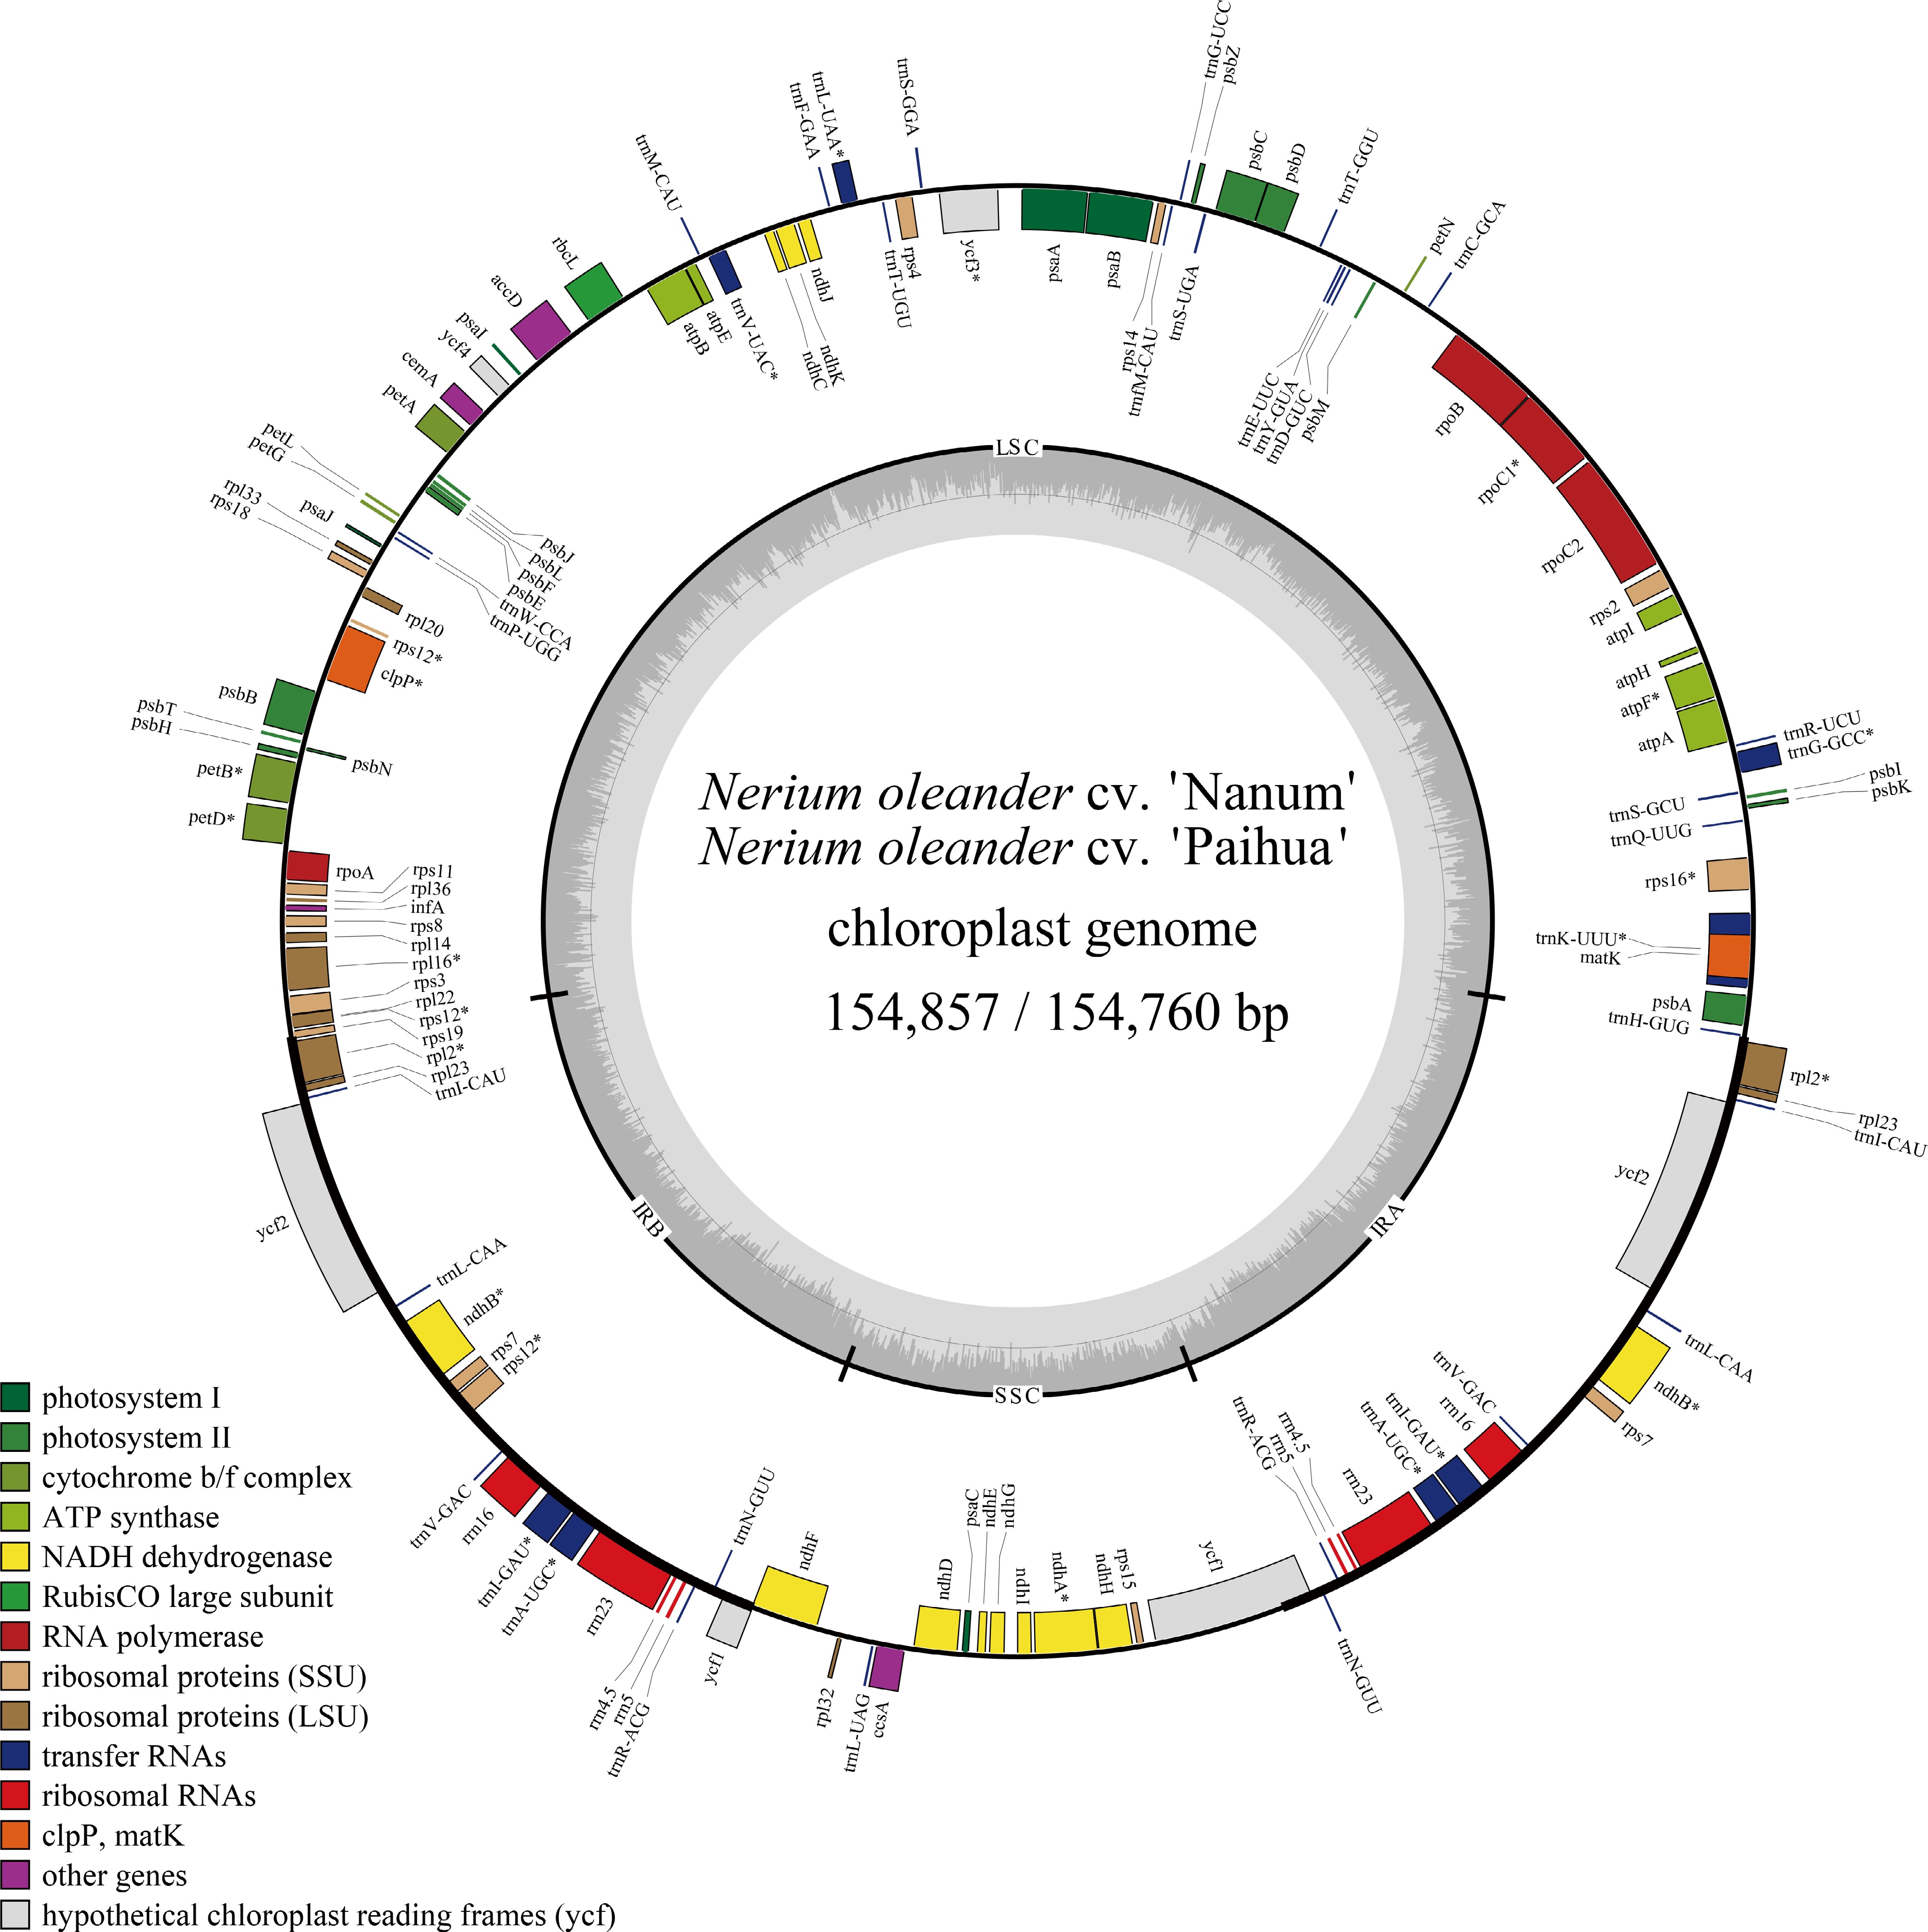
Figure 1.
Chloroplast genome map of N. oleander cultivars 'Paihua' and 'Nanum'. Genes located on the outer circle are transcribed in the clockwise direction, whereas those on the inner circle are transcribed counterclockwise. Different functional gene categories are indicated by distinct colors. The dashed region within the inner ring denotes the GC content of the chloroplast genome.
The chloroplast genomes of N. oleander cultivars 'Paihua' and 'Nanum' share an identical set of 113 genes, including 79 protein-coding genes, 30 transfer RNA (tRNA) genes, and 4 ribosomal RNA (rRNA) genes (Supplementary Table S2). These genes can be categorized into three functional groups: Class I comprises genes involved in energy production, comprising six ATP synthase subunits, 11 NADH dehydrogenase subunits, six cytochrome b/f complex genes, five photosystem I subunits, 15 photosystem II-related genes, and one gene encoding the large subunit of ribulose-1,5-bisphosphate carboxylase/oxygenase (Rubisco). Class II consists of genes associated with self-replication, including 4 rRNA genes, 30 tRNA genes, 12 small ribosomal subunit protein genes, nine large ribosomal subunit protein genes, and four RNA polymerase subunit genes. Class III comprises the ycf gene series and other putative protein-coding genes. Overall, the two N. oleander cultivars share almost the same chloroplast genome structures and gene content across core functional categories.
Analysis of codon characteristics and influencing preference factors
-
The GC content of coding sequences across the 14 Apocynoideae chloroplast genomes ranged from 37.93% to 38.51% (Table 1). Among them, Parsonsia goniostemon (NC_079593) exhibited the highest GC content (38.51%), while Strophanthus wallichii (NC_079590) had the lowest (37.93%), indicating that the nucleotide composition of chloroplast genomes in Apocynoideae is highly conserved. Although GC content at each codon position remained below 50%, substantial variation was observed among positions. The first codon position displayed the highest GC content, whereas the third position showed a marked decrease. These results indicate that the chloroplast genomes are biased toward A/U nucleotides, particularly at the third codon position.
Table 1. Codon usage characteristics of 14 chloroplast genomes in Apocynoideae.
Species Gene bank ID GCall GC1 GC2 GC3 GC3S ENC Nerium oleander NC_025656 38.06 46.01 37.71 31.45 38.40 50.12 Apocynum venetum NC_053902 38.15 46.52 38.30 32.62 38.50 50.09 Wrightia laevis NC_094286 38.45 46.15 38.48 30.71 38.40 50.19 Chonemorpha megacalyx NC_056322 38.33 46.46 38.60 31.94 39.00 50.01 Amalocalyx microlobus NC_067035 38.34 46.56 39.72 30.73 37.70 50.49 Apocynum pictum NC_070061 38.36 47.54 38.14 31.41 38.36 50.60 Chonemorpha eriostylis NC_072067 38.32 46.18 37.93 30.84 38.80 50.04 Strophanthus hispidus NC_079589 38.06 46.60 38.11 30.47 37.47 50.46 Strophanthus wallichii NC_079590 37.93 46.21 39.00 31.58 37.60 50.22 Pachypodium lamerei NC_075951 38.46 46.01 38.61 30.76 37.90 50.27 Parsonsia goniostemon NC_079593 38.51 46.11 38.56 30.86 37.90 50.30 Trachelospermum jasminoides NC_082280 38.43 46.13 38.48 30.68 38.60 50.01 Nerium oleander cv. 'Nanum' PX764290 38.06 46.66 37.92 30.60 38.60 51.00 Nerium oleander cv. 'Paihua' PX764291 38.08 46.41 39.29 30.55 37.50 51.39 The effective number of codons (ENC), ranging from 20 to 61, is commonly employed to assess codon usage bias in comparative genomic studies. Lower ENC values reflect stronger codon bias, while higher values indicate more random codon usage. In the 14 chloroplast genomes analyzed, average ENC values exceeded 35, suggesting relatively weak codon bias (Table 1). Chonemorpha megacalyx (NC_056322) had the lowest ENC value (50.01), showing the strongest codon preference. In contrast, N. oleander cv. 'Paihua' exhibited the highest value (51.39), reflecting the weakest preference.
RSCU provides a key measure of codon usage bias by comparing observed codon frequencies to their expected values. An RSCU of 1 indicates no bias, values above 1 reflect preferential codon usage, and values below 1 indicate underrepresentation relative to synonymous codons. After merging and removing duplicates from the high-frequency codons (RSCU > 1) across the 14 chloroplast genomes, a total of 29 common high-frequency codons were identified, distributed across 18 synonymous codon families (Supplementary Fig. S1). Remarkably, 28 of these codons (96.55%) contained an A/U at the third position, demonstrating a pronounced A/U bias.
Within each of the 14 chloroplast genomes, the number of high-frequency codons ranged from 30 to 32, with 31 observed in most cases. Further identification of optimal codons, based on ΔRSCU values (≥ 0.08) together with RSCU estimates from highly expressed gene sets, showed that Strophanthus hispidus possessed the greatest number of optimal codons (22), whereas Amalocalyx microlobus had the lowest count (14) (Supplementary Fig. S1). A comparison of optimal codons across the 14 genomes identified six conserved optimal codons: UUA (leucine), GUA (valine), GGU (glycine), CGA (arginine), AUU (isoleucine), and AAA (lysine). All six codons terminate in A/U, consistent with the A/U bias evident in codon usage patterns of these chloroplast genomes.
The scatter plot of ENC-GC3s indicated that most gene points were positioned near or along the expected theoretical curve under neutral evolutionary conditions (Supplementary Fig. S2). The curve represents the codon usage pattern determined exclusively by the GC3s composition. The average ENC value across all chloroplast genomes was 50.37, slightly below the neutral expectation of 61. This minor deviation was consistently observed across all 14 genomes, suggesting that mutational pressure contributes to codon usage patterns in chloroplast protein-coding genes, whereas additional evolutionary forces may also be involved. Among the three chloroplast genomes of N. oleander, the ENC-GC3s plots showed highly similar distribution patterns, indicating conserved codon usage.
PR2 analysis is used to examine potential biases in nucleotide usage at the third codon position, helping to evaluate the relative effects of mutation and selection on codon usage. PR2 analysis of the 14 chloroplast genomes in Apocynoideae showed that the mean A3/(A3 + T3) value was 0.4618 ± 0.0009, significantly below the neutral expectation of 0.5 (p < 0.01), indicating a bias toward T over A. In contrast, the mean G3/(G3 + C3) value reached 0.5380 ± 0.0028, exceeding 0.5 and suggesting a moderate preference for G relative to C (Fig. 2). In the PR2 plot, most points fall within the fourth quadrant (A3/[A3 + T3] < 0.5; G3/[G3 + C3] > 0.5), supporting a directional bias in nucleotide usage at the third codon position. This asymmetric distribution is consistent across all 14 chloroplast genomes, indicating that codon usage asymmetry is shaped by non-neutral evolutionary forces. At the species level, only slight interspecific differences in codon usage asymmetry were detected. The G3/(G3 + C3) values ranged from 0.5351 to 0.5432, while A3/(A3 + T3) varied between 0.4596 and 0.4631. All three N. oleander chloroplast genomes shared identical values, with G3/(G3 + C3) = 0.5367 and A3/(A3 + T3) = 0.4620, both close to the overall mean. Although minor variation exists among species, the narrow ranges and low standard deviations indicate that codon usage asymmetry is highly conserved across Apocynoideae chloroplast genomes.
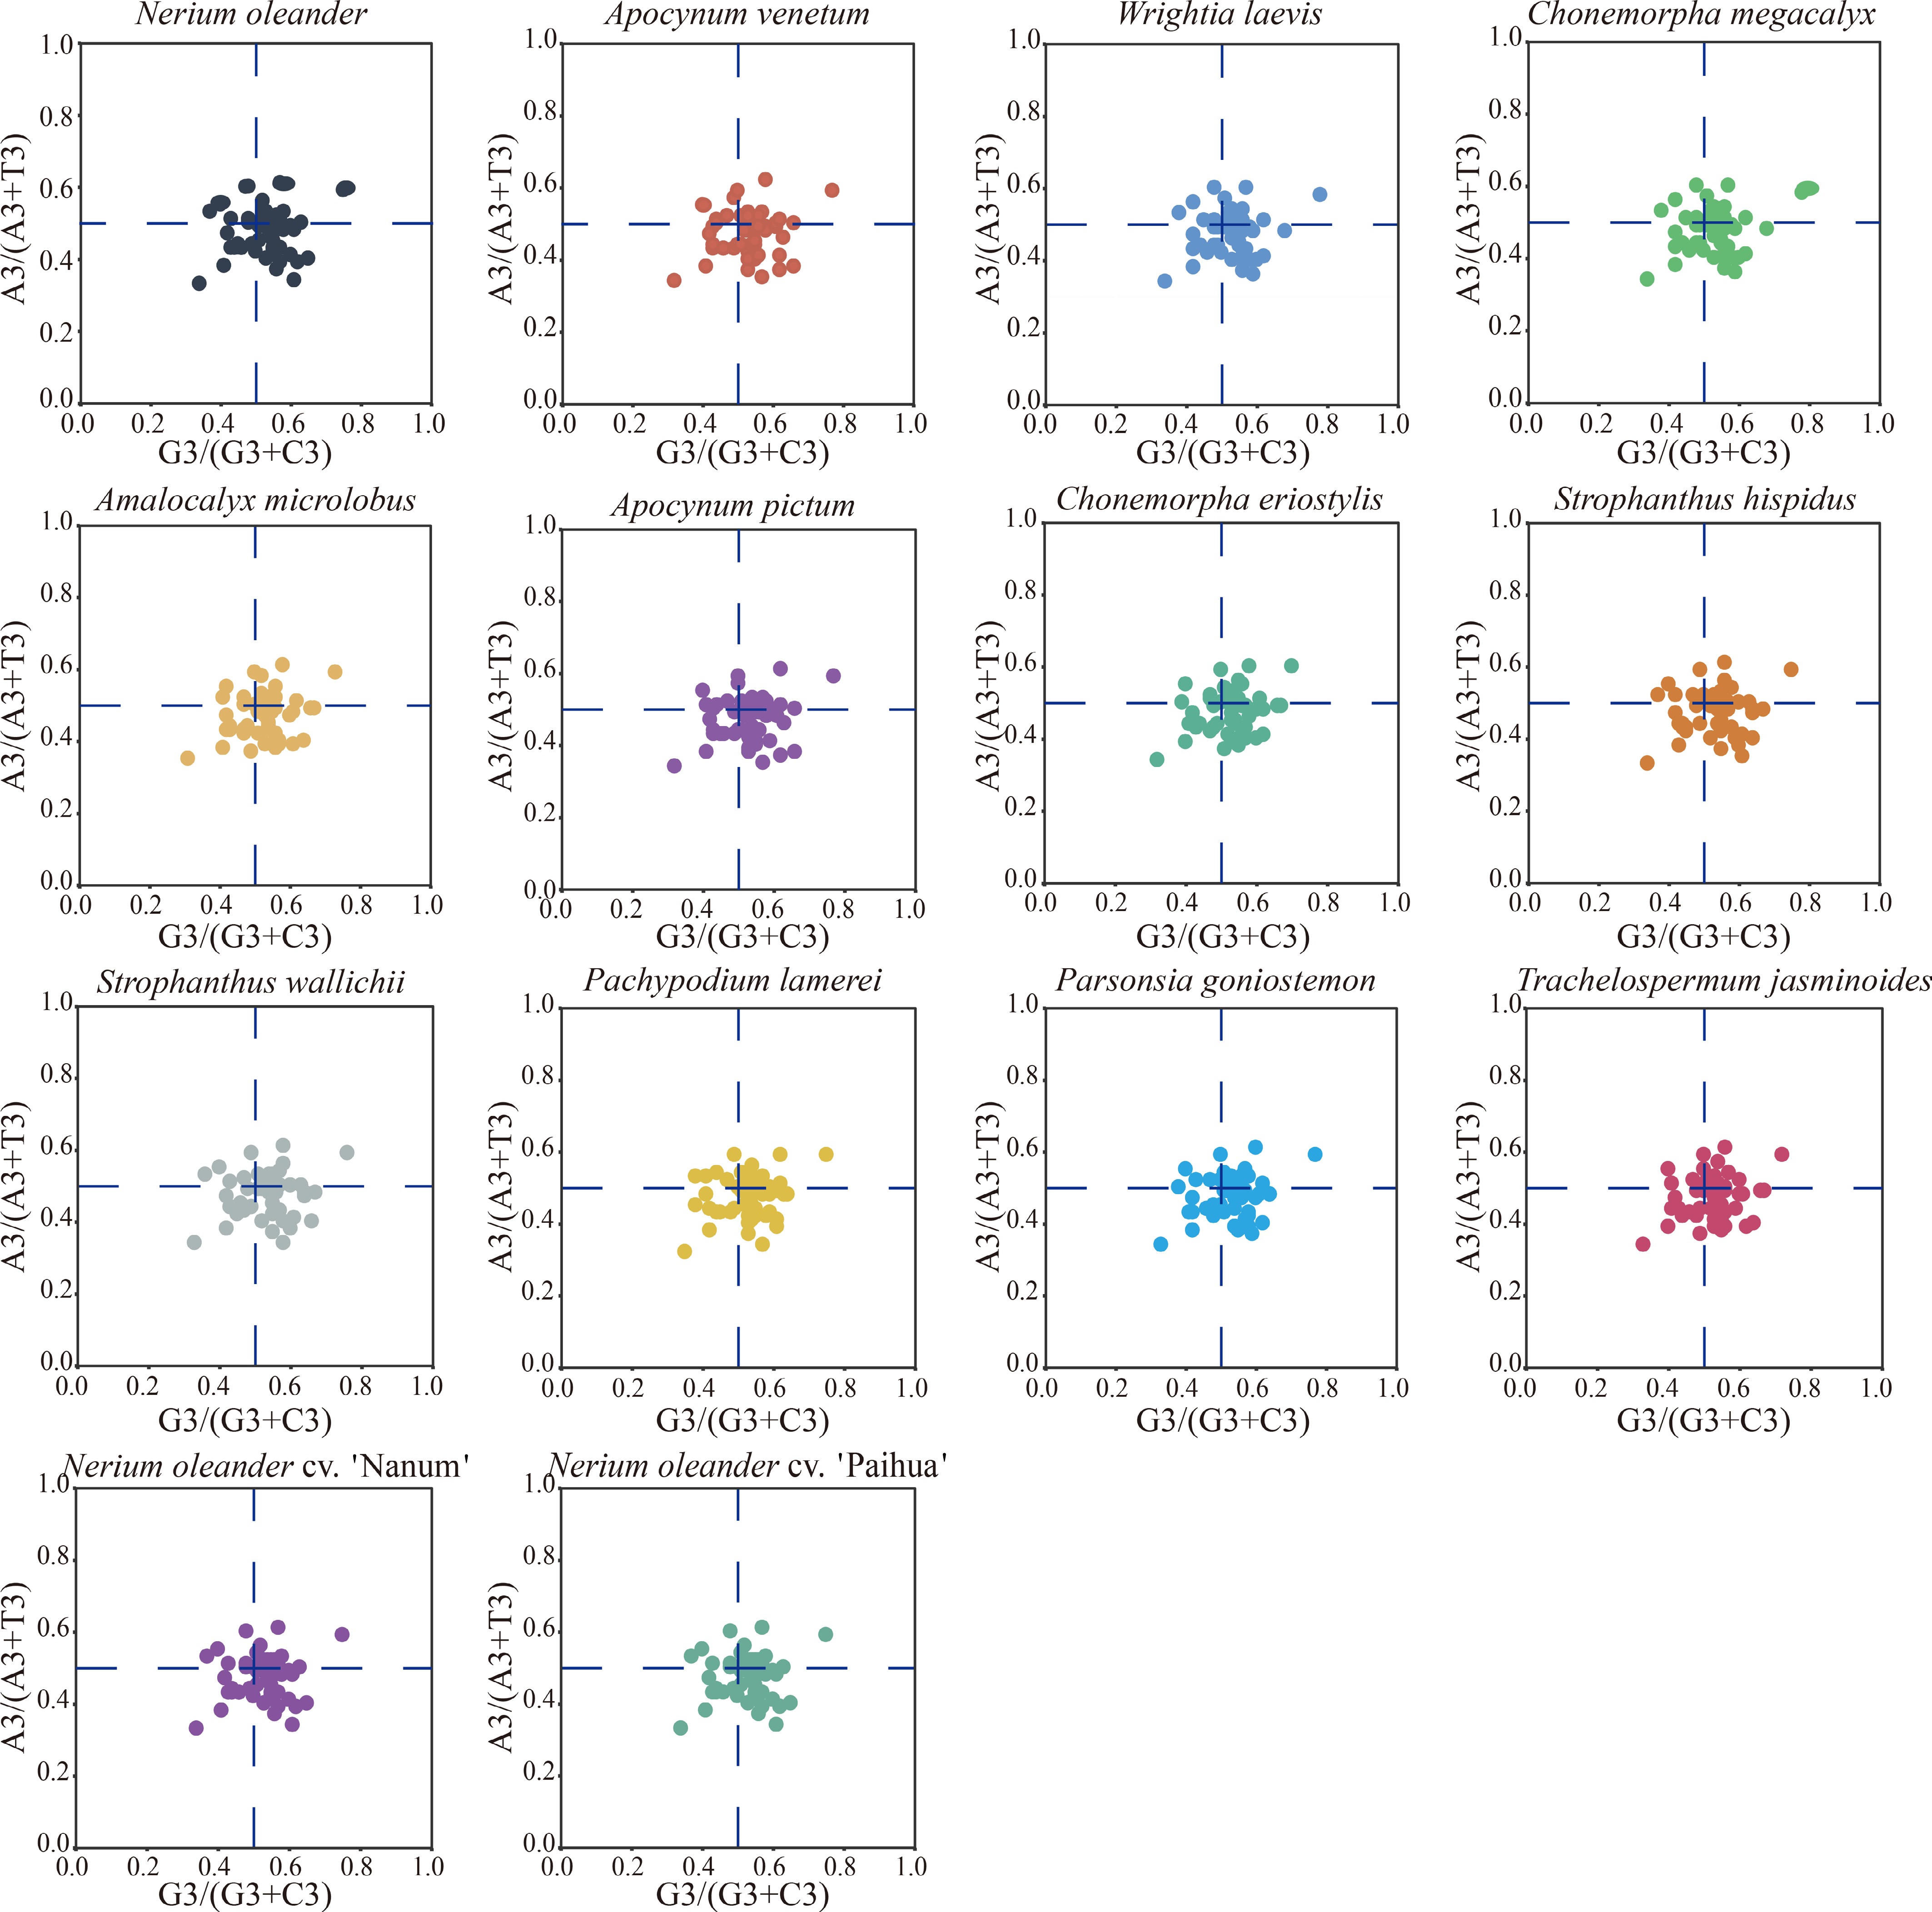
Figure 2.
PR2 analysis was conducted on protein-coding genes from 14 Apocynoideae chloroplast genomes. Each subplot illustrates the relationship between G3/(G3 + C3) and A3/(A3 + T3) for genes within a given genome. Individual points represent genes, and their sizes are scaled according to ENC values. The blue dashed lines denote the theoretical PR2 expectation, with the intersection at (0.5, 0.5) reflecting the neutral assumption that complementary bases (A = T, G = C) are used at equal frequencies at the third codon position.
To evaluate the determinants of codon usage bias in Apocynoideae chloroplast genomes, neutrality plot analysis was carried out using GC content at the first, second, and third codon positions. Across all protein-coding genes, GC3 ranged from 0.3047 to 0.3262 (mean = 0.3109), whereas GC12 varied between 0.4186 and 0.4314 (mean = 0.4244). The marked disparity between GC3 and GC12 indicates that codon positions might have experienced distinct evolutionary pressures. Regression analysis of GC3 against GC12 yielded slopes ranging from 0.0103 to 0.2760 (mean = 0.1952). Apocynum pictum exhibited the lowest slope (0.0103), while Chonemorpha eriostylis showed the highest (0.2760). The adjusted R2 values were consistently low (−0.0200 – 0.0270; mean = 0.0056) (Fig. 3), accompanied by the lowest value in A. pictum (−0.0200) and the highest in C. megacalyx (0.0270). Taken together, these findings indicate that codon usage bias in Apocynoideae chloroplast genomes is predominantly driven by natural selection rather than mutational pressure. Moreover, the intensity of natural selection shows significant interspecific variation, with Apocynum experiencing the strongest selective pressure, compared to the relatively weaker selection observed in Chonemorpha.
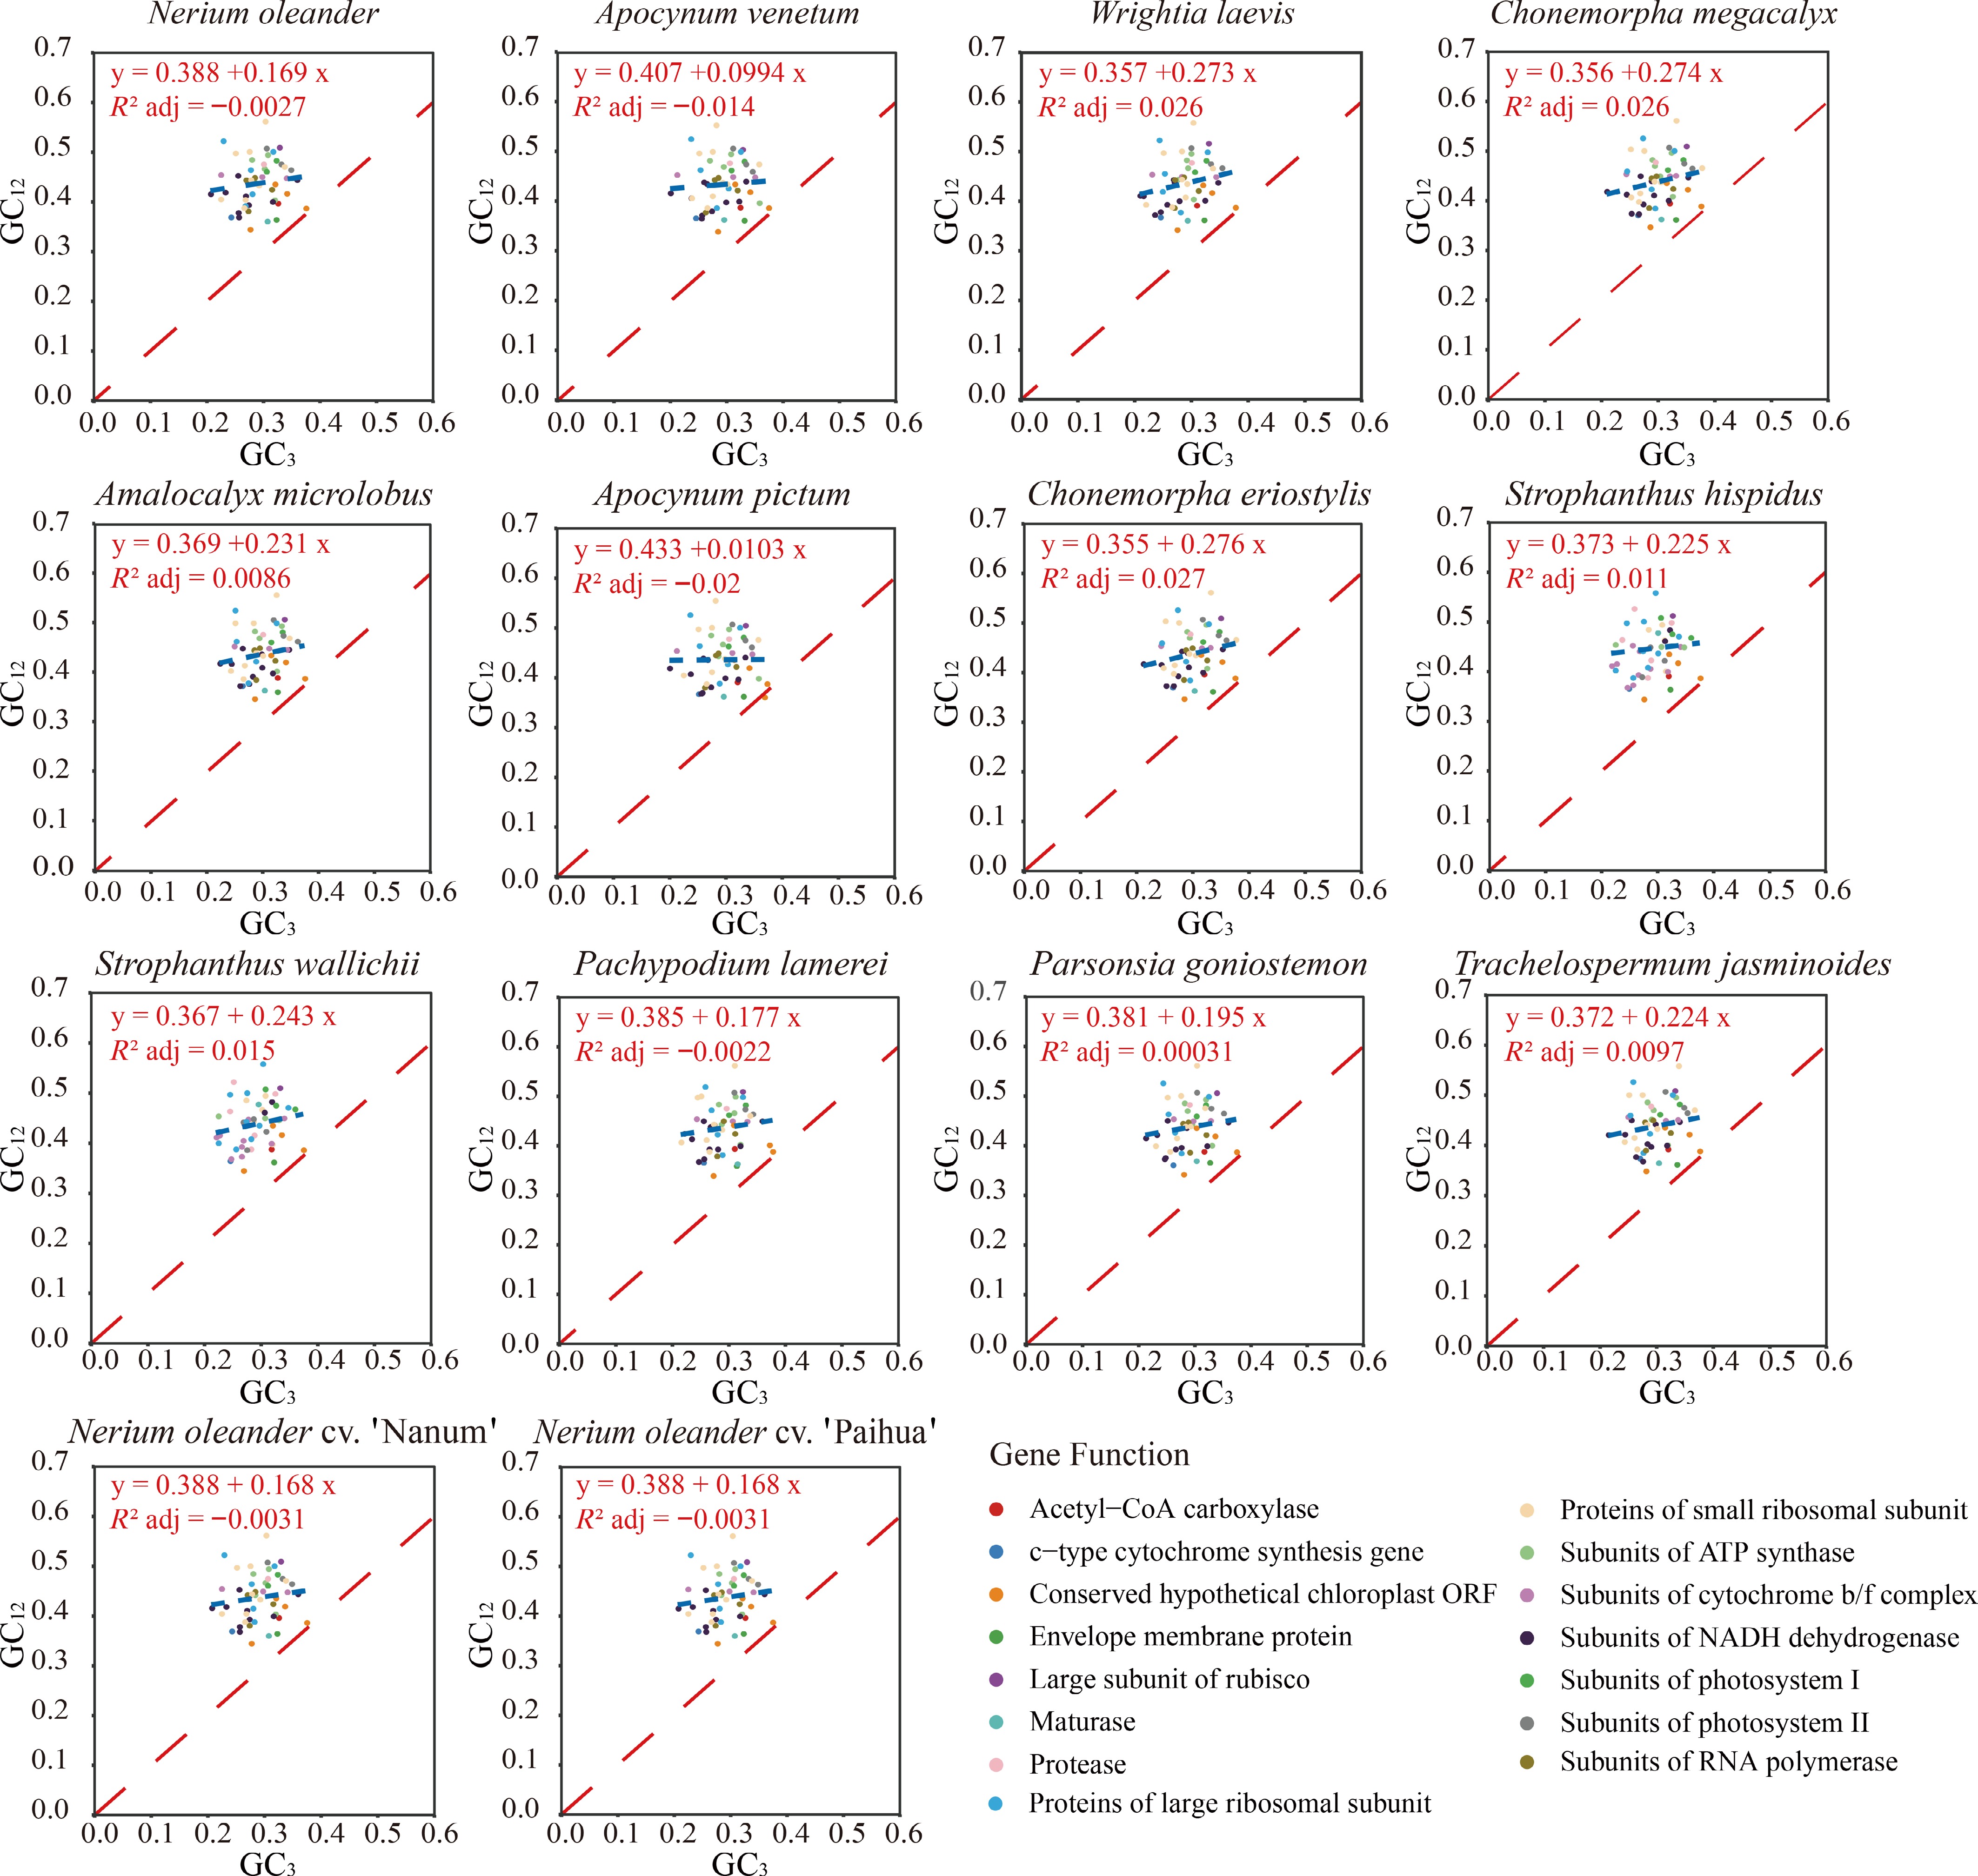
Figure 3.
Neutrality plot analysis was performed on codon usage in protein-coding genes from 14 Apocynoideae chloroplast genomes. Each subplot depicts the relationship between GC3 and GC12 for a given genome. Individual points correspond to genes, with their sizes scaled according to ENC values. The blue dashed line represents the fitted regression, whereas the red dashed line denotes the theoretical neutral expectation (GC12 = GC3). The regression equation and adjusted R2 value indicate the strength of the association between GC3 and GC12.
Selective pressure analysis
-
To explore evolutionary patterns in chloroplast genomes of subfamily Apocynoideae, a supermatrix comprising 81 protein-coding sequences was constructed, and Ka/Ks ratios were calculated to assess selection pressures. Across the 14 chloroplast genomes, all pairwise Ka/Ks values ranged from 0.096 to 0.301, remaining well below 1 (Fig. 4). These results suggest that chloroplast genomes in this subfamily are predominantly subject to strong purifying selection. Some variation in Ka/Ks values was observed among comparisons: closely related species pairs (e.g., within the same genus, such as Apocynum) showed relatively lower ratios (e.g., 0.161 between A. pictum and Apocynum venetum), whereas more distantly related pairs displayed higher values (e.g., 0.259 between A. microlobus and W. laevis). These results may suggest that closely related species are subject to stronger purifying selection and thus maintain tighter genetic constraints, whereas more distantly related species are more likely to exhibit comparatively relaxed constraints. Moreover, the consistently narrow range of Ka/Ks values across all comparisons underscores the evolutionary stability of core homologous genes within the subfamily Apocynoideae.
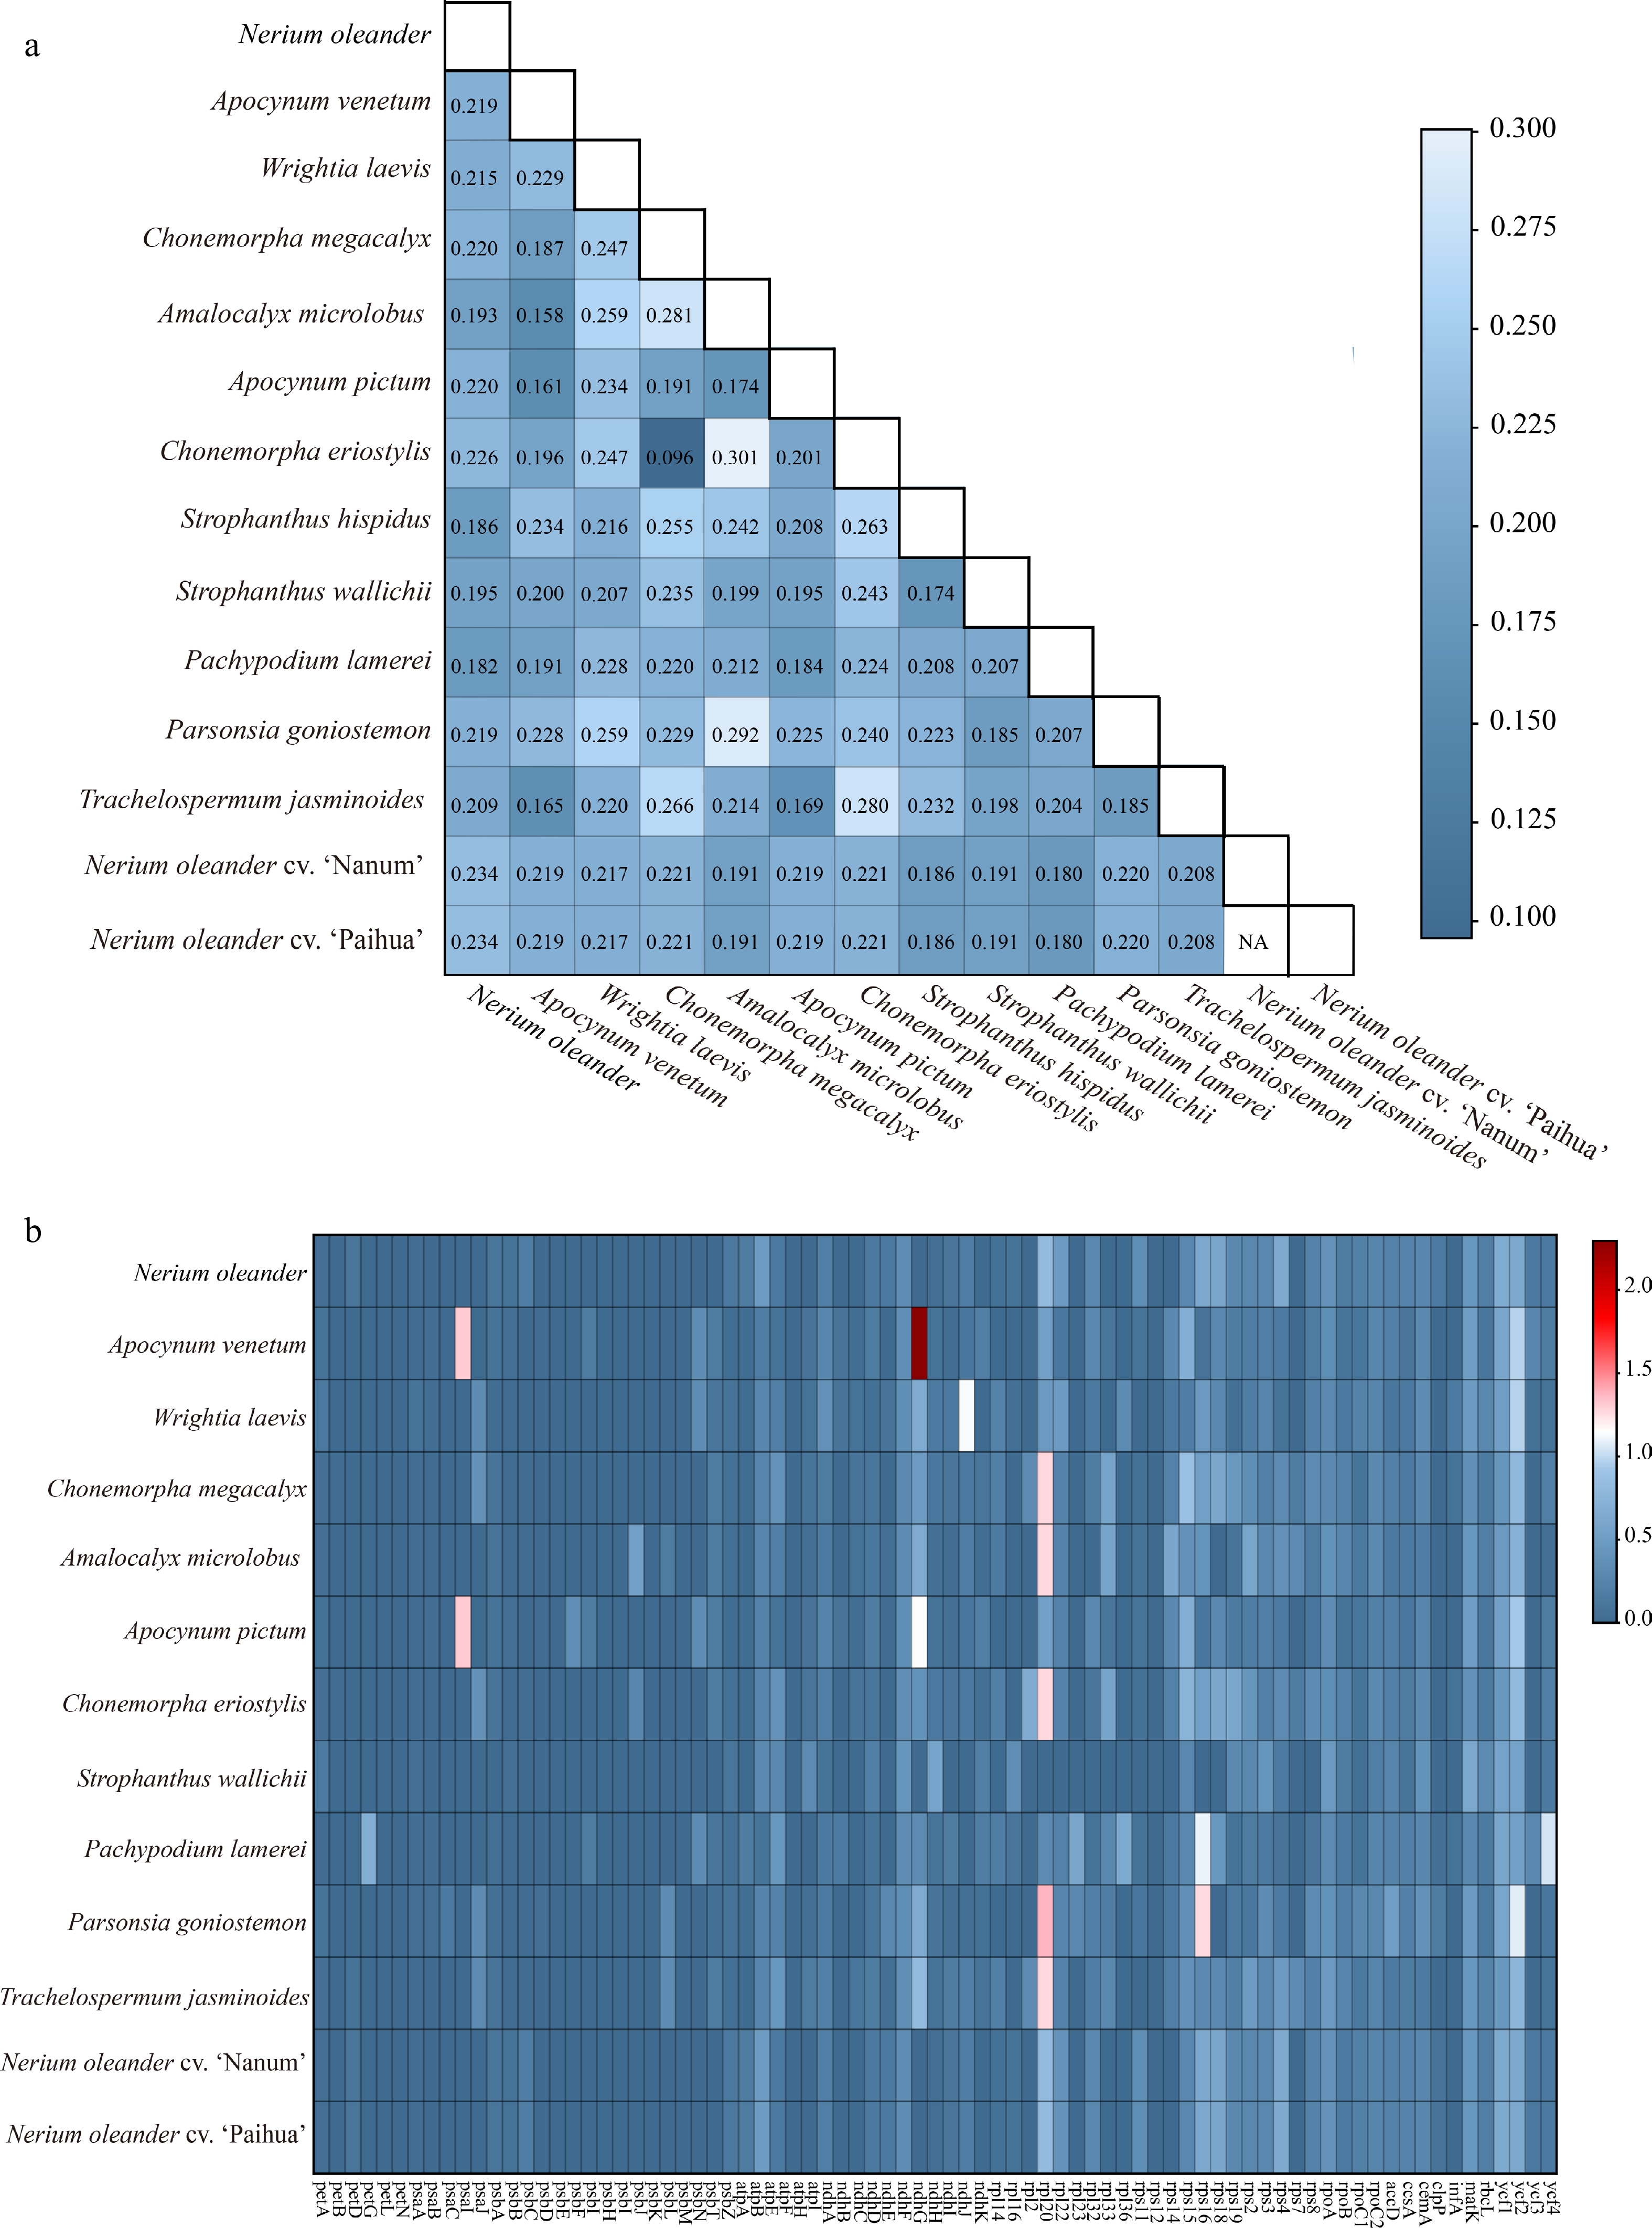
Figure 4.
Ka/Ks ratio patterns among 14 Apocynoideae chloroplast genomes. (a) Distribution of pairwise Ka/Ks ratios among species. (b) The Ka/Ks ratios of homologous genes.
Using S. hispidus as the reference, Ka/Ks ratios of homologous genes were examined across the other 13 Apocynoideae chloroplast genomes (Fig. 4). The analysis revealed pronounced variation in selection pressures among genes and species, with purifying selection emerging as the dominant evolutionary force. For most genes, Ka/Ks values fell below 1, indicating that purifying selection predominates. Among these, core functional genes displayed Ka/Ks values near 0, reflecting strong functional conservation, whereas a few genes showed weak purifying selection, with Ka/Ks approaching 1. Notably, seven genes—ndhG, rpl20, psaI, rps16, ndhJ, ycf2, and ycf4—exhibited Ka/Ks values greater than 1, revealing instances of positive selection within the subfamily. The ndhG gene in A. venetum displayed the highest Ka/Ks ratio (2.29533), indicating the strongest positive selection. The rpl20 gene, showing positive selection in five species, emerged as a key candidate associated with species differentiation. P. goniostemon contained four genes under positive selection. Furthermore, closely related species, including A. venetum and A. pictum, shared a positive selection signal in the psaI gene (Ka/Ks = 1.31677).
Repeat sequences analysis
-
This study systematically analyzed SSRs and dispersed long repeats in the 14 chloroplast genomes of Apocynoideae. The total number of SSRs ranged from 81 in S. wallichii to 107 in W. laevis. Among the six examined repeat types, mononucleotide repeats (70–93) were the most prevalent (Fig. 5). Analysis of SSR composition revealed a pronounced A/T bias, with A/T repeats dominating most genomes and C/G repeats absent in A. venetum and A. pictum (Fig. 5). Hexanucleotide repeats were rare, detected only once in each of C. megacalyx and C. eriostylis.
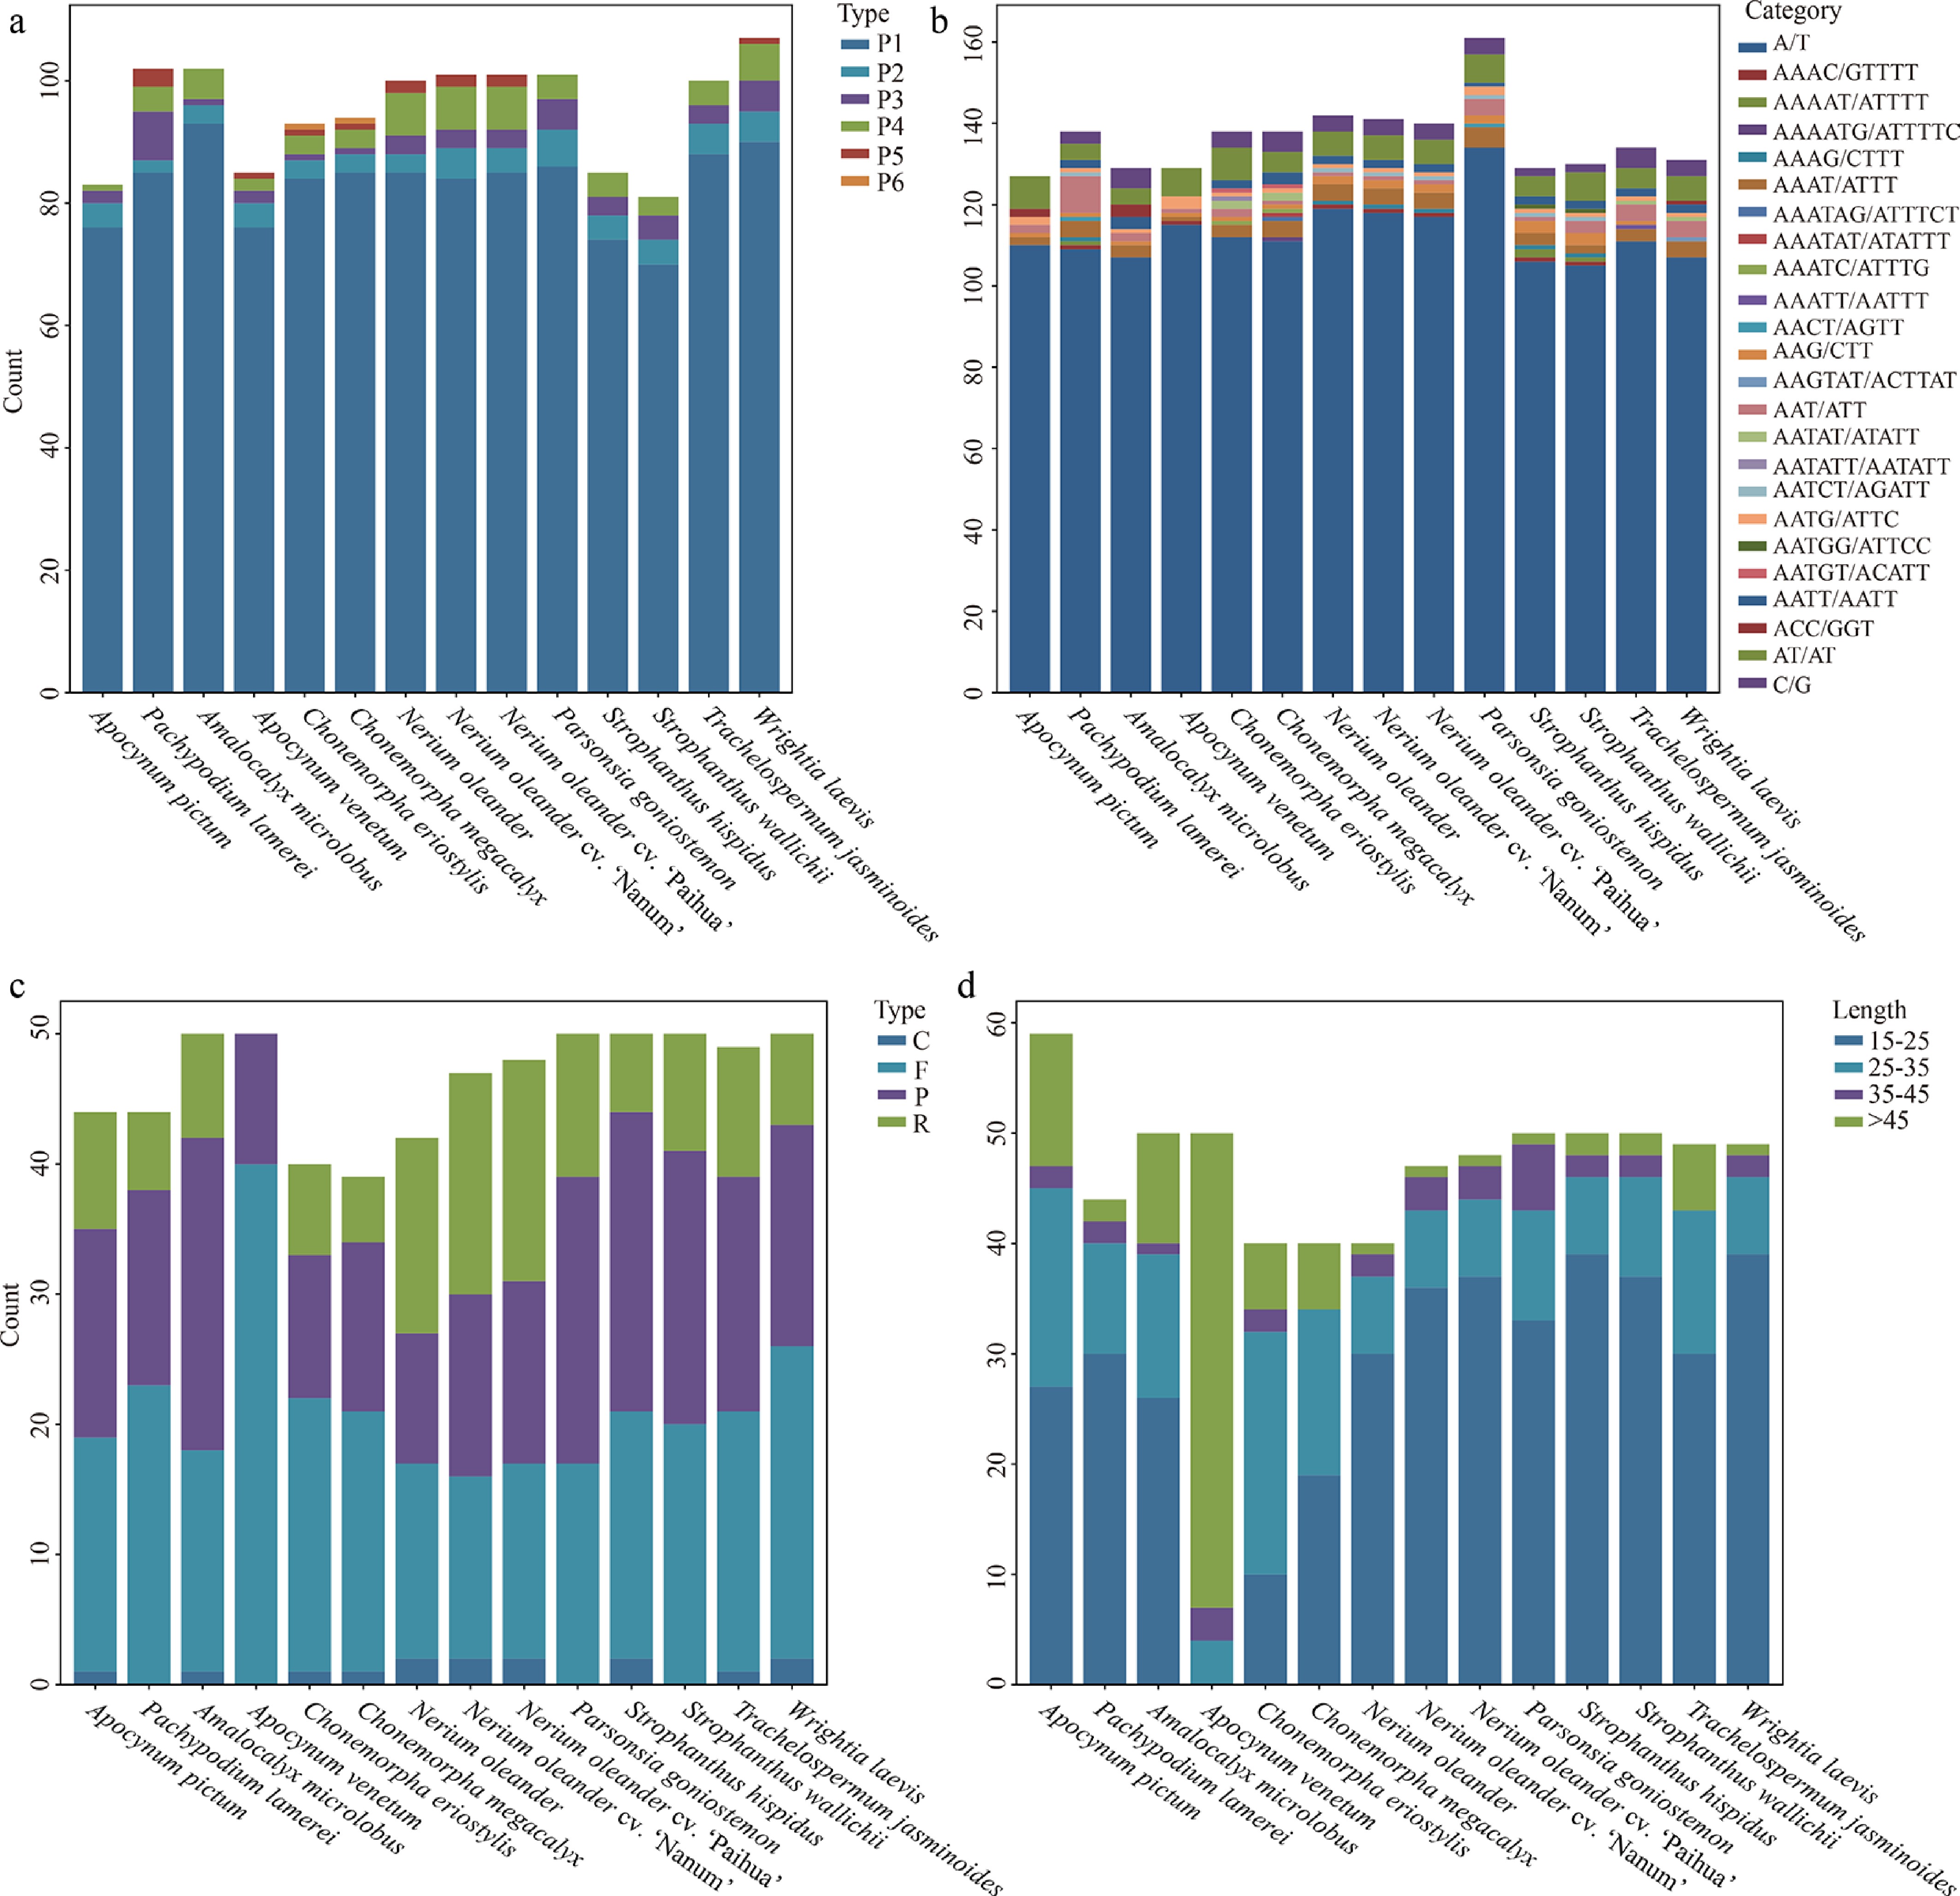
Figure 5.
Comparative analysis of repetitive sequences across 14 Apocynoideae chloroplast genomes. (a) Distribution of six SSR repeat unit types. (b) Count of each SSR repeat type. (c) Count of four long repeat categories. (d) Count of long repeats by length.
The overall count of long repeat sequences varied between 39 and 50. Of the four repeat categories identified, forward repeats were the predominant type (14–40), while complement repeats were the least frequent (0–2) (Fig. 5). A. venetum displayed a distinctive repeat composition, with direct repeats accounting for 80% and no palindromic or complement repeats detected. The length distribution of long repeats also varied markedly among species, highlighting species-specific patterns (Fig. 5). In A. venetum, long repeats were predominant, with 86% exceeding 45 bp in length. By contrast, Chonemorpha species showed a concentration of repeats in the shorter 25–35 bp range, accounting for 37.5%–55%. A. pictum exhibited elevated proportions of long repeats in both the 25–35 bp (30.5%) and > 45 bp (20.3%) categories. These contrasting distribution patterns likely reflect lineage-specific differences in genomic evolution and repeat sequence dynamics.
Comparative analysis of chloroplast genomes
-
A sequence identity plot using N. oleander as the reference revealed that Apocynoideae chloroplast genomes maintain high collinearity and overall structural stability, with no detectable large-scale rearrangements or inversions (Fig. 6). Sequence conservation was higher in the IR regions, whereas the LSC and SSC regions exhibited lower identity, consistent with typical chloroplast genome evolution. At a finer scale, non-coding regions (red bars) displayed substantially greater divergence than exonic regions (purple bars).
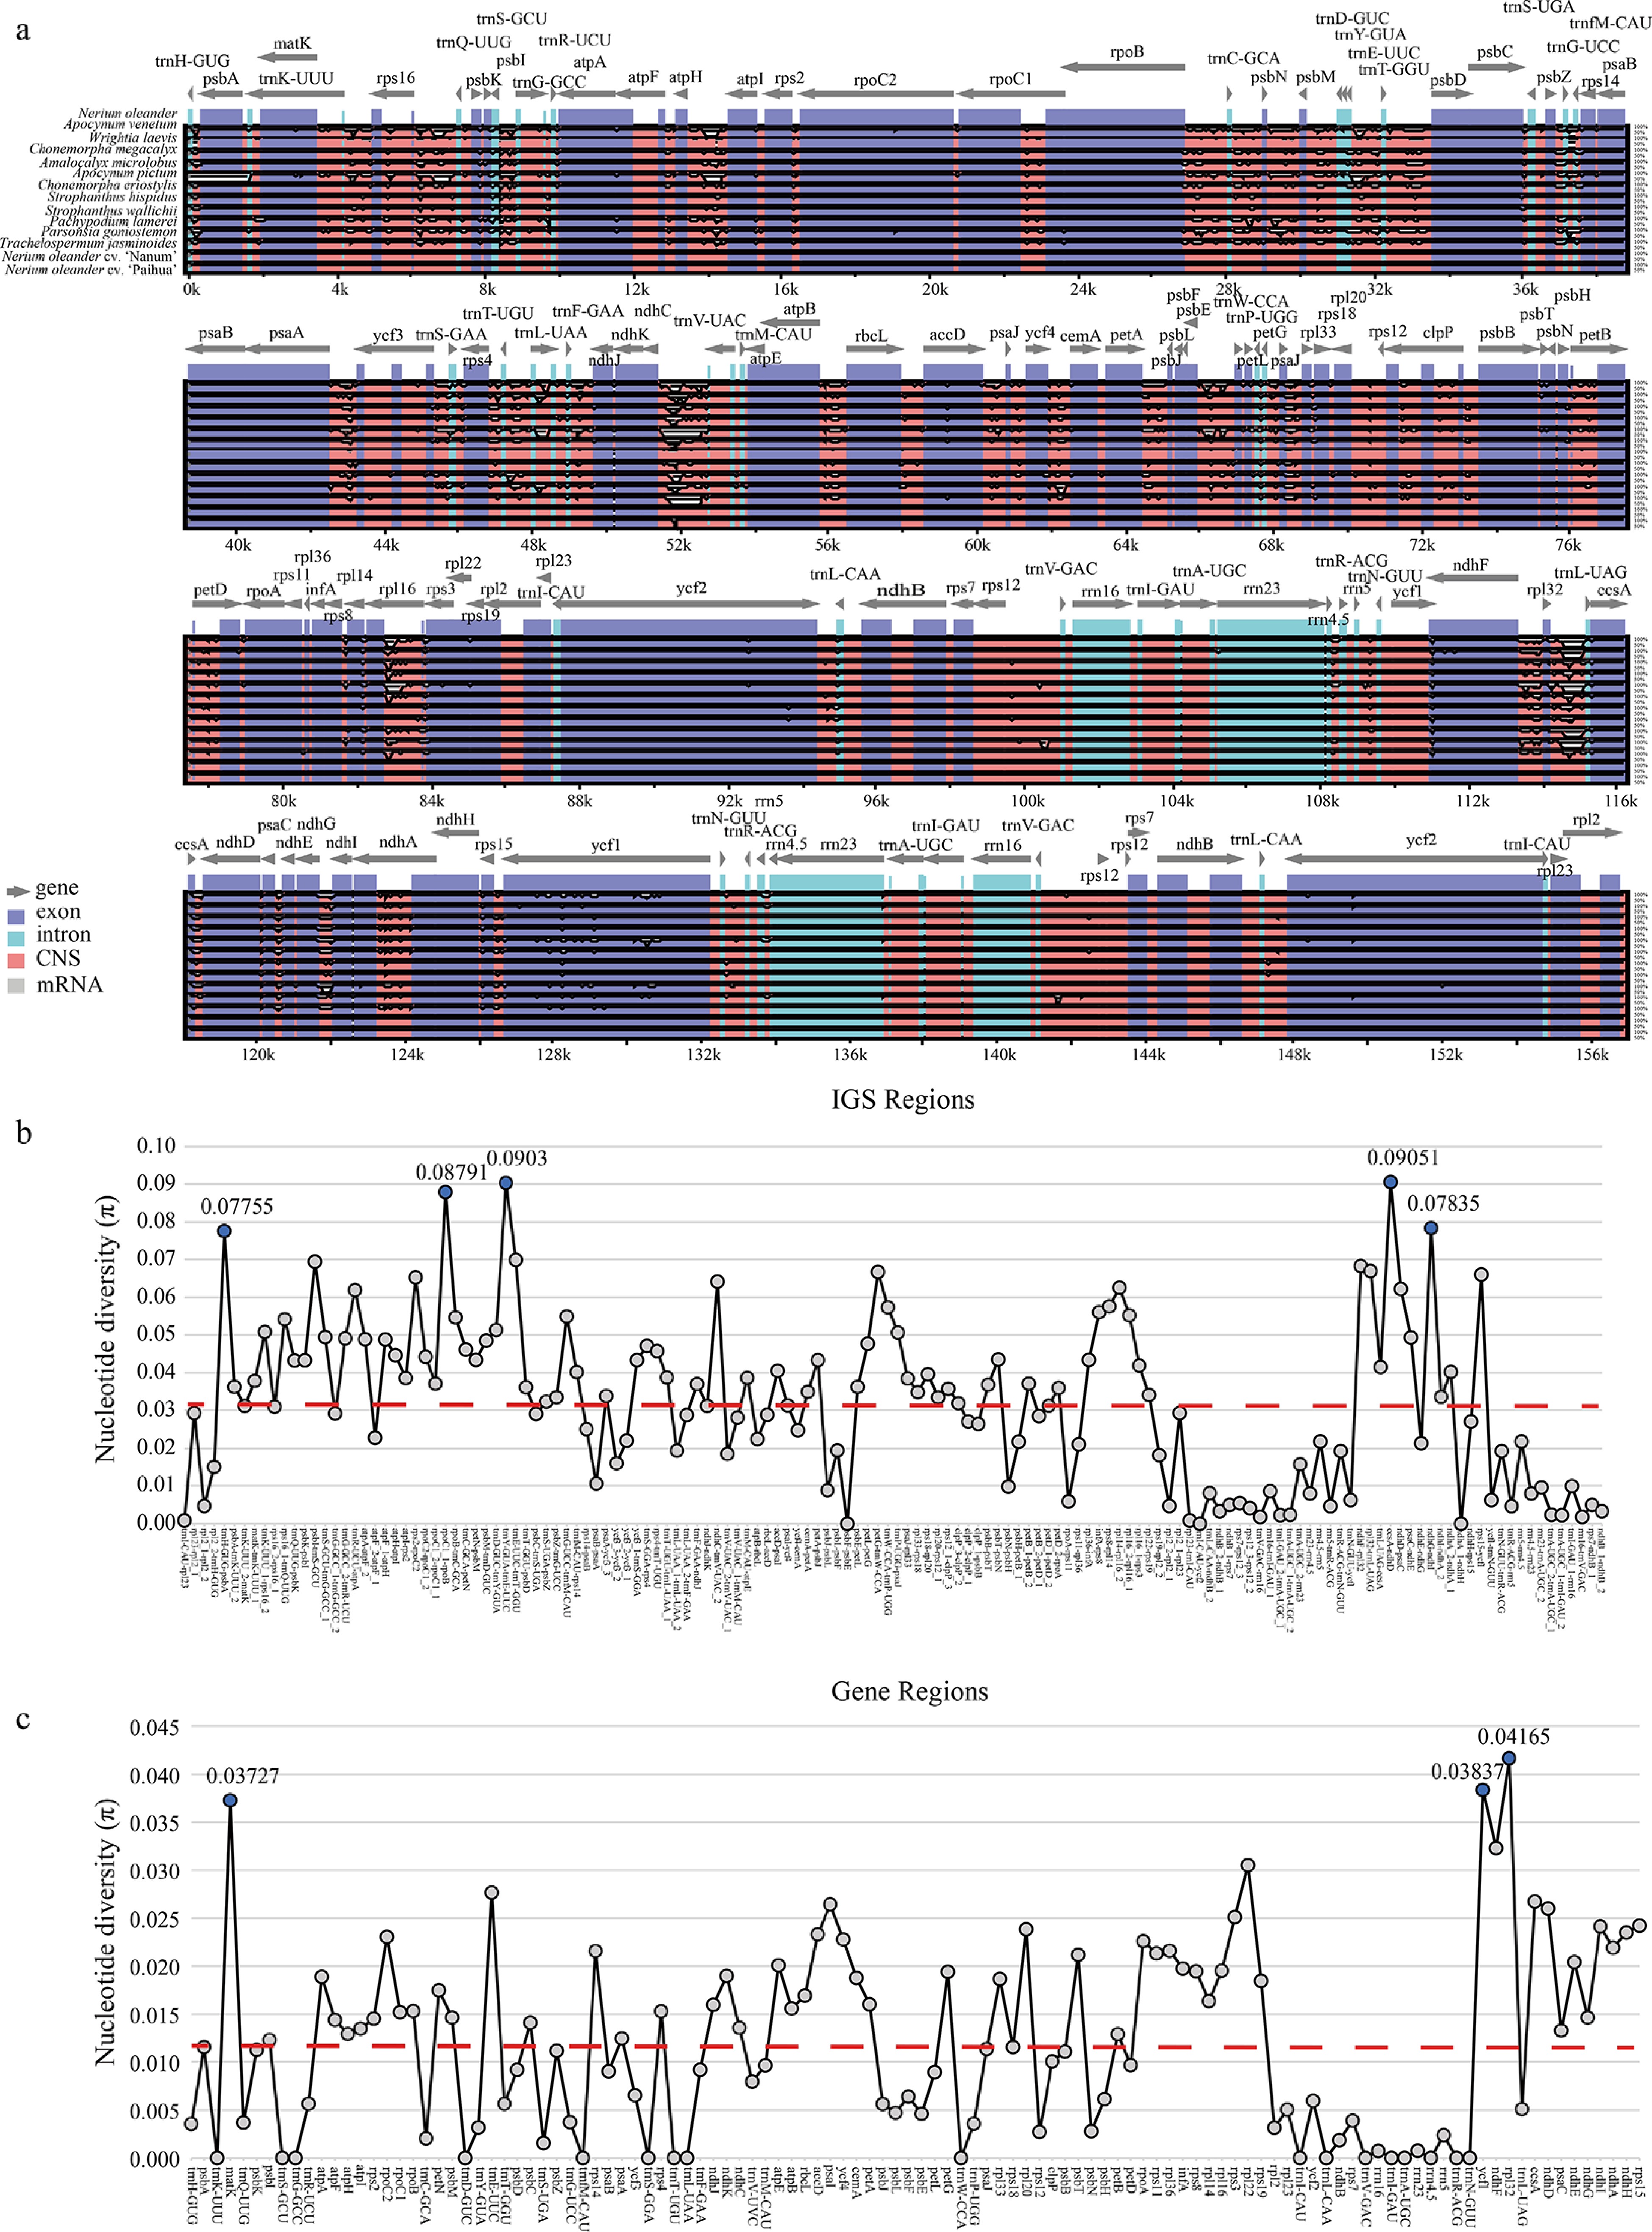
Figure 6.
Comparative analysis of 14 Apocynoideae chloroplast genomes. (a) Sequence identity with N. oleander as the reference. Gray arrows indicate gene orientation, red bars represent non-coding sequences, purple bars denote exons, and blue bars signify introns. (b) Nucleotide variability comparison in intergenic regions. (c) Nucleotide variation comparison in coding regions. Red dashed line represents the average value.
Analysis of nucleotide diversity (π) in coding and intergenic regions revealed pronounced differences in sequence variation. The mean π for intergenic regions (0.0327) was roughly 2.68 times greater than that observed for coding regions (0.0122). Several highly variable hotspots were identified within intergenic regions, with ccsA–ndhD showing the highest diversity (π = 0.09051), followed by trnY-GUA–trnE-UUC (π = 0.0903), and rpoC1_1–rpoB (π = 0.08791) (Fig. 6). These highly variable intergenic regions provide promising targets for developing molecular markers useful in species identification and phylogenetic analyses within Apocynoideae. In contrast, coding regions exhibited generally low nucleotide diversity (π < 0.045). Only a few genes, including rpl32 (π = 0.04165), ycf1 (π = 0.03837), and matK (π = 0.03727), exhibited comparatively elevated variability (Fig. 6).
Comparative analysis of IR boundary structures across 14 Apocynoideae chloroplast genomes demonstrated a high level of structural conservation within the IR regions (Supplementary Fig. S3). In most genomes, IRa and IRb exhibit identical lengths (25,733–25,910 bp), and the arrangement of core genes (e.g., rps3, rpl22, rps19, rpl2) shows minimal variation. The distance between the trnH gene and the IRa/LSC boundary is consistently 2 bp in nearly all chloroplast genomes, reflecting strong boundary conservation. The only exception is A. pictum, which displays a marked IR asymmetry that alters this distance.
Despite the overall conservation, notable lineage-specific changes were detected. A. pictum possesses an extended LSC region (104,272 bp) compared with other species (84,751–86,836 bp) and exhibits an extreme asymmetric IR contraction, with both IRa and IRb reduced to 14,613 bp—substantially shorter than the typical ~25 kb observed in other genomes. As a result, its chloroplast genome is markedly smaller than those of other Apocynoideae species.
Phylogenetic analysis
-
A phylogenetic tree using the ML approach was inferred from the concatenated matrix of 65 homologous protein-coding genes, with G. scabra from Gentianaceae as outgroup (Fig. 7). The resulting matrix had a total length of 48,495 bp, comprising 39,021 conserved sites, 9,474 variable sites, and 5,629 parsimony-informative sites, offering substantial phylogenetic signals for tree reconstruction. The tree revealed that subfamily Apocynoideae is non-monophyletic, as it clusters with the genus Carissa (of the subfamily Rauvolfioideae) and with the subfamily Asclepiadoideae. Nonetheless, species from the same genus within Apocynoideae consistently formed monophyletic clades. Furthermore, N. oleander clustered with species of the genus Strophanthus, located at the relatively basal position of Apocynoideae. As for the three chloroplast genomes of N. oleander, they form a monophyletic group, with the two newly assembled genomes clustering together with almost 100% bootstrap support. This suggests that the two N. oleander cultivars 'Paihua' and 'Nanum' represent intraspecific variation, and the observed phenotypic differences are likely driven by variation in the nuclear genome or environmental factors, rather than chloroplast genome divergence.
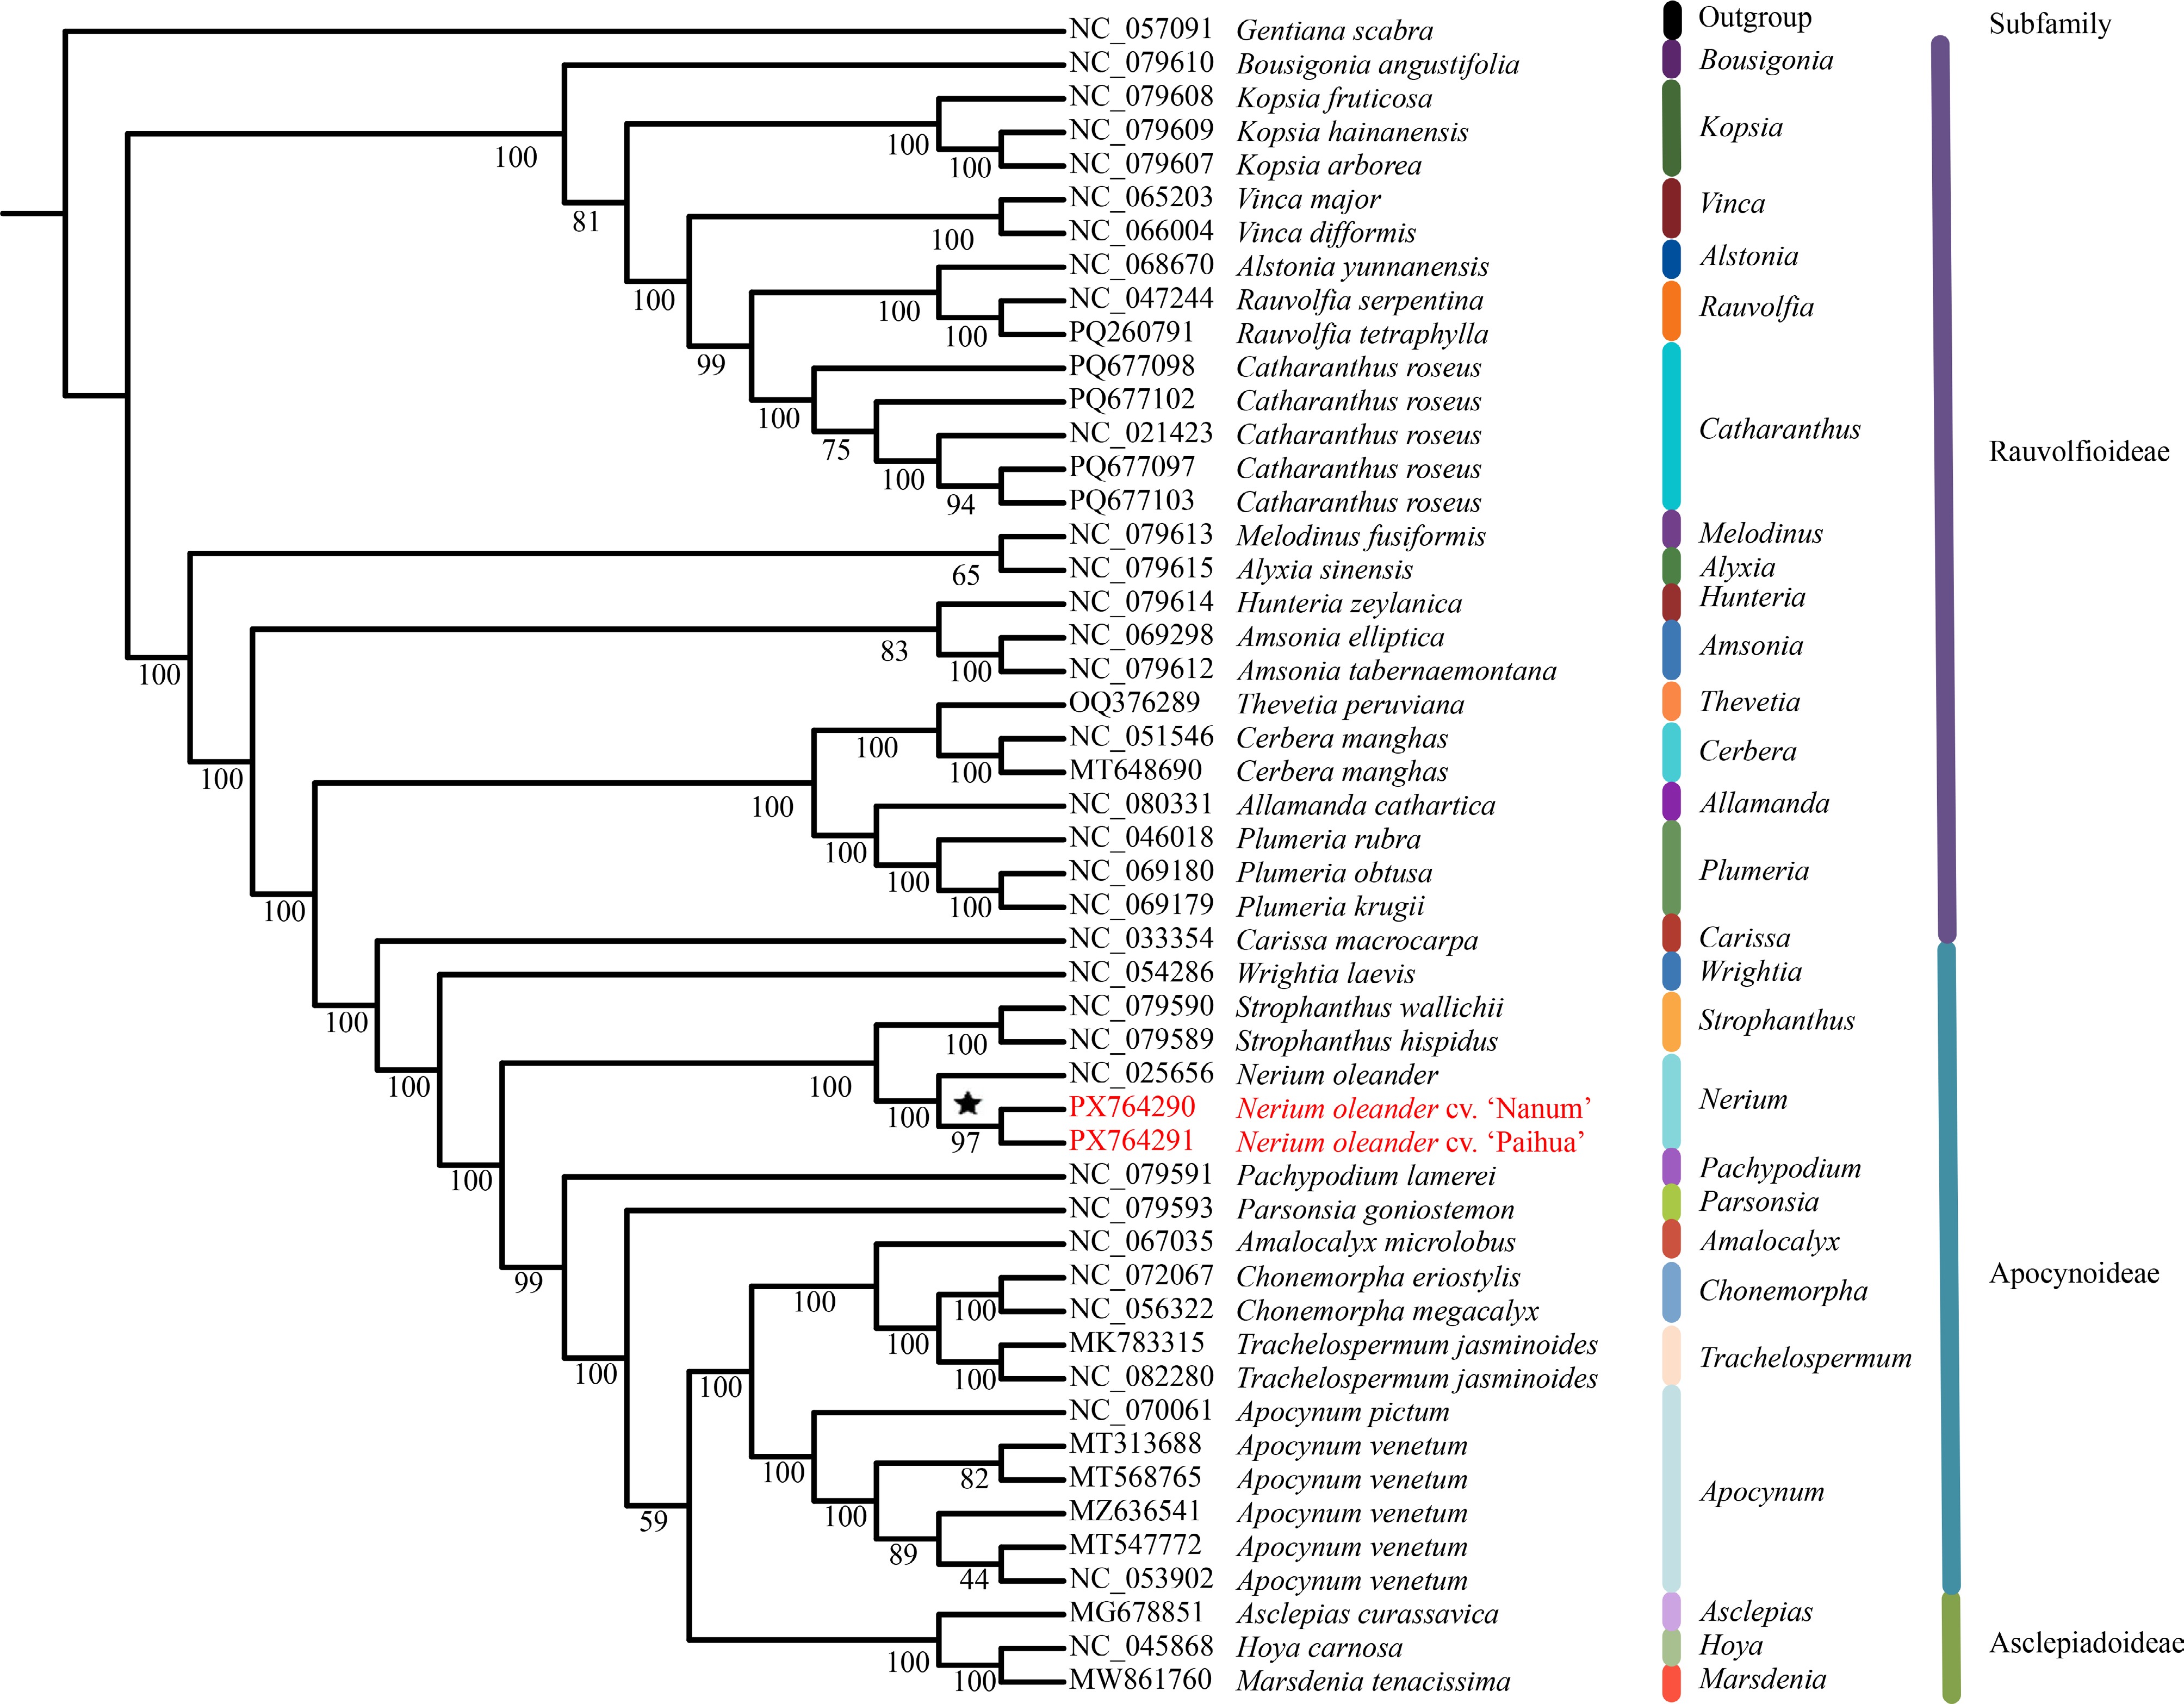
Figure 7.
Phylogenetic tree constructed using concatenated CDS of 50 chloroplast genomes.
-
At the subfamily level, chloroplast genomes of N. oleander cultivars and closely related species display notable structural stability, consistently preserving the canonical angiosperm quadripartite structure (LSC, SSC, IRa, and IRb). Variation in genome length, GC content, and gene composition among species or cultivars is minimal, reflecting the conserved evolutionary patterns observed in chloroplast genomes of Apocynaceae and other angiosperms. This pronounced structural stability is largely attributed to the essential roles of chloroplasts in photosynthesis and core metabolic functions[36]. Purifying selection reinforces this stability by removing deleterious mutations, thereby preserving functionally critical regions over evolutionary time[36,37].
Phylogenetic analysis based on the concatenated CDS of 50 chloroplast genomes produced topologies largely consistent with the current classification of Apocynaceae and further confirmed that Apocynoideae is not monophyletic[2,3]. Genera traditionally assigned to the Wrightieae/Nerieae alliance (e.g., Wrightia, Strophanthus, and Nerium) occupy basal positions within Apocynoideae. In contrast, Apocynum, Amalocalyx, Chonemorpha, and Trachelospermum occupy more derived positions and form a well-supported sister clade to Asclepiadoideae[2]. The three N. oleander chloroplast genomes form a strongly supported monophyletic clade, with the two newly assembled genomes in this study exhibiting especially close affinity. This high level of chloroplast genome similarity indicates that the pronounced phenotypic variation among cultivars is likely driven by nuclear genomic differences or environmental factors.
Codon usage preference and adaptive evolutionary drivers
-
Within Apocynoideae, chloroplast genomes consistently display a strong A/U codon usage bias, suggesting that codon preference is driven by multiple evolutionary forces rather than by random nucleotide composition alone. Mutation patterns in these genomes generally favor A/T enrichment, reinforced by translational selection. Codons ending in A or U are more compatible with the most abundant chloroplast tRNAs, which enhances the translational efficiency of highly expressed photosynthetic genes. This selective advantage likely contributes to the long-term maintenance of A/U-biased codons[36]. The identification of several conserved optimal codons across chloroplast genomes indicates a degree of evolutionary consistency, reflecting a shared adaptive context among species within Apocynoideae. Analyses from ENC-GC3s plots, PR2 bias assessments, and neutrality tests collectively suggest that, while mutational bias establishes a baseline, natural selection predominantly shapes codon usage. The weak correlation between GC12 and GC3 further supports the view that codon preference is not primarily dictated by neutral processes, but instead reflects selection for translational accuracy and functional stability. This pattern corresponds with the critical metabolic roles of chloroplast-encoded genes[38]. Moreover, the 'natural selection dominates, with mutational bias as a secondary factor' model is widely applicable to chloroplast genomes in plants, as similar evolutionary trends have been observed across different phylogenetic lineages, such as in the gymnosperm order Gnetales, the basal angiosperm genus Chloranthus, and the Rubiaceae genus Uncaria[39−41].
Ka/Ks analysis showed that the majority of chloroplast protein-coding genes experience strong purifying selection, highlighting the evolutionary conservation of photosynthesis- and energy metabolism-related functions[42]. At the same time, positive selection signals identified in a small subset of genes, such as ndhG and rpl20, in particular lineages indicate localized adaptive responses to environmental pressures. For example, ndhG encodes a subunit of the chloroplast NDH complex, which participates in chloroplast respiration and cyclic electron transport and plays a critical role in plant responses to environmental stress[43,44]. Considering that Apocynum venetum exhibits typical drought resistance, the positive selection signals detected in ndhG may be associated with the species' evolutionary adaptation to arid environments. The rpl20 gene encodes a component of the chloroplast large ribosomal subunit, contributing to chloroplast translation[45]. Positive selection signals in this gene were observed in five species, suggesting that rpl20 may be involved in the adaptive modulation of chloroplast function under varying environmental conditions. Additionally, psaI encodes a subunit of Photosystem I, essential for photosynthetic electron transport[46]. In the closely related species A. venetum and A. pictum, shared positive selection in psaI likely reflects convergent adaptive evolution in response to similar environmental stresses, such as drought and salinity. Overall, these findings reveal an evolutionary pattern in chloroplast genomes marked by broad functional conservation alongside lineage-specific adaptive refinement[47].
Chloroplast genome sequence variation and molecular marker development
-
The lineage-specific distribution of SSRs and long repeats across the 14 Apocynoideae chloroplast genomes indicates that these elements are not merely the result of random accumulation but may contribute to structural variation and lineage differentiation[47]. Mononucleotide SSRs exhibit a pronounced A/T bias in most genomes, while forward repeats are the most prevalent among long repeats, with notable interspecific differences in repeat length[48]. For instance, Apocynum pictum features long repeats predominantly exceeding 45 bp, whereas in Chonemorpha species, most repeats fall within the 25–35 bp range. These patterns likely reflect the distinct evolutionary dynamics operating across lineages.
In addition to repeat-associated structural variation, contraction and expansion of IR regions play an important role in chloroplast genome divergence. In A. pictum, the IR region is reduced by approximately 43.6% compared with A. venetum, accompanied by a ~20.1% expansion of the LSC region. This shift results in the relocation of genes such as rps19 and rpl2 from the IR to the LSC region, leading to the loss of duplicated copies. Similar patterns have been reported in A. pictum, where IR contraction alters IR/LSC boundaries and drives gene copy number variation[49]. Shifts in IR/SC boundaries and changes in gene copy number have also been observed in other angiosperms. For instance, in Euphorbia, near-complete loss of the IR regions has converted genes, originally in the IR, into single-copy genes[50]. Similarly, in Vicia kulingana, the absence of IR regions results in single copies of genes like rps19 and rpl2[51]. These findings indicate that IR contraction is a common mechanism driving structural variations in chloroplast genomes. The resulting reduction in gene copy number, especially for rps19 and rpl2, may alter gene dosage effects, influencing plant adaptation to different environments.
Analysis of nucleotide diversity showed that intergenic regions exhibit substantially greater variation than coding regions, with a mean π roughly 2.68 times higher. This pattern aligns with the typical evolutionary trajectory of chloroplast genomes, in which non-coding regions accumulate mutations more rapidly and function as important reservoirs of information for species differentiation[48]. The highly variable regions within intergenic regions, such as ccsA–ndhD, trnY-GUA–trnE-UUC, and rpoC1_1–rpoB, are potential candidates for molecular marker development and may facilitate species delimitation and phylogenetic reconstruction[52].
Within coding regions, overall sequence variability is low; however, genes such as rpl32, ycf1, and matK display relatively elevated variation, highlighting their suitability as chloroplast barcodes for plant species identification[53]. These high-variability regions, including both intergenic regions and coding genes, are suitable for species identification at the species and subspecies levels, while more conserved coding genes (e.g., psbA, rbcL, and rrn16) can be used for higher-level phylogenetic reconstruction[54−56]. This study provides important resources to support the development of molecular markers for Apocynoideae, overcoming the constraints associated with traditional markers in this subfamily.
-
In this study, we sequenced and characterized the chloroplast genomes of two N. oleander cultivars, 'Paihua' and 'Nanum', and conducted a comparative genomic analysis of 14 chloroplast genomes within Apocynoideae. The results show that both cultivars retain the canonical quadripartite chloroplast structure and display a high level of genomic conservation, reflecting minimal variation. Phylogenetic analysis indicates that the two N. oleander cultivars represent intraspecific variation, with their phenotypic differences likely driven by nuclear genome variation and/or environmental influences. Within Apocynoideae chloroplast genomes, non-coding regions exhibit substantial sequence divergence, while coding regions show a pronounced A/U codon usage bias, reflecting the combined influence of mutational tendencies and selective pressures. Our results indicate that codon usage patterns are mainly shaped by selective pressures, with core regions remaining conserved across species, while specific lineages exhibit divergence in certain loci. Highly variable regions, including ccsA–ndhD, were identified as strong candidate markers for species discrimination. Moreover, this study clarifies the evolutionary dynamics of Apocynoideae chloroplast genomes, emphasizing both the conservation of IR boundary structures and the lineage-specific patterns of repetitive sequences. These findings address a key gap in our understanding of chloroplast genome evolution within the subfamily. Collectively, the results offer crucial molecular evidence for lineage diversification, adaptive evolution, and species identification, supporting the effective utilization of genetic resources and molecular breeding in Apocynoideae. Future studies that include more extensive lineage sampling and integrate nuclear/mitochondrial genome data will offer a deeper understanding of the evolutionary history and origin of this subfamily.
-
The authors confirm their contributions to this study as follows: study design and project leading: Wang Z; samples collection: Wu M, Su H; data analyses, writing - draft manuscript preparation: Wu M, Hu L, Su H; technical support: Wu Y; writing - review and editing: Yang X, Hu L, Wang Z. Wu M and Hu L contributed equally. All authors read and approved the final version of the manuscript.
-
The newly sequenced and assembled plastomes in this study have been deposited in the NCBI GenBank database (www.ncbi.nlm.nih.gov) under accession numbers PX764290 and PX764291. All other data generated or analyzed during this study are included in this article and its supplementary files.
-
This work was supported by the National Natural Science Foundation of China (Nos. 32422053, 32301411) and Natural Science Foundation of Jiangsu Province, China (No. BK20230394).
-
The authors declare that they have no conflict of interest.
-
accompanies this paper online at: https://doi.org/10.48130/gcomm-0026-0009.
-
# Authors contributed equally: Menglin Wu, Lichao Hu
- Supplementary Table S1 Characteristics of chloroplasts in N. oleander cultivars 'Nanum' and 'Paihua'.
- Supplementary Table S2 N. oleander cultivars 'Nanum' and 'Paihua' chloroplast genome annotated gene list.
- Supplementary Fig. S1 Synonymous and optimal codon usage patterns in chloroplast genomes of Apocynoideae.
- Supplementary Fig. S2 ENC versus GC3s relationship for protein-coding genes in 14 chloroplast genomes. Each point represents an individual gene, with the point size proportional to its ENC value.
- Supplementary Fig. S3 Comparison of LSC, SSC, and IR boundary regions among 14 Apocynoideae chloroplast genomes.
- Copyright: © 2026 by the author(s). Published by Maximum Academic Press, Fayetteville, GA. This article is an open access article distributed under Creative Commons Attribution License (CC BY 4.0), visit https://creativecommons.org/licenses/by/4.0/.
-
About this article
Cite this article
Wu M, Hu L, Su H, Wu Y, Yang X, et al. 2026. A comprehensive analysis of 14 chloroplast genomes from the subfamily Apocynoideae (Apocynaceae). Genomics Communications 3: e010 doi: 10.48130/gcomm-0026-0009 

A comprehensive analysis of 14 chloroplast genomes from the subfamily Apocynoideae (Apocynaceae)
- Received: 04 March 2026
- Revised: 10 April 2026
- Accepted: 09 May 2026
- Published online: 28 May 2026
Abstract: The subfamily Apocynoideae comprises diverse woody vines and shrubs that play important ecological, medicinal, and ornamental roles, with Nerium oleander being one of the representative species. Analyzing the chloroplast genomes of this subfamily provides a molecular foundation for phylogenetic reconstruction, species identification, and breeding programs. In this study, we conducted a comprehensive comparative analysis of 14 chloroplast genomes in Apocynoideae, including the two newly sequenced genomes of N. oleander cultivars 'Paihua' and 'Nanum'. Our results revealed that: (1) the chloroplast genome structure within this subfamily exhibits significant variations in the non-coding regions; (2) codon usage is influenced by both mutational pressure and natural selection, with lineage-specific fine-tuning; and (3) selection pressure follows an evolutionary pattern characterized by core conservation and specific divergence, while repetitive sequences display distinct species-specific features and a notable A/T-rich bias. Phylogenetic analysis showed that N. oleander shares a close relationship with Strophanthus. Furthermore, the subfamily Apocynoideae is non-monophyletic, with the subfamily Asclepiadoideae nested within it as a clade. This study provides the first comprehensive multi-dimensional evolutionary analysis of chloroplast genomes in Apocynoideae, offering important molecular evidence for lineage differentiation, adaptive evolution, and species identification.
-
Key words:
- Nerium oleander /
- Chloroplast genome /
- Phylogeny /
- Codon preference /
- Selective pressure