


-
Lawns are integral to urban landscapes, enhancing esthetic appeal, improving environmental quality, and providing recreational spaces[1,2]. However, the proliferation of tall buildings and dense tree canopies in urban areas often subjects turfgrass to severe shading, a primary stress factor limiting growth and survival[3]. Shading induces physiological changes in turfgrass, including chlorophyll degradation, reduced relative water content (RWC), decreased photosynthetic rates, slower growth, and leaf yellowing or death, which compromise lawns' quality and functionality[4,5]. As urban greening initiatives expand, selecting shade-tolerant turfgrass species is critical for sustainable landscaping, as is understanding the adaptive mechanisms that enable plants to thrive under low-light conditions.
Plants have evolved two primary strategies to cope with shade: Shade avoidance syndrome (SAS) and shade tolerance. Shade-avoiding species, such as Arabidopsis thaliana, respond to low red : far-red (R : FR) ratios, indicative of neighbor proximity or canopy shade, by elongating their stems and petioles, reducing leaf expansion, and accelerating flowering to escape shade[6]. These responses are mediated by phytochrome B (phyB) deactivation, which releases phytochrome-interacting factors (PIFs) to promote the expression of growth-related genes[7−9]. In contrast, shade-tolerant species, like Cardamine hirsuta, adopt a conservative growth strategy, prioritizing organ preservation and photosynthetic efficiency under low light, with attenuated elongation and enhanced antioxidant defenses[10,11]. Molecularly, shade tolerance involves negative regulators like LONG HYPOCOTYL IN FAR-RED LIGHT 1 (HFR1), which inhibit PIFs' activity, and enhanced Phytochrome A (phyA) stability, suppressing SAS responses[12]. These divergent strategies highlight the complex interplay of photoreceptors (phytochromes, cryptochromes) and transcription factors in modulating plants' responses to shade[6,13,14].
Centipedegrass (Eremochloa ophiuroides), a perennial C4 grass from the Poaceae family, is native to China and is widely used in tropical and subtropical regions because of its desirable traits, including short stature, drought tolerance, resilience to poor soils, tolerance of shade and wet environments, rapid growth, high coverage, and low maintenance requirements[15,16]. It serves as an ideal ground cover for lawns, highway embankments, and slope stabilization. Despite its adaptability, there is a notable shortage of shade-tolerant centipedegrass germplasm, and research on its shade tolerance mechanisms remains limited. This gap is particularly significant, given the increasing demand for turfgrass in high-density urban environments, where shading often co-occurs with abiotic stresses like drought and salinity, requiring varieties with cross-tolerance[17].
The molecular mechanisms underlying shade responses, which have been thoroughly studied in model species, involve photoreceptor signaling networks that integrate light and environmental cues. Phytochromes (phyA, phyB) and cryptochromes (CRY1, CRY2) perceive changes in R:FR and blue light, respectively, modulating PIF-driven gene expression to regulate growth, photosynthesis, and stress responses[6,7,10,13,18,19]. Shade-tolerant species exhibit enhanced antioxidant activity and osmotic adjustment, reducing oxidative damage and maintaining cellular function under low light[20−22]. However, these mechanisms are underexplored in turfgrass species like centipedegrass, limiting the development of shade-adapted cultivars.
This study addresses these gaps by screening 16 centipedegrass genotypes, collected from diverse habitats in China, to identify shade-tolerant germplasm. We focused on two contrasting genotypes, CP11 (shade-tolerant) and CP2 (shade-sensitive), to analyze their physiological and biochemical responses under 66% and 99% shading treatments. Transcriptome sequencing was used to elucidate the molecular mechanisms of shade tolerance, identifying differentially expressed genes (DEGs) and pathways associated with shade adaptability. By integrating physiological and transcriptomic data, this study aims to enhance our understanding of shade tolerance in centipedegrass and provide a foundation for breeding resilient turfgrass varieties for urban and agricultural applications.
-
The centipedegrass ecotypes in the study were collected from several provinces in China, including Guangxi, Guangdong, Jiangsu, Jiangxi, and Hunan. After collection from the wild, all accessions were uniformly propagated at the CATAS Forage Base. Sixteen representative centipedegrass germplasms were selected for evaluating shade tolerance (Table 1). According to the preliminary results, CP11 showed strong shade tolerance, whereas CP2 was shade-sensitive. Therefore, CP11 and CP2 were chosen for further analysis.
Table 1. Sources of tested centipedegrass ecotypes and their geographical information.
Serial number Sampling location Longitude (E) Latitude (N) Altitude (m) CP1 Fangchenggang City, Guangxi 108.28° 21.50° 0 CP2 Jiangcheng District, Yangjiang City, Guangdong Province 111.58° 21.38° 0 CP3 Xiajiang County, Jiangxi Province 115.19° 27.34° 50.6 CP4 Boluo County, Huizhou City, Guangdong Province 114.28° 23.18° 26.2 CP5 Hepu County, Beihai City, Guangxi 109.44° 21.29° 35 CP6 Tieshangang District, Beihai City, Guangxi 109.31° 21.38° 10 CP7 Dongxing City, Fangchenggang City, Guangxi 108.90° 21.31° 0 CP8 Changsha City, Hunan Province 113.08° 28.26° 53.6 CP9 Provided by Jiangsu Academy of Agricultural Sciences − − − CP10 Yifeng County, Pingxiang City, Jiangxi Province 114.14° 27.35° 589 CP11 Wuyishan City, Nanping City, Fujian Province 117.58° 27.37° 197.2 CP12 Jiangning District, Jiangsu Province 119.04° 32.03° 73 CP13 Provided by Jiangsu Academy of Agricultural Sciences − − − CP14 Xinfeng County, Ganzhou City, Jiangxi Province 114.55° 25.07° 170.4 CP15 Hepu County, Beihai City, Guangxi 109.12° 21.39° 53.9 CP16 Nanchang City, Jiangxi Province 115.51° 28.50° 35.3 Experimental design and shading treatments
-
The pot experiment method was adopted. Healthy, pest-free, and uniformly growing seedlings of CP11 and CP2 centipedegrass were selected from the test site and transplanted into plastic pots with a diameter of 20 cm. After one month of cultivation to ensure that the density and coverage of each pot were basically consistent, the shading treatments were applied. Two shading treatments were established using shading rates of 66% (34% light transmittance) and 99% (near-total shading, with minimal light transmittance), with nonshaded plants serving as the control. The shading treatments were achieved by covering the plants with different layers of shade nets. Leaf and root samples were collected on Days 0, 6, 12 and 18 during the shading stress treatment for index measurement, with three biological replicates per treatment.
Leaf withering rate
-
Wilted leaves were eliminated before the onset of the shade treatment. The percentage of withered leaves relative to the total number of leaves was then documented at different sampling times during the shade treatment period.
Leaf RWC
-
The leaf RWC was assessed using the saturated weighing method outlined by Liu et al.[23]. Approximately 0.5 g of freshly cut leaves was weighed to obtain the fresh weight (FW), referred to as W1. The leaves were then soaked in water for 24 h, blotted dry, and weighed again to obtain the saturated weight (W2). After drying at 105 °C for 24 h, the dry weight (W3) was measured. The formula is as follows:
$ RWC{\text{%}}=\dfrac{W1-W3}{W2-W3}\times 100{\text{%}} $ Leaf chlorophyll content
-
Chlorophyll content was determined following the method described by Liu et al.[22]. About 0.5 g of the fresh leaf samples was placed in 15-mL tubes with 10 mL of an extraction solution (acetone : ethanol : water = 4.5:4.5:1) and kept in the dark for 24 h. After the leaves turned white, absorbance at 663 nm and 645 nm was recorded to calculate the total chlorophyll content (C_total) using the formula:
$ \rm {C\_total\;(mg/g)=(20.2A645+8.02A663)\times V/(W\times 100)} $ where, W represents the sample's fresh weight (g), and V denotes the total volume of the sample extract (mL).
Leaf electrolyte leakage
-
The electrolyte leakage (EL) of the leaves was measured by the method of Hatsugai and Katagiri[24]. Leaves were cut into 2-cm pieces and rinsed three times with distilled water. Then 0.5 g of the leaf segments were placed in 20 mL of distilled water and shaken for 24 h. Conductivity (E1) was measured, followed by boiling the samples at 100 °C for 20 min to measure the total conductivity (E2). Relative EL was calculated as (E1/E2) × 100.
Leaf and root malondialdehyde
-
Leaf and root malondialdehyde (MDA) content was determined, following the method outlined by Davey et al.[25]. The reaction solution was made by dissolving 20 g of trichloroacetic acid (TCA) and 0.5 g of thiobarbituric acid (TBA) in 100 mL of distilled water. Next, 1.2 mL of the extract was mixed with 2.4 mL of this solution, heated at 100 °C for 30 min, cooled on ice, and centrifuged at 8,000 × g for 10 min, then the absorbance at 450, 532, and 600 nm was measured.
$ \rm{MDA\;Concentration\;({\text μ}mol\cdot L^{-1})=6.45\times (A532-A600)-0.56\times A450} $ MDA content (μmol·g−1 FW) = MDA concentration (μmol·L−1) × dilution factor × total volume of extract / sample FW
Root viability
-
Root viability was assessed using the 2,3,5-Triphenyltetrazolium chloride (TTC) method following the protocol outlined by Comas et al.[26]. Approximately 0.5 g of centipedegrass roots was cut into small segments and immersed in 0.5 mL of 0.4% TTC and 0.07 mol·L−1 of a phosphate buffer. The samples were incubated in the dark at 37 °C for 2 h. After red coloration appeared, 5 mL of 1 mol·L−1 sulfuric acid was added to stop the reaction. The roots were then dried, soaked in 10 mL of methanol, and incubated at 37 °C until the tissues turned white. The absorbance of the extracted solution was measured at 485 nm using methanol as a blank.
Osmotic substances
-
The soluble sugar content was measured using the phenol method[27], the soluble protein content was measured using the Coomassie Brilliant Blue G-250 staining method[28], and the free proline content was measured using the ninhydrin method[29].
Superoxide dismutase activity assay
-
The activities of superoxide dismutase (SOD) was determined following the protocols described by Wang et al.[30]. In total, 0.2 g of the root sample was ground in liquid nitrogen, then mixed with 4 mL of a 50 mM phosphate buffer (pH 7.8) and centrifuged at 10,000 × g for 20 min at 4 °C. The supernatant was used for subsequent analysis. The reaction mixture (3.0 mL) contained a phosphate buffer, methionine, nitroblue tetrazolium (NBT), ethylenediaminetetraacetic acid (EDTA), riboflavin, and 100 μL of the enzyme extract. the control lacked the enzyme. After 10 min of light exposure (13,000 lux), the color changed from yellow to blue-black, and absorbance was measured at 560 nm, with the dark, enzyme-free control as the blank.
Total RNA extraction, RNA-seq library construction, and sequencing
-
RNA sequencing (RNA-seq) was conducted by Wuhan IGENEBOOK Biotechnology Co., Ltd. (
www.igenebook.com ). Total RNA was extracted using the RNAprep Pure Kit DP432 (Tiangen, Beijing, China) following the manufacturer's instructions. RNA quality was checked with a Qsep400 instrument. Libraries were prepared with the VAHTS mRNA-seq V8 Kit and sequenced (150 bp paired-end) on an Illumina NovaSeq 6000.Bioinformatic analysis of RNA-seq results
-
The low-quality reads were filtered with cutadapt (version 1.11). Clean reads were mapped to the reference genome by Hisat2 (version 2.1.0)[16], allowing up to two mismatches. These genes were subjected to alignment against the public protein databases NR (RefSeq nonredundant proteins). Featurecount (v1.6.0) was used for estimating transcript abundance and normalization of the expression values as FPKM (fragments per kilobase of transcript per million fragments mapped)[31]. Differentially expressed genes were identified by edgeR with a filter threshold of false discovery rate (FDR) < 0.05 and |log2(fold change)| > 1[32]. ClusterProfiler (
www.bioconductor.org/packages/release/bioc/html/clusterProfiler.html ) in the R package[33] was used to perform GO (Gene Ontology) (http://geneontology.org/ )[34] enrichment analysis. The GO and Kyoto Encyclopedia of Genes and Genomes (KEGG) enrichment analyses were calculated using the hypergeometric distribution with a q-value cutoff of 0.05.Real-time polymerase chain reaction verification
-
cDNA was synthesized using the SuperScript III First-Strand Synthesis System (Thermo Fisher Scientific) with oligo(dT) primers following the manufacturer's instructions. Real-time polymerase chain reaction (PCR) was performed using the QuantiTect SYBR Green PCR Kit (Qiagen). The primer sequences are listed in Supplementary Table S1. The Eremochloa ophiuroides Actin gene (evm.TU.ctg83.46) was used as the reference, and expression levels were calculated using the 2−ΔCᴛ method.
-
We investigated the shading resistance of 16 centipedegrass ecotypes, collected from various locations (Table 1), under 99% shading for 18 d, compared with a control group with no shading. The control group exhibited healthy growth with no wilted leaves (0% wilting rate across all ecotypes). In contrast, the shade-treated groups showed a progressive increase in wilted leaves. By Day 18, the rate of leaf wilting varied significantly among ecotypes: CP11 exhibited the lowest rate at 56.33%, whereas CP2 had the highest at 98.2%. Other ecotypes ranged from 79% (CP5) to 95% (CP15), indicating diverse responses to shading stress (Fig. 1a).
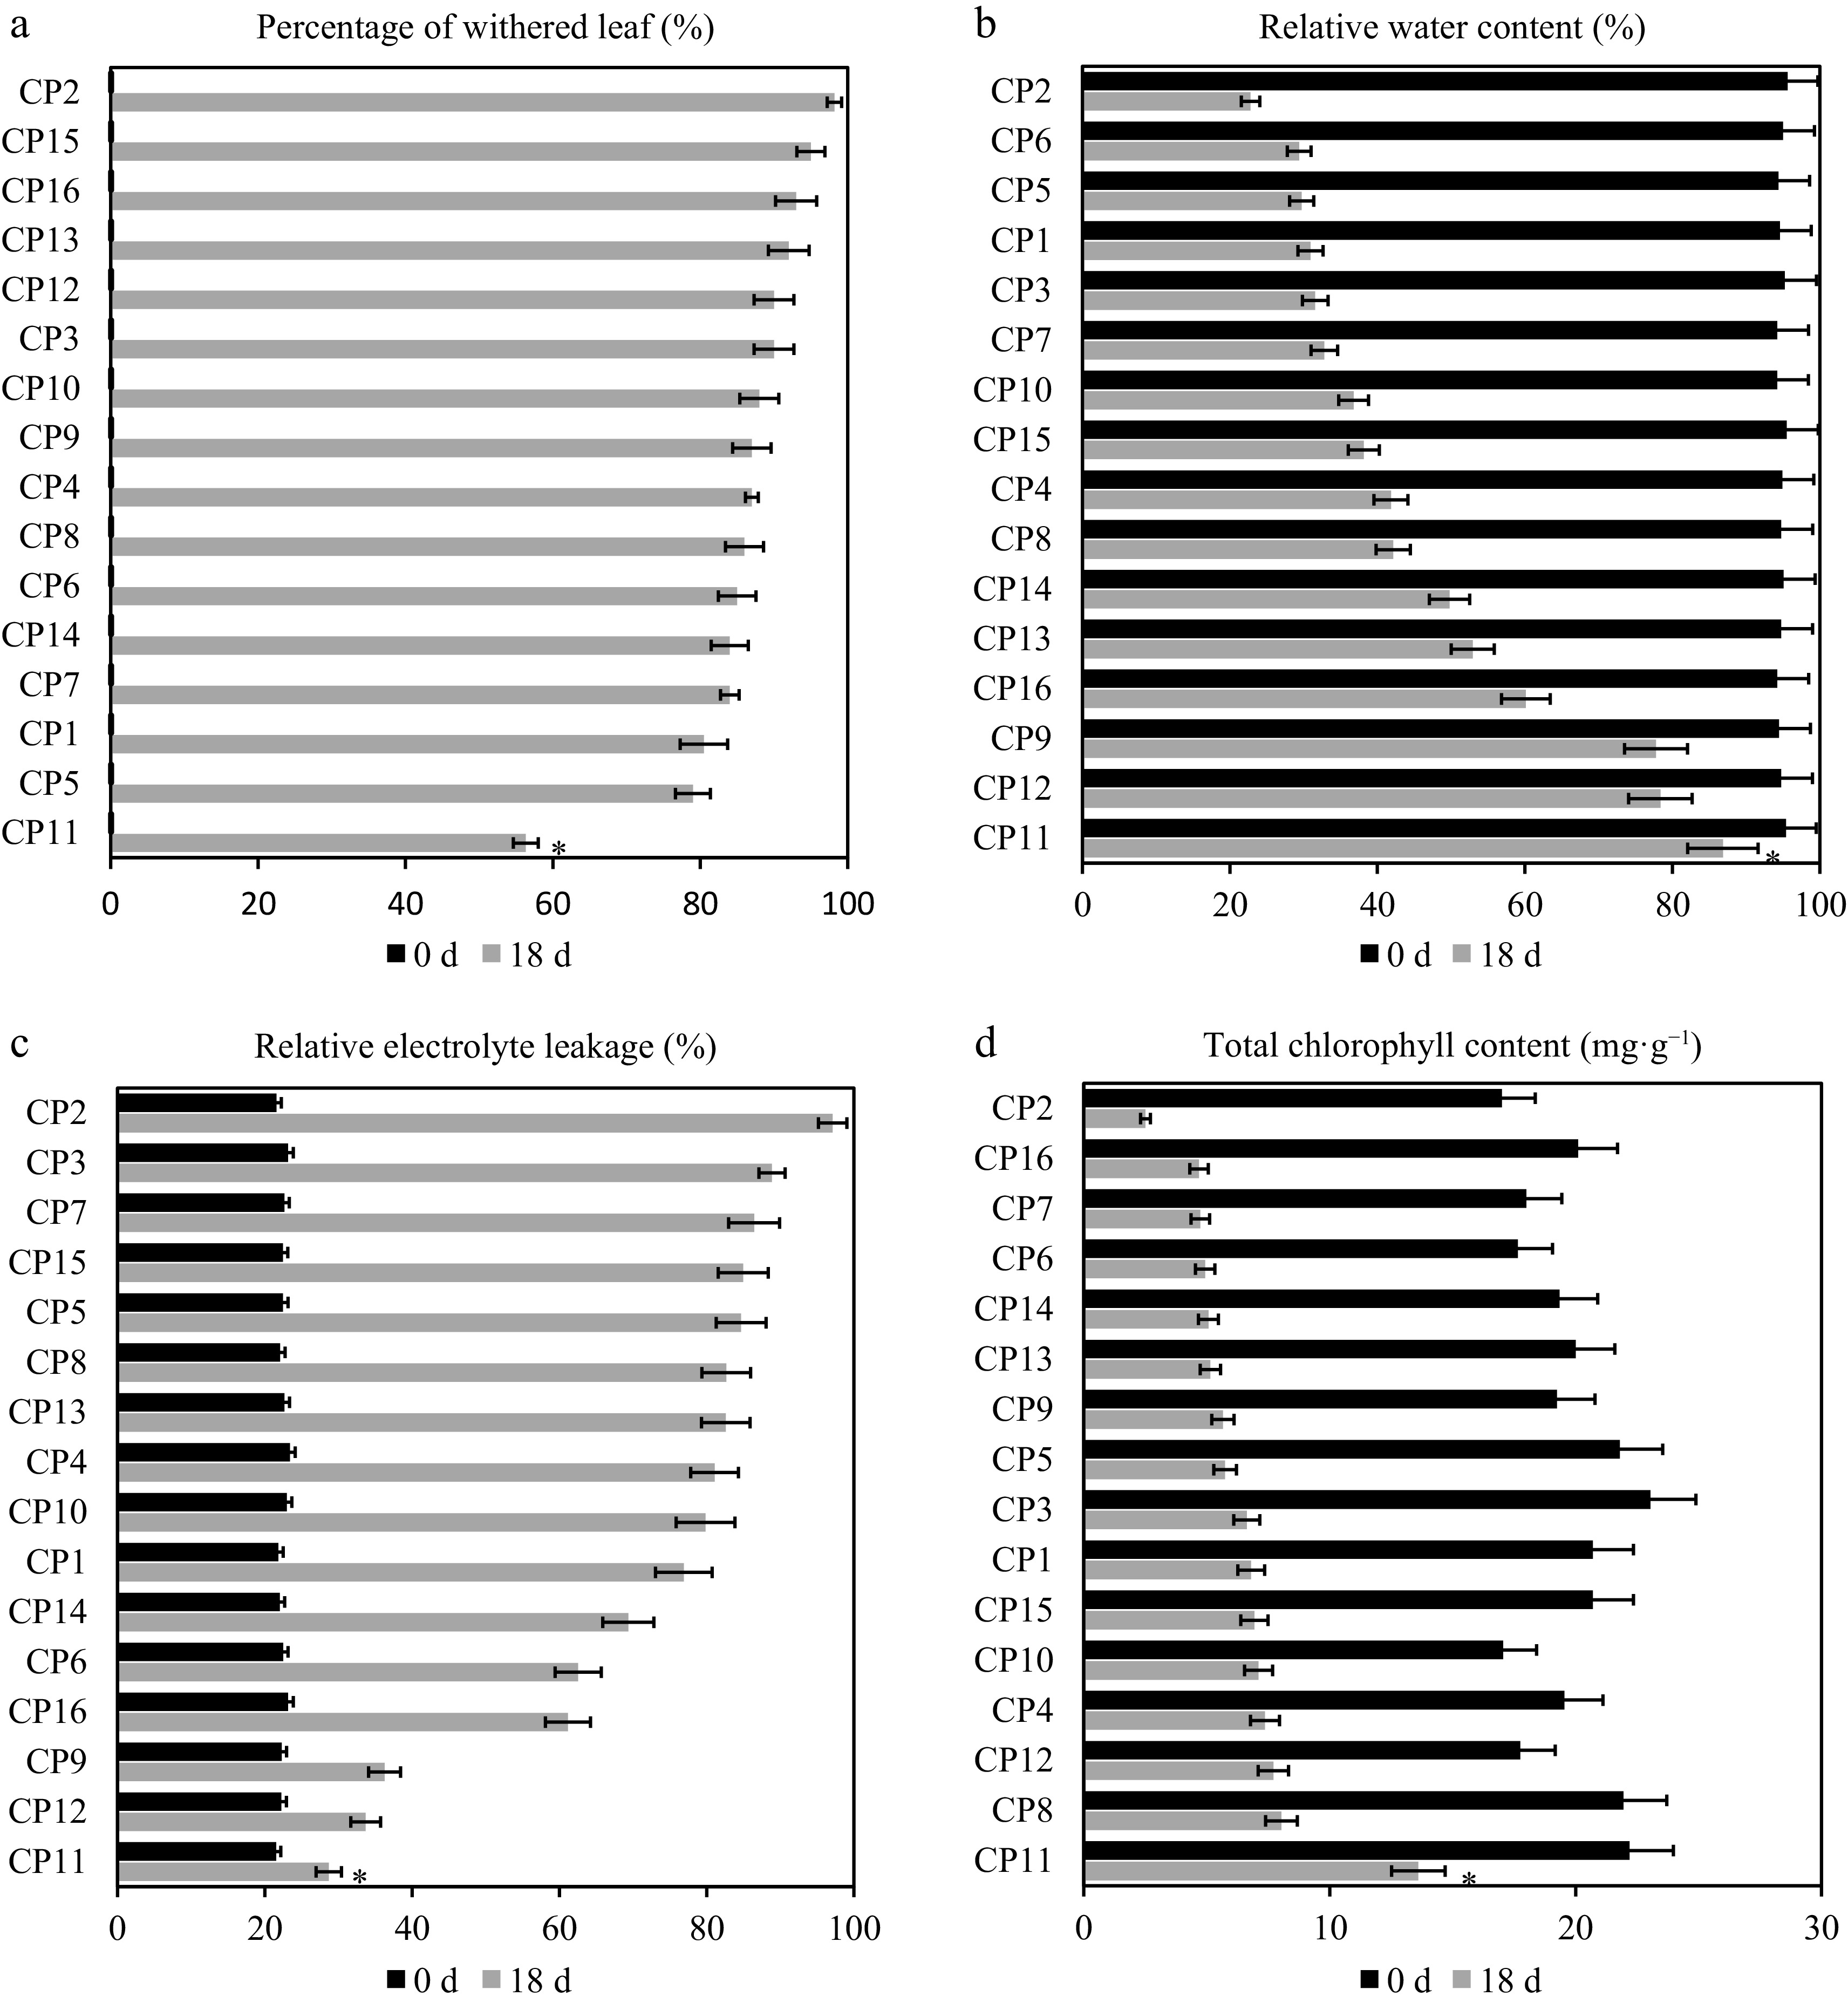
Figure 1.
Physiological responses of 16 centipedegrass genotypes to the 99% shade treatment after 18 d. Comparison of physiological responses across 16 centipedegrass genotypes (CP1–CP16) under the control (full light, 0 d) and 99% shade (18 d) conditions. (a) Leaf wilting rate (%), (b) relative water content (RWC, %), (c) relative conductivity (RC, %), (d) total chlorophyll content (mg·g−1). The shade-tolerant genotype CP11 exhibits the lowest wilting rate (56.33%), the highest RWC (86.85%), the lowest RC (28.68%), and the highest chlorophyll retention (13.61 mg·g−1 total), whereas the shade-sensitive CP2 shows the highest wilting rate (98.2%), the lowest RWC (22.8%), the highest RC (97.12%), and the lowest chlorophyll content (2.51 mg·g−1 total). Data represent the means of three biological replicates. An asterisk indicates a significant difference between CP2 and CP11 on Day 18 (p < 0.05).
Leaf RWC in the control group remained stable, ranging from 94.21% (CP10) to 95.63% (CP2). Under shading, RWC declined over time. By Day 18, CP11 maintained an RWC of 86.85% (a 8.97% drop from 95.41%), whereas CP2 experienced the most significant decline to 22.8% (a 76.16% drop from 95.63%). Other ecotypes, such as CP12 (78.38%), CP9 (77.79%), and CP16 (60.14%), showed intermediate reductions, highlighting CP11's superior water retention under shading stress (Fig. 1b).
Relative conductivity (RC), an indicator of membrane integrity, remained low in the control group (from 21.52% for CP11 to 23.42% for CP4). In the shade-treated groups, RC increased, reflecting membrane damage. By Day 18, CP2 exhibited the largest increase to 97.12% (a 349.79% rise from 21.59%), whereas CP11 showed the smallest increase to 28.68% (a 33.27% rise from 21.52%). Ecotypes like CP12 (33.7%) and CP9 (36.26%) had moderate increases, underscoring CP11's better membrane stability under shading (Fig. 1c).
Chlorophyll content, including total chlorophyll, chlorophyll a, and chlorophyll b, was stable in the control group but showed dynamic changes under shading. Total chlorophyll in the control ranged from 11 mg·g−1 (CP10) to 16.2 mg·g−1 (CP3). By Day 18, CP2 experienced the largest reduction to 1.64 mg·g−1 (an 85.23% drop from 11.1 mg·g−1), whereas CP11 showed a moderate decline to 8.81 mg·g−1 (a 44.94% drop from 16 mg·g−1) (Fig. 1d). Similarly, chlorophyll a content dropped significantly in CP2 to 0.87 mg·g−1 (an 85.25% reduction from 5.9 mg·g−1), compared with CP11's milder decrease to 4.8 mg·g−1 (a 22.58% reduction from 6.2 mg·g−1) (Supplementary Fig. S1a). Chlorophyll b followed a similar trend, with CP2 declining to 2.51 mg·g−1 (an 85.24% drop from 17 mg·g−1) and CP11 to 13.61 mg·g−1 (a 38.69% drop from 22.2 mg·g−1) (Supplementary Fig. S1b). These results indicate that CP11 better preserves chlorophyll levels and photosynthetic capacity under prolonged shading, whereas CP2 exhibits rapid chlorophyll loss, signaling weaker adaptation to shading stress.
Among the 16 centipedegrass ecotypes, CP2 was the most sensitive and CP11 the most tolerant to shading. Their contrasting phenotypes under 99% shading over 18 d are illustrated in Fig. 2. By Day 6, CP11 leaves showed slight yellowing, whereas CP2 leaves had already yellowed and curled. By Day 12, CP11 exhibited further yellowing with some leaf shedding, whereas CP2 showed extensive yellowing and pronounced wilting. By Day 18, CP11 leaves remained yellowed but partially upright, whereas CP2 leaves were fully wilted.
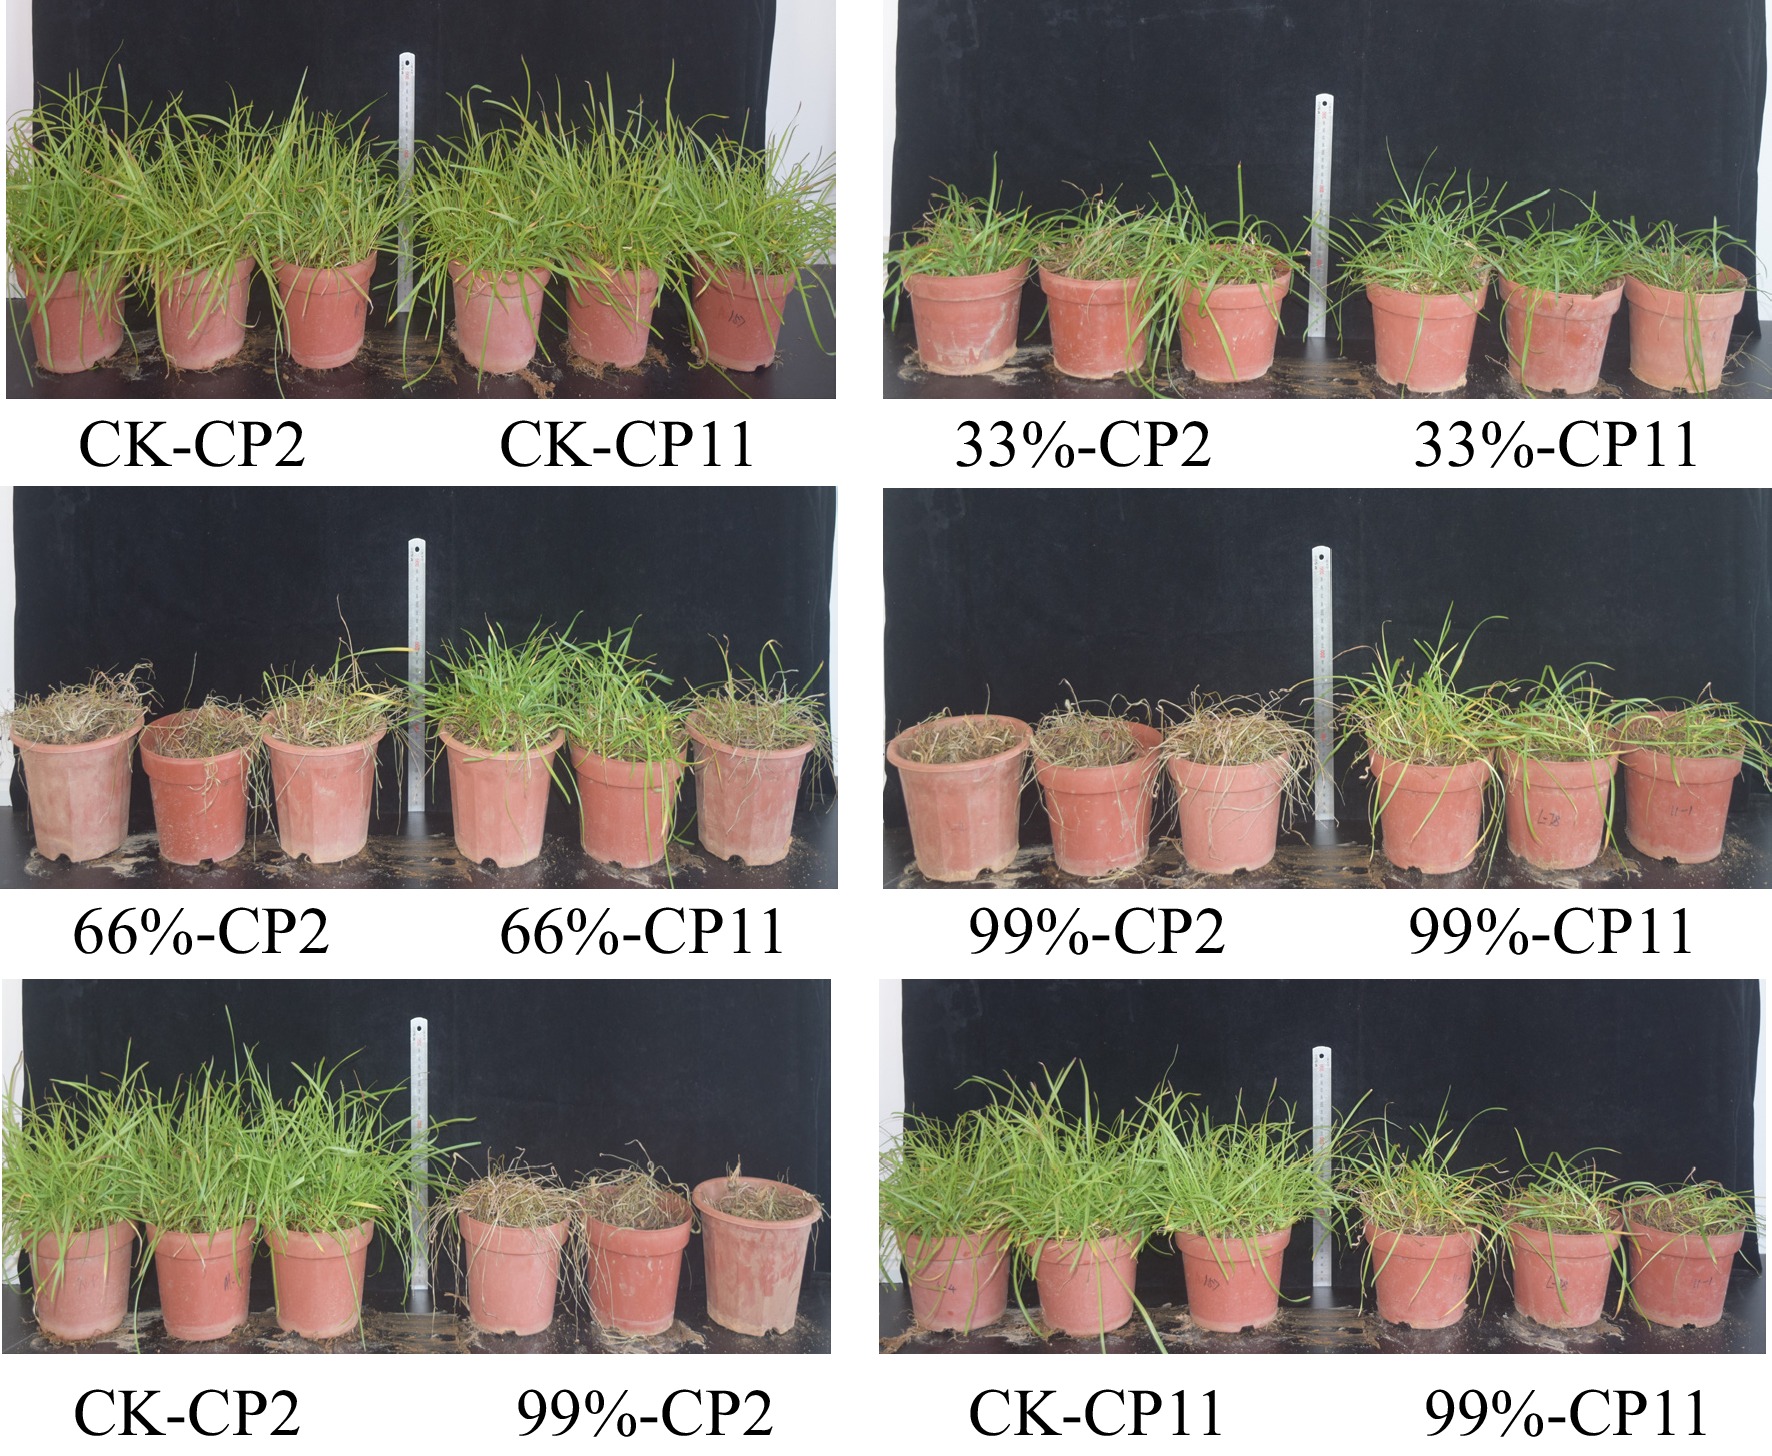
Figure 2.
Effects of 18-d shading treatments on the phenotypes of two centipedegrass genotypes under different shading levels. Treatments include the control (CK, full light), 33% shade, 66% shade, and 99% shade. CP11 exhibits minimal leaf yellowing and upright growth, whereas CP2 shows extensive yellowing, curling, and wilting, particularly under 99% shade.
Leaf physiological responses of CP2 and CP11 to shading stress
-
To assess physiological adaptations to severe shading, we measured key stress-related indicators in the leaves of CP2 and CP11 under 0%, 33%, 66%, and 99% shading conditions over an 18-d period. Leaf MDA content in CP11 increased modestly under shading, reaching 11 μmol·g−1 under 99% shading on Day 18 compared with 7.8–8.2 μmol·g−1 on Day 0 (Fig. 3a). CP2 exhibited a more severe increase, with MDA levels rising from 7.8–8.1 μmol·g−1 on Day 0 to 22 μmol·g−1 under 99% shading on Day 18, reflecting greater oxidative stress in leaves under intense shading. Leaf SOD activity in CP11 was stable on Days 0 and 6 (570–620 unit mg−1 proline) but declined significantly by Day 18 under 99% shading (200 unit mg−1 proline) (Fig. 3b). CP2 had higher baseline SOD activity (1,010–1,080 unit mg−1 proline on Day 0) but experienced a drastic reduction under 99% shading by Day 18 (30 unit mg−1 proline), with moderate declines under 66% shading (610 unit mg−1 proline). The control treatments maintained higher SOD activity in both genotypes.
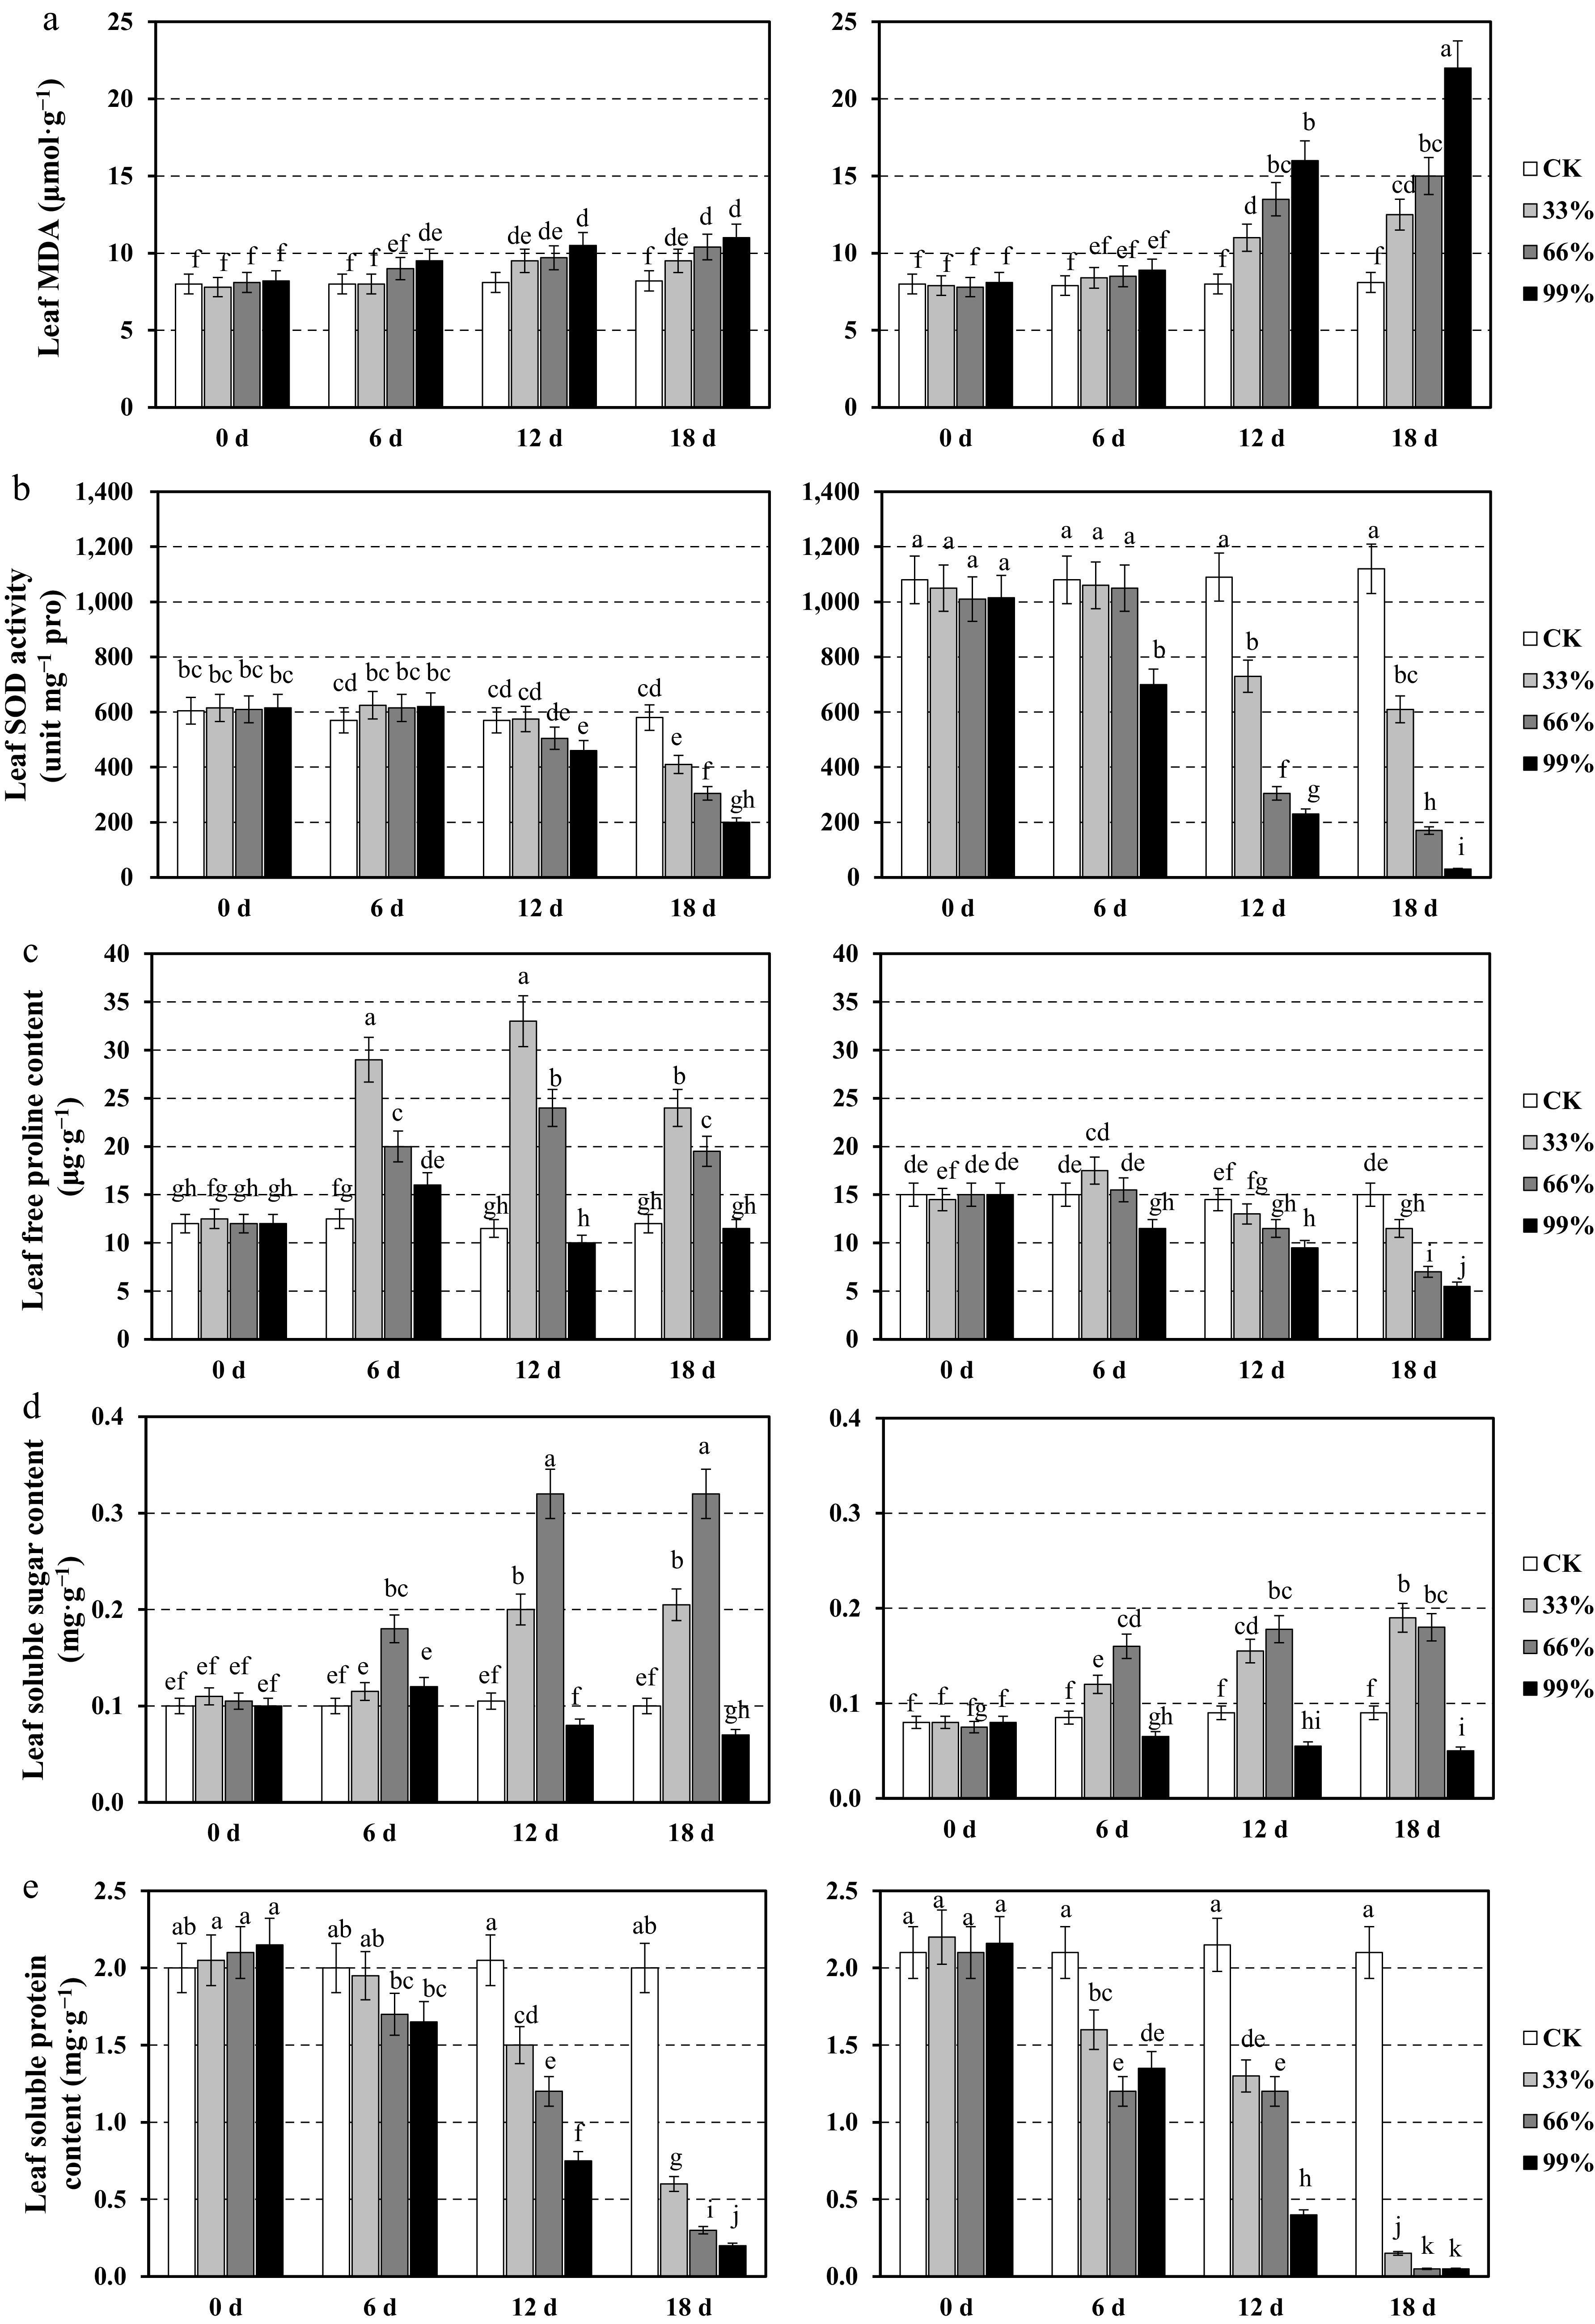
Figure 3.
Physiological responses of the leaves in two centipedegrass genotypes, CP11 (left panels) and CP2 (right panels), under different shading levels (CK [control], 33%, 66%, and 99%) over a time course of 0, 6, 12, and 18 d. Data are shown for (a) malondialdehyde (MDA) content (μmol·g−1), (b) superoxide dismutase (SOD) activity (unit mg−1 proline), (c) free proline content (μg·g−1), (d) soluble sugar content (mg·g−1), and (e) soluble protein content (mg·g−1). Values represent the means ± standard error (SE) (n = 3). Different letters indicate statistically significant differences (p < 0.05) according to analysis of variance (ANOVA) followed by post hoc tests.
Leaf proline content in CP11 peaked on Day 12under 66% shading (33 µg·g−1) but declined by Day 18, whereas CP2 showed a consistent decrease under 99% shading (5.5 µg·g−1 on Day 18) (Fig. 3c). Leaf soluble sugars in CP11 increased under 66% shading by Day 12 (0.32 mg·g−1) but dropped under 99% shading by Day 18 (0.07 mg·g−1). CP2 exhibited a similar pattern, with a peak under 66% shading (0.19 mg·g−1 at 18 d) and a decline under 99% shading (0.05 mg·g−1) (Fig. 3d). Leaf soluble protein in CP11 decreased significantly under 99% shading by Day 18 (0.2 mg·g−1) compared with Day 0 (2–2.15 mg·g−1). CP2 showed a similar trend, with levels dropping to 0.05 mg·g−1 under 99% shading by Day 18 (Fig. 3e).
Physiological responses in the roots of CP2 and CP11 to shading stress
-
In addition, we assessed key stress-related physiological markers in the roots of CP2 and CP11 under 0%, 33%, 66%, and 99% shading conditions over an 18-d period to gain comprehensive insights into their adaptive responses to severe shading stress.
In CP11, root activity remained relatively stable across all shading treatments and time points, with mean values ranging from 0.31 to 0.545 g·g−1·h−1. Under 99% shading, a slight decline was observed by Day 12 (0.31 g·g−1·h−1) compared with Day 0 (0.475 g·g−1·h−1). In contrast, CP2 exhibited a more pronounced decline in root activity under higher shading intensities (66% and 99%) over time, dropping from 0.45 g·g−1·h−1 on Day 0 to 0.15 g·g−1·h−1 on Day 18 under 99% shading. The control and 33% shading treatments showed minimal changes in both genotypes (Fig. 4a).
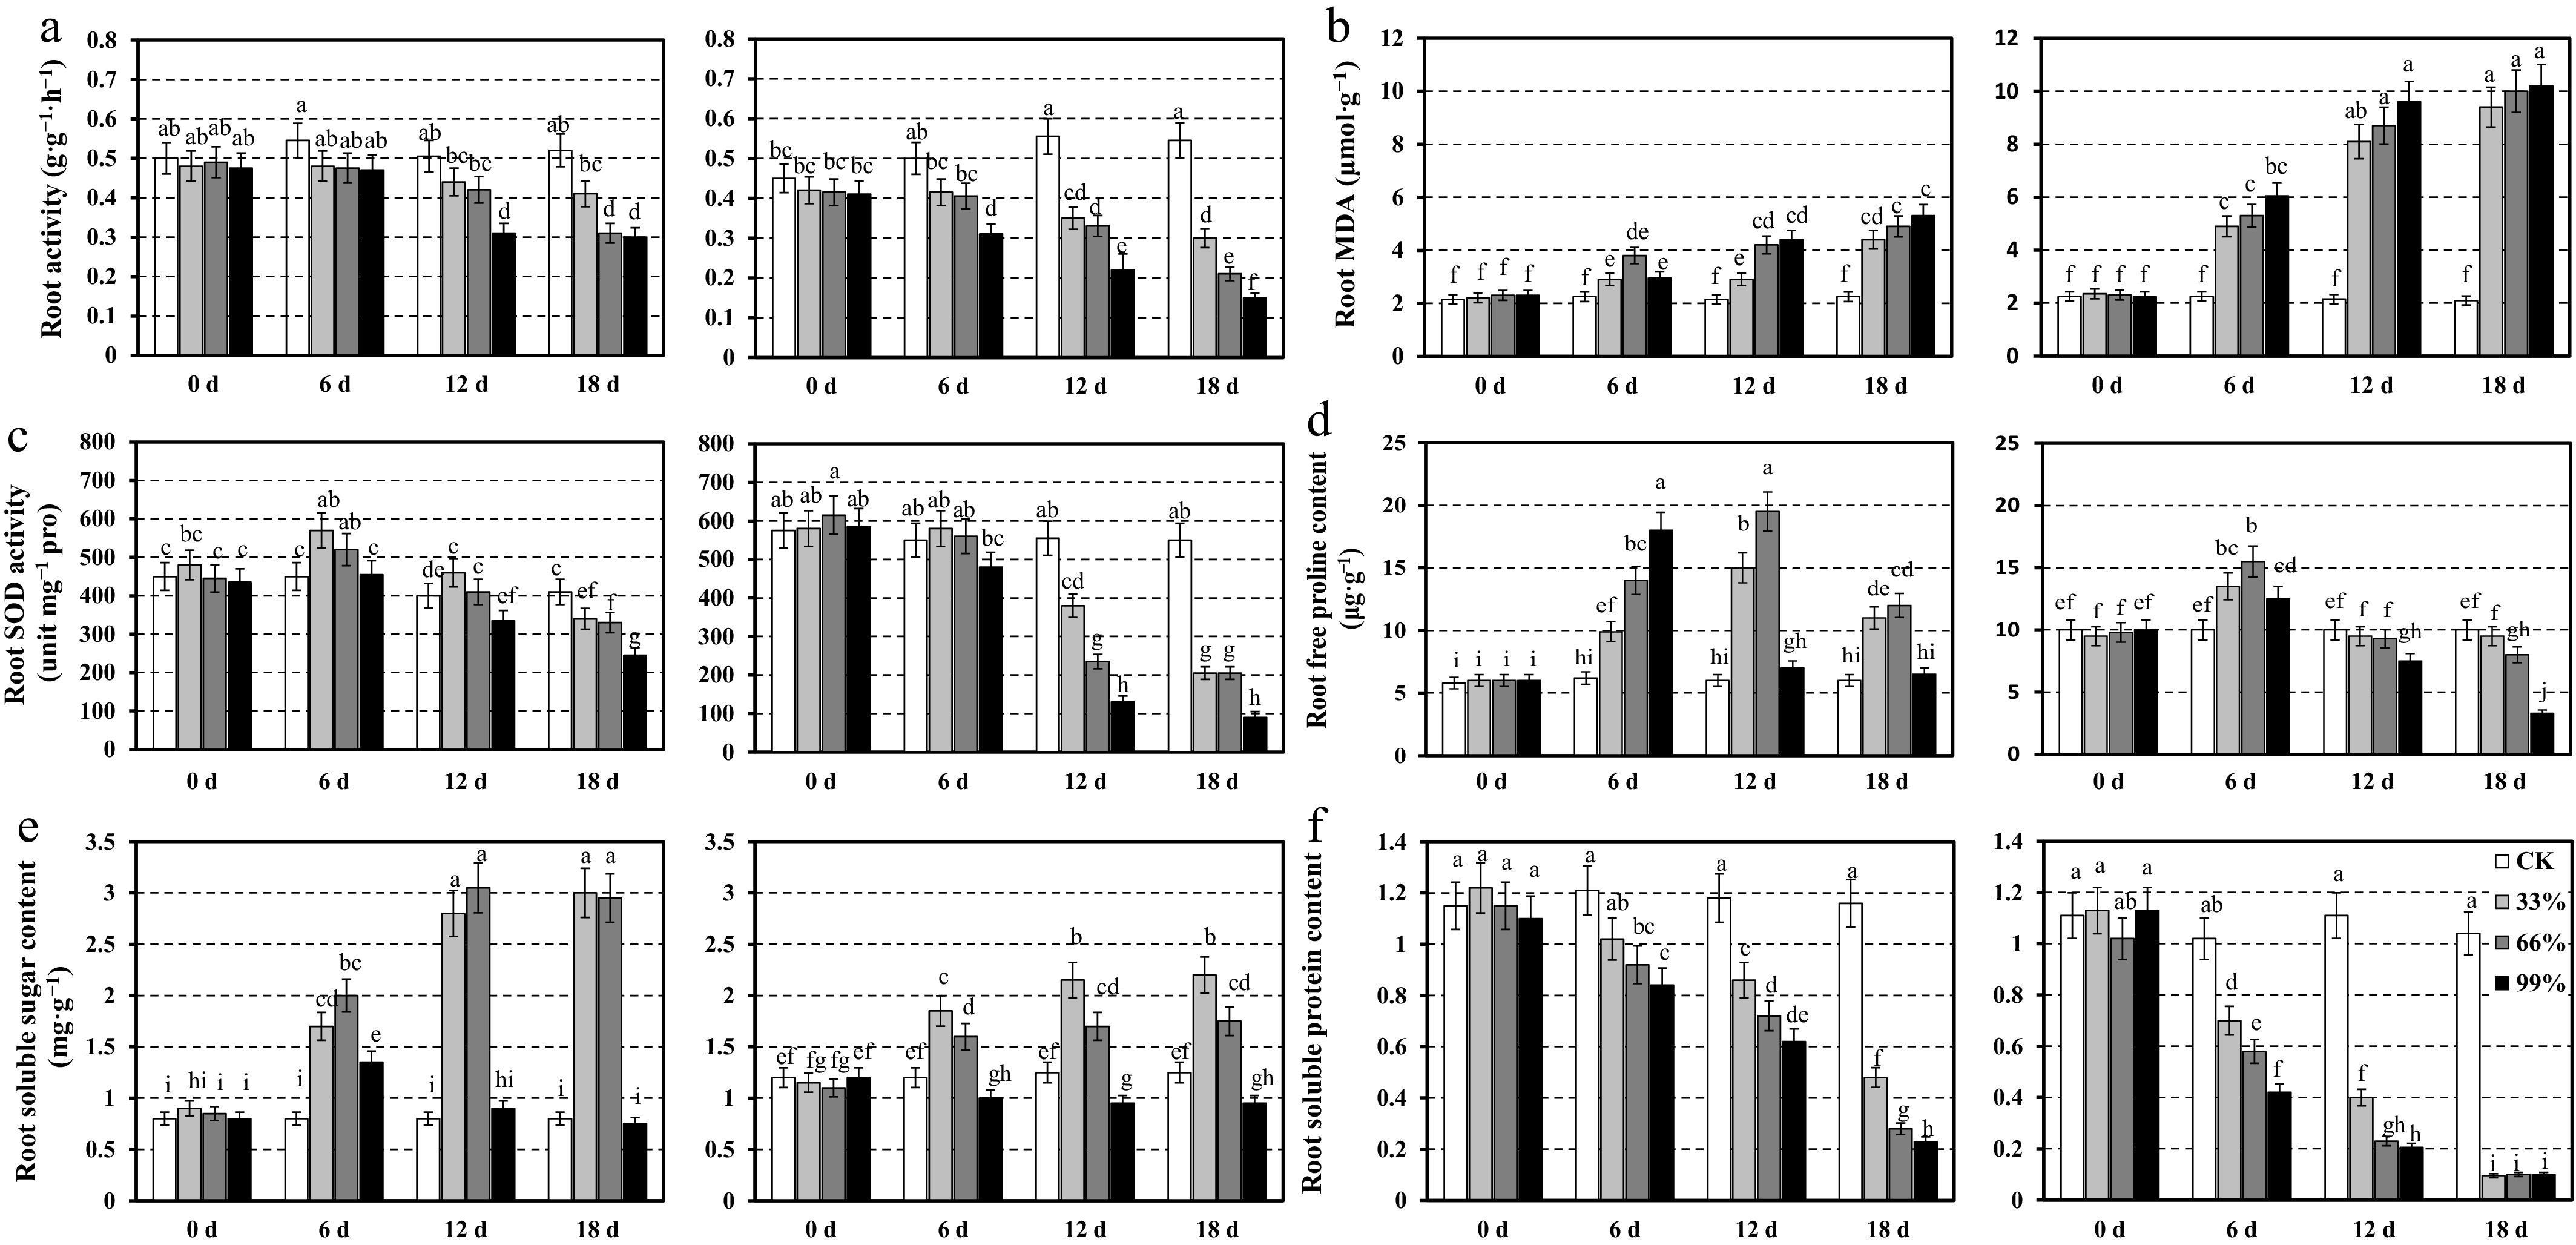
Figure 4.
Root physiological responses of two centipedegrass genotypes, CP11 (left panels) and CP2 (right panels), under different shading levels (CK [control], 33%, 66%, and 99%) over a time course of 0, 6, 12, and 18 d. Data are shown for (a) root activity (g·g−1·h−1), (b) MDA content (μmol·g−1), (c) SOD activity (unit mg−1 proline), (d) free proline content (μg·g−1), (e) soluble sugar content (mg·g−1), and (f) soluble protein content (mg·g−1). Values represent the means ± SE (n = 3). Different letters indicate statistically significant differences (p < 0.05) according to ANOVA followed by post hoc tests.
MDA content, an indicator of oxidative stress, increased in CP11 roots under 66% and 99% shading, peaking on Day 18 (5.3 μmol·g−1 under 99% shading) compared with Day 0 (2.15–2.3 μmol·g−1). CP2 showed a more dramatic increase, with MDA levels rising from 2.25 μmol·g−1 on Day 0 to 10.2 μmol·g−1 on Day 18 under 99% shading, indicating greater susceptibility to shading-induced oxidative damage (Fig. 4b). SOD activity in CP11 roots peaked on Day 6 under 66% shading (570 unit mg−1 proline) but declined by Day 18 across all treatments, particularly under 99% shading (245 unit mg−1 proline). CP2 displayed higher baseline SOD activity on Day 0 (575–615 unit mg−1 proline) but experienced a sharp decline under 66% and 99% shading by Day 12 (235 and 130 unit mg−1 proline, respectively), with further reductions by Day 18 (90 unit mg−1 proline under 99% shading). The control treatments maintained higher SOD activity in both genotypes (Fig. 4c).
Root proline content in CP11 peaked on Day 12 under 66% shading (19.5 µg·g−1) but declined by Day 18, whereas CP2 showed a consistent decrease under 99% shading (3.3 µg·g−1 on Day 18) (Fig. 4d). Soluble sugar content in CP11 root increased under 66% shading by Day 12 (3.05 mg·g−1) but dropped under 99% shading by Day 18 (0.75 mg·g−1). CP2 exhibited a moderate increase in root soluble sugars under 66% shading (2.2 mg·g−1 on Day 18) but remained stable under the other treatments (Fig. 4e). Root soluble protein in CP11 decreased under 66% and 99% shading by Day 18 (0.23 mg·g−1 under 99% shading) compared with Day 0 (1.1–1.22 mg·g−1). CP2 followed a similar trend, with a sharper decline to 0.1 mg·g−1 under 99% shading by Day 18 (Fig. 4f).
Principal component analysis of physiological traits under shading stress
-
To evaluate the overall physiological responses of CP11 and CP2 to shading treatments across time, we performed principal component analysis (PCA) using 11 physiological traits measured at 0, 6, 12, and 18 d under four shading levels (0%, 33%, 66%, and 99%).
For CP11, the first two principal components (PC1 and PC2) explained 61.8% and 26.3% of the total variance, respectively (Fig. 5a). Samples were separated primarily along PC1 according to shading intensity, whereas PC2 further separated samples by duration of treatment. Root and leaf MDA contributed most positively to PC1, whereas root and leaf soluble protein contributed most negatively (Fig. 5c), indicating that oxidative damage and protein metabolism are the primary axes of variation in CP11. The PCA biplot (Fig. 5e) also revealed that osmolyte-related traits such as proline and soluble sugars clustered together, whereas SOD activity and MDA content were oriented in different directions, reflecting distinct physiological strategies under shading stress.
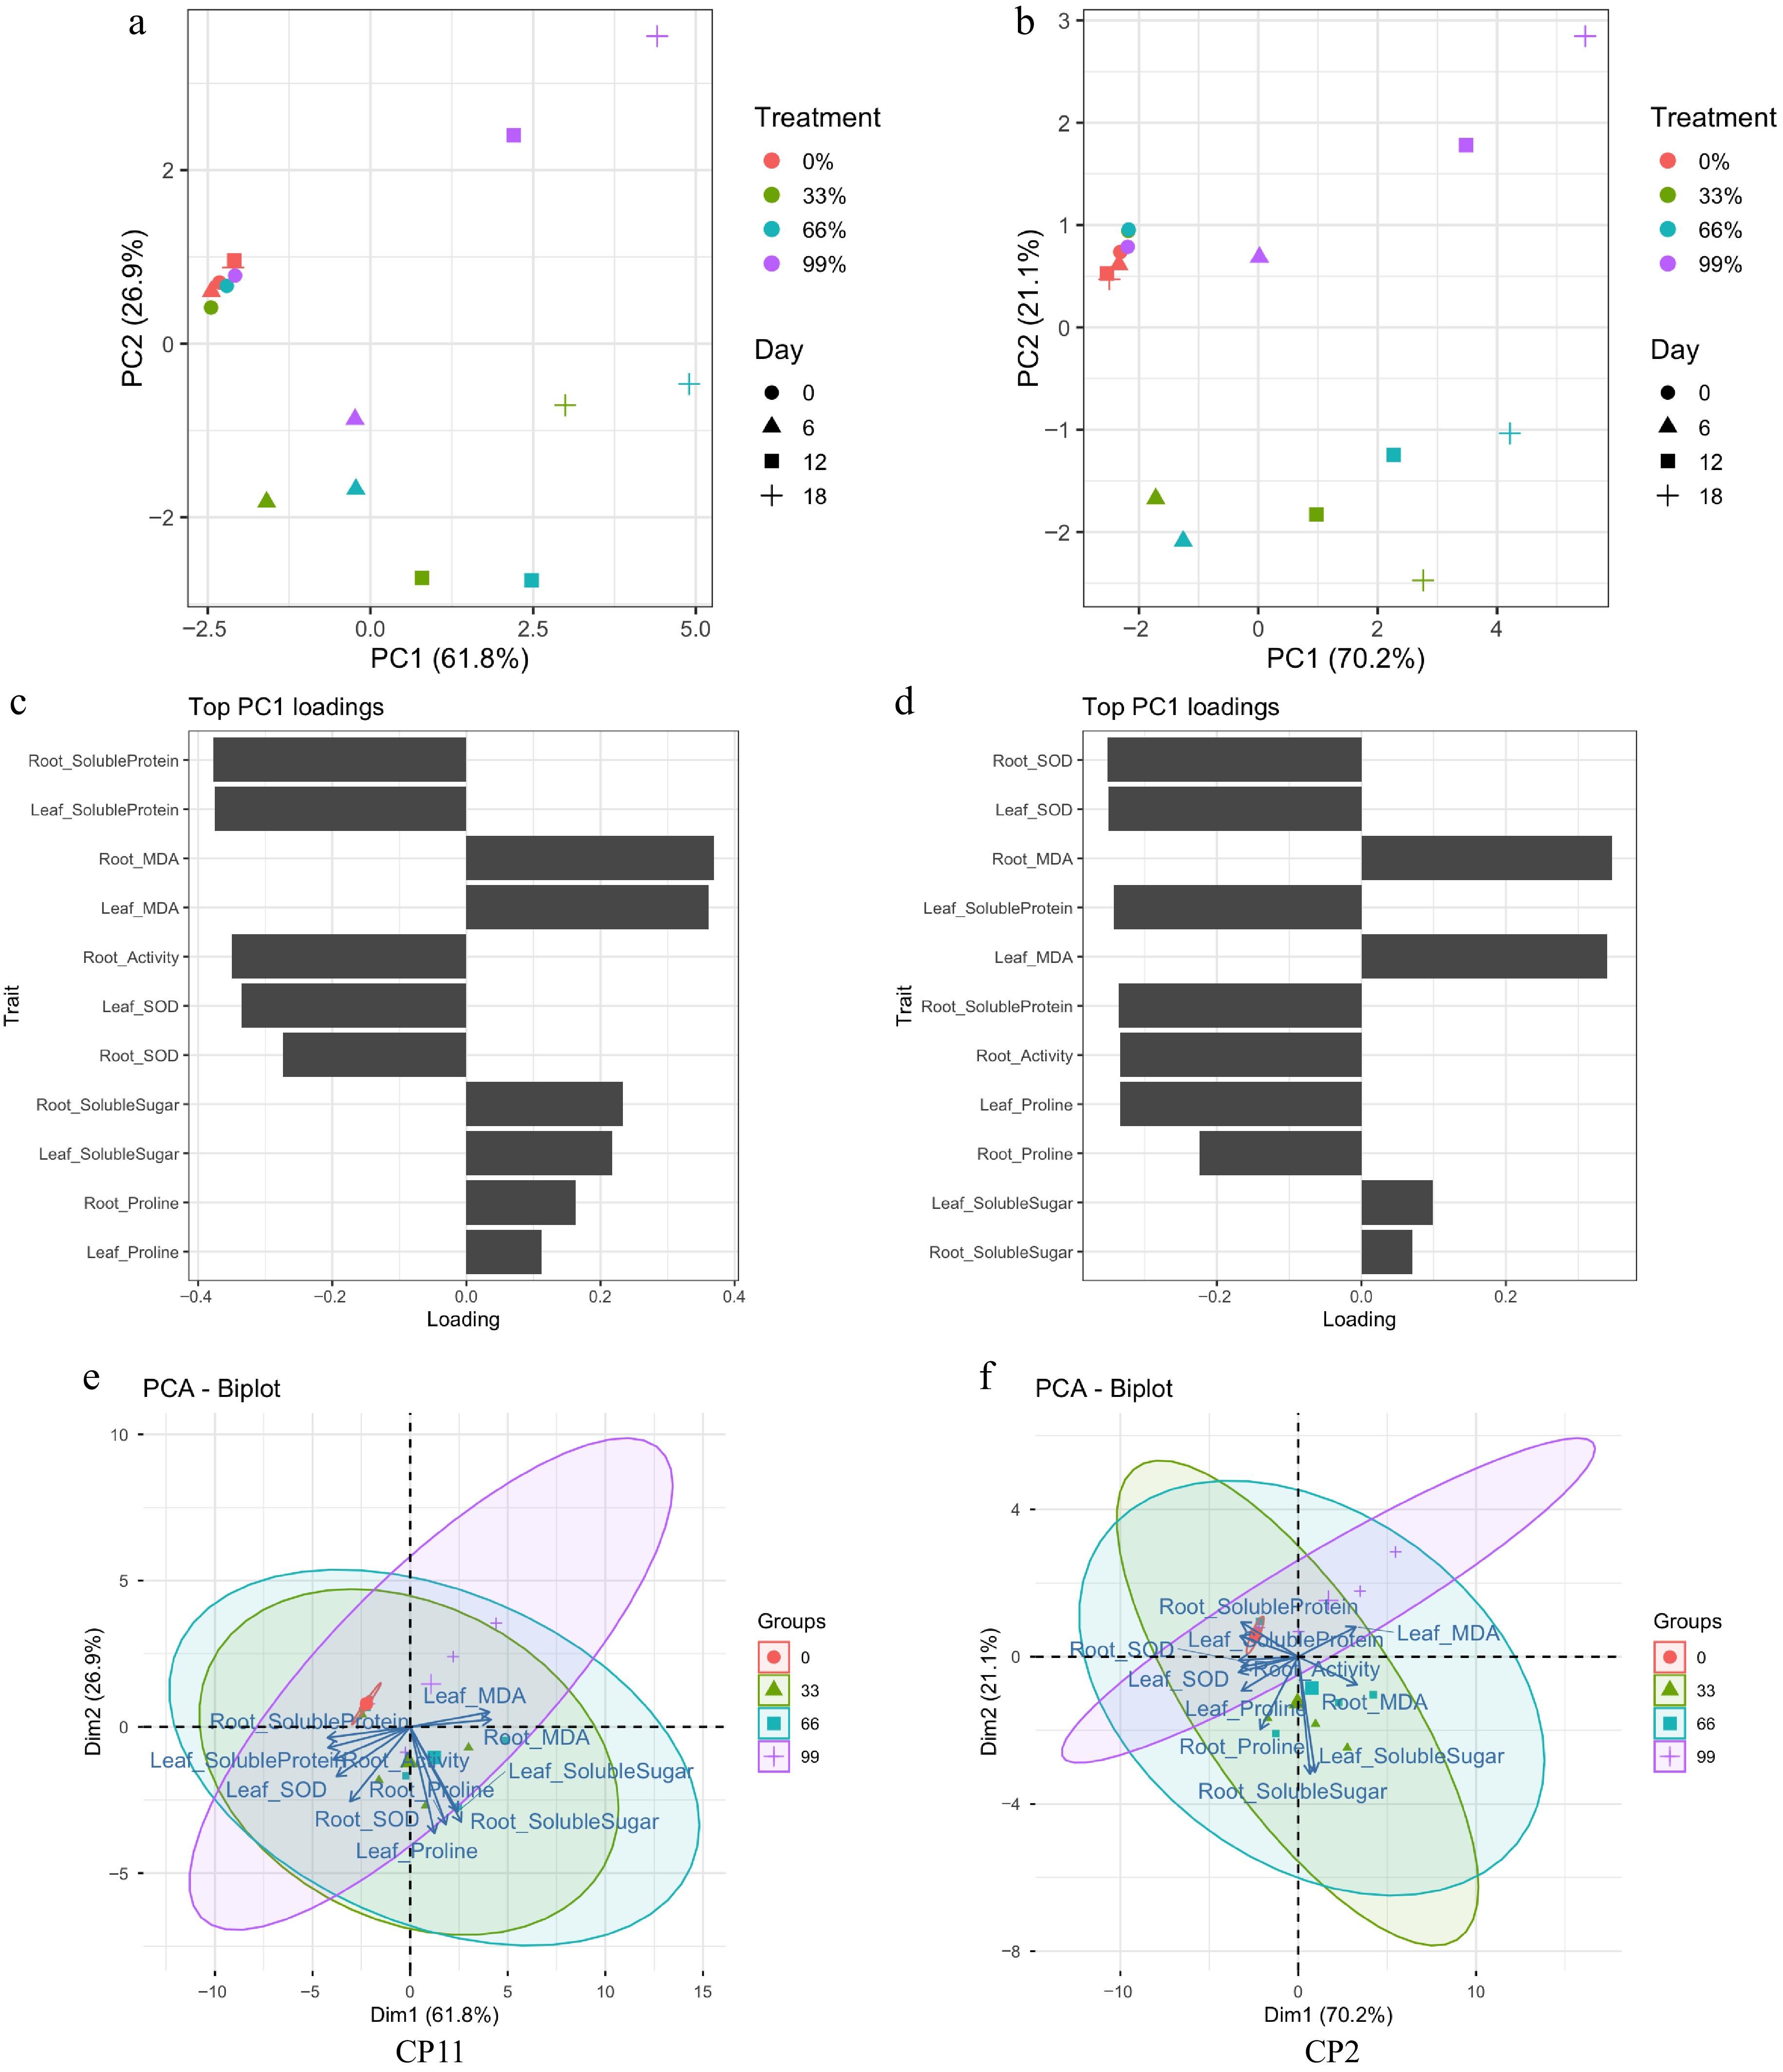
Figure 5.
Principal component analysis (PCA) of physiological traits under shading treatments in CP11 and CP2 genotypes. (a, b) PCA score plots showing the separation of treatments and time points. Treatments (0%, 33%, 66%, and 99% shading) are indicated by colors, wherease the sampling days (0, 6, 12, and 18) are indicated by different shapes. (a) CP11; (b) CP2. (c, d) Contribution of the top 11 traits to PC1. Bars represent loading values, indicating the relative importance of each physiological trait to the variation explained by PC1. (c) CP11; (d) CP2. (e, f) PCA biplots visualizing the relationships among treatments, days, and traits. Arrows represent trait loadings, and ellipses indicate 95% confidence intervals around the treatment groups. (e) CP11; (f) CP2.
For CP2, PC1 explained 70.2% and PC2 21.1% of the variance (Fig. 5b). Similar to CP11, the treatments were separated along PC1, with stronger separation of shading levels. Traits with the strongest positive loadings on PC1 were root and leaf MDA, whereas root and leaf SOD showed the most negative loadings (Fig. 5d), underscoring the central role of antioxidant capacity and oxidative stress regulation in CP2. In the biplot (Fig. 5f), root and leaf traits appeared more loosely clustered compared with CP11, suggesting less coordinated stress responses across tissues.
Overall, both genotypes showed the clear differentiation of treatments and time courses in the PCA, but the major contributing traits differed. CP11 was mainly driven by protein metabolism and osmolyte accumulation, whereas CP2 was more strongly characterized by antioxidant activity and oxidative stress regulation. These results suggest distinct physiological strategies underlying shading tolerance in the two genotypes.
Transcriptome changes in the roots and leaves of two centipedegrass germplasms under 99% shading conditions
-
To investigate the molecular mechanisms underlying the differential responses of two centipedegrass germplasms (CP2 and CP11) to shade stress, we conducted transcriptome sequencing on root and leaf samples collected from both germplasms after exposure to 99% shading for 0 (control), 6, and 12 d. After data filtering and quality control, a total of 1.71 million clean reads were obtained from 36 samples. The Q20 and Q30 scores of the clean reads exceeded 97% and 93%, respectively, indicating high-quality sequencing data suitable for downstream analysis (Supplementary Table S2). Assembly of the clean reads yielded 31,428 genes across the two germplasms.
We then identified DEGs in response to shading by comparing expression levels on Day 6 and Day 12 with those of the control (Day 0). These DEGs reflect transcriptomic changes in roots and leaves across time points and between germplasms.
In the leaves, CP2 (L2) showed 3,014 upregulated and 3,506 downregulated genes on Day 6 (L2-6d vs L2-0d), increasing to 3,894 upregulated and 3,781 downregulated genes on Day 12 (L2-12d vs L2-0d). CP11 leaves (L11) exhibited 3,312 upregulated and 3,127 downregulated genes on Day 6 (L11-6d vs L11-0d), which increased to 3,822 upregulated and 3,346 downregulated genes on Day 12 (L11-12d vs L11-0d) (Fig. 6a).
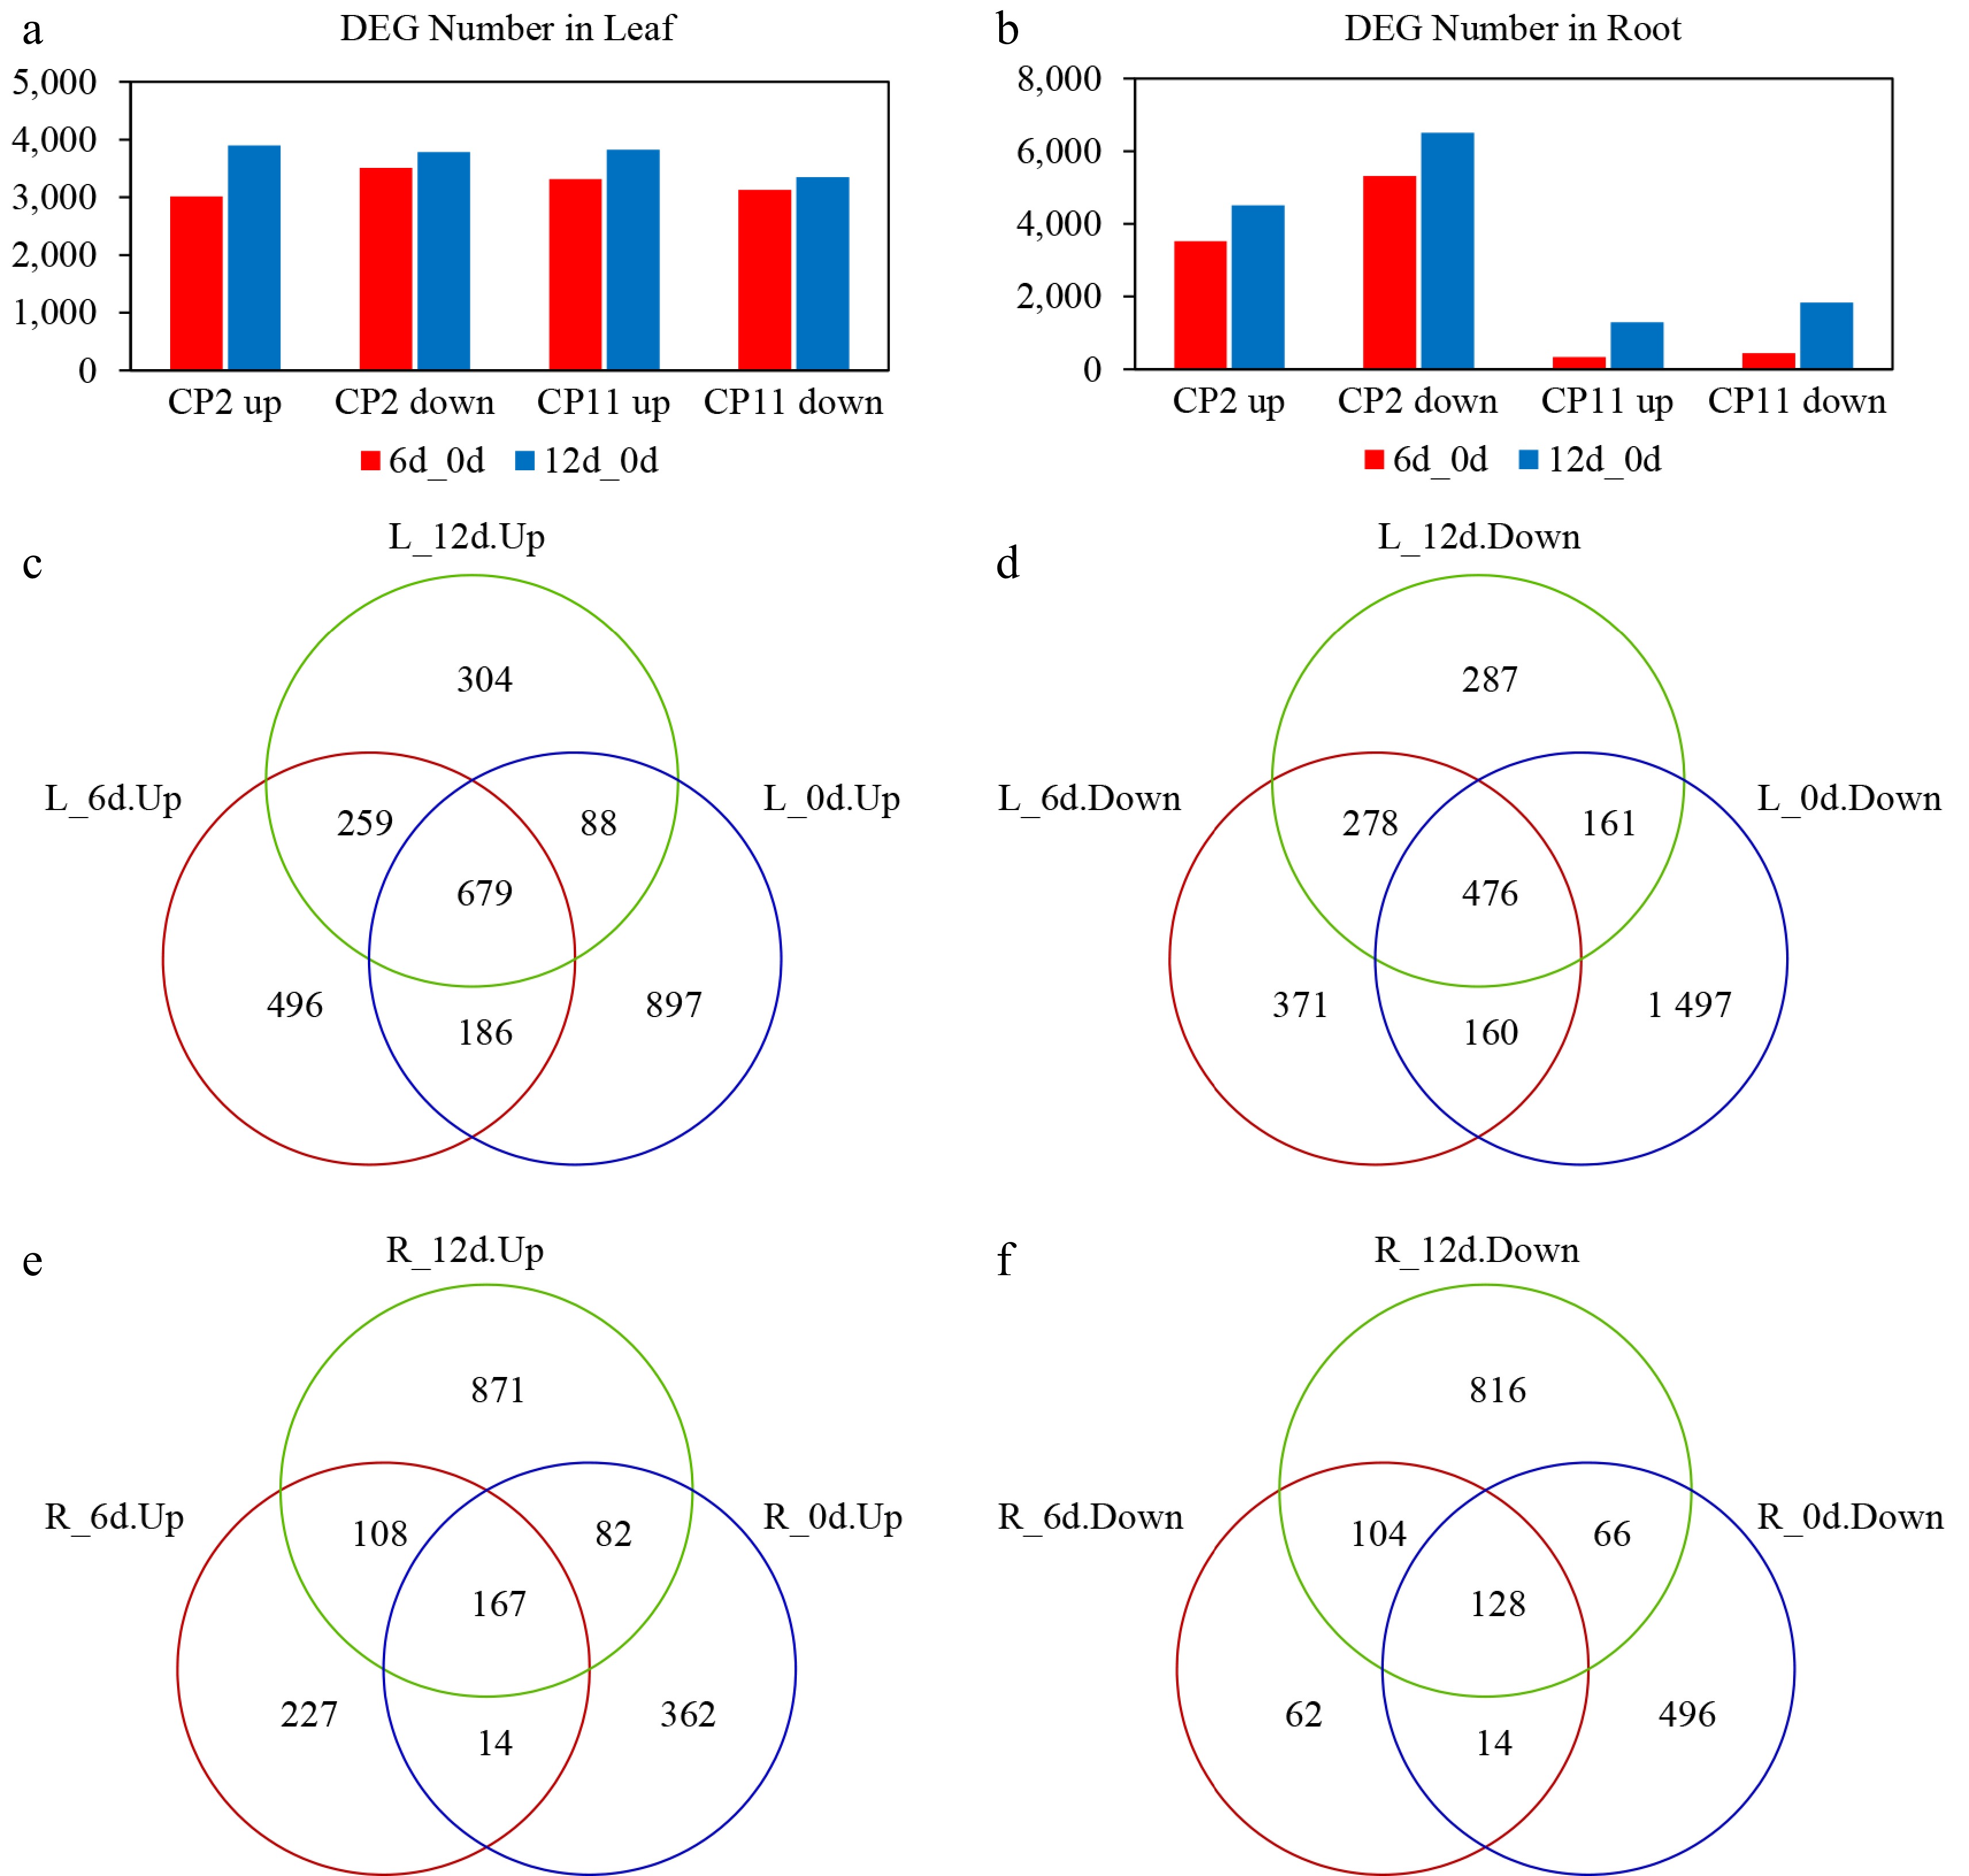
Figure 6.
Transcriptional changes in the genes of the roots and leaves of two centipedegrass genotypes, CP2 and CP11, under the 99% shading treatment. (a, b) Number of DEGs in the leaves (a) and roots (b) identified from pairwise comparisons: CP2 on Day 6 vs Day 0, CP2 on Day 12 vs Day 0, CP11 on Day 6 vs Day 0, and CP11 on Day 12 vs Day 0. (c–f) Identification of consistently up- and downregulated DEGs between CP11 and CP2 genotypes in the roots and leaves under 99% shading stress. Up- and down-regulated DEGs were analyzed separately. (c) Consistently upregulated DEGs in the leaves were identified by overlapping genes upregulated in the comparisons of CP11 on Day 6 vs CP2 on Day 6 and CP11 on Day 12 vs CP2 on Day 12, excluding those already upregulated on Day 0 (CP11 vs CP2). (d) Downregulated DEGs in the leaves were identified by intersecting genes downregulated on both Day 6 and Day 12, after removing those already downregulated on Day 0. (e) and (f) represent the consistently (e) upregulated and (f) downregulated DEGs in the roots, identified using the same strategy based on pairwise comparisons of CP11 and CP2 transcriptomes under shading conditions.
In the roots, CP2 (R2) had a pronounced transcriptomic response, with 3,526 upregulated and 5,322 downregulated genes on Day 6 (R2-6d vs R2-0d), and 4,515 upregulated and 6,510 downregulated genes on Day 12 (R2-12d vs R2-0d). In contrast, CP11 roots (R11) exhibited a much smaller response: 334 upregulated and 442 downregulated genes on Day 6 (R11-6d vs R11-0d), increasing to 1,295 upregulated and 1,834 downregulated genes on Day 12 (R11-12d vs R11-0d) (Fig. 6b).
These results suggest that shading stress has a more substantial impact on the root transcriptome of CP2 than that of CP11, indicating that root-specific responses may contribute to the differential shade adaptability between the two centipedegrass germplasms.
Identification of consistently regulated DEGs across 6- and 12-day shade treatments reveals candidate genes for shade adaptability in CP11
-
To identify gene models in CP11 that may contribute to enhanced shade adaptability compared with CP2, we conducted further transcriptome analysis. Specifically, we focused on DEGs in the roots and leaves that are consistently altered in both the R11-6d vs R2-6d and R11-12d vs R2-12d comparisons but were not present in the baseline comparison (R11-0d vs R2-0d) as well as in the L11-6d vs L2-6d and L11-12d vs L2-12d comparison, but not the L11-0d vs L2-0d comparison.
In the leaf system, 259 upregulated and 278 downregulated DEGs in CP11 showed consistent changes in expression at both time points relative to CP2 (Fig. 6c, d and Supplementary Tables S3 and S4). In the root system, we identified 108 upregulated and 104 downregulated DEGs in CP11 that were shared between the 6-d and 12-d shading treatments compared with CP2 (Fig. 6e, f and Supplementary Tables S5 and S6). To validate the RNA-seq data, quantitatve real-time (qRT)-PCR was performed on 22 leaf and 14 root DEGs selected at random. The qRT-PCR results revealed a strong positive correlation between the relative expression profiles of these genes and their FPKM values (Fig. 7). These consistent expression patterns confirm the reliability and utility of the RNA-seq data for further functional analysis of candidate genes associated with shade resistance.
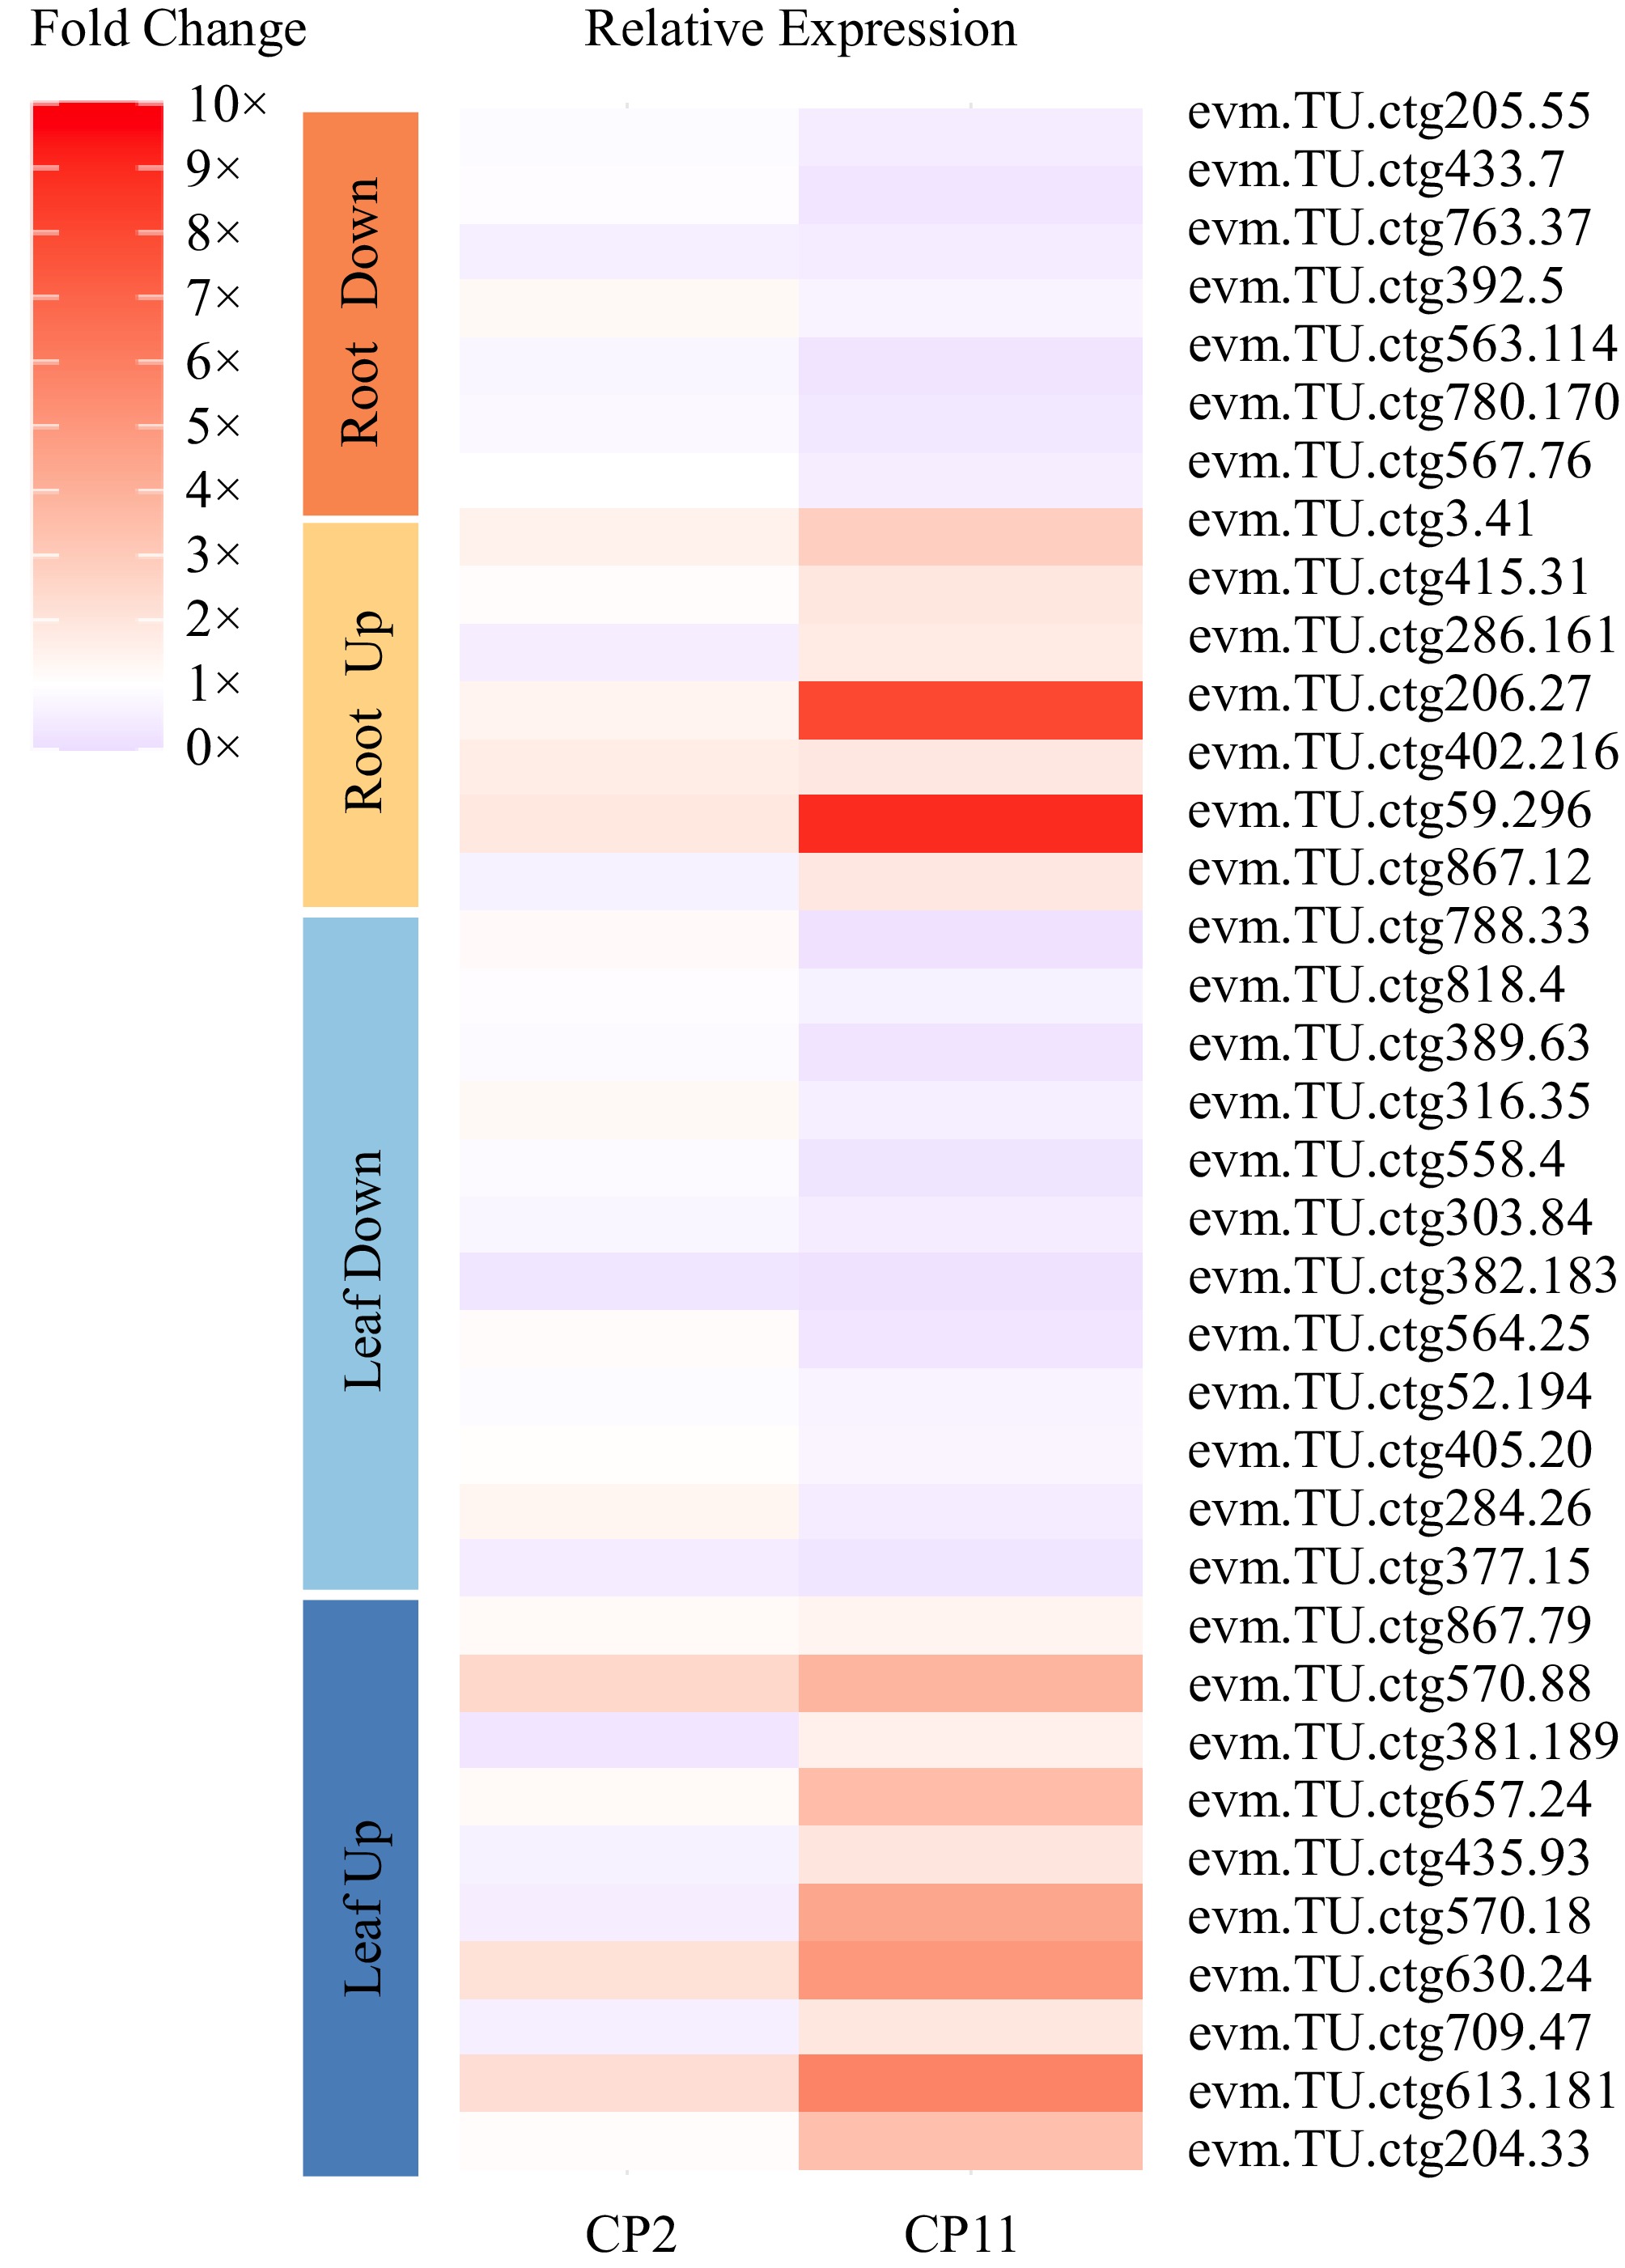
Figure 7.
Heatmap illustrating qRT-PCR validation of DEGs in leves and roots of CP2 and CP11 under 99% shading conditions. The analysis includes 10 upregulated genes in the leaves (dark blue), 10 upregulated genes in the leaves (light blue), 12 downregulated genes in the leaves (yellow), 7 upregulated genes in the roots, and 7 downregulated genes in the roots (orange), selected on the basis of consistent differential expression in the RNA-seq data for CP11 vs CP2 under 6-d and 12-d 99% shading treatments. Fold change values were calculated using the 2−ΔCᴛ method relative to the Actin gene, with three replicates.
Among the consistent leaf DEGs (Supplementary Tables S3 and S4), several are associated with chlorophyll biosynthesis and light sensing. For instance, evm.TU.ctg204.33, a homolog of psbB (CP47 chlorophyll apoprotein), was upregulated in CP11. Additionally, evm.TU.ctg570.13, a homolog of the transcription factor WRKY53, and evm.TU.ctg377.15, a homolog of ETHYLENE-INSENSITIVE 2, are both downregulated in CP11. In contrast, evm.TU.ctg570.18, a homolog of protein phosphatase 2C (PP2C), which plays a crucial role in plant stress responses, was upregulated in CP11. Among the consistent root DEGs (Supplementary Tables S5 and S6), evm.TU.ctg205.55, a homolog of the ethylene-responsive transcription factor 109 (ERF109) gene, is downregulated in CP11, whereas evm.TU.ctg3.41, a cytokinin response factor2 (CRF2) gene, is upregulated. Additionally, evm.TU.ctg867.12, a homolog of a MYC transporter gene, and evm.TU.ctg59.296 (Fig. 7), a fructose-1,6-bisphosphatase gene, are also differentially expressed in the roots of CP2 and CP11 under shading conditions. These overlapping DEGs offer valuable insights into the molecular basis of shade adaptability in CP11. In particular, pathways related to leaf light sensing, root carbohydrate metabolism (especially fructose biosynthesis), and ethylene signaling merit further investigation.
GO enrichment analysis of DEGs in CP11 vs CP2 under shading
-
To understand the functional differences between CP11 and CP2 under shading stress, we performed GO enrichment analysis of DEGs in leaf and root tissues, focusing on the three major GO domains: biological process (BP), molecular function (MF), and cellular component (CC). The results are summarized below (Fig. 8).
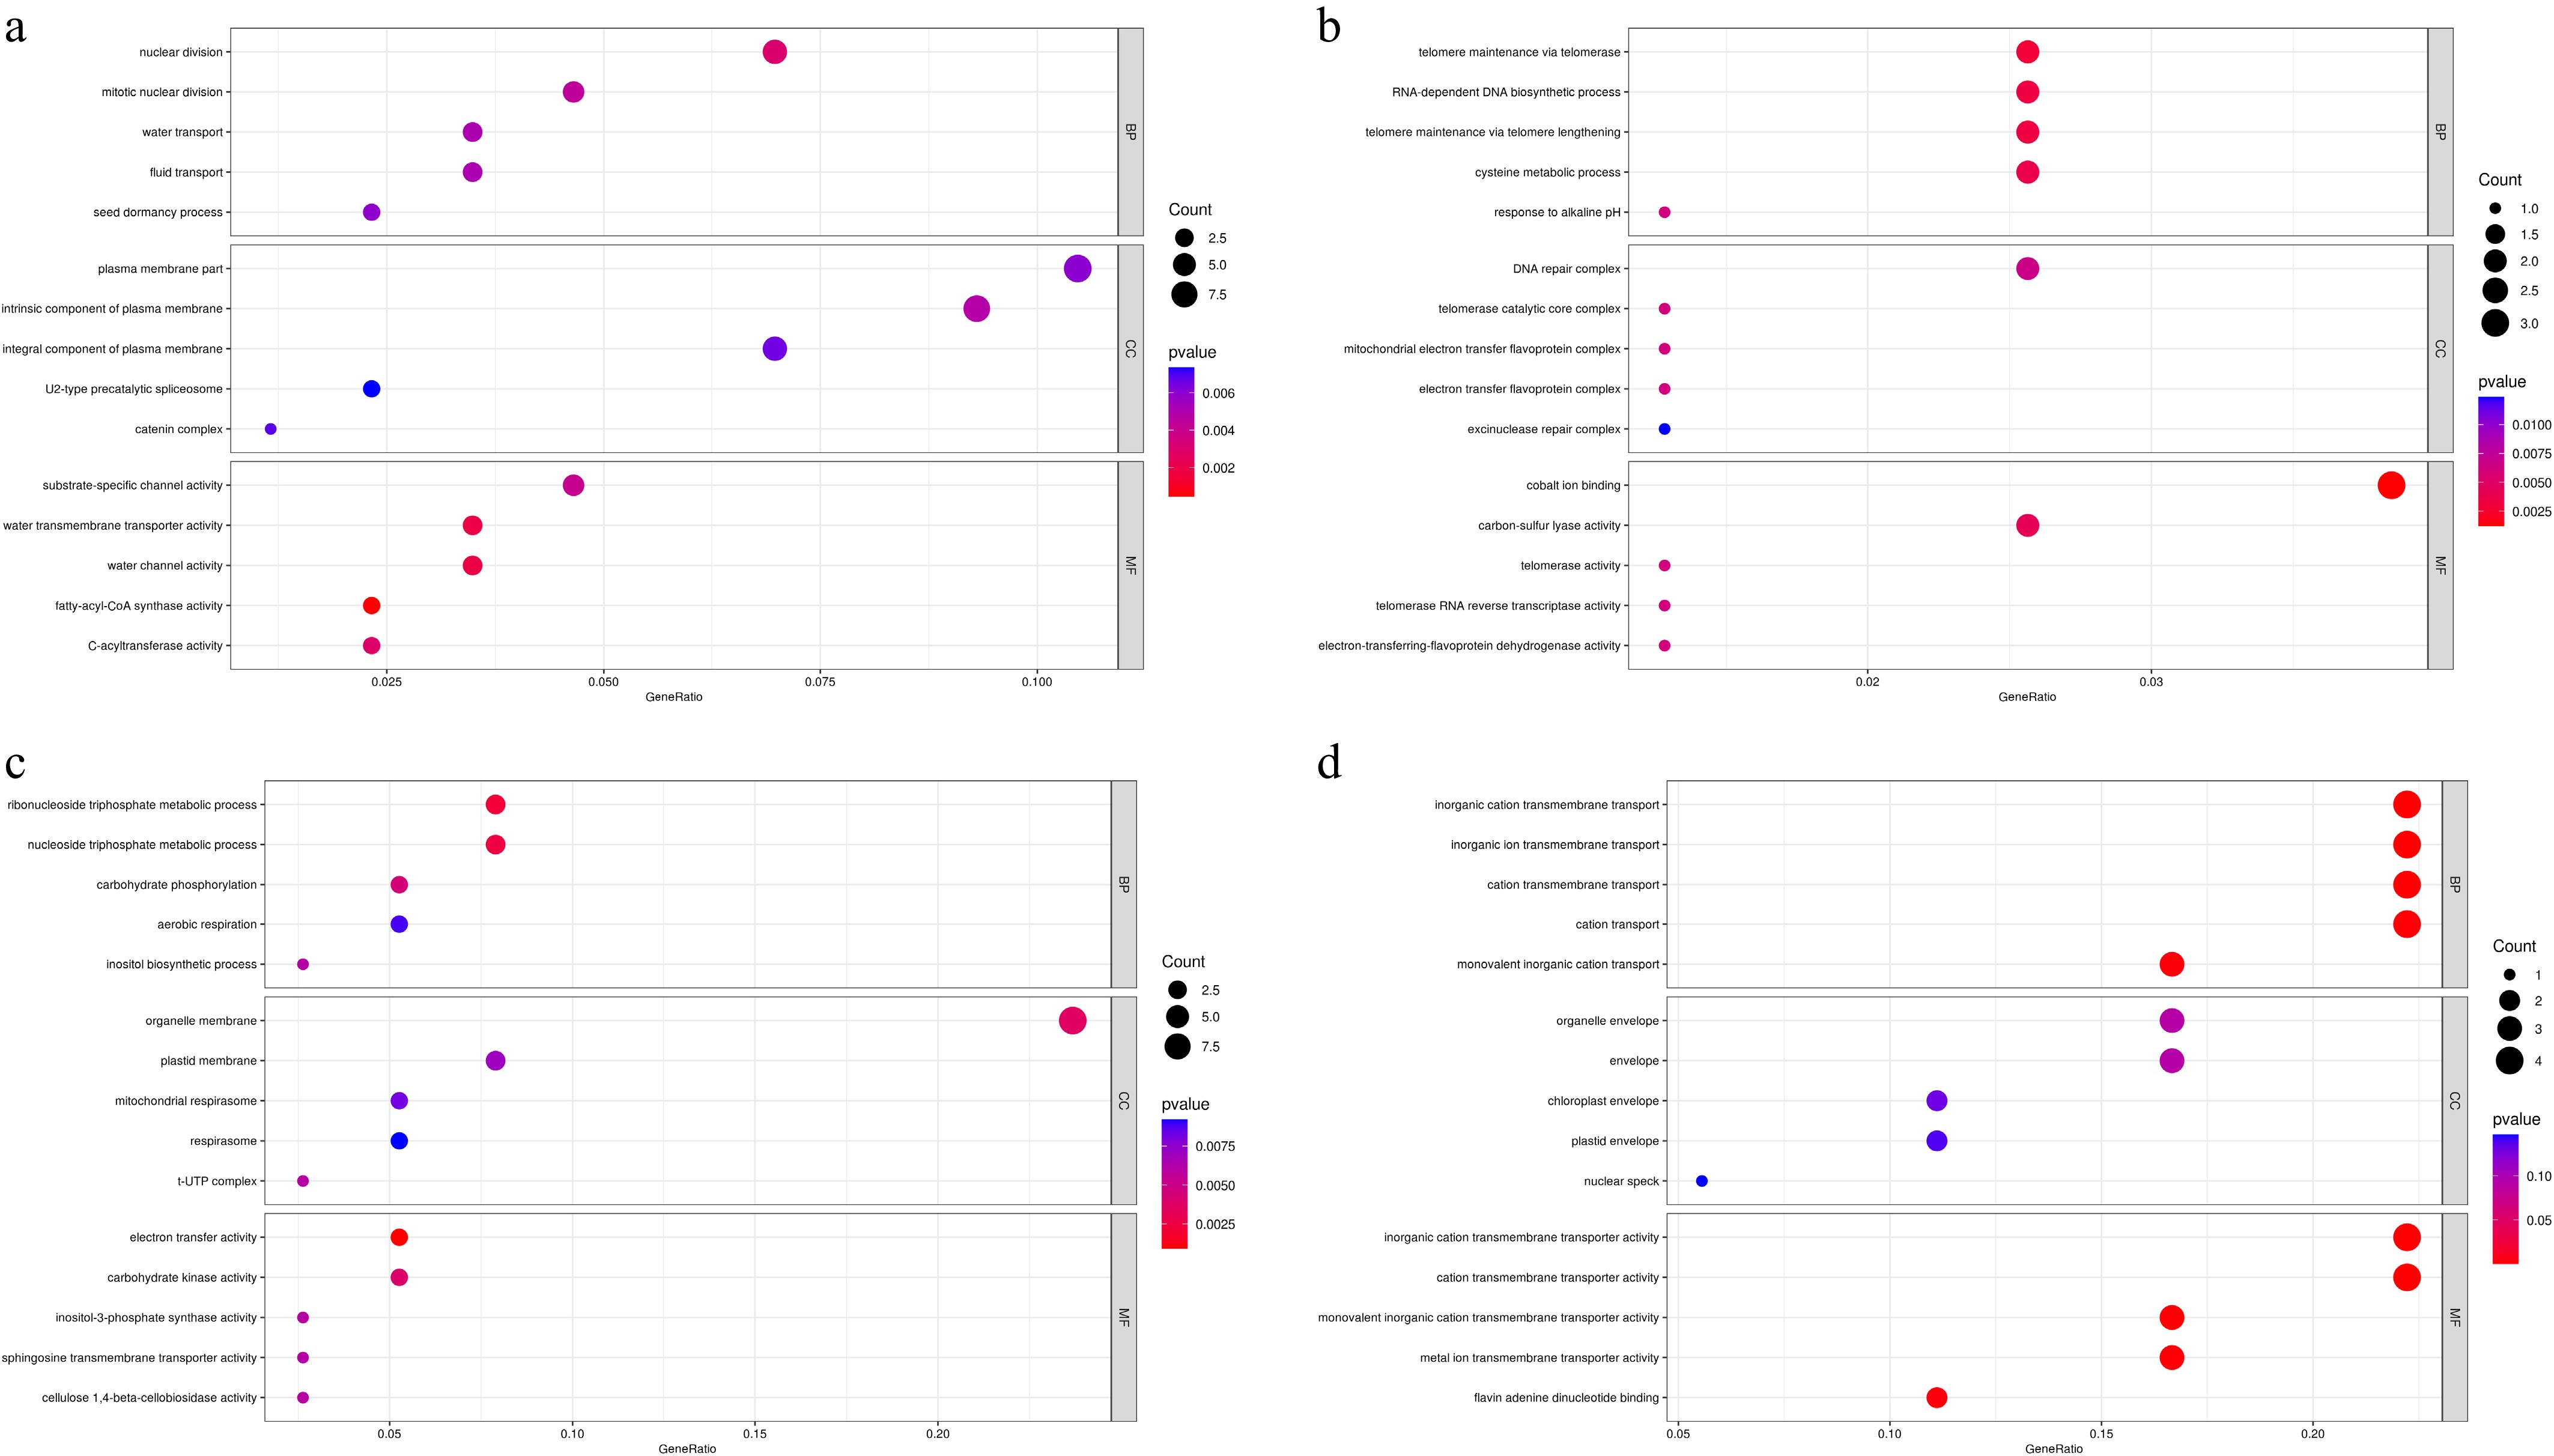
Figure 8.
Gene Ontology enrichment analysis of DEGs between CP11 and CP2 genotypes under 99% shading stress. GO analysis was performed for the sets of DEGs identified in Fig. 6c–f. (a) Significantly enriched GO terms for upregulated DEGs in the leaves (corresponding to Fig. 6c). (b) Significantly enriched GO terms for downregulated DEGs in the leaves (corresponding to Fig. 6d). (c) Significantly enriched GO terms for upregulated DEGs in the roots (corresponding to Fig. 6e). (d) Significantly enriched GO terms for downregulated DEGs in the roots (corresponding to Fig. 6f). GO terms are categorized as biological process (BP), molecular function (MF), and cellular component (CC) and are shown with their significance levels (e.g., –log10p-value or adjusted p-value).
Upregulated genes from the leaves (Leaf-Up) were significantly enriched in nuclear division, mitotic nuclear division, water transport, and fluid transport under the BP category. In the CC domain, terms such as plasma membrane part, intrinsic component of the plasma membrane, and integral component of the plasma membrane were enriched, indicating a focus on maintaining membrane integrity and facilitating transport under shading conditions. Additionally, MF terms like fatty-acyl-CoA synthase activity, water transmembrane transporter activity, and water channel activity were enriched, suggesting enhanced lipid metabolism and water regulation to support cellular homeostasis and growth (Fig. 8a). Downregulated genes in the leaves (Leaf-Down) were enriched in terms related to telomere maintenance via telomerase, RNA-dependent DNA biosynthetic process, mitochondrial electron transfer flavoprotein complex, and DNA repair complex, spanning across the BP, CC, and MF categories. Additionally, MF terms such as cobalt ion binding, telomerase activity, and electron-transferring-flavoprotein dehydrogenase activity were suppressed (Fig. 8b). These changes imply that shade stress may suppress energy-intensive processes like telomere maintenance, DNA repair, and mitochondrial activity, potentially as a resource conservation strategy under adverse conditions.
Upregulated genes in the roots (Root-Up) were significantly enriched in the ribonucleoside triphosphate metabolic process, nucleoside triphosphate metabolic process, carbohydrate phosphorylation, and inositol biosynthetic process within the BP category. In the CC domain, terms such as organelle membrane, plastid membrane, and mitochondrial respirasome were enriched, indicating a focus on maintaining energy metabolism and membrane integrity in root tissues under shading conditions. Additionally, MF terms like electron transfer activity, carbohydrate kinase activity, and inositol-3-phosphate synthase activity were enriched, suggesting enhanced energy production and metabolic flexibility to support root growth (Fig. 8c). Downregulated genes in the roots (Root-Down) were enriched in terms related to inorganic cation transmembrane transport, cation transmembrane transport, and monovalent inorganic cation transport, spanning across the BP, CC, and MF categories. In the CC domain, organelle envelope, chloroplast envelope, and plastid envelope were suppressed, whereas MF terms such as inorganic cation transmembrane transporter activity, cation transmembrane transporter activity, and metal ion transmembrane transporter activity were also downregulated (Fig. 8d). These changes imply that root tissues may suppress ion transport and envelope-related processes under stress conditions, potentially to conserve resources and mitigate ion imbalance.
Overall, the GO enrichment analyses reveal tissue-specific and genotype-specific responses to shading. In CP11, leaf tissues activate respiratory and electron transport pathways, whereas the roots show enhanced ion transport and membrane-related functions, demonstrating a multifaceted strategy for shade tolerance. In contrast, CP2 exhibits downregulation of key metabolic and cell cycle processes in both roots and leaves, indicating a reduced capacity to cope with prolonged shading stress. The enrichment in plasma and organelle membrane-related processes further highlight the importance of maintaining membrane integrity (Fig. 8), which is critical for sustaining transport and energy balance under stress.
-
This study evaluated 16 centipedegrass genotypes under 99% shading (Table 1, Fig. 1, Supplementary Fig. S1), identifying CP11 as shade-tolerant and CP2 as shade-sensitive (Fig. 2), and investigated the underlying mechanisms through integrated physiological and transcriptomic analyses. These findings elucidate the mechanisms underlying shade tolerance in turfgrass, contributing to broader knowledge of plants' responses to low-light stress[8,14,18]. CP11 exhibited superior shade adaptability, characterized by reduced leaf wilting, stable RWC, lower membrane damage, and moderate chlorophyll loss compared with CP2, reflecting a conservative strategy typical of shade-tolerant species that prioritize organ preservation over elongation[35].
Physiological and molecular mechanisms of shade tolerance
-
CP11's shade tolerance is driven by enhanced antioxidant defenses, osmotic adjustments, and sustained photosynthetic efficiency, as detailed in the results. Compared with CP2, CP11 showed less leaf wilting (Fig. 1a), higher RWC (Fig. 1b), and reduced membrane damage (Fig. 1c) under extreme shading, indicating effective stress mitigation. CP11 exhibited higher SOD activity and lower MDA levels, indicating more efficient scavenging of reactive oxygen species (ROS). Additionally, elevated levels of proline and soluble sugars in CP11 support better osmotic regulation (Fig. 3 and Fig. 4b–f). In contrast, CP2 displayed a more rapid physiological decline, characterized by lower SOD activity, higher MDA content, and reduced accumulation of osmolytes. Such physiological responses represent conserved strategies that plants use to withstand abiotic stresses, including shading[36,37]. Moreover, CP11 had higher chlorophyll levels compared with CP2 under shading (Fig. 1d and Supplementary Fig. S1), a trait associated with greater shade resilience. Similar to findings in apple trees, this characteristic enhances light capture and helps sustain photosynthesis under low light conditions[22]. Although these physiological patterns highlight CP11's superior ability to mitigate oxidative and osmotic stress, the molecular mechanisms coordinating these responses remain unclear. To further elucidate the regulatory basis of shade tolerance, we conducted comparative transcriptomic analyses between CP11 and CP2.
The transcriptomic analysis revealed CP11's conservative molecular strategy, with fewer DEGs in the roots compared with CP2 (Fig. 6a, b), suggesting energy conservation under prolonged shade stress. A smaller number of DEGs may indicate a more stable transcriptional network, consistent with reports that shade-tolerant rice maintains lower transcriptomic plasticity to conserve energy under light limitation[38]. We further identified consistent leaf- and root-specific DEGs in CP11 that likely contribute to its enhanced shade adaptability relative to CP2 under both 6-d and 12-d shading conditions (Fig. 6c–f). GO enrichment analysis highlighted tissue- and genotype-specific adaptations to shading. In CP11, upregulated genes in the leaf tissues were involved in nuclear division, water transport, respiration, and electron transfer, whereas those upregulated in the roots enhanced ion transport, ribonucleoside triphosphate metabolism, and organelle membrane functions, supporting cellular growth, hydration, and energy metabolism under shade (Fig. 8). In contrast, CP2 displayed widespread downregulation of metabolic and cell cycle processes in both the leaves and roots, reflecting a reduced capacity to cope with prolonged shading.
Under prolonged shading, such coordinated suppression likely reflects metabolic reprogramming toward energy optimization, consistent with recent findings that shading triggers broad morphophysiological and metabolic adjustments in various species. For example, shading or blue-light depletion induces the activation of primary energy metabolism and lipid biosynthesis while reducing secondary metabolites such as phenylpropanoids, reflecting a shift from energy-consuming to energy-saving processes[39]. Similar proteomic and metabolomic evidence in tobacco leaves further supports that low light conditions enhance photosynthetic carbon fixation and terpenoid biosynthesis via the reorganization of energy metabolism[40]. Together, these observations suggest that CP11 adopts a similar strategy, maintaining shade resilience through an integrated balance of energy conservation, optimized carbon utilization, and adaptive resource allocation across the leaves and roots. The transcriptomic profiles further point to a finely tuned transcriptional regulatory system underlying this coordinated response. To uncover the regulators orchestrating CP11's shade tolerance, we examined the key transcription factors and functional genes involved in shade-responsive signaling and metabolic pathways.
Transcription factor genes involved in plant hormone signaling were found to be differentially expressed, including the downregulation of ERF109 and the upregulation of CRF2 in the roots (Fig. 7, Supplementary Tables S5, S6). ERF109 is a transcription factor that integrates plant hormone signaling, including jasmonic acid, auxin, and ethylene, to mediate responses to various environmental stresses[41−43]. However, its direct role in the shade-avoidance response remains poorly understood. Recent studies indicate that the expression of ERF109 is regulated by light and oxidative stress, suggesting a potential mechanism through which centipedegrass ERF109 may contribute to modulating the plant's responses under shading conditions[41,44].
The CRF transcription factor family has been widely reported to participate in abiotic stress responses via cytokinin signaling, although its involvement in shade stress has not yet been documented[45]. In Arabidopsis roots, CRF2 has been shown to regulate lateral root development in response to cold stress[46]. Therefore, we speculate that the upregulation of CRF2 in CP11 may influence roots' morphology or physiological activity to enhance shading resilience, possibly by maintaining water and nutrient transport efficiency when photosynthetic demand is reduced under low light conditions.
Upregulation of a fructose-1,6-bisphosphatase gene in the roots enhances carbon metabolism, aiding osmotic adjustment (Fig. 7, Supplementary Table S5)[47,48], whereas leaf-specific upregulation of psbB and PP2C indicates fine-tuned photosynthesis and stress response networks (Fig. 7, Supplementary Table S3)[49,50], potentially involving negative regulators like HFR1[14]. Additionally, the downregulation of ribulose bisphosphate carboxylase subunit (RBCS) in CP11 leaves suggests a proactive strategy to conserve energy under shading stress (Fig. 7, Supplementary Table S4), as limited light availability restricts photosynthesis[51].
Agricultural and ecological implications
-
CP11's shade tolerance has significant implications for urban landscapes, where shading from buildings and trees is common. Its physiological and molecular adaptations may confer cross-tolerance to abiotic stresses like drought or salinity, warranting further study. These traits could enhance turfgrass varieties for urban greening and inform cover crop engineering for shaded agricultural systems, supporting sustainable food production.
Future directions and conclusions
-
Future research should validate candidate DEGs (e.g., ERF109, CRF2, PP2C) using genetic tools like clustered regularly interspaced short palindromic repeats (CRISPR) to confirm their roles in shade tolerance. Proteomic and metabolomic analyses could uncover post-transcriptional mechanisms, providing a comprehensive view of shade adaptation[40]. Field trials under combined stresses (e.g., shade and drought) are needed to evaluate CP11's performance under realistic conditions.
In summary, CP11's shade tolerance arises from coordinated physiological adaptations (antioxidant defenses, osmotic adjustment, and chlorophyll retention) and conservative molecular responses that distinguish it from the shade-sensitive CP2. These findings advance our understanding of shade tolerance in turfgrass and lay a foundation for developing resilient genotypes suited for urban and agricultural applications, with broader implications for plant stress biology.
This work was supported by the Central Public-interest Scientific Institution Basal Research Fund (1630032025015, 1630032022011) and the earmarked fund for China Agriculture Research System (CARS) (CARS-Z22, CARS-34). We sincerely thank Mr. Chuanxin Liu for his invaluable assistance with data collection.
-
The authors confirm their contributions to the paper as follows: designed and conducted the experiments and contributed to writing the manuscript: Liu Y, Wang Z; conceptualized and supervised the project: Liu G, Wang W; performed data analysis and provided critical insights into the results: Liu Y, Wang Z, Zhang Y, Dong R, Wang W; reviewed, edited, and approved the final manuscript: Liu Y, Wang Z, Zhang Y, Dong R, Huan H, Yu D, Wang W. All authors reviewed the results and approved the final version of the manuscript.
-
The datasets generated analyzed during the current study are available from the corresponding author on reasonable request.
-
The authors declare that they have no conflict of interest.
- Supplementary Table S1 Sequences of pirmers used in this study.
- Supplementary Table S2 The transcriptome sequencing statistics of 36 libraries.
- Supplementary Table S3 Commonly upregulated leaf DEGs in CP11 relative to CP2 under 6-Day and 12-Day shading treatments.
- Supplementary Table S4 Commonly downregulated leaf DEGs in CP11 relative to CP2 under 6-Day and 12-Day shading treatments.
- Supplementary Table S5 Commonly Upregulated Root DEGs in CP11 Relative to CP2 Under 6-Day and 12-Day Shading Treatments.
- Supplementary Table S6 Commonly Downregulated Root DEGs in CP11 Relative to CP2 Under 6-Day and 12-Day Shading Treatments.
- Supplementary Fig. S1 Chlorophyll a (a) and chlorophyll b (b) content in 16 Eremochloa ophiuroides (centipedegrass) genotypes after 18 days of 99% shading treatment.
- Copyright: © 2026 by the author(s). Published by Maximum Academic Press, Fayetteville, GA. This article is an open access article distributed under Creative Commons Attribution License (CC BY 4.0), visit https://creativecommons.org/licenses/by/4.0/.
-
About this article
Cite this article
Liu Y, Liu G, Dong R, Zhang Y, Huan H, et al. 2026. Screening shade-tolerant centipedegrass genotypes: Physiological and transcriptomic insights into shade adaptation mechanisms. Grass Research 6: e005 doi: 10.48130/grares-0025-0033 

Screening shade-tolerant centipedegrass genotypes: Physiological and transcriptomic insights into shade adaptation mechanisms
- Received: 04 September 2025
- Revised: 07 November 2025
- Accepted: 20 November 2025
- Published online: 26 February 2026
Abstract: Shade stress is a major constraint for the growth and performance of turfgrass in urban environments. To investigate shade tolerance mechanisms in centipedegrass (Eremochloa ophiuroides), we evaluated 16 genotypes under 66% and 99% shading for 18 d. CP11 was identified as shade-tolerant; CP2 was shade-sensitive. Both were subjected to detailed physiological and transcriptomic analyses. CP11 exhibited significantly reduced leaf wilting, higher relative water content, greater membrane stability, and enhanced chlorophyll retention compared with CP2. In addition, CP11 maintained higher antioxidant enzyme activities and osmolyte accumulation, supporting superior oxidative stress mitigation and osmotic adjustment. Transcriptome analysis identified 259 upregulated and 278 downregulated differentially expressed genes (DEGs) in CP11 leaves, and 108 upregulated and 104 downregulated DEGs in roots, consistently regulated at 6 and 12 d under 99% shading compared with CP2, revealing candidate genes like psbB, PP2C, and CRF2 for CP11's enhanced shade adaptability, which highlight molecular mechanisms involving chlorophyll biosynthesis, stress signaling, and ethylene regulation. Gene Ontology (GO) enrichment analysis showed that CP11 upregulates leaf pathways for nuclear division, water transport, and plasma membrane integrity, and root pathways for energy metabolism and membrane functions, while downregulating energy-intensive processes like DNA repair and ion transport, indicating a resource-conserving strategy that, together with coordinated physiological protection and transcriptomic reprogramming, underscores CP11's multifaceted adaptations to prolonged shading stress. This work provides mechanistic insights into shade adaptation and establishes a genetic foundation for breeding shade-resilient centipedegrass cultivars to support sustainable urban landscaping.