












-
Leeches (Annelida: Hirudinea), as key benthic invertebrate parasites, hold dual significance in biodiversity monitoring and medical applications, with over 680 species recorded worldwide[1]. They are primarily freshwater dwellers, with some terrestrial species[2], and are classified into Rhynchobdellida (jawless), Arhynchobdellida (jawed), and Acanthobdellida, most being vertebrate blood-feeders[3]. Their value extends to evolutionary studies[4], environmental bioindicators (e.g., Hirudo nipponia for monitoring water pollution[5]), and historic medical uses in surgery and anticoagulant development[6−8].
Recent agricultural pollution and overharvesting have severely degraded wild leech habitats, driving reliance on aquaculture to meet traditional Chinese medicine demands. China’s primary farmed species include Hi. nipponia, Poecilobdella manillensis (high prothrombin activity), and Whitmania pigra (non-hematophagic, easily reared[9]). However, unregulated trade of wild and non-medical species with limited taxonomic knowledge has created market chaos, raising safety concerns.
Morphological identification challenges, including convergent traits, incomplete reproductive isolation[10], and destructive and time-consuming methods (e.g., Erpobdellid dissection requiring gonopore annuli counts and male reproductive system analysis)[11,12], exacerbate misidentification risks. For instance, Hirudo tianjinensis was initially misclassified as Hi. nipponia before molecular clarification[9]. DNA-based techniques now complement morphology, enabling accurate adulterant detection[13], with mitochondrial genomes (mitogenomes) proving particularly effective as phylogenetic markers[14,15]. Whole mitogenomes outperform single genes in resolution[16,17], aided by expanding databases such as GenBank[18,19]. Phylogenetic relationships within different groups of leeches have been explored using combined evidence from molecular markers (mitochondrial COX1 and 12S rRNA, and nuclear 18S rRNA and 28S rRNA) and morphological data[12,20−24]. Recent advances in sequencing technology[25] have fueled a rapid increase in the number of sequenced leech mitochondrial genomes[26,27].
Despite advances, leech molecular studies remain scarce. While early mitogenome analyses suggested structural conservation (all genes on one strand), recent discoveries reveal complex rearrangements[28,29]. Limited mitogenome availability relative to the high species diversity impedes phylogenetic understanding[30,31]. This study made an effort to address these gaps by sequencing 11 mitogenomes of leech species (including first reports for Barbronia weberi, Dinobdella ferox, Mooreobdella quaternaria, and Batracobdella cancricola), analyzing mitogenome structural evolution and Hirudinea phylogeny through integration of newly generated and public data, and investigating species adulteration in Chinese medicinal markets via multi-region sampling combined with DNA barcode validation. By bridging molecular and morphological approaches, we aim to resolve taxonomic ambiguities and improve the management of medicinal leech resources.
-
In total, 11 leech species (Whitmania acranulata, Barbronia yunnanensis, B. weberi, D. ferox, Alboglossiphonia lata, M. quaternaria, Hi. nipponia, Haemadipsa yanyuanensis, W. pigra, P. manillensis, and Ba. cancricola) were sampled (Supplementary Table S1), collected from eight locations in five provinces (municipalities) of China (Supplementary Fig. S1). All leeches were killed by rapid deep-freezing. Live specimens along with culture medium were sealed in cryovials and immediately placed in a –80 °C ultra-low temperature environment for processing, and then identified based on the morphological characteristics described in the literature[3,4,32]. We used the COX1 gene obtained from the assembled mitogenomes to blast with GenBank (
https://blast.ncbi.nlm.nih.gov ) (threshold values of sequence similarity not less than 98%) to further verify the morphological identification[33]. A unique voucher number was assigned to each specimen, and all specimens are reserved in the repository of Meng’s Laboratory at Central South University. The complete voucher list and taxonomic information are presented in Supplementary Table S2.We also collected 60 leech samples from 19 regions in China between 2021 and 2023 (Supplementary Fig. S2), all of which were farmed species or collected in the markets. All specimens were stored in absolute ethyl alcohol at –20 °C. All voucher specimens were assigned a unique field code and reserved in Meng’s Lab, Central South University. Geographic collection locations were listed in Supplementary Table S3. The TIANamp Genomic DNA Kit (DP304, TIANGEN, Beijing, China) was used for lysis of tissue and DNA extraction. The primers (LCO1490: 5′-GGTCAACAAATCATAAAGATTG-3′; HCO2198: 5′-TAAACTTCAGGGTGACCAAAAAATCA-3′[34]) were used to amplify the COX1 gene of Hirudinea. PCR was performed in a 25 μL reaction mixture containing 2 × PCR Buffer for KOD FX, 1.5 μL 10 pmol/μL of each primer, 10 μL 2 mM dNTPs, 1 μL of genomic DNA template, and 1 μL KOD FX enzyme. The thermal cycling profile involved an initial denaturation at 94 °C for 2 min, followed by 35 cycles of 98 °C for 10 s and 50 °C for 30 s, with a final extension at 68 °C for 1 min. Amplification success was confirmed by running 5 μL of the PCR product on a 0.2% agarose gel. The purified COX1 PCR product was bidirectionally sequenced using the original primers via Sanger sequencing. The results were manually edited and aligned, followed by assembly into a final consensus sequence to ensure accuracy using BioEdit[35].
Mitochondrial genome sequencing and assembly
-
The mitogenomes were generated by de novo sequencing. After DNA isolation, 1 μg of purified DNA was fragmented to ~500 bp using the Covaris M220 system to construct short-insert libraries according to the manufacturer’s instructions (TruSeq™ Nano DNA Sample Prep Kit, Illumina, San Diego, CA, USA), and prepared using the platform Illumina TruSeq SBS Kit (300 cycles) to generate paired-end reads of 150 bp length. The sequencing work was performed on an Illumina NovaSeq 6000. Prior to assembly, the software Trimmomatic v0.39[36] was used to trim adapter sequences and filter out low-quality sequences.
Mitochondrial de novo assembly was performed using SPAdes v3.10.1[37] and GapCloser v1.12[38]. Assembly quality was confirmed by several metrics, including a mean coverage depth of 250×, complete gene annotation (37 genes), and high BLASTN identity (> 99%) to a close relative. The starting position and direction of mitochondrial assembly sequences were corrected by reference genomes to obtain final mitochondrial genome sequences.
Characterization of mitochondrial genomes
-
In order to confirm the correctness of gene boundaries, 13 protein-coding genes (PCGs) were aligned with published mitogenomes of leeches using Muscle (codons) implemented in MEGA 5[39], and Open Reading Frames (ORFs) Finder was performed according to the invertebrate mitochondrial genetic codes (
https://ncbi.nlm.nih.gov/gorf/gorf.html ). The location and secondary structure of tRNAs were predicted via tRNAscan-SE Search Server v1.21 (https://lowelab.ucsc.edu//tRNAscan-SE )[40], and corrected manually by aligning with other leeches. The rRNA genes (rrnS and rrnL) were identified by the boundary of the adjacent tRNA genes (trnL1, trnV, and trnM) and aligned with the mitogenomes of leeches by the Q-INS-I method as implemented in the MAFFT v7 online service (https://mafft.cbrc.jp/alignment/server )[41]. The boundaries of the control region were identified by its flanking genes (trnR and trnH) and its high A + T content, with the notable exception of W. pigra (the control region was located between COX1 and NAD2). The identity was further supported by the presence of characteristic conserved sequence blocks (CSBs) and tandem repeats, which were identified through multiple sequence alignment with congeneric species (Poecilobdella javanica, Hi. nipponia; GenBank accession numbers MN542781, MZ507570) using MAFFT and through analysis using the Tandem Repeats Finder online server (https://tandem.bu.edu/trf/trf.basic.submit.html )[42], respectively. Finally, all files were manually validated and then submitted to the NCBI database. The mitogenome maps (Supplementary Fig. S3) were produced using OGDRAW v1.3.1[43]. Characteristics of 11 newly sequenced mitogenomes of leeches were annotated (Supplementary Table S4).Nucleotide sequences of each of the 13 PCGs were translated into amino acids, aligned separately with Muscle implemented within MEGA, and then toggled back into nucleotide alignments. Two rRNAs and all tRNAs were aligned separately in MAFFT using the Q-INS-I algorithm. All ambiguously aligned sites from 13 PCGs and two rRNAs were removed by Gblocks v0.91b[44]. For quality, all alignments were then checked and corrected manually in MEGA.
Base composition of PCGs was performed using MEGA. Strand asymmetry of 51 leech mitochondrial sequences (GenBank accession numbers were listed in Supplementary Table S1) was evaluated by AT Skew and GC Skew using the formula: AT-skew = (A − T)/(A + T) and GC-skew = (G − C)/(G + C) manually. Genetic divergences among the 13 concatenated PCGs of 51 leech mitogenomes were calculated utilizing the uncorrected pairwise p-distances in MEGA. Sequence divergence heterogeneity, which was based on five datasets (AA: amino acids; PCG3: the third codons in PCGs; PCG12: the first and second codons in PCGs; PCG123: all codons in PCGs; PCGrRNA: PCGs and rRNAs), was analyzed using AliGROOVE v1.06 with the default sliding window size[45]. The rate of non-synonymous (Ka), synonymous substitutions (Ks), and evolutionary rate (Ka/Ks, ω) of each PCG was determined by MEGA. Relative synonymous codon usage (RSCU) was calculated by DAMBE v7.3.11[46] and visualized by ChiPlot (
https://chiplot.online/#Heatmap ).DNA barcoding and molecular identification
-
The COX1 genes of 60 successfully amplified leech samples from 10 genera were compared using ClustalX v1.83 (default parameter values)[47] and uploaded into GenBank with the accession numbers: OR578840−OR578899. The online BLAST tool was used to perform molecular identification, and the results showed that all specimens were identified as Hirudinea. COX1 gene sequences of Hirudinea (130 samples from 31 genera) in GenBank were chosen for analysis. MEGA was used to generate inter- and intraspecific genetic distance matrices based on the p-distance method, and inter- and intrageneric distances were calculated manually.
Phylogenetic analyses
-
All PCGs (excluding the termination codons) and RNAs of 51 mitogenomes of Hirudinea were applied to construct the phylogenetic trees, representing 39 leech species belonging to 23 genera, nine families, and three orders. Dendrobaena veneta, Eisenia fetida, and Lumbricus rubellus (Oligochaeta: Lumbricidae) and Tubifex tubifex (Oligochaeta: Naididae) were included as outgroups[48]. To assess the robustness of the phylogenetic inferences and the impact of different evolutionary pressures, phylogenetic analyses were performed using the maximum likelihood (ML) and Bayesian inference (BI) methods with three datasets concatenated by SequenceMatrix v1.8[49]: (1) PCG12, to obtain a signal less affected by substitution saturation and base composition biases; (2) PCGrRNA, which is subject to different functional constraints, thereby providing a more comprehensive phylogenetic perspective; (3) PCG123, to utilize the full phylogenetic signal from protein-coding genes and to evaluate the impact of the rapidly evolving third codon positions. Substitution saturation was evaluated via plotting the number of transitions (Ti) and transversions (Tv) against the corrected genetic distance estimated with a GTR model as implemented in DAMBE. For each data partition, saturation plots showed little substitution saturation, and only third codon positions are relatively heterogeneous (Supplementary Fig. S4). Therefore, these three datasets could be used in phylogenetic analyses.
For BI analyses, the best-fit partitioning schemes and nucleotide substitution models were confirmed by PartitionFinder v2.1.1[50] with the Akaike Information Criterion (AIC) and the 'greedy' algorithm, with branch lengths estimated as 'unlinked' (Supplementary Table S5). BI analyses were executed with 100 million generations with 4 chains, sampling every 1,000 generations in MrBayes v3.2.4[51]. Posterior probabilities (PPs) were computed in a consensus tree after discarding the first 25% of trees as burn-in. For ML analyses, the optimal partitioning schemes for each dataset and the best evolutionary model for each partition were selected according to the Bayesian Information Criterion (BIC) (Supplementary Table S6). ML trees were constructed using the IQ-TREE web server (
https://iqtree.cibiv.univie.ac.at )[52], and the nodal support values of the majority-rule consensus tree were inferred with 10,000 bootstrap replicates. The phylogenetic trees were visualized and drawn using FigTree v1.4.2 (https://tree.bio.ed.ac.uk/software/figtree ).For the identification of raising leeches, the ML tree was constructed with 190 COX1 sequences of Hirudinea using the substitution model GTR + F + I + R6 in IQ-TREE, and the Neighbor Joining (NJ) tree was constructed using the Kimura 2-parameter model with 1,000 bootstrap replicates in MEGA. De. veneta, E. fetida, L. rubellus, and T. tubifex from Oligochaeta were used as outgroups. The molecular species delimitation analysis using the PTP-ML method was also constructed (
https://species.h-its.org/ptp ). -
Most newly sequenced mitogenomes are typically circular, double-stranded molecules (Fig. 1; Supplementary Fig. S3). However, the noncoding regions of D. ferox, A. lata, M. quaternaria, and Hi. nipponia located between trnR and trnH were longer and more complex than those of close relatives, and were therefore partially assembled, resulting in four incomplete mitogenomes (Supplementary Fig. S3). The same situation also occurred in Hirudo medicinalis and Hirudo verbena[18]. These 11 new sequences contained 37 genes (13 PCGs, 22 tRNAs, and two rRNAs), all encoded by the heavy strand (H-strand). The complete leech mitogenome lengths varied from 14,439 to 15,589 bp, with the majority of variation due to length variation in the A + T-rich region.
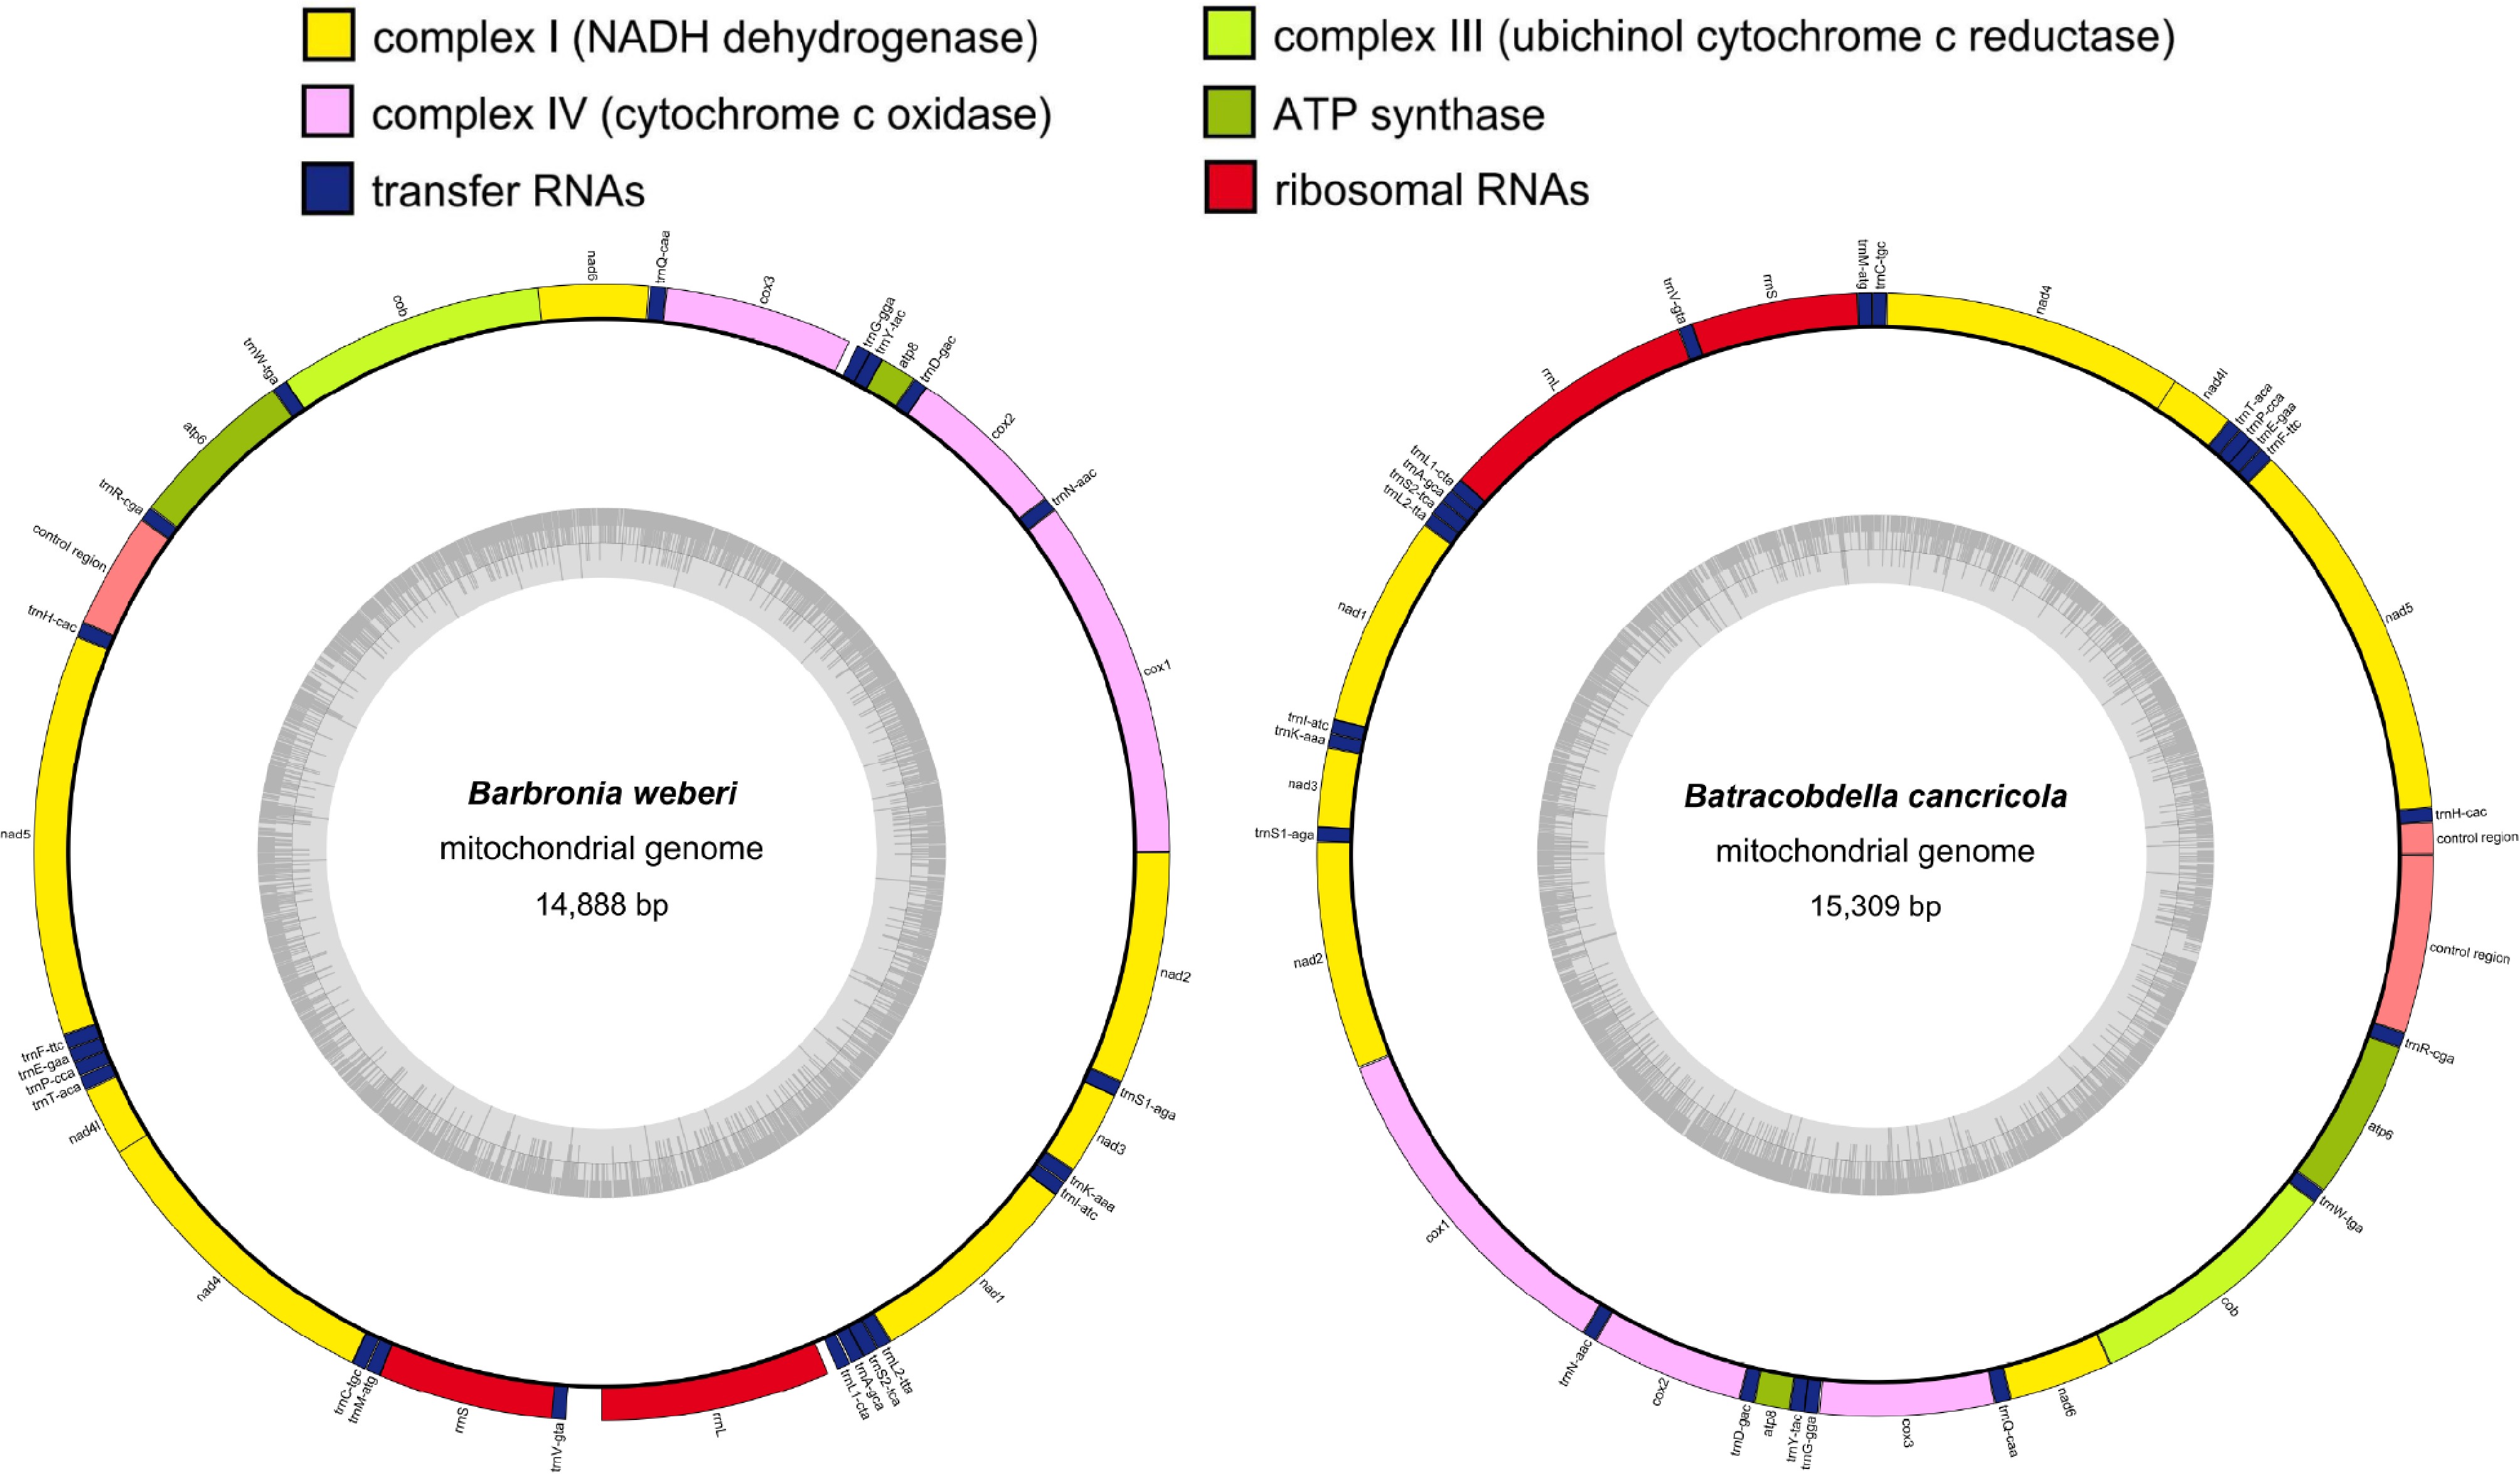
Figure 1.
The circular mitogenomes of two firstly sequenced leech species. Genes are characterized by different color blocks. Color blocks outside each loop reveal that the genes are on the heavy strand.
The tRNA putative secondary structures of 11 new sequences and the RSCU of PCGs in leech mitogenomes were provided in Supplementary Figs S5–S7. Most tRNAs can fold into the typical cloverleaf structure, with the exception of a few tRNA genes that lack the DHU arm (e.g., tRNASer[UCU] and tRNAArg) or the TψC arm (e.g., tRNAGly and tRNAVal). Several mismatches (e.g., non-canonical G-U pairs and mismatches such as A-A, U-U, U-C, and A-C) are found on the arms of tRNAs, primarily occurring in the amino acid arms (e.g., tRNAAla and tRNAGlu). Among degenerate codons, A/T is used more frequently than G/C, with codons CTA, CGA, TCA, TCT, and GTA all ending in A or T. In contrast, several GC-rich codons, such as GCG, CTC, CCG, CGG, ACG, and GTC, are rarely used in the mitochondrial genes of Hirudinea.
Based on 13 PCGs from 51 mitogenome sequences of leech species, uncorrected p-distances were calculated, and the interspecific distances varied from 1.9% (between Baicaloclepsis grubei [OM257166] and Baicaloclepsis echinulata [OM257165]) to 32.6% (between Paracanthobdella livanowi [OM117614] and W. acranulata [MK347500]). Intraspecific distances of 0 were observed in Hi. nipponia (OQ076763 vs MZ507570) and W. acranulata (OQ076763 vs KM655838 and MK347500 vs KC688271), and the mean intraspecific distances ranged from 0.6% (Pa. livanowi and W. pigra) to 25.6% (Erpobdella octoculata) (Supplementary Table S7). The average intrageneric distances spanned from 1.9% in Baicaloclepsis to 18.5% in Erpobdella, and the average intergeneric distances were lowest between Glossiphonia and Baicaloclepsis (5.4%) and highest between Paracanthobdella and Whitmania (31.8%) (Supplementary Table S8).
Evolutionary rates and heterogeneous sequence divergence
-
The AT content of 13 PCGs within 51 leech mitogenomes varied from 66.97% (Placobdella lamothei) to 78.13% (Piscicola geometra). Third codon positions (average 84.83%) were much higher in AT content than the first (average 68.07%) and second codon positions (average 66.58%) (Fig. 2a; Supplementary Table S9). The AT skew (−0.19 to −0.02) was consistently negative across all species studied (Supplementary Table S9), indicating a uniform bias towards T over A on the heavy strand. The GC skew (−0.27 to 0.16) showed notable variation, with values distributed in both positive and negative ranges.
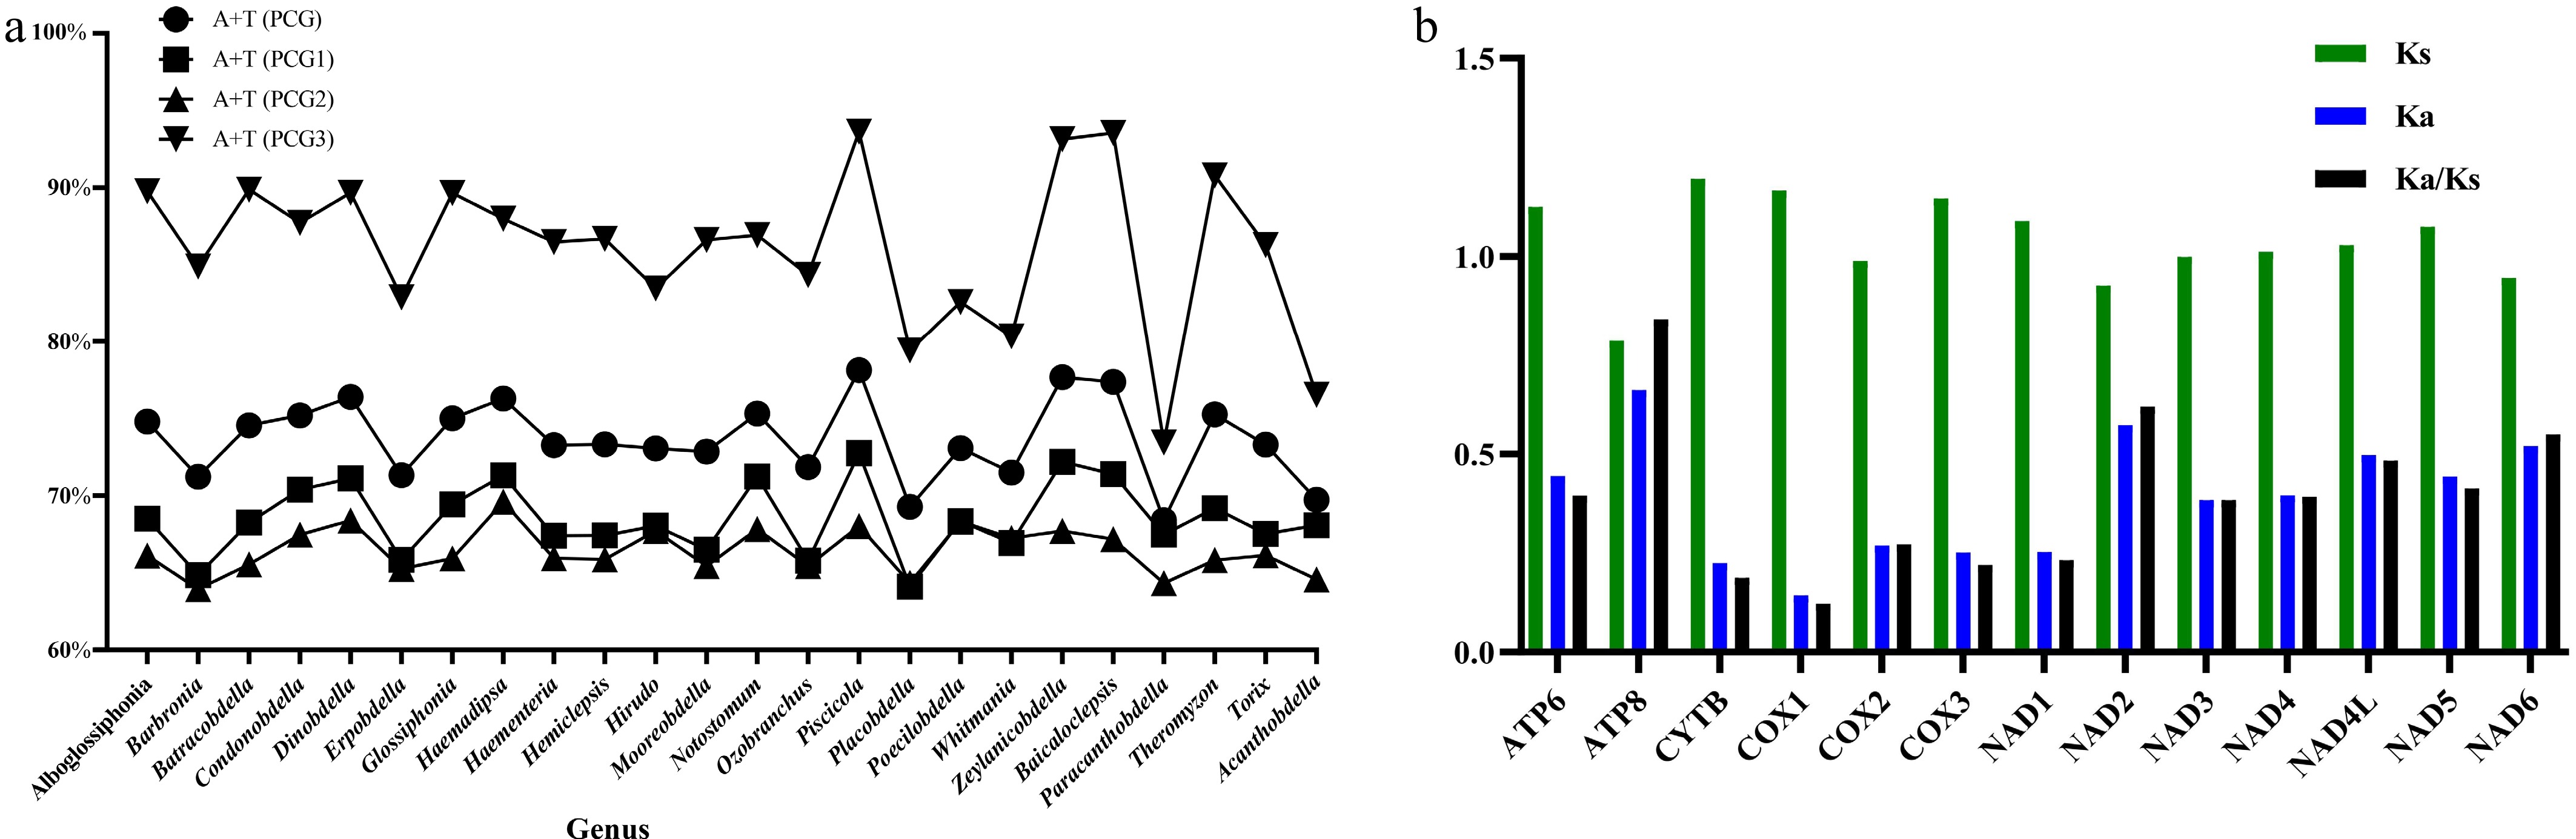
Figure 2.
Average base composition of 13 PCGs and evolutionary rate of each PCG in the mitogenomes of 51 leech species. (a) The AT content of the 1st, 2nd, and 3rd codon positions of 13 PCGs. (b) Synonymous nucleotide substitutions per synonymous site (Ks), nonsynonymous nucleotide substitutions per nonsynonymous site (Ka), and the ratio of Ka/Ks.
The values of Ka, Ks, and Ka/Ks (ω) were determined for each PCG in evaluating the evolutionary patterns among 13 PCGs of the 51 leech species (Fig. 2b). Ka ranged from 0.14 (COX1) to 0.67 (ATP8). COX1 had the lowest evolutionary rate (ω = 0.12) of all PCGs. In contrast, ATP8 had the highest (ω = 0.84). The complete Ka, Ks, and ω values were provided in Supplementary Table S10.
Furthermore, the heterogeneity of sequence divergence in multiple sequence alignments was measured using pairwise comparisons (Fig. 3). High heterogeneity was observed between the outgroups and Hirudinea species. The dataset AA had the lowest sequence heterogeneity, followed by the dataset PCG12. The third codon positions of PCGs were the most heterogeneous.
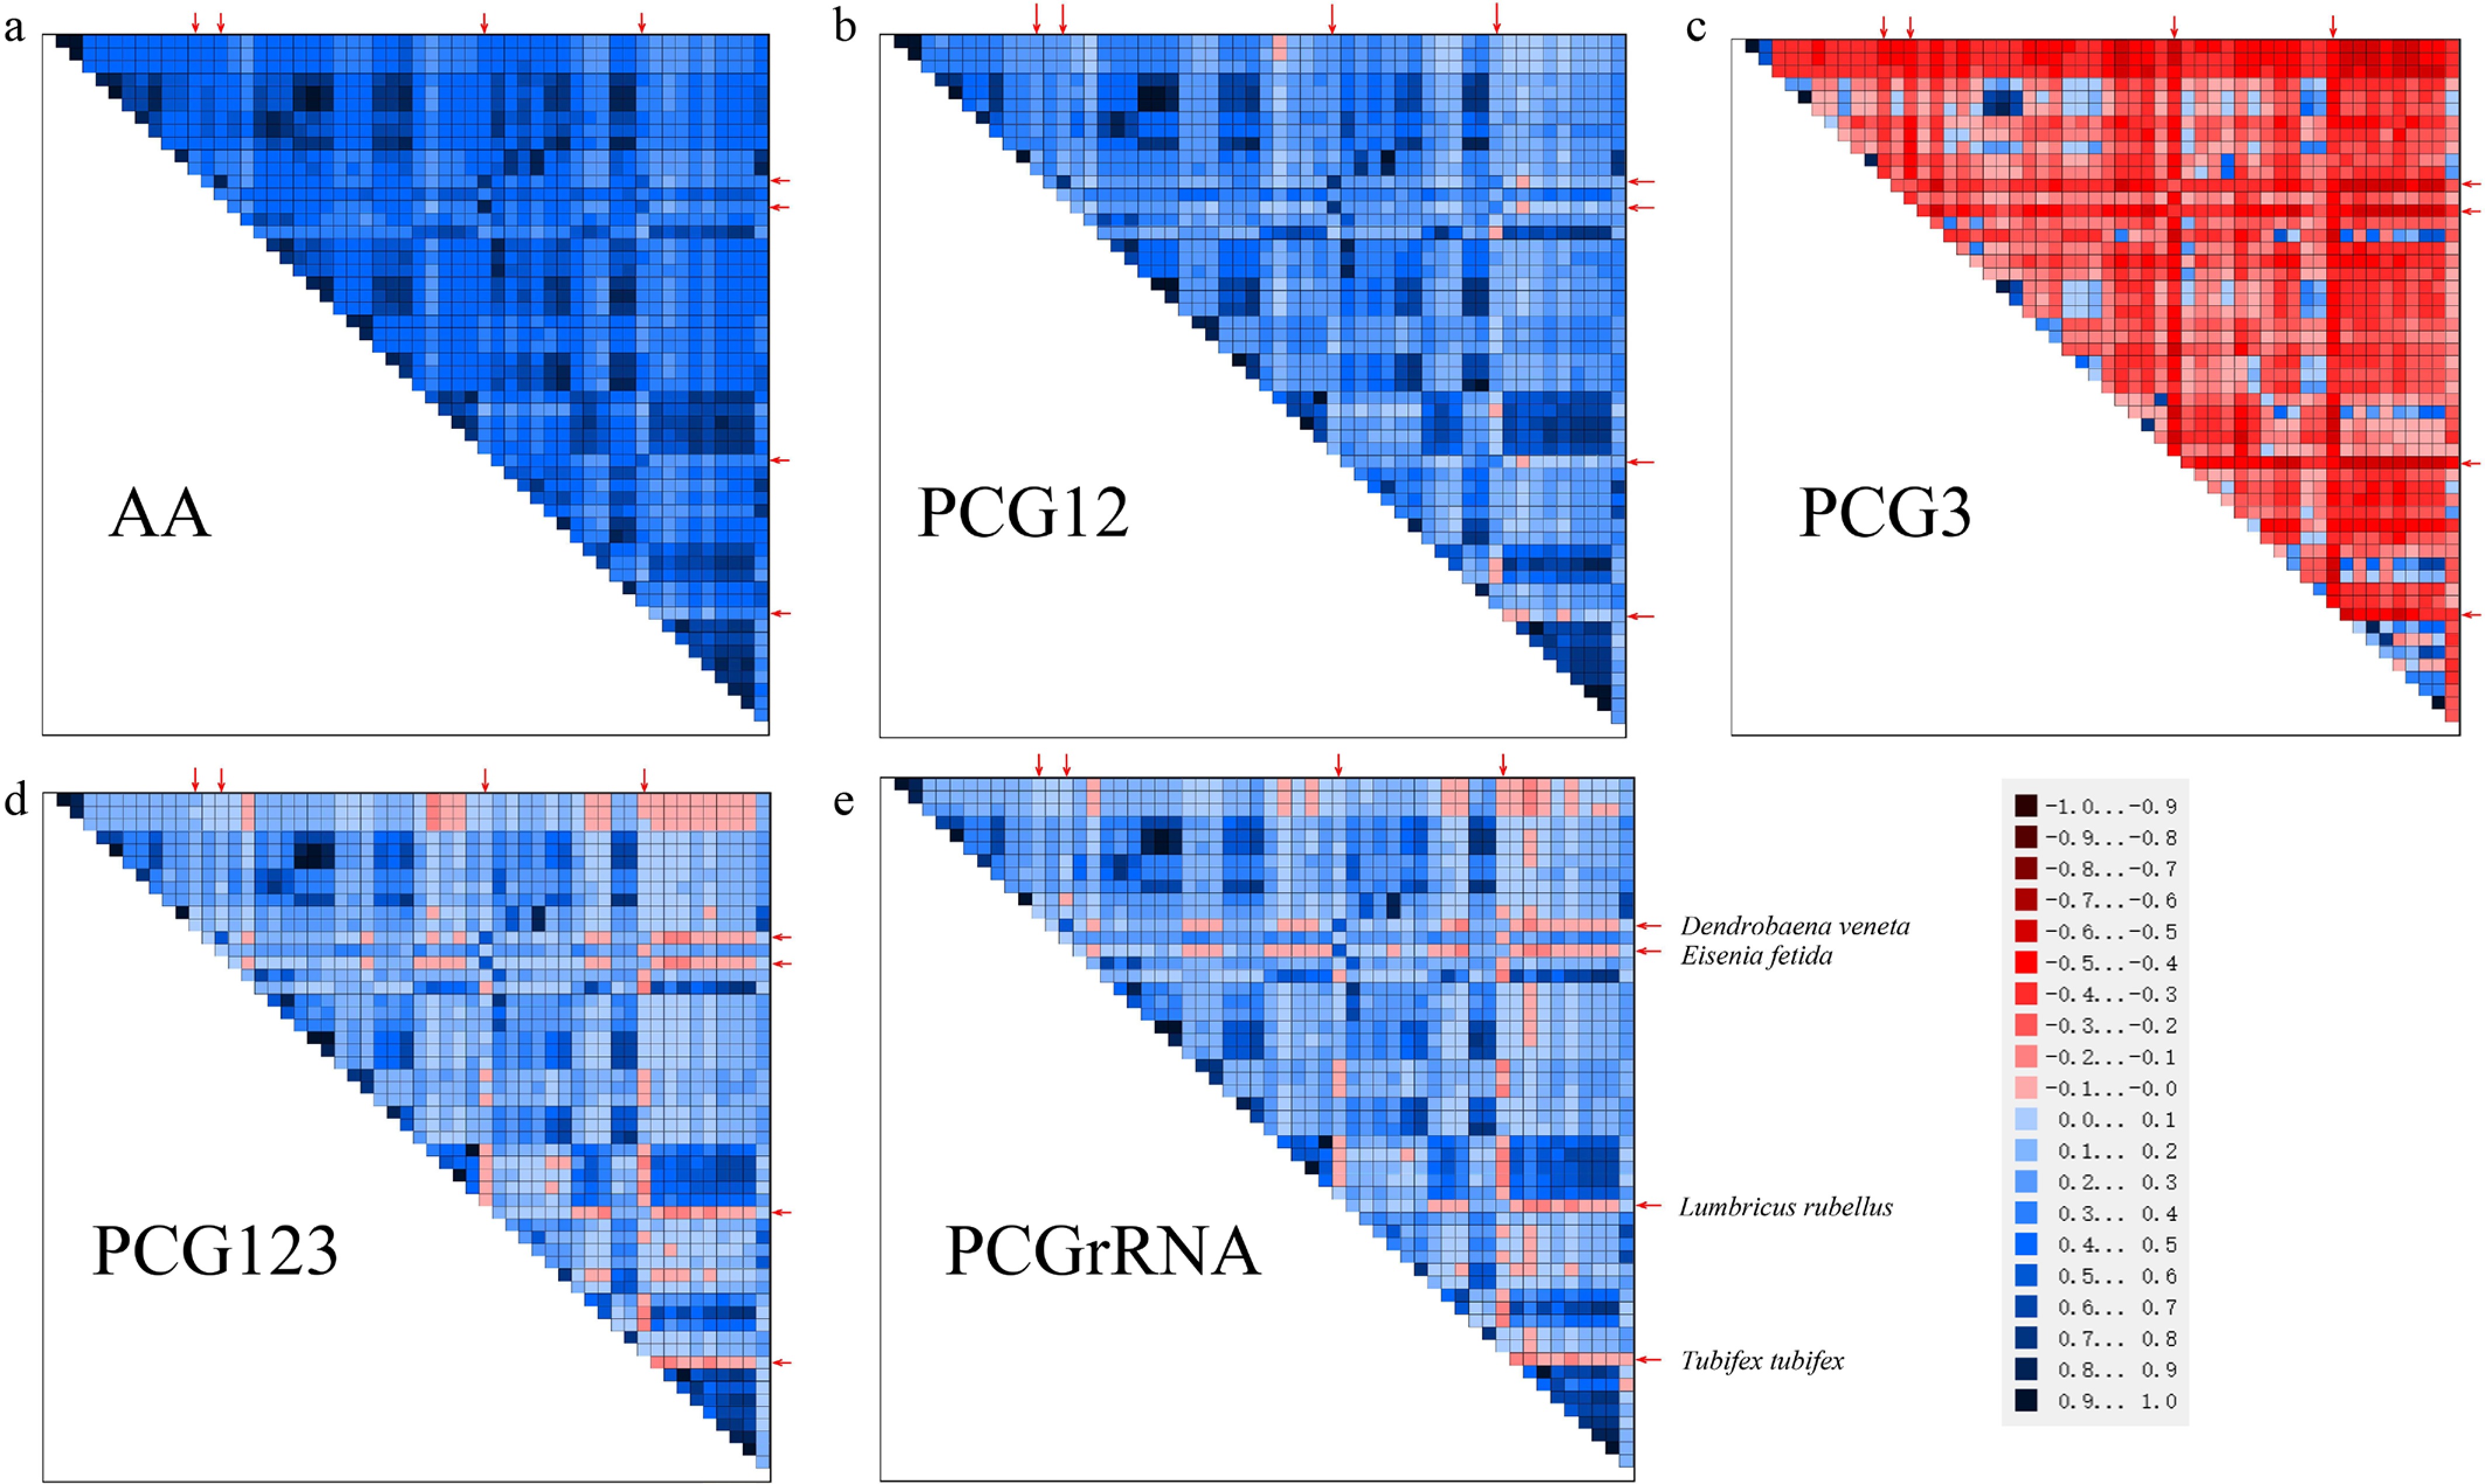
Figure 3.
Heterogeneous sequence divergence among Hirudinea mitogenomes and four outgroups (indicated by red arrows).
Mitogenomic phylogeny and gene rearrangement
-
Except for some species from Hirudinidae and Haemopidae, the phylogenetic relationships were largely consistent in the analyses of three datasets using both inference methods (BI and ML) (Fig. 4; Supplementary Figs S8–S12). Combining with two rRNAs barely increased branch support in the ML and BI trees compared to that of 13 PCGs. The monophyly of the Hirudinea was highly supported in all trees. The findings of this study provide high support for the taxonomic scheme dividing Hirudinea into three distinct orders and show the topology as ([Rhynchobdellida + Arhynchobdellida] + Acanthobdellida). As primitive parasitic seawater species, Pa. livanowi and Acanthobdella peledina, belonging to Acanthobdellida, were exclusive to the basal monophyletic clade. The phylogenetic analyses revealed a monophyletic topology of three families: Piscicolidae, Glossiphoniidae, and Haemadipsidae. Hirudinidae, Haemopidae, and Erpobdellidae exhibited complicated phylogenetic relationships. Specifically, the non-monophyly of Erpobdellidae was caused by Erpobdella sp. (MW435182) and a doubtful record of E. octoculata (KC688270). Although not all listed families were recovered as monophyletic, the phylogenetic backbone of Hirudinea approximated the topology: (((((Hirudinidae + Haemopidae) + Haemadipsidae) + (Erpobdellidae + Salifidae)) + ((Piscicolidae + Ozobranchidae) + Glossiphoniidae)) + Acanthobdellida).
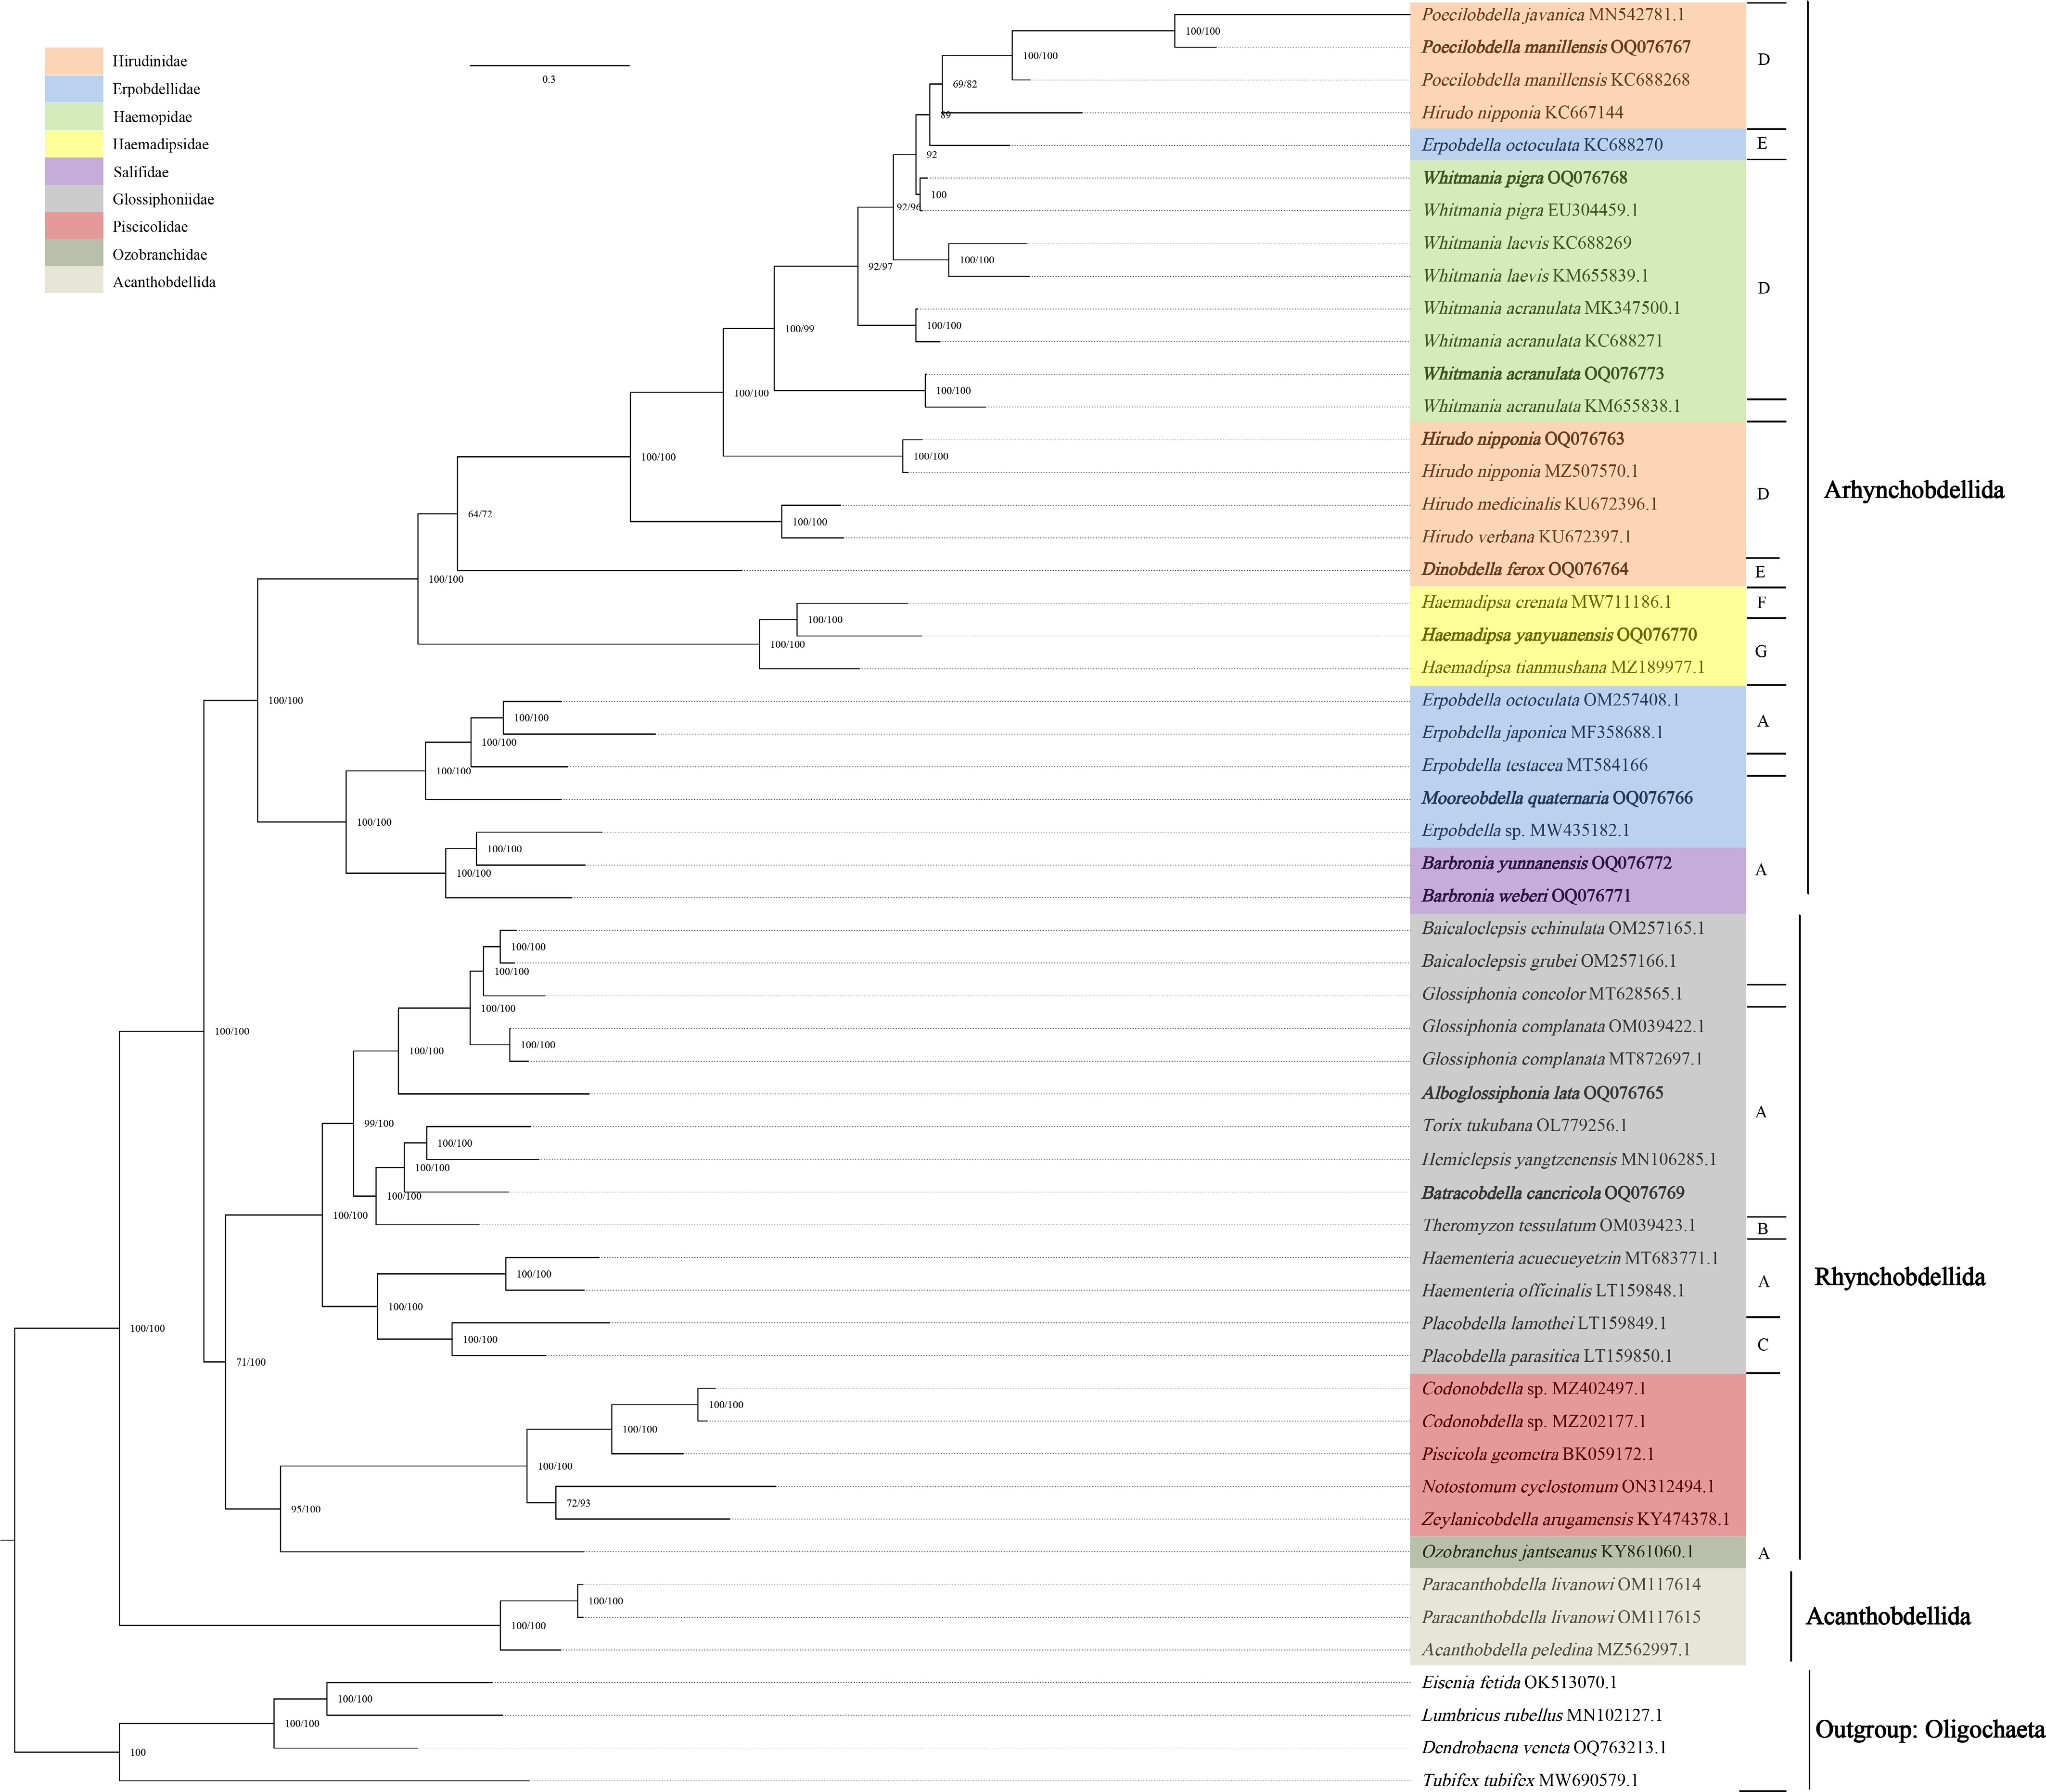
Figure 4.
Maximum likelihood phylogenetic relationships inferred from all positions of PCGs and two rRNAs (PCGrRNA). Numbers are ML bootstrap and BI PP values. A-G represent the corresponding gene order patterns in Fig. 5. Different colors represent different families in Hirudinea. The 11 newly sequenced sequences were displayed in bold.
The gene rearrangement patterns (Fig. 5) of leech mitogenomes were analyzed. Two records of E. octoculata (accession numbers: OM257408 and KC688270) exhibited two different genetic arrangements (patterns A and E). The patterns included transposition between genes (trnY/G, trnS2/A, and trnK/I), single gene translocation (trnC and trnR), and gene addition (trnD). To infer the ancestral gene order for this group, we mapped the seven gene order patterns onto the phylogenetic tree. The result (Fig. 4) showed that pattern A was not only the most widespread pattern (all the sampled Acanthobdellida species, most sampled Rhynchobdellida species, and the basic lineages of Arhynchobdellida) but also present within the outgroups and the basal lineages of Hirudinea. In contrast, patterns B−G exhibited varied distribution among taxa, with no consistent association between most patterns and phylogenetic clades, except for pattern C, which was recovered within a well-supported monophyletic group. This phylogenetic distribution provides strong evidence that pattern A represents the ancestral gene order of the Hirudinea, from which the other arrangements were subsequently derived through independent rearrangement events. It is also challenging to determine the evolutionary history from pattern A to the others. In our study, the transposition between trnG and trnY represents a core change that occurred in the Arhynchobdellida lineage, sister to the clade containing Erpobdellidae and Salifidae after their divergence.
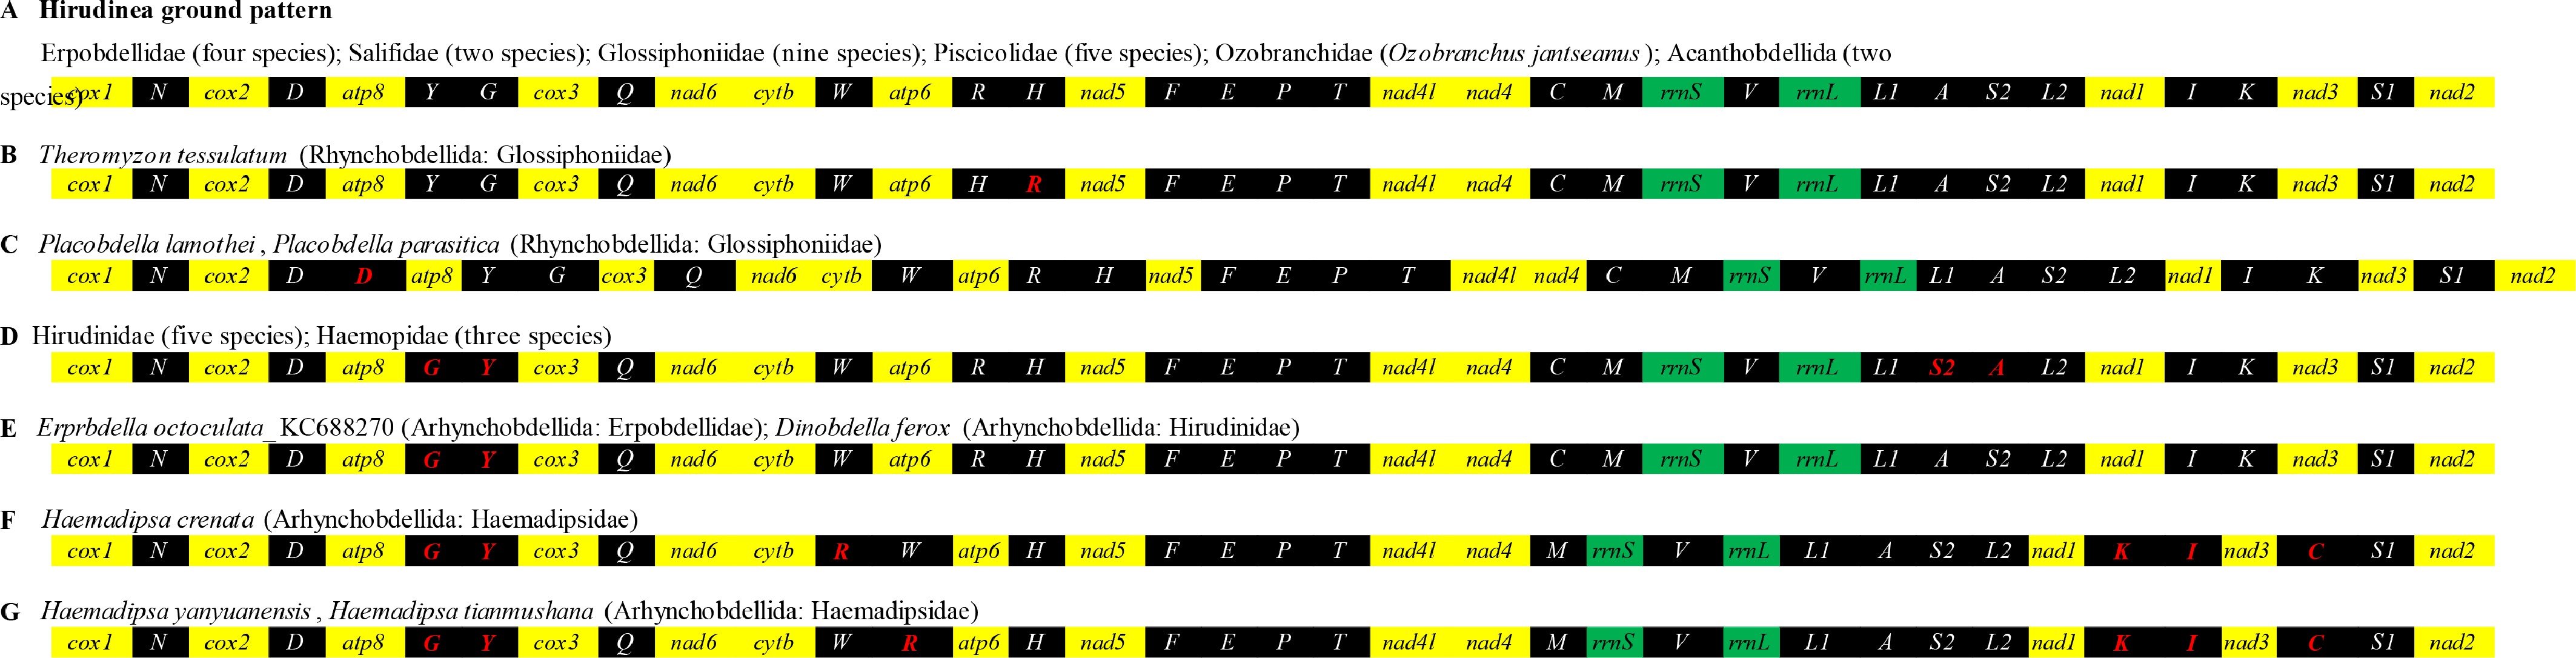
Figure 5.
Seven gene order patterns identified among the Hirudinea mitogenomes in this study. All genes are encoded on the same strand. PCGs, tRNAs, and rRNAs are marked by yellow, black, and green, respectively, and the rearrangements of tRNAs are shown in red.
Molecular identification based on COX1 of farmed medicinal leeches
Adulterants and genetic distances
-
The samples collected from different medicine markets were morphologically identified as Hi. nipponia, P. manillensis, D. ferox, W. acranulata, W. pigra, H. yanyuanensis, B. weberi, B. yunnanensis, A. lata, and Ba. cancricola, and the results of COX1 blasting are in agreement with the morphological work. The COX1 sequence of an unidentified species of Salifidae was reported for the first time. The adulterants, circulated in the medicine material market as 'Liaoning leech', were molecularly identified as M. quaternaria (accession number: OR578866).
In this study, genetic distances based on COX1 were calculated at the species level (Supplementary Table S11). The largest mean intraspecific difference was found in Whitmania laevis (15.98%); samples of the same species from adjacent locations show the smallest intraspecific difference (0), such as Hi. nipponia (between OR578849 and OR578850) and W. acranulata (between KM655838 and OR578891). The interspecific distances ranged from 0.15% to 31.03%. The lowest interspecific distance was found between W. acranulata (KC688271) and W. pigra (KC688269). Low interspecific distances were also observed between other species pairs, such as Hirudinaria thailandica (OM415428) vs P. javanica (MN542781) (0.61%) and Erpobdella parva (MN613025) vs Erpobdella dubia (AF116023) (0.79%). The highest interspecific variation (31.03%) was found between Unoculubranchiobdella expansa (MK386574) belonging to Rhynchobdellida and Hi. nipponia (OR578853) belonging to Arhynchobdellida.
Genetic distances at the genus level were also calculated based on COX1 (Supplementary Table S12). The highest intrageneric variation (21.51%) was found in Hirudo, and the highest average intrageneric variation (17.87%) was observed in Batracobdella. The highest intergeneric variation (27.96%) was between Hirudo and Unoculubranchiobdella, while the lowest intergeneric variation (11.34%) was found between Tyrannobdella and Myxobdella.
Phylogenetic trees of COX1
-
The phylogenetic relationships of farmed Hirudinea based on COX1, inferred from analyses of 190 Hirudinea sequences representing 34 genera, were not fully consistent with the morphological identifications. Four outgroup species were clearly separated from Hirudinea in both NJ and ML trees. The topologies of the two trees were essentially the same at the species level (Fig. 6; Supplementary Fig. S13). At the family level, only Haemadipsidae, Erpobdellidae, Salifidae, and Glossiphoniidae were recovered as monophyletic (Supplementary Fig. S13). In contrast, Hirudinidae and Haemopidae were resolved as non-monophyletic, with their constituent genera interspersed among other lineages. Given this instability, the internal topologies of these non-monophyletic families are not discussed in detail here. At the genus level, the phylogenetic framework of Hirudinea consistently recovered 3 orders comprising 34 genera with high support values, among which the genera Whitmania, Haemopis, Limnatis, Tritetrabdella, Haemadipsa, Salifa, Dina, Trocheta, Glossiphonia, Theromyzon, Batracobdelloides, and Hemiclepis were monophyletic. Erpobdella was not monophyletic in both ML and NJ analyses, consistent with the overall pattern of non-monophyly observed in several genera.
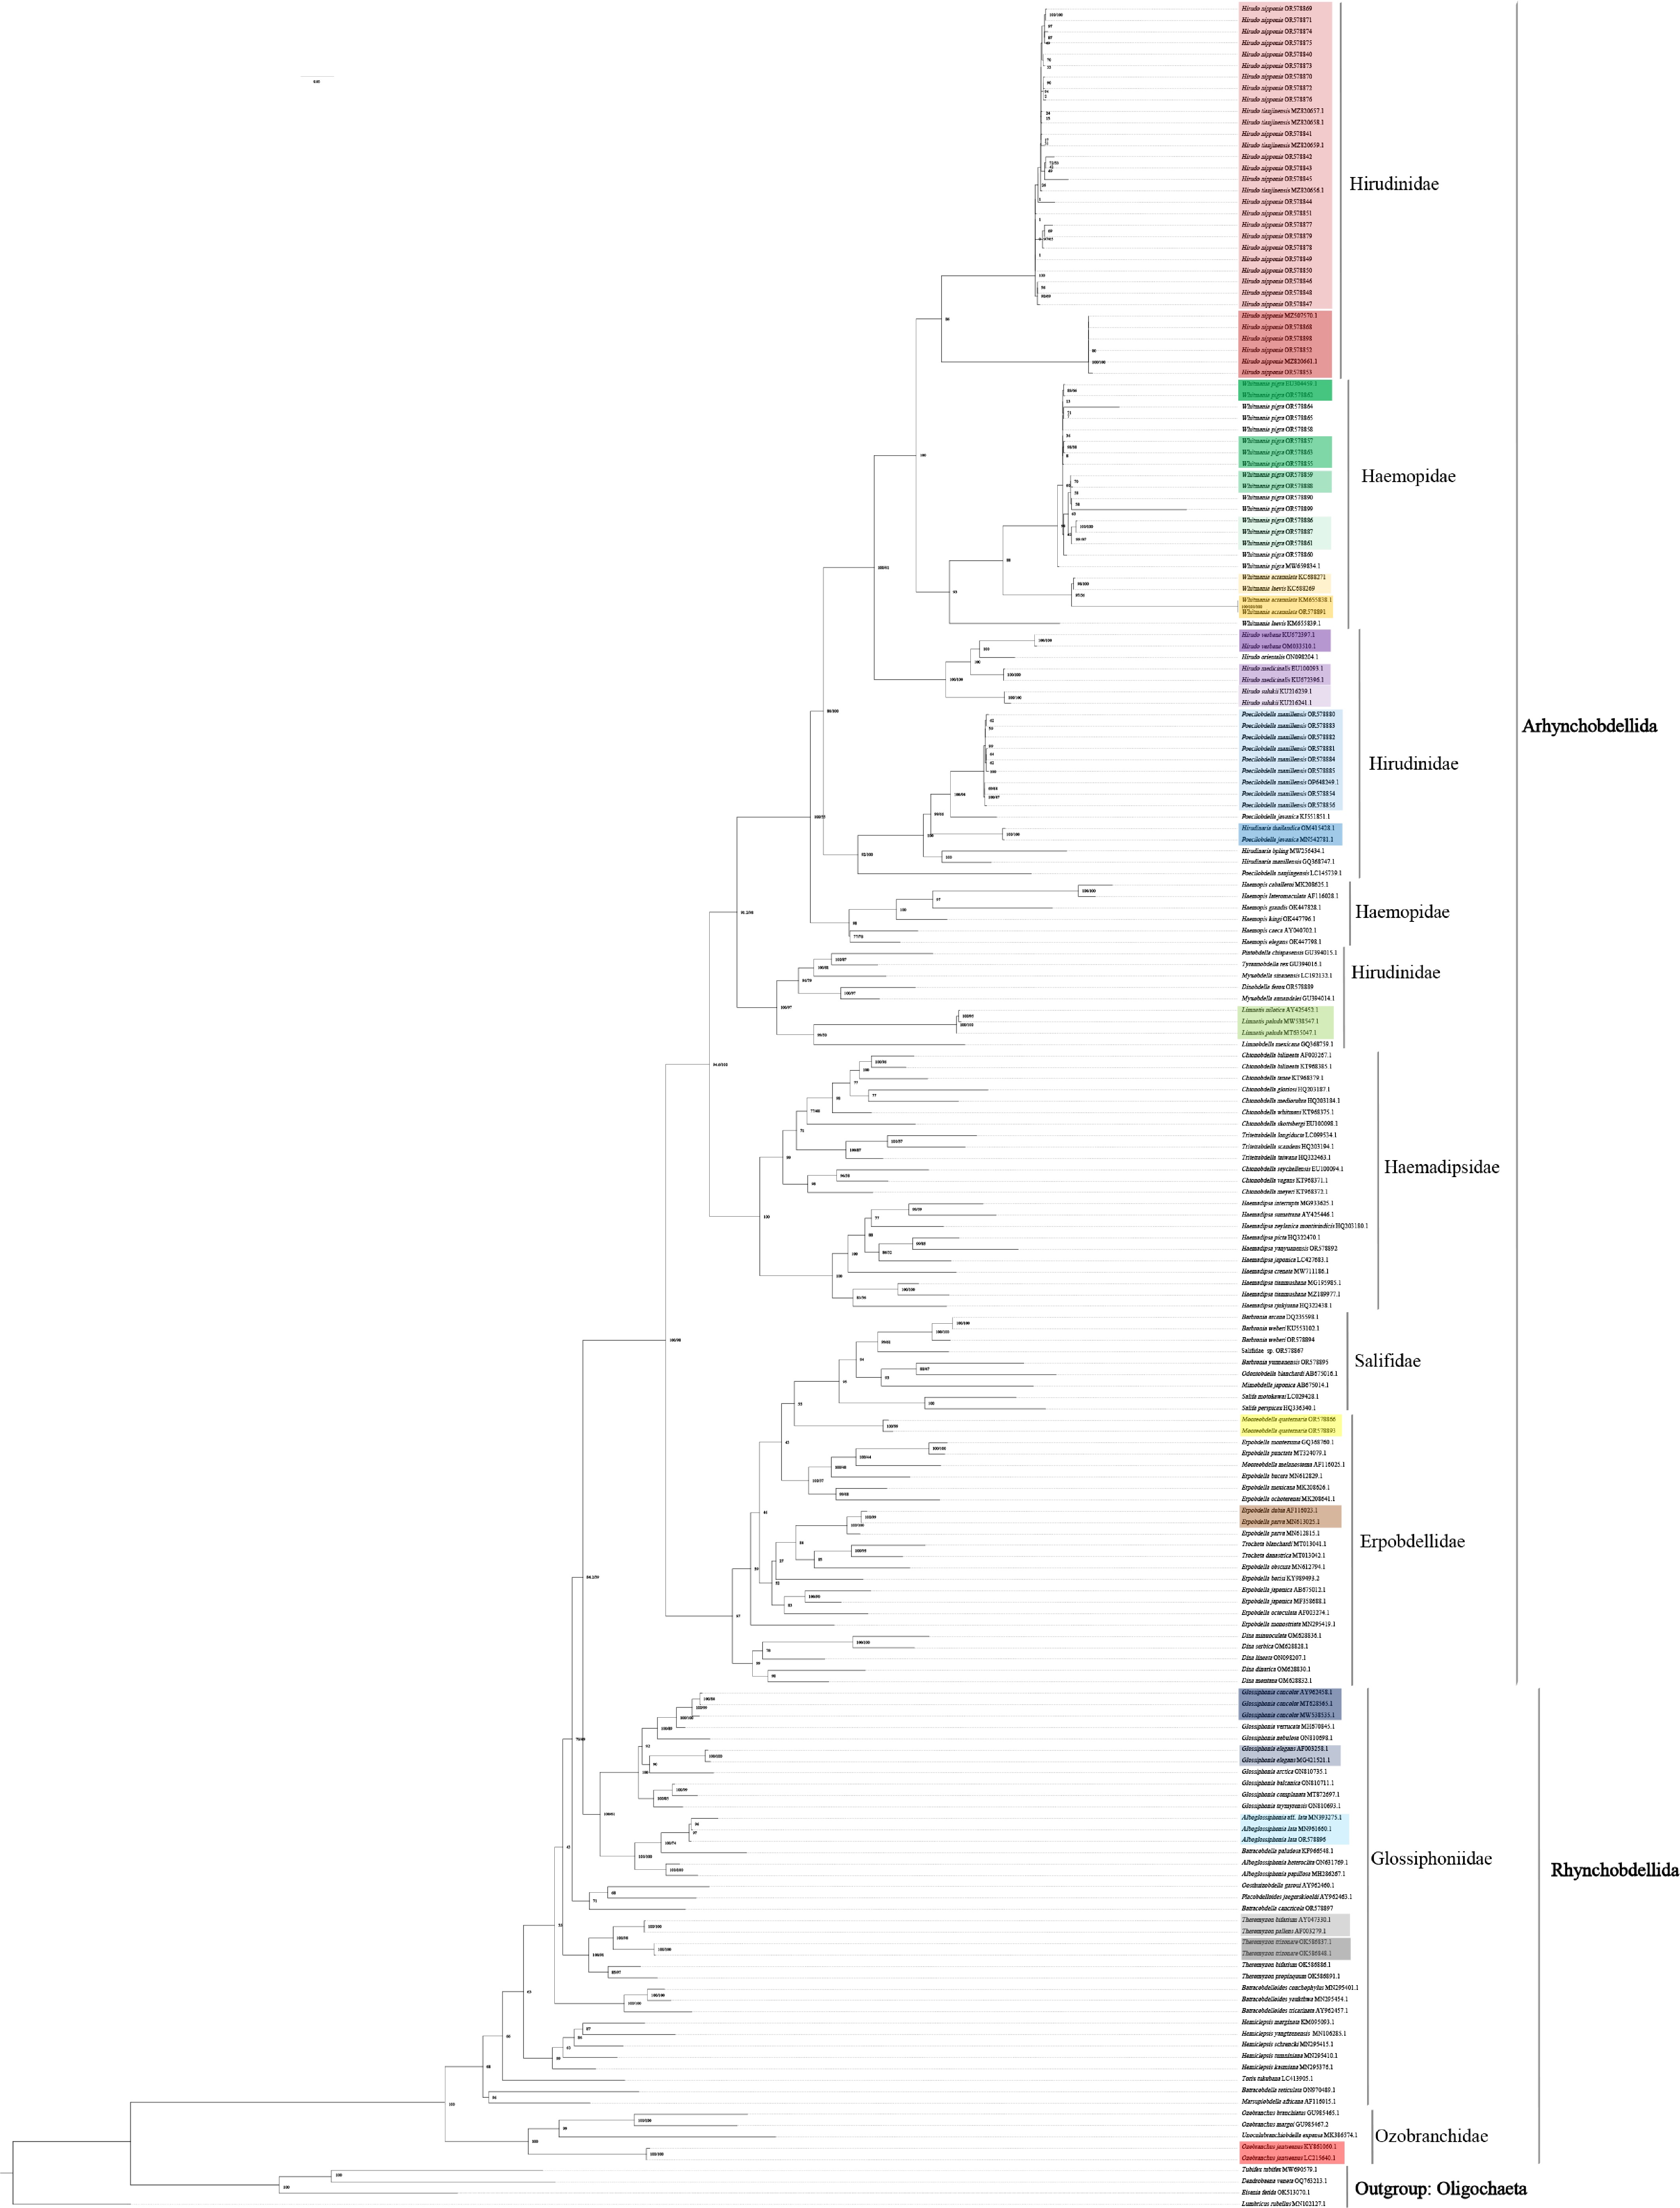
Figure 6.
Maximum likelihood phylogenetic tree based on 190 Hirudinea COX1 sequences. Numbers are bootstrap values. Species represented by the same color block are delimited as a single MOTU (molecular operational taxonomic unit) by species delimitation analysis, and each unmarked species corresponds to an individual MOTU.
The PTP-ML species delimitation analysis identified 127 distinct species (Supplementary File 1). Twenty-nine Hi. nipponia specimens were delimited into two species, while 17 W. pigra specimens were assigned to 11 species. The delimitation results of other species largely aligned with morphological identification outcomes (Fig. 6).
-
The mean AT content of PCGs from 51 leech species was 73.16%, greater than the average for all other reported annelids (61.13%–68.14%)[53−55]. The strand asymmetry pattern observed in leeches (Supplementary Table S9)—a consistently negative AT skew alongside a variable GC skew—appears to be largely congruent with the most annelid condition[56]. However, the uniformity of the AT skew across all sampled Hirudinea species may represent a more extreme or fixed state of this ancestral bias, potentially linked to their specialized evolutionary history as a derived clade within annelids. The ω value for all PCGs was lower than 1, indicating that purifying selection is guiding the evolution of these genes. As a result, all PCGs could be used in the phylogenetic analyses. Heterogeneous sequence analysis revealed two key findings. First, comparison of sequence evolutionary heterogeneity between the outgroup (Oligochaeta) and the leech ingroup supported the rationale for outgroup selection. Second, among the three codon positions of PCGs, the third codon site exhibited significantly higher heterogeneity than the first and second sites, consistent with its exceptionally high AT content. This finding justified the use of differential datasets (e.g., PCG12) in subsequent phylogenetic analyses to mitigate the impact of saturated sites and avoid systematic errors from uneven evolutionary rates.
The mitochondrial gene order in leech species predominantly follows pattern A (the most widely distributed pattern of Hirudinea mitochondrial gene arrangement in our study), which previous studies have identified as the ancestral arrangement for Hirudinea[57]. Deviations from this ancestral pattern (e.g., patterns B and C) represent derived rearrangement events within specific lineages (Figs 4, 5). The history of gene arrangement may not be consistent with the results of phylogenetic analysis of the investigated species. However, this result provides valuable information for understanding the phylogenetic relationships among species of Hirudinea.
The mitochondrial gene rearrangement patterns observed in this study among leeches, which were primarily caused by translocations of tRNAs, can be interpreted through established mechanisms of mitochondrial genome evolution. The most widely accepted model is the Tandem Duplication-Random Loss (TDRL) model, which posits that a tandem duplication of a genomic region occurs, followed by the random loss of redundant gene copies, thereby altering the gene order[58]. In some instances, gene loss may not be entirely random but exhibits certain biases, as suggested by the Duplication-Nonrandom Loss model[59]. Furthermore, growing evidence indicates that homologous recombination may serve as a significant driver of mitochondrial gene rearrangements in invertebrates[60]. These mechanisms have been invoked to explain structural variations in the mitochondrial genomes of various invertebrate groups, including sipunculans and other annelid taxa[61−63]. Although the precise molecular mechanisms warrant further validation, these models provide a robust theoretical framework for understanding the dynamic evolution of mitochondrial architecture within Hirudinida.
The results of intergeneric genetic distance based on 13 PCGs showed high consistency with the phylogenetic relationship (Fig. 4). The lowest intergeneric distance was observed between Glossiphonia and Baicaloclepsis, consistent with the phylogenetic tree in which these two genera clustered into a monophyletic clade with high support (100%). This finding indicated that the two genera likely share a relatively recent common ancestor[64], providing crucial molecular support for traditional morphological classification. However, the 'monophyly' of this clade still requires rigorous future testing by integrating morphological data and incorporating a more comprehensive set of taxa[65].
The recovery of established relationships, such as the H. medicinalis-H. verbana sister clade[18], validates the reliability of our phylogenetic analyses using mitogenomes. With this established phylogenetic foundation, we continue to explore the new insights revealed by our data. The first reported mitogenome resources for B. weberi, D. ferox, M. quaternaria, and Ba. cancricola provide more detailed information, contributing to the further refinement of Hirudinea relationships and phylogenetic studies within Arhynchobdellida and Rhynchobdellida. The results of phylogenetic analyses in this study were mainly consistent with previous studies based on 13 PCGs or complete mitogenomes[57,66,67]. Most of the newly sequenced species were clustered with previously published records of the same species, such as W. acranulata, W. pigra, and Hi. nipponia (Fig. 4).
Arhynchobdellida comprised two distinct clades. The first clade included Erpobdellidae and Salifidae. Five records of Erpobdella fell into three different groups. E. octoculata (KC688270) clustered together with Poecilobdella, which is similar to a previous study[68], and it showed an obviously different gene arrangement pattern to other Erpobdella species (Fig. 5). Similarly, KC688270 exhibited both high intraspecific (25.6% between KC688270 and OM257408) and intrageneric distances (25.4% between KC688270 and the other Erpobdella species) (Supplementary Table S7), which indicated that KC688270 may be a misidentified specimen or an erroneous record. The second clade within Arhynchobdellida contained three families (Hirudinidae, Haemopidae, and Haemadipsidae). Our study indicated that neither Hirudinidae nor Haemopidae form monophyletic groups, which has been discussed in previous research[66,69]. Specifically, the genera Poecilobdella and Hirudo within Hirudinidae did not cluster together but instead intertwined with the genus Whitmania from Haemopidae. This complex cross-family topology indicates that the current morphologically based family-level classification fails to fully reflect their true evolutionary history, and revision based on multi-gene data is warranted.
Rhynchobdellida exhibited monophyly in the phylogenetic analyses, and most species shared a conserved gene arrangement pattern A, with only three species exhibiting tRNA duplication and translocation. The insufficient species representation hinders in-depth investigation into its internal phylogenetic relationships. Acanthobdellida shared the same gene arrangement pattern (pattern A) as most Rhynchobdellida species, which may represent a shared ancestral trait inherited from a common ancestor. However, phylogenetic analyses placed Acanthobdellida outside both Rhynchobdellida and Arhynchobdellida, forming a unique clade in the Hirudinea phylogenetic trees, which was also reported in a previous study[57]. This finding supports the classification of Acanthobdellida as an early-diverging lineage in Hirudinea, and its ancestral gene arrangement pattern may reflect a relatively conserved mitogenome evolutionary history.
The complicated relationships and diverse mitochondrial gene arrangement patterns observed in Hirudinea may be related to some rapid evolutionary events that coincided with the species diversity and close relationships in the leech lineage. However, it was unclear whether the change in mitochondrial gene arrangement was a cause or a consequence of rapid evolution. More sequence resources and comparative studies on biological characters among those species may shed light on this question.
Molecular identification of farmed medicinal leeches using COX1
-
Compared to other PCGs, the COX1 gene has evolved slowly (Fig. 2b). Several studies have reported DNA barcoding-based identification of annelids[9,31,70,71], and DNA barcoding based on COX1 has been used in previous studies to identify Hirudinea species[72−74]. In this study, a total of 190 Hirudinea sequences were used, of which 60 were collected from 19 areas in China, and the potential of COX1 for identifying farmed medicinal leeches was evaluated. Pairwise genetic distances among the studied leech species ranged from 0% to 31.0%, with a mean of 21.5% (Supplementary Table S11). The significant difference between the average intraspecific (6.2%) and interspecific distance (22.0%) indicates that DNA barcoding is generally effective for leech species identification. However, the high maximum intraspecific variation (19.4%) and the overlap between intraspecific and interspecific distance ranges suggest that cryptic diversity may exist within some species, or that closely related species were difficult to distinguish only based on COX1. The results highlight both the utility and limitations of single-gene barcoding in leech taxonomy, emphasizing the necessity of employing multi-gene strategies for complex taxonomic units.
Phylogenetic relationships inferred from COX1 fragments should be interpreted within the broader framework provided by our mitochondrial genome analyses. Despite differences in sampling, the consistent recovery of monophyly in families such as Haemadipsidae, Salifidae, and Ozobranchidae validates the utility of COX1 for higher-level taxonomic classification in many contexts. Conversely, regions of low resolution or inconsistency in the COX1 trees empirically highlight its inherent limitations in resolving ancient divergence events, underscoring the importance of multi-gene or genomic data for reliable deep phylogenetic studies.
Some morphologically distinct species (each with no more than three specimens, such as P. javanica, B. weberi, and Erpobdella japonica) failed to be defined as a single MOTU in the species delimitation analysis. This may stem from the COX1 marker being insufficient to distinguish recently diverged species or from undiscovered taxonomic complexity. In addition, significant intraspecific splitting was observed in the genus Whitmania and Hi. nipponia. Seventeen specimens morphologically identified as W. pigra were delimited into 11 MOTUs, indicating significant cryptic diversity or potential misidentification[33,75]. Furthermore, W. acranulata (KC688271) and W. laevis (KC688269) were delimited into one MOTU with high clade support (Fig. 6; Supplementary Fig. S13), suggesting possible synonymy or hybridization events. Similarly, the samples of Hi. nipponia from different locations were clustered into different subgroups, and the newly reported Hi. tianjinensis was nested within them. The clade including sequences OR578852, OR578898, OR578868, MZ507570, MZ820661, and OR578853 was clearly divergent from the remaining Hi. nipponia samples, with intraspecific distances exceeding 17.5%. The species delimitation results of Hi. nipponia and Hi. tianjinensis samples identified two distinct MOTUs: (1) Hi. nipponia (OR578852, OR578898, OR578868, MZ507570, MZ820661, and OR578853), and (2) the remaining Hi. nipponia samples and Hi. tianjinensis, which aligned with the results of phylogenetic analysis. More evidence from morphological and molecular investigations is required before concluding that Hi. nipponia has evolved into two species. The other Hi. nipponia samples, which clustered with Hi. tianjinensis, leave open the possibility of an unidentified subspecies or cryptic species closely related to Hi. tianjinensis. Hi. tianjinensis has long been misidentified as Hi. nipponia in Tianjin and Hebei due to their morphological similarity, until it was described as a new species in our previous study[9]. The existence of Hi. tianjinensis raises the question of whether the Hi. nipponia group in the traditional medicine markets contains other cryptic species. Overall, these findings indicate that while the COX1 barcoding could be used for preliminary diversity screening, clarifying the complex species boundaries among leeches requires integrated analysis combining morphological, ecological, and multi-gene data.
In the markets, most P. manillensis samples come from Yangjiang, Guangdong. This limited geographic sampling range hindered the analysis of genetic distance among P. manillensis populations within China. The family Haemopidae was divided into two clades, Whitmania and Haemopis. In the ML tree, W. pigra (OR578899) formed a clade with W. pigra (OR578890) but exhibited a much longer branch, indicating substantial genetic divergence. Additionally, the average intraspecific variation between W. pigra (OR578899) and the other Chinese W. pigra samples was 10.9%, far higher than that among the other W. pigra samples collected in China (7.7%). These results indicate that further integrative data are needed to determine whether it represents a cryptic species or reflects extreme intraspecific variation.
Salifidae sp. (OR578867) from Fushun, Liaoning, was clustered with the clade of Barbronia. It cannot be identified by morphological characters, as the samples were processed for medicine rather than fresh specimens. A morphological study should be performed in the future to determine its species identity. In addition, two 'Liaoning leech' samples purchased from Liaoning were identified as M. quaternaria (OR578866 and OR578893), which has not been included in the catalogue of Chinese Pharmacopoeia (2020 Edition) and does not belong to the commonly used medicinal leeches. Their pharmaceutical value and safety as oral medicines are not clear, which may bring potential risks when applied as medicinal material. Therefore, COX1 could be used as an effective biomarker to distinguish such adulterants from common medicinal leeches.
-
This study presents a comprehensive analysis of the mitochondrial genomes of 11 Chinese leech species, significantly expanding the available mitogenomic resources for Hirudinea. By sequencing and comparing these genomes, the study uncovers seven distinct gene rearrangement patterns that partially align with leech phylogeny, suggesting evolutionary constraints or adaptive significance. The conserved regions and lineage-specific rearrangements identified highlight divergent evolutionary trajectories among leech lineages. The phylogenetic analyses clarify the relationships within Rhynchobdellida and Arhynchobdellida, corroborating morphological diversification. Furthermore, the study demonstrates the utility of COX1 sequences for molecular identification of medicinal leech species, supporting the authentication of medicinal resources. This work not only deepens our understanding of leech evolution but also provides practical tools for biodiversity conservation and sustainable utilization of medicinal leeches, underscoring the need for further investigation into the mechanistic drivers of mitochondrial gene rearrangements in leeches.
Not applicable.
-
Not applicable. This study does not involve vertebrate animals or human subjects. All samples were collected from invertebrates (leeches) and did not involve any endangered or protected species.
-
The authors confirm their contributions to this study as follows: conceptualization, methodology, investigation, funding support: Liu ZC; data curation, writing – original draft preparation: Luo YF; writing, funding support, reviewing, supervision: Meng FM; writing, reviewing and editing: Jallow BJJ, Liu MD, Tong XR; morphological identification, specimen collection, field management: Yang XL, Huang JJ, Cai JF. All authors reviewed the results and approved the final version of the manuscript.
-
The data that support the findings of this study are available in NCBI at https://ncbi.nlm.nih.gov, under accession numbers OQ076763–OQ076773 for 11 newly sequenced mitogenomes and OR578840–OR578899 for 60 COX1 DNA barcoding sequences.
-
The authors declare that they have no conflict of interest.
-
accompanies this paper online at https://doi.org/10.48130/jzser-0026-0006.
-
# Authors contributed equally: Zi-Chao Liu, Yi-Fei Luo
- Supplementary Table S1 List of the species included in the phylogenetic analysis of class Hirudinea.
- Supplementary Table S2 Taxonomic information of newly sequenced species in this study.
- Supplementary Table S3 Collecting locations and reference data of Hirudinea specimens for COX1 analysis.
- Supplementary Table S4 The sequence characteristics of mitochondrial genomes of 11 leeches.
- Supplementary Table S5 Best models were calculated by PartitionFinder2 of PCG12, PCGrRNA and PCG123 datasets.
- Supplementary Table S6 Best models were calculated by IQ-TREE of PCG12, PCGrRNA and PCG123 datasets.
- Supplementary Table S7 Interspecific distances among species and intraspecific distances within each species based on analysis of their 13 PCGs.
- Supplementary Table S8 Intergeneric distances among genera and intrageneric distances within each genus based on analysis of their 13 PCGs.
- Supplementary Table S9 Base composition of the first, second, third, and all codon positions of 13 PCGs of 51 leeches.
- Supplementary Table S10 The Ka, Ks, and Ka/Ks (ω) values for each PCG.
- Supplementary Table S11 Intra- and interspecific COX1 variation among related Hirudinea.
- Supplementary Table S12 Intra- and intergeneric COX1 variation among related Hirudinea.
- Supplementary Fig. S1 The collection regions of the 11 newly sequenced Hirudinea in this study.
- Supplementary Fig. S2 Hirudinea collected in the following areas for COX1 analysis.
- Supplementary Fig. S3 The 5 circular and 4 linear maps of 9 leech mitogenomes. Genes are characterized by different color blocks.
- Supplementary Fig. S4 Saturation analyses of 13 protein-coding genes (PCGs) and 2 tRNA genes in the 51 leech species, with GTR distance as abscissa and Transition (s) and Transversion (v) as ordinate.
- Supplementary Fig. S5 Non classic tRNA putative secondary structures in 11 newly sequenced mitochondrial DNA of leech species.
- Supplementary Fig. S6 Putative secondary structures of the 22 tRNAs identified in the mitogenome of 11 newly sequenced leeches.
- Supplementary Fig. S7 The relative synonymous codon usage (RSCU) of PCGs in leech mitogenomes.
- Supplementary Fig. S8 Phylogenetic relationships inferred from first and second codon positions of PCGs (PCG12). Numbers are bootstrap values calculated according to maximum likelihood method (ML tree).
- Supplementary Fig. S9 Phylogenetic relationships inferred from all codon positions of PCGs and 2 rRNAs (PCGrRNA).
- Supplementary Fig. S10 Phylogenetic relationships inferred from all codon positions of PCGs (PCG123). Numbers are bootstrap values calculated according to maximum likelihood method (ML tree).
- Supplementary File 1
- Supplementary Fig. S11 Phylogenetic relationships inferred from first and second codon positions of PCGs (PCG12). Numbers are posterior probabilities calculated according to Bayesian inference method (BI tree).
- Supplementary Fig. S12 Phylogenetic relationships inferred from all codon positions of PCGs (PCG123). Numbers are posterior probabilities calculated according to Bayesian inference method (BI tree).
- Supplementary Fig. S13 Neighbor Joining phylogenetic tree based on 190 Hirudinea COX1 sequences. Numbers are bootstrap values.
- Supplementary File S1 The results of PTP-ML species delimitation analysis identified 127 distinct species.
- Copyright © 2026 by the author(s). Journal of Zoological Systematics and Evolutionary Research published by Maximum Academic Press on behalf of John Wiley & Sons Ltd. This is an open access article under the terms of the Creative Commons Attribution License, which permits use, distribution and reproduction in any medium, provided the original work is properly cited.
-
About this article
Cite this article
Liu ZC, Luo YF, Jallow BJJ, Liu MD, Tong XR, et al. 2026. Leech mitochondrial genomes: phylogeny, evolutionary implication, and medicinal species identification via DNA barcoding. Journal of Zoological Systematics and Evolutionary Research 2026: e006 doi: 10.48130/jzser-0026-0006 

Leech mitochondrial genomes: phylogeny, evolutionary implication, and medicinal species identification via DNA barcoding
- Received: 11 August 2025
- Revised: 06 July 2026
- Accepted: 14 July 2026
- Published online: 28 August 2026
Journal of Zoological Systematics and Evolutionary Research
2026,
Article number: e006 (2026)
|
Cite this article
Abstract: Despite their ecological and medicinal importance, comprehensive studies on leech mitochondrial genome evolution remain scarce. This study provides novel insights into the evolutionary dynamics of leech mitogenomes through comprehensive sequencing and comparative genomic analyses. We present mitochondrial genomes of 11 Chinese leech species (including Barbronia weberi, Dinobdella ferox, Mooreobdella quaternaria, and Batracobdella cancricola for the first time), significantly expanding the mitogenomic resources for Hirudinea. High-throughput sequencing and systematic annotation revealed seven distinct gene rearrangement patterns, which did not fully correspond to the established leech phylogeny, suggesting potential evolutionary constraints or adaptive significance. The mitochondrial heavy strand (H-strand) coding phenomenon was found in all those species. Phylogenetic analyses revealed clear relationships among the three orders, resulting in a topology of ([Rhynchobdellida + Arhynchobdellida] + Acanthobdellida). Haemadipsidae, Glossiphoniidae, and Piscicolidae were found to be monophyletic. Notably, we present a fully resolved and robustly supported phylogenetic tree for Rhynchobdellida, significantly consolidating the current consensus on its internal relationships. Furthermore, species identification using cytochrome c oxidase subunit 1 (COX1) sequences, based on a total of 190 sequences (including 60 newly obtained in this study across 19 regions in China), demonstrated its potential discriminating power in authenticating medicinal leech resources. This work not only enriches the mitogenome resources for studying leech evolution but also offers practical tools for biodiversity conservation and sustainable utilization of medicinal leeches.
-
Key words:
- Hirudinea /
- Mitogenome /
- Molecular phylogeny /
- Gene arrangement /
- Medicinal leech