













-
Seasonal regulation of reproductive activity is a widespread phenomenon across the animal kingdom, serving as a fundamental adaptive strategy to cope with periodic environmental fluctuations[1−4]. Seasonal reproduction ensures that energetically costly reproductive processes are synchronized with favorable environmental conditions, thereby maximizing reproductive efficiency[2,3,5]. It also enables organisms to balance reproductive investment with somatic maintenance in response to predictable environmental constraints[4,5]. This physiological coupling between energy allocation and reproductive suppression enables resource redirection during non-breeding periods[4,6,7]. By actively suppressing reproductive system development and function in non-breeding seasons, animals markedly reduce energy expenditure and prioritize survival processes; rapid reactivation during breeding seasons aligns reproduction with optimal windows for offspring survival[4,8−10]. Consequently, the reversible transition between breeding and non-breeding states, centered on reversible reproductive quiescence, represents a critical evolutionary trade-off mechanism balancing reproductive success against individual survival[4,5,11].
While seasonal breeding is not exclusive to mammals and occurs broadly in birds, reptiles, amphibians, and certain fish, primarily driven by seasonal variations in photoperiod, temperature, and food availability[1−3,12,13], mammalian seasonal reproduction displays greater physiological complexity. In mammals, reproductive cycles are intricately coupled to the hypothalamic–pituitary–gonadal (HPG) axis, energy metabolism, and thermoregulation[4,14−16]. As the primary effector organ of the HPG axis, the testis plays a central role in translating systemic endocrine signals into coordinated cellular processes that govern spermatogenesis and steroidogenesis[6,9,10]. Seasonal transitions are therefore ultimately manifested in the testis, where coordinated regulation of germ cell differentiation, metabolic activity, and the local microenvironment governs reproductive output[9,17,18]. Emerging evidence suggests that, rather than involving large-scale loss or regeneration of cell lineages, seasonal testicular remodeling may rely on reversible modulation of cellular states and differentiation trajectories, coupled with coordinated metabolic and microenvironmental reprogramming[8−10,17].
Previous molecular investigations into testicular function in seasonally breeding mammals have predominantly examined hormonal regulation, signaling pathways, and bulk tissue-level transcriptomics, yielding valuable insights into broad gene expression patterns linked to reproductive cycles[8,10,11,19,20]. However, these approaches are inherently limited in resolution. The testis is a highly heterogeneous organ, comprising germ cells at diverse developmental stages and multiple somatic support cell types. Bulk RNA-seq cannot discern whether observed transcriptional shifts result from alterations in cellular composition (e.g., loss or gain of specific populations) or from reprogramming of transcriptional programs within persistent cell types[17,18,20]. Moreover, it remains unresolved whether changes in germ cell lineages and the somatic microenvironment occur synchronously or exhibit differential dynamics during seasonal transitions[9,10,17]. The emergence of single-cell and single-nucleus RNA sequencing (snRNA-seq) technologies now permits detailed characterization of complex tissue transcriptomes at cellular resolution, offering powerful means to dissect dynamic reproductive regulation[13,21−23].
The four-toed hedgehog (Atelerix albiventris) provides a compelling model for studying this trade-off, owing to its distinctive reproductive physiology that presents a striking physiological paradox[18]. As a seasonal breeder, this species exhibits pronounced cyclic transitions between reproductively active and inactive states, with the summer months (approximately May to September), characterized by high temperatures and extended photoperiods, corresponding to a reproductively active phase, whereas the winter period is marked by reproductive quiescence[18]. In addition, hedgehogs possess naturally undescended testes that remain within the abdominal cavity throughout life[24]. In the majority of scrotal mammals with complete testicular descent, cryptorchidism imposes elevated stress on spermatogenesis, increases oxidative stress, and heightens the risk of germ-cell apoptosis, consequently leading to irreversible spermatogenic failure[3,6,16,25]. Therefore, hedgehogs face unique physiological challenges. Despite the complex challenges posed by their seasonal reproductive cycles and naturally undescended testes, the cellular and molecular foundations governing this reversible process in hedgehogs remain poorly understood[9,17,20].
Here, the present study utilizes snRNA-seq to conduct a systematic comparison of testicular tissues from breeding and non-breeding periods in the four-toed hedgehog. We sought to determine whether seasonal transitions involve global remodeling or selective cellular reorganization by addressing two key questions: (1) To what extent is seasonal reproductive suppression driven primarily by structural rearrangements within the germ cell lineage, and does the somatic cell microenvironment remain relatively stable during this process? (2) At single-cell resolution, how are gene expression programs remodeled across distinct cell types to underpin the molecular basis of seasonal reproductive phenotypes? Resolving these questions provides a detailed characterization of testicular cell composition and gene regulatory programs in the four-toed hedgehog, a non-model species exhibiting seasonal reproduction. This work thereby offers new insights into the cellular and molecular mechanisms underlying seasonal reproductive regulation in mammals[4,11,15]. More broadly, these findings may also provide a theoretical basis for improving reproductive efficiency in economically important animals, including poultry and livestock, under suboptimal environmental conditions[13,18,20,23].
-
Testicular tissues from adult male four-toed hedgehogs (Atelerix albiventris) were used in this study. Samples were collected post-mortem from naturally deceased wild individuals found in the field during the reproductive and non-reproductive stages of the annual cycle, corresponding to August 27, 2025, and December 2, 2025, respectively. These sampling dates fall within the established breeding-active and reproductive-quiescent phases of this species.
Immediately after dissection, testicular tissues were placed into pre-chilled tissue preservation solution tubes, sealed with parafilm, and maintained under low-temperature conditions during transport. Upon processing, tissues were transferred into ice-cold PBS, and the tunica albuginea, connective tissues, and visible blood vessels were carefully removed to minimize contamination and tissue degradation. Samples were then rapidly frozen on dry ice and transported to the laboratory for nuclei isolation[26−28].
Frozen tissues were mechanically homogenized using a tissue grinder until no obvious tissue fragments remained. The homogenate was incubated on ice for 5 min in lysis buffer primarily containing Tris-HCl, NaCl, MgCl2, NP-40, and related surfactants, following the standard 10× Genomics single-nucleus RNA sequencing protocol[29−31]. The lysate was filtered through a 30 µm cell strainer, followed by centrifugation and washing. Density-gradient centrifugation was subsequently performed to enrich nuclei and obtain a clean nuclear suspension[26,32]. Nuclear quality was assessed using AOPI staining, and only preparations with intact nuclear membranes, clean background, and high structural integrity were retained for downstream analysis[28,32]. Final nuclei concentrations were adjusted to 700–1,200 nuclei/µL to meet loading requirements for library construction[27,33].
Single-nucleus transcriptome libraries were generated using the 10× Genomics Chromium Next GEM Single Cell 3 v3.1 reagent kit, with a target recovery of 6,000–8,000 nuclei per sample. Libraries were sequenced on the Illumina NovaSeq 6000 platform using paired-end 150 bp reads (PE150), with a minimum raw data output of 25 Gb per sample to ensure sufficient sequencing depth and transcriptome coverage[27,31,34]. Sequencing of the single-nucleus RNA-seq libraries generated 332,008,332 and 360,023,393 raw reads for the two samples, respectively. This yielded mean reads per nucleus of 38,854 and 43,086, with sequencing saturation of 64.5% and 68.0%. An estimated 8,545 and 8,356 nuclei were recovered, with median genes detected per nucleus of 816 and 866, and median UMI counts per nucleus of 1,982 and 2,118. These sequencing depth and saturation metrics confirmed sufficient coverage for downstream bioinformatic analyses.
Data quality control, filtering, and preprocessing
-
Initial data processing was performed using Cell Ranger v7.0.0 (10x Genomics) to generate the raw gene-barcode count matrix. Reads were aligned to a custom Atelerix albiventris reference genome (de novo assembled in-house for this study; unpublished) together with the corresponding custom transcriptome annotation to produce UMI counts.
Quality control and filtering were subsequently performed in R v4.2.0 using the Seurat package v4.3.0. Nuclei with fewer than 200 or more than 3,000 detected genes, mitochondrial gene content exceeding 15%, or abnormal UMI counts were excluded to remove low-quality nuclei. Potential doublets were further detected and removed using DoubletFinder v2.0.3, with the expected doublet rate estimated according to the number of nuclei loaded per sample.
After filtering, data normalization was carried out using SCTransform. Principal component analysis (PCA) was performed, followed by batch correction using harmonypy v0.0.9 (the Python implementation of the Harmony algorithm) to integrate the reproductive and non-reproductive datasets and correct for batch effects. Uniform Manifold Approximation and Projection (UMAP) was then applied for dimensionality reduction and visualization of cell clustering structure[35].
Subsequent analyses, including pseudotime trajectory inference and functional enrichment, were conducted using the following R packages: monocle3 (v1.3.7), miloR (v2.8.1), clusterProfiler (v4.12.6), ggplot2 (v3.5.1), patchwork (v1.2.0), and dplyr (v1.1.4).
Cell type identification and annotation
-
Cell types were manually annotated based on known marker gene expression patterns, literature reports, and cross-species conservation, combined with UMAP clustering results. Primary reference marker genes included those for spermatogonia (e.g., MOV10L1, RNF17, TEX101) (details provided in the Results section). SingleR and reference datasets (human/mouse testis single-cell atlases) were also used for auxiliary annotation to improve accuracy and consistency[36].
MetaNeighbor cross-validation of cell identity conservation
-
The MetaNeighbor R package (v1.18.0) was used with reproductive-stage cell types as the training set and non-reproductive-stage cells as the test set to compute AUROC values for each cell type, quantitatively assessing transcriptome similarity between cell types across the two periods. This algorithm evaluates cell-type conservation across datasets based on neighborhood overlap and is particularly suitable for comparing cell identity stability under different physiological states[37].
MiloR differential abundance analysis
-
The miloR package was used to construct a k = 50 neighborhood graph (PCA d = 30). Neighborhoods were built with prop = 0.15 sampling and counted. Because there were no biological replicates per sample, edgeR and DESeq2 could not be applied; instead, Fisher's exact test was used. For each neighborhood, a 2 × 2 contingency table (inside/outside neighborhood × Repro/NonRepro) was constructed to calculate two-sided p-values. log2FC was corrected relative to the global Repro proportion. SpatialFDR was approximated by BH correction. The significance threshold was FDR < 0.1. This method integrates seamlessly with the aforementioned single-nucleus sequencing data to resolve cell abundance dynamics during seasonal transitions.
Single-cell differential expression analysis
-
Seurat's FindMarkers function (Wilcoxon rank-sum test) was used to perform differential expression analysis at multiple scales, including the global level, spermatogonial subpopulations, early differentiation stages, and segmented late spermatids. Unless otherwise specified, differentially expressed genes were identified using the thresholds of adjusted p-value < 0.05 and |log2FC| > 0.5, with multiple-testing correction performed using the Benjamini–Hochberg (BH) method. The analysis was conducted directly on the integrated Seurat object and complemented the differential abundance results obtained from MiloR.
Differentially expressed genes, including significant DE genes or ranked Top 100 gene sets from targeted comparisons, were further subjected to Gene Ontology (GO; BP, MF, and CC) and Kyoto Encyclopedia of Genes and Genomes (KEGG) pathway enrichment analyses using the clusterProfiler R package (adjusted p-value < 0.05, BH method)[38]. GO analysis covered biological process, molecular function, and cellular component categories, whereas KEGG analysis focused on signaling pathways and metabolic networks. Enrichment results were visualized as bubble plots, bar plots, or network diagrams and interpreted in the context of reproductive biology.
Spermatogonial subtype re-clustering and specificity gene analysis
-
The spermatogonia subpopulation was extracted from the integrated Seurat object and grouped by reproductive and non-reproductive stages. Reproductive-stage specificity scores were calculated for each gene:
$ \rm{\rm {Specificity}}\_{\rm{score}} =\dfrac{Mean_{Reproductive} + \varepsilon} {Mean_{Reproductive }+ Mean_{NonReproductive} +\varepsilon}\;\; (\varepsilon = 10^{-6}) $ The top 100 genes ranked by specificity score were selected as reproductive-stage-biased genes for subsequent functional enrichment analysis. The FindClusters function (resolution = 0.5) was used to re-cluster spermatogonia, and subtypes were delineated in combination with UMAP visualization and known marker genes (SCML2, PARN, ERBB4, FSIP2, etc.). Fisher's exact test was used to assess the significance of proportion differences for each subtype between the two periods (p < 0.05)[39].
Pseudotime trajectory inference and dynamic analysis
-
The Monocle3 R package was used to construct pseudotime trajectories separately for the spermatogonial subpopulation, the continuous developmental spectrum from spermatogonia to primary spermatocytes, and late spermatids (Elongating spermatids to Mature spermatids)[40,41]. The Seurat object was first converted into a Monocle3 cell data set (CDS), and the existing PCA and UMAP embeddings were imported. Principal graph structures were learned using the learn_graph function (use_partition = FALSE, ncenter = 500–1,000). Root nodes were defined biologically, with undifferentiated/SSC-like cells used as the root for the spermatogonial trajectory, and cells expressing early elongating spermatid markers (SPATA16, DPY19L2, ZPBP, SPACA1, etc.) used as the root for the late spermatid trajectory. Pseudotime ordering was inferred using the order_cells function.
Trajectory-associated genes were identified using graph_test or generalized linear models (expression ~ pseudotime + stage), with significance thresholds of q < 0.05 and positive pseudotime coefficients, giving priority to genes elevated during the reproductive stage. For late spermatids, pseudotime trajectories were further divided into Early, Mid, and Late segments according to tertiles, and FindMarkers was applied independently within each segment to compare reproductive and non-reproductive stages. Global dynamic genes were additionally identified using graph_test (principal_graph) with q_value < 0.05 and Moran's I > 0.1. Season-specific dynamic expression patterns were visualized by fitted expression curves using ggplot2.
Pseudo-bulk expression profile correlation analysis
-
For each cell type, AggregateExpression (based on RNA counts) was used to generate Reproductive and NonReproductive pseudo-bulk expression profiles. After log1p CPM normalization, Pearson correlation coefficients were calculated (considering only genes with expression > 0). An r value closer to 1 indicates greater overall transcriptome stability of that cell type between the two periods.
Multi-metric comprehensive instability assessment
-
Four complementary metrics were normalized to the range 0–1: proportion of significant DA neighborhoods (MiloR), median |logFC| > 0.5 (MiloR), proportion of DE genes (Wilcoxon), and 1–Pearson r (pseudo-bulk). The composite instability index was the mean of the four metrics. Heatmaps were generated after sorting by this index. Germ cell lineage (Germ) and microenvironment cells (Microenvironment) were grouped for comparison, providing multi-dimensional quantification of seasonal instability.
Immune cell subpopulation re-clustering and comparative analysis
-
Immune cell populations annotated in the integrated Seurat object were extracted for focused re-analysis, including lymphoid and macrophage compartments. Cells were grouped into reproductive and non-reproductive stages, and sub-clustering was performed using the standard Seurat workflow described above. Subpopulations were annotated according to canonical marker genes. The lymphoid compartment consisted of T/NK cells characterized by TRBC1 and KLRK1, as well as a distinct mast cell population characterized by CMA1 and GATA2. For macrophages, four functional subpopulations were identified, including tissue-resident, metabolic, antigen-presenting, and inflammatory macrophages, based on representative markers such as APOE, DAB2, and RNF135.
Cellular proportions of each immune subpopulation were calculated and compared between reproductive and non-reproductive stages to evaluate seasonal alterations in immune cell composition DE analyses were then performed within each immune cell subtype showing stage-specific enrichment. To improve biological interpretability, predicted or uncharacterized genes beginning with EVM, LOC, LINC, novel, or ENSS were systematically excluded from downstream analyses.
Marker genes and differentially expressed genes identified from immune subpopulations were subjected to GO (BP, CC, and MF) and KEGG enrichment analyses using clusterProfiler, with the mouse annotation database (org.Mm.eg.db) used as a proxy reference. Comparative enrichment analysis across macrophage subpopulations was additionally conducted using compareCluster. Statistical thresholds and visualization procedures followed the general methods described above.
-
To investigate the cellular heterogeneity and seasonal transcriptional dynamics of testes in the four-toed hedgehog across reproductive and non-reproductive stages, we performed snRNA-seq using the 10× Genomics Chromium platform (Fig. 1a). Post-quality control and integration of both datasets yielded a total of 16,901 high-quality single nuclei, including 8,356 nuclei from the reproductive stage (average reads per cell: 43,086; median genes per cell: 866) and 8,545 nuclei from the non-reproductive stage (average reads per cell: 38,854; median genes per cell: 816). These sequencing metrics indicate adequate depth to capture low-abundance transcripts while maintaining high cell quality without excessive filtering. Following quality control, dimensionality reduction, and clustering, UMAP visualization demonstrated highly similar cell population distribution patterns between the two stages (Fig. 1b–d).
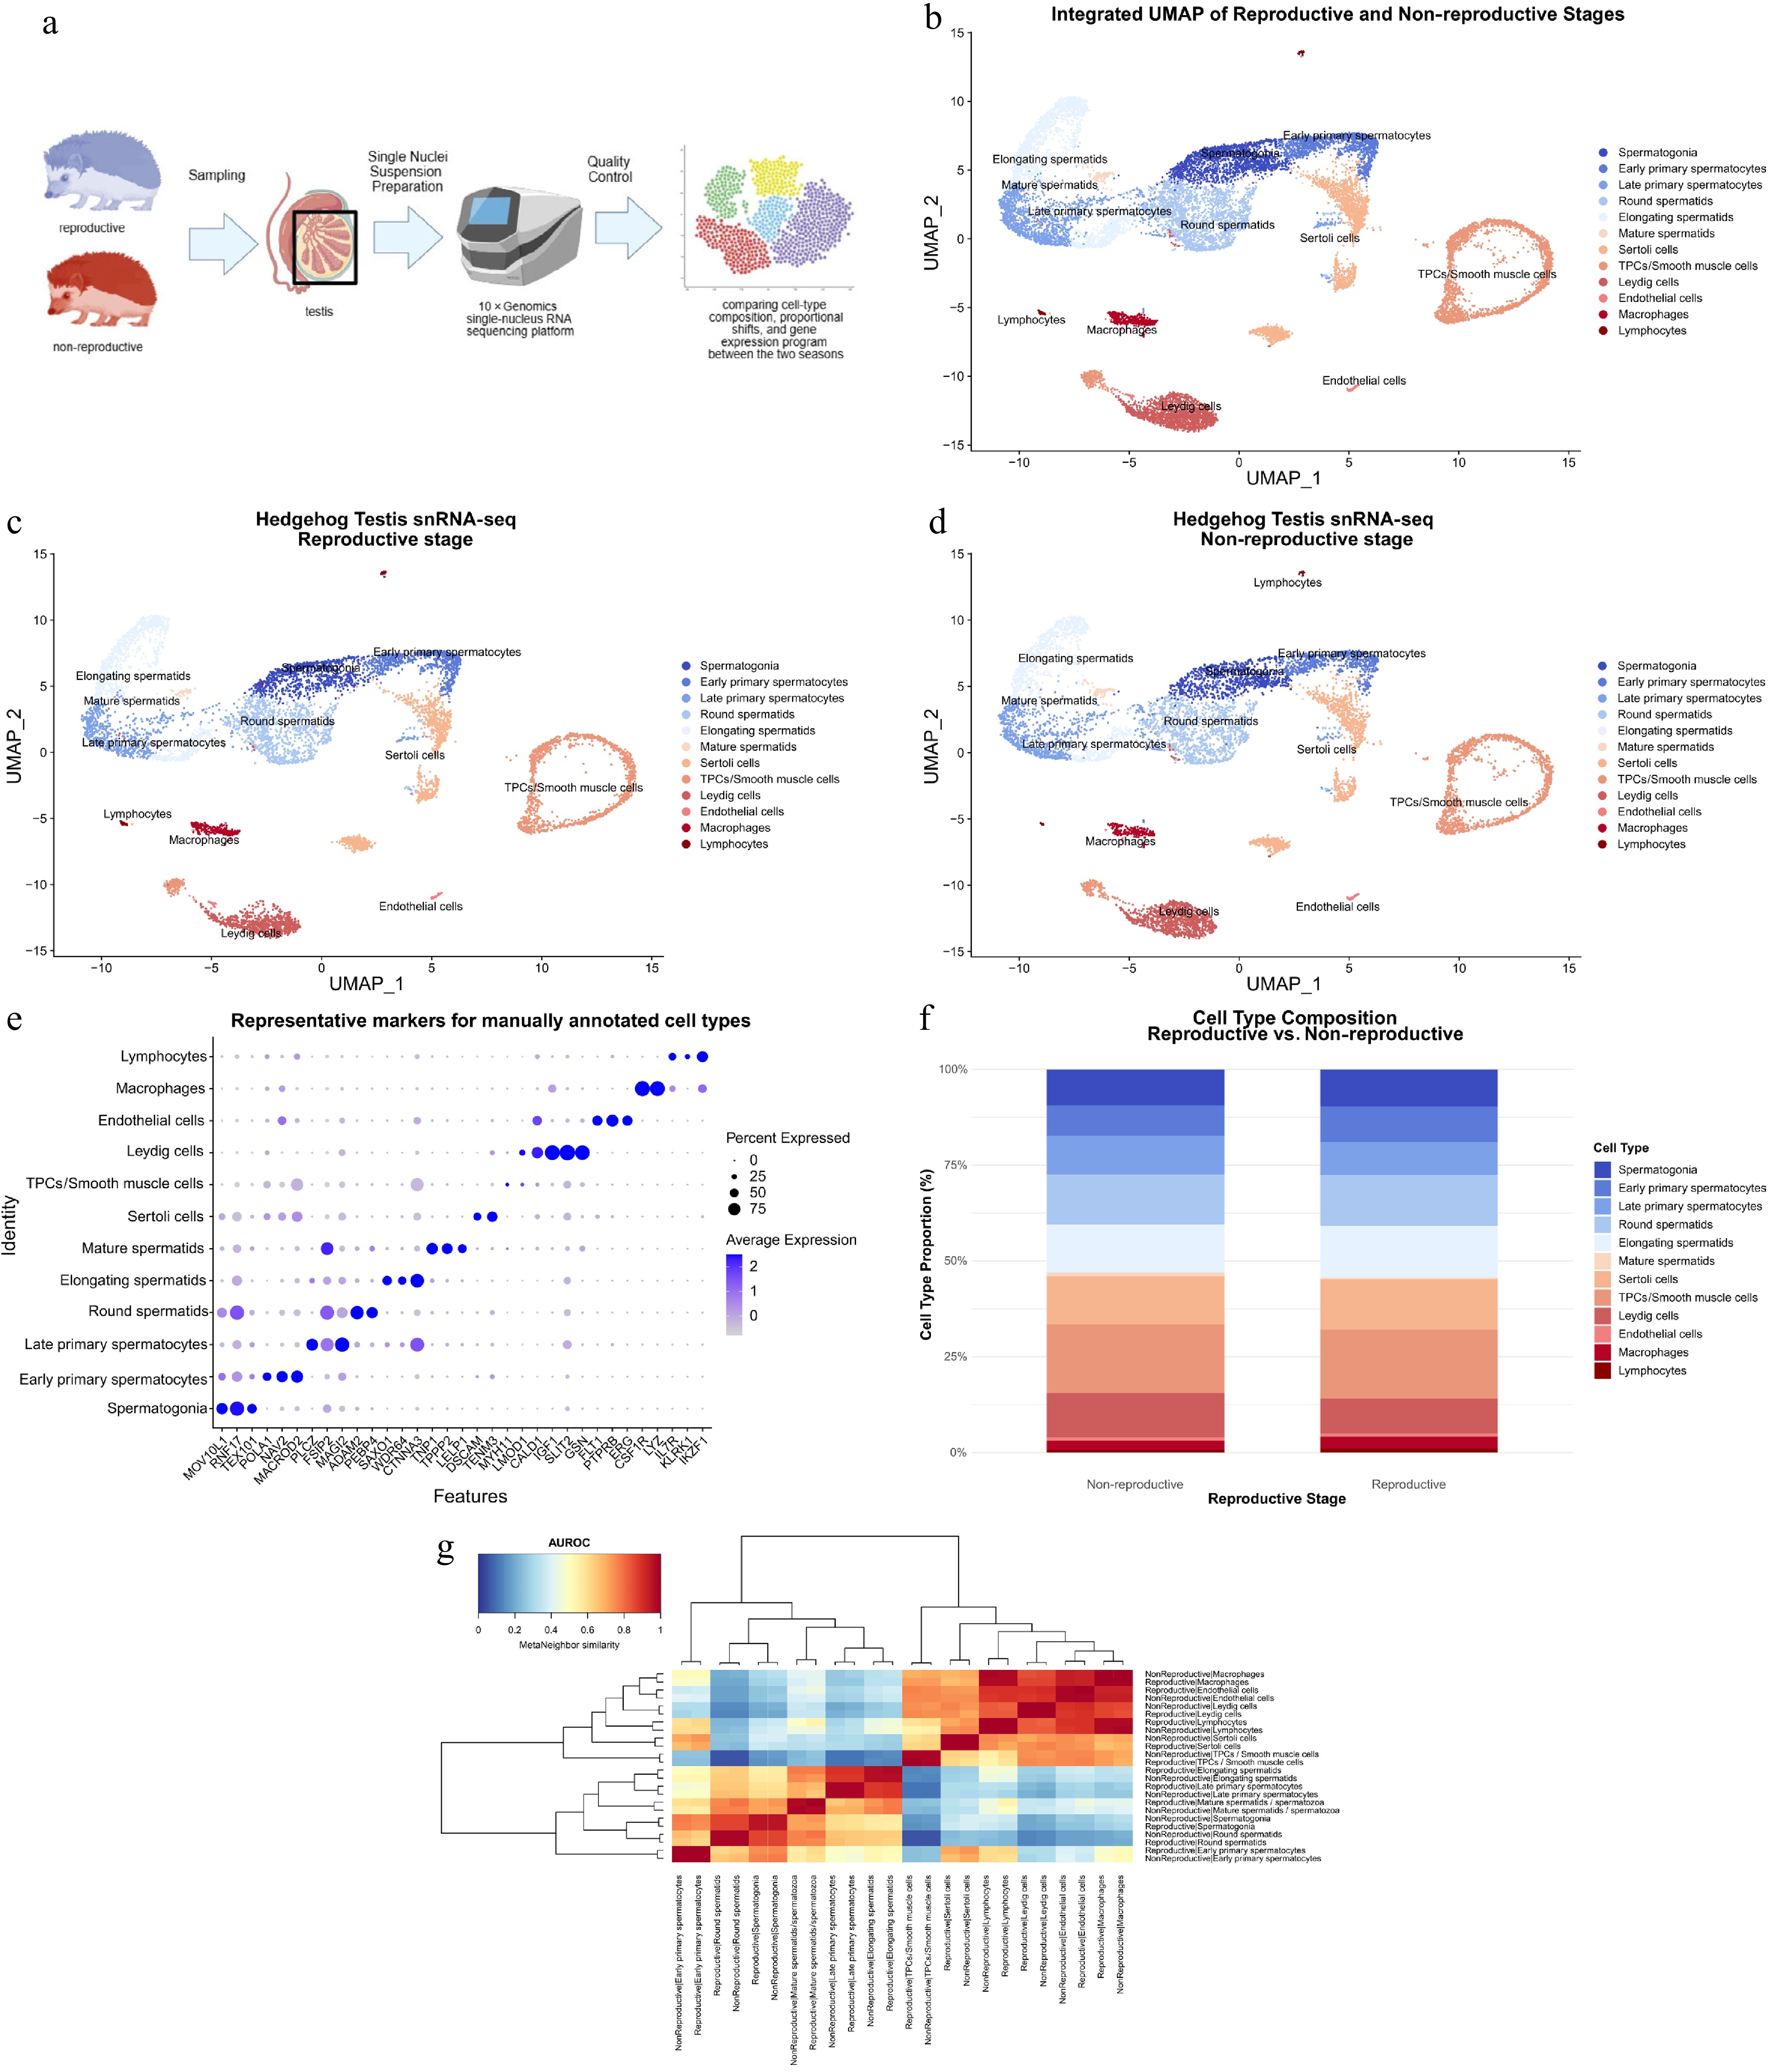
Figure 1.
Single-nucleus transcriptomic landscape of the testis across reproductive and non-reproductive stages. (a) Schematic workflow of the experimental design, including testis tissue sampling from individuals in reproductive and non-reproductive stages, single-nuclei suspension preparation, 10× Genomics snRNA-seq, and downstream bioinformatic analysis. Created with BioGDP.com[42]. (b) Integrated UMAP (Uniform Manifold Approximation and Projection) visualization of the combined dataset, showing the distribution of testicular cell populations. Twelve distinct cell clusters were identified, encompassing both germ cells and somatic cells. (c) Stage-specific UMAP plot illustrating the cellular distribution in the reproductive stage. (d) Stage-specific UMAP plot illustrating the cellular distribution in the non-reproductive stage. (e) Dot plot showing the expression of representative marker genes used for the manual annotation of the 12 cell types. The size of each dot represents the percentage of cells within a cluster expressing the gene (Percent Expressed), and the color intensity reflects the average expression level (Average Expression). (f) Comparison of cell type composition between reproductive and non-reproductive stages. The stacked bar chart shows the relative proportion (%) of each cell type, highlighting the shift in the cellular landscape during different reproductive cycles. (g) Heatmap of pairwise AUROC values from MetaNeighbor cross-validation of matched cell types across stages (average AUROC = 0.985), demonstrating high transcriptomic conservation.
Through the expression patterns of canonical and conserved marker genes (Supplementary Table S1), 12 major cell types were identified, encompassing a complete spermatogenic lineage (including spermatogonia, early primary spermatocytes, late primary spermatocytes, round spermatids, elongating spermatids, mature spermatids/spermatozoa) as well as key microenvironmental populations (Sertoli cells, peritubular myoid cells/smooth muscle cells, Leydig cells, endothelial cells, and immune cells) (Fig. 1e). The cell-type composition in the reproductive and non-reproductive stages is shown in Fig. 1f. All major cell types were fully retained in both stages, with no complete loss or de novo emergence of any cell lineage observed. These results suggest that seasonal reproductive transitions are not associated with major alterations in cellular lineage composition. The relatively consistent proportions of each cell type between stages indicate a stable cellular composition framework, which may provide a basis for maintaining overall testicular organization.
To further assess whether corresponding cell types also exhibit conserved transcriptional profiles across reproductive and non-reproductive stages, we applied the MetaNeighbor algorithm for cross-validation of matched cell types across conditions. This analysis yielded a high average area under the receiver operating characteristic curve (AUROC) of 0.985 (range 0.951–0.999) (Fig. 1g; Supplementary Table S2), suggesting that corresponding cell types maintain highly similar transcriptomic signatures between the two stages. This conservation was particularly evident in microenvironmental cell populations, including Sertoli cells and Leydig cells, which exhibited AUROC values greater than 0.990, indicating minimal transcriptomic divergence across seasonal conditions.
Localized transcriptomic remodeling across cell types between reproductive and non-reproductive stages
-
Despite the overall conservation of cell-type composition and transcriptomic profiles across reproductive states, we next sought to determine whether specific cell populations exhibit differential remodeling at a finer resolution. To this end, we performed MiloR-based differential abundance (DA) analysis to systematically identify cellular neighborhoods with significant compositional changes between stages. This approach enables the detection of localized shifts in cell distribution that may not be apparent at the global cell-type level, thereby providing a framework to uncover stage-associated remodeling within specific cellular compartments.
DA analysis revealed that approximately 48% of cellular neighborhoods exhibited significant compositional changes between stages (SpatialFDR < 0.1) (Fig. 2a–c). These results suggest that seasonal reproductive transitions might be associated with localized rearrangements in cellular composition rather than wholesale loss or expansion of major cell types, which is consistent with the overall conservation of cell-type composition observed across reproductive states.
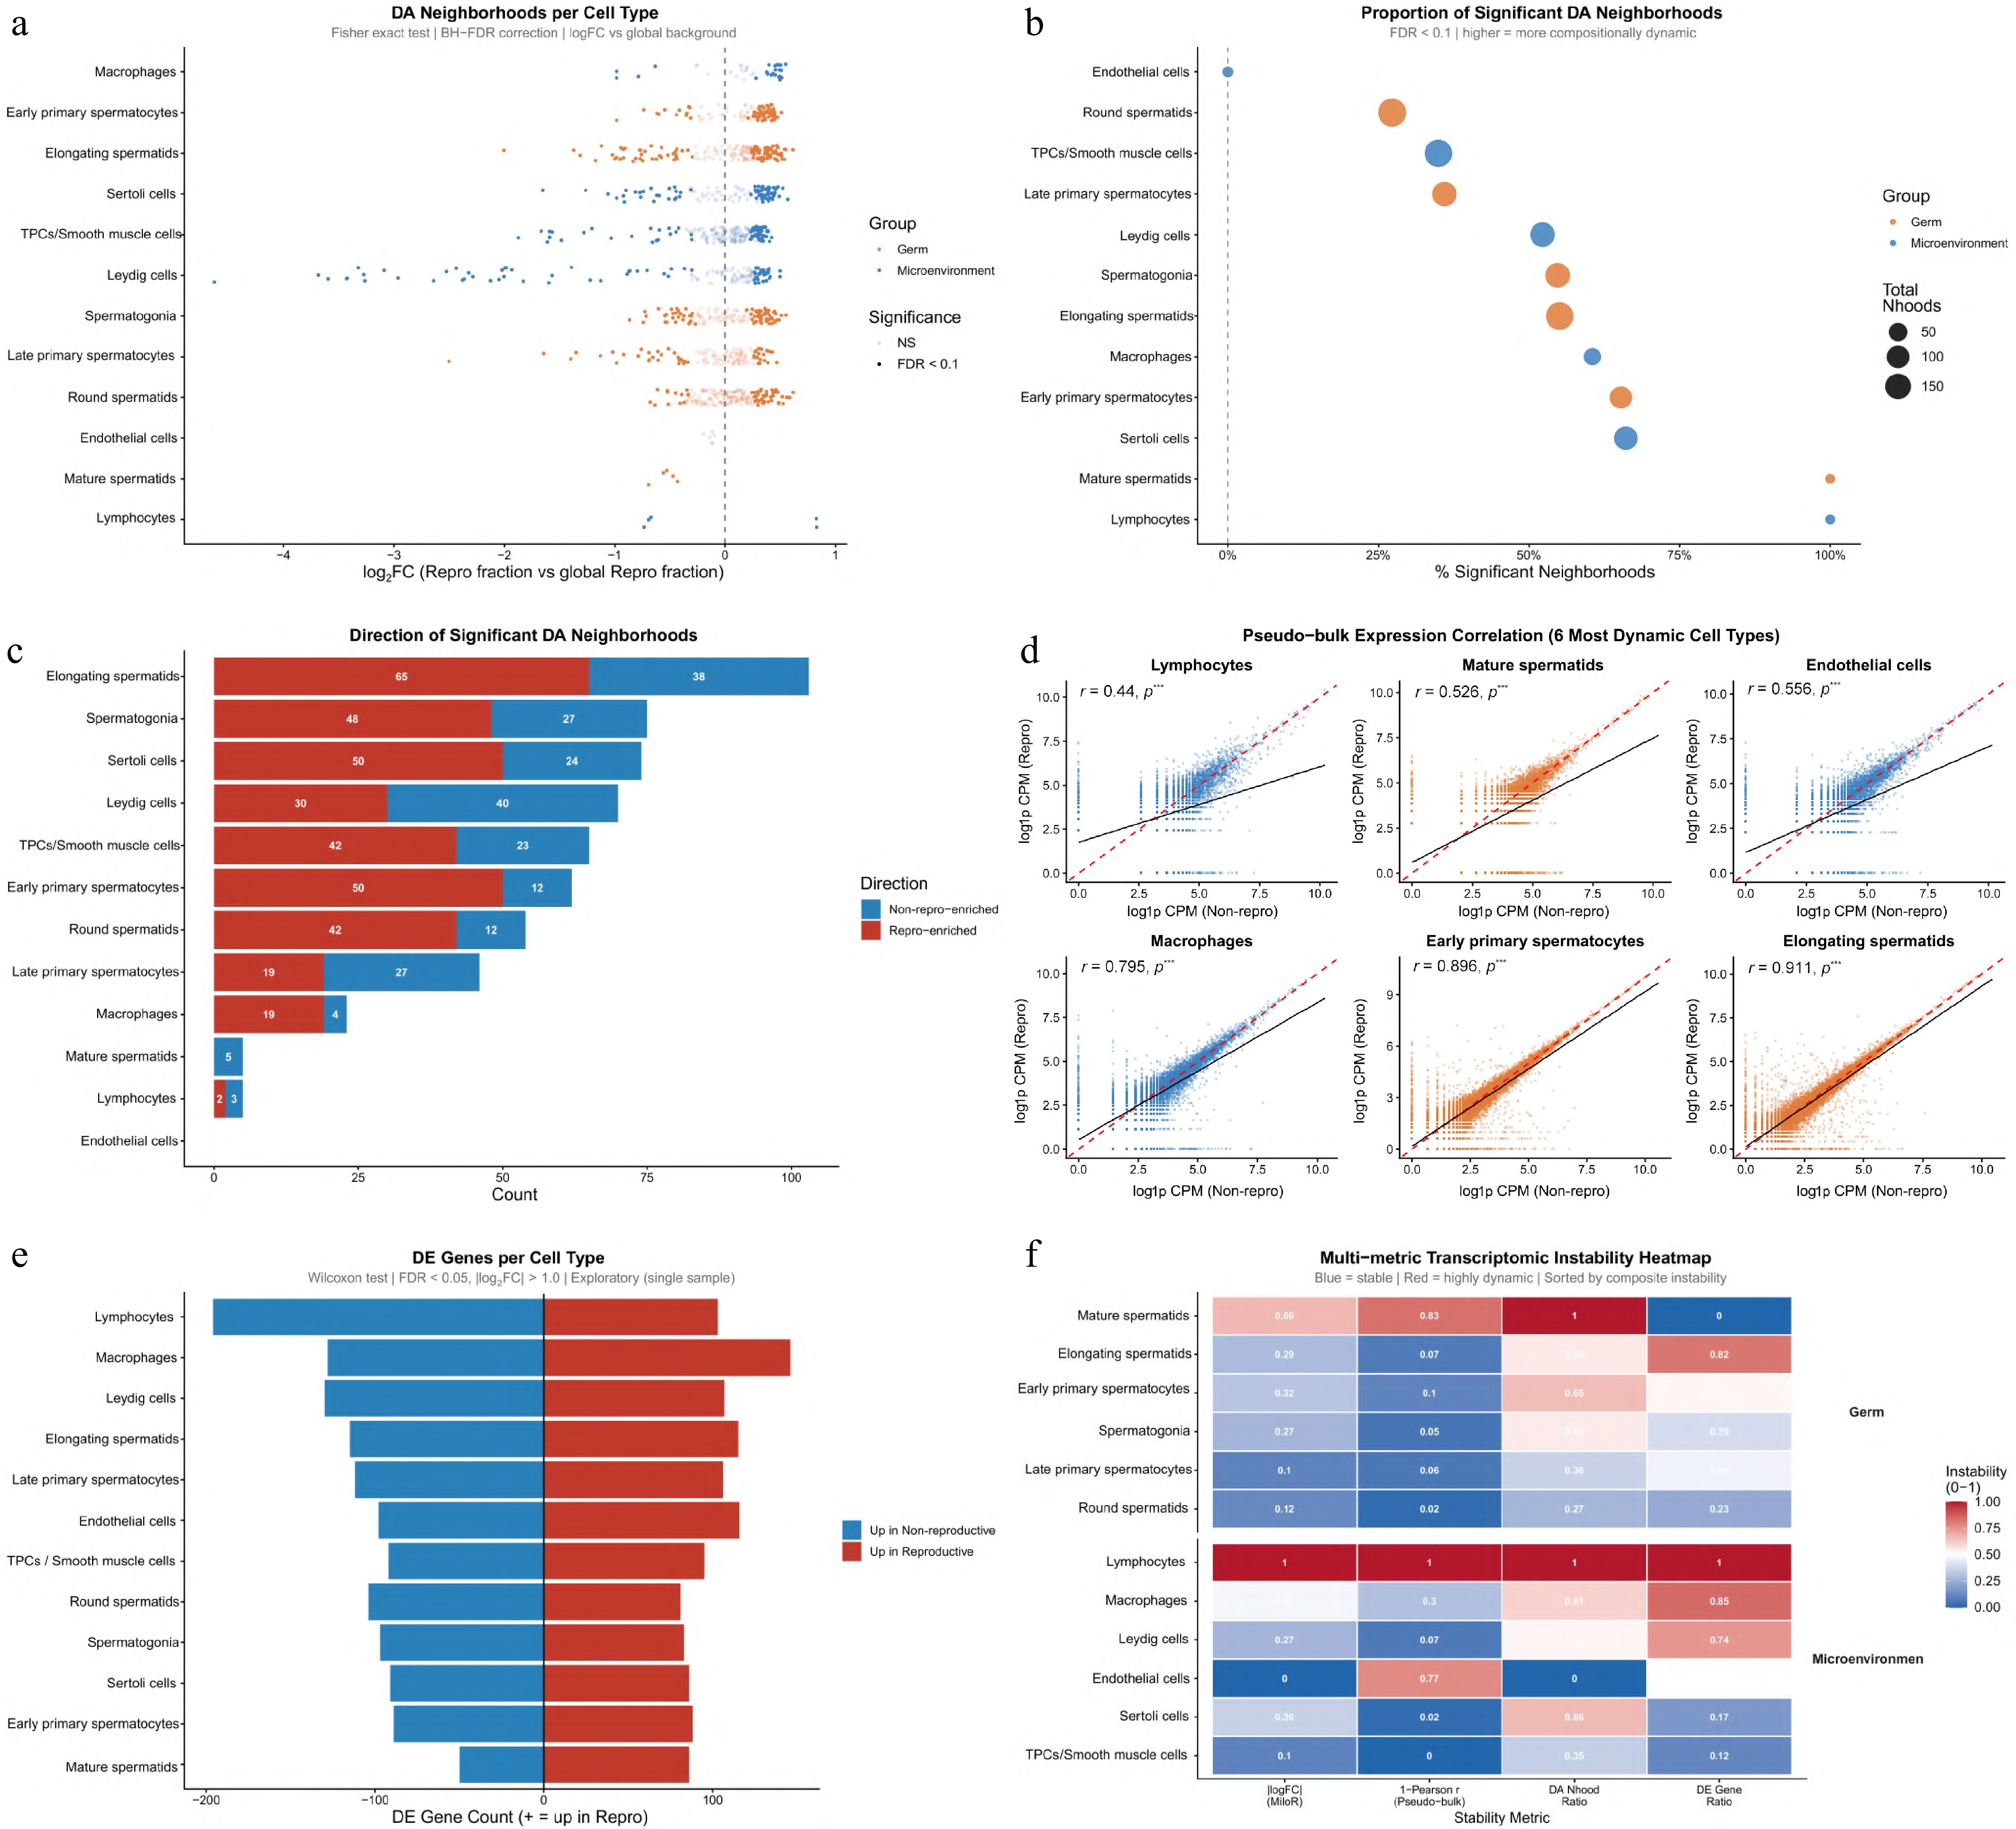
Figure 2.
Comparative transcriptomic analysis and differential abundance of testicular cell populations between reproductive and non-reproductive stages. (a) DA neighborhoods per cell type identified by MiloR analysis. (b) Proportion of significant DA neighborhoods (SpatialFDR < 0.1) per cell type. (c) Direction of significant DA neighborhoods (enrichment in reproductive vs non-reproductive stage), with positive logFC indicating enrichment in the reproductive stage. (d) Pseudo-bulk expression correlation for the six most dynamic cell types. Scatter plots illustrate the correlation of log10-transformed counts per million (CPM) between the reproductive and non-reproductive stages. Pearson correlation coefficients (r) are indicated, highlighting the global transcriptional shifts within each lineage. (e) Quantitative distribution of differentially expressed genes (DEGs) per cell type. The horizontal bar chart shows the number of upregulated genes in the reproductive stage (red) vs. the non-reproductive stage (blue). Cell types are ranked by the total number of DEGs. (f) Multi-metric transcriptomic instability heatmap integrating proportion of significant DA neighborhoods, absolute log2FC, DE gene ratio, and 1−Pearson r (ranked by composite instability index). Higher scores (red) indicate increased transcriptomic instability between stages.
The most pronounced changes were observed in lymphocytes (100% significant neighborhoods) and mature spermatids/spermatozoa (100% significant neighborhoods, median log2FC = −0.527, all enriched in the non-reproductive stage), suggesting potential accumulation or localized clearance mechanisms for mature sperm during the non-reproductive stage. Sertoli cells (65% significant neighborhoods) and early primary spermatocytes (67% significant neighborhoods) also displayed substantial changes, predominantly enriched in the reproductive stage. Spermatogonia showed moderate compositional shifts (54% significant neighborhoods), while endothelial cells remained completely stable (0% significant neighborhoods).
Pseudo-bulk expression correlation analysis further confirmed high overall transcriptomic similarity between stages for most cell types (r > 0.900) (Fig. 2d). The least stable populations were lymphocytes (r = 0.440) and mature spermatids/spermatozoa (r = 0.526), followed by endothelial cells (r = 0.556) and macrophages (r = 0.795). In contrast, germ cells and supportive cells exhibited markedly higher stability.
Next, differential expression (DE) analysis was conducted to compare gene expression changes within each cell type between stages and identified approximately 2,500 significant DE genes (adjusted p < 0.05, |log2FC| > 1.0) (Fig. 2e). Microenvironmental cell populations showed the highest DE activity overall, with lymphocytes and macrophages displaying the largest numbers of DE genes. Within the germ cell lineage, elongating spermatids had the most DE genes (230), followed by mature spermatids/spermatozoa (136), indicating that transcriptional differences are unevenly distributed across cell types and are predominantly driven by microenvironmental cell populations.
Finally, we integrated four complementary metrics—proportion of significant DA neighborhoods, absolute log2FC, DE gene ratio, and 1−Pearson r—into a composite transcriptomic instability heatmap (Fig. 2f). Lymphocytes ranked as the most unstable cell type across all four metrics, while Sertoli cells and peritubular myoid cells consistently showed low instability. Notably, in addition to immune cell populations, substantial variability was also observed within the germ cell lineage, suggesting that both microenvironmental and germline compartments contribute to stage-associated transcriptional differences. These observations prompted us to further investigate the specific cell states and regulatory programs underlying differentiation dynamics within germ cells.
Distinct differentiation patterns of spermatogonial subtypes during seasonal breeding
-
Among all testicular cell types, spermatogonia displayed the lowest transcriptomic similarity between reproductive and non-reproductive stages (AUROC = 0.951; Supplementary Table S2), indicating that they might constitute the primary cellular source of spermatogenesis regulation during the reproductive state transition.
To further investigate the transcriptional features of spermatogonia across stages, we first performed Gene Ontology (GO) enrichment analysis on the top 100 reproductive-stage-specific genes in spermatogonia (ranked by specificity score = Reproductive/(Reproductive + NonReproductive); Supplementary Table S3). The enriched terms were predominantly associated with mRNA processing, RNA splicing, ribonucleoprotein complex biogenesis, proteasome-mediated ubiquitin-dependent protein catabolic process, cytoplasmic translation, and protein-containing complex localization (Fig. 3a, b). These results suggested that spermatogonia in the reproductive stage exhibit increased activity in protein synthesis and decomposition, consistent with an active transcriptional state associated with differentiation readiness prior to meiotic entry. (Fig. 3c–h; Supplementary Fig. S1a–S1g).
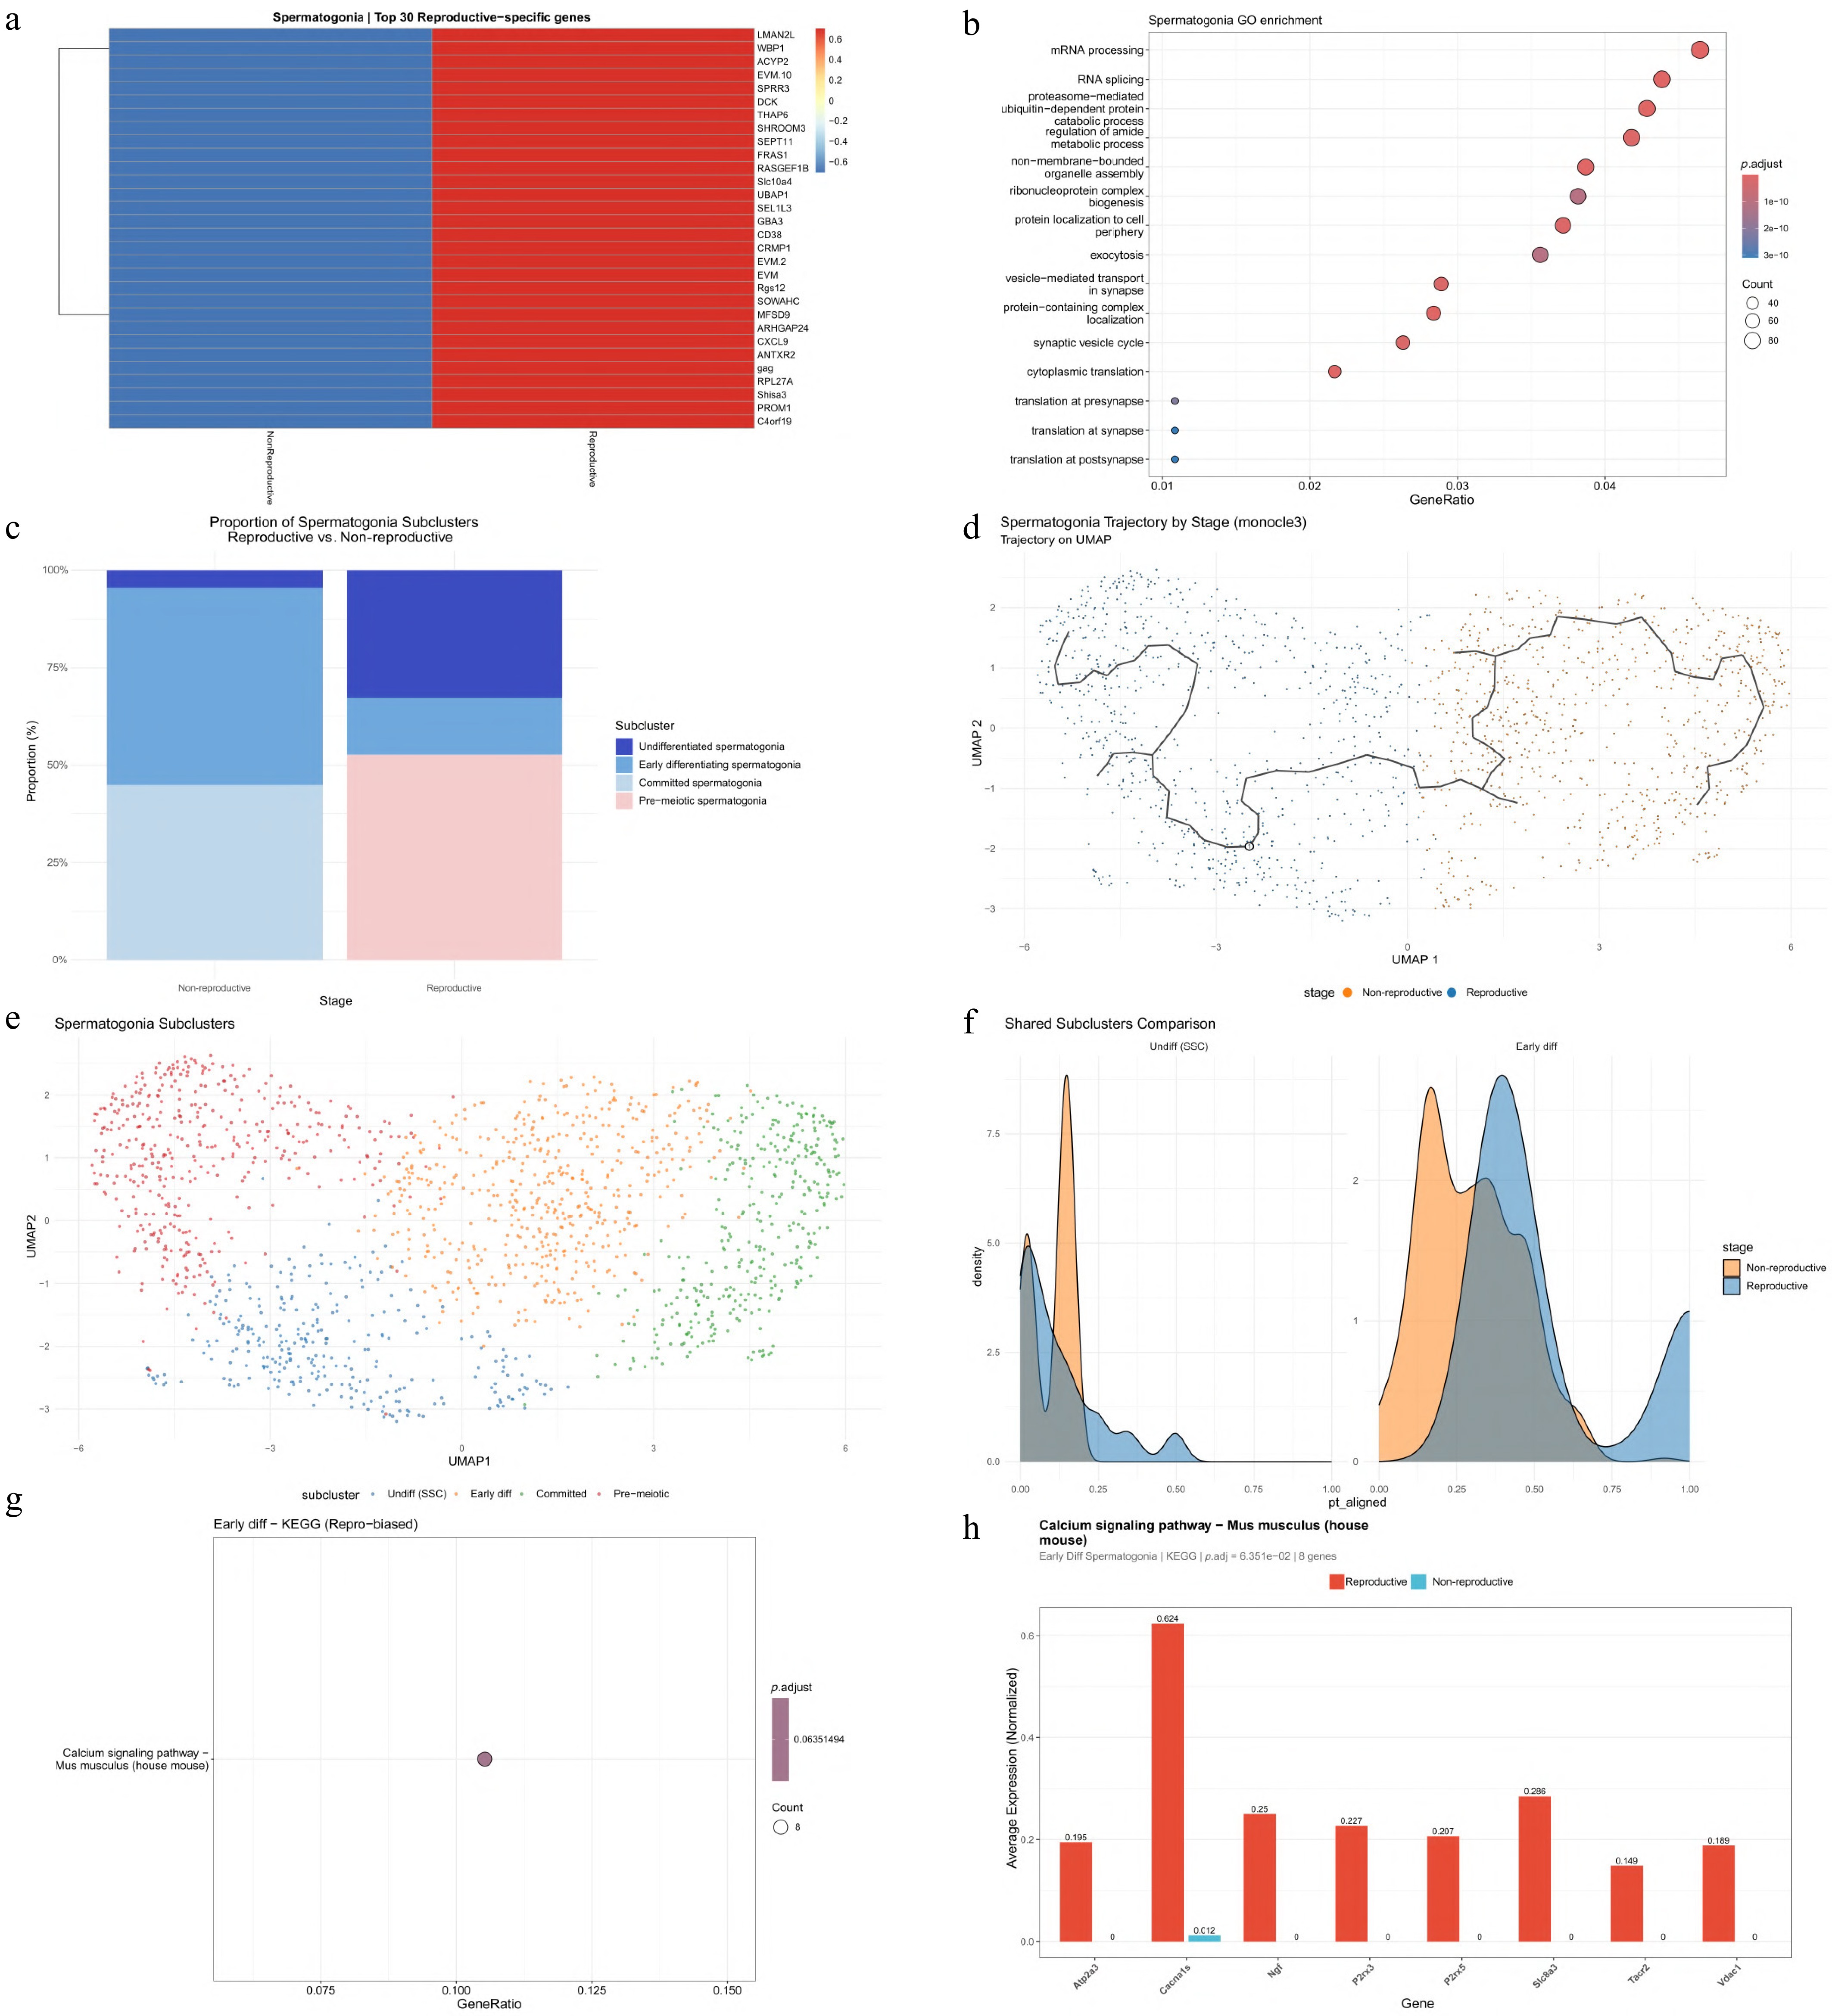
Figure 3.
Transcriptional divergence, subpopulation dynamics, and pseudotime trajectory of spermatogonia between reproductive and non-reproductive stages. (a) Heatmap of the top 30 reproductive-stage-biased genes in spermatogonia (ranked by specificity score). (b) Gene Ontology (GO) enrichment analysis of reproductive-stage-biased genes in spermatogonia. (c) Stacked bar plot showing the proportion of spermatogonial subclusters in reproductive and non-reproductive stages. (d) Monocle3 pseudotime trajectory of spermatogonia colored by reproductive and non-reproductive stages. (e) UMAP of spermatogonial subclusters highlighting subcluster identity. (f) Density plot comparing shared spermatogonial subclusters between reproductive and non-reproductive stages. (g) KEGG pathway enrichment analysis for early differentiating spermatogonia (reproductive-biased). (h) Bar plot showing expression of key calcium signaling pathway genes (mmu04020) in reproductive and non-reproductive stages.
Re-clustering analysis of spermatogonia based on marker gene expression resolved four continuous differentiation states: undifferentiated/SSC-like spermatogonia, marked by SCML2, PARN, EPHA6, GNAQ, and ARHGAP6; early differentiating spermatogonia, marked by ERBB4, CATSPERE, and WDR63; committed spermatogonia, characterized by reduced stemness-associated marker expression and absence of overt meiotic markers; and pre-meiotic spermatogonia, marked by FSIP2, DNHD1, DNAH7, and WDR63 (Supplementary Fig. S1b). These subpopulations were arranged along a continuous trajectory from an SSC-like state toward a pre-meiotic state, suggesting progressive differentiation within the spermatogonial compartment (Fig. 3d, e).
Cell proportion analysis revealed a clear stage-specific distribution pattern (Fig. 3c; Supplementary Table S4). Specifically, in the reproductive stage, spermatogonia efficiently progressed to the pre-meiotic state (52.68%), whereas in the non-reproductive stage, cells accumulated dramatically at the committed state (44.93%), with near-complete absence of the pre-meiotic population. The SSC-like population was reduced but not entirely lost. This pattern demonstrates that reproductive inactivity in seasonal breeding is not caused by wholesale loss of spermatogonia but by a precise state redistribution, with differentiation blocked at the 'committed → pre-meiotic' spermatogonia subtype transition window.
Monocle3 pseudotime trajectory analysis revealed stage-associated differences in the distribution of spermatogonia along the differentiation trajectory (Fig. 3d). When mapped onto defined spermatogonial states (Fig. 3e), undifferentiated spermatogonia showed broadly overlapping distributions between stages, whereas differences became more apparent in early differentiating spermatogonia, with reproductive-stage cells preferentially occupying more advanced positions along the trajectory (Fig. 3f).
The top 100 differentially expressed genes in the early differentiating stage were strongly enriched for calcium ion transmembrane transport, calcium signaling pathway, proteolysis regulation, and apoptosis-related processes. GO enrichment analysis (molecular function, biological process, and cellular component) confirmed significant functional specialization in signal receptor activity, glycosaminoglycan/heparin binding, peptidase regulator activity, extracellular region, and mitochondrial permeability transition pore complex (Supplementary Fig. S1e–S1g). KEGG pathway analysis further validated the central role of the calcium signaling pathway (mmu04020) (Fig. 3g; Supplementary Fig. S1a). Eight key calcium-related genes were significantly upregulated in the reproductive stage (ATP2A3, CACNA1S, NGF, P2RX3, P2RX5, SLC8A3, TACR2, and VDAC1; Fig. 3h; Supplementary Table S5).
These results support a four-state model of spermatogonial differentiation and suggest a coordinated progression of transcriptional programs along the differentiation trajectory. In the reproductive stage, genes associated with calcium signaling, apoptosis, and ubiquitin-proteasome pathways showed stage-specific expression patterns during the transition from early differentiating to pre-meiotic spermatogonia. In contrast, committed spermatogonia exhibited a marked accumulation in the non-reproductive stage, with a reduced proportion progressing toward the pre-meiotic state.
Expression of cell-cycle and anabolic genes promotes spermatocytogenesis in the reproductive stage
-
To investigate how the differentiation trajectory from spermatogonia to primary spermatocytes differs between cells from the reproductive and non-reproductive stages, we performed Monocle3-based trajectory inference. UMAP visualization (Fig. 4a) revealed a continuous trajectory that includes three major germ cell types—spermatogonia, early primary spermatocytes, and late primary spermatocytes—demonstrating a broadly conserved pattern of differentiation across both reproductive and non-reproductive stages. When cells were colored according to their developmental stage (Fig. 4b), it was evident that cells from both the reproductive and non-reproductive stages largely followed the same trajectory. This indicates that, regardless of whether they are in the reproductive or non-reproductive stage, the overall progression of spermatogonial differentiation remains fundamentally similar.
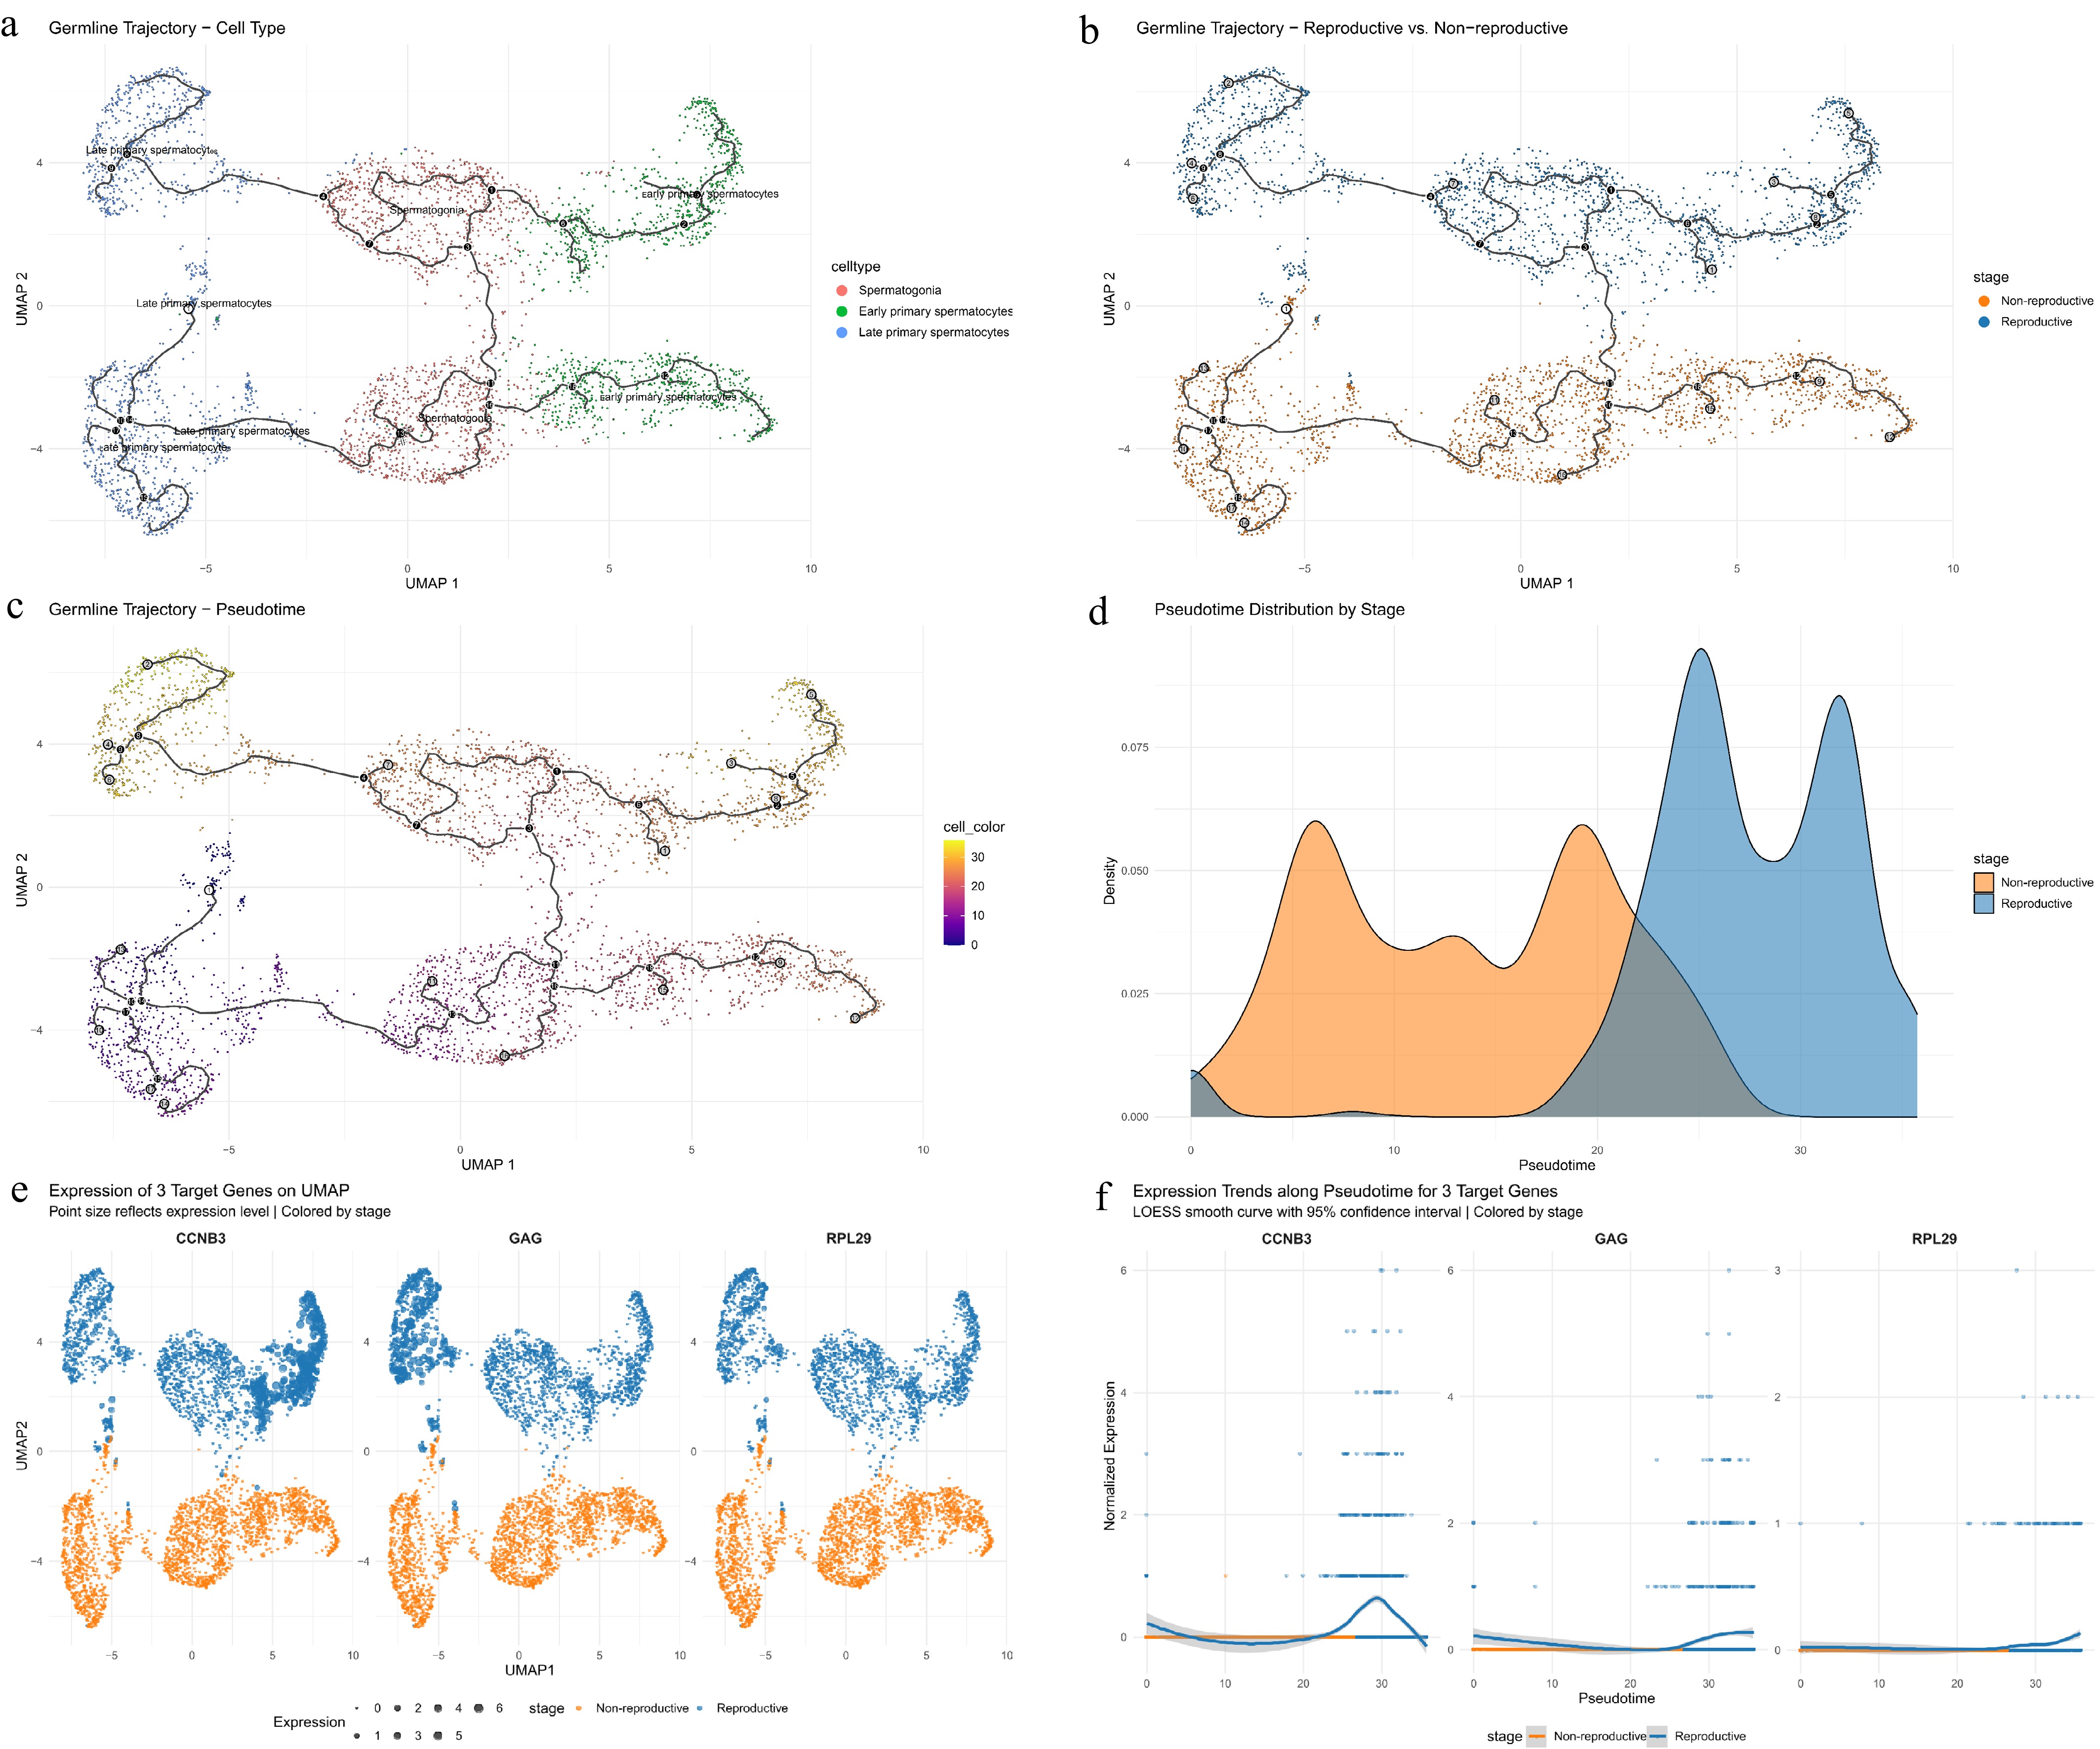
Figure 4.
Pseudotime trajectory analysis of spermatogonia and spermatocytes reveals developmental dynamics and gene expression between reproductive and non-reproductive stages. (a) Developmental trajectory of spermatogonia and spermatocytes colored by manually annotated cell types. (b) Trajectory colored by reproductive vs. non-reproductive stage (blue and orange, respectively). (c) Monocle3 pseudotime trajectory of spermatogonia and spermatocytes. (d) Pseudotime density distribution of spermatogonia and spermatocytes in reproductive and non-reproductive stages. (e) UMAP expression patterns of three representative trajectory-driving genes (CCNB3, GAG, RPL29) across cell types and stages. (f) Expression trends of CCNB3, GAG, and RPL29 along pseudotime, with LOESS smooth curves and 95% confidence intervals.
However, differences became apparent when we examined the distribution of cells along pseudotime. In Fig. 4c, cells are colored by pseudotime, with purple representing early differentiation (low pseudotime) and yellow representing later stages (high pseudotime). Cells from the non-reproductive stage were primarily concentrated in the lower pseudotime regions, indicating that they were predominantly in earlier differentiation stages. In contrast, cells from the reproductive period extended further along the pseudotime axis, reaching the higher pseudotime regions indicative of more advanced differentiation stages. Pseudotime density analysis further confirmed this difference, showing that cells from the reproductive period exhibited higher density at later pseudotime positions, particularly beyond pseudotime 20, while non-reproductive cells were more enriched at earlier pseudotime positions (Fig. 4d).
During the transition from spermatogonia to spermatocytes, regression-based trajectory analysis identified three genes with stage-associated dynamic expression patterns (Fig. 4e, f). One of the three genes is the cell-cycle-related gene CCNB3. It exhibited increased expression in the middle segment of the differentiation trajectory and was more prominently expressed in reproductive-stage cells than in non-reproductive-stage cells. Similarly, GAG showed enhanced expression along the reproductive-stage trajectory, suggesting increased transcriptional activity associated with the progression of germ cells. In addition, the ribosomal protein gene RPL29 displayed higher expression in reproductive-stage cells, consistent with increased protein synthesis activity that is crucial for spermatocytogenesis, as it supports the cellular growth and division required during the transition from spermatogonia to primary spermatocytes.
Together, these trajectory and gene expression analyses indicate that germ cells in the reproductive stage are characterized by broader progression toward spermatocyte states and increased expression of genes associated with cell-cycle regulation and protein synthesis. In contrast, germ cells in the non-reproductive stage are relatively enriched at earlier pseudotime positions and show lower expression of these key genes, including CCNB3, GAG, and RPL29, which are critical for spermatocytogenesis and the regulation of cell cycle and protein synthesis during spermatogenic progression.
Functional divergence in spermatid differentiation across reproductive and non-reproductive seasons
-
To further investigate stage-associated transcriptional remodeling within the germ cell lineage, we next focused on late spermatogenesis, particularly the transition from elongating spermatids to mature sper-matids/spermatozoa. This stage is critical for the final differentiation steps, where spermatids undergo extensive morphological changes and gain the ability to fertilize an egg, a process central to male fertility. Additionally, as revealed by our previous composite transcriptomic instability heatmap, elongating spermatids and mature spermatids/spermatozoa are two cell types that show marked transcriptional differences during spermatogenesis (Fig. 2f), making them particularly interesting for further investigation.
Complete populations of elongating spermatids and mature spermatids/spermatozoa were detected in both stages, with no apparent interruption of differentiation. The proportion of elongating spermatids was comparable between the reproductive and non-reproductive stages (approximately 50% each), whereas mature spermatids/spermatozoa showed a higher proportion in the non-reproductive stage (approximately 67%) compared with the reproductive stage (approximately 33%) (Supplementary Fig. S2a). These observations suggest a relative accumulation of mature spermatids/spermatozoa in the non-reproductive stage, while the reproductive stage is characterized by a greater representation of elongating spermatids. Analysis of reproductive-stage-specific gene expression patterns (Fig. 5a, b; Supplementary Tables S6 and S7) showed that representative genes in both elongating spermatids and mature spermatids/spermatozoa were upregulated in the reproductive stage and showed low or minimal expression in the non-reproductive stage. This stage-specific expression pattern is consistent with reduced transcriptional activity in late spermatogenesis during the non-reproductive stage. Functional enrichment analysis of these reproductive-stage-specific genes further supported these findings (Supplementary Fig. S2b–S2e). In elongating spermatids, differentially expressed genes were enriched in processes related to mRNA processing, RNA splicing, protein ubiquitination, vesicle transport, and organelle organization. These functions are crucial for the structural changes and organization required as spermatids elongate during the transition to mature sperm. In contrast, in mature spermatids/spermatozoa, enriched functions included microtubule-based transport, protein localization, and ribonucleoprotein complex assembly, reflecting the cellular processes necessary for the final maturation steps of spermatogenesis.
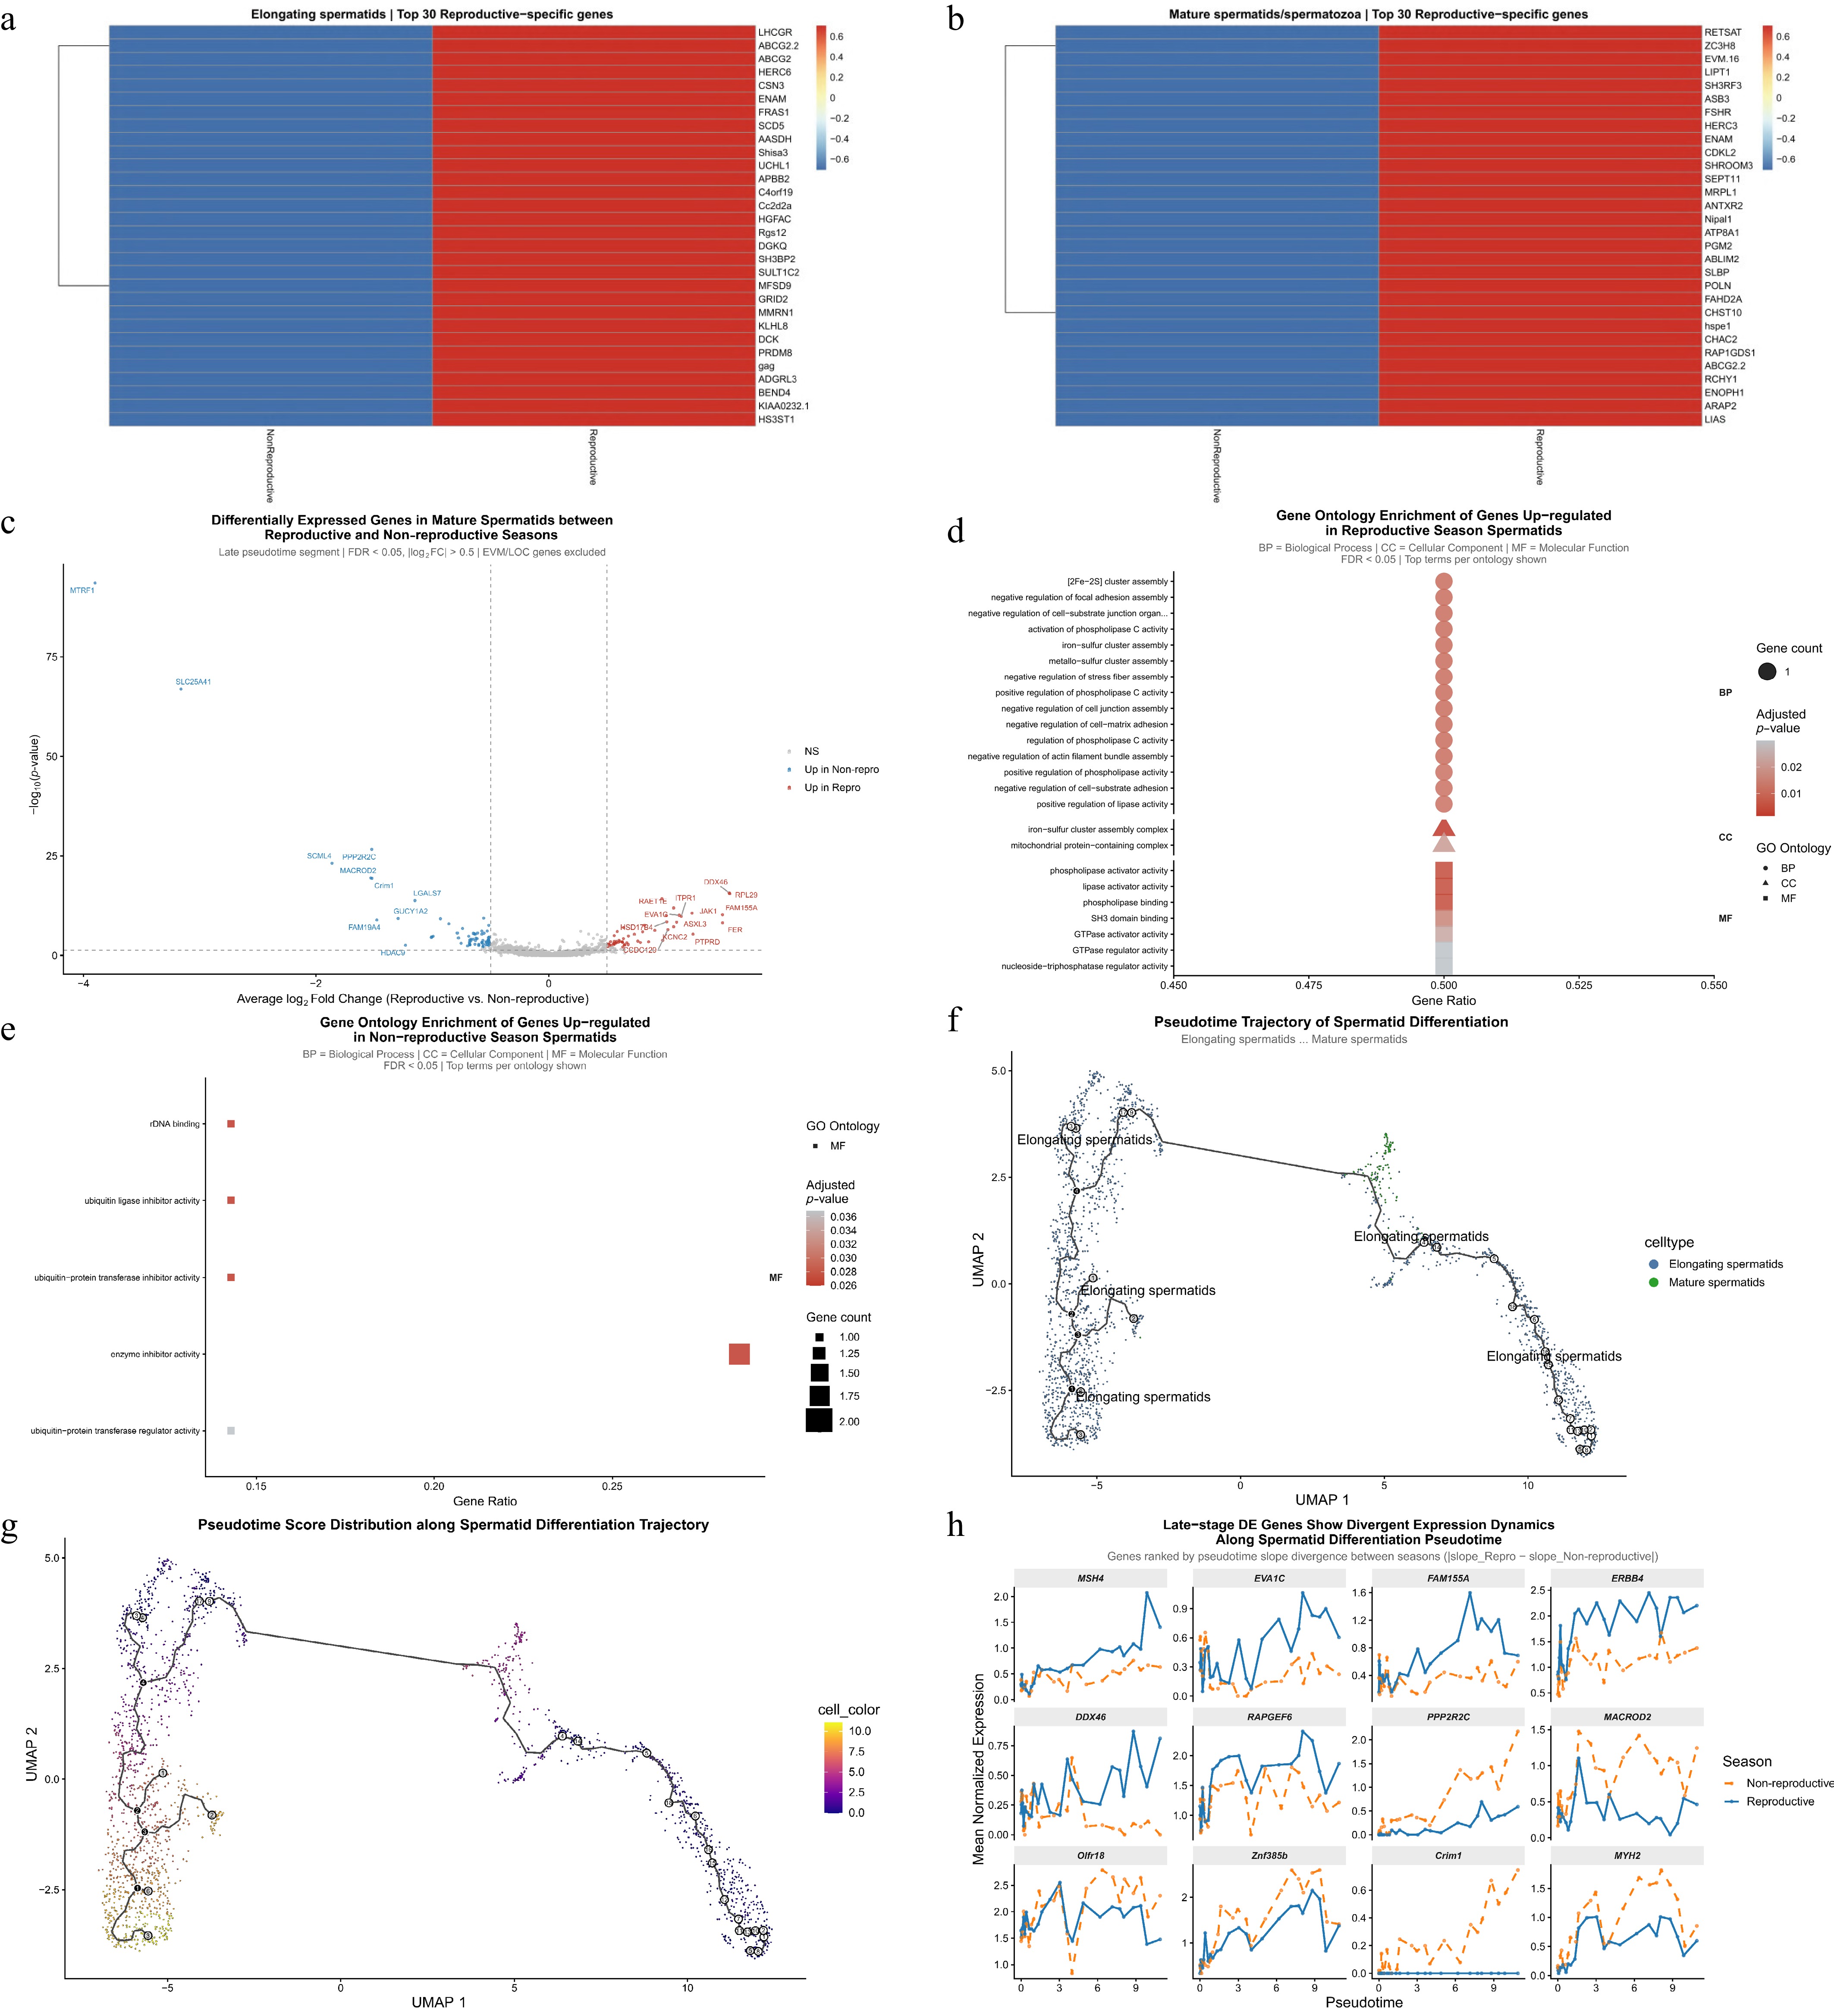
Figure 5.
Transcriptional dynamics, subpopulation proportions, pseudotime trajectory, and functional enrichment of elongating spermatids and mature spermatids/spermatozoa between reproductive and non-reproductive stages. (a) Heatmap of the top 30 reproductive-stage-specific genes in elongating spermatids (ranked by specificity score). (b) Heatmap of the top 30 reproductive-stage-specific genes in mature spermatids/spermatozoa (ranked by specificity score). (c) Volcano plot of differentially expressed genes in mature spermatids/spermatozoa between reproductive and non-reproductive stages. (d) Gene Ontology (GO) enrichment analysis of genes upregulated in reproductive mature spermatids/spermatozoa. (e) Gene Ontology (GO) enrichment analysis of genes upregulated in non-reproductive mature spermatids/spermatozoa. (f) Monocle3 pseudotime trajectory of spermatid differentiation colored by cell type. (g) Pseudotime trajectory of spermatid differentiation colored by pseudotime score. (h) Expression dynamics of season-specific genes along the spermatid differentiation pseudotime trajectory.
Differential expression analysis focusing on late-stage cells revealed significant transcriptional differences between the reproductive and non-reproductive stages, with a larger number of genes upregulated in the non-reproductive stage (Fig. 5c). These genes were primarily enriched in functions related to mitochondrial activity and metabolic processes. Representative genes upregulated in the non-reproductive stage, such as MTRF1, SLC25A41, and PPP2R2C, are associated with mitochondrial translation, energy transport, and signaling regulation. In contrast, genes upregulated in the reproductive stage were fewer and enriched in functions related to protein synthesis and intracellular signaling. For example, the ribosomal protein encoding gene RPL29 showed increased expression, consistent with heightened translational activity. Additional genes, including ITPR1 and RAET1E, were also upregulated, suggesting stage-specific differences in calcium-related signaling and immune-related pathways. These differences in gene expression were further supported by GO enrichment analysis, which revealed distinct patterns of gene regulation between the two stages. In the reproductive stage, genes upregulated in spermatocytes were significantly enriched in processes related to cell adhesion/adhesion remodeling (such as focal adhesion and actin cytoskeleton), phospholipase C (PLC) signaling, and iron-sulfur cluster (Fe-S) assembly (Fig. 5d, e). These enrichments indicate active structural remodeling, signal transduction, and energy metabolism during the reproductive period. Specifically, upregulated genes involved in cell adhesion and cytoskeleton dynamics play a critical role in sperm tail formation and motility acquisition, essential for the final stages of spermatogenesis. Additionally, the enrichment of Fe-S cluster assembly pathways reflects the increased metabolic demands of sperm cells, where mitochondrial function and oxidative phosphorylation are vital for energy production during sperm maturation and motility acquisition. The involvement of the PLC signaling pathway further emphasizes the regulation of cellular signaling in response to environmental cues, which is crucial for the interaction between germ cells and somatic cells during spermatogenesis. In contrast, genes upregulated in the non-reproductive stage were predominantly enriched in pathways related to ubiquitin ligase/transferase inhibition and rRNA binding. This suggests a shift toward a protective state with enhanced protein homeostasis, including the inhibition of protein degradation via the ubiquitin-proteasome system, which may help maintain cellular integrity during periods of low metabolic activity. The upregulation of rRNA binding genes further indicates that translational control plays a significant role in regulating protein synthesis at minimal levels during the non-reproductive stage, ensuring that cellular functions are maintained at a basal level while preventing unnecessary metabolic costs.
Using marker genes of elongating spermatids as root nodes, a continuous differentiation trajectory from elongating spermatids to mature spermatids/spermatozoa was reconstructed (Fig. 5f). Pseudotime values increased progressively along this trajectory and overlapped with the distribution of mature spermatids/spermatozoa (Fig. 5g). Cells from both stages were distributed along the same trajectory without evidence of stage-specific branching, suggesting that the overall differentiation path is preserved across conditions.
To investigate the temporal dynamics of late-stage differentially expressed genes, we examined their expression trajectories along the spermatid differentiation pseudotime (Fig. 5h). Late-stage DE genes were ranked by the absolute difference in pseudotime slopes between the reproductive and non-reproductive seasons. Representative genes upregulated in the reproductive season (MSH4, EVA1C, FAM155A, ERBB4, DDX46, and RAPGEF6) exhibited steeper increasing trajectories or sustained high expression specifically during the reproductive season, particularly in the late pseudotime segment. These genes are likely involved in processes crucial for the later stages of spermatid maturation, such as DNA repair, meiotic recombination, and regulation of cell signaling, which are all essential for ensuring the proper progression and function of spermatogenesis during the reproductive season when germ cells undergo extensive differentiation. In contrast, genes upregulated in the non-reproductive season (PPP2R2C, MACROD2, OlFR18, ZNF385B, CRIM1, and MYH2) displayed markedly higher expression or upward trends exclusively in the non-reproductive season, remaining low or flat during the reproductive season. These genes are associated with processes such as mitochondrial function, energy metabolism, and structural maintenance, suggesting that during the non-reproductive season, spermatids prioritize cellular homeostasis and mitochondrial activity, which may be necessary for cellular maintenance and survival in the absence of active differentiation. The temporal separation of these pathways between the reproductive and non-reproductive seasons points to a highly regulated, season-specific transcriptional program that ensures optimal spermatogenesis during the reproductive period while maintaining cell viability and metabolic activity during the non-reproductive phase.
Remodeling of immune cell subpopulations in the testicular microenvironment
-
Because immune cells are key components of the testicular microenvironment, contributing to immune privilege, spermatogenic support, and tissue homeostasis, we reasoned that immune remodeling between reproductive and non-reproductive conditions may be closely linked to seasonal changes in testicular function. Notably, our composite transcriptomic instability analysis revealed dynamical alternation of immune cells (lymphoid cells and macrophages) between the reproductive and non-reproductive stages (Fig. 2f). We therefore focused on these two immune populations to further compare their cellular composition and transcriptional programs between the two reproductive conditions.
Cross-stage differential expression analysis revealed marked transcriptional divergence between reproductive and non-reproductive lymphoid cells (Fig. 6a). Genes upregulated in the reproductive stage (e.g., THEMIS, ARHGAP15, and DOCK10) were associated with T-cell development and immune activation[43,44], whereas genes upregulated in the non-reproductive stage (e.g., CMA1 and MCPT10) were linked to tissue remodeling and angiogenesis. Functional enrichment analysis further supported this contrast, with reproductive-stage upregulated genes enriched in immune response and T-cell differentiation processes, and non-reproductive-stage upregulated genes enriched in blood vessel formation and cell migration (Supplementary Fig. S3a, S3b). Similarly, macrophages displayed clear transcriptional remodeling between reproductive and non-reproductive conditions (Fig. 7a). Genes upregulated in non-reproductive-stage macrophages (e.g., RNF135, ALKBH3, and BCL2) were related to cell survival and homeostasis[45−47], whereas genes upregulated in reproductive-stage macrophages (e.g., FCRL3, CPED1, and ARHGEF3) were primarily associated with antigen presentation and extracellular matrix-related processes[48−50]. Functional enrichment analysis confirmed these patterns, with non-reproductive-stage macrophage genes enriched for pathways related to apoptosis regulation and tissue maintenance, and reproductive-stage macrophage genes enriched in glycosaminoglycan metabolism and extracellular matrix organization (Fig. 7b, c).
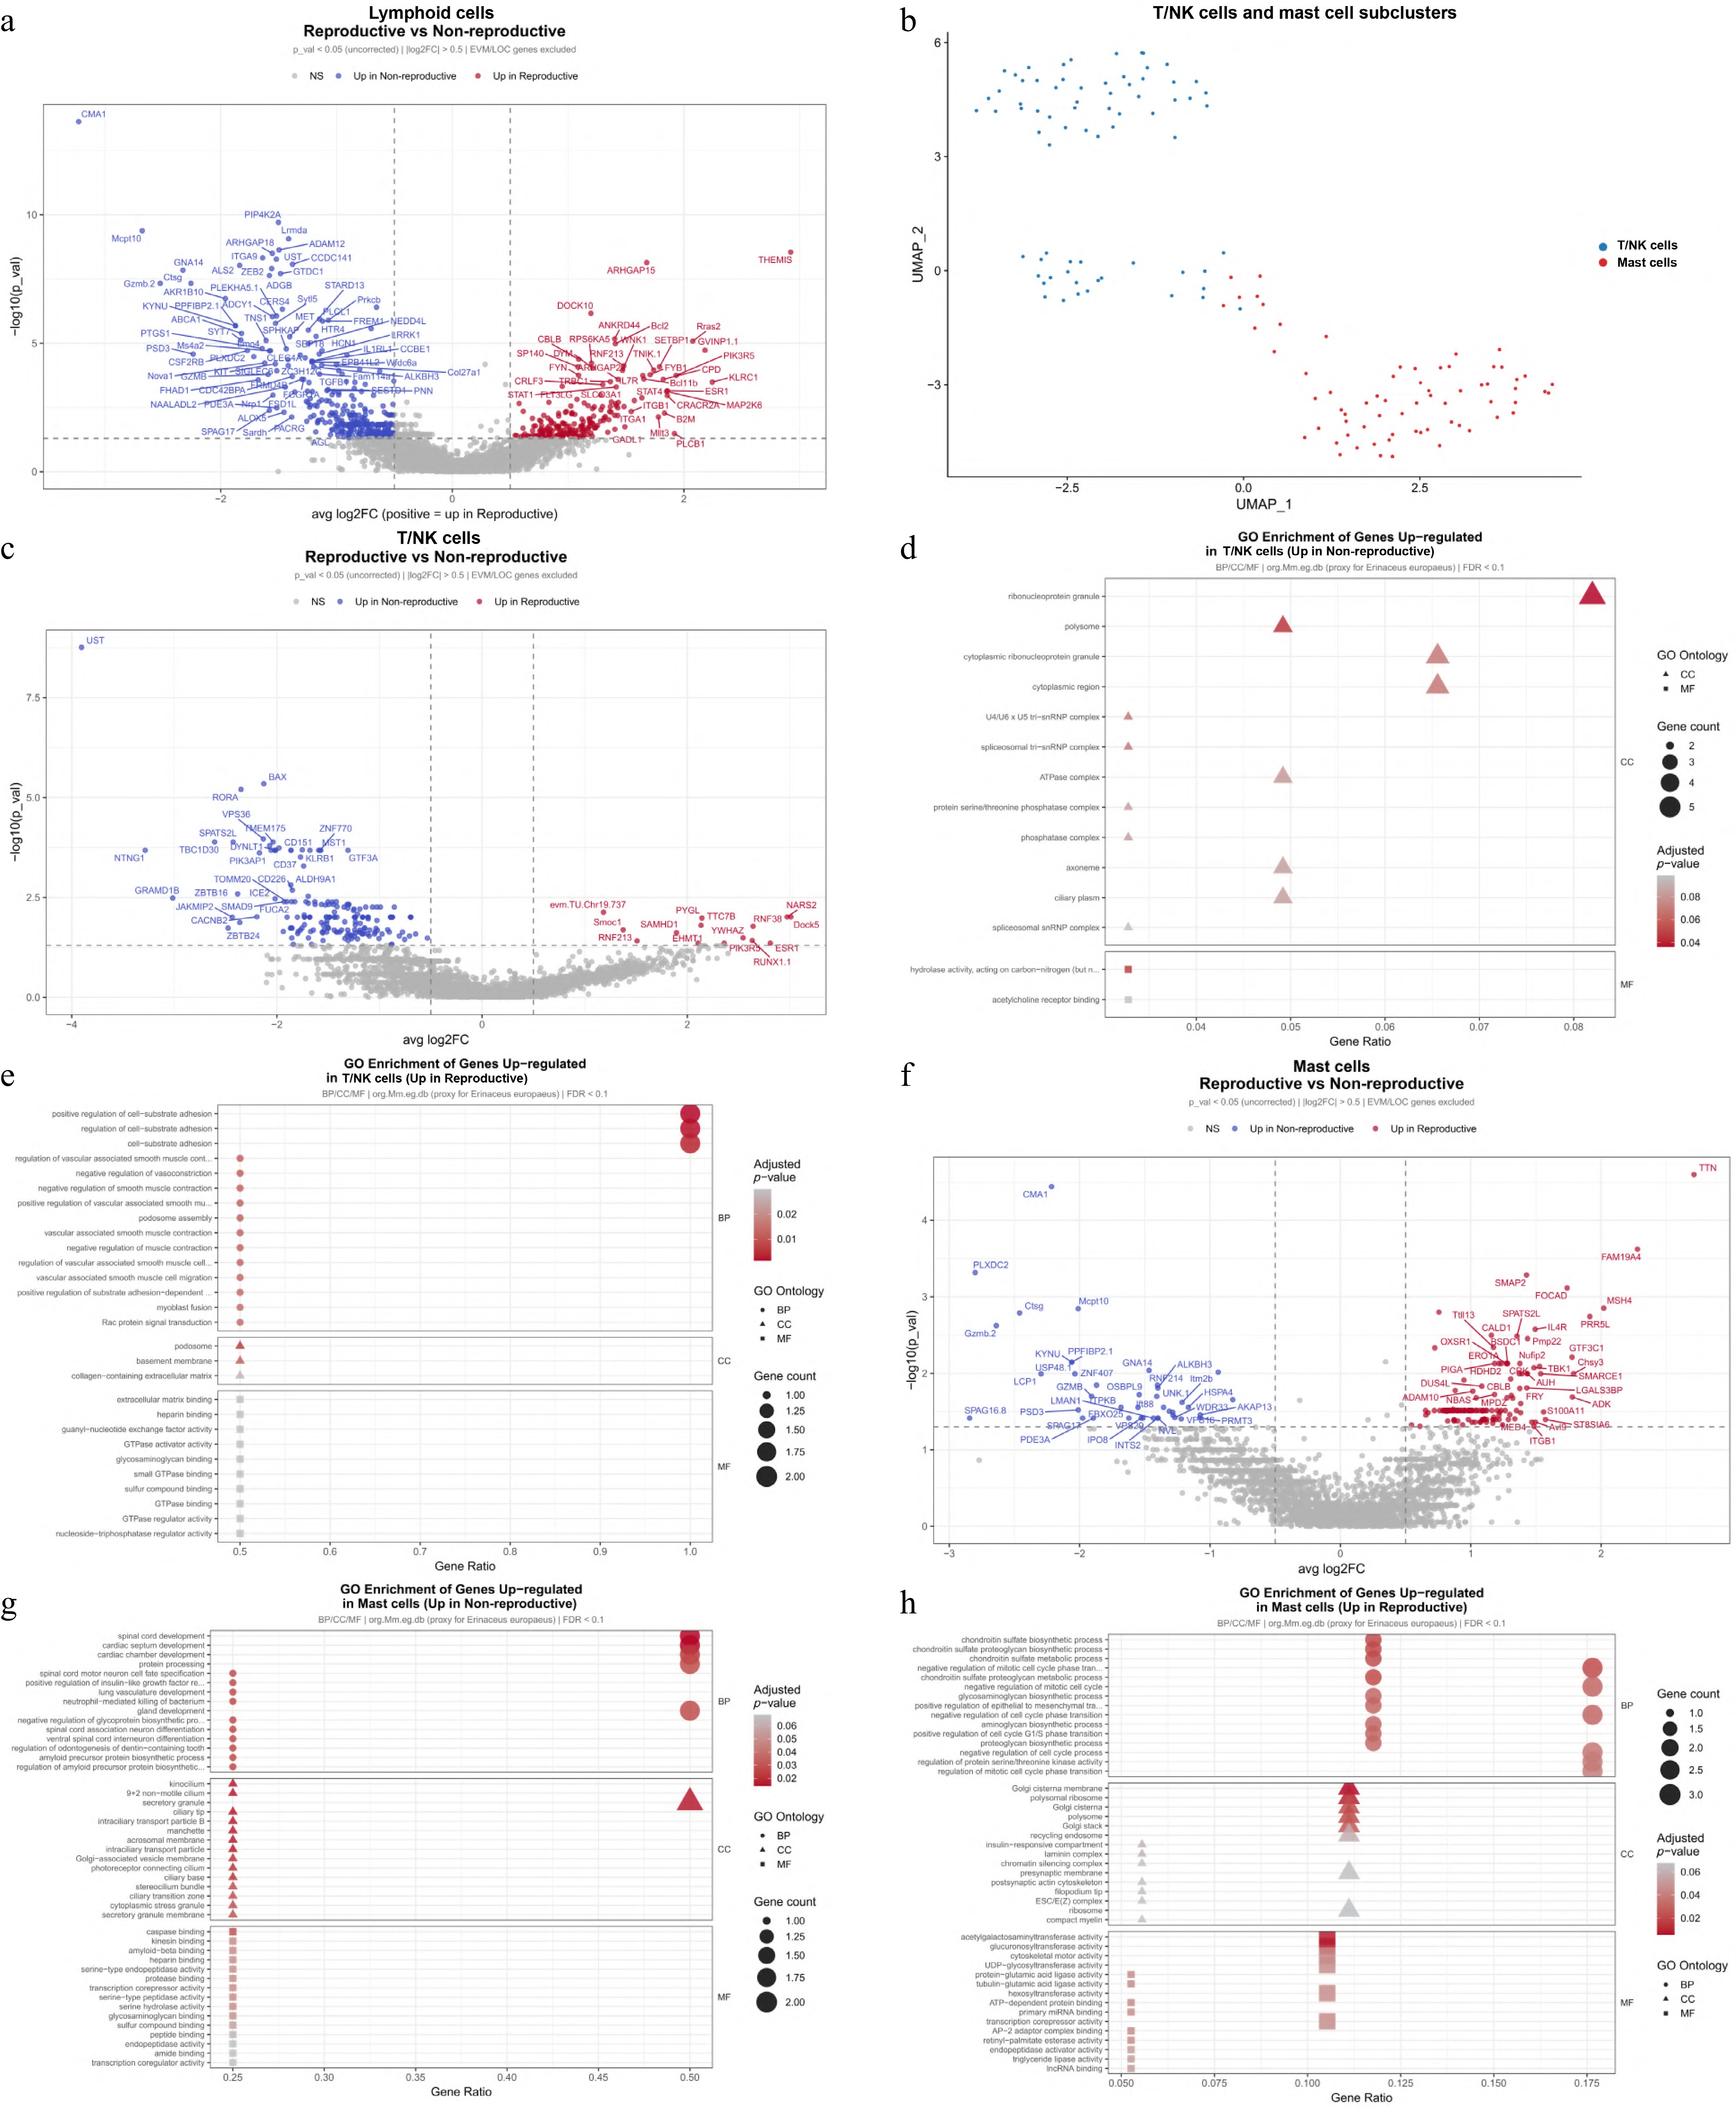
Figure 6.
Dynamic remodeling of T/NK and mast cells in the testicular immune microenvironment between reproductive and non-reproductive stages. (a) Volcano plot showing differentially expressed genes in lymphoid population between reproductive and non-reproductive stages. (b) UMAP visualization of annotated subclusters of T/NK and mast cells. (c) Volcano plot of differentially expressed genes in T/NK cells between reproductive and non-reproductive stages. (d) Gene Ontology (GO) enrichment analysis of genes upregulated in T/NK cells in the non-reproductive stage. (e) Gene Ontology (GO) enrichment analysis of genes upregulated in T/NK cells in the reproductive stage. (f) Volcano plot of differentially expressed genes in mast cells between reproductive and non-reproductive stages. (g) Gene Ontology (GO) enrichment analysis of genes upregulated in mast cells in the non-reproductive stage. (h) Gene Ontology (GO) enrichment analysis of genes upregulated in mast cells in the reproductive stage.
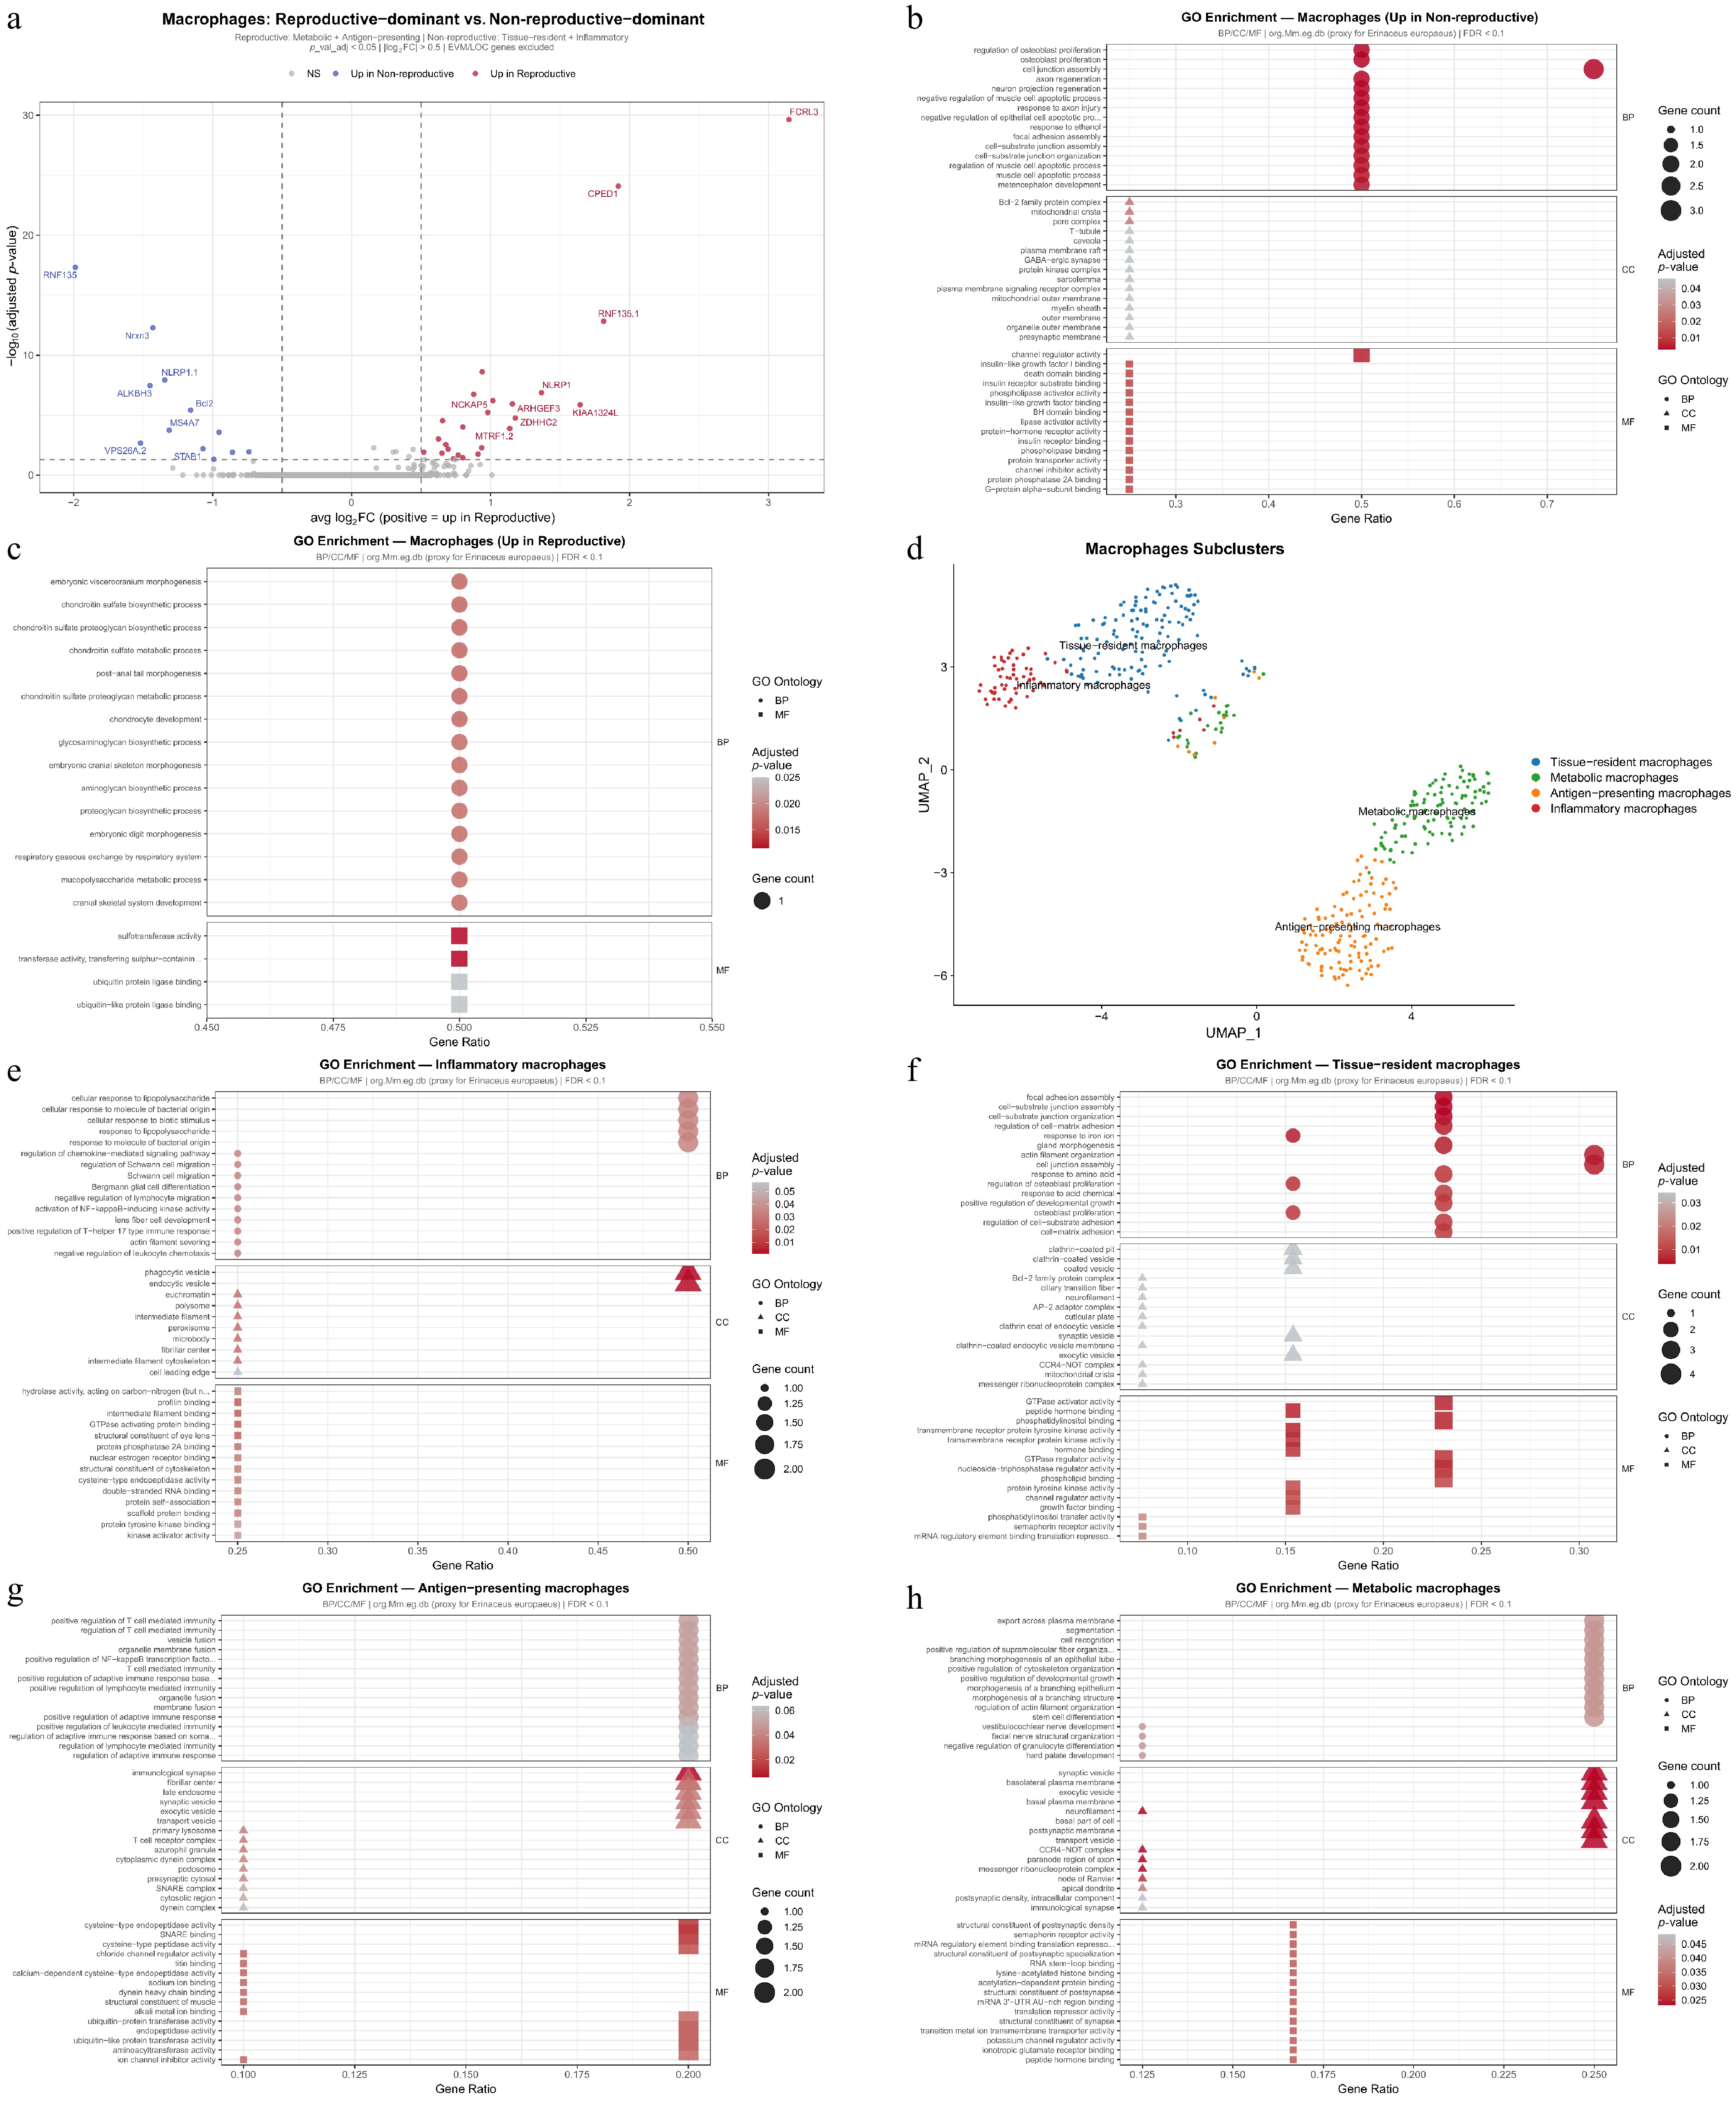
Figure 7.
Dynamic remodeling of macrophages in the testicular immune microenvironment between reproductive and non-reproductive stages. (a) Volcano plot of differentially expressed genes in macrophages between reproductive and non-reproductive stages. (b) Gene Ontology (GO) enrichment analysis of genes upregulated in macrophages in the non-reproductive stage. (c) Gene Ontology (GO) enrichment analysis of genes upregulated in macrophages in the reproductive stage. (d) UMAP visualization of annotated macrophage subclusters. (e) Gene Ontology (GO) enrichment analysis of genes upregulated in inflammatory macrophages. (f) Gene Ontology (GO) enrichment analysis of genes upregulated in tissue-resident macrophages. (g) Gene Ontology (GO) enrichment analysis of genes upregulated in antigen-presenting macrophages. (h) Gene Ontology (GO) enrichment analysis of genes upregulated in metabolic macrophages.
Having established broad transcriptional divergence between reproductive and non-reproductive immune cells, we next asked whether these differences reflected changes in immune subpopulation composition and/or subpopulation-specific transcriptional programs. Re-clustering analysis revealed clear transcriptional heterogeneity within these immune cells, with distinct subpopulations forming well-separated clusters in UMAP space (Figs. 6b, 7d; Supplementary Fig. S3c, S3d). Within lymphoid compartment, we identified a T/NK cell population characterized by the expression of T-cell-associated markers (TRBC1 and THEMIS) together with the cytotoxic-associated marker KLRK1, and a distinct mast cell population characterized by canonical mast cell markers (CMA1, MITF, and GATA2) (Supplementary Fig. S3e). Macrophages were further resolved into four subpopulations, including tissue-resident, metabolic, antigen-presenting, and inflammatory macrophages (Fig. 7d).
Quantitative analysis revealed pronounced differences in immune subpopulation composition between reproductive and non-reproductive conditions. Mast cells predominated in the non-reproductive stage, whereas T/NK cells were enriched in the reproductive stage (Supplementary Fig. S3g). Macrophage composition also differed markedly between the two stages: the non-reproductive stage was characterized by higher proportions of tissue-resident macrophages (approximately 70%) and inflammatory macrophages (approximately 30%), whereas the reproductive stage showed increased proportions of metabolic and antigen-presenting macrophages, each accounting for approximately 50% (Supplementary Fig. S3h). These results indicate substantial immune cell remodeling between reproductive and non-reproductive testicular states.
We further examined whether each immune subpopulation exhibited distinct transcriptional programs between the reproductive and non-reproductive stages. In T/NK cells, genes upregulated in the non-reproductive stage were enriched in pathways related to RNA processing and translational regulation, including ribonucleoprotein granules, polysomes, and spliceosome complexes (Fig. 6c, d). In contrast, genes upregulated in the reproductive stage were enriched in processes such as cell-matrix adhesion, vascular smooth muscle contraction, Rac signaling, and basement membrane components (Fig. 6e). Mast cells also showed distinct transcriptional programs between the two reproductive conditions. In the non-reproductive stage, upregulated genes (e.g., CMA1, GZMB, MCPT10, and CTSG) were enriched in protease activity, secretory granule components, and protein processing pathways (Fig. 6f, g). In the reproductive stage, upregulated genes were enriched in chondroitin sulfate biosynthesis, extracellular matrix organization, and glycosyltransferase-related activities, along with cellular components associated with the Golgi apparatus and polysomes (Fig. 6h).
Macrophage subpopulations displayed consistent functional specialization between reproductive and non-reproductive conditions (Fig. 7e–h). Inflammatory macrophages were enriched in immune response-related pathways, including responses to bacterial molecules and NF-κB signaling. Tissue-resident macrophages showed enrichment in focal adhesion and cell–matrix interaction processes. Antigen-presenting macrophages were associated with adaptive immune regulation, whereas metabolic macrophages were enriched in transport and cytoskeletal organization pathways.
Overall, these analyses reveal coordinated remodeling of both the composition and transcriptional programs of immune cell subpopulations between reproductive and non-reproductive testicular states.
-
This study provides a single-nucleus resolution transcriptomic atlas for the testes of the four-toed hedgehog, one of the prominent mammalian seasonal breeders, for the first time (Fig. 1). Our analyses revealed that hedgehog testes maintain a remarkably stable cellular architecture across reproductive and non-reproductive stages. Importantly, the transition between reproductive and non-reproductive states of this species is not driven by large-scale compositional remodeling, but rather by coordinated functional modulation across germline and microenvironmental compartments.
Testicular germ cells and microenvironmental cells (such as Sertoli cells, Leydig cells, macrophages, and lymphocytes) are both intimately associated with male reproductive function, coordinating spermatogenesis, steroidogenesis, and immune privilege within the testis[1,2,6]. The present study found that cell composition did not undergo drastic changes across reproductive and non-reproductive stages. All major cell types, encompassing the complete spermatogenic lineage and key somatic support and immune populations, were fully preserved with comparable abundances and no complete loss or de novo emergence of any lineage (Fig. 1f). Transcriptomic identities were also highly conserved (Fig. 1g; Supplementary Table S2). Similarly, stability in cellular composition during seasonal transitions has been reported in other seasonal breeders. For example, single-cell RNA sequencing of testicular cells across the annual reproductive cycle in two seasonal breeding teleost fishes—the large yellow croaker (Larimichthys crocea) and black rockfish (Sebastes schlegelii)—has revealed that the complete spectrum of spermatogenic cell types (including undifferentiated/differentiated spermatogonia, spermatocytes, and spermatids) persists throughout all stages, from active differentiating/breeding phases to regressed non-breeding phases. This demonstrates a highly stable core cellular lineage framework in the testis. Seasonal transitions are likely driven by dynamic transcriptional reprogramming and shifts in cellular activity and proportions, rather than large-scale cell-type loss or gain[23,51]. We propose that this mechanism confers an adaptive advantage in seasonal breeders. By retaining the full complement of cell lineages year-round, the testis can rapidly reactivate spermatogenesis in response to environmental cues, such as photoperiod or temperature changes. This avoids the energetic and temporal costs of extensive stem cell expansion or tissue regeneration. As a result, reproductive competence can be swiftly restored when conditions improve[3,9,18].
In mammalian seasonal breeders, testicular regression in the non-reproductive state has traditionally been attributed to structural and compositional remodeling of the testis, mediated by extensive germ cell apoptosis and degeneration[8,9]. However, this apoptotic regression has been challenged. A histology study in another hedgehog (the Egyptian long-eared hedgehog, Hemiechinus auritus) demonstrated that testicular regression occurs primarily through desquamation of live, non-apoptotic germ cells rather than widespread apoptosis[52]. Although our data cannot directly resolve germ cell desquamation, we found no evidence for large-scale cell-type loss or degeneration during the non-reproductive stage. We also did not detect significant upregulation of apoptosis-related GO terms or KEGG pathways in any major cell populations. Together, our snRNA-seq data from the four-toed hedgehog do not support an apoptosis-driven mechanism of testis regression during seasonal breeding, further extending the non-apoptotic model in hedgehogs to the transcriptomic level.
Previous studies on seasonal breeders have shown that testicular regression can be achieved through different cellular strategies, including extensive germ-cell apoptosis, seminiferous epithelial regression, altered Sertoli–germ cell interactions, blood–testis barrier remodeling, and endocrine suppression. In several seasonal mammals, the non-reproductive testis exhibits reduced spermatogenic activity and partial loss or degeneration of advanced germ cells, whereas other species retain major germ-cell lineages but suppress their differentiation and functional activity. Our findings are more consistent with the latter model. The four-toed hedgehog retained all major germline and somatic cell populations during the non-reproductive stage. In mammalian models, scRNA-seq across developmental stages in dairy goats has delineated continuous germ cell trajectories and Sertoli cell heterogeneity that support stage-dependent suppression and reactivation of differentiation programs[53,54]. Comparative single-cell analyses in Mongolian sheep revealed conserved yet plastic transcriptional landscapes of germ and somatic cells during spermatogenesis, consistent with fine-tuned, reversible regulation rather than wholesale cell elimination[55]. Likewise, scRNA-seq atlases of yak testis have resolved heterogeneous populations of SSCs, spermatogonia, spermatocytes, and spermatids, illuminating somatic-germ cell interactions and metabolic shifts that facilitate spermatogenic modulation[56]. Compared with histological and bulk-transcriptomic studies that mainly describe broad regression or pathway-level changes, our single-nucleus data refine this process to specific cellular events, including a committed-to-pre-meiotic spermatogonial checkpoint, limited progression into spermatocytes, metabolic and proteostasis remodeling of retained mature spermatids, and immune microenvironmental reprogramming.
In spermatogenesis, spermatogonia serve as a developmental gatekeeper. Committed spermatogonia represent a transitional population irreversibly committed to differentiation, whereas pre-meiotic spermatogonia constitute the final stage before meiotic entry. Progression through these stages is tightly regulated by nutrient-sensing and signaling pathways[57,58]. In the four-toed hedgehog, spermatogonia displayed the lowest transcriptomic similarity between stages (AUROC = 0.951). We found that during the non-reproductive stage, spermatogonia accumulated predominantly at the committed state (44.93%), whereas pre-meiotic spermatogonia were nearly absent (Fig. 3d; Supplementary Table S4). In contrast, reproductive-stage spermatogonia progressed efficiently toward the pre-meiotic state (52.68%). Monocle3 pseudotime analysis further identified a differentiation checkpoint at the committed-to-pre-meiotic transition (Fig. 3e–g), with reproductive-stage cells occupying more advanced positions along the trajectory. Genes upregulated in reproductive-stage early differentiating spermatogonia were enriched for calcium signaling (Fig. 3g, h), consistent with its established role in driving spermatogonial progression[59]. These results indicate that the committed-to-pre-meiotic window acts as a sensitive and season-associated differentiation gate regulated, at least in part, by calcium-dependent signaling.
Having established that spermatogonial differentiation is arrested at the committed-to-pre-meiotic checkpoint during the non-reproductive stage, we next explored the dynamic progression of spermatogonia into primary spermatocytes. Pseudotime trajectory analysis of spermatogonia and spermatocytes showed that the overall differentiation trajectory is largely conserved across stages (Fig. 4a). However, reproductive-stage cells extend significantly further along the pseudotime axis, occupying positions corresponding to more advanced spermatocyte maturation, while non-reproductive-stage cells remain concentrated at earlier developmental stages (Fig. 4b, c). This shift was further supported by pseudotime density distributions, which showed enrichment of reproductive-stage cells beyond pseudotime 20 and accumulation of non-reproductive cells at earlier positions (Fig. 4d). This enhanced developmental progression in the reproductive stage is accompanied by increased expression of key trajectory-associated genes, including the cell-cycle regulator CCNB3, GAG, which is associated with transcriptional activity during germ cell advancement, and the ribosomal protein gene RPL29, which is required for protein synthesis (Fig. 4e, f). These genes support the elevated demands for cell division, transcriptional activity, and biosynthetic capacity necessary for efficient spermatocytogenesis[60,61].
Collectively, these results demonstrate a coordinated seasonal arrest of early germ cell differentiation. By blocking progression at the committed-to-pre-meiotic checkpoint in spermatogonia and limiting advancement into later spermatocyte stages during the non-reproductive stage, the testis avoids the high energetic cost of progressing through demanding cell-cycle and biosynthetic programs when environmental conditions are unfavorable[1,3]. In contrast, during the reproductive season, calcium-dependent signaling together with upregulation of cell-cycle (CCNB3), transcriptional (GAG), and protein synthesis (RPL29) genes enables rapid and efficient advancement through these early stages. This reversible checkpoint mechanism therefore constitutes an elegant adaptive strategy that minimizes unnecessary reproductive investment during quiescence while permitting swift reactivation of spermatogenesis as soon as favorable breeding conditions return, thereby maximizing reproductive success in a seasonally fluctuating environment[3,9,18].
We next examined whether late spermatogenesis also exhibits seasonal functional differences. Although the overall composition and differentiation trajectory of late spermatids/spermatozoa were largely preserved between seasons (Supplementary Fig. S2a; Fig. 5f, g), these cells displayed marked season-specific states. Mature spermatids/spermatozoa were relatively more abundant in the non-reproductive stage (Supplementary Fig. S2a) and preferentially expressed genes related to mitochondrial function, proteostasis, and metabolic homeostasis, including MTRF1, SLC25A41, and PPP2R2C (Fig. 5d). In contrast, elongating and mature spermatids in the reproductive stage showed enrichment for upregulated genes involved in structural remodeling, protein synthesis, and signaling pathways essential for sperm tail formation, motility acquisition, and fertilization competence (e.g., cell adhesion/cytoskeleton dynam-ics, PLC signaling, Fe-S cluster assembly; Fig. 5d, e). These observations revealed a pronounced functional divergence in late spermatids between reproductive states. During the reproductive stage, mature spermatids activate transcriptional programs that rapidly confer fertilization competence, including cytoskeletal remodeling for tail formation, PLC-mediated signaling for motility initiation, and Fe-S cluster assembly for energy production required for capacitation and sperm–egg interaction[9,18,62]. By contrast, in the non-reproductive stage, mature spermatids downregulate these maturation- and fertilization-related genes while enhancing pathways involved in mitochondrial maintenance and proteostasis. This shift likely promotes a low-metabolic, survival-oriented cellular state that conserves energy and preserves sperm viability until favorable breeding conditions return[9,18,63]. These reversible transcriptional changes provide an efficient mechanism for sustaining seasonal fertility without the energetic cost of continuous sperm maturation[9,18].
In parallel with germ cell remodeling, the testicular microenvironment also showed changes in immune cell composition and transcriptional profiles. Re-analysis of immune populations revealed distinct seasonal restructuring among immune subpopulations, including T/NK cells, mast cells, and macrophage subsets. T/NK cells and metabolic/antigen-presenting macrophages being enriched during the reproductive stage, whereas mast cells and tissue-resident/inflammatory macrophages predominated in the non-reproductive stage (Supplementary Fig. S3g, S3h). These compositional shifts were accompanied by distinct transcriptional programs. In the non-reproductive stage, mast cells and tissue-resident macrophages upregulated genes involved in protease activity, secretory granules, apoptosis regulation, and tissue maintenance. These programs likely promote controlled tissue remodeling, clearance of cellular debris, and establishment of an anti-inflammatory, tolerogenic microenvironment that protects the accumulated mature spermatids from unnecessary immune attack while maintaining low-energy homeostasis during prolonged quiescence[64−66]. Conversely, reproductive stage T/NK cells and antigen-presenting/metabolic macrophages activated programs supporting immune activation, cell-matrix adhesion, Rac signaling, extracellular matrix organization, and antigen presentation. Such programs facilitate dynamic immune surveillance and create a supportive niche that promotes efficient spermatogenesis and rapid response to increased germ cell demands during active breeding[64,67]. Together, these immune-cell remodeling programs enable the testis to efficiently switch between a protective, energy-conserving state in the non-reproductive season and a productive, spermatogenesis-supporting state in the reproductive season. This dynamic balance may represent an important adaptation that allows seasonal breeders to coordinate reproductive investment with long-term somatic maintenance[9,18].
Several limitations should be acknowledged. Although this study generated a high-resolution single-nucleus atlas of the hedgehog testis, only one individual was analyzed for each physiological state, and therefore the observed cellular and transcriptional differences cannot completely exclude the influence of inter-individual variation or sampling bias. As a result, the robustness and generalizability of some stage-associated changes should be interpreted with caution, and the identified seasonal remodeling patterns should be considered hypothesis-generating rather than definitive population-level conclusions. Future studies incorporating additional biological replicates, multiple seasonal time points, and independent validation approaches will be required to confirm the robustness of the proposed mechanisms underlying seasonal reproduction.
Collectively, our data support a working framework in which seasonal reproduction in the four-toed hedgehog is achieved primarily through reversible remodeling of germ cell states, late-spermatid transcriptional programs, and immune microenvironmental composition, rather than large-scale loss or gain of testicular cell lineages. This framework provides new insights into the cellular basis of reversible fertility in seasonal breeders and may inform future studies on reproductive adaptation, livestock breeding, wildlife conservation, and environmentally associated infertility[68].
-
In conclusion, this study provides the first single-nucleus RNA-sequencing atlas of the four-toed hedgehog testis, revealing the cellular and molecular basis of reversible seasonal reproduction in a non-model mammal. We demonstrate that the testicular cellular architecture—comprising 12 major cell types spanning the full spermatogenic lineage and key somatic/immune populations—remains remarkably stable in both composition and core transcriptomic identity across reproductive and non-reproductive stages. Seasonal transitions are achieved not through large-scale loss or gain of cell lineages, but via coordinated functional reprogramming: a precise differentiation checkpoint at the committed-to-pre-meiotic spermatogonia transition (gated by calcium signaling and anabolic programs), survival-oriented metabolic and proteostatic adaptations in retained mature spermatids/spermatozoa, and dynamic remodeling of the testicular immune microenvironment toward tolerance and homeostasis during quiescence. These findings establish a comprehensive cellular framework for understanding how seasonal breeders balance reproductive investment with somatic maintenance, offering new mechanistic insights into adaptive fertility regulation in mammals. The atlas further provides a valuable resource for comparative reproductive biology, wildlife conservation, and potential applications in optimizing breeding efficiency under fluctuating environmental conditions.
The authors are grateful to the anonymous reviewer(s) for their helpful suggestions.
-
Testicular samples were collected post-mortem from naturally deceased wild adult male four-toed hedgehogs (Atelerix albiventris) found in the field. The study did not involve the capture, handling, or euthanasia of live animals.
-
The authors confirm their contributions to the paper as follows: study conception and design: Chai SM, Yang G, Liu WH; data collection, analysis and interpretation of results, draft manuscript preparation: Zhu CW. All authors reviewed the results and approved the final version of the manuscript.
-
The datasets generated and analyzed during the current study are publicly available in the Figshare repository at: https://doi.org/10.6084/m9.figshare.32228442 (adult non-reproductive-stage hedgehog testis single-nucleus transcriptome expression matrix) and https://doi.org/10.6084/m9.figshare.32228424 (adult reproductive period hedgehog testis single-nucleus transcriptome expression matrix). No custom code was generated in this study. All analyses were performed using publicly available R/Bioconductor packages as described in the Methods section.
-
The authors declare that they have no conflict of interest.
-
accompanies this paper online at: https://doi.org/10.48130/jzser-0026-0007.
- Supplementary Table S1 Representative marker genes and functional descriptions for the 12 major cell types.
- Supplementary Table S2 MetaNeighbor cross-validation AUROC values for matched cell types between re-productive and non-reproductive stages (reproductive → non-reproductive).
- Supplementary Table S3 Top 100 reproductively enriched genes with highest specificity scores in spermato-gonia, ranked by specificity score, comparing reproductive stage versus non-reproductive stage.
- Supplementary Table S4 Proportions of spermatogonial subpopulation states in reproductive and non-reproductive stages, including undifferentiated/SSC-like, early differentiating, differentiation-committed, and pre-meiotic states.
- Supplementary Table S5 Expression levels of key calcium signaling pathway genes in early differentiating spermatogonia, comparing reproductive and non-reproductive stages.
- Supplementary Table S6 Top 100 reproductively enriched genes with highest specificity scores in elongating spermatids, ranked by specificity score, comparing reproductive stage versus non-reproductive stage.
- Supplementary Table S7 Top 100 reproductively enriched genes with highest specificity scores in mature spermatids and spermatozoa, ranked by specificity score, comparing reproductive stage versus non-reproductive stage.
- Supplementary Fig. S1 Spermatogonial subpopulation characterization and functional en-richment analysis.
- Supplementary Fig. S2 Gene Ontology (GO) and KEGG pathway enrichment analysis of differentially expressed genes in elongating spermatids and mature sper-matids/spermatozoa between reproductive and non-reproductive stages.
- Supplementary Fig. S3 GO enrichment analysis and marker gene expression of immune cell subpopulations between reproductive and non-reproductive stages.
- Copyright © 2026 by the author(s). Journal of Zoological Systematics and Evolutionary Research published by Maximum Academic Press on behalf of John Wiley & Sons Ltd. This is an open access article under the terms of the Creative Commons Attribution License, which permits use, distribution and reproduction in any medium, provided the original work is properly cited.
-
About this article
Cite this article
Zhu CW, Liu WH, Yang G, Chai SM. 2026. A single-nucleus RNA atlas of the hedgehog testis reveals the cellular basis of seasonal reproduction. Journal of Zoological Systematics and Evolutionary Research 2026: e007 doi: 10.48130/jzser-0026-0007 

A single-nucleus RNA atlas of the hedgehog testis reveals the cellular basis of seasonal reproduction
- Received: 11 May 2026
- Revised: 11 July 2026
- Accepted: 24 July 2026
- Published online: 28 August 2026
Journal of Zoological Systematics and Evolutionary Research
2026,
Article number: e007 (2026)
|
Cite this article
Abstract: Seasonal reproduction in mammals entails profound functional remodeling of the testis, yet the underlying cellular and molecular mechanisms remain incompletely understood. Here, we employed single-nucleus RNA sequencing (snRNA-seq) to profile testes from reproductive and non-reproductive stages of the four-toed hedgehog (Atelerix albiventris), a representative seasonal breeder exhibiting reversible transitions in reproductive function. By analyzing 16,901 nuclei, we identified 12 major cell types that were consistently preserved across stages, with comparable cell abundances, indicating that seasonal reproductive transitions might rely primarily on functional modulation rather than loss or gain of cellular lineages. This stability was further supported by highly conserved transcriptomic identities across stages. Despite this overall conservation, localized cell subtype compositional and transcriptional changes were primarily detected in spermatogonia, late spermatids, and immune cells. Trajectory analysis revealed that inactivation of spermatogenesis in the non-reproductive stage is driven by a differentiation checkpoint at the transition from committed to pre-meiotic spermatogonia. This gating is associated with upregulated calcium signaling and enhanced post-transcriptional regulation during the reproductive stage, whereas its disruption leads to the accumulation of committed spermatogonia in the non-reproductive stage. Concurrently, mature spermatozoa are still retained during the non-reproductive stage and exhibit survival-oriented programs involving enhanced mitochondrial and proteostasis regulation. In parallel, the testicular immune microenvironment undergoes pronounced seasonal reprogramming, characterized by the polarization of lymphoid cells and macrophages toward immune tolerance and homeostatic maintenance in the non-reproductive stage. Together, these findings demonstrate that transitions in reproductive function in the four-toed hedgehog testis are governed by coordinated regulation of spermatogonia differentiation gating, spermatozoa metabolic reprogramming, and immune microenvironmental remodeling, providing a comprehensive cellular framework for understanding seasonal reproduction and adaptations in mammals.