


-
The nitrogen (N) paradox—the stark contrast between N's role as a cornerstone of global food security and its emergence as a primary driver of environmental degradation—poses a critical challenge for sustainable development. Since the Haber-Bosch process revolutionized N fixation over a century ago, synthetic fertilizers have enabled a 300% increase in global crop yields, sustaining 4.5 billion people[1]. Yet, this agricultural triumph has come at a devastating cost: reactive nitrogen (Nr) emissions now account for 78% of global N pollution, fueling eutrophication, biodiversity loss, and greenhouse gas emissions equivalent to 1.5 gigatons of CO2-equivalent annually[2−4]. This duality necessitates a paradigm shift in N governance. Feeding 10 billion people by 2050 within planetary boundaries requires simultaneously addressing two imperatives: (1) nutritional imperatives: Scaling plant-based diets and reducing food waste by 50% could cut agricultural N demand by 35%[5]; and (2) environmental imperatives: Implementing precision agriculture (e.g., variable-rate fertilization) and closing N loops through manure recycling could reduce losses by 40%−60% without compromising yields[6−8]. Thus, resolving the N paradox demands integrating food systems transformation with circular economy principles—a challenge as complex as balancing the Haber-Bosch process's dual legacy of life and death.
Nitrogen pollution risk is especially serious in China, where grain production has increased more than three times since 1960 in response to an approximately 100-fold increase in the application of N (NPK) fertilizers[9], but at the cost of very large emissions of Nr to the environment due to its overuse in intensive agricultural regions[10,11]. Excessive N application has caused significant acidification of agricultural soils[12], eutrophication of surface waters[13], and impacts on terrestrial ecosystems due to enhanced ammonia emissions and resulting N deposition to land[14−16]. In addition, excessive Nr poses significant risks to human health through two distinct pathways: (1) ammonia volatilization contributes to secondary particulate pollution; while (2) enhanced nitrate leaching contaminates groundwater and surface water resources that serve as drinking water supplies[17]. The potential health effects of high nitrate levels include reproductive problems, methaemoglobinaemia ('blue-baby' syndrome), and cancer of the digestive tract[17,18]. Increased levels of particulate matter (PM) can damage lung function. A recent study by Pozzer et al.[19] showed that a 50% reduction in agricultural ammonia emissions could reduce the global mortality attributable to air pollution by ca 250,000 people per year, amounting to reductions in mortality of 30%, 19%, 8%, and 3% over North America, Europe, East Asia, and South Asia, respectively. The various impacts also impose large societal and economic costs, and the benefits of measures to reduce Nr losses are likely much higher than the abatement costs, as has been shown recently for ammonia[20,21]. China represents not merely a nation grappling with severe N challenges but also a globally significant 'hyper-accelerated case study' that provides critical predictive insights for developing countries navigating similar trajectories[22,23].
The intensifying demand for food security in China, driven by population growth and dietary shifts, necessitates sustainable intensification of agricultural systems. While the 'Zero Increase Action Plan' (2015) has curbed chemical N fertilizer use[24], its reliance on partial NUE improvements overlooks the critical knowledge gap in harmonizing fertilizer and manure systems. Zhang et al.[7] projected a 2050 N demand of 27 Tg N yr−1 for China under 60% NUE, but their framework ignored manure's role in closing yield gaps while mitigating N losses. The present analysis quantifies, for the first time, the dual thresholds of N inputs for food production and critical N loss limits (e.g., NH3 volatilization and nitrate N leaching), revealing that current practices are fall shorts of these benchmarks. By establishing an integrated framework, policy blueprints are derived that reduce fertilizer dependency and increase organic manure recycling while sustaining yields—a prerequisite for aligning China's agricultural targets with the Sustainable Development Goals (SDGs). However, no distinction was made between fertilizer and manure inputs, and incomplete manure recycling was not considered. Insight into combined fertilizer and manure management is crucial for assessing required changes in agricultural practices at the national scale. To this end, the necessary N inputs required to meet food production demands in China were first evaluated, comparing these requirements against critical N inputs and critical N loss thresholds to minimize environmental pollution. Variations in N source types were further distinguished, and historical trends in N inputs and losses spanning 1961−2018 were analyzed. Building on this analysis, actionable strategies for fertilizer and manure management were identified that could simultaneously fulfil food production targets and environmental protection goals, and the associated costs and benefits quantified.
To address the need for strategic depth, the N budget was redefined as a diagnostic tool for evaluating historical phases of China's agricultural development. By quantifying national-scale N inputs in 1961, 1980, 2000, and 2018, systemic imbalances in NUE across four developmental epochs were diagnosed. They represent: (1) the early stage of the New China (1961, manure dominant); (2) the post-reform era (1980, wide use of fertilizer N); (3) the moderate prosperity phase (2000, overuse of fertilizer N); and (4) the primary developed stage (2018, peak N surplus). This diagnostic approach revealed critical N thresholds through a multi-objective assessment framework, including the environmental, economic, and social pillars. By aligning these metrics with China's SDG targets (SDG 2 and 13), a novel sustainability framework that balances food security with ecological resilience was established. As a first step, the fate of N fertilizer in agroecosystems was summarized by data-mining and national-scale N budgets calculated for major crop systems in China for the years 1961, 1980, 2000, and 2018, which serves as an important tool to quantify the N surplus and the need for sustainable N management[25−26]. The results in terms of N inputs, N uptake, and N losses to air and water at the four time-points are then discussed in the context of the required N inputs for food demand and the critical N inputs and losses for minimizing environmental pollution. Critical N inputs were estimated based on acceptable thresholds for ammonia emissions to air and nitrate leaching to groundwater, using critical N loads for biodiversity protection and critical limits for groundwater quality (drinking water) to avoid impact on human health[4,27]. The potential for management practices to achieve sustainable development by minimizing the gap between actual and required/critical N inputs were quantified. Finally, the direct and indirect economic benefits of saving fertilizer N and reducing Nr emissions to the environment were analyzed.
-
Cropland N inputs comprise fertilizer, manure, and environmental sources (including N deposition, irrigation, and biological N fixation), while outputs comprise crop uptake, NH3 emissions, leaching and runoff, and denitrification-nitrification processes (including N2O, NOx and N2). N budgets were calculated using the mass balance approach[28]:
$ {\sum} _{\mathrm{h}=1}^{\mathrm{m}}{\mathrm{N}}_{{\mathrm{I}\mathrm{N}}_{\mathrm{h}}}={\sum} _{\mathrm{g}=1}^{\mathrm{n}}{\mathrm{N}}_{{\mathrm{O}\mathrm{U}\mathrm{T}}_{\mathrm{g}}}+{\sum} _{\mathrm{k}=1}^{\mathrm{p}}{\mathrm{A}\mathrm{C}\mathrm{C}}_{\mathrm{k}} $ (1) $ {\sum} _{\mathrm{h}=1}^{\mathrm{m}}{\mathrm{N}}_{{\mathrm{I}\mathrm{N}}_{\mathrm{h}}}={\mathrm{N}}_{\mathrm{F}\mathrm{E}\mathrm{R}}+{\mathrm{N}}_{\mathrm{O}\mathrm{M}}+{\mathrm{N}}_{\mathrm{E}\mathrm{N}\mathrm{V}} $ (2) $ {\sum} _{\mathrm{g}=1}^{\mathrm{m}}{\mathrm{N}}_{{\mathrm{O}\mathrm{U}\mathrm{T}}_{\mathrm{g}}}={\mathrm{N}}_{\mathrm{U}\mathrm{P}}+{\mathrm{N}}_{\mathrm{S}\mathrm{U}\mathrm{R}} $ (3) $ \mathrm{N}_{\mathrm{OM}}\mathrm{\ =\ N}_{\mathrm{ROM}}\mathrm{\ +\ N}_{\mathrm{NOM}} $ (4) $ \mathrm{N}_{\mathrm{ENV}}\mathrm{\ =\ N}_{\mathrm{DEP}}\mathrm{\ +\ N}_{\mathrm{FIX}}\mathrm{\ +\ N}_{\mathrm{IRR}} $ (5) where, INh and NOUTg represent N input and N output; ACCk represents N accumulation; NIN denotes N input into the system; NUP means N uptake by crops; NFER and NOM denote N input from chemical fertilizer and manure, respectively, where NOM comprises two components: recycled manure (NROM) and non-recycled manure (NNOM) (For NNOM, it is assumed to be applied to fallow land with half is lost directly to water and the remaining half lost through NH3 volatilization and denitrification—each process accounting for approximately half of this portion)[29,30]; and NENV denotes N from the environment, including N deposition (NDEP), biological fixation (NFIX) and irrigation (NIRR).
Neglecting small changes in soil N pools over the long term, N input and output budgets in China between 1961 and 2018 were systematically evaluated. The N surplus (NSUR) was calculated as the difference between N input and N uptake (NUP) by harvested crops:
$ \mathrm{N}_{ \mathrm{sur}} \mathrm{=N}_{ \mathrm{IN}} -\mathrm{N}_{ \mathrm{UP}} $ (6) where, NSUR (N surplus, defined as the difference between N inputs and N uptake) comprises NH3 volatilization (NNH3), and NDN (N2O, NO and N2 emissions from denitrification-nitrification) and NO3− to water (leaching and runoff).
Nitrogen fertilizer use (NFER) and manure N (NOM) in China were estimated using data from the China National Statistics Yearbook and EARTHSTAT[31,32]. NDEP was obtained from published data on N deposition in China as described in Liu et al.[14], Xu et al.[33], and Wen et al.[34]. NIRR was calculated according to relationships between NIRR and years, derived from published data[35]. The N uptake (NUP) was calculated in three steps: (1) NUP for 16 main crops (i.e. wheat, rice, maize, soybean, barley, sorghum, millet, rapeseed, groundnut, sunflower, sugarcane, potato, cassava, oilpalm, rye, and sugarbeet) (Supplementary Fig. S1) was calculated by the sum of NUP of each crop's NUP, which is multiplied by national crop production and N content; (2) NUP for other crops (i.e. vegetables) was estimated using the same step as for the 16 main crops; and (3) the total NUP for all crops in China was obtained by summing the values from the previous steps. To assess the effects of changing N inputs on N losses to air and water from China's cropping systems, a literature survey was conducted to assess the fate of N fertilizer and its contribution of NH3 emission, N2O emission, N leaching, N runoff, and N uptake (Supplementary Figs S2 & S3c as well as the references in the Supporting Information). Crop production data were derived from the Chinese National Statistics Yearbook[32], while the crop Nup (including N content), and N loss fractions were obtained from a literature survey (Supplementary Fig. S2).
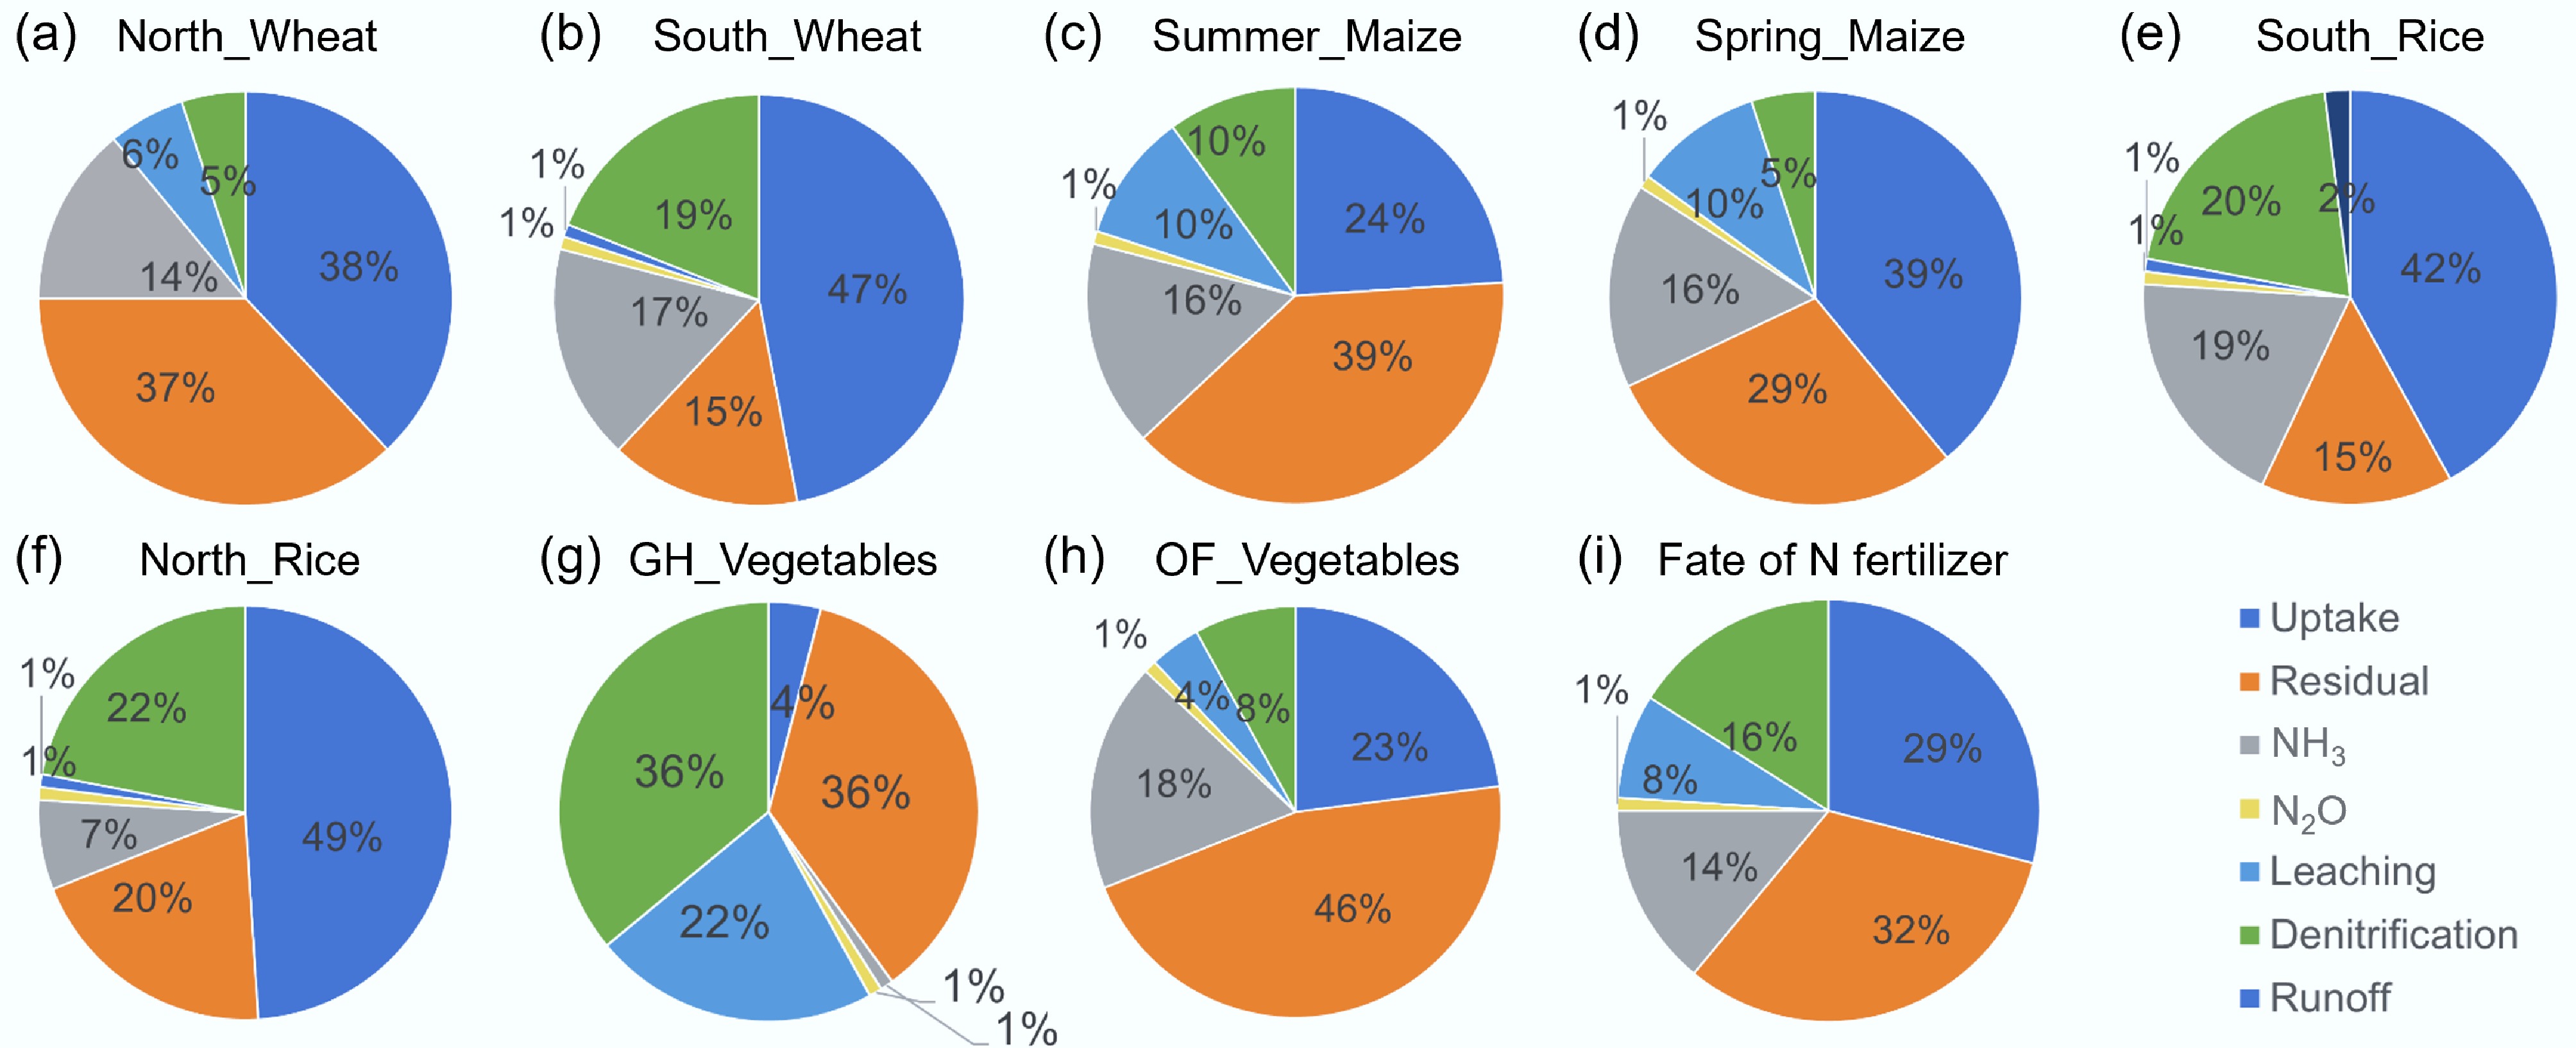
Figure 1.
Fate of fertilizer N in different crops. (a) North_Wheat. (b) South_Wheat. (c) Summer_Maize. (d) Spring_Maize. (e) South_Rice. (f) North_Rice. (g) Greenhouse(GH)_Vegetables. (h) Openfield(OF)_Vegetables and the overall fate of N fertilizer in China's crop production (i). Data were summarized from literature and introduced for details in the Material and methods section as well as the supplementary information.
Required N input
-
Required N input (Nreq) denotes the necessary N input to supply the normal human protein-N requirement under a targeted N use efficiency[27]. Nreq was calculated according to:
$ \mathrm{N}_{\mathrm{req}}\mathrm{\ =\ N}_{\mathrm{int,req}}\ \times\ \mathrm{T}_{\mathrm{pop}}\mathrm{/NUE}_{\mathrm{f}} $ (7) where, Nreq denotes the required N input; Nint,req denotes the required annual human body N intake per year; Tpop denotes the national population (billion), and NUEf denotes the national average N use efficiency (N consumption/N input) in the whole food chain (%).
Nint,req was defined as 3.5 kg N capita−1 yr−1, based on Chinese national dietary guidelines, slightly higher than the value of 3.0 kg N capita−1 yr−1 proposed by Westhoek et al.[36] and De Vries et al.[27]. Tpop in China was 0.66, 0.99, 1.27, and 1.40 billion in 1961, 1980, 2000, and 2018, respectively. The value for NUEf in the food system was taken from Ma et al.[37] as the average value of 0.16 (0.09−0.20). The fixed NUEf value of 0.16 (achieved in 1980) was used as a theoretically achievable and nutritionally balanced benchmark, reflecting a state where plant and animal protein intake are in equilibrium. This value provides a reference for calculating the minimum critical N inputs needed to sustain both food production and environmental sustainability in China. While actual NUEf has declined over time, this benchmark remains relevant for evaluating progress toward improved N management practices.
Critical N losses to water
-
Critical N losses to water were calculated from the N surplus leached to groundwater or surface water (runoff)[25]. Critical N losses to groundwater per hectare of land was calculated by multiplying a critical NO3-N concentration for groundwater by an annual averaged water leaching rate, which is a fraction of precipitation plus irrigation, as shown in the following equation:
$ \mathrm{NO}_{ \mathrm{3}}{\text-} \mathrm{N}_{ \mathrm{lea,ha}} \mathrm{(crit)=NO}_{ \mathrm{3}}{\text-} \mathrm{N}_{ \mathrm{dw}} \mathrm{(crit)\,\times\, W}_{ \mathrm{AL}} \,\times\,\mathrm{ 10}^{ \mathrm{-2}} $ (8) where, NO3-Nlea,ha (crit) denotes the critical N loss per hectare of land (kg N ha−1 yr−1); NO3-Ndw (crit) denotes the critical N concentration for drinking water (mg N L−1), as defined by the WHO guideline; WAL denotes the annual average leaching rate in China (mm yr−1); 10−2 is a conversion coefficient from mg N L−1 × mm to kg N ha−1 yr−1.
The critical N loss for the whole country was then calculated as:
$ \mathrm{NO}_{ \mathrm{3}}{\text-} \mathrm{N}_{ \mathrm{lea,to}} \mathrm{(crit)=NO}_{ \mathrm{3}} {\text-}\mathrm{N}_{ \mathrm{lea,ha}} \mathrm{(crit)\,\times\, Area}_{ \mathrm{crop}} \,\times\,\mathrm{ 0.001} $ (9) where, Areacrop denotes the cropland area (Mha) in China; 0.001 is a coefficient to convert Million kg N yr−1 to Million tons N yr−1, i.e. Tg N yr−1.
11.3 mg N L−1 was used as NO3-Ndw (crit) based on the WHO standard for the NO3− concentration in drinking water. Despite natural variations, this threshold is still appropriate as the present study specifically investigates the mitigation of human health risks associated with nitrate pollution from agricultural N fertilization, where groundwater contamination remains the primary exposure pathway. The national annual average leaching rate from croplands, WAL, was calculated as the sum of precipitation and irrigation minus evapotranspiration for the different crops and integrated across the main agricultural regions in the country (Supplementary Table S1). Based on Huang[38] and Li & Huang[39], the average annual leaching rate was calculated to be 160 mm yr−1. Multiplying the annual average leaching rate by the critical concentration of 11.3 mg N L−1 gives an annual average acceptable N loss (NO3-Nle (crit)) to groundwater of 18.1 kg N ha−1 yr−1. Multiplying this value by a cropland area of 125 Mha gives an acceptable annual loss of 2.3 Tg N yr−1.
Critical NH3 losses to air
-
As an N-indicator for eutrophication and related biodiversity (especially plant species diversity) decline in terrestrial ecosystems, the approach of De Vries & Schulte-Uebbing[40] was used, which took the area-weighted mean critical N load as a basis to assess critical NH3 emission rates. In this way, the critical NH3 emission per hectare of land and the total emission for the country were derived according to De Vries et al.[25]:
$ \mathrm{NH}_{ \mathrm{3}}{\text-} \mathrm{N}_{ \mathrm{em,ha}} \mathrm{(crit)=N}_{ \mathrm{totdep}} \mathrm{(crit)\,\times\, f}_{ \mathrm{NH3}} \mathrm{/f(ag)} $ (10) $ \mathrm{NH}_{ \mathrm{3}}{\text-} \mathrm{N}_{ \mathrm{em,tot}} \mathrm{(crit)=N}_{ \mathrm{em,ha}} \mathrm{(crit)\,\times\, Area}_{ \mathrm{crop}}\,\times\, \mathrm{ 0.001} $ (11) where, NH3-Nem,ha (crit) denotes the critical NH3 emission rate (kg N ha−1 yr−1); Ntotdep (crit) denotes the critical total N deposition (kg N ha−1 yr−1); fNH3 denotes the fraction of NH3 in total (NOx + NH3) deposition; f (ag) denotes the fraction of agricultural land in a region. According to Bobbink et al.[41], the Ntotdep (crit) was set at a country average value of 10 kg N ha−1 yr−1, a widely accepted conservative benchmark. For fNH3 and f (ag), national average values were used, i.e fNH3 as 0.54 according to Xu et al.[42] and f(ag) as 0.13 (125 Mha/960 Mha). The value of NH3-Nem (crit) was thus calculated at 10 × 0.54/0.13 = 42 kg NH3-N ha−1 yr−1, which is equivalent to 5.2 Tg N yr−1.
Critical N inputs
-
Critical N inputs related to either critical NO3-N losses to groundwater or critical NH3-N emissions to air were calculated from the above critical N losses divided by either the average N leaching fraction or NH3-N emission fraction from croplands (relative to total N input):
$ \mathrm{N}_{ \mathrm{input}} \mathrm{(crit)=N}_{ \mathrm{loss}} \mathrm{(crit)/frN}_{ \mathrm{ave\_loss}} $ (12) where, Ninput (crit) denotes the critical N input (Tg N yr−1); Nloss (crit) denotes the critical N loss (either N leaching or NH3-N emission) rate (Tg N yr−1); frNave_loss denotes the average N loss fraction (unitless), which is either the country average NO3-N leaching fraction or NH3-N emission fraction. The uncertainties in critical N inputs at the national scale were estimated at 25% assuming that uncertainties at the local scale average out. The 25% uncertainty estimate is based on previous studies: (1) Ma et al.[37] reported a 20%−30% uncertainty in national-scale N use efficiency (NUE) due to variability in agricultural practices and emission factors; (2) Oenema et al.[43] estimated > 30% uncertainty in the N budgets of the Netherlands, emphasizing spatial heterogeneity in soil properties and management. The limitations of current simple uncertainty estimate regarding spatial resolution and data granularity are also realized, and it is proposed that future work should refine uncertainties using high-resolution datasets.
Cost savings
-
The proposed changes in N management will lead to direct and indirect beneficial economic effects. Direct beneficial effects include the reduced costs of N fertilizer. Based on the costs of urea of about EUR€300−500 per ton, and an N content of 46%, N fertilizer costs were calculated to be EUR€0.6−1.0 per kg N, with an uncertainty of 50% to account for price differences for different types of fertilizers. The indirect benefits from reduced health costs and environmental improvement were based on the willingness to pay (WTP) in the EU27[44], corrected for the ratio of gross domestic product (GDP) per capita in China to that in EU27. The WTP for China was derived from the corrected values from the EU based on various N losses to air and water given in Supplementary Table S2.
Further methodological details and a complete list of references supporting the estimation of each N output are provided in Supplementary File 1 (methods) and Supplementary File 2 (references), respectively.
-
Based on data mining derived from literature, the fate of fertilizer N in China's cropland during the 2000s is summarized in Fig. 1. For every crop (Fig. 1a−h), N use efficiency (NUE; indicated by uptake in the figure) exhibited a significant variability (4%−49%), with cereals (wheat, maize, and rice) showing higher NUE than vegetables—specifically, openfield vegetables (23%) displayed markedly greater NUE than greenhouse vegetables (4%). Soil residual N was categorized into two groups: higher residual N (29%−46%) was observed in northern wheat, summer/spring maize, and greenhouse/openfield vegetables; lower residual N (15%−20%) occurred in southern wheat and rice in both southern and northern regions. Compared to N losses via N2O and N runoff (0%−1%), NH3 volatilization, N leaching, and total denitrification emerged as three primary N loss pathways across all crops. Exceptions included southern wheat (with only 1% leaching loss) and greenhouse vegetables (with 1% NH3 loss). Nitrogen fate reflects integrated results of crop, soil, climate, and management[23]. Compared with cereals (i.e., rice, wheat, and maize) and openfield vegetables, the very low NUE (NUP), and high N loss (esp. N leaching and denitrification) in greenhouse vegetables are mainly due to extremely high N and organic carbon inputs with frequent irrigation under shallow root systems, all of which restrict crop N uptake but favor N leaching and denitrification losses. In contrast, NH3 volatilization is low in the greenhouse vegetables because of high soil moisture and a closed environment (greenhouse conditions).
At the national scale (Fig. 1i), the fate of fertilizer N was distributed as follows: 29% recovered by crops, 32% residual in soil, and 39% lost to the environment. Among these losses, total denitrification dominated (16%), followed by NH3 volatilization (14%), N leaching (8%), and N2O emissions/N runoff (both ≤ 1%). Collectively, these results underscore low NUE and elevated N loss rates, particularly in greenhouse vegetable production systems[45]. Based on these data-mining results, the historical N budgets in China are estimated below.
N budgets and food security
-
To gain an overall insight into long-term changes of China's N budgets, a long-term dataset of China's N inputs (from N fertilizer, manure, and the environment) and outputs (crop uptake, NH3 emissions, leaching/runoff, gaseous losses from denitrification and nitrification) between 1961 and 2018 were systematically compiled based on a mass balance approach[28]. The years 1961, 1980, 2000, and 2018 were chosen as four exemplar time points to show the changes in N flows (Fig. 2a−d), while annual changes of total N input and output are given in Supplementary Fig. S2a and b.
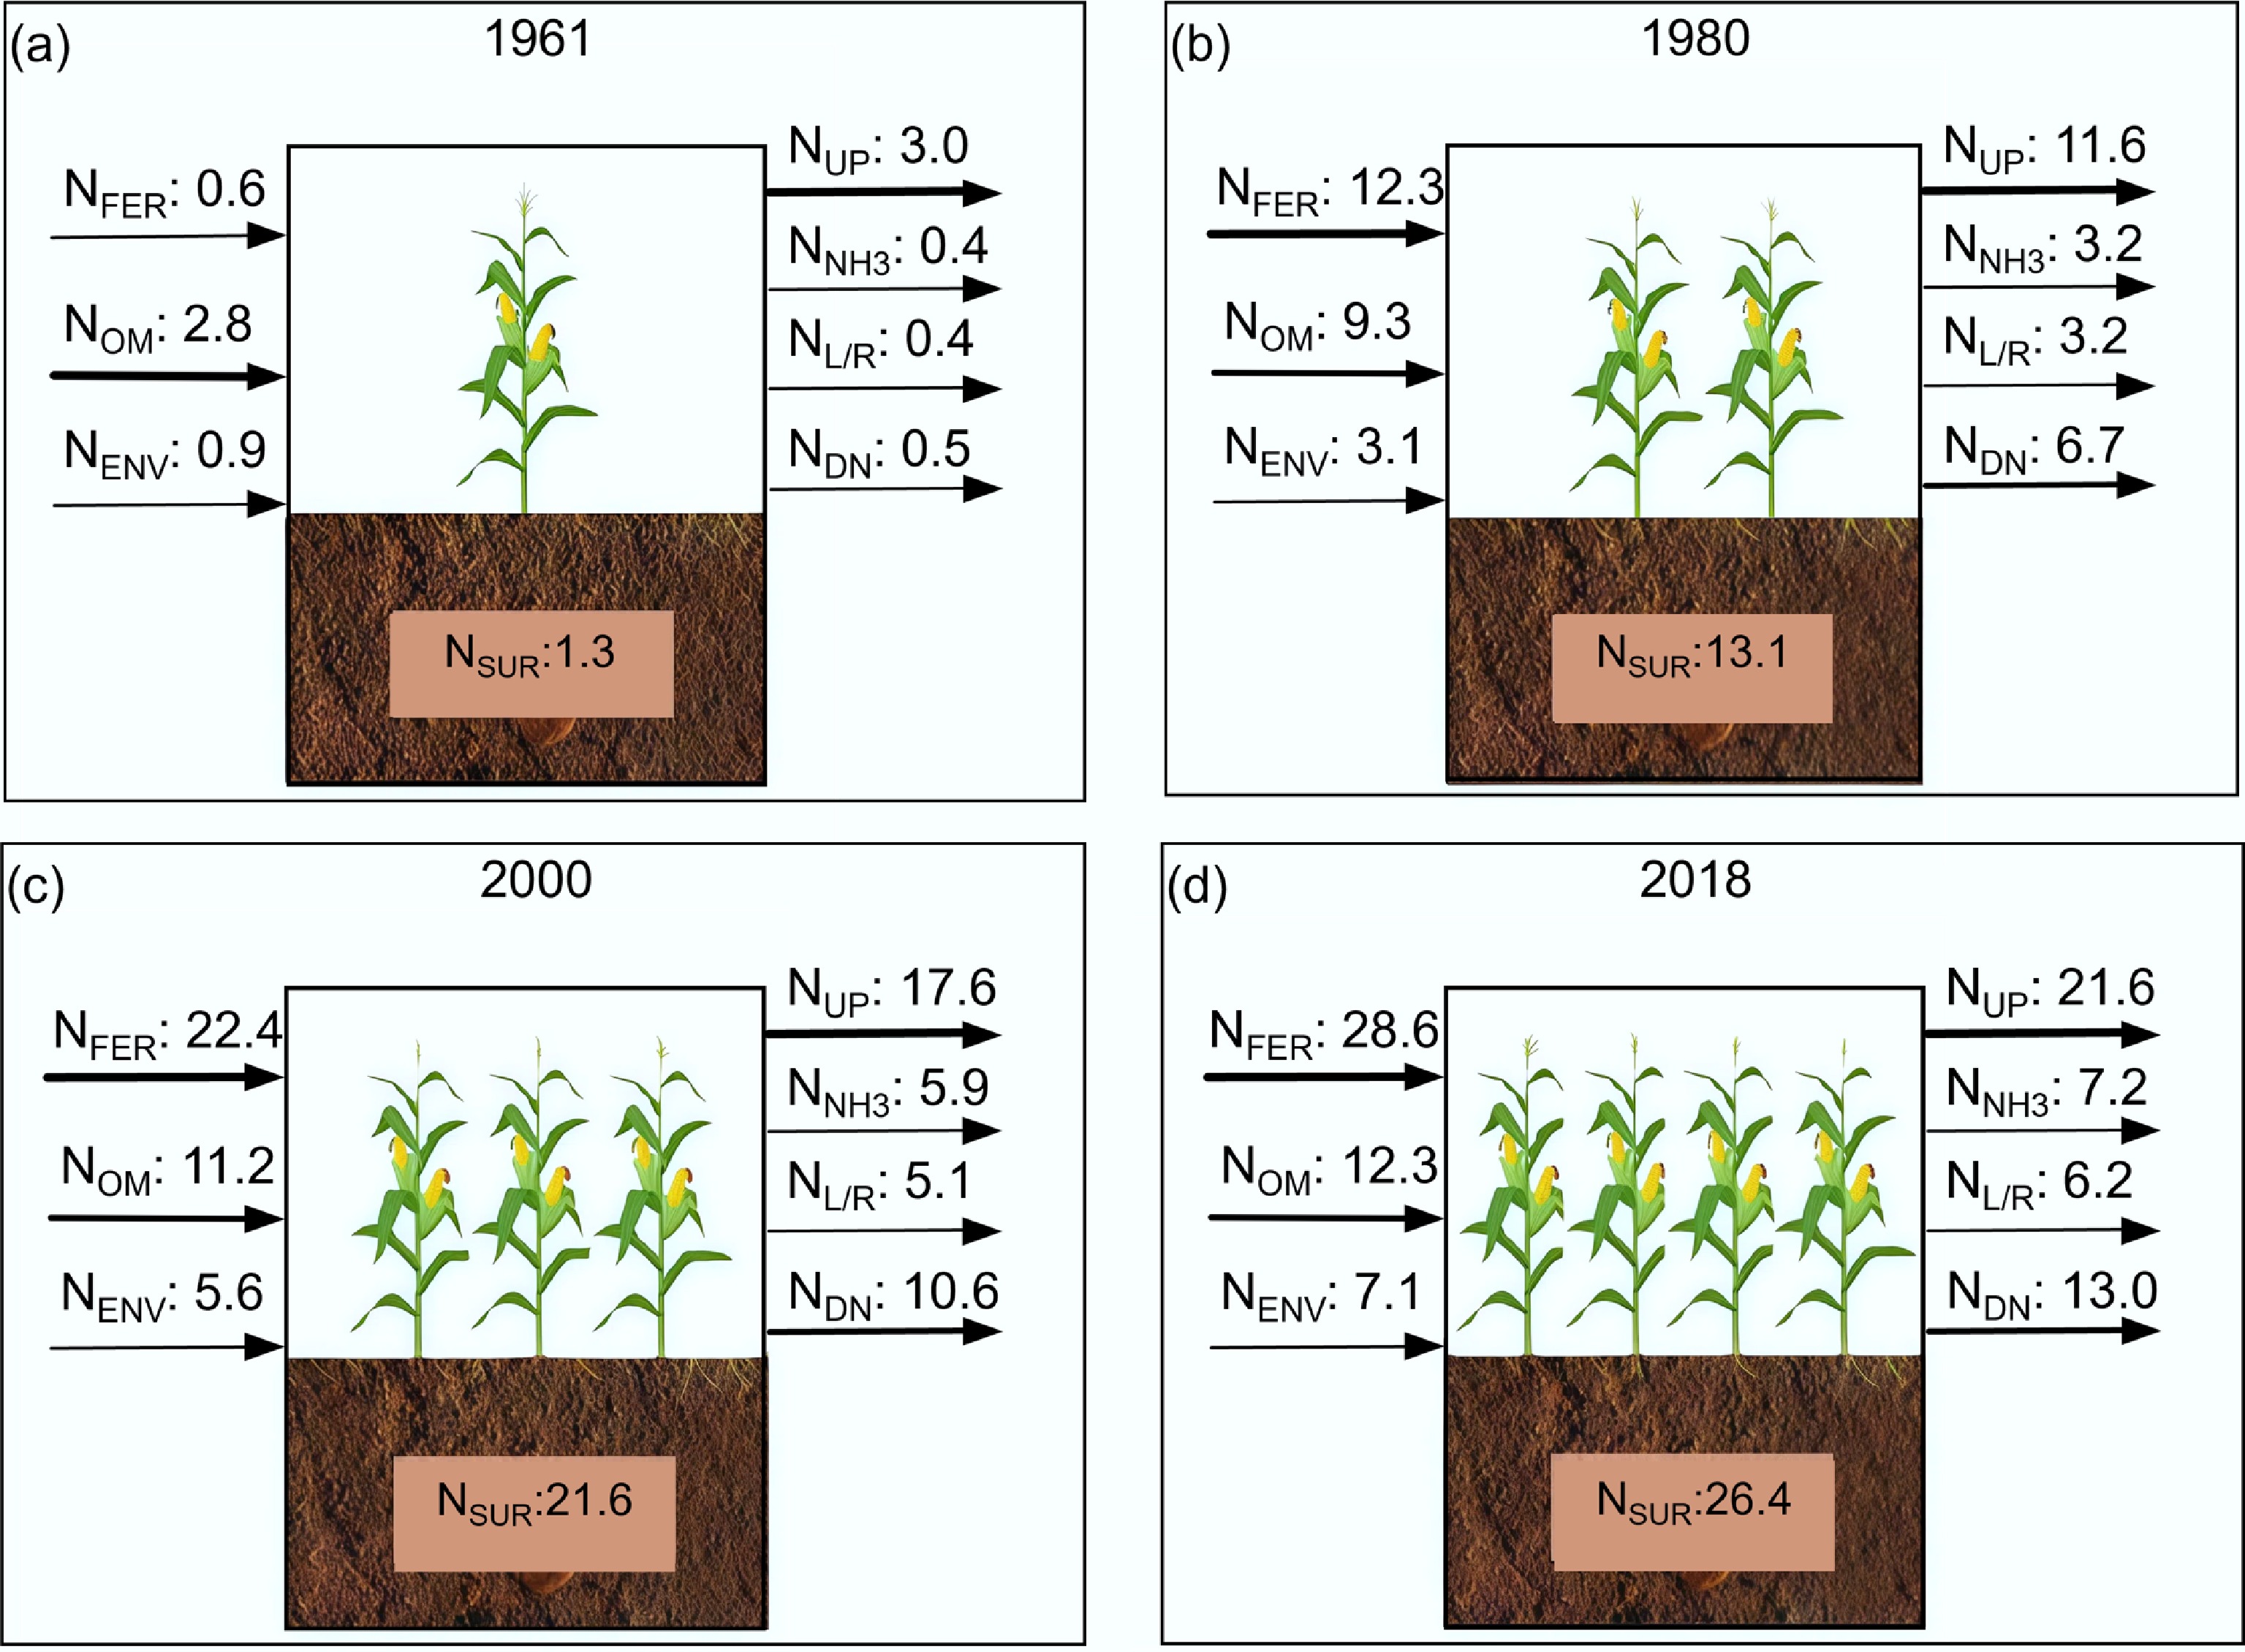
Figure 2.
Nitrogen inputs and losses to the environment in China's crop production systems: (a)−(d), N flows (Tg N yr−1) in 1961, 1980, 2000, and 2018; (e) and (f) changes of total N inputs and outputs. Abbreviations: NFER, N from fertilizer; NENV, N from environment (sum of N fixation, deposition and irrigation); NOM, N from manure; NUP, N uptake by crop; NNH3, N loss from NH3 emission; NL/R, N loss from leaching and runoff; NDN, N loss from denitrification and nitrification (N2, NO and N2O); NSUR, N surplus equals the sum of all N losses to air and water (sum of NNH3, NL/R and NDN).
In 1961, China was experiencing a three-year period of economic hardship, facing serious societal issues (e.g., food scarcity) (Supplementary Fig. S4). Under this background, the use of N fertilizer (NFER, 0.6 Tg N yr−1) was very low, and major N inputs were recycled manure (2.6 Tg N yr−1) plus atmospheric N deposition and N in irrigation water, together defined as N from the environment (NENV, 0.9 Tg N yr−1); crop uptake (NUP) was 3.0 Tg N yr−1 and the N surplus (NSUR, 1.3 Tg N yr−1) was relatively small (Fig. 2a). N losses from manure (NOM, both recycled to croplands, i.e. NROM and not recycled, i.e. NNOM) were included in the overall N budget analysis (Supplementaty Table S2). The overall N use efficiency (NUE, defined as the percentage of the total N input that is retained in the harvested parts of the crop) was 70%, with 30% of total N input being lost to the environment as NH3, N leaching, runoff, and denitrification (NDN including N2O, NO, and N2). However, cereal production was only 140 Mt yr−1, equal to 235 kg capita−1 yr−1, and daily protein intake was only 40 g capita−1 (Supplementary Fig. S2), less than the WHO recommendation (50 g capita−1 d−1)[46]. At that time, most of the population of China was suffering from hunger and was chronically under-nourished due to food shortages and famine. Food production was the top priority for the Chinese government at this time.
By 1980, China was in the post-reform era, achieving initial industrialization and self-sufficiency in agricultural products. The demand for food and economic development had greatly stimulated the widespread use of N fertilizer. N fertilizer (12.3 Tg N yr−1) had become the largest N input to cropping systems, followed by N inputs from organic manure (9.3 Tg N yr−1), and the environment (3.1 Tg N yr−1). Meanwhile, national N uptake (11.6 Tg N yr−1) was lower than the N surplus (13.1 Tg N yr−1) (Fig. 2b), with NUE decreasing to 47%. Total cereal production, however, had increased to 321 Mt yr−1, equalling 325 kg capita−1 yr−1, and consequently the average daily dietary protein consumption had reached 53 g capita−1, but with only 12% coming from animal products (Supplementary Fig. S4). Overall food demand was largely met, yet the proportion of animal protein in the diet remained below the WHO recommendation (20%−30%).
After 1980, rapid economic development and an increasingly wealthy lifestyle in China strongly stimulated agricultural expansion. The 'Meeting vegetable/fruit/animal-products in market (Cai-Lan-Zi)' project, launched by the government in 1988, greatly increased the production of vegetables, fruits, and animal products through a combination of increases in per unit-area yield and in the harvested areas of vegetables and fruits. This was accompanied by a massive increase in N fertilizer production and consumption[22].
In 2000, China's economy entered a moderate prosperity phase and gradually became the 'world factory', resulting in a large amount of N surplus in agriculture. Total N inputs to cropping systems grew to 39.2 Tg N yr−1, with a very large input from fertilizers (22.4 Tg N yr−1), followed by N from organic manure (11.2 Tg N yr−1) and from deposition and irrigation (NENV of 5.6 Tg N yr−1) (Fig. 2c; Supplementary Table S2). Crop uptake (17.6 Tg N yr−1) accounted for 45% of the total N input. The N surplus (21.6 Tg N yr−1) via NH3 volatilization (5.9 Tg N yr−1), N leaching and runoff (5.1 Tg N yr−1), and denitrification (10.6 Tg N yr−1) almost doubled compared with that in 1980. Total grain production increased to 462 Mt yr−1, equal to 364 kg capita−1 yr−1 with an average daily dietary protein consumption of 75 g capita−1, including 25% from animal products (Supplementary Fig. S4). Large losses mainly attributed to direct discharge of animal excreta to surface water or to N leaching, NH3 volatilization and denitrification from the soil and manure management (55%).
In 2018, China completed its primary modernization, and its agricultural input and production showed further increases. Between 2000 and 2015, there was a continuous increase in N inputs from 39.2 Tg N yr−1 to 52.3 Tg N yr−1, and the N surplus increased by 22% from 21.6 to 28.8 Tg N yr−1 (Fig. 2c; Supplementary Fig. S2a, b). Total grain production (621 Mt yr−1), annual grain consumption (452 kg capita−1), and daily dietary protein intake (98 g capita−1) in 2015 increased substantially by 24%−34% relative to 2000, including 35% protein intake from animal products (Supplementary Fig. S4). China had greatly improved its grain production, a very significant achievement, but this was accompanied by significant N losses to air and water. Between 2015 and 2018, a decline of 8% in total N inputs was observed (from 52.3 Tg N yr−1 in 2015 to 48.0 Tg N yr−1 in 2018) (Fig. 2d; Supplementary Fig. S2a), which was mainly explained by the implementation of the 'Zero Increase Plan' for N fertilizer by the Chinese Ministry of Agriculture and Rural Affairs in 2015[24]. The N surplus also decreased by 8% from 28.8 to 26.4 Tg N yr−1, suggesting successful policy interventions for reducing agricultural N pollution.
Required and critical N inputs
-
To quantify the environmental impact of N used in food production, the required N input for food demand and the critical N input for minimizing environmental harm for China was calculated, and the time estimated when the actual N input exceeded the critical N input (Fig. 3a−d) based on environmental thresholds[27,47].
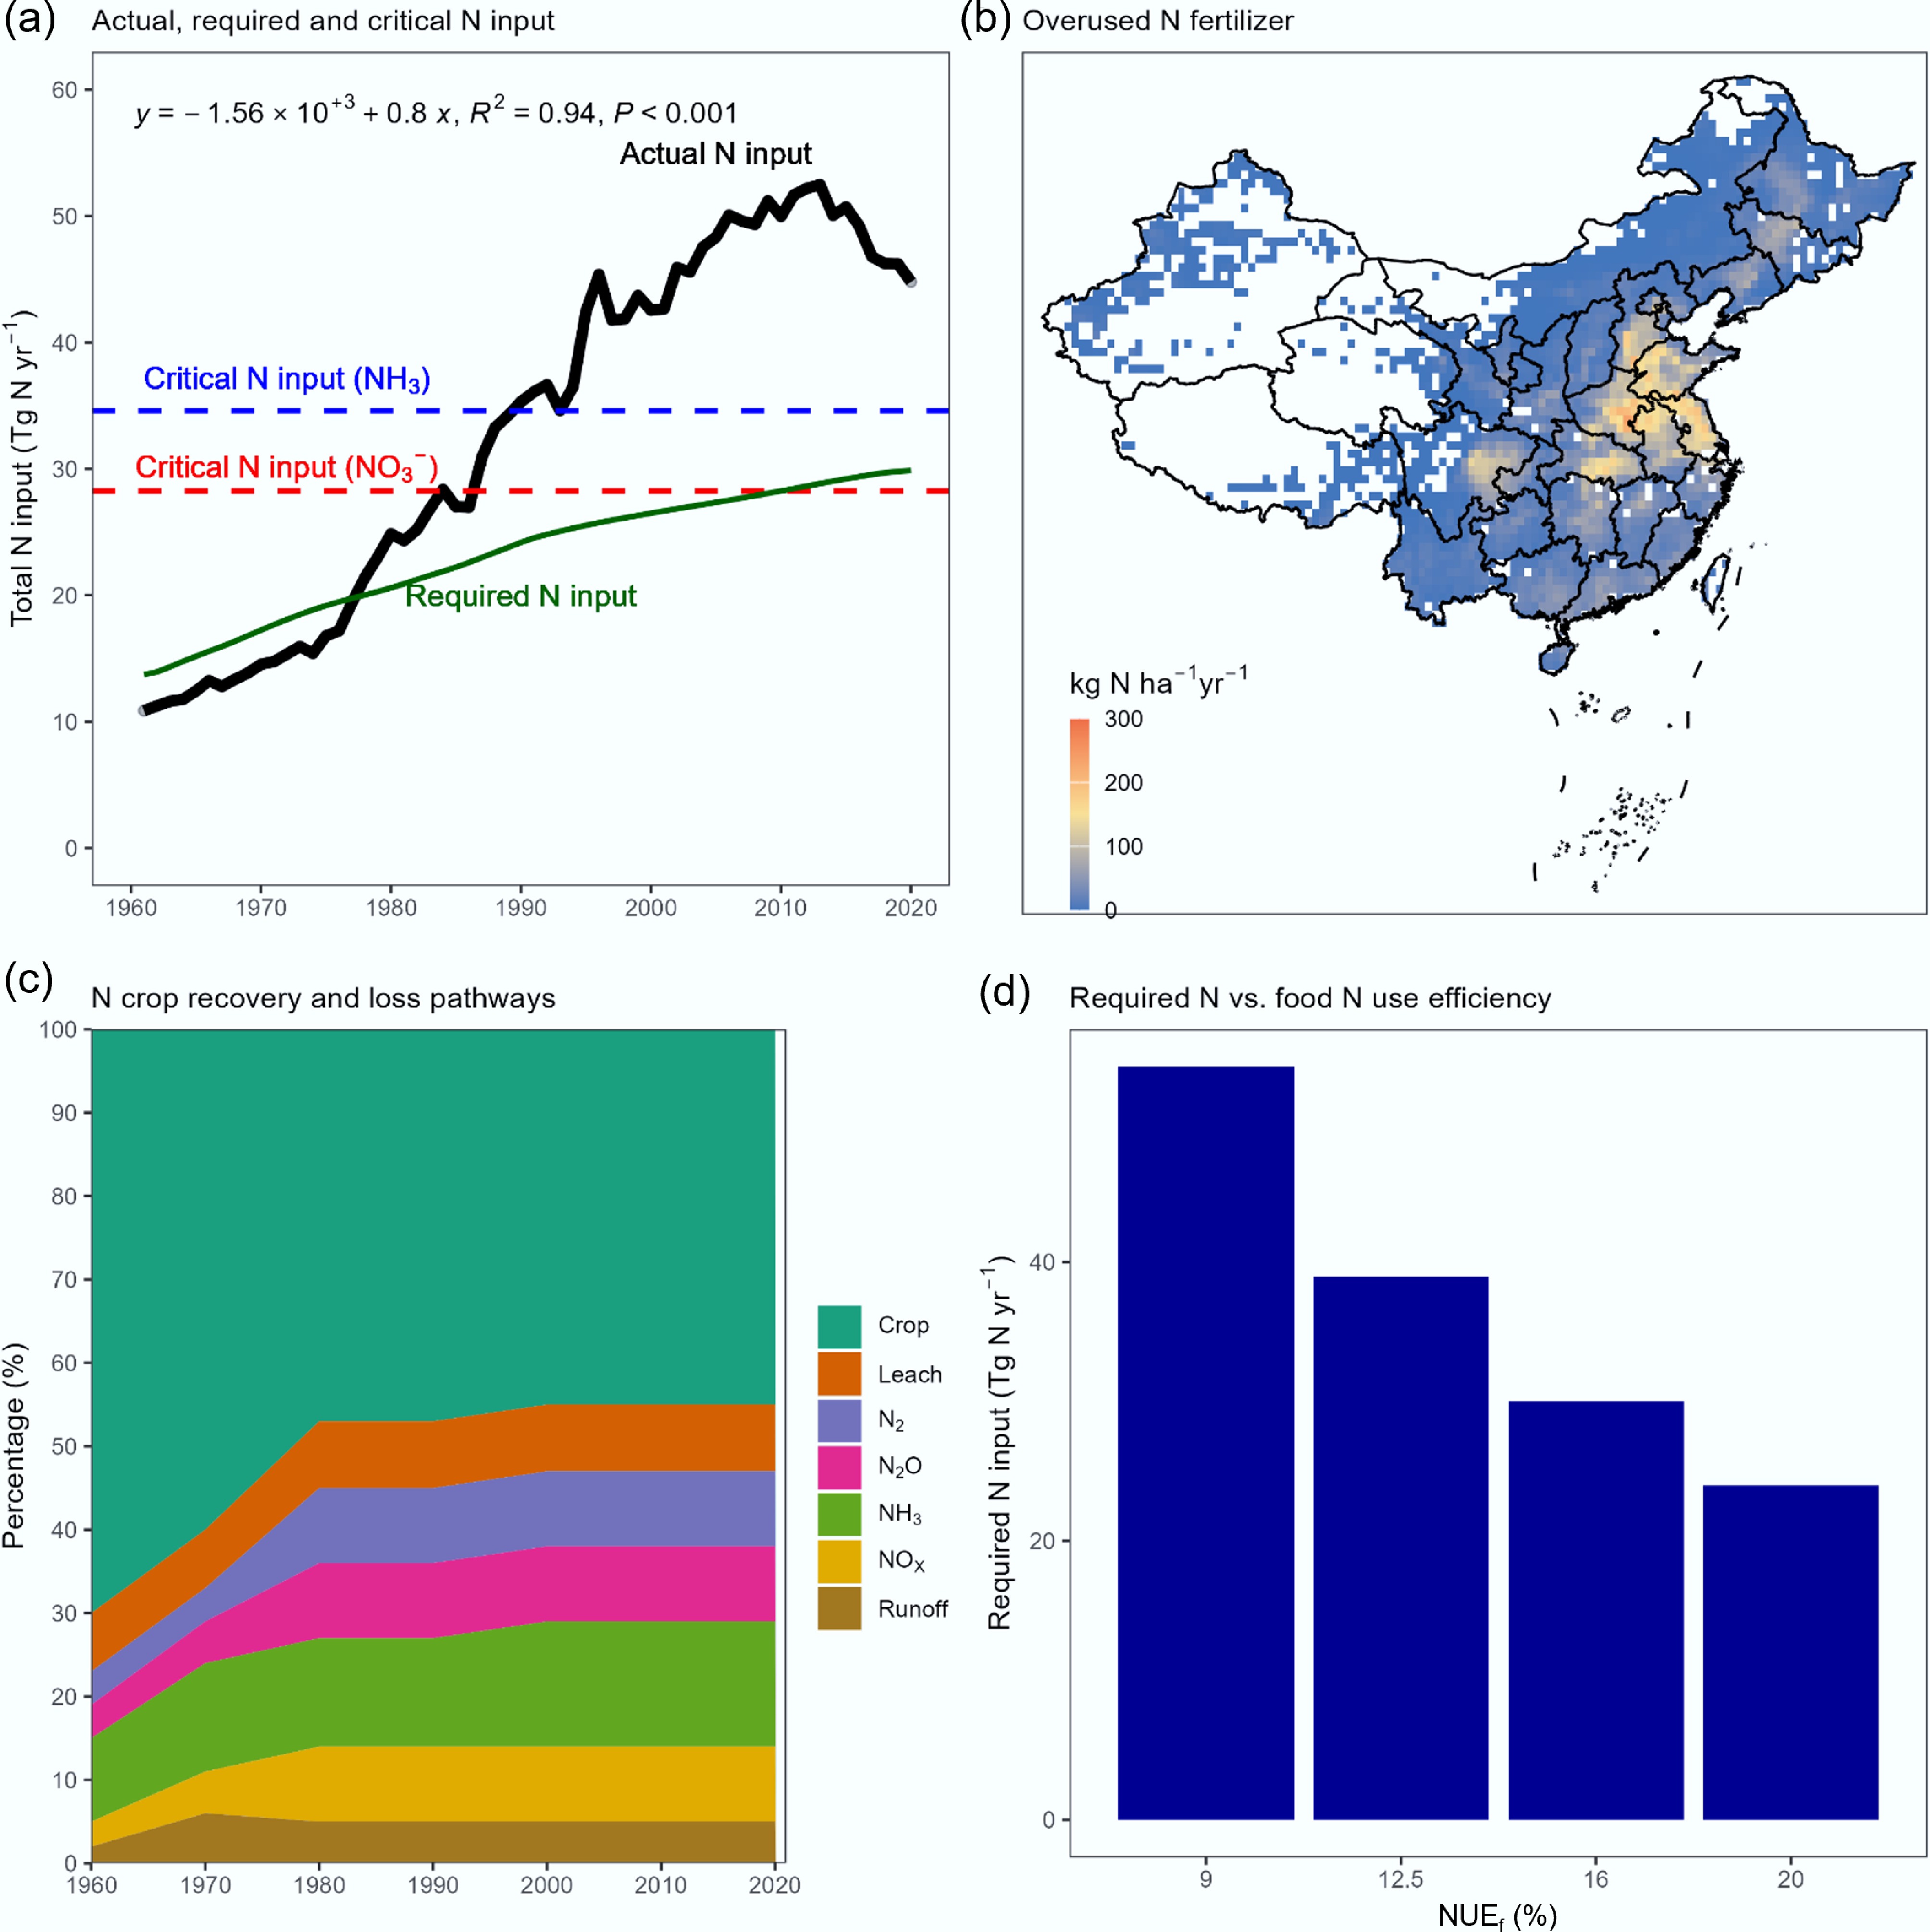
Figure 3.
Actual, required and critical N inputs. (a) Annual changes in actual, required and critical N inputs. The required N input to cropland is calculated based on the human requirement for daily protein intake and N use efficiency in the food chain. (b) The spatial distribution of fertilizer N overuse for 16 major crops in China. (c) The contribution of N output by each pathway in China between 1961 and 2018. (d) Required N inputs under different food N use efficiency levels in China.
Briefly, the required N input denotes the amount of necessary N to guarantee the required human protein intake for the whole food chain. The required annual N intake from food is 3.5 kg N capita−1 according to the daily protein intake (60 g capita−1) recommended by the Chinese Health and Nutrition Association (slightly higher than the WHO recommended value of 50 g protein intake per capita per day). The ratio of N consumption to N inputs in the complete food chain was 0.16 in China, close to the global average value of 0.167 given in De Vries et al.[27], and equal to the average value given by Ma et al.[37]. Between 1961 and 2018, the required N input ranged from 15 to 30 Tg N yr−1 (Fig. 3a). Considering the major N overuse regions located in eastern China (Fig. 3b), and the decreased N uptake proportion with time (Fig. 3b), we expect a quicker increase in required N input in eastern China. The required N input was negatively correlated with NUE along the food chain—i.e., the higher the NUE within the food chain, the lower the required N input (Fig. 3d).
The critical N input represents the maximum acceptable N input to achieve an N surplus that meets environmental protection targets, i.e. a NO3− concentration in leachates below 11.3 mg NO3-N L−1, and a critical NH3 emission based on a critical N load for terrestrial ecosystems. Using the WHO limit for drinking water (11.3 mg N L−1) as the critical N concentration permitted to be leached from croplands leads to a critical NO3-N loss to groundwater of 18.1 kg N ha−1 yr−1 or 2.3 Tg N yr−1. Using a leaching fraction of total N input of 0.08 (0.06−0.10), the total critical N input for China was calculated as 28 (24−32) Tg N yr−1. For the critical NH3 emission from croplands using an area-weighted mean critical N load (10 kg N ha−1 yr−1) to natural and semi-natural ecosystems[25,41], a critical NH3 loss to air was estimated at 42 kg N ha−1 yr−1 or 5.2 Tg N yr−1. Using an average NH3 loss fraction for China of 0.15 (close to 0.14 or 14% in Fig. 1), the total critical N input was calculated to be 35 (30−40) Tg N yr−1.
Based on the critical N loss with respect to surface water limits (1.0 mg N L−1) used by Yu et al.[13], and the years 1987−1988, when China's actual N runoff was equal to the critical N loss, the critical N input was found to be 27−28 Tg N yr−1; actual N input surpassed the critical N input for NH3 around 1990−1995 (Fig. 3a). The actual N input was much lower than the required and critical N inputs in 1961, and close to those inputs in 1980, but substantially higher after 2000 (Fig. 3a). Meanwhile, the required N input was less than the critical N input, but became similar, after 2010, due to demands from a continuously increasing population. The actual N input was 18−20 Tg N higher than the required or critical N input (assuming the lowest value to be the 'real' critical input) in 2018, equal to 37%−39% of total N input. Approximately 38% of N inputs were in excess in China based on a yield-N input response model[15]. The current N input to crop production in China is therefore excessive, especially in the North China Plain and Yangtze River Basin (Fig. 3b; Supplementary Figs S1, S3, S5), and is far from safe and must be optimized to protect both the environment (e.g., biodiversity), and human health (e.g., drinking water quality).
Strategies to improve N management
-
Large differences between actual and required/critical N inputs in China have been identified. Closing these gaps is a huge challenge for the country. However, progress has been made in parts of Europe, achieved through the introduction of the European Union Directive on NO3− in water, national directives on N fertilizer and manure inputs, and the National Emissions Ceilings Directive (NECD) with limits for NH3 emission[41,48]. The EU's Nitrates Directive and NECD offer the most actionable templates for China's agricultural pollution control. By integrating EU-style compliance frameworks with China's digital governance strengths (e.g., IoT-based fertilizer tracking), a hybrid model could achieve predictable NUE improvement in high-risk regions. This alignment ensures policy coherence while addressing China's unique challenges in food security and ecological conservation.
A three-step strategy for China is proposed (Fig. 4a): (i) replacing some fertilizer N with effectively recycled manure (as shown by 'Manure replacement' or '80% manure recycled'); (ii) balancing N fertilizer inputs and other non-fertilizer N sources by reducing excessive N fertilizer use based on the crop N demand (as shown by 'Balanced fertilization'); (iii) integrated soil-crop system management (as shwon by 'Integrated approaches'), including optimized N fertilization techniques (i.e., 4R strategy) and optimized crop and soil management (best cultivars; optimal rotations; improved soil productivity)[23,49,50]. The potential of a range of Nr-saving technologies for crop production in China to close the gaps were assessed, and 2018 was taken as a baseline for assessing the N reduction potential in 2030.
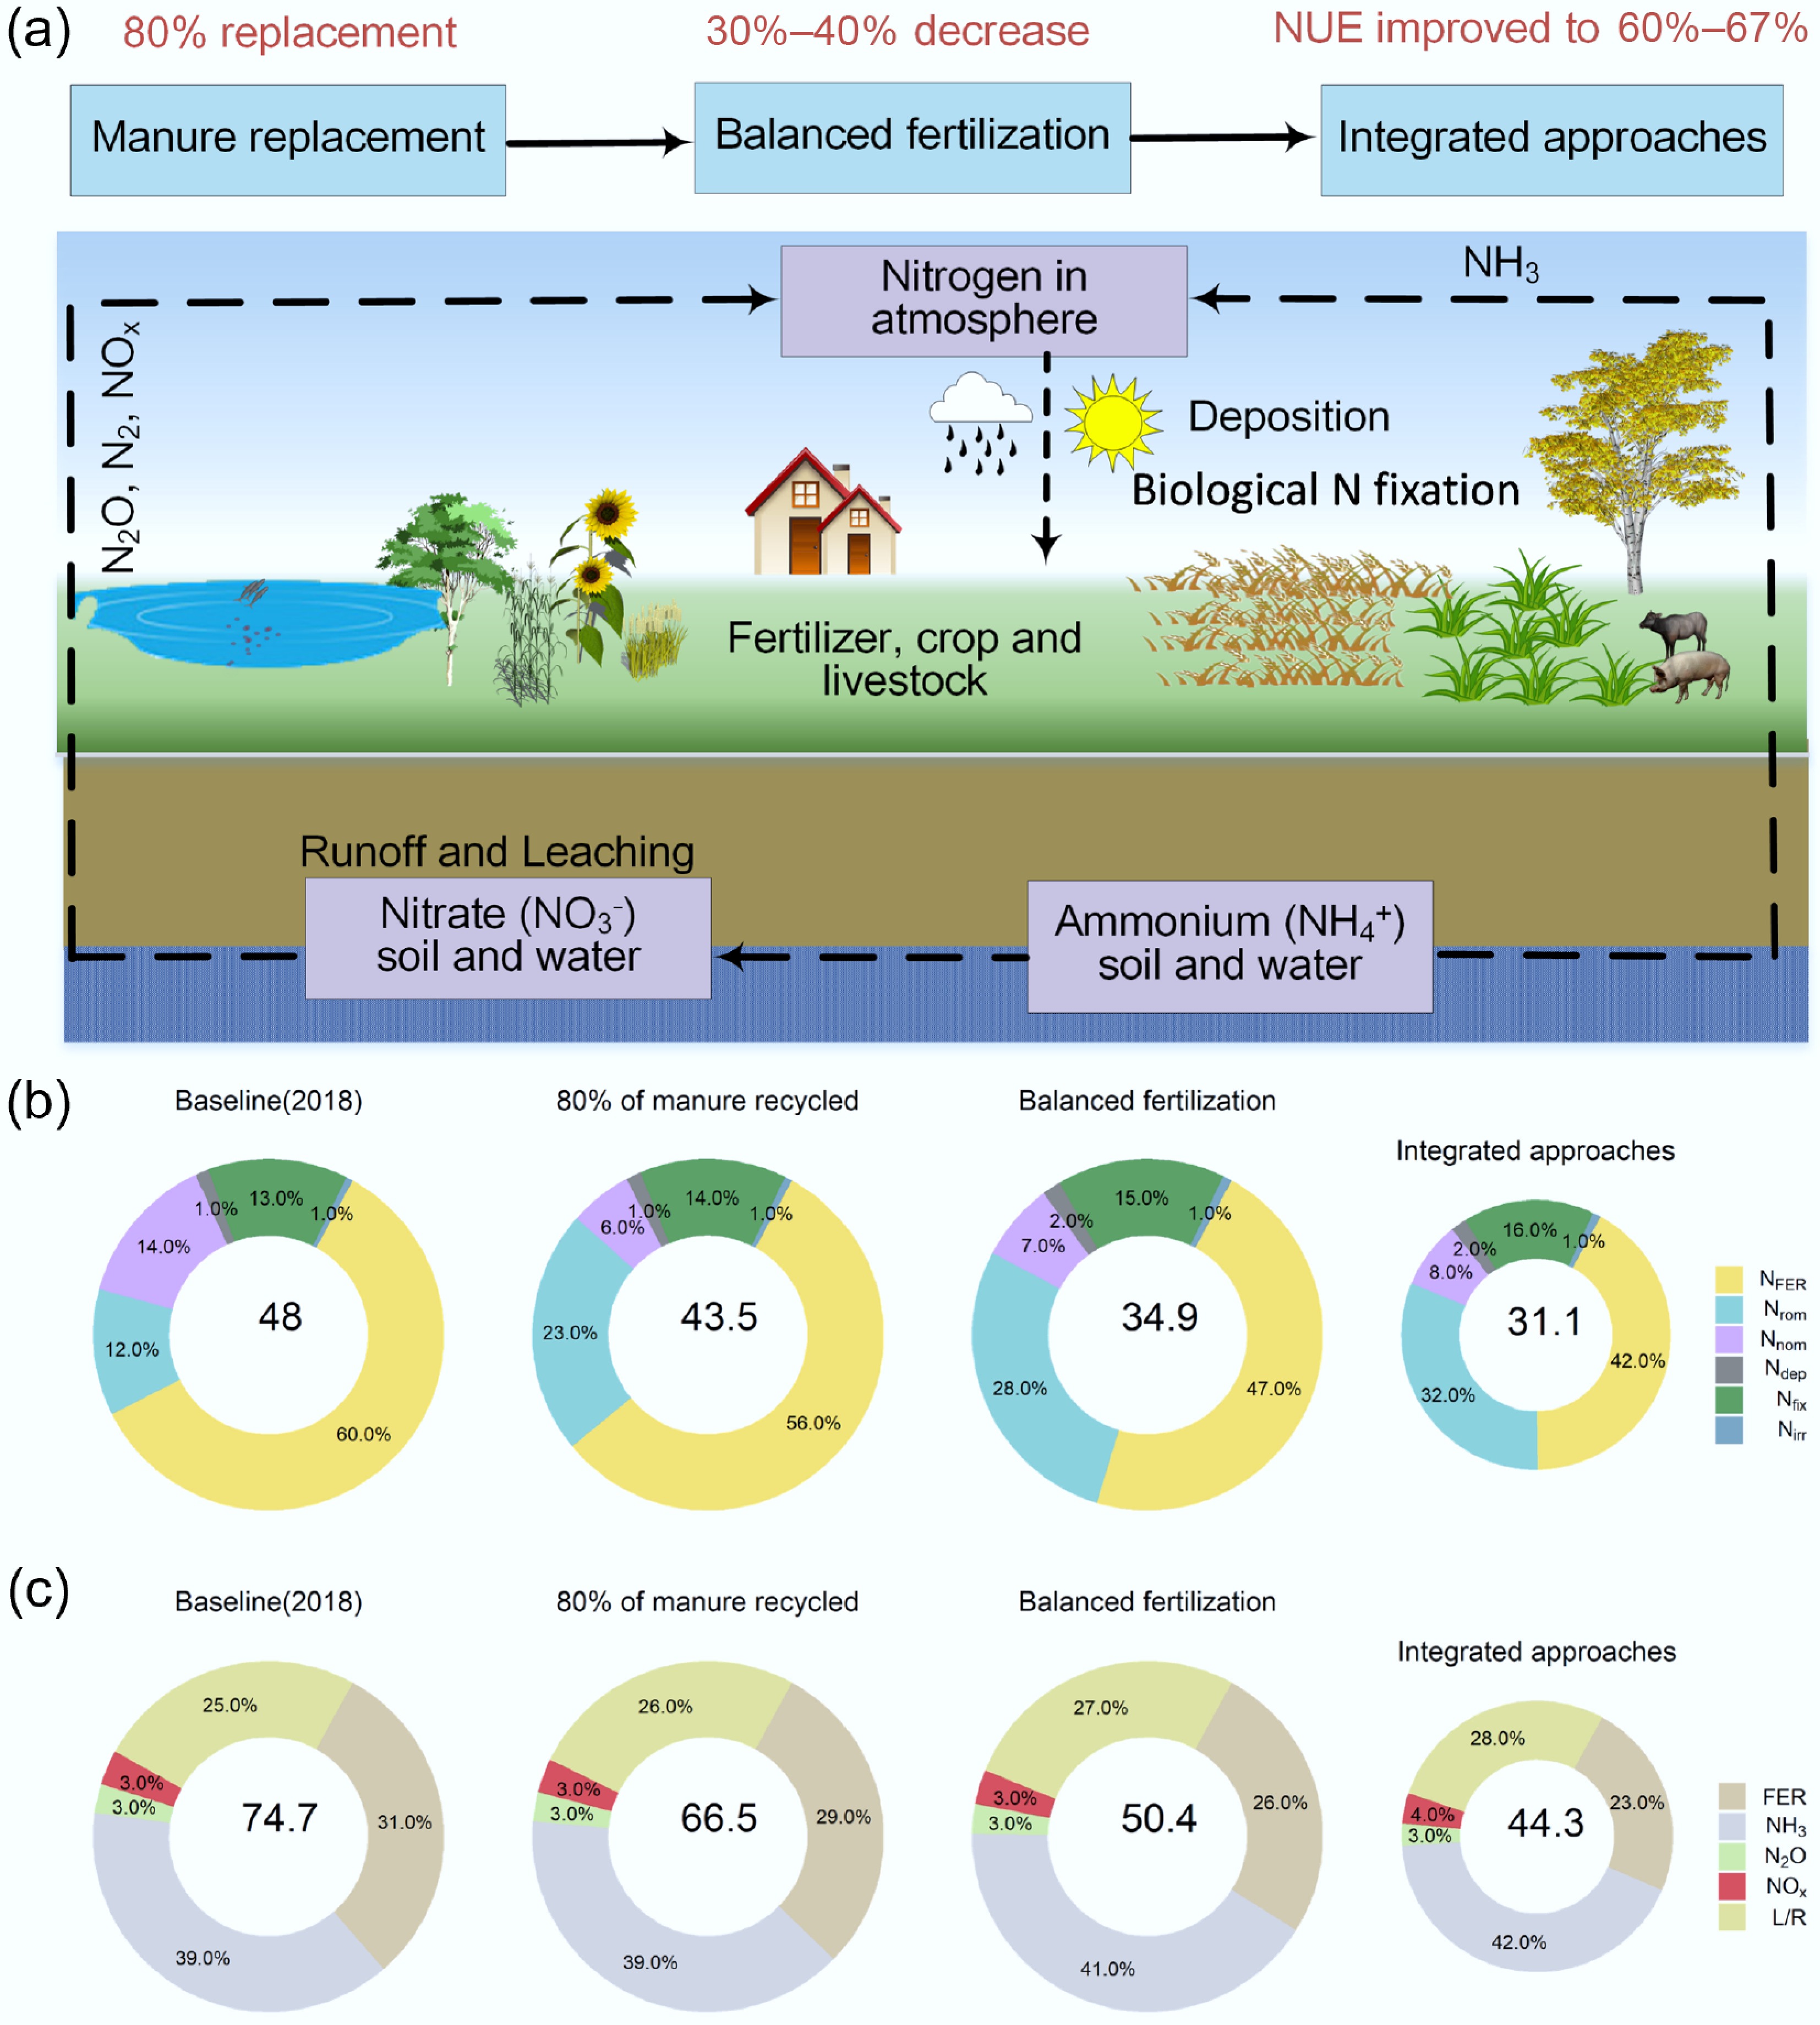
Figure 4.
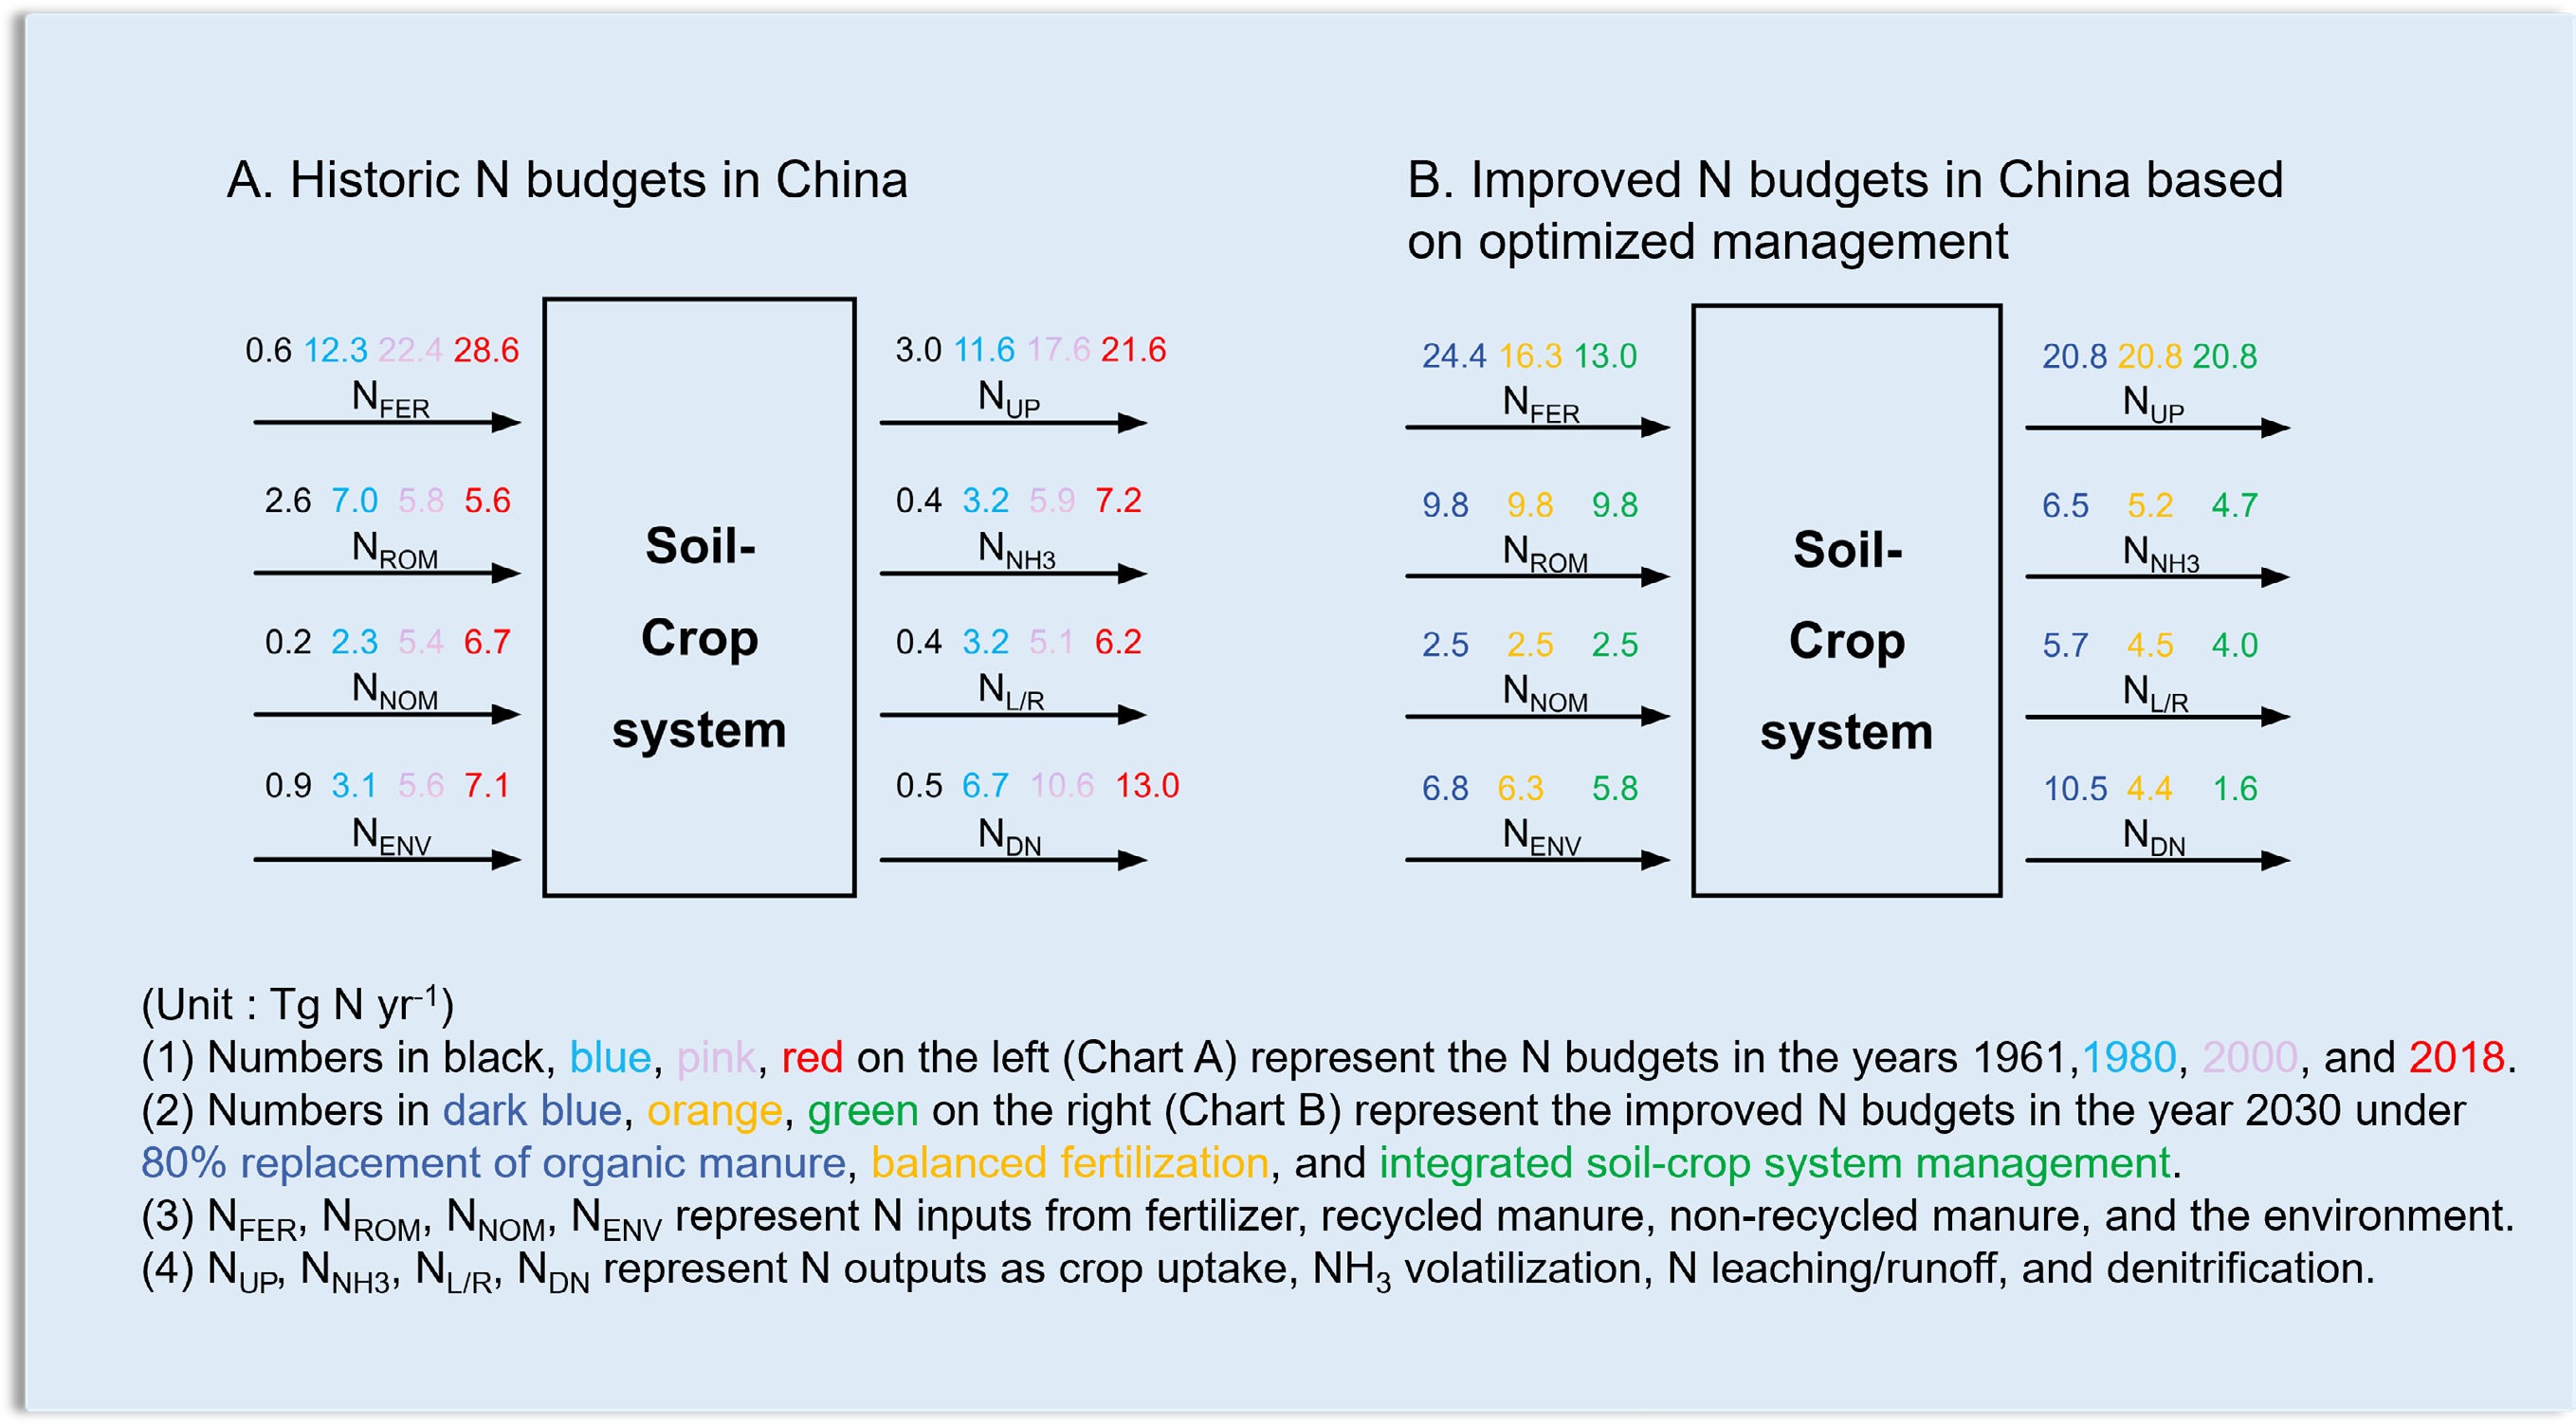
Reduction of N inputs and associated costs through improved nutrient management practices: (i) 80% of manure recycled; (ii) option (i) + balanced fertilization; (iii) options (i) + (ii) + integrated approaches through soil-crop system management. (a) A scheme of N flows and steps to reduce N fertilizer use and N loss. (b) Reduction in N inputs by improved recycling of manure, plus balanced fertilization (Right amount), plus integrated management (Right time, Right place and Right product with soil-crop management). (c) Cost-benefit analysis induced by N fertilizer saving and by lower Nr losses to water and air. Notes: (1) NFER, NROM, NNOM, NDEP, NFIX, and NIRR in sub-chart B denote fertilizer N, recycled manure, non-recycled manure, N deposition, biological N fixation, and N from irrigation, respectively; (2) FER, NH3, N2O, NOx and L/R in sub-chart C denote direct and indirect costs induced by fertilizer N use, and by NH3, N2O, NOx, and N leaching/runoff losses, respectively.
First, one major issue in China is the inefficient use of manure, which is only partly recycled in crop production. The total amount of manure N in 2018 was 15.4 Tg N yr−1, of which 80% (12.3 Tg N yr−1) was accessible to cropping systems and 20% was accessible to grazed grasslands. The amount of recycled manure N available for croplands was estimated at 9.8 Tg N yr−1, assuming a recycling efficiency of 80%, while current manure N input was estimated at 5.6 Tg N yr−1 in 2018 (Supplementary Table S3). Thus, 80% recycling of N in manure (the policy target by 2025) would lead to an additional saving of 4.2 Tg N yr−1 (plus the already recycled 5.6 Tg N yr−1), approximately equal to 34% of fertilizer N (28.6 Tg N yr−1). We note that the 80% manure recycling target by 2025 is ambitious. The main barriers to the recycling of manures are the decoupling between crop and livestock production and the high economic costs associated with manure returning to cropland. To realize the recycling of N in manure, we need to reform the currently industrialized livestock-dominated systems towards more coupled crop-animal systems. Meanwhile, governments should allocate targeted subsidies to stimulate the development and adoption of advanced machinery for livestock manure management, thereby promoting environmental compliance and operational efficiency in farming systems.
The second step is to balance N fertilization and non-fertilizer N sources when calculating total N inputs. China's average NUE is 46% (Supplementary Table S2). This could result in a further 30%−35% reduction in N fertilizer without impacting current yields[51], which would present an enormous improvement, implying a saving of 8.1 Tg N yr−1 and an additional reduction in NHx deposition of 0.5 Tg N yr−1, thus reducing the total N input by 8.6 Tg N yr−1 (Fig. 4b; Supplementary Tables S3 & S4). This implies that an improved NUE of 62% is achievable in China, a level comparable to that in Europe, near 60%−65%[52].
The third step is to improve management of the whole soil-crop system by increasing the NUE and thereby decreasing N loss. This can be achieved through practices such as by applying 4R methods, best cultivars, and optimal rotations[23,49]. This would further reduce N fertilizer use by 20% (Supplementary Table S3) and increase the NUE to 67%, which is slightly higher than the NUE in Europe[52], which would deliver a more efficient use of all the N available and higher soil productivity[51,53].
Through this three-step strategy, total N inputs can be reduced by 17 Tg N yr−1 (around 35% reduction) and brought to a level close to the required/critical N input (31 vs 28−35 Tg N yr−1). The improvement in N management will require considerable effort but would also lead to large direct and indirect benefits (Supplementary Table S5). Direct benefits include the reduced requirement for N fertilizer by farmers: an annual reduction of 15.6 Tg of N fertilizer results in direct savings for farmers of EUR€14.0 (13.4−16.0) billion, assuming an N fertilizer cost of approximately EUR€0.6−1.0 per kg N and the cost of urea of about EUR€300−500 per ton and an N content of 46% (Fig. 3c; Supplementary Table S5). The indirect benefits include reduced costs for treating water (removing nitrate from water), reduced health expenses, and environmental improvements, such as reduced emissions of greenhouse gases (contributing to carbon reduction targets). These were estimated at EUR€17.9 billion (Fig. 4c; Supplementary Table S5), based on an adjusted willingness to pay in the EU27 for the reduction of impacts from N losses to air and water[44]. In summary, the total direct plus indirect benefits due to N savings through integrated approaches could be up to EUR€30.4 (28.5−35.8) billion, or CNY¥212 (199−250) billion in China. In addition, the required and critical N inputs are not fixed; instead, they may decrease or increase alongside an aging population and reduced NH3 emission and NO3−-N leaching fractions under improved N management in the future.
-
To reach this ambitious target of minimising N-related environmental harm associated with food security, China needs a thorough nationwide reform of its agricultural production systems. This requires substantial advances in nutrient management technology and policy, particularly for the large number of smallholder farmers[54,55]. The decrease in N inputs will likely be associated with an increase in farm size and a reduction in the farmer population[56,57]. We believe, however, that farmer education may be just as important for improving N use efficiency, encouraging the adoption of such practices as better crop rotations and mixed cropping, using N-fixing plants as green manures, and applying N fertilizers, and manures at the right time and at the right place.
Recent national actions and changes in policies are bringing about a rapid transition of agriculture towards green agriculture development in China[58], including initiatives such as National Soil-testing and Fertilizer Recommendations, Zero-increase Action Plan for Fertilizer Use, National Action for Soil Quality Improvement, and amalgamating smallholder croplands[9,21]. To accelerate this transition, the following policy-related actions in line with the abovementioned proposed three-step strategy are recommended.
The most important issue, as the first-step strategy, is to promote the full utilization of various nutrient resources, including organic manures and environmental nutrients (e.g., N from deposition, biological fixation, and irrigation). We appeal to redirect subsidies from synthetic fertilizers to manure recycling infrastructure and enhance the integration of livestock and crop production systems for improved utilization of manure nutrients[59]. We also emphasize the importance of developing a field-scale manure nutrient recommendation system. Such a system should incorporate manure nutrient composition (encompassing total and available nutrients) and account for the impacts of application timing, method, rate, and soil type on manure N availability, as these factors directly influence post-application NH3 volatilization, N2O emissions, and N leaching losses. At the same time, it is essential to implement stricter environmental protection regulations to control N inputs and losses from croplands and livestock farms. Coordinated spatial planning to colocated intensive livestock farms with crop production areas, along with the establishment of nitrate vulnerable zones, will also be important[60].
It is also extremely important to develop systematic tools—from decision to application systems—for applying nutrients (either inorganic or organic resources) to the cropland. The development of intelligent machinery and site-specific soil-crop management should be encouraged as a priority, especially considering diversified cropping and different plot sizes in China. This can be achieved by promoting cooperative farming management schemes to accelerate the application of innovative/green technologies, such as 4R technologies.
Another significant reform for sustainable food systems will involve a structured shift in dietary patterns toward alignment with China's National Nutrition Guidelines and WHO's protein intake benchmarks (< 10% of total energy from animal proteins). Reducting and optimizing animal-based food consumption will significantly mitigate environmental pressures from livestock production. The proportion of legumes (e.g., soybean) with a high N fixing capacity in novel/new crop rotations should be increased to reduce N fertilizer inputs, with legume protein being an important component of a healthy diet[61]. This transition requires an integrated Food-Chain-N-Management approach for green transformation of agriculture in China[23].
Finally, we believe that developing international markets and trade policies is important to reconcile the conflict between agricultural productivity and environmental protection in China, ensuring that efforts to reduce N-related pollution benefit both national and global sustainability. We also suggest explicitly incorporating uncertainty analysis (Supplementary Fig. S6) into future research and policy recommendations to enhance the robustness of conclusions and facilitate informed decision-making under varying environmental and economic scenarios.
-
It accompanies this paper at: https://doi.org/10.48130/nc-0025-0010.
-
Not applicable.
-
The authors confirm their contributions to the paper as follows: study design: Liu X, de Vries W, Zhang F; data analysis: Zhang Y, Liu X, Liu L; conducting the research: Liu X, Liu L, Zhang Y, Ma L; writing the manuscript: Liu X, Liu L, de Vries W, Zhang Y; all authors participated in the discussions and commented on the paper. All authors reviewed the results and approved the final version of the manuscript.
-
The datasets used or analyzed in the current study are available from the corresponding author upon reasonable request.
-
This work was supported by the National Basic Research Program of China (2023YFD1900604, 2023YFD1901404, ZD20232320), the National Natural Science Foundation of China (42277097, 41425007, 42371324), the Gansu Province Outstanding Youth Fund Project (25JRRA629) and the Sino-UK CINAg project on nitrogen (BB/N013468/1).
-
The authors declare that they have no conflict of interest.
-
# Authors contributed equally: Xuejun Liu, Wim de Vries, Ying Zhang, Lei Liu
Full list of author information is available at the end of the article. - Supplementary File 1 Supplementary methods to this study.
- Supplementary File 2 References for contribution of each N output.
- Supplementary Table S1 Leaching rates from precipitation and irrigation to croplands in China based on the water balance in seven major watersheds, according to Li & Huang[39].
- Supplementary Table S2 Estimated N inputs from fertilizer, manure, fixation, deposition, and irrigation, plus crop N uptake and NUE.
- Supplementary Table S3 Improved N inputs from N fertilizer replacement by 80% manure recycling, balanced N fertilization and integrated soil-crop system management in China.
- Supplementary Table S4 Nr losses and their reductions achieved by manure recycling, plus balanced N fertilization and plus integrated approaches based on soil-crop system management in China.
- Supplementary Table S5 Cost-benefit analyses resulting from improving N management.
- Supplementary Fig. S1 Spatial distribution of N fertilizer inputs for 16 major crops ((a) wheat; (b) rice; (c) maize; (d) soybean; (e) barley; (f) sorghum; (g) millet; (h) rapeseed; (i) groundnut; (j) sunflower; (k) sugarcane; (l) potato; (m) cassava; (n) oilpalm; (o) rye; (p) sugarbeet) in China.
- Supplementary Fig. S2 Annual changes of (a) N input and (b) output in China’s crop production systems during 1961 and 2018. Abbreviations: NENV, N from the environment (sum of N fixation, deposition and irrigation); NFER, N from fertilizer; NOM, N from manure; NUP, N uptake by crop; NNH3, N loss from NH3 emission; NL/R, N loss from leaching and runoff; NDN, N loss from denitrification and nitrification (N2, NO, and N2O).
- Supplementary Fig. S3 Spatial distribution of total N inputs including N fertilizer, manure, and environment (N deposition, irrigation and N fixation) in China in 1961, 1980, 2000 and 2018.
- Supplementary Fig. S4 Changes in the population, grain yield, grain consumption, daily protein intake, annual N intake, and the ratio of animal protein to total (animal + plant) protein.
- Supplementary Fig. S5 Spatial distribution of N fertilizer, manure and environment (N deposition, irrigation, and N fixation) inputs in China in 2010.
- Supplementary Fig. S6 Distribution and uncertainty ranges of the N balance for (a) wheat (b) rice (c) maize and (d) vegetables based on a Monte Carlo analysis by sampling 1,000 times.
- Copyright: © 2025 by the author(s). Published by Maximum Academic Press, Fayetteville, GA. This article is an open access article distributed under Creative Commons Attribution License (CC BY 4.0), visit https://creativecommons.org/licenses/by/4.0/.
-
About this article
Cite this article
Liu X, de Vries W, Zhang Y, Liu L, Ma L, et al. 2025. Minimizing nitrogen-related environmental harm while achieving food security in China. Nitrogen Cycling 1: e010 doi: 10.48130/nc-0025-0010 

Minimizing nitrogen-related environmental harm while achieving food security in China
- Received: 17 July 2025
- Revised: 17 September 2025
- Accepted: 01 October 2025
- Published online: 17 November 2025
Abstract: Elevated nitrogen (N) fertilizer inputs have been pivotal in sustaining a growing global population, but they have also caused significant environmental challenges, primarily driven by reactive nitrogen (Nr) emissions to air and water on a global scale—a situation particularly pronounced in China. To better understand the improvements to N management required to reduce impacts in China, a long-term N budget over the period 1961−2018 was compiled, historic changes in N inputs, crop uptakes and losses quantified, and compared with the N inputs required to satisfy food security and critical N inputs necessary to protect the environment, considering acceptable losses of ammonia emissions to air and nitrate leaching to water. The N inputs required to satisfy the food demand of China were 14, 21, 27, and 29 Tg N yr−1 in 1961, 1980, 2000, and 2018, respectively, while the actual N inputs were 4, 25, 39, and 48 Tg N yr−1, respectively, exceeding the required input after 1980. Since 2000, the actual N inputs have also exceeded the critical N inputs in view of ammonia emissions to air (35 Tg N yr−1), and nitrate leaching to groundwater (28 Tg N yr−1) that are needed to protect biodiversity and human health. It is demonstrated that reducing N input from 48 to 31 Tg N yr−1, thereby reconciling food production with environmental safety, can be achieved through enhanced manure recycling, balanced N fertilization, and integrated soil-crop system management. Such a 'win-win' strategy would improve air and water quality, protect the environment and human health, and enhance resource-use efficiency while reducing N fertilizer use and Nr losses.
-
Key words:
- Nitrogen balance /
- Denitrification /
- Food security /
- Environmental safety /
- Nutrient management /
- China