


-
The global nitrogen (N) cycle has been dramatically altered by excessive reactive N inputs into the environment since the 1860s[1,2]. Anthropogenic activities have increased the concentrations of bioavailable N, such as nitrate (NO3−) and ammonium (NH4+), in both surface water and groundwater worldwide[3−5], posing risks to aquatic ecosystems and human health[6]. Global inland water N cycling has also accelerated, with riverine N export rising from 27 to 68 Tg yr−1 during 1900–2010[5]. In China, N concentrations in most water bodies increased dramatically (over 15 mg N L−1) after the 1990s, whereas they were lower than 1 mg N L−1 before the 1980s[7]. This trend is especially pronounced in agricultural regions, where non-point source pollution remains the dominant driver of NO3− enrichment in both surface water and groundwater[8,9]. Reducing N fluxes remains challenging because N transport and transformation are driven by complex interactions among climatic, biological, hydrological, and physicochemical processes[10−12].
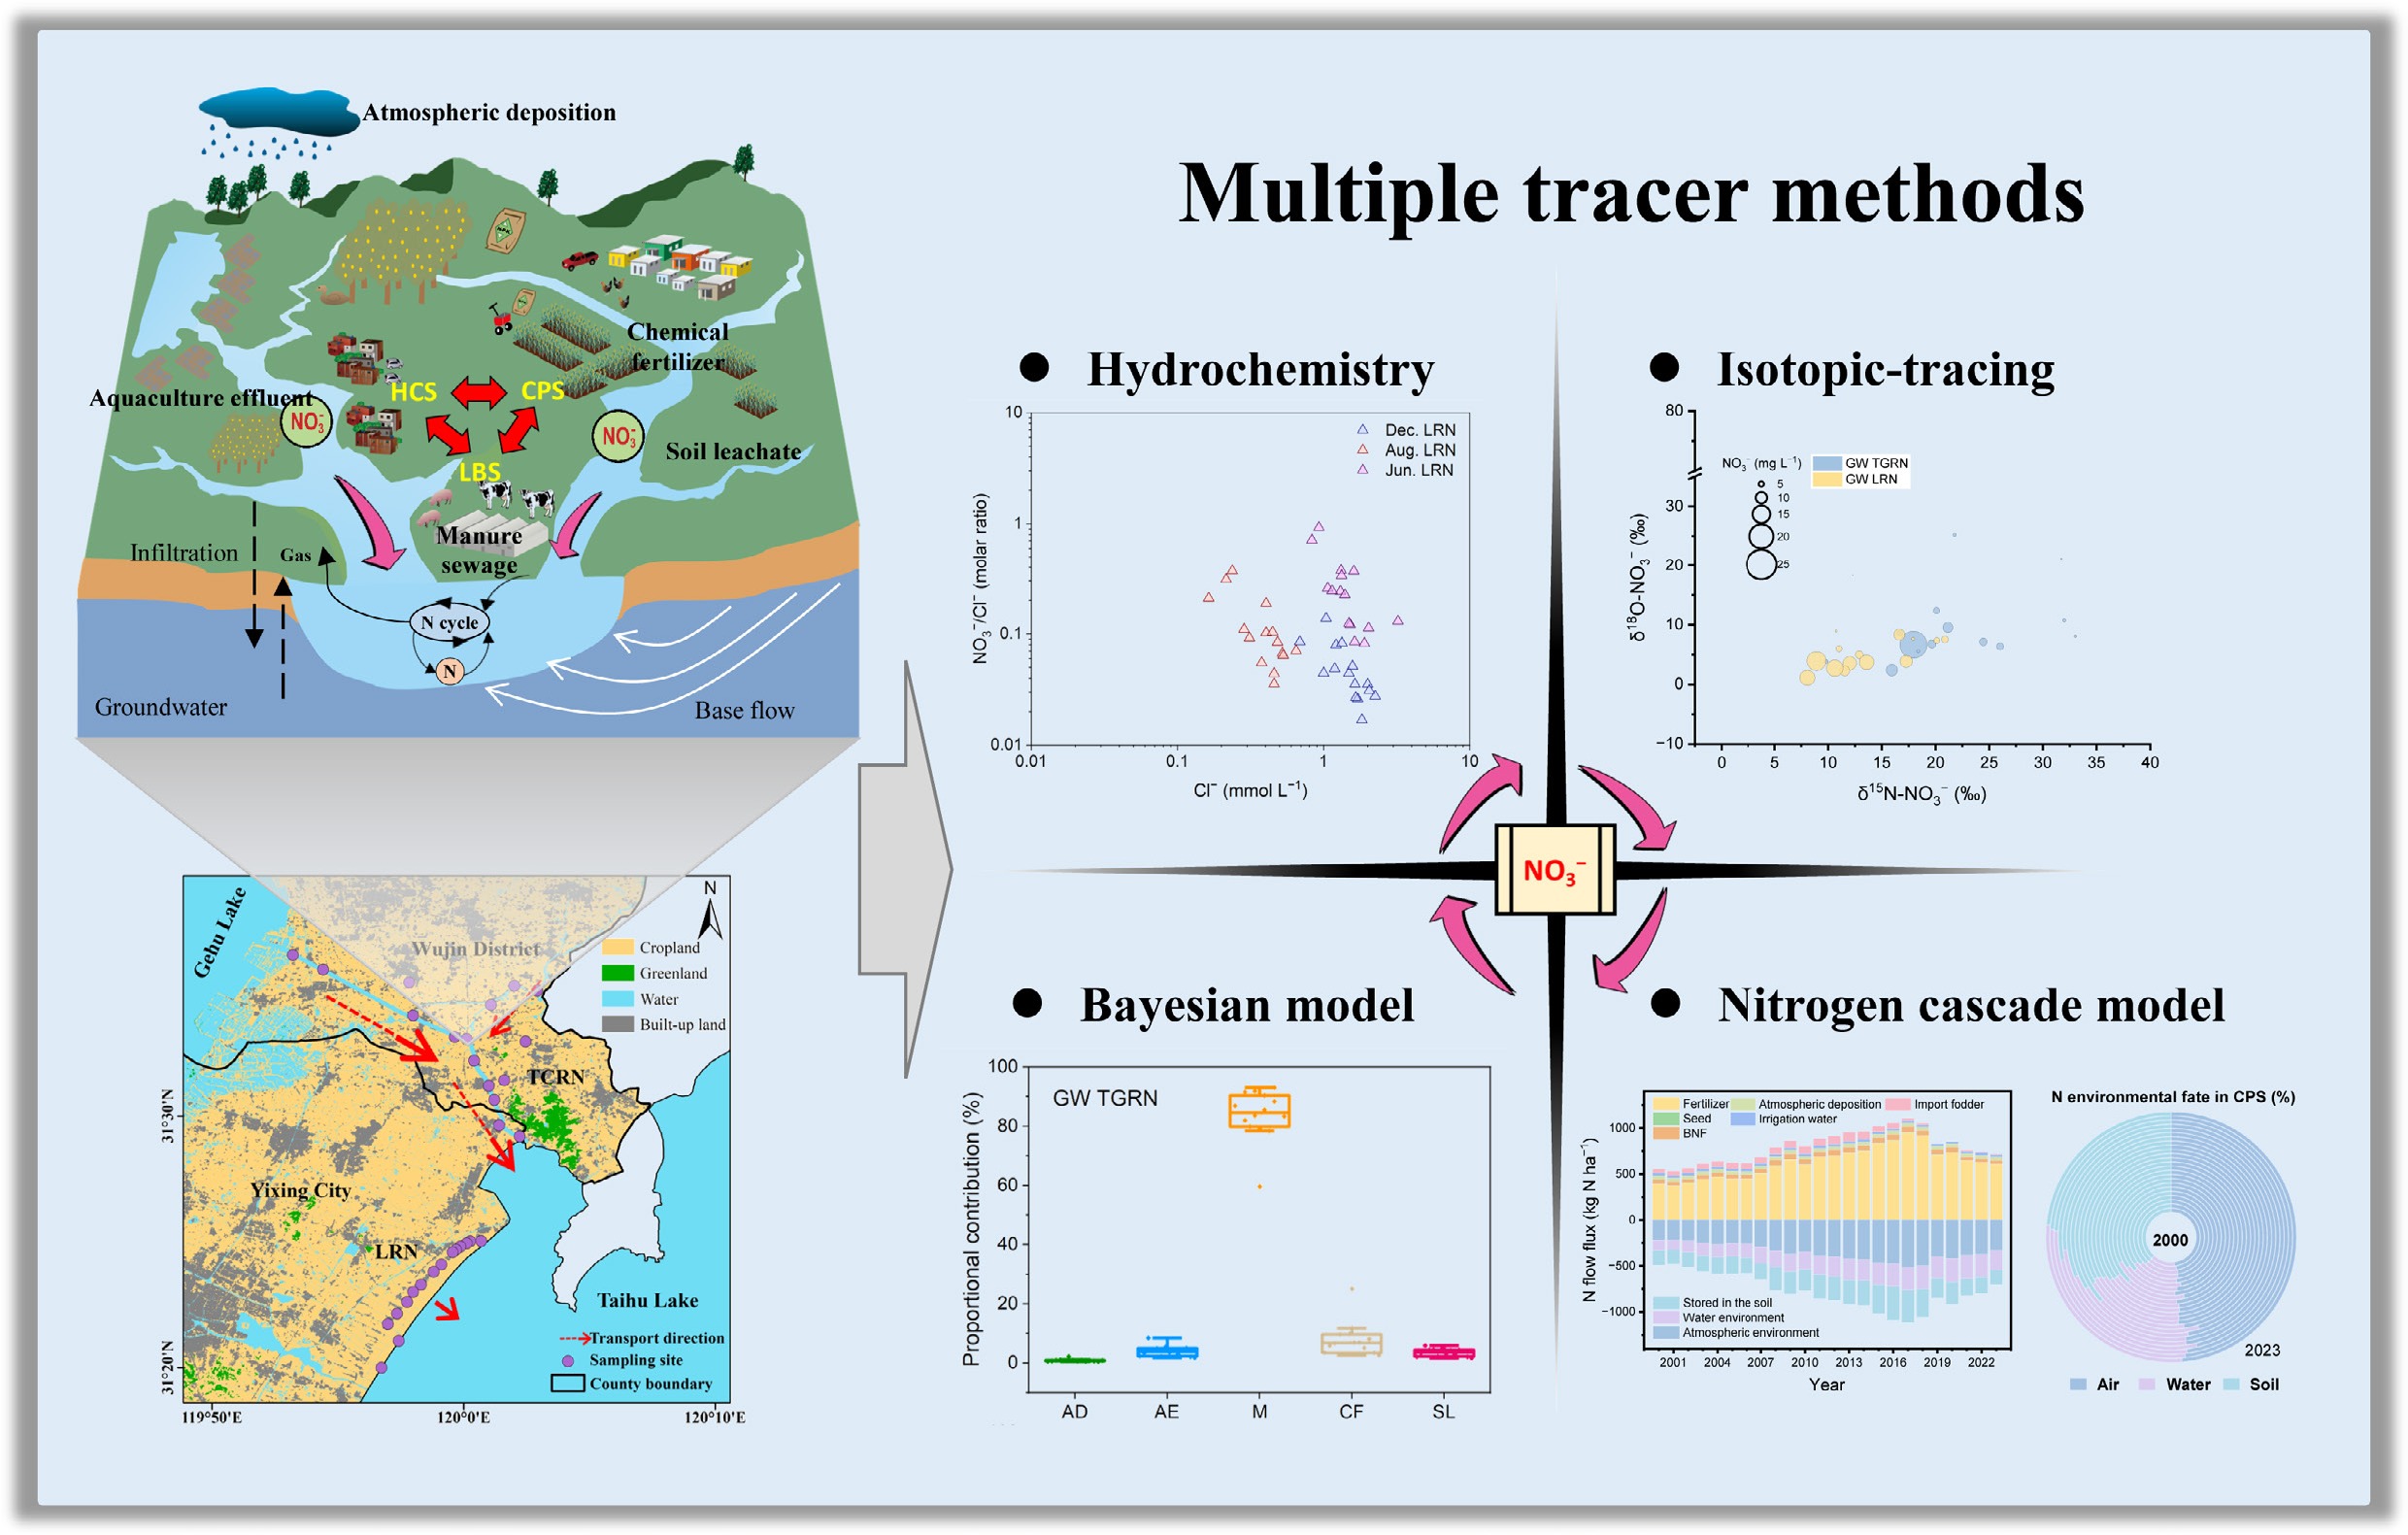
Agricultural activities are a significant source of NO3− in intensively managed watersheds, driven by heavy fertilizer application, livestock breeding, and rural domestic waste[13,14]. During transport from fields through ditches and rivers to downstream water bodies[15], NO3− undergoes multiple biogeochemical transformations (e.g., nitrification, denitrification, volatilization, anammox, assimilation), which obscure source signatures and hinder reliable source attribution[16,17]. Traditional monitoring techniques, therefore, provide limited ability to infer N cycling dynamics because they capture only instantaneous concentrations or approximate fluxes. Stable isotope and hydrochemical analysis provides more diagnostic information on N transformations and sources, including the isotopic compositions of NO3− (δ15N-NO3− and δ18O-NO3−), NH4+ (δ15N-NH4+), water (δ2H-H2O and δ18O-H2O)[18−20]. However, the dual-isotope approach is limited by spatial variability, reliance on literature end-members, and single-scale studies, leading to uncertainty in source apportionment in complex agricultural-village landscapes. At the county scale, integrating isotopic analysis with a N cascade framework can help overcome some of these challenges by linking measured water-quality signatures with agricultural production structures and N losses across the agriculture-food-environment systems[14].
The lower Yangtze River Basin is a critical region, accounting for approximately 52.1% of China's pond aquaculture output and about one-third of global production[21]. Rapid expansion has intensified feed inputs and increased pollutant losses, thereby elevating the regional N burden[22]. For instance, the exogenous N load delivered by the upstream tributaries to Taihu Lake ranged from 25.1 to 56.5 Gg N yr−1, predominantly as NO3−[8]. Previous studies have documented elevated NO3− levels, yet the linkage between surface and groundwater, the quantification of multiple NO3− sources, and the integration of isotopic evidence with human-driven N flows remain insufficiently understood. Such an approach is particularly needed in regions like the Taihu Basin, where agricultural intensification, aquaculture expansion, and rapid land-use change have increased the complexity of N cycling[23,24].
Therefore, this study focuses on two representative county-level regions in the upstream Taihu Basin, where agricultural, aquacultural, and residential activities coexist. In this work, the field investigation was conducted in dry, wet, and regular flow seasons. Surface water and groundwater samples were collected. This study aimed to: (1) characterize the N fraction occurrence and flow route on the spatial-temporal scale; (2) quantify the contribution of N pollutant sources and identify the primary pollutant; (3) integrate the results with a county-scale N cascade model to evaluate how agricultural and aquacultural intensification influence N fluxes and environmental losses. By linking isotopic fingerprints to a process-based N flow framework, this study provides an improved, regionally calibrated approach for identifying NO3− sources and offers new insights into N management in developed agricultural landscapes.
-
The rural-urban ecotone of north-western Taihu Lake is a typical inflow area with a mixed agricultural and urban landscape (Fig. 1). Two areas in different counties of China, i.e., Wujin District (WJ), and Yixing City (YX), were targeted for research. The boundary between urban and rural is unclear in WJ. It is a well-developed agricultural area with flourishing commercial agriculture, i.e., vegetables, fruits, and aquaculture ponds. WJ is a hybridized area containing industrialized, populated, and agricultural areas, known as the Tai-ge Canal River Network (TCRN). YX is a traditional agricultural and residential area named Lakeside River Network (LRN). Seasonal surface water collections were conducted in different areas in December 2021 (dry season), August 2023 (wet season), and June 2025 (regular flow season). At the surface water sampling sites, groundwater samples were collected in June 2025. A total of five categories of regional primary typical pollutant samples were collected during sampling, i.e., precipitation, aquaculture effluent, manure, soil, and chemical fertilizer.
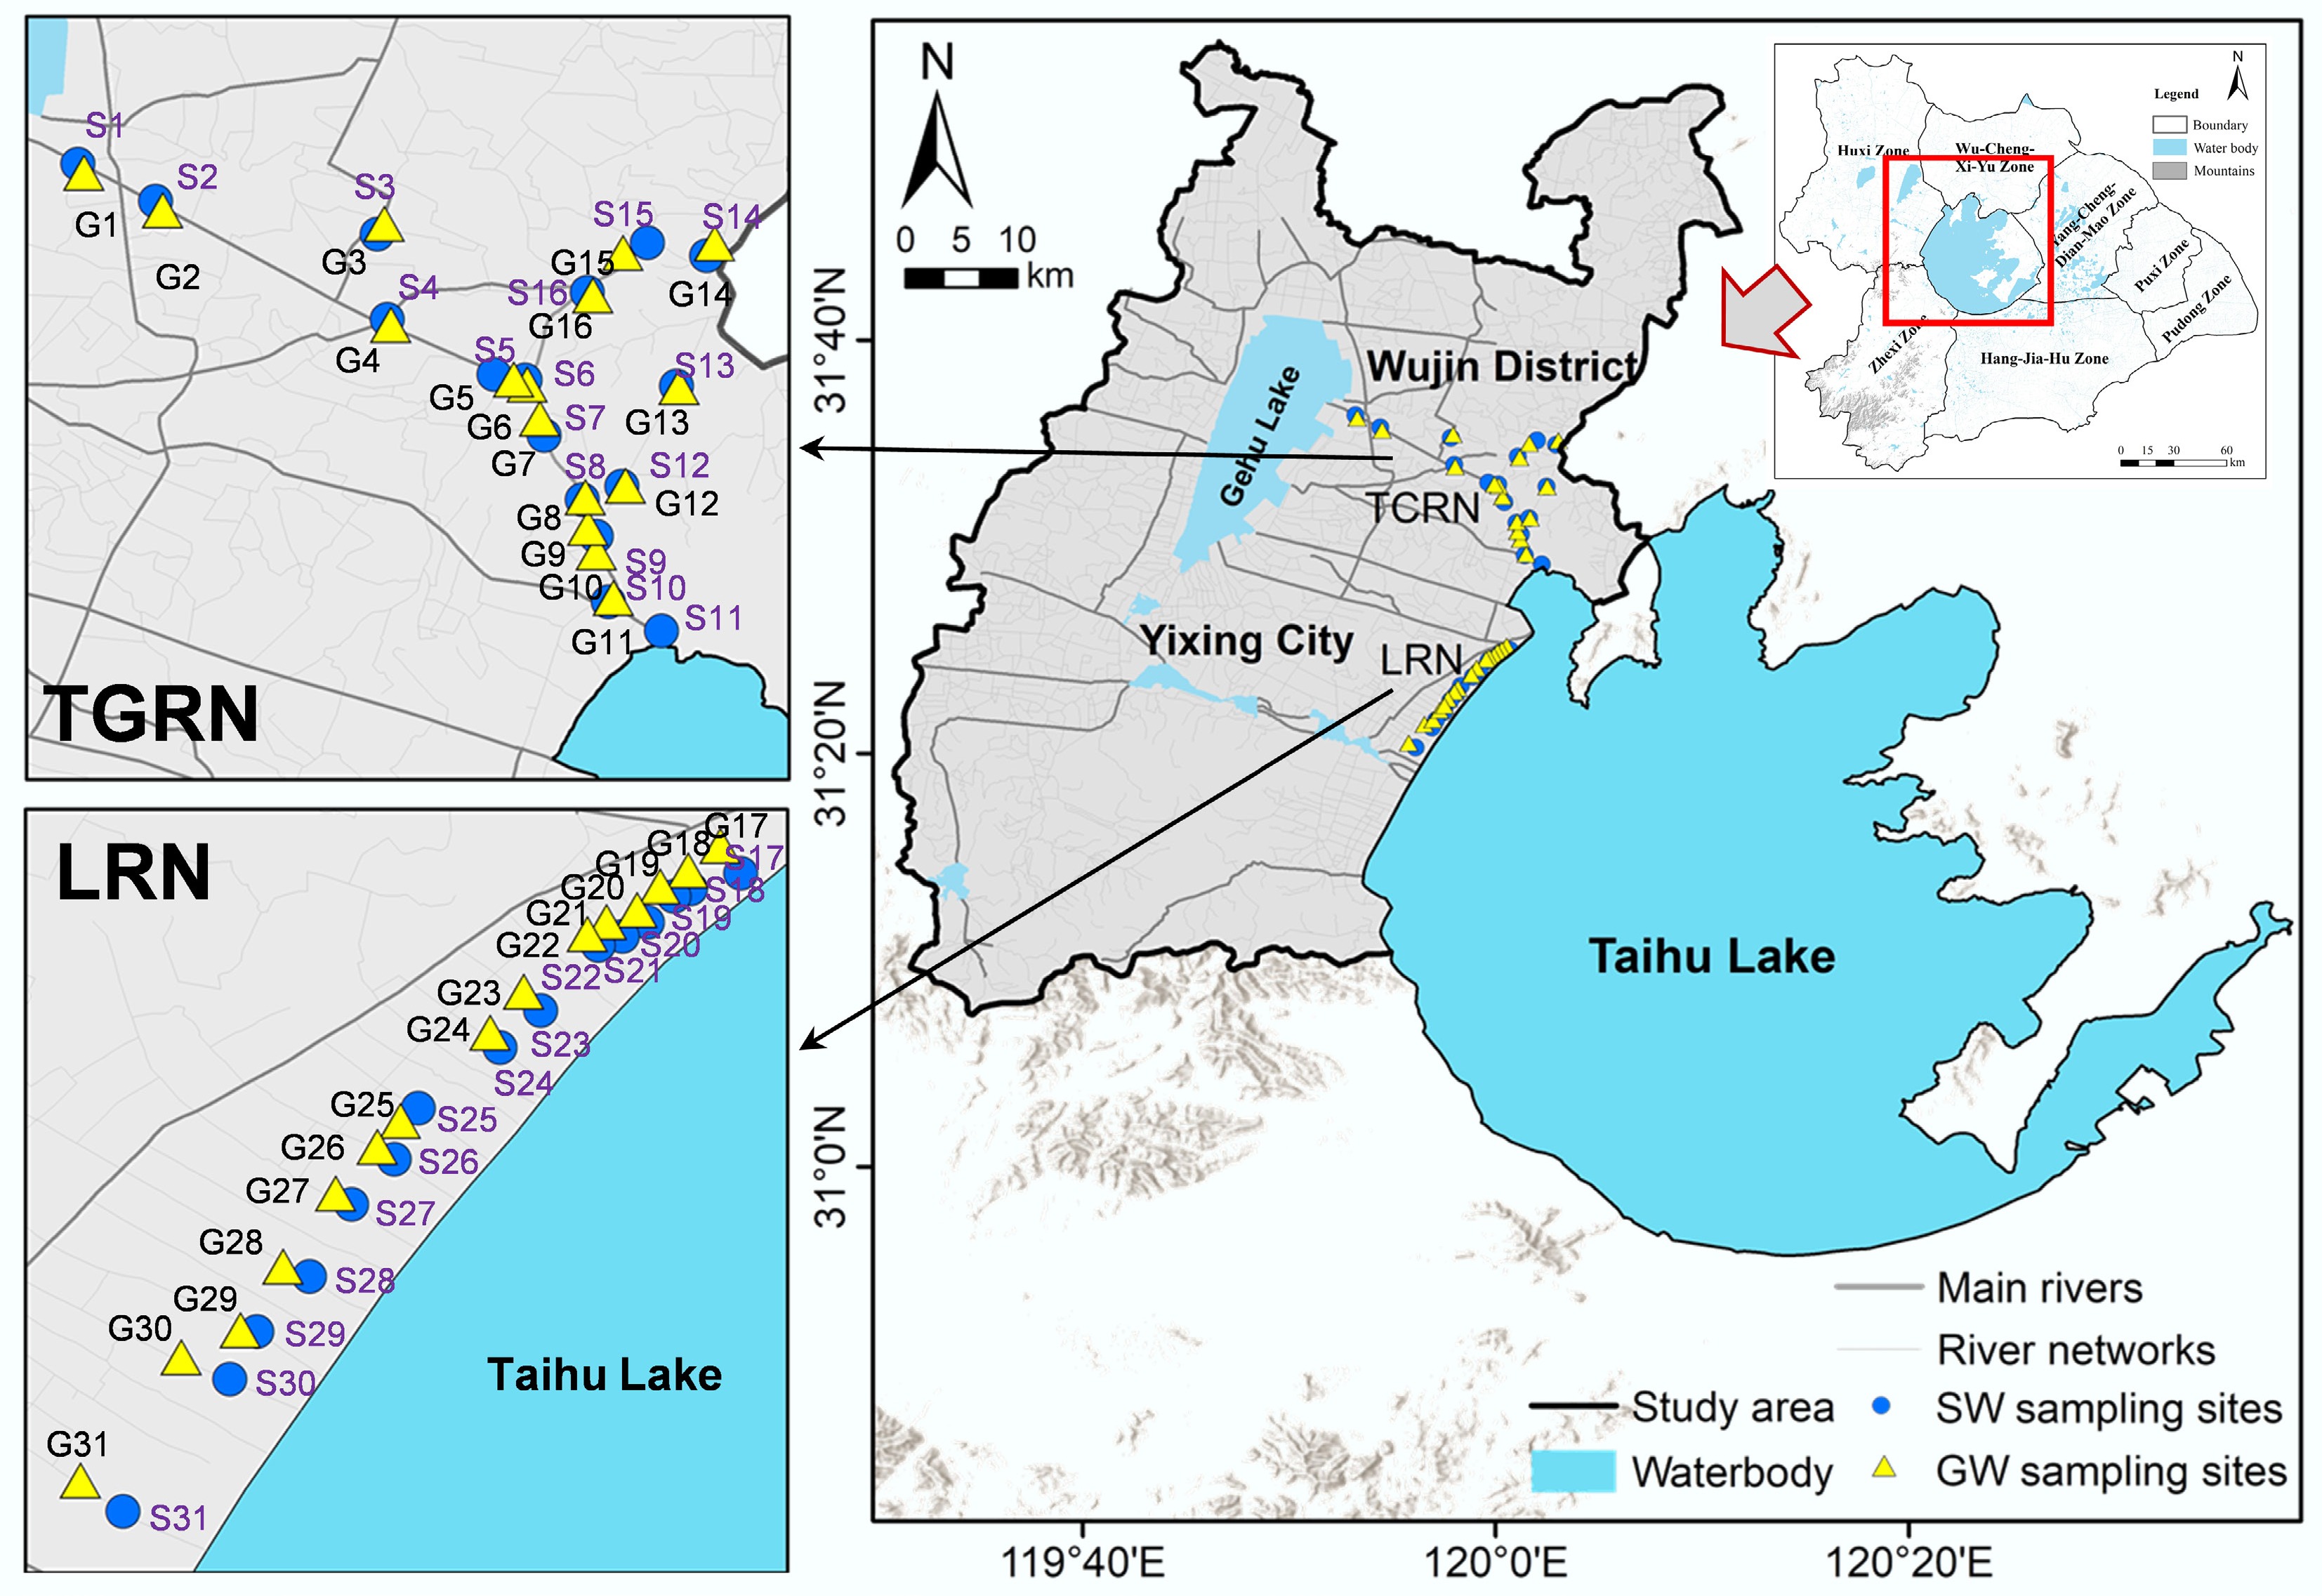
Figure 1.
Study area and seasonal sampling sites for surface water and groundwater samples. TCRN and LRN represent the Tai-ge Canal river network and the lakeside river network, respectively.
Hydrochemistry and isotopic analysis
-
Field water quality indicators, i.e., water temperature (T), dissolved oxygen (DO), electrical conductance (EC), and pH, were determined with a multi-parameter water quality analyzer (Professional Plus, YSI). The contents of total N (TN), ammonium (NH4+-N), NO3−, and total phosphorus (TP) were measured using a continuous flow analyzer (San++, Skalar). The chloride ion (Cl−) concentrations in water samples were determined using an ion chromatography system (ICS-600, Thermo Fisher Scientific).
Dual NO3− isotopes were analyzed by the chemical conversion method[20]. More details on the per-treatment isotopic analysis are available in Supplementary Text S1. Briefly, in the presence of halide ions, the cadmium particles were used to convert NO3− to nitrite (NO2−). The sodium azide-acetic acid mixture solution reduced NO2− to N2O. The δ15N-NO3− and δ18O-NO3− were measured by the isotope ratio mass spectrometer (DELTA Q, Thermo Fisher Scientific) equipped with Gasbench system (Gasbench Plus, Thermo Fisher Scientific). The reference of δ15N and δ18O are N2 in air and Vienna Standard Mean Ocean Water, respectively. The blank correction was applied to each result. Then international standard references and laboratory reference material, USGS-34 (δ15N −1.8‰, δ18O −27.9‰), NO3−-Lab1 (δ15N 66.4‰, and δ18O −7.8‰), NO3−-Lab2 (δ15N 111.8‰, and δ18O 5.6‰), USGS-32 (δ15N 180‰, and δ18O 25.7‰) were used to corrected the raw result. The precision of δ15N and δ18O analysis was 0.31‰ and 0.55‰, respectively.
NO3− source identification
-
To estimate the potential contribution of NO3− sources, the Bayesian mixing model was applied using the R package MixSIAR (v 3.1.12), which accounts for variability in the source and mixture tracer data[25]. More details on MixSIAR can be found in the supplementary material (Supplementary Text S2). The NO3− sources were attributed to five types, i.e., atmospheric deposition (AD), aquaculture effluent (AE), chemical fertilizer (CF), manure, including other organic fertilizers, and their leachate (M), and soil leachate (SL). To estimate the contributions of these sources, dual isotopic values (δ15N-NO3− and δ18O-NO3−) and the end-members were integrated by MixSIAR.
The county-scale N cascade model
-
To estimate the N dynamics at the county scale, an agriculture-food-environment chain model based on material flow analysis was applied in this study[26]. Three categories were divided: the household-consumption subsystem (HCS), the livestock-breeding subsystem (LBS), and the crop-production subsystem (CPS). The N cascade was characterized by statistical data from 2000 to 2023 of YX and WJ. In this flow system, exogenous N inputs include fertilizer, seed, biological N fixation, AD, irrigation water, and imported fodder. After flowing through three systems, it is defined that the N has two output routes (losses to air and water) in this cascade system. However, the N accumulated in cropland soil was not calculated directly in the model using differential subtraction in CPS. More details on the N cascade model and coefficients for each system are described in Wang et al.[14], and in Supplementary Tables S1–S3.
Data and statistical analysis
-
The analysis of the N cascade model data was obtained from the Statistical Yearbook (
https://tjj.changzhou.gov.cn/class/OEJCMFCP/ ,https://tj.wuxi.gov.cn/ztzl/tjnj/ ). The land-use cover change data for the sampling year were obtained from the annual China Land Cover Dataset (CLCD;https://zenodo.org/records/15853565 ).The spatial analysis was realized by ArcMap (ArcGIS 10.2, Esri). The experimental and statistical analyses were performed in Origin (Origin 2024, OriginLab) and RStudio (R Core Team, v 4.2.3). The relative experimental analysis error for each sample was below 5%.
Several uncertainties in the agriculture-food-environment N cascade model, with more than 200 parameters, were analyzed due to limitations and deviations. The parameter change rate was taken as ± 10%[20].
-
The spatiotemporal distribution of hydrogeochemical indicators in the Lakeside River Network (LRN) and the Tai-ge Canal River Network (TCRN) was examined (Fig. 2; Supplementary Tables S4, S5). In surface water, TN concentrations ranged from 1.17 to 21.23 mg L−1 over the area, consistently exceeding the Taihu Lake control threshold of 1.2 mg L−1. The N was dominated by NO3−, followed by NH4+ (Fig. 2). The mean NO3− concentration was 2.81 ± 2.68 mg L−1 (0.33–17.22 mg L−1). The mean NH4+ concentration was 0.35 ± 0.60 mg L−1 (ranging from 0.03 to 5.25 mg L−1), which was lower than NO3−. The Cl− concentrations ranged from 5.80 to 125.28 mg L−1. The DO concentrations in these areas ranged from 1.33 to 23.93 mg L−1, indicating that a few sample sites were in an anaerobic environment (DO < 2 mg L−1) during the rainy, high-temperature season. Groundwater pollution was more severe, with mean values of 7.42 ± 6.99 mg L−1 for TN, 6.27 ± 4.86 mg L−1 for NO3−, and 60.30 ± 57.54 mg L−1 for Cl−.
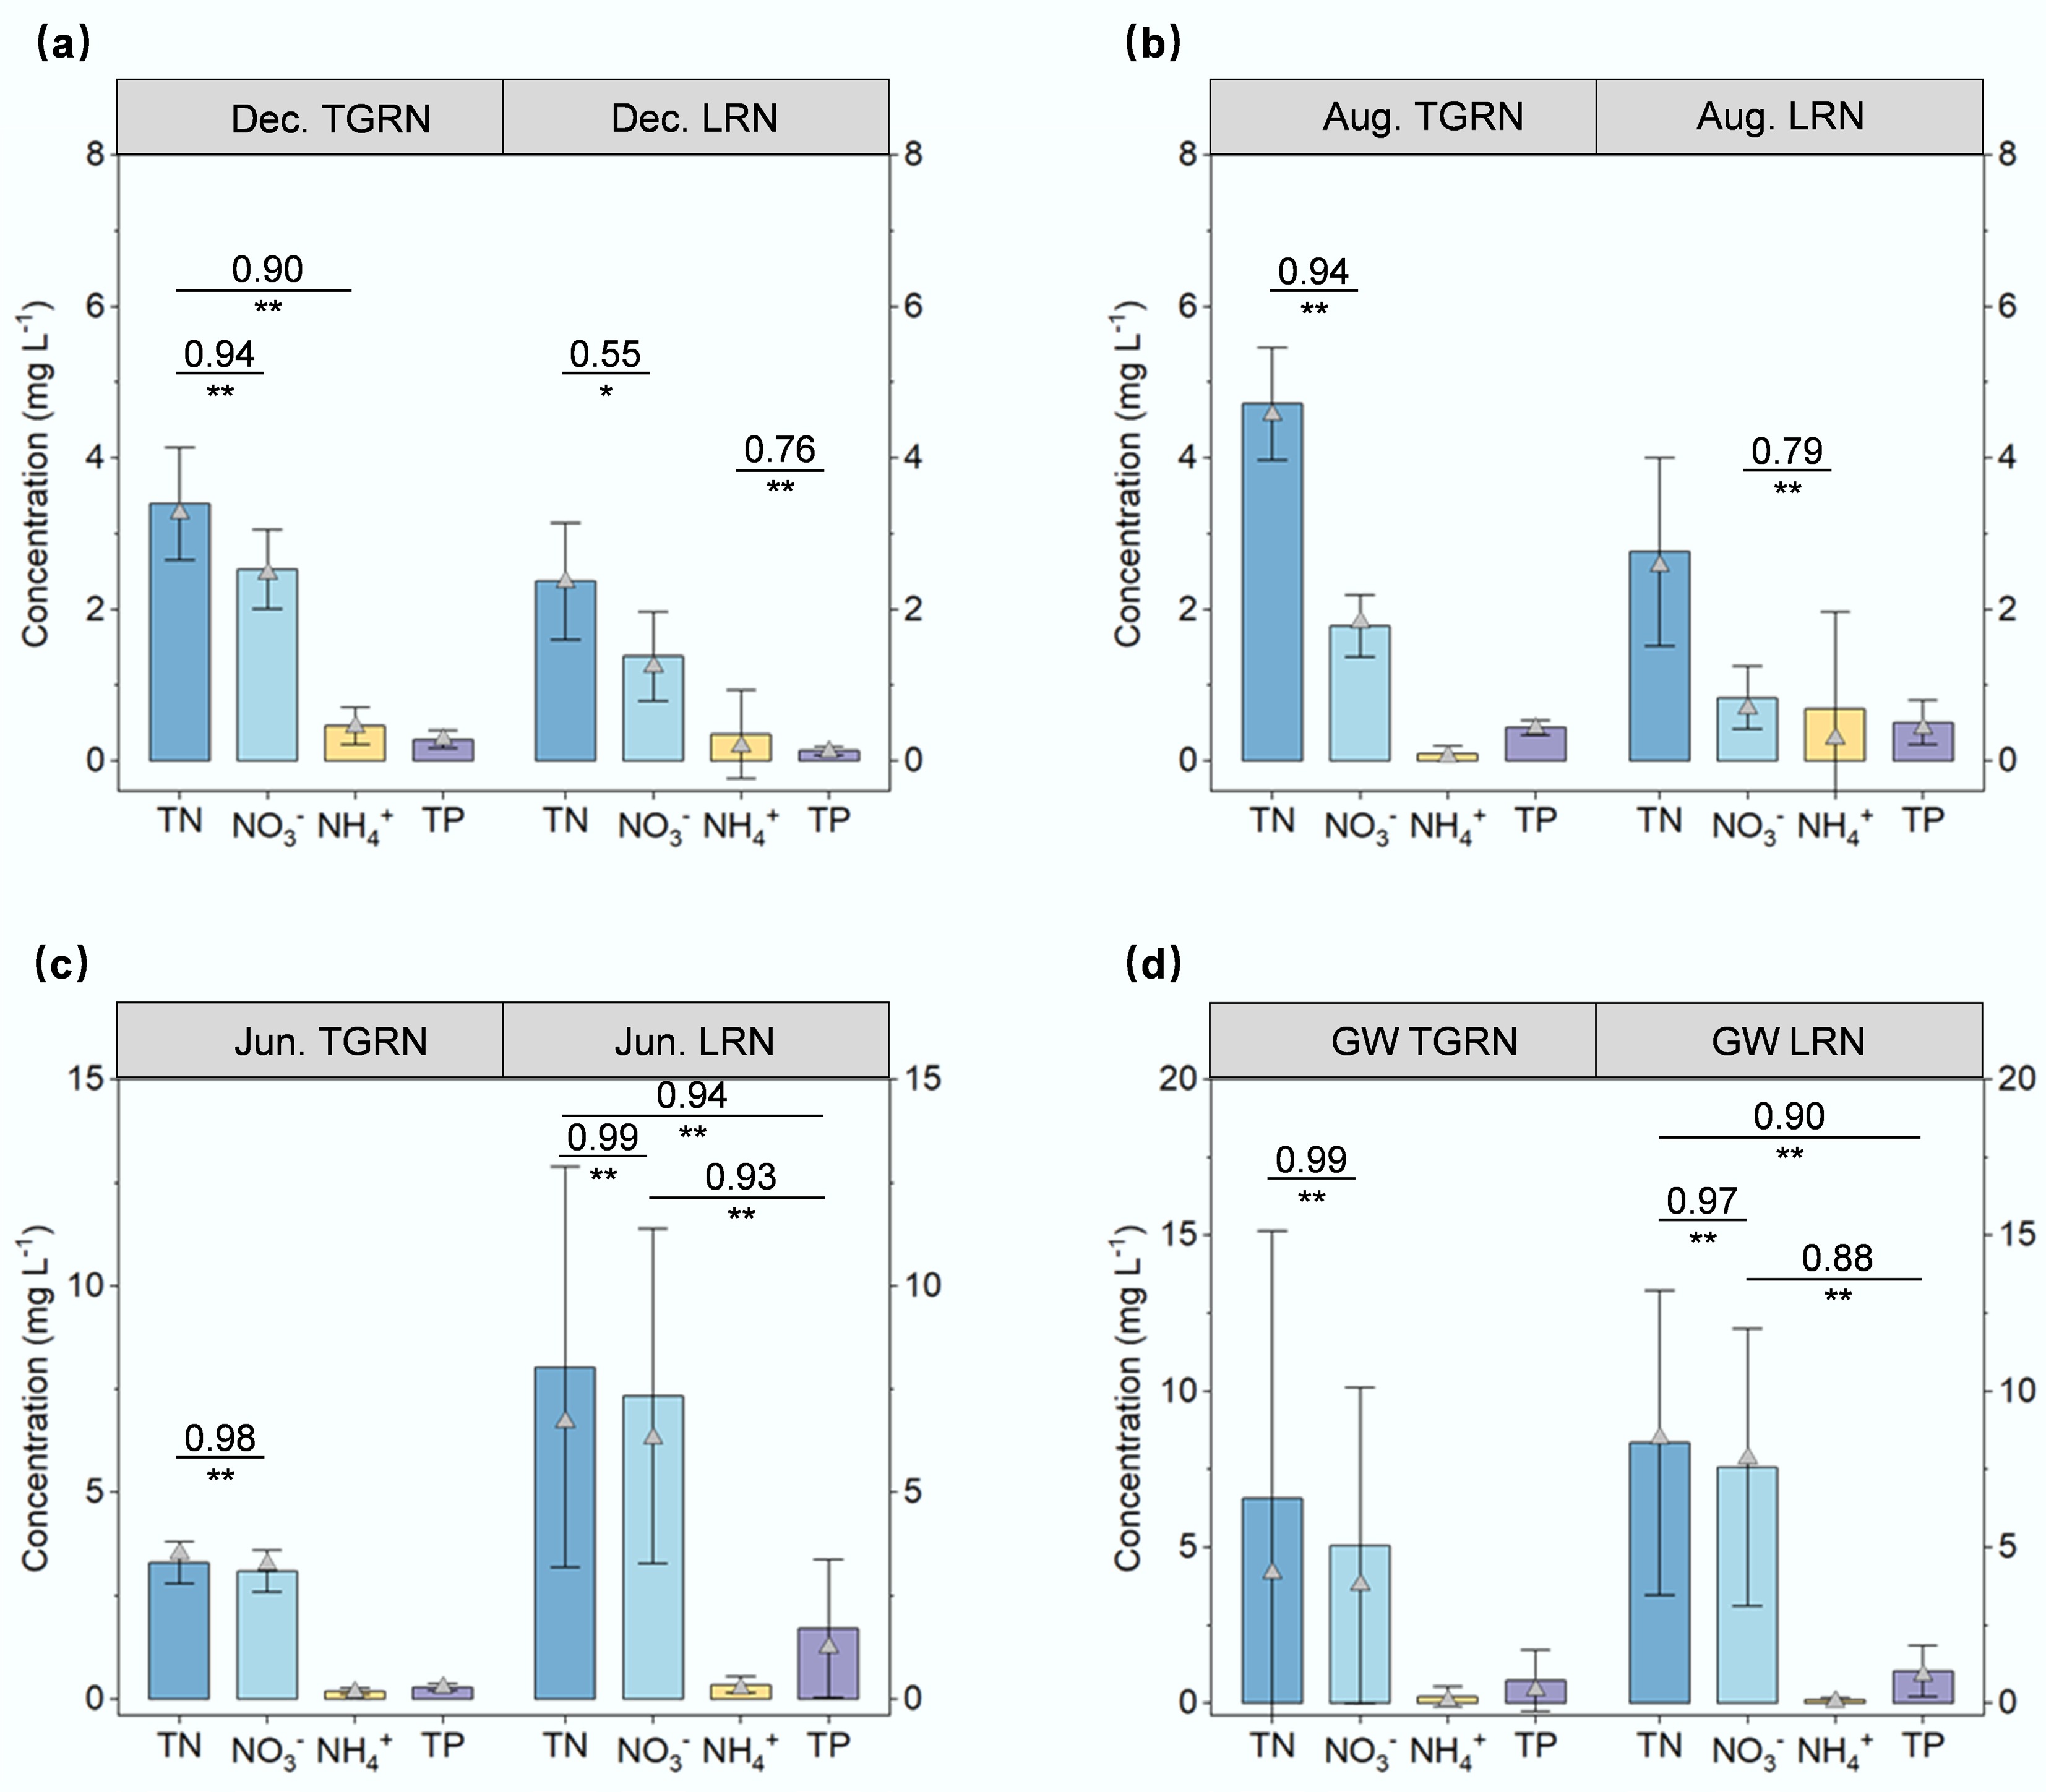
Figure 2.
Differences in nutrient concentration of surface water during the (a) dry, (b) wet, and (c) regular flow seasons and groundwater during the regular (d) flow season in the Tai-ge Canal river network area (TGRN), and the lakeside river network (LRN).
TN in TCRN was higher than that in LRN both in the dry season (3.39 ± 0.75 mg L−1 > 2.37 ± 0.77 mg L−1) and wet season (4.72 ± 0.74 mg L−1 > 2.76 ± 1.24 mg L−1), as well as the trend in NO3− and TP. The N/P ratio was higher in the dry season (19.75 ± 7.44 in LRN and 15.62 ± 10.52 in TGRN) than in the wet season (8.11 ± 8.08 in LRN and 11.27 ± 2.96 in TGRN) and regular season (8.82 ± 6.54 in LRN and 12.39 ± 3.51 in TGRN). Seasonal shifts in inflowing N/P ratios may aggravate nutrient limitation patterns in Taihu Lake and complicate nutrient management[8,27].
End-member values for regional potential NO3− sources
-
Isotopic and hydrogeochemical indices were used to characterize N cycling processes and identify potential NO3− source[28]. Potential NO3− sources and isotopic end-member values were established. Due to the plain-river network, a high density of freshwater ponds was observed upstream of the basin, covering about 600,000 acres[29]. To meet high production levels, the breeding pounds require high inputs and generate high outputs (e.g., nutrients, antibiotics, and hormones). Smallholder farms release more chemical fertilizers and manure into the field and the environment. Thus, based on field investigations of regional NO3− sources, five potential NO3− sources were identified in this study (i.e., AD, AE, CF, M, and SL). All potential regional NO3− sources were collected in the field and analyzed for isotopic characteristics in the lab (Table 1). The CF includes the fertilizers, i.e., compound fertilizer (N-P2O5-K2O), urea, and ammonium bicarbonate, commonly used in the region. The manure includes human excrement, poultry droppings, and their leachate.
Table 1. Isotopic end-members for MixSIAR quantifying the contribution of NO3− sources
Sources δ15N-NO3−
(Mean ‰ ± SD ‰)δ18O-NO3−
(Mean ‰ ± SD ‰)n Atmospheric deposition (AD) −3.38 ± 2.42 58.04 ± 6.27 4 Aquaculture effluent (AE) 4.46 ± 4.92 8.27 ± 5.22 5 Chemical fertilizer (CF) −0.94 ± 1.00 −0.60 ± 1.50 7 Manure (M) 20.10 ± 6.39 12.63 ± 4.28 7 Soil leachate (SL) 6.09 ± 6.33 9.20 ± 2.75 17 Spatiotemporal patterns of NO3−-related hydrochemical and isotopic indicators
-
The combination of hydrogeochemical indicators and dual isotopes allows for better traceability. Cl− is a chemical tracer due to its chemical and biological inertness, which can combine with NO3− to identify potential sources of NO3−[30]. Because Cl− is affected by dilution and hydrological mixing, the NO3−/Cl− ratio was applied to distinguish agricultural inputs, soil leachate, and manure and sewage sources (Fig. 3). During the dry season in LRN, the Cl− concentration was high (1.51 ± 0.43 mM) and NO3−/Cl− was low (0.05 ± 0.03), which indicated the potential sources may be the manure. In the wet season, the Cl− in LRN (0.40 ± 0.13 mM) and TGRN (0.61 ± 0.20 mM) were relatively low, and the NO3−/Cl− ratios were low, indicating the increasing contribution of mixing sources. In the regular flow season, isotopic and hydrochemical patterns pointed primarily to manure and sewage inputs.
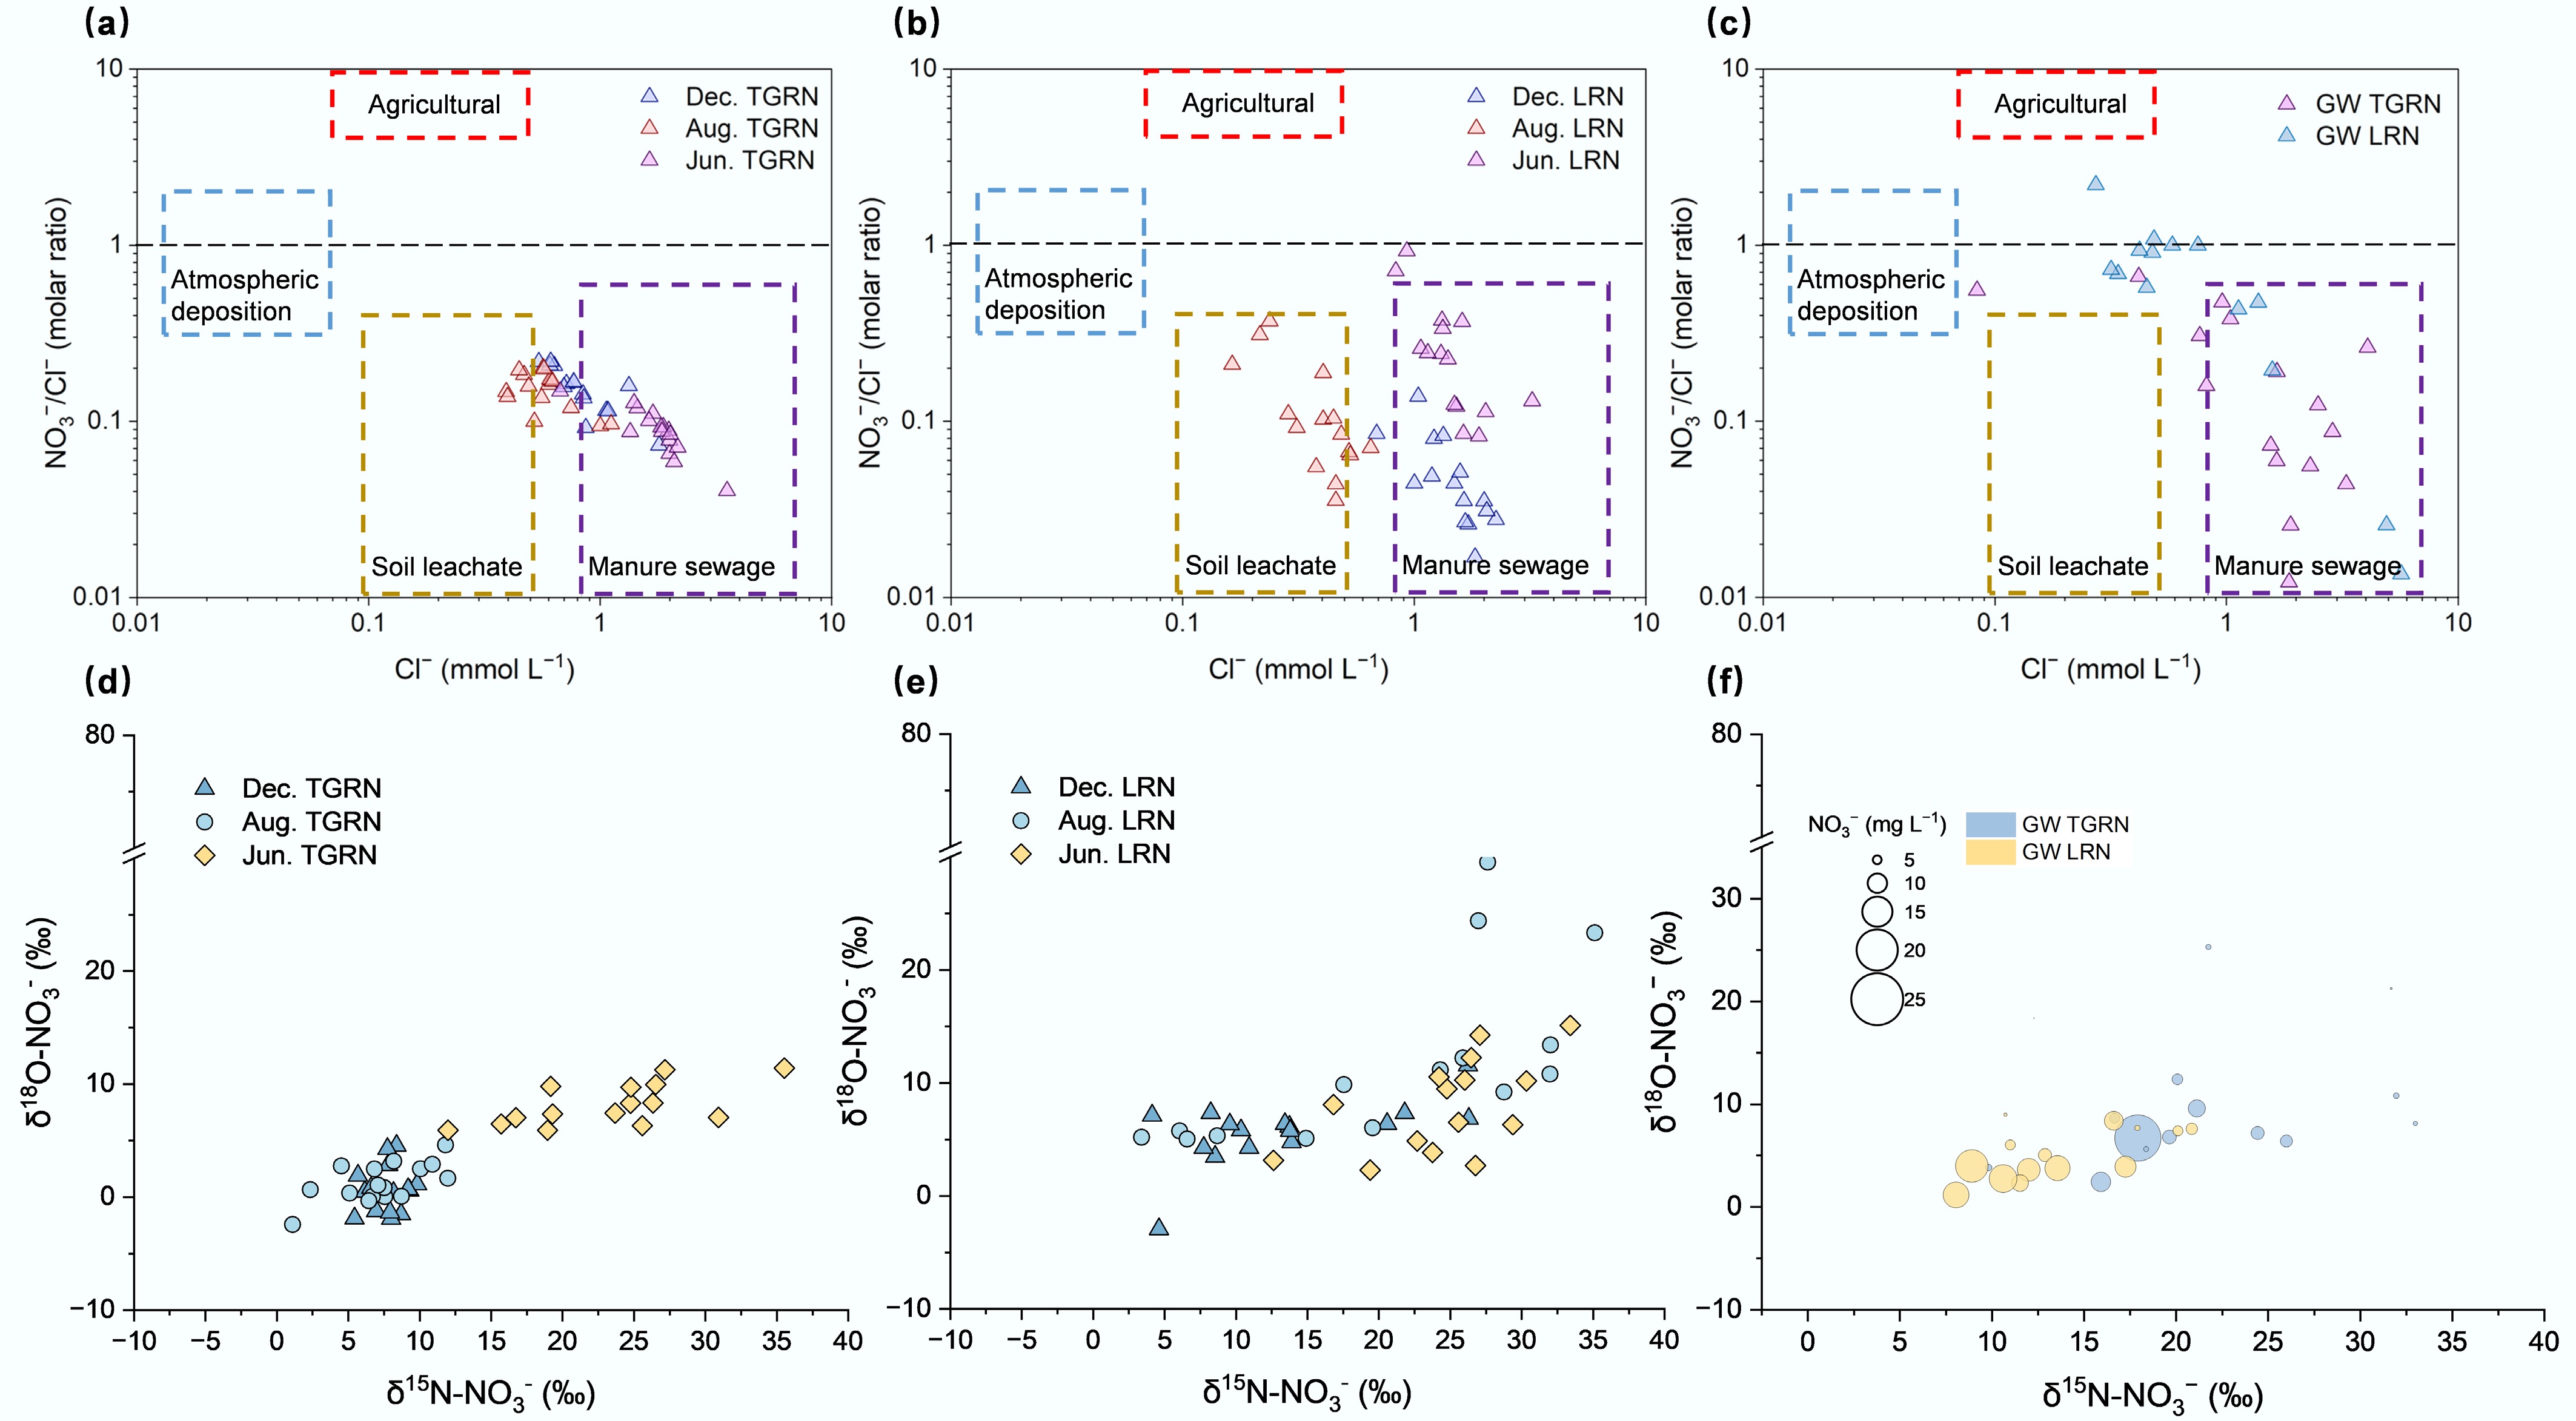
Figure 3.
(a)–(c) Mixing diagram with NO3−/Cl− ratios and Cl− concentrations. (d), (e) Dual isotopic component for surface water samples in dry, wet, and regular seasons. (f) Dual isotopic component and NO3− concentration for groundwater samples.
Generally, TGRN exhibited a narrower range of NO3− isotopic value than LRN (Fig. 3). During the wet season, δ15N-NO3− in LRN surface water ranged from 4.13‰ to 26.29‰ and the δ18O-NO3− from −2.93‰ to 11.56‰, both exceeding the corresponding ranges in TGRN (mean δ15N-NO3− 7.68‰ ± 1.28‰; mean δ18O-NO3− 0.62‰ ± 2.01‰). The average δ15N-NO3− values in the wet season were 20.01‰ ± 10.10‰ in LRN and 7.30 ± 3.08‰ in TGRN. In the regular flow season, elevated TN and δ15N-NO3− values were observed in both LRN (24.61‰ ± 5.25‰) and TGRN (23.14‰ ± 6.17‰). Spatially, areas with lower NO3− concentrations tended to exhibit higher δ15N-NO3− and δ18O-NO3− values, with these observations concentrated in traditional agricultural zones. Groundwater in TGRN showed a higher mean δ15N-NO3− than that in LRN (Fig. 3f).
Quantitative identification of NO3− sources
-
In the LRN, the proportional contributions of NO3− sources showed consistent seasonal patterns, with the ranking of potential sources following M > CF > AE > SL > AD across the dry, wet, and normal flow seasons (Fig. 4a). Manure was the dominant contributor, accounting for 51.3% ± 19.3% in the dry season, increasing to 65.4% ± 22.5% in the wet season, and reaching 89.0% ± 4.9% during the regular flow period. Chemical fertilizer (CF) represented the second-largest source, contributing 28.8% ± 13.0%, 23.0% ± 17.8%, and 4.8% ± 3.0% in the dry, wet, and regular flow seasons, respectively. The contributions from AE and SL were relatively minor, and both showed higher proportions in the dry season (12.9% ± 5.6% and 6.5% ± 2.5%) than that in between δ15N–NO the wet and regular flow seasons. Overall, LRN exhibited a strong and persistent influence of M-derived NO3−. Manure was also the predominant NO3− source in groundwater (Fig. 4c), contributing 59.6% ± 12.8% on average, followed by CF (27.0% ± 11.2%).
In contrast, the TGRN displayed a different seasonal structure of NO3− sources, with contributions ranked as AE > CF > M > SL > AD in dry and wet season (Fig. 4a). During the dry season, AE was the primary source, contributing 71.4% ± 4.2%, followed by CF at 17.0% ± 3.2%. In the wet season, however, the influence of agricultural inputs increased, with CF- and M-derived NO3− rising to 37.0% ± 9.7% and 14.5% ± 4.8%, respectively. Notably, similar to LRN, manure became the dominant source during the regular flow season, contributing 83.0% ± 7.9%. Groundwater in TGRN was also primarily influenced by M (Fig. 4b), accounting for 83.8% ± 8.5%.
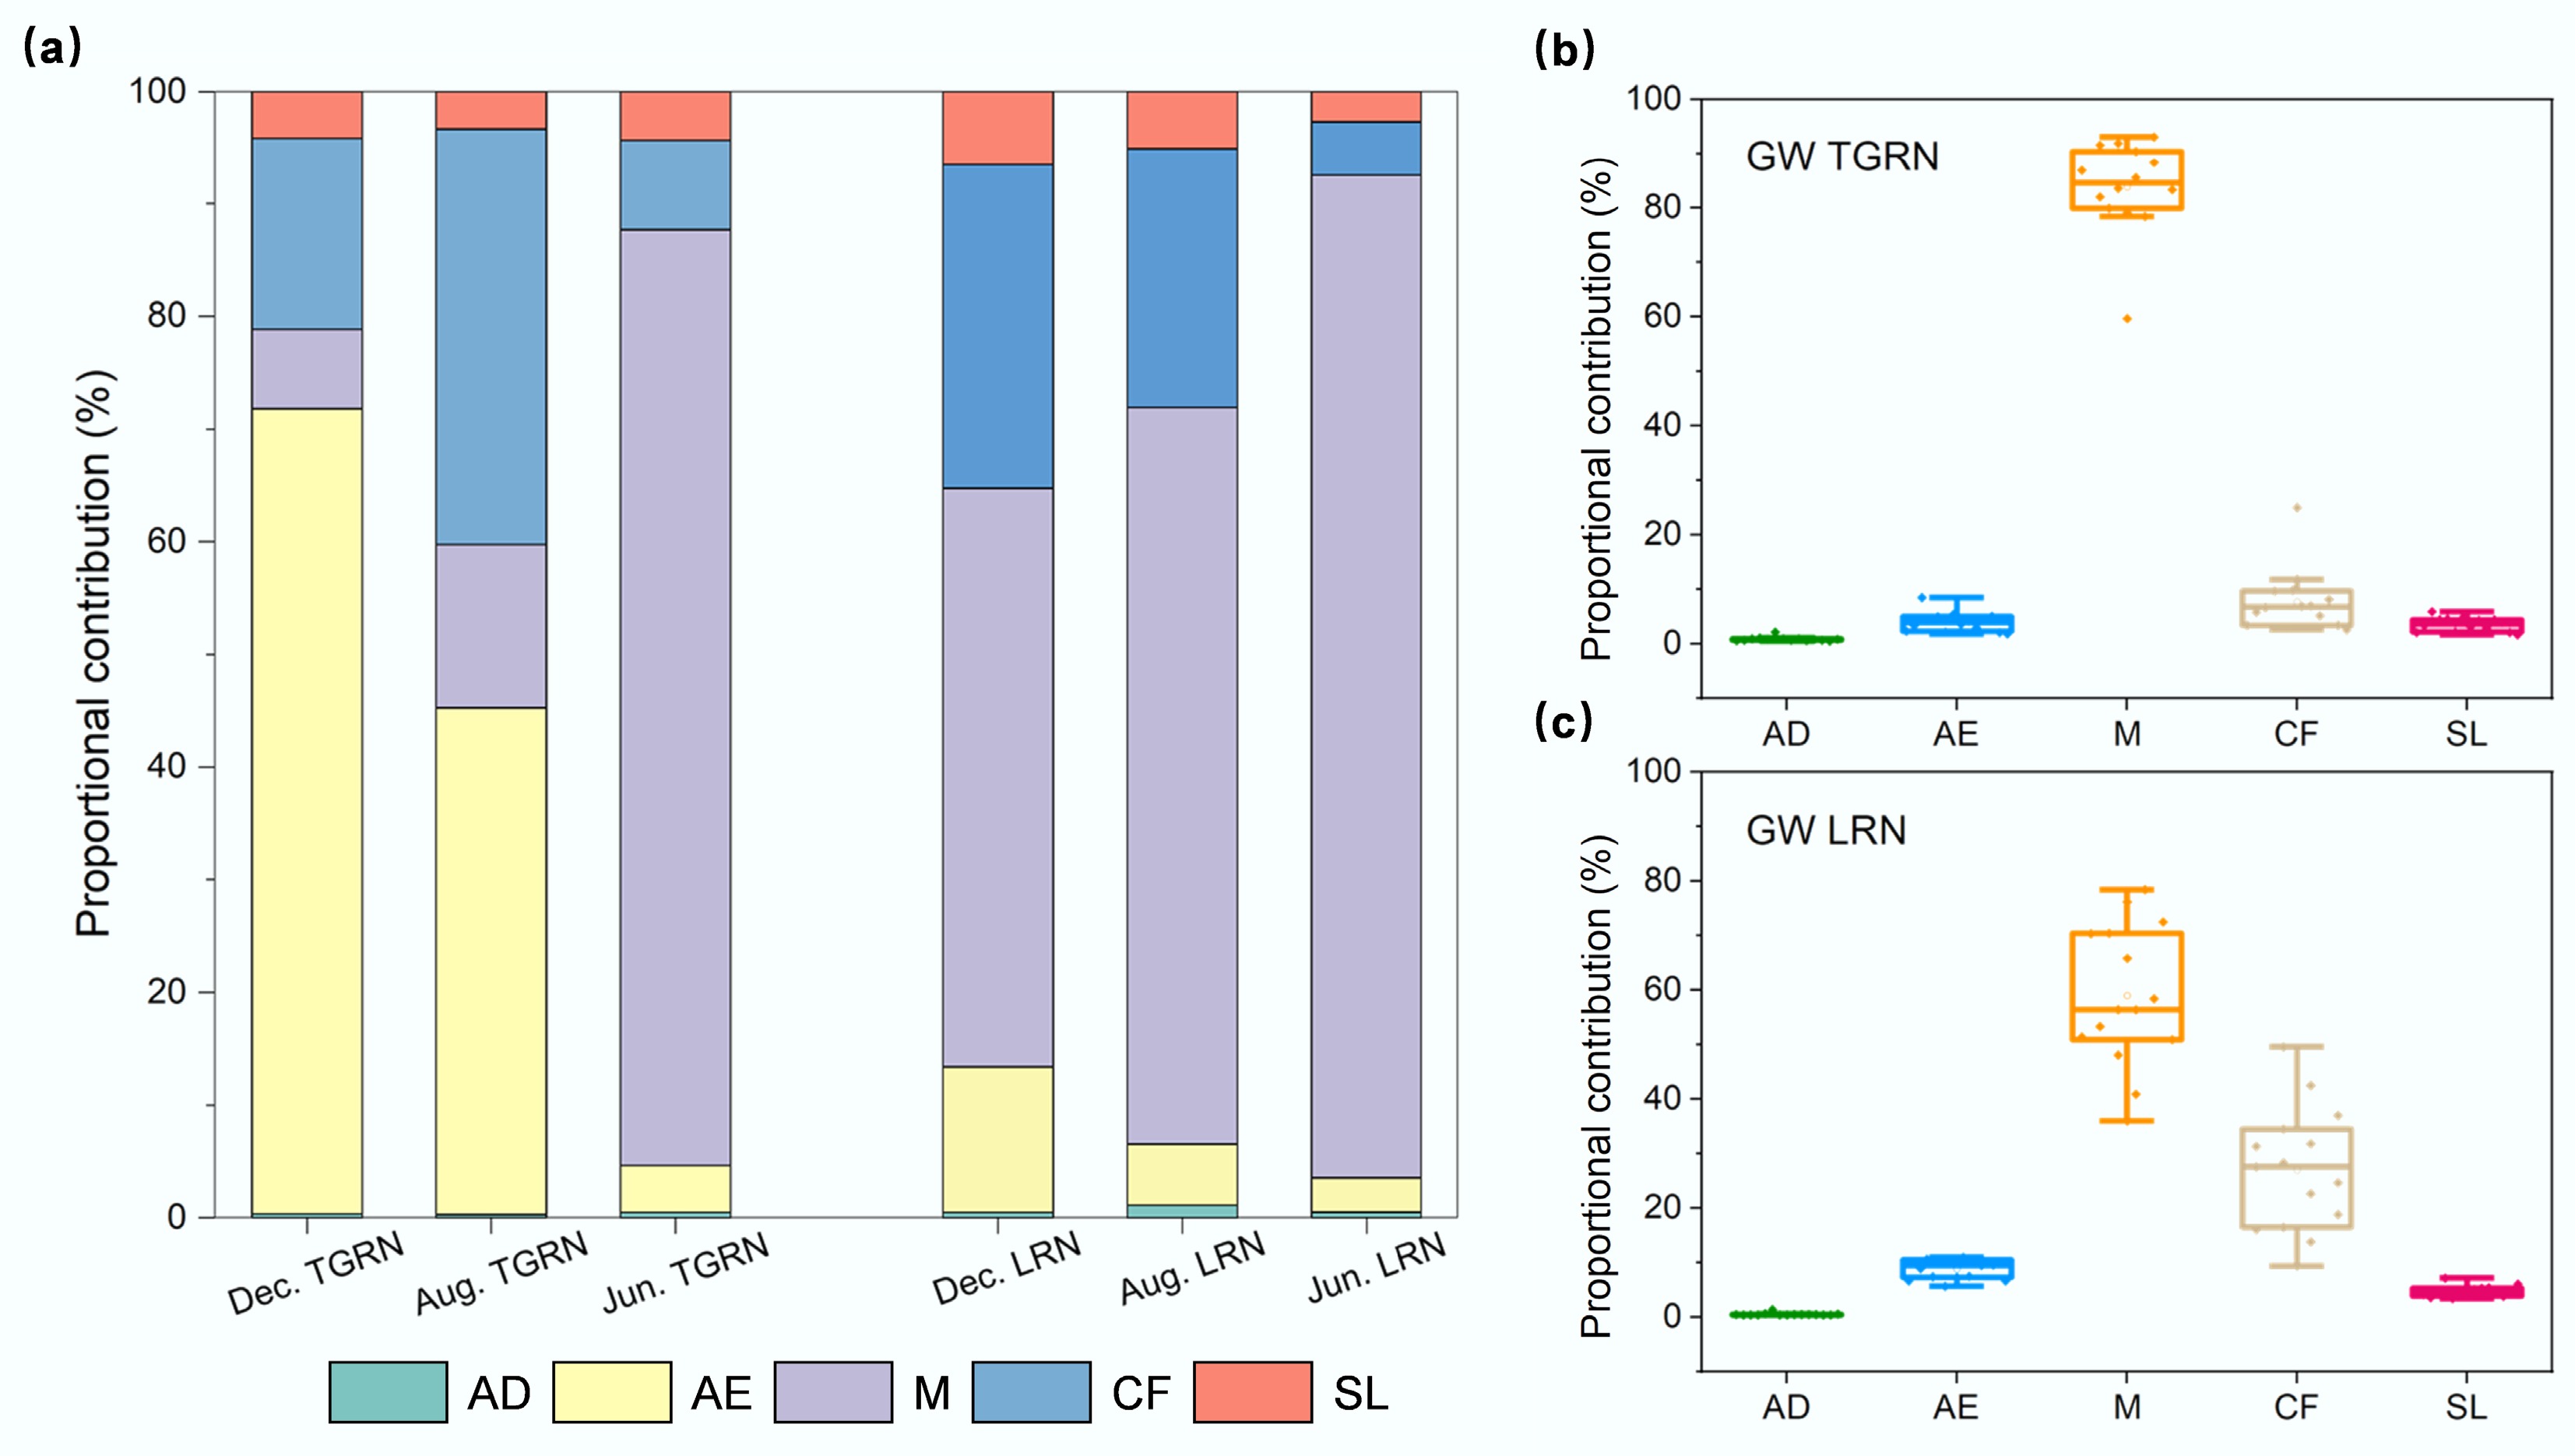
Figure 4.
Proportions for NO3− source in (a) surface water samples, and (b), (c) groundwater samples. Atmospheric deposition (AD), aquaculture effluent (AE), chemical fertilizer (CF), manure (M), and soil leachate (SL) were potential sources of nitrate.
-
Keeling plots showed no significant linear relationships between isotopic values and 1/NO3− (Supplementary Fig. S1), indicating mixed NO3− sources and active biological removal[31]. Biological processes such as nitrification, denitrification, and biological assimilation in aquatic systems alter the isotopic composition of NO3−. The oxygen atoms in NO3− were derived from H2O and O2, the microbial nitrification, following the equation: δ18O-NO3−= 2/3 δ18O-H2O + 1/3 δ18O-O2[31]. The end-member value of δ18O-O2 was 23.5‰. Based on previous δ18O-H2O measurement from Gehu Lake (−3.1‰) and Taihu Lake (−3.5‰), the theoretically nitrification δ18O value was approximately 6.7‰–6.8‰[19]. In this study, the averaged measured δ18O-NO3− in the Lakeside River Network (LRN) during the dry season was highly variable (5.77‰ ± 3.01‰) but close to theoretical values, indicating that nitrification was the main process shaping δ18O-NO3− during sampling. This is consistent with the hydrological and biogeochemical context of LRN: shallow channels, short water residence times, strong connectivity with cropland drainage, elevated ammonium inputs, and generally oxic conditions together enhance nitrification[24].
In denitrification processes, anaerobic microbes consume the light isotopes such as 14N and 16O, leading to the simultaneous enrichment of 15N and 18O in the residual NO3−[32]. The DO concentration could also reflect anaerobic conditions (DO < 2 mg L−1), and the ratio of δ15N-NO3− to δ18O-NO3− could reflect denitrification ranging from 1.3:1 to 2.1:1[24]. For surface water, during the wet season, DO concentrations in LRN (3.98 ± 2.32 mg L−1) and the Tai-ge Canal River Network (TCRN) (4.11 ± 2.07 mg L−1) were lower than in the dry and regular seasons. At the same time, no significant linear correlations were observed between δ15N-NO3− or δ18O-NO3− and ln[NO3−] (p > 0.05, Supplementary Fig. S2c, S2d). Therefore, the impacts of denitrification and biological assimilation were limited in surface water. In contrast, groundwater exhibited a clear negative correlation between δ18O-NO3− and ln[NO3−], consistent with isotopic enrichment of the residual nitrate during denitrification. The occurrence of denitrification is further supported by low DO levels and by the hydrogeological setting of TGRN, where rising groundwater tables and reduced vadose-zone thickness enhance the mobilization of organic carbon into the aquifer[33].
Because source contributions are probabilistic variables, their uncertainty was quantified using the uncertainty index (UI90), defined as the difference between the 5th and 95th percentiles divided by 90[34,35]. Regarding the TGRN tracing results, an uncertainty analysis was conducted (Supplementary Table S6). The NO3− sources, such as AD, AE, and SL, exhibited minimal UI90 values (≤ 2 × 10⁻⁴), indicating highly stable posterior estimates with contributions close to 0% (0%–2.1%). The primary sources, i.e., CF and M, also demonstrated very low uncertainty, with UI90 values of 2 × 10⁻³. Overall, the low UI90 values across all sources demonstrate that the source apportionment results in this study are highly reliable.
From an environmental management perspective, the contrasting N transformation pathways between the two river networks highlight differing ecological risks. In the wet season, due to agricultural production, fertilizers (chemical fertilizer, i.e., Synthetic NO3− fertilizers, urea, and ammonium bicarbonate; organic fertilizer, i.e., manure and green manure) were wildly applied in the field[15]. In LRN, rapid flushing and strong nitrification facilitate downstream export of NO3−, thereby increasing the potential for eutrophication in receiving lakes. In this study, δ15N-NO3− values for all groundwater samples exceeded 8‰, indicating a more substantial influence of anthropogenic activities. It was usually accompanied by a higher Cl− concentration (Fig. 3c), due to their common source. Conversely, denitrification in groundwater provides partial attenuation of NO3− loads, but may enhance the production of reduced N form or potent greenhouse gases such as N2O under anaerobic conditions. Understanding these spatially heterogeneous transformation processes is therefore crucial for designing targeted nitrogen mitigation strategies in the Taihu Lake Basin.
Variations in N inputs and environmental losses
-
In developed agricultural areas, it is necessary to establish a suitable rural-scale N flow model to examine the characteristics of N flux and its environmental fate. The boundary N imported into the agriculture-food-environment system in Wujin County during 2000–2017 increased from 533 kg to 1,108 kg N ha−1 and had a decrease after 2017 (Fig. 5a). In YX, the imported boundary N decreased from 650 kg to 450 kg N ha−1 (Fig. 5d). The massive fertilizer input in two areas was the major component of total N input, accounting for 66%–87%. Statistical data indicate a clear shift from grain crops toward high-value commercial crops. From 2000 to 2022, grain production in YX decreased from 478,950 to 357,311 t, whereas vegetable and fruit production increased by 121% and 301%, respectively. This shift reflects the growing dominance of commercial agriculture, which typically requires higher fertilizer inputs[36]. In the crop-production subsystem (CPS), the contribution of atmospheric deposition decreased from 6.7% to 3.8% of N input in Wujing District (WJ) and averaged 7.5% in Yixing City (YX) over the decades, and this contribution was significantly influenced by cultivated area (p < 0.01). China has become a hotspot for N deposition driven by excessive N fertilizer use. The N deposition caused by over-application of N accounted for 10%–20%[37]. Reducing field N fertilizer application is urgent and has been proven effective without affecting crop yields[38]. In addition, in the developed region of the Yangtze River Delta, rural-urban migration creates an opportunity to integrate fragmented farmland[39], which may improve N use efficiency.
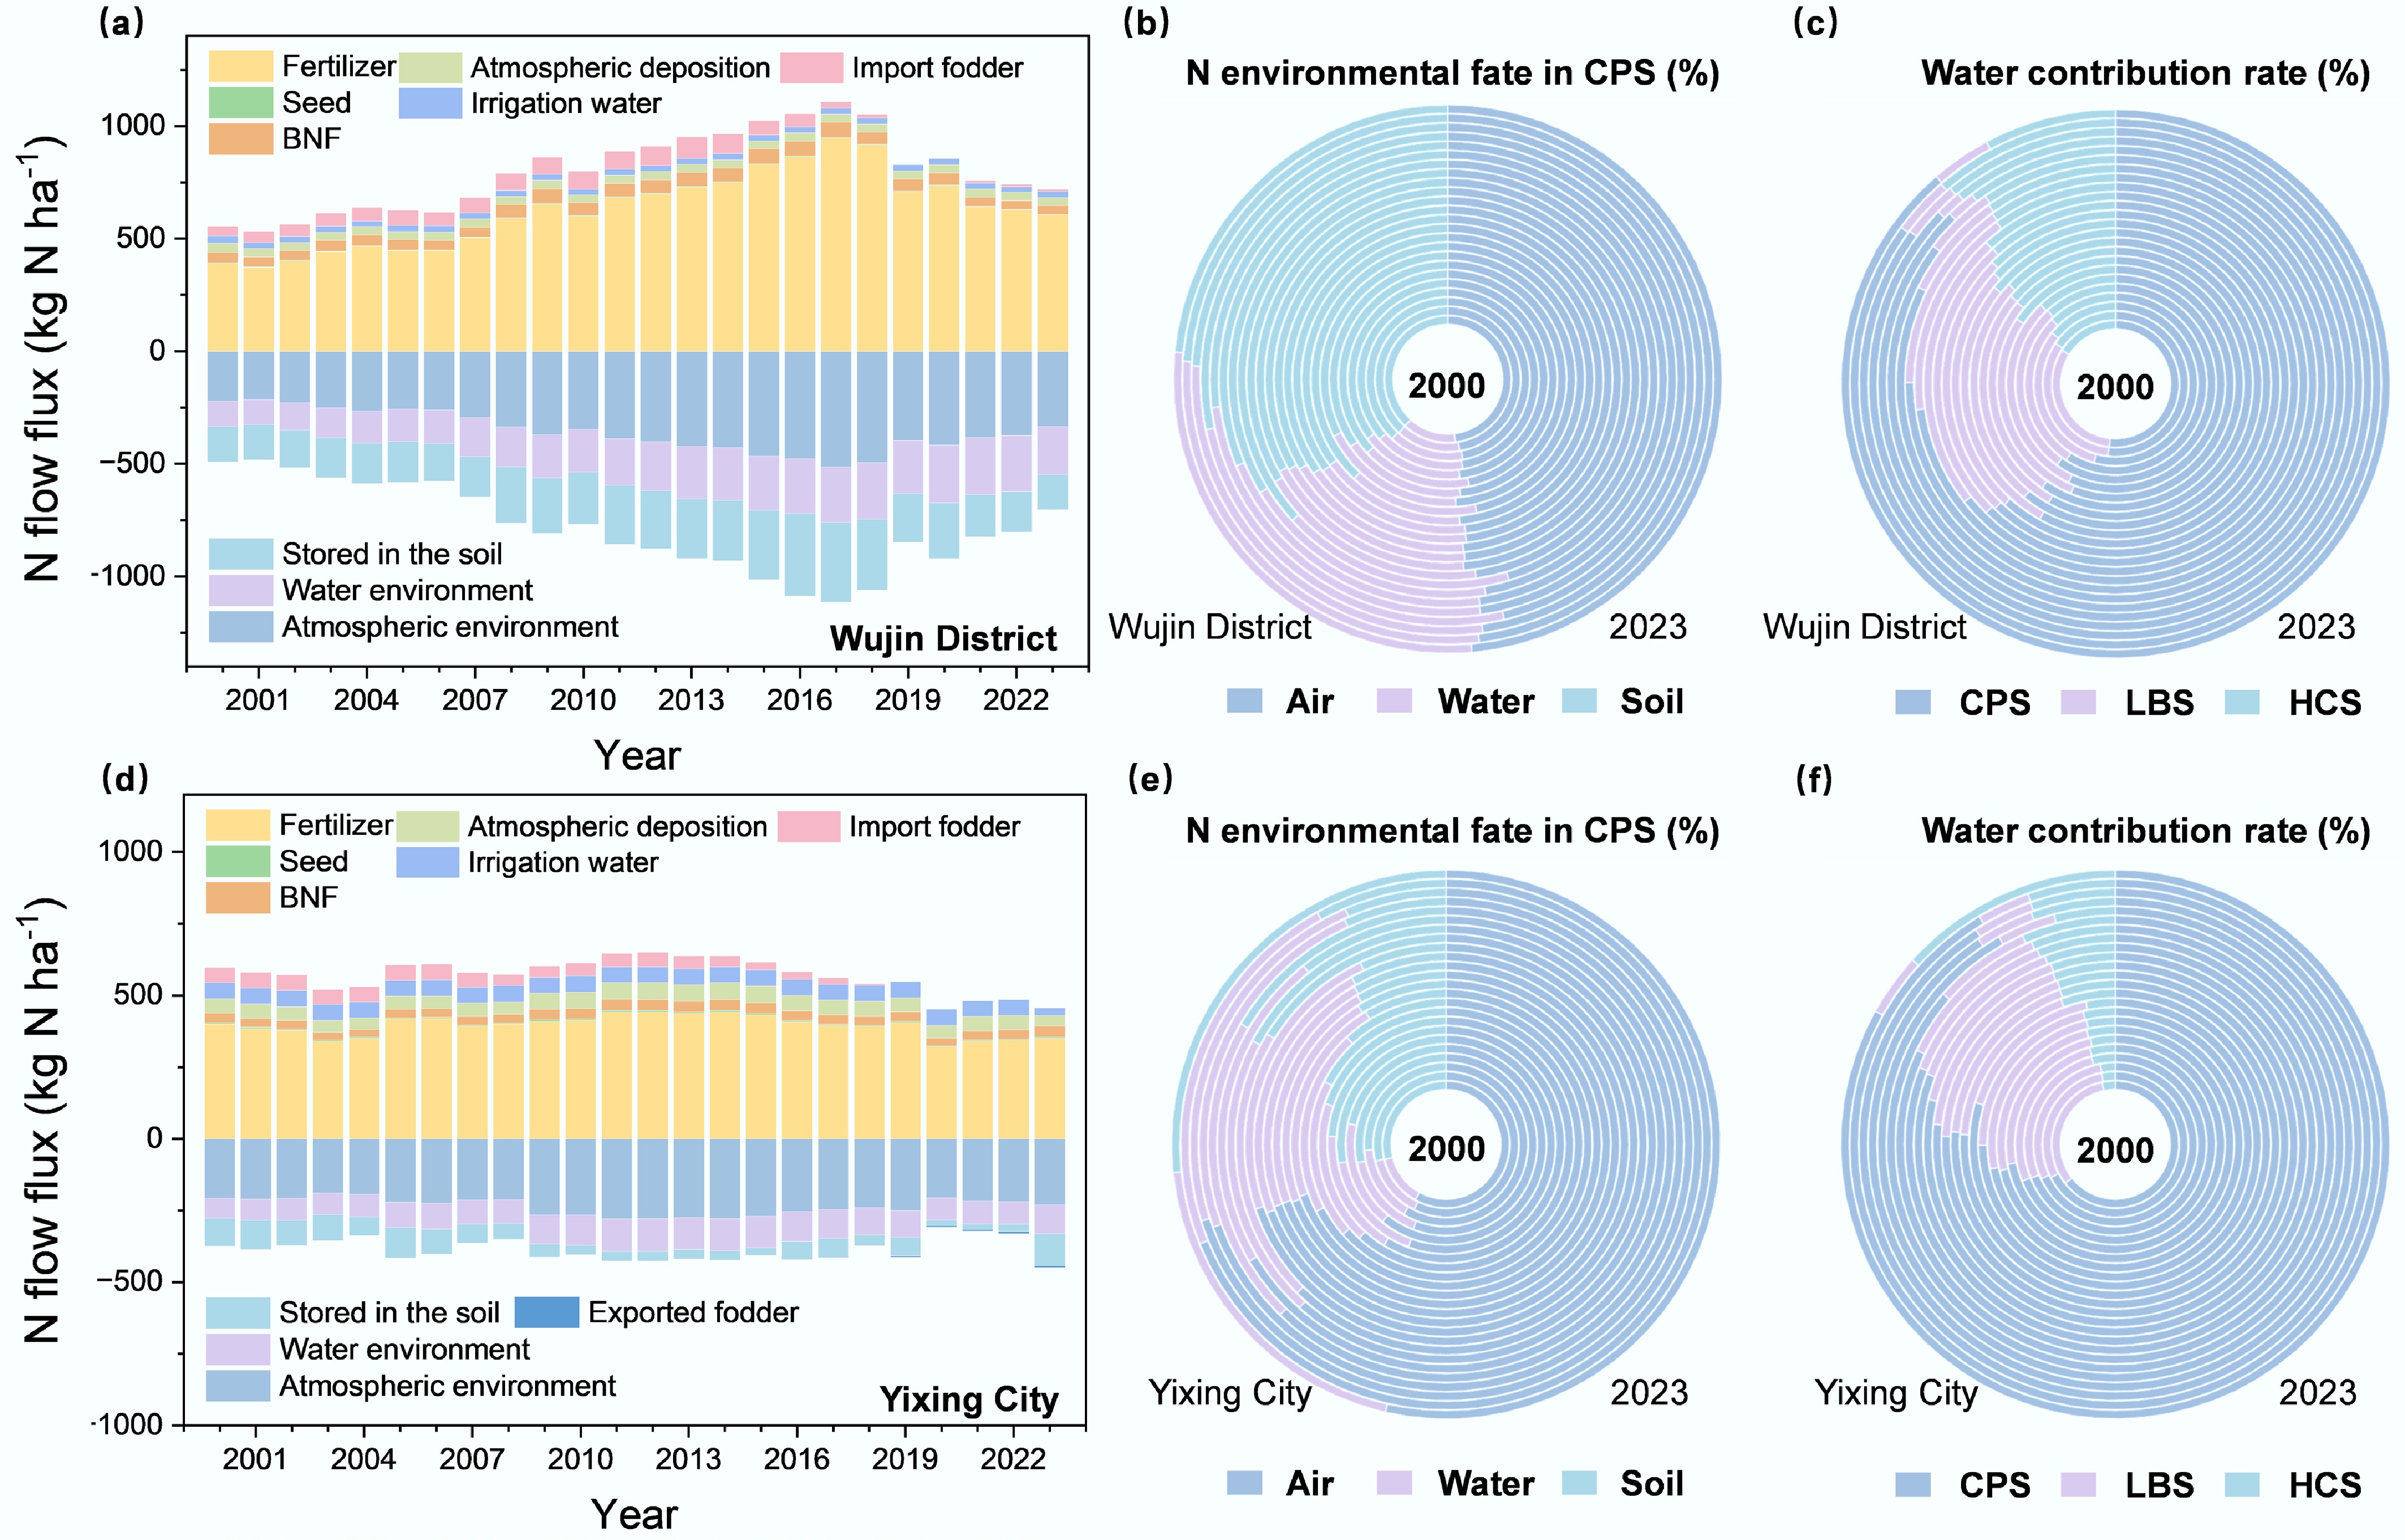
Figure 5.
Temporal N flux in the agriculture-food-environment system in (a) Wujin District, and (d) Yixing City from 2000 to 2023. (b), (e) The N environment fate in CPS can be divided into losses to air and water, and storage in soil. (c), (f) The contribution percentage of N loss from crop-production subsystem (CPS), livestock-breeding subsystem (LBS), and household-consumption subsystem (HCS) subsystems to the water environment during the period 2000–2023.
During the N flow process in systems, the environmental fate of N can generally be divided into losses to the atmosphere and water environments, and storage in soil. In CPS, N environmental fate was mainly lost to the atmosphere in both areas (Fig. 5b, e). While in WJ, a high density of N fertilizer application results in a relatively higher soil storage rate (average of 34%) than in YX (average of 16%). It is worth noting that the component of the N losses to water has increased over the years. From the perspective of the agriculture-food-environment system (Fig. 5c, f), especially in the water environment, WJ had higher N losses to water flux from 112 to 257 kg N ha−1 from 2000 to 2023 than YX (69 to 114 kg N ha−1). Since 2000, due to urbanization and the low economic returns of traditional agriculture, cultivated land area has decreased, especially in WJ (from 78,453 to 12,327 ha). Lower cultivated land area, along with excessive application of N fertilizers, is one of the issues that urgently need to be solved[15]. Under the policy guidance of the local government, the livestock-poultry industry in the region has been adjusted. Over 4,000 livestock and poultry farms (mainly pig farms) have been significantly reduced, leading to a remarkable decrease in the water contribution rate of the livestock-breeding subsystem (LBS).
Implication for collaborative watershed management
-
Maintaining a balance between agricultural income and environmental benefits has become a problem of coexistence across multiple disciplines, due to smallholder farms and fragmented croplands[39,40]. Especially in the complex plain-river network of the Taihu Lake Basin, traditional grain crop cultivation was no longer favored by local farmers and had been replaced by more economically efficient commodity agriculture, which also imposes a greater environmental burden[16,21]. Agricultural non-point sources have been a challenge in the restoration of Taihu Lake for decades[24,41]. Regional key nutrient-loss processes were identified based on isotopic analysis. (1) Livestock and poultry breeding: It was estimated as one of the primary TN emission sources, accounting for 20%–40% of total N emissions from agricultural non-point source pollution[42]. For the management of controlling N, more than 5,000 small/large-sized livestock farms have been removed from the catchment, and more than 9,000 livestock operations are still in operation[41]. In LRN, free-range poultry farming was widespread. The traditional small-scale peasant economy instructed the smallholders to raise around a dozen poultry to produce manure for use on farmland. (2) Aquaculture ponds breeding: To meet the protein and economic income needs, freshwater aquaculture has been famous since 1992, with two-thirds of the total aquaculture ponds in the upstream area of Taihu Lake after 2004[21]. The average yield of pond aquaculture output in WJ was above the national average after 2011, increasing from 2.5 t ha−1 in 2000 to 14.3 t ha−1 in 2021 (Supplementary Fig. S3a). (3) N loss in cropland: The overuse of N fertilizer leads to low N use efficiency in cropland in China, which is the primary source of N loss[43]. Although the nation's N use efficiency in cropland increased to 42%, it is still much lower than that in Europe and America[44]. Especially for the commercial crop (Supplementary Fig. S3b), excessive N fertilizer was applied in the orchard to pursue high output. In the peach orchard, only 28.8% of the applied N fertilizer was absorbed by the tree, 29.6% was retained in the soil, and the rest was lost in multiple ways[36]. Thus, corresponding regional management measures need to be improved based on isotopic tracing and key regional N-loss processes.
Based on isotope values and source apportionment, it can be inferred that N derived from anthropogenic activities not only interacts within surface water but can also enter groundwater through physical or biogeochemical processes[45]. During the regular flow season, NO3− in groundwater exhibited a pronounced isotopic signature of denitrification, with δ15N-NO3− and δ18O-NO3− values more enriched in heavy isotopes (Fig. 3). Meanwhile, groundwater (baseflow) provided the primary recharge to surface water. It was suggested that both surface water and groundwater are critical pathways of N inputs to the lake. Therefore, reducing external N loads to the eutrophic lake also represents a critical concern for groundwater N pollution.
Upstream inflows deliver a significant exogenous nutrient load into the lake. Curbing nutrient loss to water is vital for regulating stoichiometry (N/P), and for aquatic restoration[27,46,47]. Hence, management at the macro and micro levels ought to be carried out simultaneously. The fragmented croplands should be integrated with urbanization. Intensive agriculture should replace the original smallholder farming[48], which can increase production, reduce economic inputs, and reduce nutrient loss[39]. Meanwhile, the sewage collection rate for kitchen waste, toilets, and showers in some rural areas is below 80%, and untreated sewage is directly discharged into the river. Meanwhile, small-catchment scale management is also necessary. According to the isotope-tracing and N-cascade model results, pond aquaculture, manure, free-range poultry, and fertilizer application are the critical NO3− sources in upstream Taihu Lake. Yang et al.[49] proposed that the 4R strategy can guide regional management (i.e., source reduction, process retention, nutrient reuse, and water restoration). The standard for tailwater from pond aquaculture and fields may be the key solution for regulating agricultural activities, reducing pollutants at the source. During the nutrient transport process, buffer strips, i.e., wetlands, can remove pollutants at a rate of 67 kg N ha−1 yr−1[50]. Upstream of Taihu Lake is a plain-river network controlled by dams[51]. The flow rate and direction of water can be easily controlled by water conservancy facilities. Even though TN concentrations in inflow tributaries have been decreasing since 2007, the exogenous N load to Taihu Lake remained at the same level in 2007[8,52]. It is critical to clarify the mechanisms of N transport from farmland to surface water bodies. Modeling the N process (e.g., precipitation, irrigation, nitrification, and denitrification) is vital to provide a scientific basis for meticulous regulation.
-
This study revealed the spatial and temporal dynamics of NO3− sources, transformations, and fluxes in the rural-urban ecotone by integrating hydrochemical indicators, dual NO3− isotopes, and a county-scale N cascade model. NO3− was identified as the dominant form of reactive N in both surface water and groundwater. The concentration in the dry season was higher than in the wet season, and TGRN exhibited higher levels than LRN spatially. Hydrochemical and isotopic evidence demonstrated that nitrification was the prevailing process in LRN during the dry season, while denitrification signals were more evident in groundwater.
Bayesian source apportionment indicated that M was the major NO3− source in LRN, whereas AE dominated in TGRN, with seasonal variations driven by agricultural practices and hydrological conditions. M was also the primary source of groundwater NO3−. The N cascade model further showed that manure return to croplands and expanding aquaculture production substantially increased N losses to aquatic systems, particularly in WJ, where N discharge to the environment was significantly higher than in YX. Pond aquaculture and free-range poultry breeding remain key challenges for N management in the region.
Hence, macro-level policy (i.e., integrated land-use and scale-agricultural operations) and micro-production guidance (i.e., 4R strategy, pollutant-removal buffer zones, and hydrologic flow control) need to be implemented simultaneously to control specific sources accurately. These results highlight that both surface water and groundwater serve as critical pathways of N delivery into Taihu Lake.
-
It accompanies this paper at: https://doi.org/10.48130/nc-0025-0011.
-
Not applicable.
-
The authors confirm their contributions to the paper as follows: Zihan Zhao: writing−original draft, investigation, data curation, visualization; Jiayu Zhao: investigation, visualization; Sidi Chen: investigation; Letian Ning: visualization; Zucong Cai: methodology; Yanhua Wang: writing − review and editing, methodology, funding acquisition, conceptualization. All authors reviewed the results and approved the final version of the manuscript.
-
The datasets generated during and/or analyzed during the current study are available from the corresponding author on reasonable request.
-
This work was supported by the National Key Research and Development Program of China (Grant No. 2021YFC3201500), the Open Research Fund of Key Laboratory of Drinking Water Source Protection of the Ministry of Ecology and Environment, Chinese Research Academy of Environmental Sciences (Grant No. 2024YYSYKFYB01), the Fundamental Research Funds for the Central Public-interest Scientific Institution (Grant No. 2024YSKY-02), and the Postgraduate Research & Practice Innovation Program of Jiangsu Province (Grant No. KYCX24_1830).
-
The authors declare that they have no known competing financial interests or personal relationships that could have appeared to influence the work reported in this paper.
-
Full list of author information is available at the end of the article.
- The supplementary files can be downloaded from here.
- Copyright: © 2025 by the author(s). Published by Maximum Academic Press, Fayetteville, GA. This article is an open access article distributed under Creative Commons Attribution License (CC BY 4.0), visit https://creativecommons.org/licenses/by/4.0/.
-
About this article
Cite this article
Zhao Z, Zhao J, Chen S, Ning L, Cai Z, et al. 2025. Tracing the nitrate source and process in rural-urban ecotone: integrated multi-tracer approach. Nitrogen Cycling 1: e011 doi: 10.48130/nc-0025-0011 

Tracing the nitrate source and process in rural-urban ecotone: integrated multi-tracer approach
- Received: 10 October 2025
- Revised: 30 November 2025
- Accepted: 04 December 2025
- Published online: 30 December 2025
Abstract: Nitrate (NO3−) has emerged as the dominant nitrogen (N) form in the intensively cultivated plain-river network area, modifying the isotopic fingerprints of NO3− in surface water and groundwater. Here, a multi-tracer approach, i.e., hydrochemical indicators, dual stable isotopes, a Bayesian model, and an N cascade model, was applied to construct N isotopic end-members and reveal N sources, transport, and destinations in the rural-urban ecotone of the central Yangtze River Delta. Results showed widespread NO3− contamination, with nitrification dominating in agricultural zones (LRN) during the dry season. Denitrification signals were observed in groundwater. Agricultural activities substantially influenced water quality. Manure was the major contributor of NO3− in both surface water (69%) and groundwater (60%) in LRN across all seasons, whereas aquaculture effluent dominated NO3− sources in hybridized areas (TGRN) during the wet and dry seasons. The county-scale nitrogen cascade model corroborated isotopic tracing, revealing that long-term manure return and rapid expansion of aquaculture and commercial crop cultivation have substantially intensified N losses to aquatic systems, increasing from 35.6 to 137.3 kg N ha−1 in TGRN and decreasing from 49.8 to 30.8 kg N ha−1 in LRN. The combined multi-tracer approach demonstrates that both surface water and groundwater serve as key pathways transporting N to Taihu Lake, underscoring the need for coordinated management strategies targeting manure application, pond aquaculture, and fragmented cropland to mitigate watershed-scale N pollution.