


-
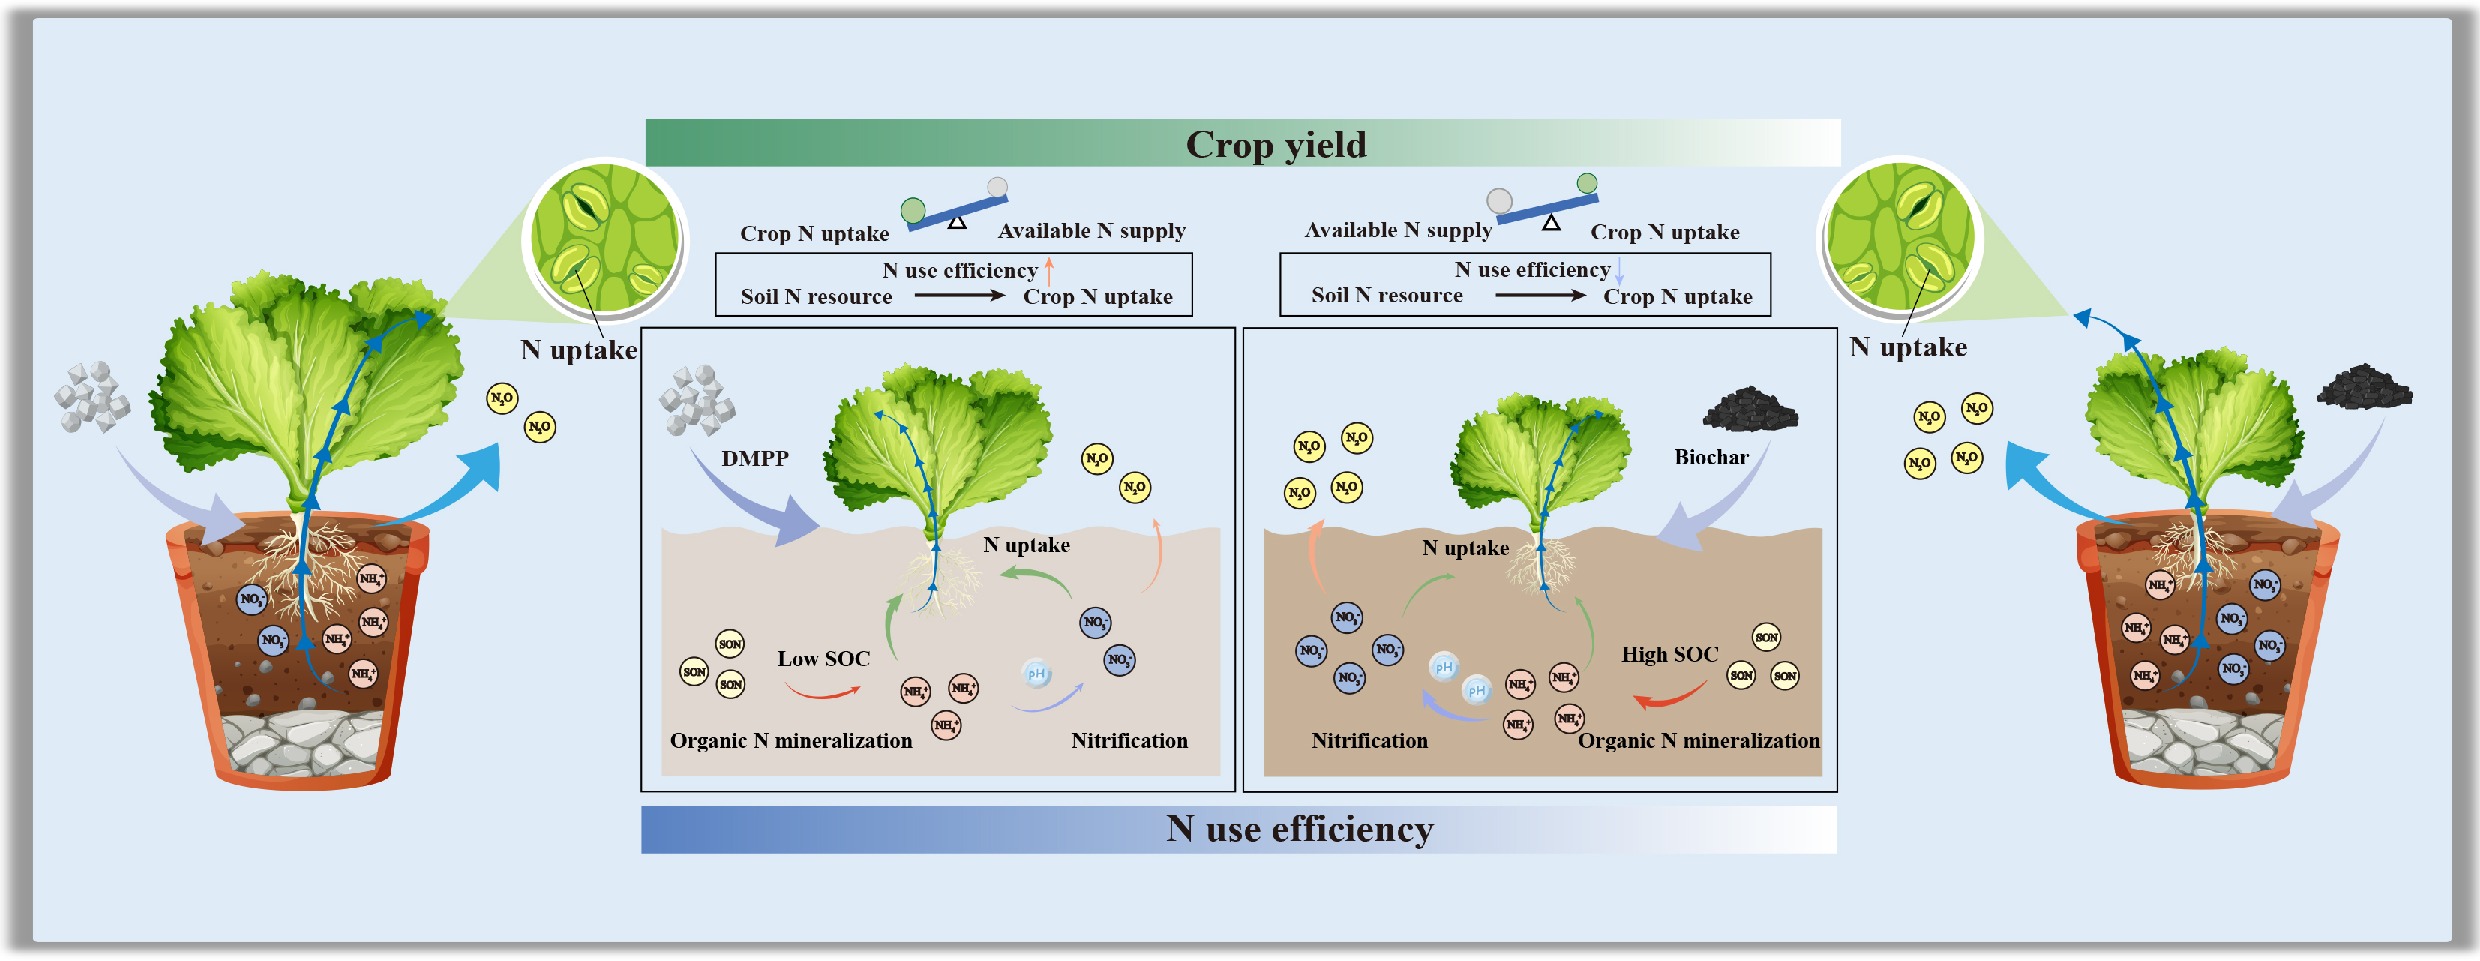
Calcareous soils are among the most widely distributed agricultural soil types worldwide[1,2], predominantly distributed in the arid and semi-arid regions of Asia, the Mediterranean coast, North Africa, and southern Australia[3−5]. These soils are rich in carbonate minerals, which confer inherently high pH and calcium content, and play a vital role in maintaining regional food security, ecosystem stability, and agricultural sustainability[6−9]. However, their distinctive physicochemical properties also pose specific challenges for nitrogen (N) management[10,11]. A high pH environment favors the activity of ammonia-oxidizing bacteria (AOB) and accelerates nitrification, leading to rapid oxidation of ammonium (NH4+) to nitrate (NO3‒)[12,13]. Consequently, inorganic N exhibits a short residence time within the soil system, while NO3‒ accumulates and is prone to leaching losses[10,14]. Under long-term intensive cultivation, farmers often rely on excessive N fertilizer inputs to compensate for N losses and sustain high crop yields[15,16]. Nevertheless, N use efficiency (NUE) in calcareous soils remains generally low[17,18]. Excessive N input not only escapes crop uptake but also leads to NO3‒ loss through leaching and denitrification, resulting in the emission of gaseous N forms such as nitrogen gas (N2) and nitrous oxide (N2O)[19]. These processes collectively contribute to severe agricultural non‒point source pollution and greenhouse gas emissions[11,16,20]. Such a 'high input‒low utilization‒high loss' N cycle pattern diminishes fertilizer benefits, and threatens both the regional ecological security and climate regulation.
To address the pervasive issues of high N losses and low use efficiency in calcareous soils, reducing nitrification rates and delaying the conversion of NH4+ to NO3‒, represent effective strategies for mitigating N loss[11,12]. Meanwhile, enhancing the retention and recycling of inorganic N within the soils is a core approach to improving NUE[10,21]. The former strategy focuses on suppressing ammonia oxidation and the related processes to limit nitrification rates, thereby reducing NO3‒ accumulation and its subsequent leaching losses[22]. The latter relies on promoting microbial immobilization and adsorption processes, extending N residence time within the soil‒plant system to achieve more efficient N retention and recycling[23,24]. A thorough comprehension of these processes is crucial for optimizing soil N cycling and enhancing agricultural NUE. Among current N management strategies, biochar and nitrification inhibitors are among the most promising approaches for simultaneously reducing N losses and improving NUE through distinct mechanisms[25−27]. Biochar, a carbon (C) rich porous material that can improve soil physicochemical properties, such as organic C content, cation exchange capacity, and water-holding capacity (WHC), thereby enhancing crop N uptake[28−30]. Meanwhile, its abundant surface functional groups (e.g., carboxyl, hydroxyl, and phenolic hydroxyl groups) significantly enhance the adsorption and retention of NH4+, delaying its oxidation by nitrifying microbes and thus stabilizing the soil inorganic N pool[24,31]. Furthermore, certain biochars contain volatile or aromatic organic compounds that may exert mild inhibitory effects on AOB, indirectly suppressing nitrification[31,32]. In contrast, the nitrification inhibitor 3,4-dimethylpyrazole phosphate (DMPP) directly inhibits the activity of both AOB and ammonia-oxidizing archaea (AOA) by chelating copper ions at the active site of ammonia monooxygenase (AMO), thus delaying NH4+ oxidation and substantially reducing NO3‒ formation and N2O emissions[33,34]. Importantly, DMPP exhibits high chemical stability under high pH conditions and is particularly effective in calcareous soils, where nitrification is predominantly driven by AOB[11,35,36].
Although both biochar and DMPP have demonstrated positive effects in reducing N losses, their effectiveness is strongly influenced by application rate, method, and soil environmental conditions[37−39]. Studies have indicated that low biochar application rates generally enhance microbial activity, promote organic N mineralization and microbial immobilization, and thereby facilitate N retention and transformation[40,41]. In contrast, high biochar application rates may alter soil oxygen diffusion and microbial community composition, accelerating nitrification and consequently increasing N losses[41,42]. The co-application of biochar and DMPP is considered to provide dual benefits: physical retention and biochemical inhibition[38,39]. However, research on their interactive mechanisms remains limited, with most studies focusing primarily on crop yield and soil N2O emissions[37,38,43]. In contrast, systematic quantification of key processes such as NH4+ immobilization, nitrification rates, and NO3‒ accumulation remains lacking. Overall, current studies on the combined use of biochar and nitrification inhibitors in calcareous soils reveals substantial knowledge gaps concerning application rate-dependent effects, synergistic mechanisms, and the quantitative dynamics of N transformation processes. Elucidating the dynamic characteristics, rate-limiting steps, and underlying biogeochemical drivers of N transformations in calcareous soils will not only advance theoretical frameworks for efficient N retention and utilization but also provide an essential scientific foundation for establishing precision N management strategies and achieving sustainable agricultural production.
Therefore, this study used a typical calcareous soil as the research object, and pak choi (Brassica rapa) as the test crop. Eight experimental treatments were conducted to assess the individual and combined effects of biochar and DMPP at different application rates: control (CK), phosphate and potash fertilizer (PK), N, phosphate, and potash fertilizer (NPK), NPK + DMPP, NPK + low biochar (10 kg ha‒1), NPK + high biochar (30 kg ha‒1), NPK + low biochar + DMPP, and NPK + high biochar + DMPP. A two-season pot experiment was conducted to systematically assess how these amendments influence crop yield, N uptake, and NUE, soil inorganic N turnover processes, the abundance of N-cycling functional genes, and N2O emissions. The present study aimed to address the following questions: (1) How do individual and combined applications of biochar and DMPP affect crop yield, N uptake, and NUE in calcareous soil? (2) How do these treatments regulate soil N availability, gross N transformation processes, and N losses, particularly N2O emissions? The present results will offer a theoretical foundation for optimizing N fertilizer management, enhancing NUE, and mitigating agricultural greenhouse gas emissions in calcareous soils, thereby promoting sustainable crop production.
-
The experimental soil was sampled from Nanxu Village, Lingchuan County, Guilin City, Guangxi Zhuang Autonomous Region, China (25°08'51'' N, 110°50'36'' E). The region has a typical subtropical monsoon climate, with a mean annual temperature of 18.7 °C, and a mean annual precipitation of 1,942 mm, mainly occurring between April and July. It receives approximately 1,615 h of annual sunshine, and has a frost-free period of about 349 d. The sampling site had been under continuous citrus cultivation for five years, with average annual fertilizer inputs of 256 kg N ha‒1, 96.0 kg P2O5 ha‒1, and 209 kg K2O ha‒1. Soil samples were obtained in September 2023 from depths of 0–20 cm and 20‒40 cm. Visible plant residues and gravel were removed, after which the samples were air-dried and passed through a 5 mm sieve before analysis. The experimental soil belongs to calcareous soil and had the following basic physicochemical properties: pH 8.20, soil organic C 19.2 g C kg‒1, total N 2.00 g N kg‒1, available phosphorus (P) 1.38 g kg‒1, available potassium (K) 7.71 g kg‒1, and total calcium 134.6 g kg‒1.
The biochar for this experiment was provided by the School of Environmental and Ecological Engineering, Jiangnan University. It was produced from camphor wood (Cinnamomum camphora) through pyrolysis under anaerobic conditions at 500–550 °C. The biochar had a pH of 7.10, total C 261 g C kg‒1, and total N 2.70 g N kg‒1. The nitrification inhibitor DMPP (98% purity) was supplied by Zhengzhou Shenyu Chemical Co., Ltd. The test crop was pak choi (Brassica rapa), cultivar 'Guixing', provided by Guangzhou Mingxin Agricultural Technology Co., Ltd.
Pot experiment design
-
The pot experiment was conducted in October 2023, in a greenhouse at the International Karst Research Center in Guilin City. Rigid polyvinyl chloride (PVC) pots (30 cm diameter × 60 cm height) served as cultivation containers. Before filling, all pots were thoroughly rinsed with clean water and air-dried to avoid any contamination. The soils were filled into the pots according to the original stratification of the sampled layers. A 10 cm layer of calcareous gravel was placed at the bottom of each pot to facilitate drainage and aeration, followed by air-dried and sieved soil. Each pot was filled with approximately 14.5 kg of soil. To maintain a bulk density consistent with field conditions, the soil was gently compacted every 5 cm during filling to ensure uniformity. This study set up biochar and nitrification inhibitor treatments to evaluate their effects on decreasing N loss and enhancing NUE. The biochar application was primarily aimed at testing whether it could stimulate the retention of inorganic N and reduce N loss, while the nitrification inhibitor was applied to verify its ability to decrease nitrification rates, increase NH4+ retention, and improve NUE. Eight treatments were established (Supplementary Table S1): (1) CK, no fertilizer (control); (2) PK, P, and K fertilizers only; (3) NPK, N, P, and K fertilizers; (4) NPK + DMPP, NPK fertilizers plus DMPP; (5) NPK + BC10, NPK fertilizers plus 10 t ha‒1 biochar; (6) NPK + BC30, NPK fertilizers plus 30 t ha‒1 biochar; (7) NPK + BC10 + DMPP, NPK fertilizers plus 10 t ha‒1 biochar and DMPP; and (8) NPK + BC30 + DMPP, NPK fertilizers plus 30 t ha‒1 biochar and DMPP. Each treatment had three replicates, resulting in 24 pots arranged in a randomized complete block design. Fertilization was based on local conventional practices, with application rates equivalent to 256 kg N ha‒1 (urea), 96.0 kg P2O5 ha‒1 (superphosphate), and 209 kg K2O ha‒1 (potassium sulfate). The DMPP application rate was equivalent to 1.50% of the pure N content from urea. Biochar was added at rates of 10 and 30 t ha‒1. All fertilizers, DMPP, and biochar were thoroughly mixed with the soil prior to sowing and applied once as a basal dressing. After fertilization, the pots were irrigated to approximately 60% WHC and equilibrated for 48 h before sowing. Twenty seeds of pak choi were sown per pot, and after emergence, seedlings were thinned to retain three uniform plants per pot based on growth vigor. During the growth period, soil moisture was maintained uniformly across all pots through manual watering, and no additional fertilizer was applied. The first growing season lasted from October 23, 2023, to January 20, 2024, and the second from February 20, 2024, to May 1, 2024. Identical cultivation and management practices were used for both seasons.
Plant sample collection and nutrient analysis
-
At maturity, pak choi plants were harvested. The aboveground and belowground parts were washed separately with deionized water, and their fresh weights were measured. The plant samples were then placed in cloth bags, inactivated at 105 °C for 30 min, and subsequently oven-dried at 80 °C to a constant weight to determine the dry biomass of both aboveground and belowground components. The dried samples were ground into fine powder using an AM410 planetary ball mill (Beijing Grinder Instrument Co., Ltd, China). Total C and N contents of the aboveground and belowground samples were analyzed with a Sercon Integra 2 isotope ratio mass spectrometer (Sercon Ltd., Crewe, UK).
Crop NUE (%) was determined as follows:
$ \text{N}_{\text{uptake}}=\ \text{Total dry weight × Total N content} $ (1) $ \text{NUE = }\dfrac{\text{N}_{\text{uptake1}}-\text{N}_{\text{uptake0}}}{\text{C}_{\text{Nf}}}\text{ × 100} $ (2) where, Nuptake is the total crop N uptake, mg; Nuptake1 and Nuptake0 are the total crop N uptake in fertilized and unfertilized treatments, mg; and CNf is the amount of N fertilizer added to each treatment, mg pot‒1.
Soil N2O emission collection and determination
-
Soil N2O emissions were determined using the static closed chamber–gas chromatography method beginning on October 31, 2023. The sampling system comprised a sealed opaque chamber (40 cm height × 30 cm diameter), and a PVC base frame. The chamber was equipped with a gas sampling port and a temperature sensor at the top. The base frame featured a square structure with a 5 cm-wide annular water channel along its edges to create a water seal during sampling. Before sampling, the chamber was securely installed above the pot, and the base channel was filled with deionized water to ensure the system was airtight. A small fan inside the chamber was operated during sampling to ensure uniform gas mixing. To minimize the effects of light and temperature fluctuations on gas exchange, all sampling was consistently conducted between 08:00 and 11:00. To ensure homogeneity, the chamber air was pre-flushed 3–5 times prior to sampling. Gas samples were collected from the chamber headspace using a 25 mL gas syringe at 0, 10, 20, and 30 min after chamber closure and immediately transferred into 20 mL pre-evacuated glass vials. Chamber and ambient air temperatures were recorded simultaneously. Sampling was performed on days 1, 2, 3, 5, and 7 after fertilization, and subsequently once per week until pak choi harvest. N2O concentrations were determined using an Agilent 7890A gas chromatograph (Agilent Technologies, USA) fitted with an electron capture detector (ECD). High-purity N2 (> 99.9%) served as the carrier gas. The column, detector, and injector temperatures were set to 55, 350, and 100 °C, respectively.
The N2O emission flux (F, mg kg‒1 h‒1), cumulative N2O emission (M, mg kg‒1), yield-scaled N2O emission (mg kg‒1 yield), and N2O emission factor (EF, %) were calculated as follows:
$ \text{F}=\rho \times \dfrac{\Delta \mathrm{C}}{\text{∆t}}\times\dfrac{\text{273.15}}{{(273.15\;+\;{\rm T})}}\times\dfrac{\text{V}}{\text{A}} $ (3) $ \text{M}={\text{F}}_{\text{1}}\times\text{24}+\sum \nolimits_{\text{i=2}}^{\text{n}}\dfrac{{\text{F}}_{\text{i}}+{\text{F}}_{\text{i}-1}}{\text{2}}\left({\text{t}}_{\text{i}}-{\text{t}}_{\text{i}-1}\right)\times{24} $ (4) $ \text{Yield-scaled}\;{\text{N}}_{\text{2}}\text{O emission}=\dfrac{\text{M}}{\text{Yield}} $ (5) $ \text{EF}=\dfrac{{\text{M}}_{\text{n}}-{\text{M}}_{\text{c}}}{{\text{F}}_{\text{N}}}\times 100{\text{%}} $ (6) where, ρ is the N2O density under standard conditions, kg m‒3; ΔC/Δt is the rate of change in N2O concentration during the sampling period; T is the chamber temperature, °C; V is the adequate chamber volume, m3; A is the chamber base area, m2; ti – ti–1 are consecutive sampling times, d; n is the total number of samplings; Yield is the dry weight of pak choi per season; Mn and Mc are the cumulative N2O emissions from fertilized and unfertilized soil, kg ha‒1; and FN is the amount of N fertilizer added to each treatment, kg N ha‒1.
Soil sample collection and physicochemical properties determination
-
After pak choi harvest, soil samples were immediately obtained from each pot. Five soil cores (5 cm in diameter) were sampled from the 0–10 cm surface layer of each pot using a five-point sampling method. After removing visible plant residues, roots, and other debris, the soil cores from each pot were thoroughly homogenized to obtain a composite sample. The composite soil was sieved through a 2 mm mesh and divided into three subsamples: one portion was refrigerated at 4 °C for determining gross N transformation rates; the second portion was frozen at –80 °C for quantifying N-cycling functional gene abundances; and the remaining portion was air-dried for basic physicochemical properties determination.
Soil pH was analyzed in a 1:2.5 (w/v) soil-water suspension with a SevenExcellence pH/mV meter. Soil WHC was measured by saturating soil samples with deionized water for 2 h, followed by natural filtration for 7 h[44]. Soil organic C and total N contents were measured using a Sercon Integra 2 isotope ratio mass spectrometer (Sercon Ltd., Crewe, UK) after pretreatment with 1 mol L‒1 hydrohloric acid (HCl)[13]. Soil NH4+ and NO3‒ contents were determined with a flow analyzer (Skalar, Breda, The Netherlands). For determining the isotopic abundances of NH4+ and NO3‒, the extraction solutions were pretreated using the magnesium oxide (MgO)-Devarda alloy distillation method[45]. In brief, MgO was first added to the extract to distill NH4+, followed by the addition of Devarda's alloy to reduce NO3‒ to NH4+ for subsequent distillation. The distillates were collected in a boric acid solution containing mixed indicators (methyl red and bromocresol green) and titrated with 0.02 mol L‒1 sulfuric acid. The resulting solution was oven-dried at 80 °C and analyzed for 15N isotopic abundance using the Sercon Integra 2 mass spectrometer.
Soil 15N tracing experiment
-
A series of fresh soil samples (30 g dry weight equivalent) was placed into 250 mL Erlenmeyer flasks and pre-incubated at 25 °C for 24 h. After pre-incubation, the soils were divided into two groups. Each flask received 1 mL of either 15NH4NO3 (5.22 atm% 15N excess) or NH415NO3 (5.14 atm% 15N excess) solution, uniformly applied to the soil surface, providing 50 mg N kg‒1 NH4+ and 50 mg N kg‒1 NO3‒, respectively. Soil moisture was adjusted to 60% WHC, and the flasks were sealed with perforated parafilm to allow gas exchange. The samples were then incubated continuously at 25 °C. At 0.5 and 24 h after the addition of the 15N tracer, inorganic N was extracted with 150 mL of 2 mol L‒1 potassium chloride (KCl) solution. The contents of NH4+ and NO3‒, as well as their respective 15N enrichments, were determined in the extracts.
Gross rates of N transformation, including gross N mineralization (GNM), gross nitrification (GN), gross NH4+ immobilization (GAI), and gross NO3‒ immobilization (GNI) (mg N kg‒1 d‒1), were evaluated as follows[46]:
$ \text{m}=\dfrac{{\text{M}}_{\text{0}}-{\text{M}}_{\text{1}}}{{\text{t}}_{\text{1}}-{\text{t}}_{\text{0}}}\times \dfrac{\ln \left(\dfrac{{\text{H}}_{\text{0}}{\text{M}}_{\text{1}}}{{\text{H}}_{\text{1}}{\text{M}}_{\text{0}}}\right)}{\ln \left(\dfrac{{\text{M}}_{\text{0}}}{{\text{M}}_{\text{1}}}\right)} ,\; {\rm c}\neq {\rm m} $ (7) $ \text{c}=\dfrac{{\text{M}}_{\text{0}}-{\text{M}}_{\text{1}}}{{\text{t}}_{\text{1}}-{\text{t}}_{\text{0}}}\times\dfrac{\ln \left(\dfrac{{\text{H}}_{\text{0}}}{{\text{H}}_{\text{1}}}\right)}{\ln \left(\dfrac{{\text{M}}_{\text{0}}}{{\text{M}}_{\text{1}}}\right)} ,\; {\rm c}\neq {\rm m} $ (8) where, M0 and M1 are the contents of N at times t0 and t1 (NH4+ for 15NH4+-labeled soils and NO3‒ for 15NO3‒-labeled soils), and H0 and H1 are the corresponding15N atom values. Here, m represents the GNM for 15NH4+-labeled soil or the GN for 15NO3‒-labeled soil, while c represents the NH4+ consumption rate in 15NH4+-labeled soil or the GNI in 15NO3‒-labeled soil. The GAI was calculated as the difference between the NH4+ consumption rate and GN, and gross microbial immobilization rate was obtained by summing GAI and GNI.
The mean residence time (MRT) represents the turnover rate of the inorganic N pool, with greater values suggesting slower turnover[47]. MRTs of NH4+ (MRT NH4+) and NO3‒ (MRT NO3–) were determined as follows:
$ {\text{MRT}}\;{\text{NH}}_{\text{4}}^{+}=\dfrac{\text{C(NH}_{\text{4}}^{\text+}\text{)}}{\text{GNM}} $ (9) $ {\text{MRT}}\;{\text{NO}}_{\text{3}}^{-}=\dfrac{\text{C(NO}_{\text{3}}^{-}\text{)}}{\text{GN}} $ (10) where, C(NH4+) and C(NO3‒) are the initial soil contents of NH4+ and NO3‒, mg N kg‒1.
Soil DNA extraction, quantitative PCR, and high-throughput sequencing
-
Total DNA was obtained from each soil sample using the FastDNA® Spin Kit for Soil (MP Biomedicals, Cleveland, OH, USA) according to the manufacturer's instructions. DNA purity and concentration were analyzed with a NanoDrop 2000c spectrophotometer (Thermo Fisher Scientific, USA), after which the extracts were stored at ‒20 °C for further analysis. The abundances of AOB and AOA amoA genes were quantified by quantitative real-time PCR (qPCR). The primer pairs used were amoA-F (5'-GGGGTTTCTACTGGTGGT-3')/amoA-R (5'-CCCCTCKGSAAAGCCTTCTTC-3') for AOB, and Arch-amoA-F (5'-STAATGGTCTGGCTTAGACG-3')/Arch-amoA-R (5'-GCGGCCATCCATCTGTATGT-3') for AOA. Each 30 μL qPCR reaction included 15 μL SYBR Green qPCR Master Mix (Takara, Japan), 2 μL Mg2+ solution, 0.5 μL of each primer (10 μmol L‒1), 2 μL of template DNA, 0.5 μL fluorescent dye, and ddH2O to a final volume. Thermal cycling conditions were as follows: For AOB amoA, 95 °C for 3 min (initial denaturation), followed by 40 cycles of 94 °C for 15 s, 60 °C for 30 s, and 72 °C for 30 s. For AOA amoA, 95 °C for 3 min (initial denaturation), followed by 40 cycles of 94 °C for 15 s, 60 °C for 20 s, and 72 °C for 20 s. All reactions were performed in triplicate, and melting curve analysis confirmed amplification specificity. The amplification efficiency ranged from 90% to 110%, with R2 > 0.99 for all standard curves. PCR amplification was carried out on an ABI GeneAmp® 9700 thermal cycler (Applied Biosystems, USA). Amplicon specificity and expected fragment size were verified by 2% agarose gel electrophoresis, and the target bands were purified with a DNA Gel Extraction Kit (Omega Bio-Tek, USA). Purified amplicons were determined with a Qubit 4.0 fluorometer (Thermo Fisher Scientific, USA) and pooled in equimolar amounts. Sequencing libraries were constructed via end repair, A-tailing, adapter ligation, and PCR enrichment. High-throughput sequencing was then performed on an Illumina HiSeq 2500 platform (Illumina, USA).
Data analysis
-
Before statistical analyses, the Shapiro‒Wilk test was carried out to examine data normality. When normality assumptions were not met, data were transformed using a standard score transformation method to eliminate heteroscedasticity. Following transformation, one-way analysis of variance (ANOVA), followed by the least significant difference (LSD) test (p < 0.05) was performed to compare differences in plant traits, soil physicochemical and microbial properties, inorganic N turnover rates, and N2O emissions among fertilization treatments within each growing season. Differences in these variables between the two growing seasons were analyzed using independent-samples t-tests (p < 0.05). A two-way ANOVA was applied to evaluate the impacts of fertilization, growing season, and their interaction on all measured parameters (Supplementary Table S2). A Pearson correlation analysis was performed to examine relationships among plant traits, soil physicochemical and microbial properties, inorganic N turnover rates, and N2O emissions. All statistical analyses were carried out using Origin 2021 Pro (OriginLab Corporation, Northampton, MA, USA) and Adobe Illustrator. Data are expressed as means ± standard deviation (n = 3).
-
Crop yield, nutrient content, N uptake, and NUE were greatly altered by fertilization treatments, growing seasons, and their interactions (Fig. 1; Supplementary Fig. S1). The NPK + DMPP and NPK + BC10 treatments significantly increased total crop yield in both seasons, with NPK + DMPP showing a more pronounced effect. Across both seasons, NPK + DMPP consistently produced higher total crop yield than NPK + BC10 and NPK + BC10 + DMPP. Total crop yield under NPK + BC10 was significantly higher than under NPK + BC30 in the second season. Crop N content under NPK + DMPP was significantly higher than under NPK + BC10, NPK + BC30, and NPK + BC30 + DMPP in the first season. Meanwhile, NPK + BC10 resulted in significantly lower crop N content than NPK + BC30 in the first season. Across both seasons, NPK + DMPP significantly enhanced crop N uptake, which remained significantly higher than that under NPK + BC10. Crop N uptake under NPK + BC10 was significantly lower than under NPK + BC30 in the first season. Across both seasons, NUE was highest under NPK + DMPP and lowest under NPK + BC30. NUE under NPK + DMPP consistently exceeded that under NPK + BC30 in both seasons, and NUE under NPK + BC10 also remained higher than under NPK + BC30.
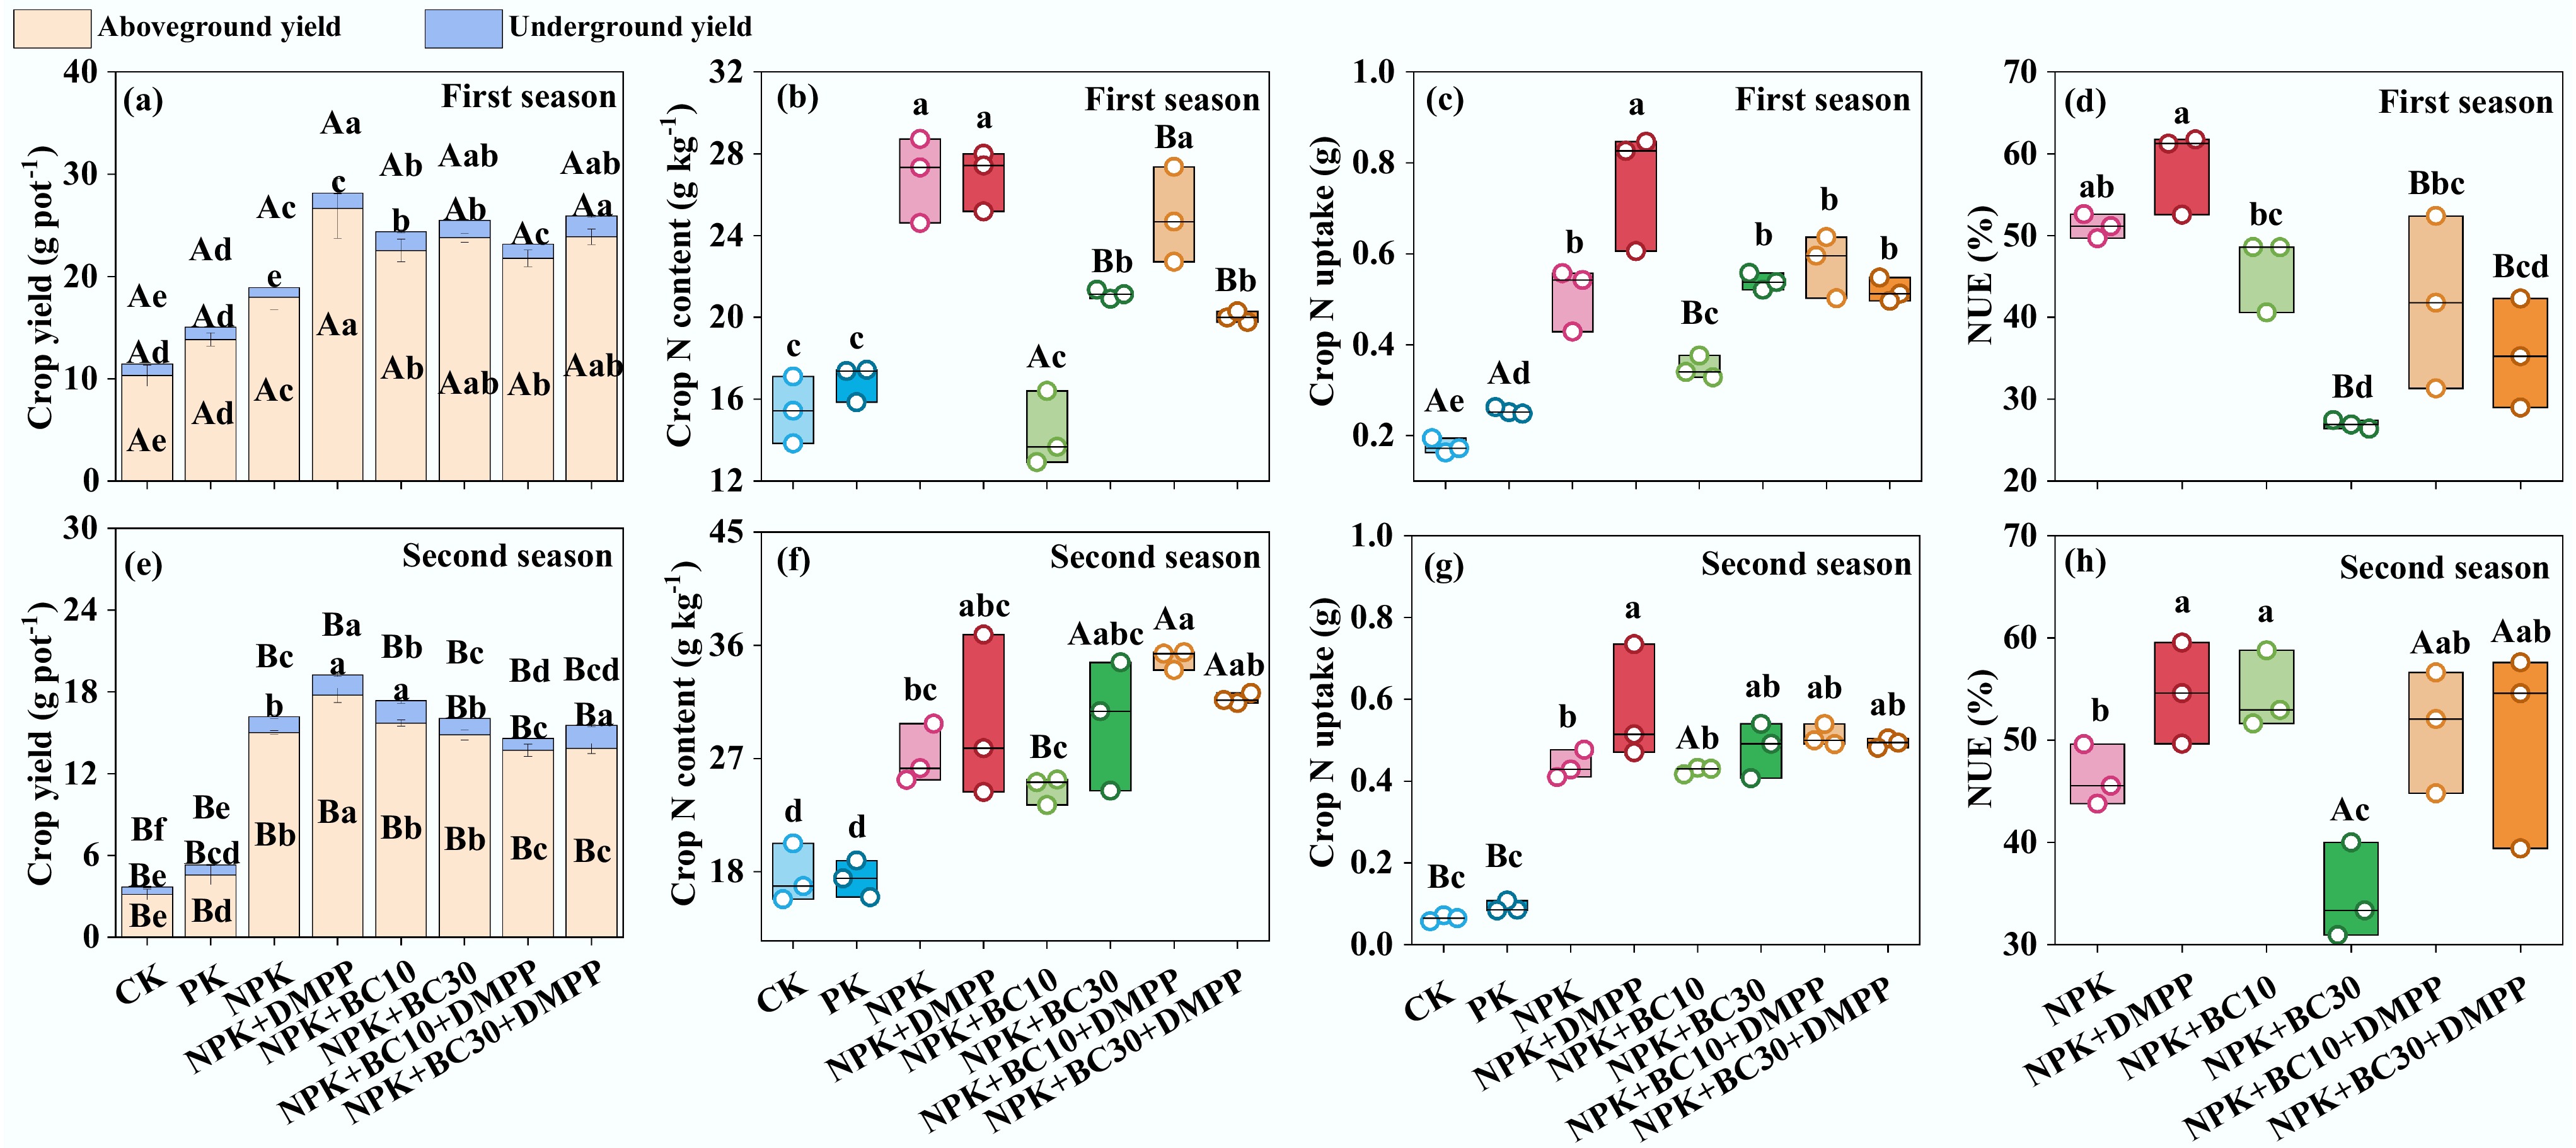
Figure 1.
Changes in (a), (e) crop yield, (b), (f) crop N content, (c), (g) crop N uptake, (d), (h) NUE after fertilizer application during the first and second seasons. Different lowercase and uppercase letters indicate significant differences between fertilization treatments and growing seasons, respectively. The absence of letters indicates no significant differences. The values represent the average ± standard deviation (n = 3).
Soil physicochemical properties
-
Fertilization treatments, growing seasons, and their interactions significantly affected soil physicochemical properties (Table 1). NPK + DMPP, NPK + BC10, NPK + BC10 + DMPP, and NPK + BC30 + DMPP significantly decreased soil pH across both seasons. In contrast, NPK + BC30 and NPK + BC30 + DMPP significantly enhanced soil organic C content and the C/N ratio in both seasons, and also significantly elevated soil NO3‒ and inorganic N contents during the second season. Soils under NPK + DMPP exhibited significantly lower pH, soil organic C content, and C/N ratio than those under NPK + BC10, NPK + BC30, NPK + BC10 + DMPP, and NPK + BC30 + DMPP in both seasons, with the differences more pronounced under NPK + BC30. Furthermore, soil pH was consistently lower under NPK + BC10 than under NPK + BC30 across both seasons.
Table 1. Changes in soil physicochemical properties after fertilizer application during the first and second seasons
Paramentera Season CK PK NPK NPK + DMPP NPK + BC10 NPK + BC30 NPK + BC10 + DMPP NPK + BC30 + DMPP WHC (%) First 63.9 ± 0.21a 57.2 ± 5.84b 62.6 ± 4.27Ba 60.3 ± 3.02Bab 60.7 ± 3.97ab 61.7 ± 1.01ab 63.0 ± 1.87a 58.3 ± 1.70ab Second 64.4 ± 0.30 65.1 ± 1.65 65.7 ± 0.27A 64.1 ± 0.12A 65.5 ± 2.58 59.1 ± 7.02 58.7 ± 9.13 55.9 ± 9.76 pH First 8.25 ± 0.14b 8.35 ± 0.05Ab 8.44 ± 0.03Aa 7.95 ± 0.04d 8.04 ± 0.02Ac 8.33 ± 0.09Ab 8.05 ± 0.01Ac 8.25 ± 0.09b Second 8.13 ± 0.03ab 8.15 ± 0.03Bab 8.17 ± 0.04Ba 7.90 ± 0.05d 7.99 ± 0.02Bcd 8.14 ± 0.04Bab 8.01 ± 0.01Bc 8.09 ± 0.02bc Soil organic C (g C kg‒1) First 51.9 ± 2.37d 51.1 ± 0.77d 53.5 ± 0.40c 50.2 ± 3.26d 57.5 ± 0.36b 67.9 ± 0.22Aa 58.7 ± 1.65b 68.2 ± 0.75a Second 52.4 ± 1.22c 50.0 ± 2.58d 51.8 ± 1.89cd 49.3 ± 2.51d 57.9 ± 0.59b 63.8 ± 1.19Ba 56.6 ± 1.60bc 65.2 ± 3.37a Total N
(g N kg‒1)First 2.13 ± 0.02B 2.12 ± 0.04 2.06 ± 0.04 2.10 ± 0.08 2.19 ± 0.08 2.17 ± 0.11 2.10 ± 0.03 2.09 ± 0.01 Second 2.17 ± 0.00Aab 2.16 ± 0.04ab 2.17 ± 0.08ab 2.10 ± 0.03b 2.20 ± 0.02ab 2.25 ± 0.02a 2.13 ± 0.05ab 2.18 ± 0.12ab C/N First 24.4 ± 1.18c 24.1 ± 0.58c 26.0 ± 0.50bc 23.9 ± 2.33c 26.3 ± 1.13bc 31.4 ± 1.56Aa 28.0 ± 1.16b 32.7 ± 0.30Aa Second 24.2 ± 0.59cd 23.1 ± 1.35d 23.9 ± 1.19d 23.4 ± 0.88d 26.3 ± 0.46bc 28.3 ± 0.25Bab 26.6 ± 1.30b 29.9 ± 0.06Ba NH4+
(mg N kg‒1)First 3.87 ± 1.09c 5.07 ± 0.45abc 4.92 ± 0.59abc 5.39 ± 0.22abc 6.82 ± 0.98a 5.87 ± 0.59ab 5.87 ± 1.57abc 4.28 ± 0.67bc Second 4.92 ± 0.37b 4.92 ± 0.14b 4.73 ± 0.48b 6.50 ± 0.64a 5.71 ± 1.00ab 4.82 ± 0.28b 6.01 ± 0.74ab 5.61 ± 0.42ab NO3‒
(mg N kg‒1)First 6.66 ± 1.03B 7.45 ± 1.47B 8.56 ± 2.02B 6.50 ± 0.98B 7.61 ± 2.06B 7.93 ± 0.81B 7.93 ± 0.22B 5.71 ± 1.03B Second 12.4 ± 0.24Ade 11.0 ± 0.85Ae 15.2 ± 1.24Acd 15.0 ± 2.80Acd 15.9 ± 0.97Abcd 20.5 ± 2.91Aa 19.5 ± 2.96Aabc 20.3 ± 1.24Aab Inorganic N (mg N kg‒1) First 10.5 ± 2.09Bab 12.5 ± 1.25Bab 13.5 ± 1.47Bab 11.9 ± 0.78Bab 14.4 ± 3.02Ba 13.8 ± 1.40Ba 13.8 ± 1.35Ba 9.99 ± 1.69Bb Second 17.3 ± 0.14Acd 16.0 ± 0.96Ad 19.9 ± 1.45Abc 21.5 ± 2.19Ab 21.6 ± 0.87Aab 25.3 ± 2.66Aa 25.5 ± 2.34Aa 25.9 ± 1.39Aa NO3‒/NH4+ First 1.80 ± 0.30B 1.49 ± 0.38 1.81 ± 0.58B 1.21 ± 0.22 1.10 ± 0.14B 1.35 ± 0.01B 1.45 ± 0.36B 1.33 ± 0.05B Second 2.54 ± 0.25Abc 2.24 ± 0.12c 3.23 ± 0.33Aabc 2.37 ± 0.71c 2.87 ± 0.56Abc 4.29 ± 0.86Aa 3.36 ± 0.95Aabc 3.63 ± 0.31Aab a WHC, water holding capacity. Different lowercase and uppercase letters indicate significant differences between fertilization treatments and growing seasons, respectively. The absence of letters indicates no significant differences. The values represent the average ± standard deviation (n = 3). Soil N2O emissions, yield-scaled N2O emissions, and N2O emission factors
-
Fertilization treatments, growing seasons, and their interactions significantly affected soil N2O emissions, yield-scaled N2O emissions, and N2O emission factors (Fig. 2; Supplementary Fig. S2). Overall, NPK + DMPP, NPK + BC10, and NPK + BC10 + DMPP significantly decreased soil N2O emissions across both seasons, with the strongest mitigation observed under NPK + DMPP. In contrast, NPK + BC30 and NPK + BC30 + DMPP significantly reduced N2O emissions only in the second season. N2O emissions under NPK + BC10 were significantly reduced relative to NPK + BC30 in the first season, whereas the opposite trend was observed in the second season. Similarly, N2O emissions under NPK + BC10 + DMPP were significantly lower than those under NPK + BC30 + DMPP across both seasons. Both NPK + DMPP and NPK + BC10 + DMPP significantly reduced yield-scaled N2O emissions in both seasons, with NPK + DMPP showing the greatest reduction. Furthermore, both NPK + DMPP and NPK + BC10 significantly decreased N2O emission factors in both seasons.
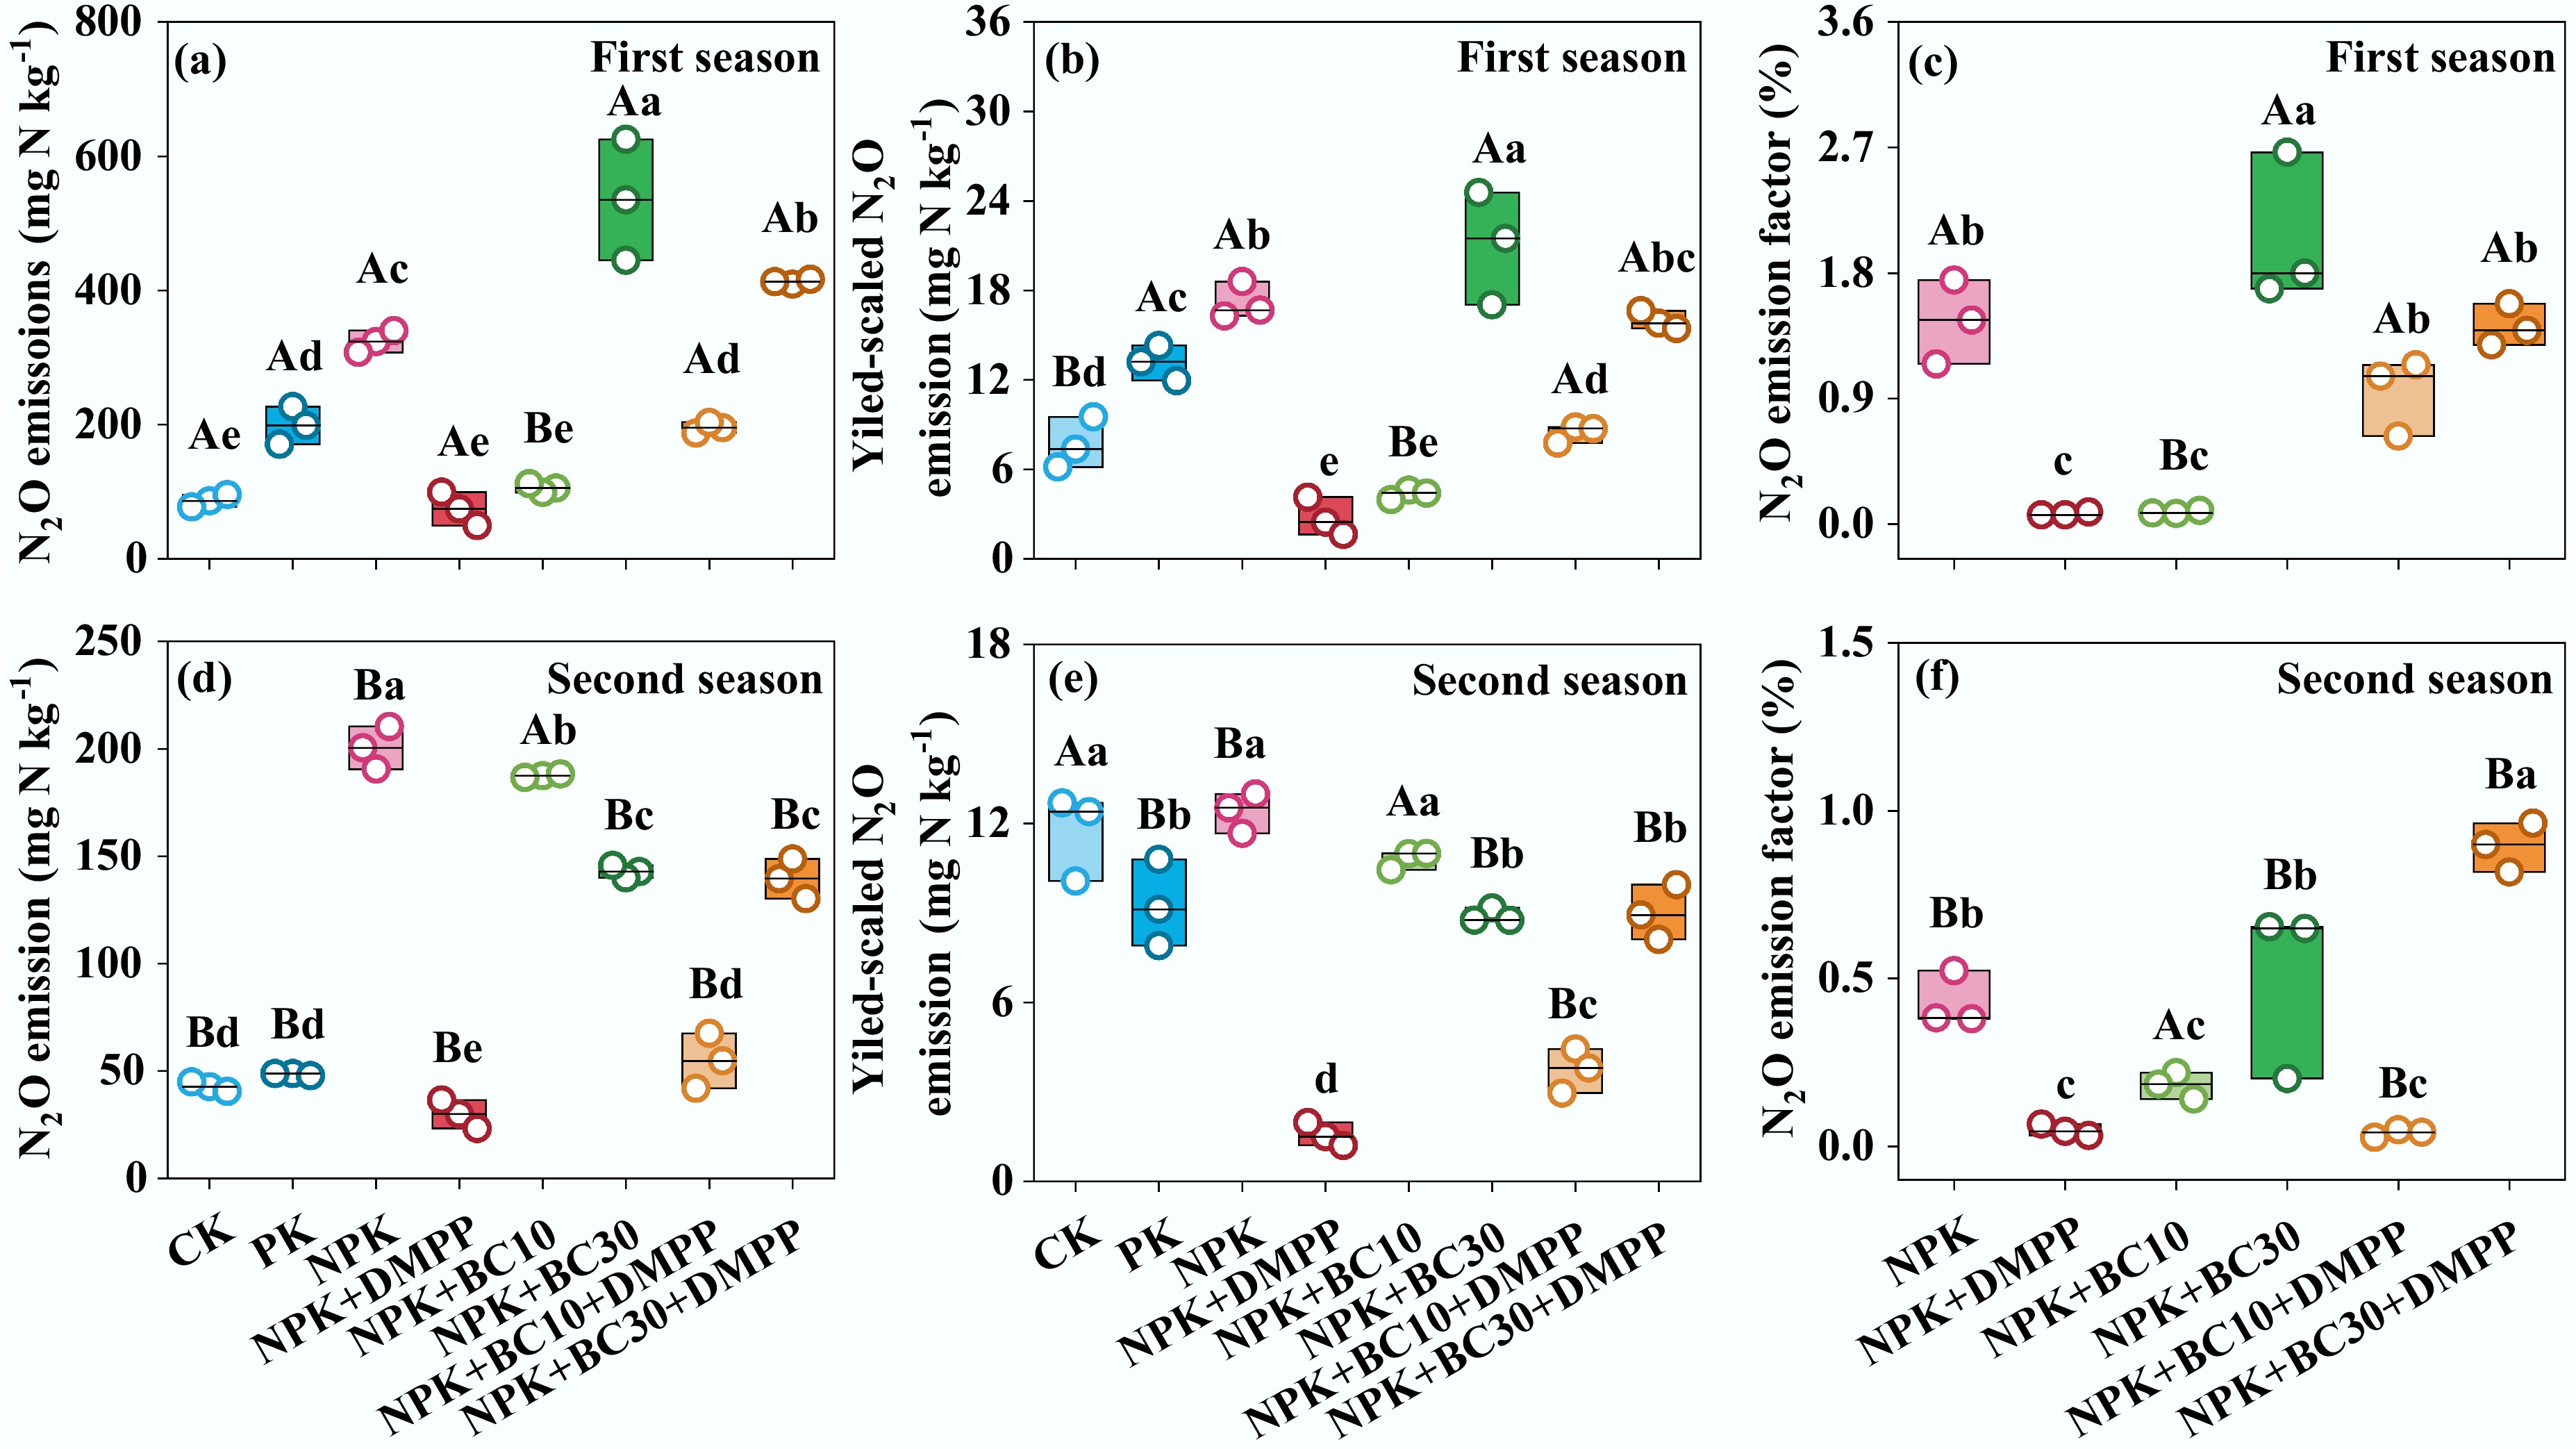
Figure 2.
Changes in (a), (d) cumulative N2O emission, (b), (e) yield-scaled N2O emission, and (c), (f) N2O emission factor after fertilizer application during the first and second seasons. Different lowercase and uppercase letters indicate significant differences between fertilization treatments and growing seasons, respectively. The absence of letters indicates no significant differences. The values represent the average ± standard deviation (n = 3).
Soil inorganic N supply and immobilization rates, N residence time, and N-cycling functional gene abundances
-
Soil inorganic N supply, immobilization rates, and N residence times were strongly influenced by fertilization treatments, growing seasons, and their interactions (Figs 3 & 4). The gross N mineralization rate varied from 2.35 to 8.32 mg N kg‒1 d‒1. NPK + BC10 and NPK + BC30 significantly enhanced gross N mineralization rate in the first season, whereas NPK + DMPP significantly decreased it in the second season. Across both seasons, NPK + BC30 consistently exhibited greater gross N mineralization rates than NPK + DMPP. Gross NH4+ immobilization rates ranged from 5.28 to 15.3 mg N kg‒1 d‒1. NPK + DMPP significantly reduced gross NH4+ immobilization rates in both seasons (5.28 and 7.62 mg N kg‒1 d‒1), with values considerably lower than those observed under all biochar-containing treatments.
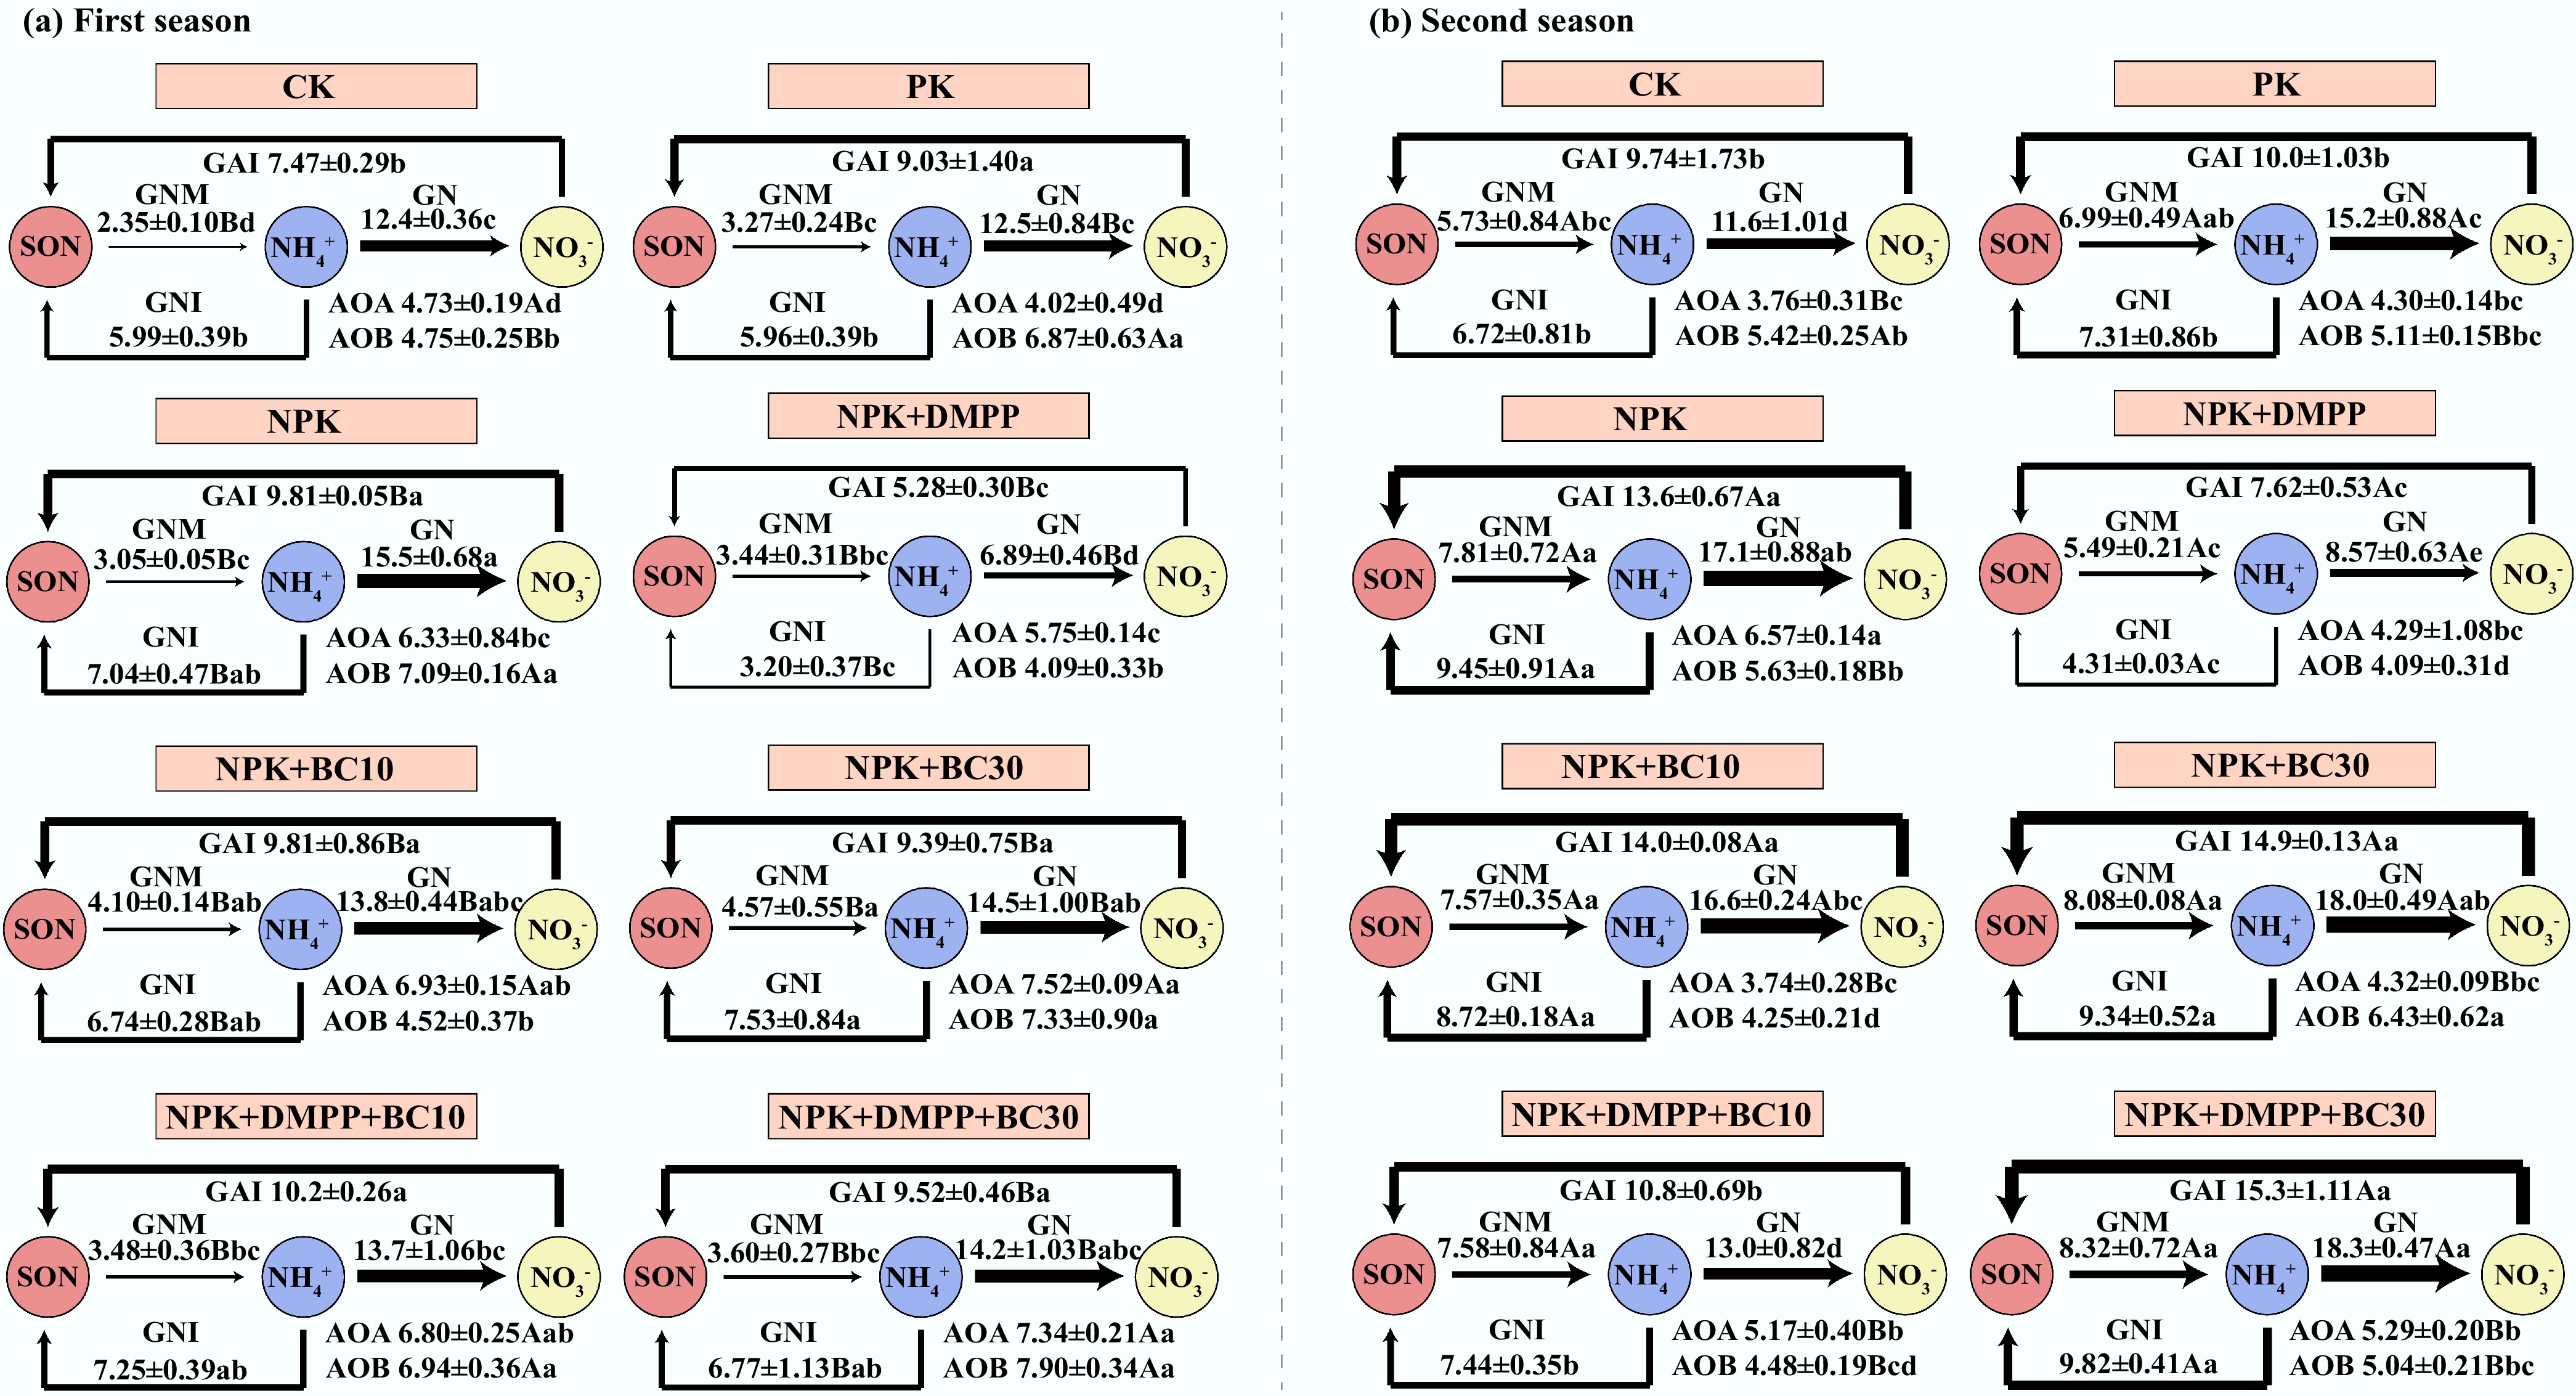
Figure 3.
Changes in soil inorganic N supply, microbial immobilization rates, and N cycling functional gene abundances after fertilizer application during the first and second seasons. All N-cycling functional gene abundances were log-transformed. Different lowercase and uppercase letters indicate significant differences between fertilization treatments and growing seasons, respectively. The absence of letters indicates no significant differences. The values represent the average ± standard deviation (n = 3).
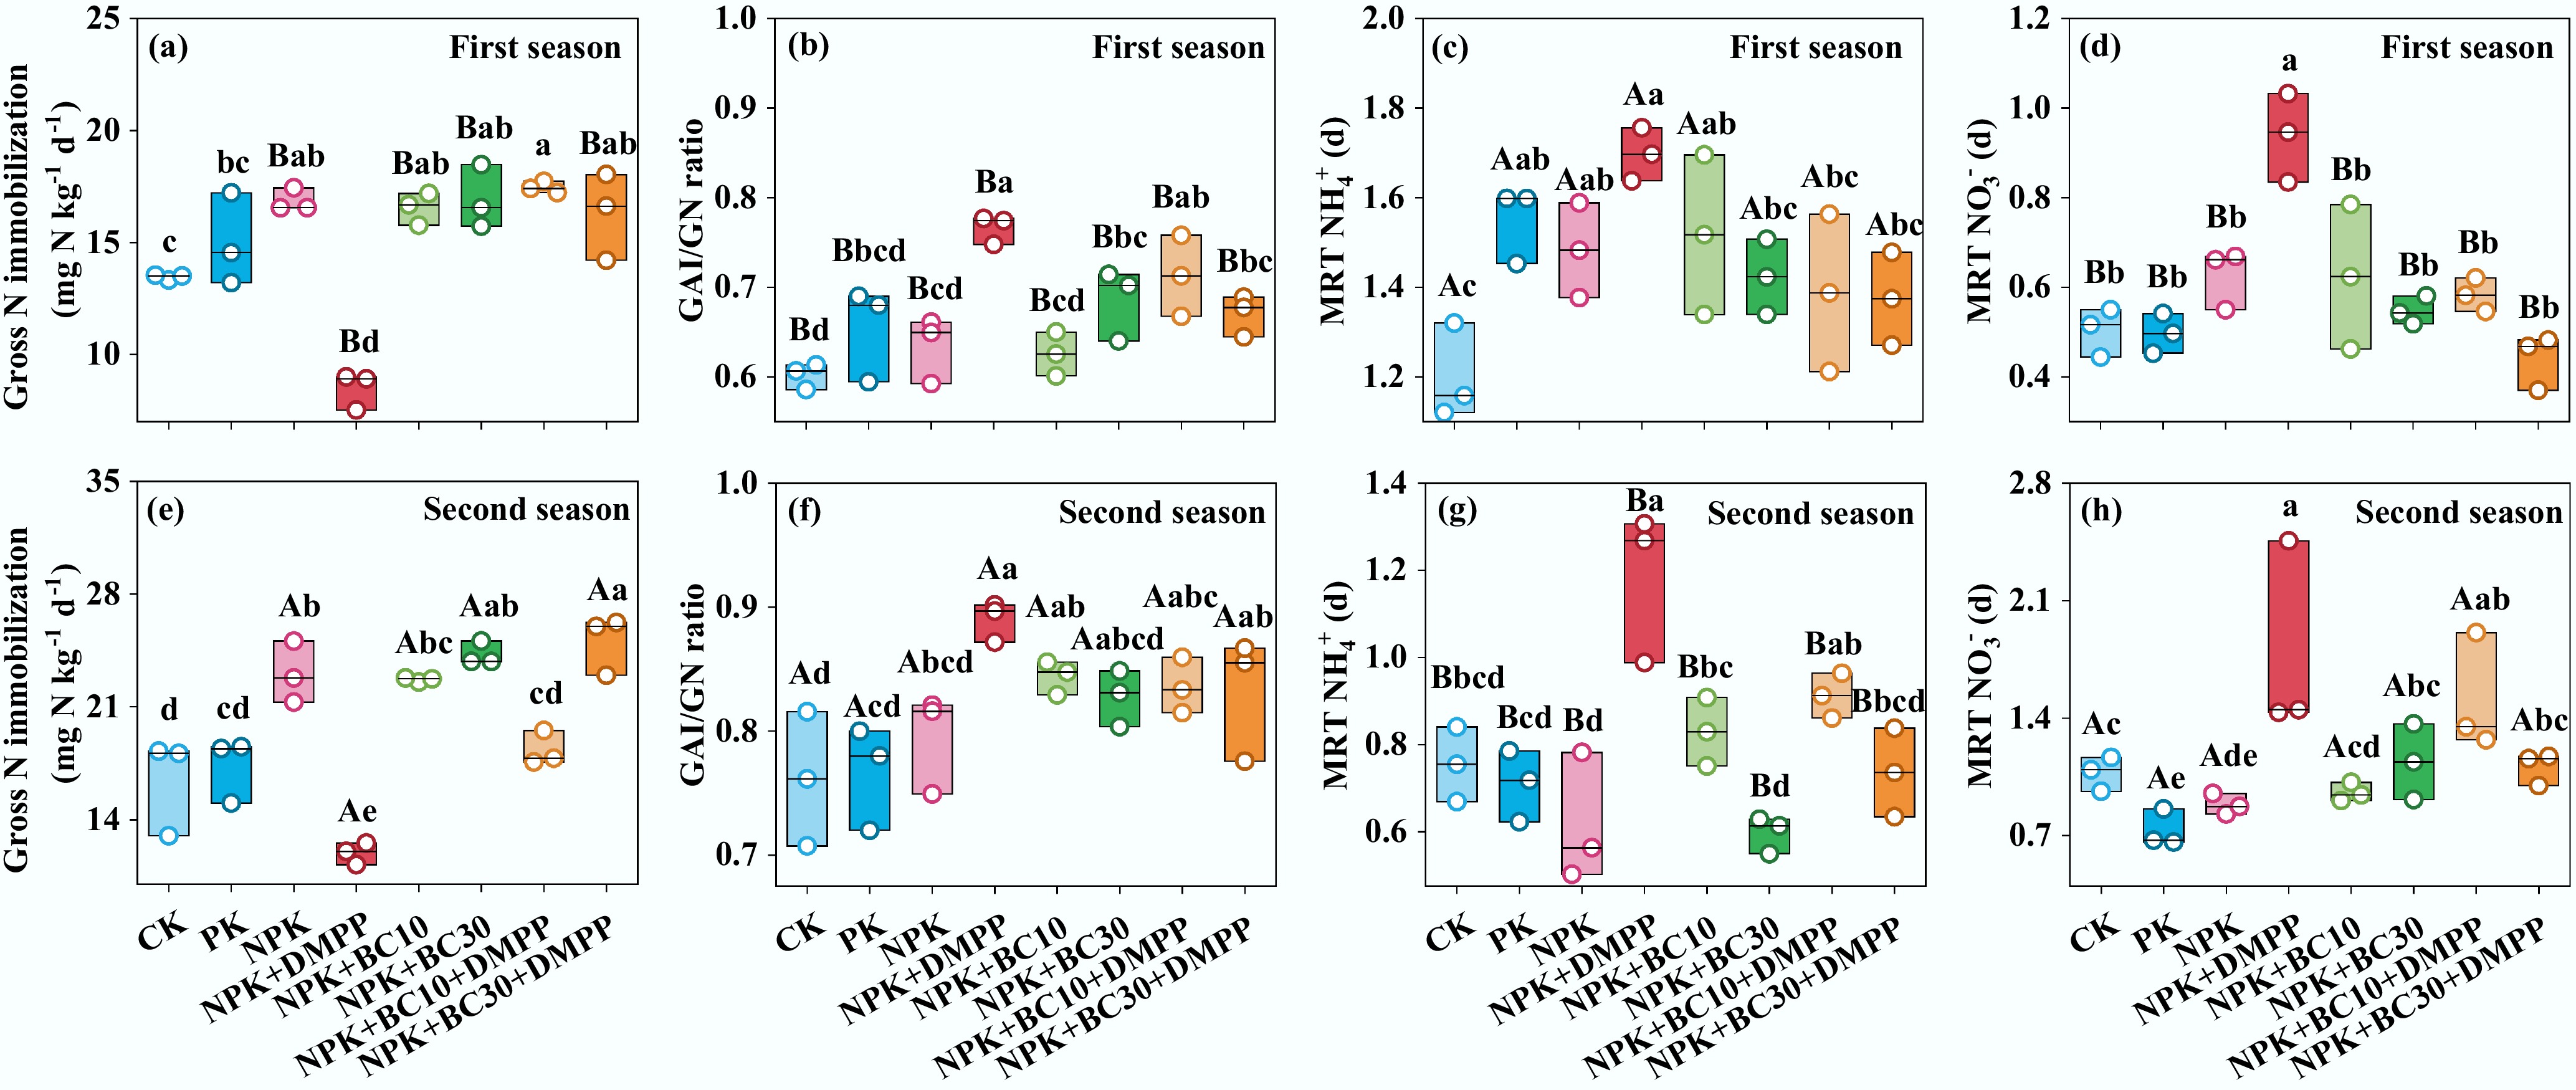
Figure 4.
Changes in (a), (e) gross N immobilization, (b), (f) gross NH4+ immobilization/gross nitrification (GAI/GN) ratio, (c), (g) mean residence time of NH4+ (MRT NH4+), and (d), (h) mean residence time of NO3‒ (MRT NO3‒) after fertilizer application during the first and second seasons. Different lowercase and uppercase letters indicate significant differences between fertilization treatments and growing seasons, respectively. The absence of letters indicates no significant differences. The values represent the average ± standard deviation (n = 3).
Gross nitrification rates varied from 6.89 to 18.3 mg N kg‒1 d‒1. NPK + DMPP (6.89 and 8.57 mg N kg‒1 d‒1) and NPK + BC10 + DMPP (13.7 and 13.0 mg N kg‒1 d‒1) significantly reduced nitrification rates in both seasons, with NPK + DMPP showing the most potent inhibition. The nitrification rate under NPK + DMPP remained consistently lower than under all biochar-related treatments in both seasons. Gross NO3‒ immobilization rates varied from 3.20 to 9.82 mg N kg‒1 d‒1. NPK + DMPP significantly reduced gross NO3‒ immobilization to 3.21 and 4.31 mg N kg‒1 d‒1 in both seasons, with values significantly lower than those under all biochar-containing treatments. The total gross immobilization rate was lowest under NPK + DMPP across both seasons (8.48 and 11.9 mg N kg‒1 d‒1). The ratio of gross NH4+ immobilization to gross nitrification (GAI/GN) remained consistently below 1 for all treatments. NPK + DMPP exhibited the highest GAI/GN ratio in both seasons, significantly exceeding those under NPK + BC10, NPK + BC30, and NPK + BC30 + DMPP in the first season. NPK + DMPP also resulted in the longest NH4+ residence times (1.70 and 1.19 d) and NO3‒ residence times (0.94 and 1.78 d) in both seasons, significantly longer than under NPK + BC30 and NPK + BC30 + DMPP.
Fertilization treatments, growing seasons, and their interactions also significantly affected AOA and AOB abundances. In the first season, AOA abundance under NPK + DMPP was greatly lower than under all biochar-containing treatments. In the second season, AOA abundance under NPK + BC10 was significantly lower than under NPK + BC10 + DMPP and NPK + BC30 + DMPP. AOB abundance under NPK + DMPP was significantly lower than under NPK + BC30 and NPK + BC30 + DMPP in both seasons. Similarly, AOB abundance under NPK + BC10 was significantly lower than under DPK + BC30 and NPK + BC30 + DMPP in both seasons.
Relationships among crop yield, NUE, soil properties, inorganic N turnover rates, functional gene abundances, and N2O emissions
-
Across both seasons, crop yield showed a significant positive correlation with the gross NH4+ immobilization-to-nitrification ratio and the mean NH4+ residence time (Fig. 5). Similarly, NUE also exhibited a strong positive correlation with mean NH4+ residence time across both seasons. Soil N2O emissions were significantly and positively related to soil pH and gross nitrification rates in both seasons. Across both seasons, the gross N mineralization rate was positively associated with soil organic C. In contrast, the gross nitrification rate was positively correlated with soil pH, organic C, and AOB abundance.
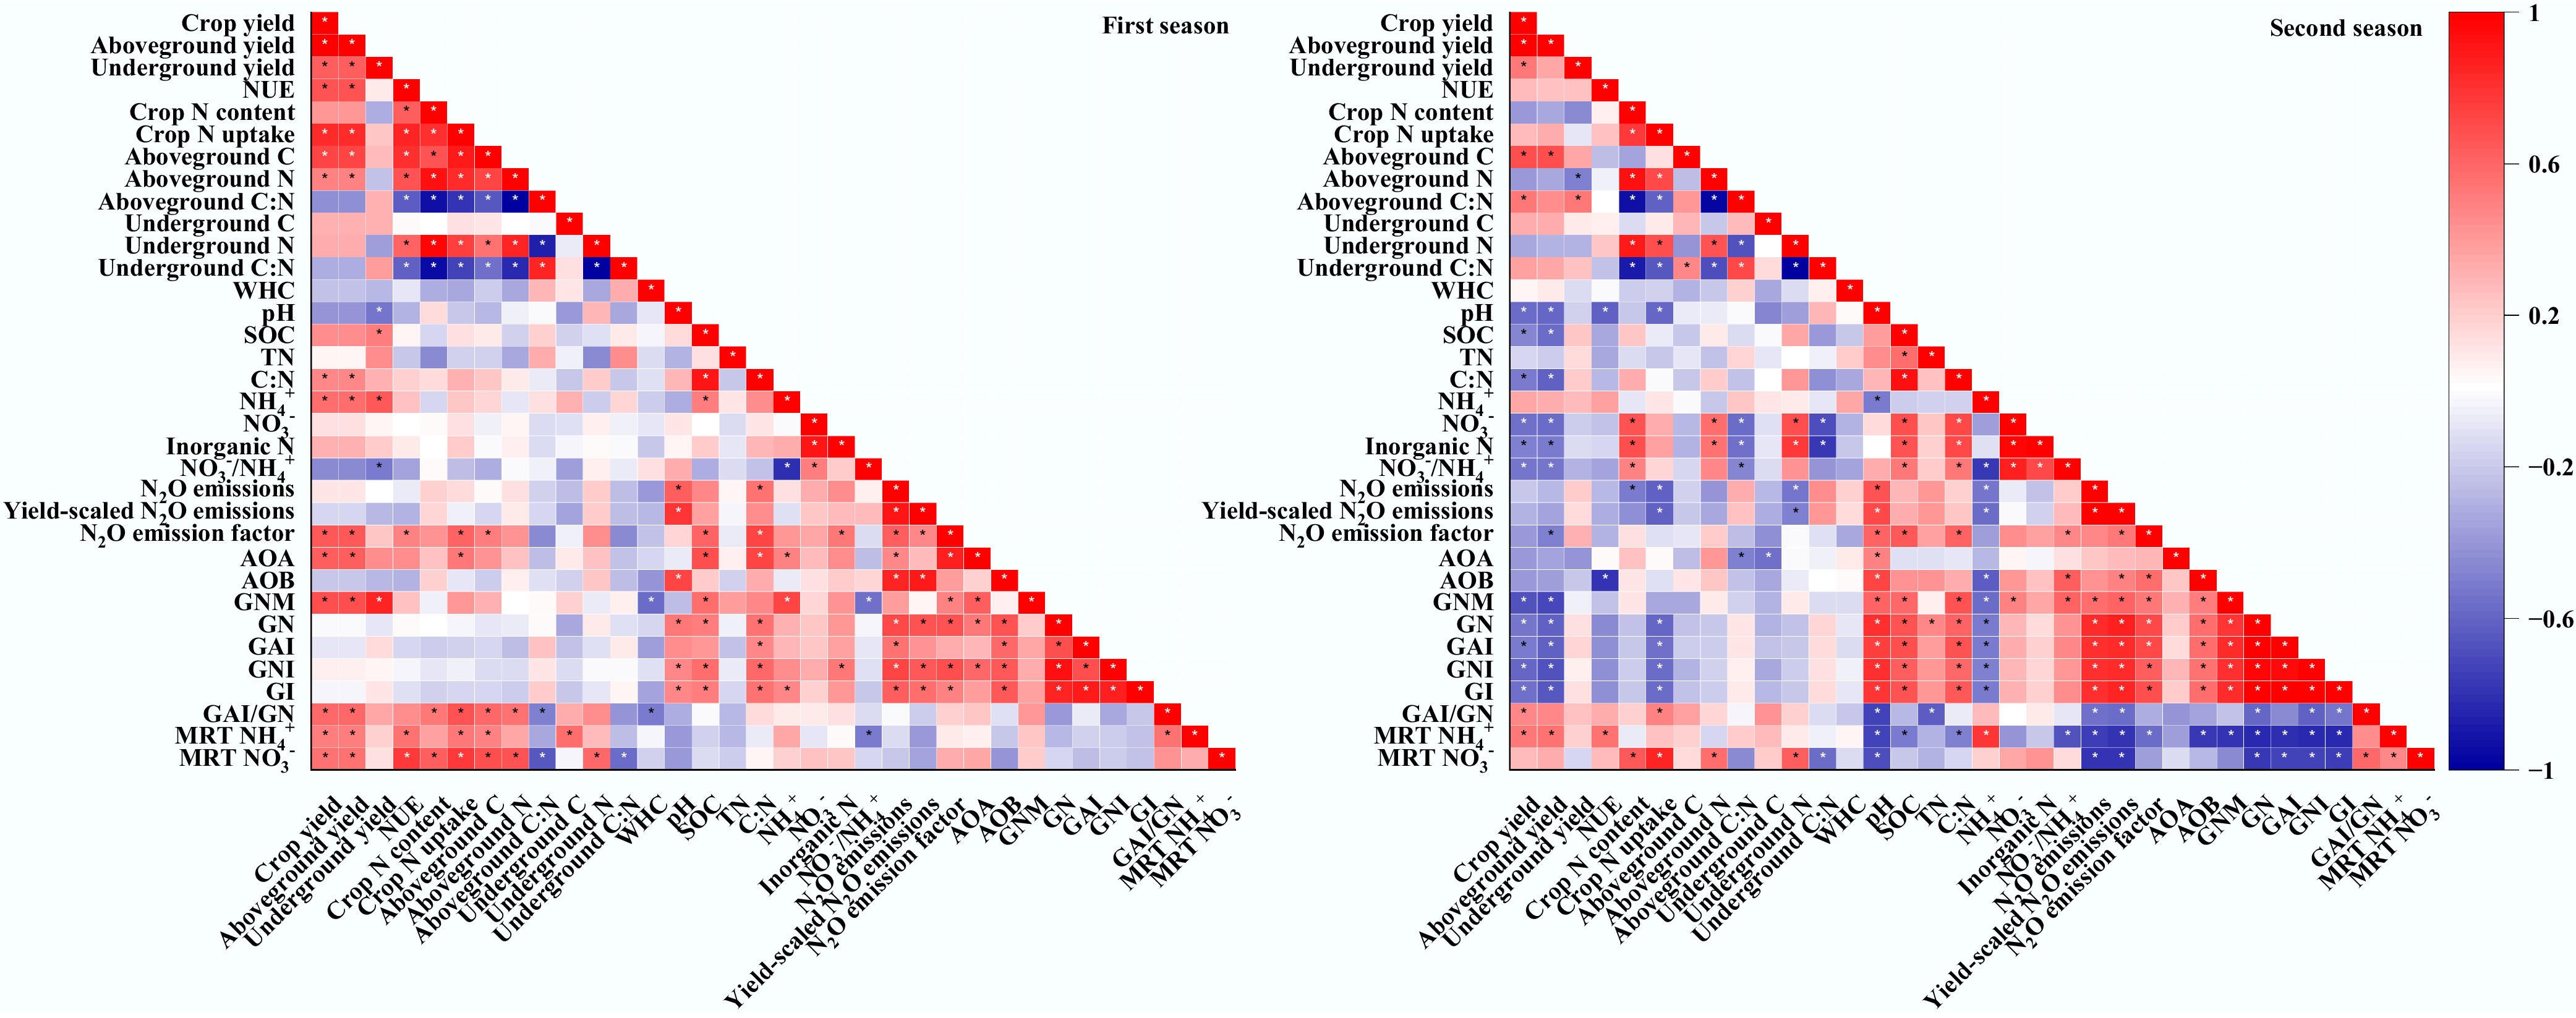
Figure 5.
Relationships between crop yields, crop nutrient contents, soil physicochemical and microbial properties, inorganic N supply and immobilization rates, and soil N2O emissions. WHC, water holding capacity; SOC, soil organic C; TN, total N; GNM, gross N mineralization; GN, gross nitrification; GAI, gross NH4+ immobilization; GNI, gross NO3‒ immobilization; GI, gross immobilization; MRT NH4+, mean residence time of NH4+; MRT NO3‒, mean residence time of NO3‒. * indicates p < 0.05.
-
The present results indicate that both biochar and DMPP, whether applied alone or in combination, enhanced crop yield to varying degrees, although the magnitude of these effects differed significantly between seasons. This enhancement was primarily attributed to the capacity of biochar and/or DMPP to promote soil inorganic N retention, thereby facilitating crop N uptake and utilization[33,34]. However, in calcareous soils, DMPP application alone exhibited the most pronounced and consistent benefits, resulting in the highest crop N uptake, yield, and NUE, while simultaneously generating the lowest soil N2O emissions across both seasons. This superior performance of DMPP is closely linked to the inherently high pH of calcareous soils. DMPP primarily inhibits ammonia oxidation, an effect known to be particularly effective under alkaline conditions[48,49], thereby delaying the oxidation of NH4+ to NO3‒ and prolonging NH4+ residence time in soil[26,34]. This mechanism increases N availability in the rhizosphere while reducing NO3‒ leaching and denitrification losses[37,50]. This observation aligns with numerous studies demonstrating that DMPP effectively decreases N leaching and N2O emissions in alkaline soils[51,52]. Moreover, our study further revealed that nitrification was the dominant pathway of N2O production in calcareous soils, as evidenced by the 77.0%–85.1% reduction in N2O emissions following DMPP application relative to NPK alone. Previous studies have shown that nitrification can be effectively inhibited at relatively low DMPP doses in alkaline soils, whereas higher doses are required in acidic soils[49]. Beyond influencing DMPP bioavailability, soil pH can regulate the composition and activity of nitrifying microbial communities through niche specialization[11,37,49]. Consequently, the present results indicate that DMPP enhances crop N uptake and utilization while simultaneously suppressing N2O production, making it a promising management strategy for achieving high NUE and mitigating greenhouse gas emissions in calcareous soils.
These findings partially contradict our hypothesis that combining DMPP with biochar would synergistically enhance crop yield. Instead, DMPP alone outperformed both biochar application alone and their combination. This may be attributed to the contrasting mechanisms of the two amendments and their antagonistic interactions in alkaline soil conditions[51,53]. Biochar, rich in labile C and characterized by a well-developed porous structure, can increase soil C availability and improve aeration[54], potentially stimulating both nitrification and denitrification processes[55]. In soils where nitrification is the primary source of N2O, biochar has been reported to increase N2O emissions relative to DMPP alone[55,56], as biochar may promote the complete denitrification in alkaline soils by facilitating electron transfer to denitrifying microbes and enhancing the abundance of N2O-reducing bacteria[57,58]. Meanwhile, the increased NO3‒ production in biochar-amended soil also poses high N leaching losses potential[10,52,59], although there are currently no direct comparative evaluations between biochar and DMPP in calcareous soils. Moreover, the abundant acidic functional groups such as carboxyl (-COOH) and hydroxyl (-OH) on biochar surfaces impart a strong negative charge[31,60], which facilitates the adsorption of positively charged DMPP molecules[61,62]. Such adsorption may reduce the effective DMPP concentration in the soil solution, thereby weakening its inhibitory effect on AMO activity[37,43]. Consequently, biochar application did not enhance‒but rather partially offset‒the inhibitory effects of DMPP, leading to increased N2O emissions, reduced crop N uptake and NUE, and ultimately limiting further yield improvement. Furthermore, the biochar application rate significantly influenced crop N uptake and yield. Although high biochar (30 t ha‒1) application increased crop N uptake and N content, its contribution to yield improvement was limited and even declined in the second season. This may be associated with the reduced NUE and higher N2O emission factor observed under high biochar application. The significant increase in soil organic C resulting from high biochar application favors inorganic N supply and enhances denitrification potential, thereby increasing N2O emissions and NO3‒ losses risks, which in turn impairs NUE and constrains yield improvement[55]. Additionally, some studies have shown that high biochar may reduce NO3‒ leaching in alkaline soils via adsorption and enhanced water retention[59] or exert minimal influence on N leaching[63], highlighting that the relative severity of N losses under biochar vs DMPP requires further empirical verification.
DMPP outperformed biochar in reducing nitrification and enhancing inorganic N retention
-
The residence times of NH4+ and NO3‒ in soil depend on the dynamic balance among multiple N transformation processes, including production (e.g., mineralization and nitrification) and consumption (e.g., immobilization, leaching, and gaseous losses), which collectively influence the dominant inorganic N forms, their fate, and availability[22,64]. Our results showed that DMPP application alone significantly prolonged the residence times of both NH4+ and NO3‒ in soil across both seasons, and NH4+ residence time was positively correlated with crop yield and NUE (Figs 4 & 5). This indicates that DMPP can enhance N retention by delaying the rapid conversion of NH4+, thereby improving NUE and increasing crop yield. Indeed, DMPP application alone significantly reduced gross nitrification rates in both seasons and inhibited gross N mineralization only in the second season, supporting its positive effect in prolonging NH4+ residence time in calcareous soils. As a copper-chelating nitrification inhibitor, DMPP binds to copper ions at the active sites of AMO enzymes used by ammonia-oxidizing microorganisms (AOB and AOA), thereby reducing AMO activity and directly inhibiting the nitrification rate[26,34]. In this study, DMPP significantly decreased AOB abundance in both seasons. At the same time, its inhibitory effect on AOA was significant only in the second season, indicating that AOB played a dominant role in DMPP-induced reduction of the nitrification rate in calcareous soils. This is in line with previous studies[11,37], which have shown that AOB typically dominate nitrification under high-N, neutral, or slightly alkaline conditions. In contrast, AOA are more competitive in low-N or acidic soils. Therefore, the present results indicate that the differential reactivity of DMPP under different pH regimes is closely related to the distinct pH sensitivities of AOB and AOA. By inhibiting AOB activity, DMPP not only extended NH4+ residence time but also reduced NO3‒ availability, thereby lowering the substrate supply for denitrification and ultimately reducing N2O emissions[65−67]. The significant positive correlations observed among AOB abundances, gross nitrification rates, and N2O emissions further confirm that nitrification was the primary source of N2O in these calcareous soils. In addition, some studies have suggested that because NO3‒ and N2O compete as electron acceptors during denitrification, lower NO3‒ concentrations may increase the N2/N2O ratio, promoting complete reduction to N2 and thereby reducing N2O emissions[67,68].
In contrast, compared to DMPP alone, both low (10 t ha‒1) and high (30 t ha‒1) biochar application rates significantly enhanced microbial NH4+ and NO3‒ immobilization rates but shortened their residence times, indicating that the impacts of biochar on soil inorganic N supply and retention are more complex. Compared to DMPP alone, biochar addition significantly enhanced gross N mineralization and nitrification rates, although the magnitude of stimulation varied with biochar application rate and season. Soil pH and organic C content are key factors driving both gross N mineralization and nitrification rates[22,69]. In the present study, biochar application (at both 10 and 30 t ha‒1) showed significantly higher soil pH and organic C contents than DMPP alone, both of which were positively associated with gross N mineralization and nitrification rates, indicating that biochar indirectly stimulates these processes by enhancing soil energy supply and modifying microbial metabolic environments. As gross N mineralization increased, greater NH4+ availability provided more substrate for nitrification rather than microbial assimilation, indicating that higher substrate supply further stimulated nitrification. This was supported by the lower GAI/GN ratio observed under biochar treatments. Moreover, the well-developed porous structure of biochar can improve soil aeration, creating favorable aerobic conditions for ammonia-oxidizing microorganisms (AOA and AOB), thereby potentially increasing nitrification rates[70,71]. The increased inorganic N supply subsequently stimulated microbial immobilization of NH4+ and NO3‒. The above effects were more pronounced at higher biochar application rates (30 t ha‒1). Furthermore, the present results found that biochar application, whether alone or combined with DMPP, consistently increased N2O emissions. This could be because organic C sources serve as electron donors for denitrifiers, and greater C availability generally stimulates denitrification and increases N2O emissions[72,73]. The elevated C inputs from biochar likely accelerated C mineralization and microbial respiration, which, in turn, increased oxygen consumption and promoted the formation of anoxic microenvironments, supporting higher denitrified abundances and favoring denitrification, particularly under high soil pH and sufficient NO3‒ supply[74]. This mechanism likely contributes to the positive correlations observed between soil organic C content, pH, and N2O emissions in the present study (Supplementary Fig. S3). Growing evidence further suggested that a substantial portion of labile C released from biochar may directly fuel denitrification[75]. For example, Lan et al.[74] found that liable C significantly enhanced denitrification rate, N2O emissions, and the N2O/(N2O + N2) ratio by upregulating nirK and nirS genes in calcareous soil. Similarly, Surey et al.[75] also reported that denitrification in Haplic Chernozem soils (pH 6.9–7.4) is strongly driven by labile organic matter, and that high C bioavailability triggers incomplete denitrification, resulting in higher N2O/N2 ratios. In addition to providing more favorable soil physiochemical conditions, greater substrate and energy availability, the abundant surface functional groups and extensive pore network of biochar may also create physical niches and spatial separation for nitrifying and denitrifying microorganisms[31,76]. This may permit microzones with contrasting redox conditions to coexist, facilitate rapid substrate exchange, and promote the accumulation of N2O as an intermediate product[55,76]. Noticeably, the strong adsorption capacity of biochar for DMPP molecules may lower their effective concentration in soil solution, thereby weakening DMPP′s inhibitory effect on AMO activity[61,62]. This could explain the observed increases in nitrification rate and N2O emissions under co-application of biochar and DMPP.
Overall, DMPP achieved superior NUE enhancement and stronger N2O emission mitigation by directly inhibiting ammonia-oxidizing microorganisms, suppressing nitrification, and prolonging inorganic N retention in soil. In contrast, although biochar improved soil physicochemical properties, its effects were highly dependent on application rate, growing season, and its interaction with DMPP. Therefore, in calcareous soils, an N management strategy centered on DMPP should be prioritized. By optimizing biochar application rates and combining it with DMPP, it is possible to simultaneously maximize NUE and mitigate greenhouse gas emissions, thereby improving both productivity and environmental sustainability in calcareous agroecosystems. Nonetheless, further investigation into plant N uptake pathways, denitrifier functional genes, denitrification dynamics, and N leaching losses are needed to more fully assess the relative effects of DMPP and biochar on soil N fate and NUE.
-
DMPP application alone greatly improved crop N uptake, NUE, and yield in both seasons while simultaneously decreasing soil N2O emissions, highlighting its superior potential to enhance NUE in calcareous soils. The primary mechanism is that DMPP suppresses AOB activity and decreases soil nitrification rates, thereby increasing microbial NH4+ immobilization-to-nitrification ratio, extending the residence time of NH4+ and NO3‒ in soil, reducing N2O production, and enhancing N retention and utilization efficiency. In contrast, biochar applied at 10 and 30 t ha‒1 promoted microbial assimilation of inorganic N but significantly increased nitrification rates and shortened the residence time of inorganic N, ultimately resulting in lower NUE and higher N2O emissions. Even when co-applied with DMPP, these adverse effects were not substantially alleviated. Overall, DMPP proved more effective than biochar in retaining inorganic N, promoting crop yield, improving NUE, and substantially mitigating N2O emissions in calcareous soils. Therefore, DMPP should be prioritized as the core N fertilizer management strategy in calcareous croplands, while moderate adjustment of biochar application rates and ratios may help achieve synergistic improvements in both agronomic productivity and environmental sustainability.
-
It accompanies this paper at: https://doi.org/10.48130/nc-0025-0013.
-
Not applicable.
-
The authors confirm their contributions to the paper as follows: Lijun Liu: data collection, data analysis, and writing−draft manuscript preparation; Nana Ding: material preparation, data collection, and data analysis; Lei Meng: study design; Tongbin Zhu: conceptualization, study design, funding acquisition, supervision, and writing−review and editing; Qi Xu: material preparation; Ahmed S. Elrys: data analysis; Lee Kheng Heng: data analysis; Christoph Müller: data collection. All authors reviewed the results and approved the final version of the manuscript.
-
The data that support the findings of this study are available upon request from the corresponding author.
-
This research was supported by the Key R&D Programs of Guangxi (Grant No. Guikenong AB241484038), the Guangxi Science and Technology Planning Project (Grant No. 2023GXNSFFA026010), the CAGS Research Fund (Grant No. YYWF 2023015), and the Geological Survey Project, China (Grant No. DD20240095).
-
The authors declare that they have no known competing financial interests or personal relationships that could have appeared to influence the work reported in this paper.
-
Full list of author information is available at the end of the article.
- The supplementary files can be downloaded from here.
- Copyright: © 2026 by the author(s). Published by Maximum Academic Press, Fayetteville, GA. This article is an open access article distributed under Creative Commons Attribution License (CC BY 4.0), visit https://creativecommons.org/licenses/by/4.0/.
-
About this article
Cite this article
Liu L, Ding N, Meng L, Xu Q, Zhu T, et al. 2026. Nitrification inhibitor enhances nitrogen use efficiency and crop yield more than biochar in calcareous soils. Nitrogen Cycling 2: e001 doi: 10.48130/nc-0025-0013 

Nitrification inhibitor enhances nitrogen use efficiency and crop yield more than biochar in calcareous soils
- Received: 31 October 2025
- Revised: 29 November 2025
- Accepted: 15 December 2025
- Published online: 13 January 2026
Abstract: Calcareous soils are characterized by high pH and rapid nitrification, which often lead to excessive nitrate accumulation, nitrogen (N) loss, and increased nitrous oxide (N2O) emissions. Effective inhibition of nitrification or enhancement of inorganic N retention is therefore crucial for enhancing N use efficiency (NUE) and mitigating N2O emissions in such systems. Biochar and 3,4-dimethylpyrazole phosphate (DMPP) are widely used N management strategies; however, their relative effectiveness in improving NUE and mitigating N2O emissions, as well as the underlying mechanisms regulating soil N transformations, remain poorly understood, particularly in calcareous soils. In this study, two consecutive seasons of pot experiments were conducted with eight treatments: control, phosphate and potash fertilizer (PK), N, phosphate and potash fertilizer (NPK), NPK + DMPP, NPK + low biochar (10 t ha‒1), NPK + high biochar (30 t ha‒1), NPK + low biochar + DMPP, and NPK + high biochar + DMPP. The effects of biochar and DMPP, applied alone, or in combination with, on crop N uptake, NUE, yield, soil gross N transformation rates, and N2O emissions, were systematically evaluated. Results showed that DMPP significantly enhanced crop N uptake and yield by 30.8%‒49.1% and 19.0%‒48.9%, increased NUE by 14.4%–17.9%, and reduced cumulative N2O emissions by 77.0%–85.1% relative to NPK across both seasons. Mechanistically, compared to NPK, DMPP effectively suppressed ammonia-oxidizing bacteria activity by 27.4%‒42.4%, and nitrification rates by 50.0%‒55.5%, but increased the microbial ammonium immobilization-to-nitrification ratio by 11.9%‒20.8%, and prolonged the residence time of inorganic N, thereby enhancing N retention and utilization. In contrast, both low and high biochar additions promoted microbial N immobilization but accelerated nitrification, decreased NUE, and stimulated N2O emissions; even co-application with DMPP did not counteract these effects. Overall, DMPP proved more effective than biochar in stabilizing inorganic N, improving NUE and crop yield, and mitigating N2O emissions in calcareous soils, representing a key strategy for optimizing N management in such agroecosystems.